RESEARCH PAPER
A multiscale DEM-LBM analysis on permeability evolutionsinside a dilatant shear band
WaiChing Sun • Matthew R. Kuhn •
John W. Rudnicki
Received: 26 October 2012 / Accepted: 16 January 2013
� Springer-Verlag Berlin Heidelberg (outside the USA) 2013
Abstract This paper presents a multiscale analysis of a
dilatant shear band using a three-dimensional discrete
element method and a lattice Boltzmann/finite element
hybrid scheme. In particular, three-dimensional simple
shear tests are conducted via the discrete element method.
A spatial homogenization is performed to recover the
macroscopic stress from the micro-mechanical force
chains. The pore geometries of the shear band and host
matrix are quantitatively evaluated through morphology
analyses and lattice Boltzmann/finite element flow simu-
lations. Results from the discrete element simulations
imply that grain sliding and rotation occur predominately
with the shear band. These granular motions lead to dila-
tion of pore space inside the shear band and increases in
local permeability. While considerable anisotropy in the
contact fabric is observed with the shear band, anisotropy
of the permeability is, at most, modest in the assemblies
composed of spherical grains.
Keywords Discrete element method � Homogenization �Lattice Boltzmann method � Micromechanics of granular
materials � Microstructure � Strain localization
1 Introduction
Deformation bands in geological materials are narrow
zones of inhomogeneous strain. Their development is often
analyzed as a material bifurcation phenomenon that takes
place as a deviation from homogeneous deformation
[5, 34]. Deformation bands can be categorized as shear,
compaction, or dilation, depending on the predominant
mode of localized strain within the band. In geological
materials, shear occurs most commonly with some amount
of volumetric deformation, either dilation or compaction
[3, 7, 11, 33, 40]. For instance, compactive shear bands,
thin zones with reduced porosity and dominated shear,
have been reproduced in sand experimentally to study the
role of spatial variability of relative density on the onset,
propagation, and orientation of shear bands in [7]. On the
contrary, a dilatant shear band can cause an increase in
porosity and change of flow path, thereby altering the fluid
transport inside the pore space. This feature is of economic
importance, because dilatant shear bands may act as flow
conduits that leak injected pore-fluid in reservoirs [44].
To predict how formation of dilatant shear bands affects
the hydraulic properties, macroscopic finite element anal-
ysis may be used to capture the evolution of porosity.
Changes of permeability are then estimated from the
porosity evolution via empirical or semi-empirical consti-
tutive relations. This macroscopic approach has several
drawbacks. First of all, empirical models, such as capillary
tube model [36] and fissure model [19], are often designed
and validated for very specific types of materials with
W. Sun (&)
Mechanics of Materials, Sandia National Laboratories,
Mail Stop 9912, 7011 East Avenue, Livermore, CA, USA
e-mail: [email protected]
M. R. Kuhn
Department of Civil Engineering, Donald P. Shiley School
of Engineering, University of Portland, 500 N. Willamette Blvd,
Portland, OR 97203, USA
J. W. Rudnicki
Department of Civil and Environmental Engineering,
Technology Institute A333, Northwestern University,
2145 Sheridan Road, Evanston, IL 60208, USA
123
Acta Geotechnica
DOI 10.1007/s11440-013-0210-2

relatively simple pore geometry. Second, empirical models,
such as the modified Kozeny-Carman equation [4], are
often designed mainly to capture the macroscopic poros-
ity-permeability relation, while permeability changes due
to macroscopic shear and grain rearrangement, rotation,
and sliding are neglected. Hence, a macroscopic empirical
porosity-permeability relation may fail to deliver reliable
predictions when the permeability changes are caused by
factors other than volumetric changes of pore space, such
as isolation of the pores and changes in tortuosity and size
distribution of flow channels, as shown in [39].
Volumetric digital image correlation (VDIC) applied to
X-ray tomography images of geomaterials may help in
understanding the kinematics of grain motion and changes
in pore geometry as shown in [27, 32]. However, due to the
technical difficulty of conducting mechanical tests while
simultaneously performing CT X-ray imaging, experi-
mental measurement of microstructural attributes is rare
(e.g., [1, 16]). Furthermore, while continuum kinematics
quantities such as strain can be extracted via VDIC [7, 11],
tracking motion and deformation of individual grains is
still a computationally demanding process [1]. Recently,
Ando et al. [1] propose a discrete particle ID approach to
directly identify and keep track of individual grains without
the necessity of image analysis and hence significantly
improve the speed. However, post-processing procedures
are required to correct the error due to incorrect tracking of
grains with similar geometrical features.
DEM is widely used to model particle assemblies and to
simulate the mechanical behavior of granular materials.
Recent work has coupled DEM with LBM and finite ele-
ment models to study fluid flow processes that evolve on a
similar time scale as particles are being rearranged: soil
liquefaction, fluidized beds, and suffusion [8, 14, 15]. In
this study, our focus is on shear band formation in high-
porosity granular material under the fully drained condi-
tion. Because the shearing that produces shear bands in
sands is slow in comparison with fluid migration under the
drained condition, the current work decouples the DEM
and LBM analyses, with DEM used to simulate the for-
mation of a band and LBM analysis used to analyze the
fluid flow after formation of the band.
To analyze the links between microstructural granular
motion and macroscopic hydraulic properties in a repeat-
able and cost-efficient way, we introduce a multiscale
numerical alternative. This approach incorporates the dis-
crete element method (DEM) to simulate grain motion
inside the dilatant shear band and a multiscale lattice
Boltzmann (LBM)/finite element (FEM) scheme to capture
the evolution of permeability. Since the motion of every
particle in the DEM ensemble is recorded at every time
step, this approach makes it possible to quantify how
individual particles affect macroscopic hydraulic properties
without the necessity of introducing an additional phe-
nomenological law.
As for notations and symbols, bold-faced letters denote
tensors; the symbol ‘�’ denotes a single contraction of
adjacent indices of two tensors (e.g., a � b ¼ aibi or
c � d ¼ cijdjk); the symbol ‘:’ denotes a double contraction
of adjacent indices of tensor of rank two or higher (e.g.,
C : ee ¼ Cijkleekl); the symbol ‘�’ denotes a juxtaposition of
two vectors (e.g. a� b ¼ aibj or two symmetric second-
order tensors (e.g., ða� bÞ ¼ aijbkl).
2 Method
2.1 Grain assembly from simple shear discrete element
simulation
In this study, we use the open source 3D discrete element
(DEM) code OVAL to simulate a simple shear test on a
specimen composed of spherical particles [2, 13, 25]. A
DEM simulation represents a granular material as an
assembly of elemental particles, among which interactions
are explicitly modeled by simplified constitutive contact
laws [13]. Each particle’s motions are obtained through
force and momentum balances, expressed as
m€uþ Cm _uþ PðuÞ ¼ Fext ð1ÞI � €x ¼ Mext ð2Þ
where m and Cm are the mass and translational damping.
Vector PðuÞ is the net force imbalance vector due to the
inter-particle contact forces, and Fext denotes the external
loads exerted by walls or gravity. I is the moment of
inertia, €x is the rotational acceleration, and Mext is the
external moment on a particular grain. For simplicity,
gravity loads are neglected in the current discrete element
simulations. To solve Eq. 1, a time-stepping explicit
central difference leap-frog algorithm is used [13]. When
simulations are intended to approximate slow, quasi-static
loading conditions, the mass damping Cm and contact
damping Cs (described below) must be sufficient to
dissipate high frequency vibrational modes without
unduly impeding particle motions that arise from particle
interactions or the boundary conditions. The homogenized
macroscopic stress and strain tensors, r and e, of the
granular assembly are determined from the contact forces
fia and branch vectors lj
a between the centers of the Nc
contacting particle pairs and from the average deformation
gradient Fij of the assembly:
rij ¼1
VX
XNc
a¼1
f ai laj ; eij ¼
1
2ðFikFkj � IijÞ ð3Þ
where VX is the assembly volume.
Acta Geotechnica
123

2.1.1 Contact model
In our implementation, we use a simplified contact model
in which the grain-to-grain force-displacement relation is
governed by a frictional Hertz-Mindlin mechanism with
viscous damping but without cohesive bonding between
particles. Incremental changes in the normal and tangential
contact forces, f n and f t, are determined by the shear
modulus of the grains Gg, Poisson ratio m, radii of the
contacting grains R1 and R2, and the normal and tangential
displacements at the contact, dd and ds [21],
df n ¼ kndd; kn ¼ffiffiffi2p
Gg
ffiffiffiffiffiRep
1� md1=2 ð4Þ
df t ¼ ksds; ks ¼ 2ffiffiffi2p
Gg
ffiffiffiffiffiRep
2� md1=2 ð5Þ
where d is the indentation at the contact and Re is the
effective radius,
Re ¼ 2R1R2
R1 þ R2
ð6Þ
The tangential force is limited by the friction coefficient lf ,
such that jf tj � lf f n. Equation 5 gives the initial, elastic
tangential stiffness ks between elastic spheres. The incre-
mental tangential force f t, however, is path-dependent, and
an exact solution involves the history of normal and tan-
gential force at the contact [24]. The approximate solution
of Thornton and Randall [43] is used in the current simu-
lation, which permits solution of a full loading-unload-
ing-reloading cycle between two spherical grains.
To maintain a stable quasi-static simulation, a viscous
damping force is applied at each contact
f s;vis ¼ Cs _s ð7Þ
where _s is the tangential sliding velocity at a contact, and
Cs is the contact viscosity. This contact viscosity is ‘‘turned
off’’ whenever frictional sliding occurs, as such sliding
becomes a dissipation mechanism that prevents spurious
grain vibrations. Mass (global) damping (Cm in Eq. 1) can
delay or prevent the emergence of shear bands, since an
emerging difference in velocities on either side of the band
imparts a reactive viscous force that will suppress the
difference. To freely permit the spontaneous emergence of
shear bands, the viscosity Cm was set to zero, and the
contact (local) viscosity Cs ¼ 0:12ffiffiffiffiffiffiffiffimknp
was used exclu-
sively as a damping measure. This small viscosity was
sufficient to maintain a stable simulation without unduly
affecting shear band thickness, since thickness is insensi-
tive to the contact damping parameter, just as it is insen-
sitive to the contact friction coefficient [23]. In this manner,
grain size and shape were the dominant factors controlling
the emergence and character of the shear band. In the
simulation, the shear modulus G was 29 GPa, the Poisson
ratio m was 0.15, and the friction coefficient between par-
ticles was 0.50. These values are in the ranges of those
measured for quartz grains [30].
2.1.2 Initial particle arrangement
The DEM simulation was conducted with an assembly of
129,000 spherical grains that were densely arranged with
an initial isotropic fabric. The distribution of particle sizes
is shown in Fig. 1 and corresponds to a poorly graded
medium sand with a coefficient of uniformity Cu of 1.4
(=D60/D10), a median particle size D50 (by volume) of 1.00
mm, and an effective size D10 of 0.754 mm. The dense
arrangement was attained from an initially sparse random
arrangement of particles by isotropically reducing the
boundary dimensions. During compaction, friction was
removed from the particle interactions, a technique that is
commonly used to achieve high packing densities [42]. The
compacted porosity was 0.337 (a void ratio of 0.509), with
an initial average coordination number of 5.52 contacts per
particle. Because of the isotropic compaction technique,
the initial normal stresses in all directions were nearly
equal to the mean stress of 416 kPa. These stresses, com-
puted with Eq. 3, are the inter-granular, effective stresses
that are developed by the contact forces.
2.1.3 Boundary conditions
The assembly shape and boundary conditions were chosen
to promote the free emergence of shear bands during
simple shear loading, and the assembly dimensions were
chosen to produce a shear band of sufficient volume for
studying its fabric and hydraulic properties. The DEM
assembly dimensions were 50.6 9 118 9 12.7 mm, or in
terms of the particle size D50, about 51 9 118 9 13D50.
Shearing was imposed across the 118 mm y-height by
0.4 0.5 0.6 0.7 0.8 0.9 1 1.1 1.20
0.2
0.4
0.6
0.8
1
Diameter (mm)
Cum
ulat
ive
Pro
babi
lity
Fig. 1 The cumulative probability function of grain diameter of the
DEM assembly
Acta Geotechnica
123
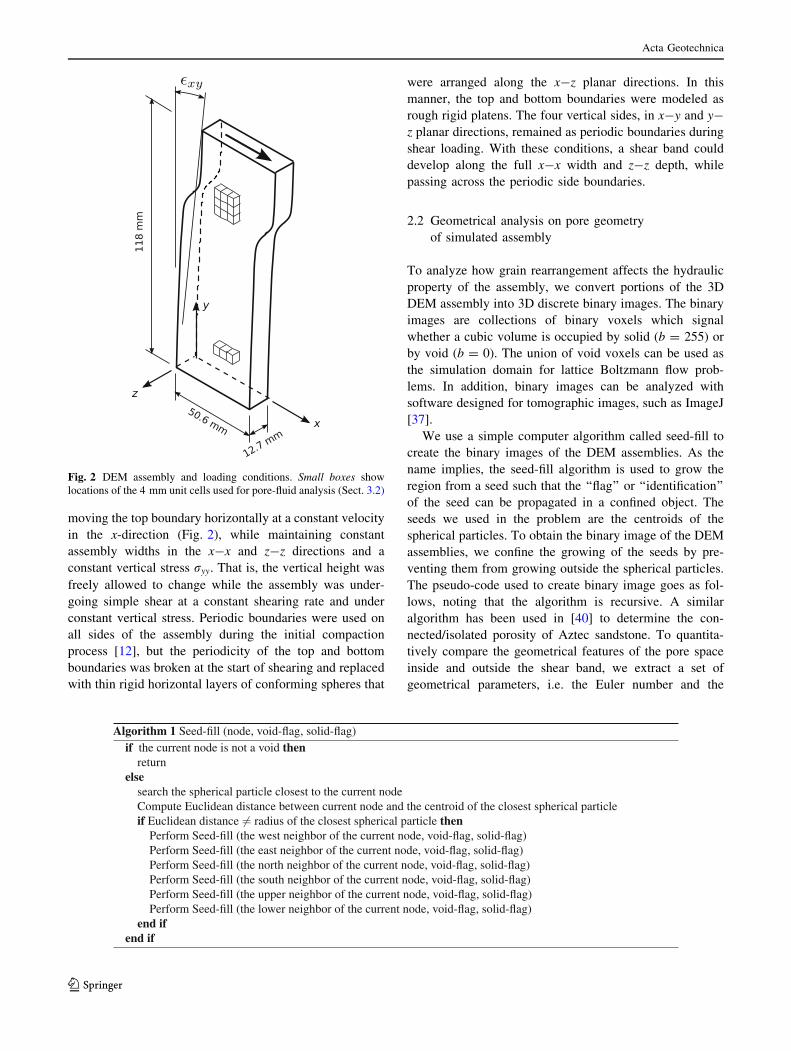
moving the top boundary horizontally at a constant velocity
in the x-direction (Fig. 2), while maintaining constant
assembly widths in the x-x and z-z directions and a
constant vertical stress ryy. That is, the vertical height was
freely allowed to change while the assembly was under-
going simple shear at a constant shearing rate and under
constant vertical stress. Periodic boundaries were used on
all sides of the assembly during the initial compaction
process [12], but the periodicity of the top and bottom
boundaries was broken at the start of shearing and replaced
with thin rigid horizontal layers of conforming spheres that
were arranged along the x-z planar directions. In this
manner, the top and bottom boundaries were modeled as
rough rigid platens. The four vertical sides, in x-y and y-
z planar directions, remained as periodic boundaries during
shear loading. With these conditions, a shear band could
develop along the full x-x width and z-z depth, while
passing across the periodic side boundaries.
2.2 Geometrical analysis on pore geometry
of simulated assembly
To analyze how grain rearrangement affects the hydraulic
property of the assembly, we convert portions of the 3D
DEM assembly into 3D discrete binary images. The binary
images are collections of binary voxels which signal
whether a cubic volume is occupied by solid (b = 255) or
by void (b = 0). The union of void voxels can be used as
the simulation domain for lattice Boltzmann flow prob-
lems. In addition, binary images can be analyzed with
software designed for tomographic images, such as ImageJ
[37].
We use a simple computer algorithm called seed-fill to
create the binary images of the DEM assemblies. As the
name implies, the seed-fill algorithm is used to grow the
region from a seed such that the ‘‘flag’’ or ‘‘identification’’
of the seed can be propagated in a confined object. The
seeds we used in the problem are the centroids of the
spherical particles. To obtain the binary image of the DEM
assemblies, we confine the growing of the seeds by pre-
venting them from growing outside the spherical particles.
The pseudo-code used to create binary image goes as fol-
lows, noting that the algorithm is recursive. A similar
algorithm has been used in [40] to determine the con-
nected/isolated porosity of Aztec sandstone. To quantita-
tively compare the geometrical features of the pore space
inside and outside the shear band, we extract a set of
geometrical parameters, i.e. the Euler number and the
Fig. 2 DEM assembly and loading conditions. Small boxes show
locations of the 4 mm unit cells used for pore-fluid analysis (Sect. 3.2)
Acta Geotechnica
123

surface area/pore volume, which are found to be closely
related to hydraulic transport behavior of porous media [17,
22, 28, 37]. The open source computer algorithm used to
extract these parameters is provided by Legland [26]. The
Euler number of binary image E is defined as,
E ¼ N � C þ H ð8Þ
where N is the number of interconnected pores, C is the
number of loops in the pore space, and H is the number of
objects completely enclosed by pore space . In other words,
the Euler number is a measure of connectivity which is
positive if the pores are poorly connected and negative if
otherwise. A large negative Euler number indicates that the
pore space has a network-like topology and that there are
more possible flow paths for pore-fluid traveling from one
end to another end. In addition, tortuosity of flow channels
can be measured by computing the ratio between the sur-
face area and the pore volume. Obviously, a high surface
area/pore volume indicates that pore-fluid must travel
along a longer flow path from one end to the other.
2.3 Geometrical enhanced lattice Boltzmann/finite
element simulation
A multiscale lattice Boltzmann/Finite element method is
used to extract geometrical features and permeability from
the granular assembly. This hybrid method was originally
proposed in [45] to estimate permeability of Castlegate
Sandstone. Sun et al. [39] improved the accuracy and com-
putation efficiency of this method by incorporating geo-
metrical analysis in the permeability calculations. The key to
this improvement is partitioning the entire grain assembly
into unit cells where pore-scale lattice Boltzmann simula-
tions are conducted in the connected pores of each unit cell.
Since discretized voxel images may contain isolated pores if
the resolution is insufficient, this method is used to ensure
that discretization does not alter connectivity of the pores.
The lattice Boltzmann method we used is a single-relax-
ation time Bhatnagar-Gross-Krook (BGK) model [10, 38],
which solves a discretized Boltzmann equation by simulat-
ing the evolution of fluid particle distribution that propagates
and collides locally among lattice nodes. The macroscopic
fluid flow is then approximated by the overall particulate
motion of the fictitious fluid particles. The evolution of fluid
particle distribution function fi in direction ei is updated in
each time step through the following equation,
fiðxþ ei; t þ DtÞ � fiðx; tÞ ¼ �1
sðfiðx; tÞ � f eq
i ðx; tÞÞ ð9Þ
where feq is a truncated equilibrium distribution defined as
f eqi ¼ wiq
�1þ 3ei � v
c2s
þ 9ðei � vÞ2
c4s
� v � v2c2
s
�ð10Þ
s is a parameter related to the dynamic fluid viscosity m, as
shown in the Chapman-Enskog equation (cf. [38]),
m ¼ Dtc2s
�s� 1
2
�ð11Þ
where cs is the constant speed of sound. q and v are the
macroscopic density and velocity. They are determined
from the evolution of the particle distribution, i.e.,
q ¼XN
i¼1
fi; v ¼ 1
q
XN
i
fiei ð12Þ
The effective permeability of a porous medium can be
measured by applying a pore pressure gradient along a basis
direction and determining the resultant fluid filtration velocity
from a pore-scale hydrodynamics simulation. Then, the
effective permeability tensor is obtained according to
kij ¼ �lv
ðrxpÞj1
VX
Z
X
viðxÞdX ð13Þ
where lv is the kinematic viscosity of the fluid occupying
the spatial domain of the porous medium X. To implement
this procedure, we first assume that the effective perme-
ability tensor kij is symmetric and positive definite.
Assuming that the principal axes of the permeability tensor
are aligned with the specimen axes, we determine the
diagonal components of the effective permeability tensor
kii by three hydrodynamics simulations. In each simulation,
we impose a pressure gradient on two opposite faces
orthogonal to an axis ei and no-slip boundary conditions on
the four sides parallel to ei where ei denotes an orthogonal
axis of a Cartesian system. This numerical treatment has
been previous used in [45] to estimate permeability of
Castlegate sandstone.
Another possible approach to estimate permeability is by
assigning uniform force in (9) at each lattice node such that
a gravitational body force leads to fluid flow [38, 41]. This
method may minimize the impact of artificial boundary
effect. However, this approach only works for periodic
media. Hence, non-periodic media must be made periodic
by specular reflection on its boundary. This technique
requires careful pre-programming to handle complicated
local metrics, such as corners. As a result, this approach is
not used in this study, but will be considered in future work.
3 Results and discussion
3.1 Microstructural attributes and homogenized
constitutive responses
The objective of the numerical experiments is to explore
how inter-particle motions, such as grain sliding and
Acta Geotechnica
123
rotation and rearrangements of grains, influence macro-
scopic mechanical behavior and hydraulic properties of the
shear band. In real geomaterials, there are numerous other
microstructural attributes (e.g. grain size distribution, grain
shapes, grain surface roughness, scale of fluctuations of
mechanical properties) and mechanisms (e.g. grain sliding,
rotation, crushing, interlocking) that may influence the
overall macroscopic behavior in various degrees of impor-
tance. Since the influences of these factors are difficult to
analyze simultaneously, we restrict our focus to the effects
of grain sliding and rotation. To minimize the influence of
inherent heterogeneity, all grains in the granular assembly
are spherical with the distribution shown in Fig. 1.
3.1.1 Stress-strain response
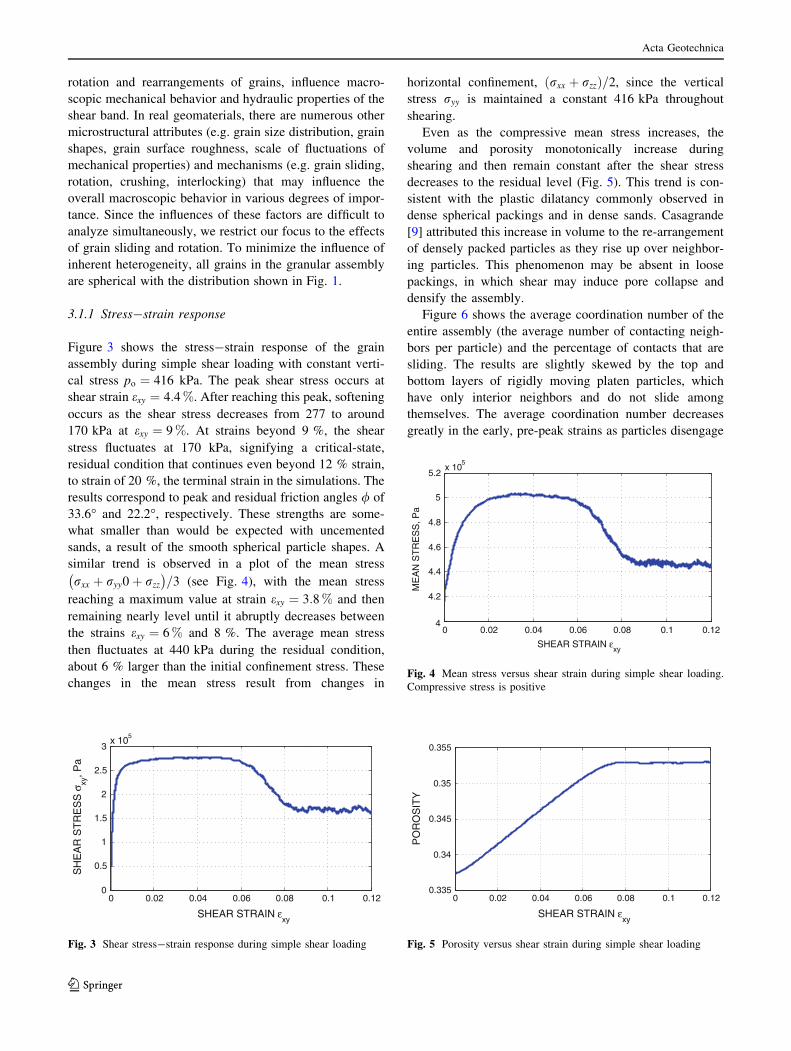
Figure 3 shows the stress-strain response of the grain
assembly during simple shear loading with constant verti-
cal stress po ¼ 416 kPa. The peak shear stress occurs at
shear strain exy ¼ 4:4 %. After reaching this peak, softening
occurs as the shear stress decreases from 277 to around
170 kPa at exy ¼ 9 %. At strains beyond 9 %, the shear
stress fluctuates at 170 kPa, signifying a critical-state,
residual condition that continues even beyond 12 % strain,
to strain of 20 %, the terminal strain in the simulations. The
results correspond to peak and residual friction angles / of
33.6� and 22.2�, respectively. These strengths are some-
what smaller than would be expected with uncemented
sands, a result of the smooth spherical particle shapes. A
similar trend is observed in a plot of the mean stress
rxx þ ryy0þ rzz
� �=3 (see Fig. 4), with the mean stress
reaching a maximum value at strain exy ¼ 3:8 % and then
remaining nearly level until it abruptly decreases between
the strains exy ¼ 6 % and 8 %. The average mean stress
then fluctuates at 440 kPa during the residual condition,
about 6 % larger than the initial confinement stress. These
changes in the mean stress result from changes in
horizontal confinement, ðrxx þ rzzÞ=2, since the vertical
stress ryy is maintained a constant 416 kPa throughout
shearing.
Even as the compressive mean stress increases, the
volume and porosity monotonically increase during
shearing and then remain constant after the shear stress
decreases to the residual level (Fig. 5). This trend is con-
sistent with the plastic dilatancy commonly observed in
dense spherical packings and in dense sands. Casagrande
[9] attributed this increase in volume to the re-arrangement
of densely packed particles as they rise up over neighbor-
ing particles. This phenomenon may be absent in loose
packings, in which shear may induce pore collapse and
densify the assembly.
Figure 6 shows the average coordination number of the
entire assembly (the average number of contacting neigh-
bors per particle) and the percentage of contacts that are
sliding. The results are slightly skewed by the top and
bottom layers of rigidly moving platen particles, which
have only interior neighbors and do not slide among
themselves. The average coordination number decreases
greatly in the early, pre-peak strains as particles disengage
0 0.02 0.04 0.06 0.08 0.1 0.120
0.5
1
1.5
2
2.5
3x 10
5
SHEAR STRAIN εxy
SH
EA
R S
TR
ES
S σ
xy, P
a
Fig. 3 Shear stress-strain response during simple shear loading
0 0.02 0.04 0.06 0.08 0.1 0.124
4.2
4.4
4.6
4.8
5
5.2x 10
5
ME
AN
ST
RE
SS
, Pa
SHEAR STRAIN εxy
Fig. 4 Mean stress versus shear strain during simple shear loading.
Compressive stress is positive
0 0.02 0.04 0.06 0.08 0.1 0.120.335
0.34
0.345
0.35
0.355
PO
RO
SIT
Y
SHEAR STRAIN εxy
Fig. 5 Porosity versus shear strain during simple shear loading
Acta Geotechnica
123

during this formative dilational stage. As shearing stress
approaches the peak, the number of contacts decreases
more slowly and remains nearly constant throughout the
subsequent peak, softening and residual periods (a trend
also observed by Thornton [42]). Figure 6 also shows that
frictional sliding is mobilized early in the loading process,
with the fraction of sliding contacts reaching a maximum
of 29 %, well before the peak stress is attained. The
fraction of sliding contacts then decreases to about 18 %
while the shearing stress is near its peak state. This
decrease in the number of sliding contacts suggests that
deformation begins to localize before the peak state is
reached and before a shear band is fully developed. Once a
shear band has formed and the material is softening (at
strains greater than 5 %), the fraction of sliding contacts
decreases again to less than 10 % during the remainder of
loading. In this final stage of loading, deformation and
sliding are concentrated in the small, localized volume of
the shear band.
3.1.2 Localized deformation in shear band
Localized deformation is apparent in Fig. 7, a view of the
x-y plane through the full z-depth of the assembly. The
figure shows the overall deformed profiles and the distri-
butions of individual particle rotations about their z-axes,
xz. At a pre-peak strain of exy ¼ 2 %, the deformed, tilting
profile is nearly uniform, although rotations, which are
both positive and negative, hint at intensely non-uniform
motions at the micro-scale of individual particles. A shear
band is clearly forming within the upper half of the
assembly at 6 % strain. Less apparent are other non-per-
sistent, ephemeral localization bands that occur between
strains of 4 and 6 %, near the peak stress condition. At
strains greater than 6 %, continued deformation coalesces
within the upper shear band. Although grain rotation is
more uniform prior to formation of the shear band, rota-
tions become concentrated within the band, with some
grains rotating about 19 radians (over three full rotations).
The shear band, occurring along a horizontal plane, is
located at about three-quarters of the assembly height from
the base of the assembly. In simulations on similar
assemblies, the band was found to occur at other heights,
the particular location being unpredictable and likely the
result of subtle weaknesses within the assembly.
The nature of stress and deformation within the band are
illustrated in Fig. 8 which shows profiles of porosity,
shearing strain and rotation, and confinement stress at the
bulk strain exy ¼ 12 %. Together, the three plots indicate
that the shear band is about 13–16 mm thick, or about
13–16 times D50. Porosity is clearly larger within the shear
band than elsewhere within the profile (Fig. 8a). Indeed,
historical awareness of such localization was based upon
x-ray transmission images showing thin planar features of
reduced density [6, 11, 29]. By comparing Figs. 3, 5, 7 and
8a, we see that softening and dilation become concentrated
within the shear band at strains of 5–8 %, after which,
material within the shear band attains a steady, critical-
state density. Outside of the shear band, the density retains
0 0.02 0.04 0.06 0.08 0.1 0.123.6
3.8
4
4.2
4.4
4.6
4.8
5
5.2
5.4
5.6
SHEAR STRAIN εxy
CO
OR
DIN
AT
ION
NU
MB
ER
(a)
0 0.02 0.04 0.06 0.08 0.10
0.05
0.1
0.15
0.2
0.25
0.3
0.35
SHEAR STRAIN εxy
FR
AC
TIO
N O
F S
LID
ING
CO
NT
AC
TS
(b)
Fig. 6 a Evolution of coordination number and b fraction of sliding contacts during simple shear loading
Acta Geotechnica
123

(a) 2% shear strain (b) 4% shear strain
(c) 6% shear strain (d) 8% shear strain
(e) 10% shear strain (f) 12% shear strain
Fig. 7 Spatial distribution of rotation in assembly at shear strains = 2, 4, 6, 8, 10 and 12 %. Color indicates rotation (radians) of individual grains
Acta Geotechnica
123

its pre-peak condition, as that material elastically unloads
while softening occurs within the band.
Figure 8b shows the profiles of two micro-scale mea-
sures of continuum deformation: the local shearing strain
exy and the mean rotation xz of particles along the height of
the assembly. This figure records the differences of strains
and rotations between two reference strains, exy ¼ 10 and
12 %. The 2 % increment is the average strain increment
hDexyi of the entire assembly, but strains near the center of
the shear band are more than 15 times larger than the
assembly strain, whereas strains outside of the shear band
are nearly zero. The mean particle rotations are also shown
in Fig. 8b. The rotations exhibit considerable scatter, as is
apparent in Fig.7, and within the band, the standard devi-
ation of these rotations is more than 5 times their mean
value. Separate scales are used in Fig. 8b for the mean
shear strain and particle rotation, since the rotation is half
of the strain rate _exy. The lines for shear strain and particle
rotation are nearly identical, showing that micro-rotation
and vorticity are nearly equal within the shear band.
Figure 8c gives the profile of the mean horizontal stress,
ðrxx þ rzzÞ=2, at the strain exy ¼ 12 %, in which the aver-
age horizontal confinement stress has been normalized with
respect to the initial mean stress po = 416 kPa. The aver-
age horizontal confinement throughout the assembly is
12 % larger than the initial value (also see Fig. 4). The
general increase in the average confinement can be inter-
preted as a response to a dilational tendency that is per-
mitted expression only in the vertical direction, while no
horizontal strain is allowed in the x-x and z-z directions.
Figure 8c shows, however, an reduction in the horizontal
confinement within the shear band, where the horizontal
stress is about 6 % less than the initial stress. This different
behavior within the band indicates that mechanical
behavior within the band has diverted from the pre-peak
response and from the response of material outside of the
shear band.
3.1.3 Fabric of contact orientation
A common measure of particle arrangement is the distri-
bution of the center-to-center orientations of pairs of con-
tacting particles [31]. During deformation, contacts are
more likely to be oriented in the direction of the major
principal compressive stress. Figure 9 shows the distribu-
tions of the orientations within the x-y plane for the initial,
unloaded assembly and at strain exy ¼ 12 %, within and
outside of the shear band. The initial distribution is iso-
tropic, a result of the isotropic compaction of the specimen.
Upon shearing, the distribution becomes highly anisotropic
with far more contacts in the direction of the major com-
pressive stress, r1, than in the orthogonal direction. Dis-
tributions inside and outside of the shear band also differ,
(a) (b) (c)
Fig. 8 Profiles of density, deformation, and confinement along the
assembly height a porosity and void ratio, b shear deformation Dexy
and particle rotation Dhz, and c horizontal confinement stress. Boxesalong right margins show locations of 4mm unit cells for pore
analysis (Sect. 3.2)
(a) εxy = 0 (b) εxy = 12% within shear band (c) εxy = 12% outside of shear band
Fig. 9 Rose diagrams of contact orientations
Acta Geotechnica
123

with a slightly greater fabric asymmetry outside the shear
band. The figure also shows the directions of the major
principal compressive stress, differing by about 4.5�between material within and outside the band, the latter
having a more horizontal orientation. The principal direc-
tions of the contact fabric, as defined by [35], are closely
aligned with the principal stress directions and differ in a
similar manner within and outside the shear band. These
results are further evidence that material behavior inside of
the shear band has diverted from that of material outside of
the shear band.
3.2 Pore geometry and homogenized hydraulic
properties of shear bands
To analyze effect of strain rotation on permeability, we
located the region of grains with the largest rotation
(defining the center of the shear band) and nearby, sur-
rounding grains within a 6 mm distance. The grains with the
maximum rotation are at (20.7, 90.1, 5.7 mm) relative to the
origin shown in Fig. 2. As shown in Figure 8, this location is
approximately at the mid-plane of the shear band.
We convert the shear band grain assembly into cubic
binary images of size 12 mm 9 12 mm 9 4 mm. To
maintain computational efficiency, we then split the
domain into nine 4mm x 4mm x 4mm unit cells, with each
cell containing about 107 particles. For comparison pur-
poses, we also extract the pore geometry of three other
adjacent 4 mm 9 4 mm 9 4 mm unit cells centered at
(16.7, 25.0, 5.7 mm), (20.7, 25.0, 5.7 mm), and (24.7, 25.0,
5.7 mm) and labeled them as ’’host matrix’’ (see Figs. 2,
8). Samples of binary images obtained from the DEM grain
assemblies are shown in Fig. 10. The resolution of the
binary images is 0.05mm per voxel.
To ensure that this binary volume is large enough to
serve as a representative elementary (porous) volume for
studying fluid flow, we follow the approach in [39, 40, 45]
and compute amount of energy dissipation per unit volume
of the binary sub-volumes in various sizes, i.e.,
D ¼Z
V
2eijeijdV; eij ¼1
2
�vi;j þ vj;i
�ð14Þ
where vi,j is the gradient of fluid velocity and l is the
viscosity. This energy dissipation rate is induced by pre-
scribing a pore pressure gradient on the top and bottom of
the sub-volume. Our goal is to test whether increasing the
size of the sub-volumes would induce severe fluctuation in
the dissipation rate per unit volume. If this is not the case,
then the sub-volume is considered to be large enough to be
a representative elementary volume.
Figure 11 shows the normalized energy dissipation
computed from 480 lattice Boltzmann simulations inside
the shear band. Different colors are used to represent the
sub-volume obtained at 0, 2, 4, 6, 8, 10, and 12 % shear
Fig. 10 Binary images generated from DEM assemblies outside (left) and inside (right) shear band at shear strain exy ¼ 12 %. Each cell contains
about 107 particles
10−1
100
101
102
0
0.1
0.2
0.3
0.4
0.5
0.6
0.7
0.8
0.9
1
Size of Numerical Specimen (mm3)
Nor
mal
ized
Dis
sipa
tion
Ene
rgy
εxy
= 12%
εxy
= 10%
εxy
= 8%
εxy
= 6%
εxy
= 4%
εxy
= 2%
εxy
= 0%
Fig. 11 Normalized energy dissipation per unit volume compute
from Lattice Boltzmann simulations
Acta Geotechnica
123
strain. We notice that fluctuation of energy dissipation rate
is large when the numerical specimens are less than 1 mm3,
but gradually decreases as the sample size get larger. (A
1 mm3 specimen will encompass, on average, only 1.7
particles.) When the size increases to 10 mm3, the energy
dissipation per unit volume begins to stabilize. Although
energy fluctuation has not yet fully diminished for the unit
cell extracted at 12 % shear strain, we decided to use
specimens of 64 mm3 to strike a balance between com-
putational efficiency and accuracy.
3.2.1 Pore geometry characteristics of shear band
and host matrix
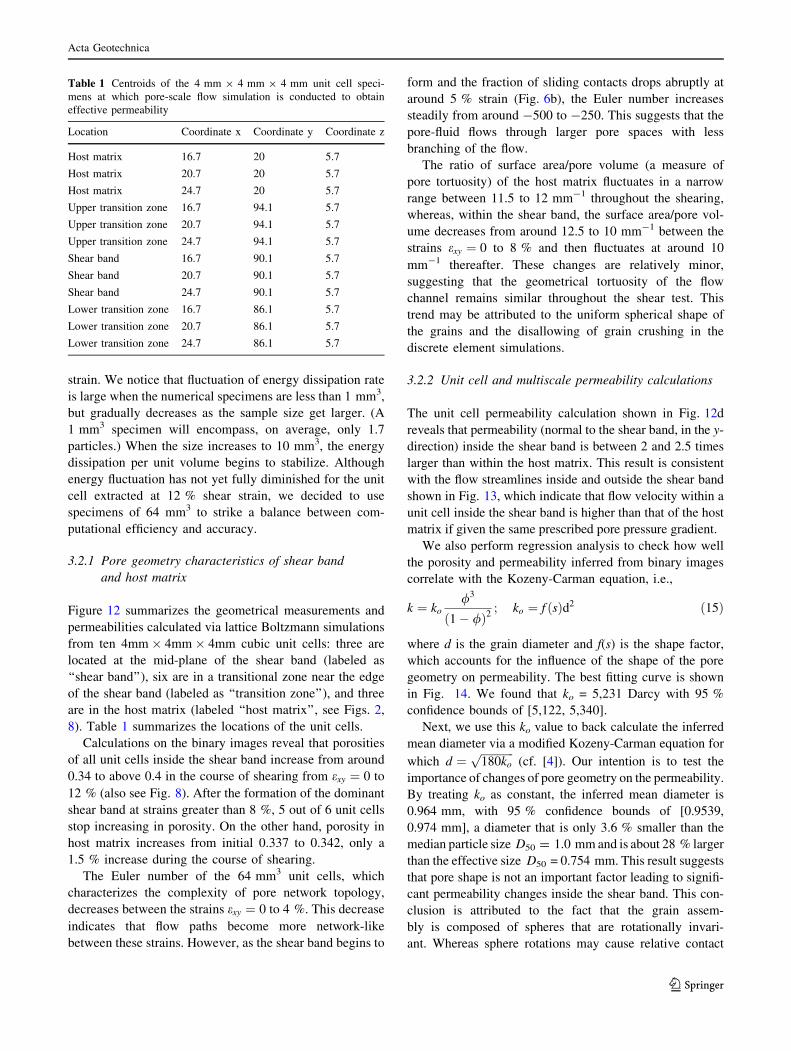
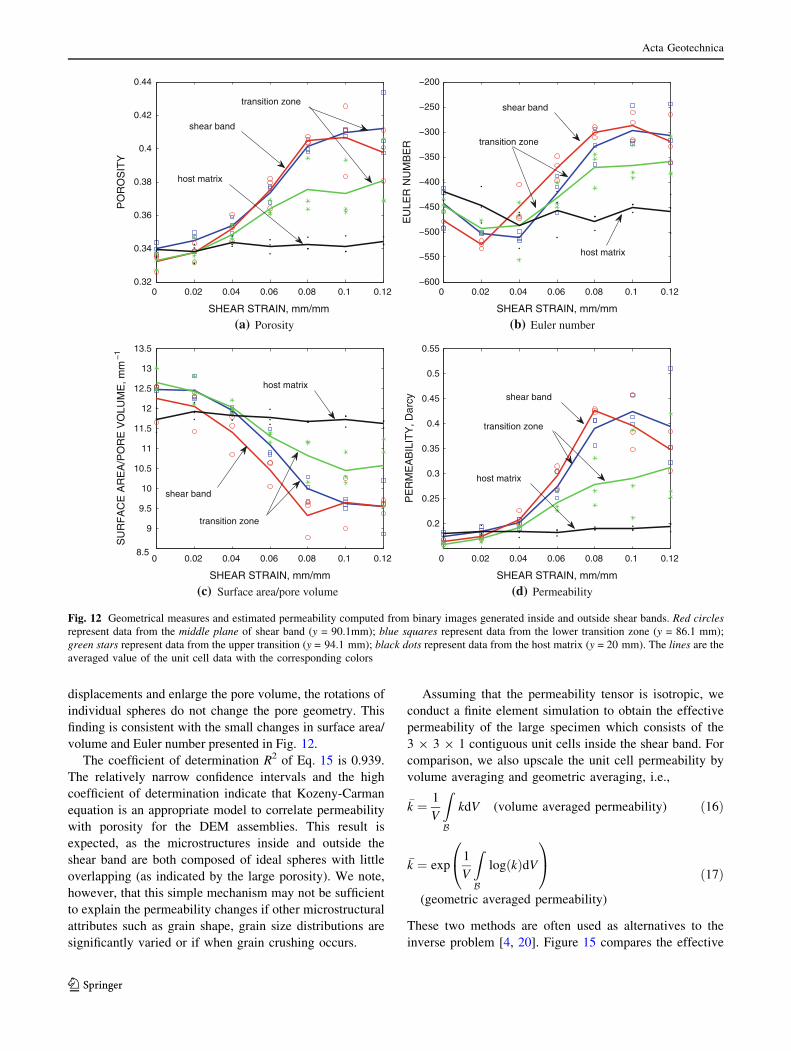
Figure 12 summarizes the geometrical measurements and
permeabilities calculated via lattice Boltzmann simulations
from ten 4mm� 4mm� 4mm cubic unit cells: three are
located at the mid-plane of the shear band (labeled as
‘‘shear band’’), six are in a transitional zone near the edge
of the shear band (labeled as ‘‘transition zone’’), and three
are in the host matrix (labeled ‘‘host matrix’’, see Figs. 2,
8). Table 1 summarizes the locations of the unit cells.
Calculations on the binary images reveal that porosities
of all unit cells inside the shear band increase from around
0.34 to above 0.4 in the course of shearing from exy ¼ 0 to
12 % (also see Fig. 8). After the formation of the dominant
shear band at strains greater than 8 %, 5 out of 6 unit cells
stop increasing in porosity. On the other hand, porosity in
host matrix increases from initial 0.337 to 0.342, only a
1.5 % increase during the course of shearing.
The Euler number of the 64 mm3 unit cells, which
characterizes the complexity of pore network topology,
decreases between the strains exy ¼ 0 to 4 %. This decrease
indicates that flow paths become more network-like
between these strains. However, as the shear band begins to
form and the fraction of sliding contacts drops abruptly at
around 5 % strain (Fig. 6b), the Euler number increases
steadily from around -500 to -250. This suggests that the
pore-fluid flows through larger pore spaces with less
branching of the flow.
The ratio of surface area/pore volume (a measure of
pore tortuosity) of the host matrix fluctuates in a narrow
range between 11.5 to 12 mm-1 throughout the shearing,
whereas, within the shear band, the surface area/pore vol-
ume decreases from around 12.5 to 10 mm-1 between the
strains exy ¼ 0 to 8 % and then fluctuates at around 10
mm-1 thereafter. These changes are relatively minor,
suggesting that the geometrical tortuosity of the flow
channel remains similar throughout the shear test. This
trend may be attributed to the uniform spherical shape of
the grains and the disallowing of grain crushing in the
discrete element simulations.
3.2.2 Unit cell and multiscale permeability calculations
The unit cell permeability calculation shown in Fig. 12d
reveals that permeability (normal to the shear band, in the y-
direction) inside the shear band is between 2 and 2.5 times
larger than within the host matrix. This result is consistent
with the flow streamlines inside and outside the shear band
shown in Fig. 13, which indicate that flow velocity within a
unit cell inside the shear band is higher than that of the host
matrix if given the same prescribed pore pressure gradient.
We also perform regression analysis to check how well
the porosity and permeability inferred from binary images
correlate with the Kozeny-Carman equation, i.e.,
k ¼ ko/3
ð1� /Þ2; ko ¼ f ðsÞd2 ð15Þ
where d is the grain diameter and f(s) is the shape factor,
which accounts for the influence of the shape of the pore
geometry on permeability. The best fitting curve is shown
in Fig. 14. We found that ko = 5,231 Darcy with 95 %
confidence bounds of [5,122, 5,340].
Next, we use this ko value to back calculate the inferred
mean diameter via a modified Kozeny-Carman equation for
which d ¼ffiffiffiffiffiffiffiffiffiffiffiffi180ko
p(cf. [4]). Our intention is to test the
importance of changes of pore geometry on the permeability.
By treating ko as constant, the inferred mean diameter is
0.964 mm, with 95 % confidence bounds of [0.9539,
0.974 mm], a diameter that is only 3.6 % smaller than the
median particle size D50 = 1.0 mm and is about 28 % larger
than the effective size D50 = 0.754 mm. This result suggests
that pore shape is not an important factor leading to signifi-
cant permeability changes inside the shear band. This con-
clusion is attributed to the fact that the grain assem-
bly is composed of spheres that are rotationally invari-
ant. Whereas sphere rotations may cause relative contact
Table 1 Centroids of the 4 mm 9 4 mm 9 4 mm unit cell speci-
mens at which pore-scale flow simulation is conducted to obtain
effective permeability
Location Coordinate x Coordinate y Coordinate z
Host matrix 16.7 20 5.7
Host matrix 20.7 20 5.7
Host matrix 24.7 20 5.7
Upper transition zone 16.7 94.1 5.7
Upper transition zone 20.7 94.1 5.7
Upper transition zone 24.7 94.1 5.7
Shear band 16.7 90.1 5.7
Shear band 20.7 90.1 5.7
Shear band 24.7 90.1 5.7
Lower transition zone 16.7 86.1 5.7
Lower transition zone 20.7 86.1 5.7
Lower transition zone 24.7 86.1 5.7
Acta Geotechnica
123
displacements and enlarge the pore volume, the rotations of
individual spheres do not change the pore geometry. This
finding is consistent with the small changes in surface area/
volume and Euler number presented in Fig. 12.
The coefficient of determination R2 of Eq. 15 is 0.939.
The relatively narrow confidence intervals and the high
coefficient of determination indicate that Kozeny-Carman
equation is an appropriate model to correlate permeability
with porosity for the DEM assemblies. This result is
expected, as the microstructures inside and outside the
shear band are both composed of ideal spheres with little
overlapping (as indicated by the large porosity). We note,
however, that this simple mechanism may not be sufficient
to explain the permeability changes if other microstructural
attributes such as grain shape, grain size distributions are
significantly varied or if when grain crushing occurs.
Assuming that the permeability tensor is isotropic, we
conduct a finite element simulation to obtain the effective
permeability of the large specimen which consists of the
3 9 3 9 1 contiguous unit cells inside the shear band. For
comparison, we also upscale the unit cell permeability by
volume averaging and geometric averaging, i.e.,
�k ¼ 1
V
Z
B
kdV (volume averaged permeability) ð16Þ
�k ¼ exp1
V
Z
B
logðkÞdV
0@
1A
(geometric averaged permeability)
ð17Þ
These two methods are often used as alternatives to the
inverse problem [4, 20]. Figure 15 compares the effective
0 0.02 0.04 0.06 0.08 0.1 0.120.32
0.34
0.36
0.38
0.4
0.42
0.44
SHEAR STRAIN, mm/mm
PO
RO
SIT
Y
transition zone
shear band
host matrix
0 0.02 0.04 0.06 0.08 0.1 0.12−600
−550
−500
−450
−400
−350
−300
−250
−200
SHEAR STRAIN, mm/mm
EU
LER
NU
MB
ER
host matrix
shear band
transition zone
0 0.02 0.04 0.06 0.08 0.1 0.128.5
9
9.5
10
10.5
11
11.5
12
12.5
13
13.5
SHEAR STRAIN, mm/mm
SU
RF
AC
E A
RE
A/P
OR
E V
OLU
ME
, mm
−1
host matrix
shear band
transition zone
0 0.02 0.04 0.06 0.08 0.1 0.12
0.2
0.25
0.3
0.35
0.4
0.45
0.5
0.55
SHEAR STRAIN, mm/mm
PE
RM
EA
BIL
ITY
, Dar
cy shear band
transition zone
host matrix
(a) Porosity (b) Euler number
(c) Surface area/pore volume (d) Permeability
Fig. 12 Geometrical measures and estimated permeability computed from binary images generated inside and outside shear bands. Red circlesrepresent data from the middle plane of shear band (y = 90.1mm); blue squares represent data from the lower transition zone (y = 86.1 mm);
green stars represent data from the upper transition (y = 94.1 mm); black dots represent data from the host matrix (y = 20 mm). The lines are the
averaged value of the unit cell data with the corresponding colors
Acta Geotechnica
123

(e) 12% shear strain (inside Shear Band)
(a) 2% shear strain (inside Shear Band) (b) 2% shear strain (outside Shear Band)
(c) 6% shear strain (inside Shear Band) (d) 6% shear strain (outside Shear Band)
(f) 12% shear strain (outside Shear Band)
Fig. 13 Streamline of two pore volumes at shear strain = 2, 6, and 12 %. Color indicates magnitude of velocity
Acta Geotechnica
123

permeability calculated by finite element method, volume
averaging, geometrical averaging, and the Kozeny-Carman
relation. We found that effective permeabilities obtained
by geometric averaging are the closest to those inferred
from finite element solutions. On the other hand, volume
averaging seems to overestimate the effective permeability
at higher porosity. This overestimation may be due to the
fact that the permeability field is much more heterogeneous
at higher porosity, as shown in Fig. 12.
3.3 Anisotropy of pore space in DEM assemblies
In order to quantify the anisotropy of the permeability, we
compute permeabilities parallel to the shear band (in the
x-direction) and compare them with permeabilities in the
normal direction (the y-direction).
Figure 16 shows the ratio between permeability normal
and parallel to the shear band. Although the permeability
inside the shear band tends to exhibit slightly larger
anisotropy, the anisotropies of both the host matrix and
shear band are both less than 20 %. This result suggests
that pore space of the spherical grain assembly remains
nearly isotropic even after undergoing significant shear.
4 Concluding remarks and future perspective
We present a multiscale lattice Boltzmann/finite element
numerical method that quantitatively links particulate
mechanics to macroscopic mechanical and hydraulic
properties of a grain assembly obtained from discrete ele-
ment simulations. Using a seed-filling algorithm, we pro-
vide a new method to convert DEM assemblies into binary
images. This treatment enables us to analyze hydraulic and
geometrical attributes of pore geometry in DEM assem-
blies with unprecedented detail. To the best of our
knowledge, this work is the first example of applications of
lattice Boltzmann simulations and geometrical measure-
ment on binary images of DEM assembly.
The DEM simulations demonstrate the manner in which
deformation and micro-rotation are localized within a shear
band. A persistent shear band forms when shearing stress is
0.32 0.34 0.36 0.38 0.4 0.42 0.44200
400
600
800
1000
1200
1400
1600P
ER
ME
AB
ILIT
Y, D
AR
CY
POROSITY
Kozeny−Carman Relationupper 95% prediction boundslower 95% prediction boundsPermeability from LBM
Fig. 14 Regression analysis on Kozeny-Carman relation
0.33 0.34 0.35 0.36 0.37 0.38 0.39 0.4400
500
600
700
800
900
1000
POROSITY
PE
RM
EA
BIL
ITY
, DA
RC
Y
FEM upscalingVolume AverageGeometric AverageKozeny−Carman
Fig. 15 Effective permeability of the large shear band specimen
obtained by FEM upscaling (blue), volume averaging (red), geomet-
rical averaging (green), and Kozeny-Carman relation (black)
0 0.02 0.04 0.06 0.08 0.1 0.120.8
0.9
1
1.1
1.2
1.3
1.4
1.5
SHEAR STRAIN, mm/mm
k n/kp, D
arcy
/Dar
cy
transition zone
shear band
host matrix
Fig. 16 Ratio between permeability in directions normal and parallel
to the shear band. Red circles represent permeability ratio of the
middle plane of shear band (y = 90.1mm); blue squares represent
permeability ratio of the lower transition zone (y = 86.1 mm); greenstars represent permeability ratio of the upper transition (y =
94.1 mm); black dots represent permeability ratio of the host matrix
(y =20 mm). The lines are the averaged value of the unit cell data with
the corresponding colors
Acta Geotechnica
123

near its peak. Subsequent dilation occurs predominantly
within the shear band, leading to larger porosities than
within the surrounding matrix. Contact sliding is also
concentrated within the shear band. Vorticity nearly ceases
outside of the shear band, and within the band, vorticity
and mean grain rotation are nearly equal. The DEM results
suggest that mechanical behavior within the band diverges
from its pre-peak behavior and from the post-peak behavior
outside of the band: the mean confinement stress dimin-
ishes within the band, whereas it increases elsewhere.
Principal directions of contact fabric and stress coincide
within the band, although the directions differ significantly
from those outside the band. Although loading does induce
considerable anisotropy in the contact fabric—the orien-
tations of contacting pairs of particles—the resulting
anisotropy of permeability is, at most, modest in these
simulations of spherical particles.
We found that dilatancy inside shear band not only
increases porosity, but leads to a more interconnected pore
space (as indicated by the increased Euler number) and less
torturous flow paths (as indicated by the decrease in sur-
face/volume number). These geometrical changes in pore
pace induced by shear band formation lead, in turn, to an
increase in effective permeability.
Under the idealized situation in which assembly is
composed of spherical grains, we find that porosity
increase is the dominant factor causing the permeability
change. Although geometrical measures do confirm chan-
ges in pore geometry within a shear band, the influence of
these changes on permeability is minor.
Notice that the proposed numerical framework can also
be integrated with laboratory and field measurements. For
example, one could imagine calibrating the DEM models
with the pre- and post-loading scans and using the
numerical method to infer the evolutions of force chain and
permeability in between. However, since real particles are
rarely in perfectly spherical shape, a more sophisticated
method, such as the potential particle approach in [18],
must be used to faithfully replicate the geometrical attri-
butes of individual grains in the assemblies. This integra-
tion between experimental measurements and numerics is
outside the scope of this work, but will be considered in
future studies.
Since it is likely that shape changes on pore geometry may
play a bigger role if the assembles are composed of non-
spherical grains, we are currently investigating the effects of
particle shape on hydraulic properties by extending the study
to DEM assemblies composed of ellipsoids.
Acknowledgments The authors gratefully acknowledge the support
provided by the Geosciences Research Program of the U. S. Depart-
ment of Energy under Grant No. DE-FG02-08ER15980 to North-
western University. We also thank Professor Teng-fong Wong for
fruitful discussion. We thank Professor Ronaldo I Borja and the
anonymous reviewer for helpful suggestions that improved the paper.
Sandia National Laboratories is a multiprogram laboratory man-
aged and operated by Sandia Corporation, a wholly owned subsidiary
of Lockheed Martin Corporation, for the U.S. Department of Energy’s
National Nuclear Security Administration under contract DE-AC04-
94AL85000.
References
1. Ando E, Hall SA, Viggiani G, Desrues J, Besuelle P (2012)
Grain-scale experimental investigation of localised deformation
in sand: a discrete particle tracking approach. Acta Geotech
7:1–13
2. Antonellini M, Pollard DD (1995) Distinct element modeling of
deformation bands in sandstone. J Struct Geol 17:1165–1182
3. Aydin A, Borja RI, Eichhubl P (2005) Geological and mathe-
matical framework for failure modes in granular rock. J Struct
Geol 29:1831–1842
4. Bear J (1972) Dynamics of fluids in porous media. Elsevier
Publishing Company, New York
5. Besuelle P, Rudnicki JW (2004) Localization: shear bands and
compaction bands. International Geophysics Series, vol 89,
pp 219–321
6. Besuelle P, Desrues J, Raynaud S (2000) Experimental charac-
terisation of the localisation phenomenon inside a vosges sand-
stone in a triaxial cell. Int J Rock Mech Min Sci 37(8):1223–1237
7. Borja RI, Song X, Rechenmacher AL, Abedi S, Wu W (2013)
Shear band in sand with spatially varying density. J Mech Phys
Solids 61(1):219–234
8. Boutt DF, Cook BK, Williams JR (2011) A coupled fluid-solid
model for problems in geomechanics: application to sand pro-
duction. Int J Num Anal Methods Geomech 35(9):997–1018
9. Casagrande A (1936) Characteristics of cohensionless soils
affecting the stability of slops and earth fills. J Boston Soc Civil
Eng 23:13–32
10. Chen C, Packman AI, Gaillard JF (2008) Using X-ray micro-
tomography and pore-scale modeling to quantify sediment mix-
ing and fluid flow in a developing streambed. Geophys Res Lett
35(14)
11. Chupin O, Rechenmacher AL, Abedi S (2012) Finite strain
analysis of nonuniform deformation inside shear bands in sands.
Int J Num Anal Methods Geomech 36(14):1651–1666
12. Cundall PA (1988) Computer simulations of dense sphere
assemblies. In: M Satake, JT Jenkins (eds) Micromechanics of
granular materials, Elsevier Science Pub. B.V., Amsterdam,
pp 113–123
13. Cundall PA, Strack ODL (1979) A discrete numerical model for
granular assemblies. Geotechnique 29:47–65
14. El Shamy U, Zeghal M (2005) Coupled continuum-discrete
model for saturated granular soils. J Eng Mech 131(4):413–426
15. Feng YT, Han K, Owen DRJ (2007) Coupled lattice Boltzmann
method and discrete element modelling of particle transport in
turbulent fluid flows: computational issues. Int J Num Anal
Methods Geomech 72(9):1111–1134
16. Hall S, Bornert M, Desrues J, Pannier Y, Lenoir N, Viggiani G,
Besuelle P (2010) Discrete and continuum analysis of localized
deformation in sand using x-ray ct and volumetric digital image
correlation. Geotechnique 60:315–322
17. Hilfer R, Manwart C (2001) Permeability and conductivity for
reconstruction models of porous media. Phys Rev E 64
18. Houlsby GT (2009) Potential particles: a method for modelling
non-circular particles in DEM. Comput Geotech 36(6):953–959
Acta Geotechnica
123

19. Irmay S (1954) On the hydraulic conductivity of unsaturated
soils. Trans Am Geophys Union 35:463–468
20. Jensen JL (1991) Use of geometric average for effective per-
meability estimation. Math Geol 23(6):833–840
21. Johnson KL (1985) Contact mechanics, Cambridge University
Press, Cambridge
22. Johnson DL, Koplik J, Schwartz LM (1986) New pore-size
parameter characterizing transport in porous media. Phys Rev
Lett 57:2564–2567
23. Kuhn MR (2005) Scaling in granular materials. In: Garcıa-Rojo
R, Herrmann HJ, McNamara S (eds) Powders and grains 2005.
A.A. Balkema, Leiden, pp 115–122
24. Kuhn MR (2011) Implementation of the Jager contact model for
discrete element simulations. Chem Eng. 88(1):66–82
25. Kuhn MR, Bagi K (2004) Contact rolling and deformation in
granular media. Int J Solids Struct 41:5793–5820
26. Legland D, Kieu K, Devaux M-F (2011) Computation of Min-
kowski measures on 2d and 3d binary images. Image Anal Stereol
26(2):1854–5165
27. Lenoir N, Andrade JE, Sun WC, Rudnicki JW (2010) Perme-
ability measurements in sandstones using x-ray ct and lattice
Boltzmann calculations inside and outside of compaction bands.
Adv Comput Tomogr Geomater. GEOX2010, ISTE & Wiley,
pp 279–286
28. Lindquist WB, Vankatarangan A, Dunsmuir J, Wong T-F (2000)
Pore and throat size distributions measured from synchrotron
x-ray tomographic images of fontainebleau sandstone. J Geophys
Res 105:21509–21527
29. Louis L, Baud P, Wong T-F (2007) Characterization of pore-
space heterogeneity in sandstone by x-ray computed tomography.
Geol Soc Lond Special Publ 284(1):127–146
30. Mitchell JK, Soga K (2005) Fundamentals of soil behavior, 3rd
edn. Wiley, New Jersey
31. Oda M, Nemat-Nasser S, Mehrabadi MM (1982) A statistical
study of fabric in a random assembly of spherical granules. Int J
Num Anal Methods Geomech 6:77–94
32. Rechenmacher AL, Abedi S, Chupin O, Orlando AD (2011)
Characterization of mesoscale instabilities in localized granular
shear using digital image correlation. Acta Geotech 6:205–217
33. Rudnicki JW (2004) Shear and compaction band formation on an
elliptic yield cap. J Geophys Res 109:B3
34. Rudnicki JW, Rice JR (1975) Conditions for the localization of
deformation in pressure-sensitive dilatant materials. J Mech Phys
Solids 23:371–394
35. Satake M (1982) Fabric tensor in granular materials. In Vermeer
PA, and Luger HJ (eds) Proceedings of IUTAM symposium on
deformation and failure of granular materials. A.A. Balkema,
Rotterdam, pp 63–68
36. Scheidegger AE (1960) The physics of flow through porous
media. University of Toronto Press, Toronto
37. Schneider CA, Rashand WS, Eliceiri KW (2012) Nih image to
imagej: 25 years of image analysis. Nat Methods 9:671–675
38. Succi S (2001) The lattice Boltzmann equation. Oxford Univer-
sity Press, Oxford
39. Sun WC, Andrade JE, Rudnicki JW (2011a) Multiscale method
for characterization of porous microstructures and their impact on
macroscopic effective permeability. Int J Num Methods Eng
88:1260–1279
40. Sun WC, Andrade JE, Rudnicki JW, Eichhubl E (2011b) Con-
necting microstructural attributes and permeability from 3d
tomographic images of in situ shear-enhanced compaction bands
using multiscale computations. Geophys Res Lett 38:L10302
41. Talon L, Bauer D, Gland N, Youssef S, Auradou H, Ginzburg I
(2012) Assessment of the two relaxation time lattice-Boltzmann
scheme to simulate stokes flow in porous media. Water Resourc
Res 48:W04526
42. Thornton C (2000) Numerical simulations of deviatoric shear
deformation of granular media. Geotechnique 50(1):43–53
43. Thornton C, Randall CW (1988) Applications of theoretical
contact mechanics to solid particle system simulation. In Satake
M, Jenkins JT (eds) Micromechanics of granular materials,
Elsevier Science Pub. B.V., Amsterdam, pp 133–142
44. Wawersik WR et al (2008) Terrestrial sequestration of CO2: an
assessment of research needs. Adv Geophys 43:97–117
45. White JA, Borja RI, Fredrich JT (2006) Calculating the effective
permeability of sandstone with multiscale lattice Boltzmann/
finite element simulations. Acta Geotech 1:195–209
Acta Geotechnica
123


