
A S H R A E M E M O R A N D U M 1791 Tullie Circle NE • Atlanta GA 30329 • PH: 404/636-8400 • FAX: 404/321-5478 • URL http://www.ashrae.org
January 3, 2012
TO: ASHRAE Authors
FROM: Cindy Michaels, Managing Editor, Special Publications
RE: 2012 Chicago Winter Conference Preprints
Attached is a copy of your conference paper as it will appear FOR SALE, in preprints at
the ASHRAE Winter Conference in Chicago, IL.
Hopefully, the paper is correct and no further corrections are needed. However, if
something has been overlooked or a miscalculation is noticed, corrections can be
submitted from now until FEBRUARY 10, 2012, but will not be recorded until after the
conference.
If we do not hear from you by that date, we will assume the paper is correct and ready for
inclusion into ASHRAE Transactions, Vol. 118, Part 1.
THIS PREPRINT MAY NOT BE DISTRIBUTED IN PAPER OR DIGITAL
FORM, IN WHOLE OR IN PART. IT IS FOR DISCUSSION PURPOSES ONLY
AT THE 2012 ASHRAE WINTER CONFERENCE. The archival version of this
paper along with comments and author responses will be published in ASHRAE
Transactions 2012, Volume 118, Part 1. Your final paper (as printed in
Transactions) will be mailed to you after Transactions has been published.
If you have any questions or concerns, we may be reached at the following:
Michshell Phillips, Editorial Coordinator, 678-539-1191, [email protected]
Matt Walker, Associate Editor, 678-539-1154, [email protected]
Elisabeth Warrick, Assistant Editor, 678-539-1160, [email protected]
Thank you for your time and contribution to ASHRAE literature.

Extremely Low Energy Design forArmy Buildings: Barracks
Richard Liesen, PhD Peter Ellis Alexander Zhivov, PhD Dale HerronMember ASHRAE Member ASHRAE Member ASHRAE Member ASHRAE
CH-12-008
ABSTRACT
The 2007 Energy Independence and Security Act (EISA)require that all new federal facilities be built fossil fuel free by2030. This raises the bar considerably from the 2005 EnergyPolicy Act, which required federal facilities be built to achieveat least 30% energy savings over ASHRAE Standard 90.1 –2004. On the trajectory towards the 2030 goal, buildings haveto meet 65% decrease of source energy from the CommercialBuilding Energy Consumption Survey (CBECS) survey for thebuilding type specified. The EISA requirement is not a compar-ison between a baseline and an energy efficient simulation, buta direct comparison with the actual results from the final simu-lation with the EISA target. This is not a delta percentagecomparison; it includes total source energy and all the buildingloads must be addressed and not left out of the calculation asan unregulated portion of the building load. The result of thestudy was guidance on how to reach a 60-80% energy usereduction from Commercial Building Energy ConsumptionStudy (CBECS).
The 2005 Energy Policy Act requires that federal facil-ities be built to achieve at least a 30% energy savings overthe 2004 ASHRAE Standard 90.1-2004. The ConstructionEngineering Research Laboratory (CERL) of the U.S. ArmyCorps of Engineers in collaboration with USACE HQ andCenters of Standardization for respective building types,subject matter expert (SME) contractors, and the DOENational Renewable Energy Laboratory (NREL) partici-pated in a study to recommend design guides to achieve theFederal requirements for new buildings to be constructedunder the Military Transformation Program. The buildingtypes included Unaccompanied Enlisted Personnel Housingor UEPH, administrative buildings (e.g., a brigade head-
quarters, and a company operation facility), a tactical equip-ment maintenance facility, and a dining facility. This paperpresents the results of the energy analysis for the soldierbarracks (UEPH). It provides the baseline building selectedfor the analysis and the modeling assumptions. As a result ofa computer analysis using EnergyPlus, the target energybudgets are defined for all DOE 15 Climate Zones. Finally,a recommended set of energy efficient solutions for eachclimate zone is presented that shows the buildings limit as itapproached net zero ready. It shows potential energy savingsboth on the building site and source energy when energy usereduction is considered on a building-by-building basis. Italso shows further energy use reduction opportunities whenenergy improvements are made with each building consid-ered as a part of the building cluster or community.
INTRODUCTION
Globally, buildings contribute to a large fraction of theworld’s energy usage. In the United States alone, buildingsconsume about 40% of total energy. The U.S. Army alonespends more than $1 billion annually in building-relatedenergy expenses. The U.S. Army Energy Security Implemen-tation Strategy sets the general direction for the U.S. Armyincluding elimination of energy waste in existing facilities,increase in energy efficiency in new construction and renova-tions, and reduced dependence on fossil fuels. The Army’slong-term goal is to foster Net Zero/Low Energy Installations.Through a combination of energy conservation, utilization ofwaste energy including use of co- and tri-generation, and thebalance of the energy needs using energy from renewablesources, we intend to produce as much as or more energy forinstallations than what we consume over the course of 1 year.
©2012 ASHRAE. THIS PREPRINT MAY NOT BE DISTRIBUTED IN PAPER OR DIGITAL FORM IN WHOLE OR IN PART. IT IS FOR DISCUSSION PURPOSES ONLYAT THE 2012 ASHRAE WINTER CONFERENCE. The archival version of this paper along with comments and author responses will be published in ASHRAETransactions, Volume 118, Part 1. ASHRAE must receive written questions or comments regarding this paper by February 10, 2012, for them to be included inTransactions.
Peter Ellis is president of Big Ladder Software, Denver, CO. Richard Liesen, Alexander Zhivov, and Dale Herron are senior engineers atthe U.S. Army Corps of Engineers Construction Energy Research Laboratory, Champaign, IL.

The U.S. 2005 Energy Policy Act (EPACT 2005) requiresthat federal facilities be built to achieve at least a 30% energysavings over the 2004 International Energy Code or ASHRAEStandard 90.1-2004 as appropriate, and that energy efficientdesigns must be life-cycle cost effective. In 2006-2008, theU.S. Army Corps of Engineers (USACE) collaborated withthe National Renewable Energy Laboratory (NREL), and theASHRAE Military Technology Group (MTG) to developbaseline and target energy budgets and design guides with aprescriptive path for achieving EPACT 2005 energy goals andthe results of this study were published in the Whole BuildingDesign Guide website and the ASHRAE papers (ASHRAE2009a, 2009b, 2009c).
The recently published USACE ECB-14-2010, whichrequires the reduction of building site energy consumptionwith new construction and major renovation projects by 40%compared to a facility designed in accordance with ASHRAE90.1-2007, is more stringent than (and thus supersedes)EPACT 2005. According to the U.S. Energy Independenceand Security Act (EISA 2007), new federal buildings andfederal buildings undergoing major renovations shall bedesigned to reduce energy consumption generated on- or off-site using fossil fuels by 55% in 2010, 80% by 2020, and 100%by 2030, as compared with such energy consumption by asimilar building in 2003.
The U.S. Army Engineer Research and DevelopmentCenter, Construction Engineering Research Laboratory of theUSACE, in collaboration with U.S. Department of Energy’s(DOE) National Renewable Energy Laboratory, academia,and private sector subject matter experts recently completedan energy analysis (USACE, 2011) that evaluates potential siteand source energy use reduction in new buildings to beconstructed. The building types studied included a soldierbarracks, a brigade headquarters (administrative building), acompany operation facility, a maintenance facility, and adining facility. As a reference, the study used recent buildingdesigns developed by USACE in collaboration with industryexperts and A&E firms. The study was conducted for repre-sentative locations in 15 DOE identified climate zones in theUnited States with building designs adapted to these climaticconditions. This paper presents the results of the energy anal-ysis for a typical Army barracks facility. It discusses energyefficiency measures and combinations used to reduce bothinternal and external loads on the building and overall energyuse. It shows potential energy savings both on the building siteand energy source when energy use reduction is considered ona building-by-building basis. It also shows further energy usereduction opportunities when energy improvements are madewith each building considered as a part of the building clusteror community.
While the main purpose of this study was to comply withthe Energy Independence and Security Act (EISA) of 2007target of a 65 percent fossil fuel reduction by 2015 achieved byreducing building energy consumption, the study simultane-ously determined compliance with the energy performance
option of the American Society of Heating, Refrigerating andAir-Conditioning (ASHRAE) Standard 189.1, which is basedon a 30 percent reduction of energy from ASHRAE 90.1-2007, including plug loads. This study was to determine if theEISA goals for 2015 could be met by energy efficiencymeasures (EEMs) alone without impacting the currentmission of the building.
APPROACH
The approaches used during the study included a prelim-inary meeting/charrettes with the COS (Center of Standard-ization) for the five building types as well as integratedschematic charrettes with COS representatives for eachprofessional discipline both before and after energy modelingwas completed. A lead Cost Estimator worked with the COSestimators and the U.S. Army Engineer Research and Devel-opment Center/Construction Engineering Research Labora-tory (ERDC/CERL) to assess what study findings may beincorporated under current project programming and howmuch additional funding will be necessary to incorporate allstudy findings into each facility type for the FY13 MILCONprogram. A webinar was held with representatives fromaffected installations in the FY13 MILCON program andlessons learned will be shared with COSs and Army Installa-tions staff. Operations and maintenance (O&M) impacts onstaff at the Installations level and long-term energy efficiencyof the buildings were also considered.
The energy efficient packages started with a base packageof low-energy features determined by CERL and NREL.These features focused specifically on a passive houseapproach, low infiltration rates, improved lighting strategies,reduced hot water usage and improved plug load levels thatcould then be modeled in combination with various HVACfeatures and technologies in an iterative process. By modelingthe various packages across different climate zones, energyusage and savings could be compared between the low-energyfeatures.
The energy use baseline, target energy budgets, andenergy savings were developed using different sets of technol-ogies, and were analyzed for the representative model of theUEPH barrack building used for this study is based on theinformation provided by the USACE Fort Worth District – thebarracks Center of Standardization. Energy efficiency tech-nology candidates were selected based on previous CERLstudies of Army barracks that outlined energy and IAQ (moldand mildew) related issues in existing facilities. EEMsselected based on previous studies and practical conditions atthe bases, recommendations of design teams, problems/issuesin existing facilities.
The goal of the integrated optimization process is to findthe optimum for the entire system. Hence, each elementrequires consideration. This process can be analyzed in severalsteps including a debate over whether to conserve energy firstor just generate energy with renewable alternatives. Figure 1shows the theoretical path and process for each individual
2 CH-12-008

building optimization. Point 1 is the base case buildingrequired to be built to the local code body requirements and theTotal Cash flow is the annual mortgage or financed cost plusthe energy cost. To get to Point 2, it is more cost effective toadd energy efficient technologies instead of renewables and isthe lowest annual cost (Point 2). One would not add renew-ables from Point 2 since many more energy efficiency tech-nologies that are more cost effective than adding renewablescan still be added. Point 3 is reached when the annual costequals the base-case building built to code, although at thatpoint, the building is now much more energy efficient and inmany cases much more comfortable. Continuing to add energyefficiency measures beyond Point 3 to the building, one even-tually reaches the crossover point, Point 4, where implement-ing energy generation systems, or supply technologies is morecost-effective than adding further energy efficiency options.By definition, this crossover (Point 4) marks the point wherethe building is “Net Zero Ready.” Point 4 is normally at 50%to 80% savings depending on building and location.
All energy simulations for the UEPH were carried outwith EnergyPlus. The first step in this whole building energysimulation project was to define the baseline building modelwhich is designed based on the Fort Worth District plans forthe Fort Leavenworth project. For this study, the GermanPassivhaus (passive house) standards were used to go beyondthe current ASHRAE standards and develop ultra-low energybuildings.
BUILDING DESCRIPTION
Unaccompanied Enlisted Personnel Housing (UEPH orbarracks) is a cross between an apartment building and college
dormitory. Within the Army, the different sizes of barracks arebased on the number of soldiers living in them. The represen-tative model of the UEPH barrack building used for this studyis based on the information provided by the USACE FortWorth District – the Barracks Center of Standardization. Themodel used for this study contained 56 double occupancyunits. Each apartment unit has two bedrooms with a storagearea, one shared bathroom, a kitchen, a mechanical room, anda storage area (Figure 2). The first floor has 18 units, a laundryroom, a common area, a mechanical room, and a storage area.The second and third floors have 19 units. Each floor is18,257 ft2 [1696 m2] and the building is 54,771 ft2 [5088.4m2], and Figure 3 shows an elevation view of the building anda rendering of the baseline computer model.
LOCATIONS
Fifteen locations were selected to represent 15 climatezones in the United States. EEMs were modeled for eachbuilding type across 15 locations. The 15 locations wereselected to represent 15 American Society of Heating, Refrig-erating and Air-Conditioning Engineers (ASHRAE) climatezones in the United States. The locations selected were repre-sentative cities for the climate zones. Colorado Springs wasselected for climate zone 5B instead of Boise, ID, to moreclosely align with the installations at Fort Carson, CO. Table 1lists the 15 climate zones and the cities used to represent them.
ENERGY MODELING
The energy simulations were completed using EnergyPlusversion 2.0 (DOE 2008). Table 2 lists the modeling assump-tions used in the baseline and energy efficient models. Customsoftware developed by Big Ladder Software was used to para-metrically construct the EnergyPlus models and manage theruns, utilizing multi-core processors when available.
The approach to modeling the energy efficiency improve-ments was to add one improvement at a time, starting with theenvelope, then infiltration, and then HVAC. The followingsections describe the approach to modeling each of these areas.
IMPROVED BUILDING ENVELOPE
Significant energy use reduction by buildings can beachieved by minimizing the impact of the external environ-ment on the building heating and/or cooling loads. While thecurrent advanced buildings practice in the United States isbased on the ASHRAE Standards 90.1 (2010) and 189.1(2009), the highest levels of insulation, windows, and air infil-tration for building energy envelope efficiency for obtainingultra-low energy buildings are the German Passive House(Passivhaus) standard. The Passivehaus standard was devel-oped by professors Bo Adamson of Lund University, Sweden,and Wolfgang Feist of the Institut für Wohnen und Umwelt(Institute for Housing and the Environment, Germany)followed by the Swiss MINENERGY-P standard.
For this study, the Passive House standards were used togo beyond the current ASHRAE standards. The basic concept
Figure 1 Lowest cost path to a building configuration thatuses net zero energy.
CH-12-008 3

Figure 2 A Section of the first floor plan for the UEPH barracks.
Figure 3 Elevation view and rendering of the energy simulation model.
4 CH-12-008

behind the passive house approach is a well insulated and veryairtight building to reduce the amount of energy required toheat, ventilate, and cool it. Typical Passive House character-istics for central European locations include:
• Airtight building shell ≤0.6 ach @ 50 Pa pressure differ-ence (~0.11 cfm/ft2 [0.56 L/s/m2] of the building enve-lope area at 75 Pa pressure difference) measured byblower-door test
• Annual heat requirement ≤15 kWh/m2/year (≤4.75kBtu/ft2/year)
• Primary Energy ≤ 120 kWh/m2/year (38.1 kBtu/ft2/year)• Window U-value ≤ 0.8 W/m2/K (0.14 Btu/h/ft2/°F)• Ventilation system with heat recovery with ≥75% effi-
ciency and low electric consumption @ 0.45 Wh/m3
(0.043 Btu/ft3)• Thermal Bridge Free Construction ≤0.01 W/m·K
(≤0.0058 Btu/(ft·°F))
Since 1996, more than 20,000 buildings meeting thesestandards were built and retrofitted around the world, primar-ily in Germany, Austria, and Switzerland, and they includeresidential, office, schools, and supermarket buildings. A greatmany of these buildings have been extensively monitored by
the PassivHaus Institut in Darmstadt. European UnionCommission intends (EU Parliament resolution of 31 January2008 on an Action Plan for Energy Efficiency) to place a bind-ing requirement that all new buildings needing to be heatedand/or cooled be constructed to Passive House or equivalentnon-residential standards from 2011 onwards.
ERDC-CERL researchers in collaboration with GeorgZielke, Architekturburo Zielke Passivhauser and Dr. BertholdKauffman, Passivhaus Institut, Germany, have developed thefollowing interpretation of Passive House characteristics ofthe building envelope to be applied to U.S. constructionspecifics for all 15 DOE climate zones.
Air Tightness
According to the USACE ECB 29 2009, the air leakagerate of the building envelope shall not exceed 0.25 CFM/ft2
(1.27 L/s/m2) at a pressure differential of 0.3 inch w.c. (75 Pa)for new and renovation construction projects. In 2010, morethan 200 buildings on Army Installations were constructedand renovated to meet or exceed this requirement (achievingair tightness of 0.10 cfm/ft2 (0.51 L/s/m2) or better was notuncommon) at no or minimal additional cost. Based on thisexperience and on industry consensus, the new level for airtightness was proposed to be lowered to 0.15 CFM/ft2 (0.76 L/s/m2) at a pressure differential of 0.3 inch w.c. (75 Pa).
Insulation of Nontransparent Building Components
Types of insulation materials used depend on construc-tion practices, the climate, and other factors. Typical insulat-ing materials used in the United States include wood-fiberboards, cellulose, foam glass, mineral wool, fiberglass,extruded polystyrene, expanded polystyrene, polyurethaneboards, perlite, etc. The most commonly used materials arewood-fiber boards (λ = 0.045 W/mK), mineral wool (λ =0.035-0.040 W/mK) and expanded polystyrene (λ = 0.035-0.040 W/mK). These low-cost materials are well suited formost new construction and retrofit situations. Table 3 listsinsulation requirements (R-values) for walls and roof in differ-ent climate conditions resulted from this study compared tocurrent Army requirements as well as requirements from theASHRAE Std 90.1 (2010, 2007), ASHRAE Std 189.1 and theASHRAE Advanced Energy Guides.
In addition to energy conservation, improved buildinginsulation and air tightness result in a more stable roomtemperature between day and night, higher internal wallsurface temperature in winter, and lower component internalwall temperature in summer. Higher wall temperature inwinter reduces the risk that mold or mildew may occur on theinternal wall surfaces and improves therefore the quality of lifein a building.
Business As Usual provides the least first cost insulationlevel. ASHRAE determines the minimum insulation level thatwill be mandated by code using a Life Cycle Cost optimizationalgorithm. The current ASHRAE Optimization parametersused for the 2010 development were national average
Table 1. Climate Zones and Cities Usedfor Simulations
Climate Zone
CityHDD,
Base 65°F(18 °C)
CDD,Base 50°F
(10 °C)
1A Miami, FL 200 9474
2A Houston, TX 1599 6876
2B Phoenix, AZ 1350 8425
3A Memphis. TN 3082 5467
3B El Paso, TX 2708 5488
3C San Francisco, CA 3016 2883
4A Baltimore, MD 4707 3709
4B Albuquerque, NM 4425 3908
4C Seattle, WA 4908 1823
5A Chicago, IL 6536 2941
5B Colorado Springs, CO 6415 2312
6A Burlington, VT 7771 2228
6B Helena, MT 7699 1841
7A Duluth, MN 9818 1536
8A Fairbanks, AK 13940 1040
CDD = Cooling degree Days; HDD – Heating Degree Days
CH-12-008 5

combined heating fuel prices at $1.22/therm ($0.042/kWh), ablended cooling fuel price at $0.09/kWh, and a scalar ratio of20. But for energy security planning and risk analysis it isnecessary to look at increased fuel prices to see the recom-mended insulation levels at higher energy prices. Thisscenario assumed fuel prices were triple, or $3.50/therm($0.119/kWh) and $0.30/kWh. This is the energy securityscenario that we must plan for today since wall and roof insu-lation level cannot be cost effectively retrofitted to these levelsat a later date.
In this example (Figure 4), the ASHRAE life cycle costcurves recommended for Climate Zone 2 going from R-25 toR-50 (R-4.4 to R-8.8) for roof insulation entirely above deckand from R-13 + R-7.5ci to R-13 + R-28.1ci (R-2.29 + R-1.32cito R-2.29 + R-4.95ci). This level would exceed the Passive
House insulation levels that are listed in Table 3, indicating thatthe Passive House levels are justified when higher energyprices are considered as part of the risk analysis. Tables 3 and4 list the values that were used in this study.
INFILTRATION
It is difficult to obtain good data and develop detailedmodels of infiltration. Every building has different leakagecharacteristics, and the infiltration varies with operation of thebuilding and ambient conditions. Most often an averageconstant infiltration rate in the energy model is used. Severalassumptions still have to be made to go from these leakagerates to the simple infiltration model in the building simulationprogram. The infiltration at these leakage rates and pressures
Table 2. Model Assumptions
Building Component Baseline Building Model Efficient Building Model
Area 54,771 ft2 (5088.4 m2) Same as baseline
Floors 3 Same as baseline
Orientation Long axis running east and west Same as baseline
Aspect Ratio Same as baseline
Window to wall ratio 15% on north and south facades Same as baseline
Window type Standard 90.1-2004 See Table 4
Wall construction Steel frame Same as baseline
Wall insulation Standard 90.1-2004 See Table 3
Roof construction Sloped roof and attic with insulation at the roof level
Sloped metal roof and attic with insulation at the ceiling
level
Roof insulation
Standard 90.1-2004 equal to the “insulation entirely
above deck” See Table 3
Infiltration 0.25 cfm/ft2 @ 0.3 inch w.c. 0.15 cfm/ft2 @ 0.3 inch w.c.
Lighting
Rooms - 1.1 W/ft2 (10.8 W/m2)
Corridors: 0.5 W/ft2 (6.5 W/m2)
See Table 6
Rooms – 0.6 W/ft2 (10.8 W/m2)
Corridors: 0.5 W/ft2 (6.5 W/m2)
See Table 6
Plug loads 1.7 W/ft2 (18.3 W/m2) plus refrigerator and range 0.835 W/ft2 (8.99 W/m2) plus refrigerator and range
Temp set points70°F (21.1C) heating; 75°F (23.9 C) cooling, no set
backSame as baseline
HVAC
DOAS (2.87 COP), central natural gas boiler hot
water system (0.80 Et), 4-pipe Fan Coil Units (FCUs)
for zone temperature control.
Sys Base: DOAS with DX dehumidification (4.4 COP),
gas heating coil (0.95 Et), ERV (80% effectiveness), 4-
pipe FCUs for zone temperature control.
Sys Optional: DOAS with DX dehumidification, gas
heating coil (0.95 Et), ERV (80% effectiveness), radiant
heating and cooling for zone temperature control.
DHW Standard natural gas boiler (0.8 Et) Condensing natural gas boiler (0.95 Et)
6 CH-12-008

CH-12-008 7
Tabl
e 3.
Wal
l and
Roo
f Ins
ulat
ion
Valu
es
Clim
ate
Zon
e1A
2A2B
3A3B
3C4A
4B4C
5A5B
6A6B
7A8A
Wal
ls (
in o
rder
fro
mm
ost t
o le
ast s
trin
gent
)
Wal
l Ins
ulat
ion
Pass
ive
Hou
se R
-Val
ueR
-19+
R7.
5ci
R-1
9+R
15ci
R-1
9+R
15ci
R-1
9+R
20ci
R-1
9+R
20ci
R-1
9+R
10ci
R-1
9+R
25ci
R-1
9+R
25ci
R-1
9+R
20ci
R-1
9+R
30ci
R-1
9+R
30ci
R-1
9+R
40ci
R-1
9+R
40ci
R-1
9+R
50ci
R-1
9+R
50ci
WB
DG
, Arm
y sp
ecs—
Stee
l-Fr
amed
Wal
lsR
-13+
R7.
5ci
R-1
3+R
7.5c
iR
-13+
R7.
5ci
R-1
3+R
7.5c
iR
-13+
R7.
5ci
R-1
3+R
7.5c
iR
-13+
R7.
5ci
R-1
3+R
12.5
ciR
-13+
R12
.5ci
R-1
3+R
12.5
ciR
-13+
R12
.5ci
R-1
3+R
18.8
ciR
-13+
R18
.8ci
R-1
3+R
18.8
ciR
-13+
R18
.8ci
90.1
-201
0 ad
dend
a bb
—St
eel-
Fram
ed W
alls
R-1
3+R
7.5c
iR
-13+
R7.
5ci
R-1
3+R
7.5c
iR
-13+
R7.
5ci
R-1
3+R
7.5c
iR
-13+
R7.
5ci
R-1
3+R
10.0
ciR
-13+
R10
.0ci
R-1
3+R
10.0
ciR
-13+
R10
.0ci
R-1
3+R
10.0
ciR
-13+
R10
.0ci
R-1
3+R
10.0
ciR
-13+
R10
.0ci
R-1
3+R
10.0
ci
189.
1–20
09—
Stee
l-Fr
amed
Wal
lsR
-13+
R5.
0ci
R-1
3+R
5.0c
iR
-13+
R5.
0ci
R-1
3+R
5.0c
iR
-13+
R5.
0ci
R-1
3+R
5.0c
iR
-13+
R10
.0ci
R-1
3+R
10.0
ciR
-13+
R10
.0ci
R-1
3+R
10.0
ciR
-13+
R10
.0ci
R-1
3+R
10.0
ciR
-13+
R10
.0ci
R-1
3+R
10.0
ciR
-13+
R10
.0ci
ASH
RA
E A
ED
G—
Stee
l-Fr
amed
Wal
lsR
-13.
0R
-13.
0R
-13.
0R
-13+
R3.
8ci
R-1
3+R
3.8c
iR
-13+
R3.
8ci
R-1
3+R
7.5c
iR
-13+
R7.
5ci
R-1
3+R
7.5c
iR
-13+
R7.
5ci
R-1
3+R
7.5c
iR
-13+
R7.
5ci
R-1
3+R
7.5c
iR
-13+
R7.
5ci
R-1
3+R
21.6
ci
90.1
–200
7—St
eel-
Fram
ed W
alls
R-1
3.0
R-1
3.0
R-1
3.0
R-1
3+R
3.8c
iR
-13+
R3.
8ci
R-1
3+R
3.8c
iR
-13+
R7.
5ci
R-1
3+R
7.5c
iR
-13+
R7.
5ci
R-1
3+R
7.5c
iR
-13+
R7.
5ci
R-1
3+R
7.5c
iR
-13+
R7.
5ci
R-1
3+R
7.5c
iR
-13+
R7.
5ci
Roo
fs (
in o
rder
fro
mm
ost t
o le
ast s
trin
gent
)
Roo
f In
sula
tion
Pass
ive
Hou
se R
-Val
ueR
-25
R-3
0R
-30
R-3
5R
-35
R-2
5R
-45
R-4
5R
-35
R-5
5R
-55
R-7
0R
-70
R-8
0R
-90
WB
DG
, Arm
y sp
ecs—
Roo
fs in
sula
tion
abov
e de
ckR
-25
R-2
5R
-25
R-2
5R
-25
R-2
5R
-30
R-3
0R
-30
R-3
0R
-30
R-4
0R
-40
R-4
0R
-40
90.1
-201
0 ad
dend
a bb
—R
oofs
insu
latio
n ab
ove
deck
R-2
0R
-25
R-2
5R
-25
R-2
5R
-25
R-3
0R
-30
R-3
0R
-30
R-3
0R
-30
R-3
0R
-35
R-3
5
189.
1–20
09—
Roo
fs in
sula
tion
abov
e de
ckR
-20
R-2
5R
-25
R-2
5R
-25
R-2
5R
-25
R-2
5R
-25
R-2
5R
-25
R-3
0R
-30
R-3
5R
-35
ASH
RA
E A
ED
G—
Roo
fs in
sula
tion
abov
e de
ckR
-15
R-2
0R
-20
R-2
0R
-20
R-2
0R
-20
R-2
0R
-20
R-2
0R
-20
R-2
0R
-20
R-2
0R
-20
90.1
–200
7—R
oofs
insu
latio
n ab
ove
deck
R-1
5R
-15
R-1
5R
-20
R-2
0R
-20
R-2
0R
-20
R-2
0R
-20
R-2
0R
-20
R-2
0R
-20
R-3
0

8 CH-12-008
Tabl
e 4.
Win
dow
Val
ues
1A2A
2B3A
3B3C
4A4B
4C5A
5B6A
6B7A
8A
Mia
mi,
FL
Hou
ston
, T
XP
hoen
ix,
AZ
Mem
phis
, T
NE
l Pas
o,
TX
San
Fra
ncis
co,
CA
Bal
tim
ore,
M
DA
lbuq
uerq
ue,
NM
Seat
tle,
W
AC
hica
go,
IL
Col
orad
o Sp
ring
s,
CO
Bur
lingt
on,
VT
Hel
ena,
M
TD
ulut
h,
MN
Fai
rban
ks,
AK
Win
dow
s
Pas
sive
Hau
sW
indo
w S
peci
fica
tion
s
U-V
alue
(B
tu/h
/ft2 /°
F)0.
260.
260.
260.
260.
260.
260.
180.
180.
180.
180.
180.
180.
180.
180.
18
U-V
alue
(W
/m2 /K
)1.
481.
481.
481.
481.
481.
481.
021.
021.
021.
021.
021.
021.
021.
021.
02
SHG
C0.
250.
250.
250.
390.
390.
390.
390.
390.
390.
490.
490.
490.
490.
490.
49
VT
>0.
50>
0.50
>0.
50>
0.50
>0.
50>
0.50
>0.5
0>
0.50
>0.5
0>
0.50
>0.
50>
0.50
>0.
50>0
.50
>0.
50
WW
R<3
0%<
30%
<30
%<
30%
<30
%<3
0%<
30%
<30
%<3
0%<
30%
<30%
<30%
<30
%<3
0%<
30%
Arm
y W
BD
G—
Win
dow
Spe
cifi
cati
ons
U-V
alue
(B
tu/h
/ft2 /°
F)0.
450.
450.
450.
450.
450.
450.
420.
420.
420.
420.
420.
420.
420.
330.
33
U-V
alue
(W
/m2 /K
)2.
562.
562.
562.
562.
562.
562.
382.
382.
382.
382.
382.
382.
381.
871.
87
SHG
C0.
250.
250.
250.
370.
370.
370.
390.
390.
390.
390.
390.
390.
39N
RN
R
VT
NR
NR
NR
NR
NR
NR
NR
NR
NR
NR
NR
NR
NR
NR
NR
ASH
RA
E 1
89.1
Win
dow
Spe
cifi
cati
ons
U-V
alue
(B
tu/h
/ft2 /°
F)1.
200.
750.
750.
550.
550.
550.
450.
450.
450.
450.
450.
450.
450.
350.
35
U-V
alue
(W
/m2 /K
)6.
814.
264.
263.
123.
123.
122.
562.
562.
562.
562.
562.
562.
561.
991.
99
SHG
C0.
250.
250.
250.
250.
250.
250.
350.
350.
350.
350.
350.
400.
400.
450.
45
VT
NR
NR
NR
NR
NR
NR
NR
NR
NR
NR
NR
NR
NR
NR
NR
ASH
RA
E 9
0.1-
2007
W
indo
w S
peci
fica
tion
s
U-V
alue
(B
tu/h
/ft2 /°
F)1.
200.
750.
750.
650.
650.
650.
550.
550.
550.
550.
550.
550.
550.
450.
45
U-V
alue
(W
/m2 /K
)6.
814.
264.
263.
693.
693.
693.
123.
123.
123.
123.
123.
123.
122.
562.
56
SHG
C0.
250.
250.
250.
250.
250.
250.
400.
400.
400.
400.
400.
400.
40N
RN
R
VT
NR
NR
NR
NR
NR
NR
NR
NR
NR
NR
NR
NR
NR
NR
NR
Arm
y Pr
opos
ed
Arm
y R
equi
red

were calculated based on the total wall and flat roof area of thebuilding, then converted to a pressure of 5 Pa from 75 Paassuming a flow coefficient of 0.65. We assumed that the aver-age pressure drop across the building envelop is 0.02 inch w.c.(5 Pa). Wind pressure and temperature differentials across thebuilding envelope drive the infiltration and these drivingforces vary throughout the year; however, these variations arenot modeled in the simulations. We assume that a constant airchanges per hour will model the average effects over the year.Table 5 lists the infiltration at these two leakage rates.
The mechanical ventilation system pressurizes the build-ing by providing outside air equal to the building exhaust, plusthe air leakage at 0.02 inch w.c. (5 Pa). Infiltration is oftenassumed to go to zero when buildings are pressurized. Thisassumption is usually made because there is a lack of evidenceto about what really happens and how to model it in an energysimulation. We have assumed that the average uncontrolledinfiltration when the building is pressurized is reduced to 10%of the value calculated at 0.02 inch w.c. (5 Pa). The differencein the leakage rates between the two air tightness levels wasaccounted for in the outdoor ventilation rates for the baselineand energy efficient models.
VENTILATION
The ventilation was set to provide 90 CFM (42.5 L/s) ofoutside air to each apartment unit to make up for the bathroomexhaust and control humidity, which is greater than the venti-lation requirements from ASHRAE Standard 62.1-2004(ASHRAE 2004b) for the baseline model. This level of venti-lation is based on experience with Army barracks. Additionaloutside air was added to the whole building to make up for theleakage rate at 0.02 inch w.c. (5 Pa) pressurization (Table 5).For the efficient model, the ventilation air was reduced to 65CFM (30.7 L/s) per living unit with excess ventilation air perTable 5. The 65 CFM (30.7 L/s) was based on the standarddesign provided by the COS (Center of Standardization).
LIGHTING
The lighting analysis was completed by Atelier Ten andthe focus was on efficient lighting design, and not just improv-ing the efficiency of existing fixtures. An example of thecontrol strategies is listed in Table 6.
Lighting efficiency measures including lighting powerdensity reductions with control strategies for each zone weremodeled.
Figure 4 Insulation life cycle cost for business as usual and passiv haus.
CH-12-008 9

DOMESTIC HOT WATER
Hot water use was assumed to be used at 110°F (43.3 C)with a peak draw of 40 gal/h (295.5 L/hr) per unit from a 140°F(60 C) storage tank. The peak washing machine use per flooris assumed to be four loads per hour or 80 gal/h (363.7 L/hr)of 120°F (48.9 C) hot water, which is approximately 53 gal/h(241 L/hr) from a 140°F (60 C) storage tank.
Domestic hot water usage is calculated at two showers/day/person at 20 gal/shower (75.7 L/shower); along with 3-4flushes/person. Therefore water usage is 60 gal/person/day(272.8 L/person/day) for all water use with ~50% for hotwater. The current use is 30-35 gal/person/day (136.4 – 159 L/person/day) for hot water use, with a subset of 20 gal/person/
day for shower with a 2.0 gpm (0.15 L/s) on shower heads forthe baseline and then at 1.5 gpm (0.11 L/s) shower heads forthe efficient case. In the UEPH, hot water-use reduction can beachieved through the use of water-conserving fixtures, espe-cially shower heads and high efficiency washing machines.
PLUG LOADS
The modeling supported the findings of the previousEPACT study for each of the building types that plug loads area major source of energy usage, particularly in the UEPH. Forexample, in UEPH, the fraction of the total power consumed byplug loads increased from 29 percent in the baseline model to 43percent in the low-energy model. This would be indicative of all
Table 5. Infiltration Leakage Rates
0.25 cfm/ft2 (1.27 L/s/m2) 0.15 cfm/ft2 (0.76 L/s/m2)
ach at 0.3 in. w.c. (75 Pa) 2.98 1.79
ach at 0.02 in. w.c. (5 Pa) 0.51 0.31
Excess ventilation flow at 0.02 in. w.c. (cfm @ 5 Pa) 5832 3499
Excess ventilation flow at 5 Pa (L/s) 2752 1651
Table 6. Lighting Design by Atelier Ten
Design Criteria
Control Strategies
Technologies ApproachLevels
Automatic Interface
Space
Tar
get
Illu
min
ance
Tas
k, f
c(D
esig
n G
oal)
Tar
get
Lig
htin
g P
ower
Den
sity
, W
/ft2
Allo
wab
le L
ight
ing
Pow
erD
ensi
ty, W
/ft2
Swit
chin
g—(b
lank
)M
ulti
-Lev
el—
M
V—
Vac
ancy
(M
anua
l ON
/au
to O
FF
)O
—O
ccup
ancy
(A
uto
ON
/A
uto
OF
F)
Day
light
(e.g
., P
hoto
sens
ors)
Sche
dule
(e.g
., A
stro
nom
ical
tim
e cl
ock)
Lin
ear
Flu
ores
cent
Com
pact
Flu
ores
cent
Cer
amic
Met
al H
alid
e
Lig
ht E
mit
ting
Dio
des
Ove
rhea
d G
ener
al L
ight
ing
Ove
rhea
d A
mbi
ent
Lig
htin
g
Tas
k L
ight
ing
Wal
lwas
h/P
erim
eter
Lig
htin
g
Adj
usta
ble
Acc
ent
Lig
htin
g
Corridor 10 0.50 0.5 O 4 • •
LivingQuarters
5–30 0.60 1.1 V 4 4 4 • • •
Mechanical/Electrical
30 0.70 1.5 V 4 •
Restroom/Shower
20 0.80 0.9 V 4 4 4 • •
Stair 10 0.50 0.6 M O 4 •
Storage(General)
10 0.50 0.8 V 4 • •
10 CH-12-008

buildings where the overall energy usage is reduced withoutreducing the plug loads. The potential EEMs are:
• Use high-efficiency LED computer monitors.• Replace all desktop computers (100 W each) with lap-
top computers (30 W each).• Change computer power settings to standby when idle
for 15 minutes.• Implement the use of standby switching devices.• Eliminate personal printers, copiers, fax machines, and
scanners. Replace them with one or two multi-functionprint stations.
• If vending machines are in the building, use a load-man-aging device and de-lamp them.
• Turn miscellaneous electronics off when they are notbeing used or during unoccupied hours.
• Investigate more efficient task lighting, such as LEDtask lighting per work station.
• All plug load appliances and equipment are not createdequal in terms of energy usage. A prioritized list shouldbe developed that results in the greatest energy savingsfor least cost increase.
In the UEPH, the bedroom has a computer, stereo, televi-sion, and other smaller electronic devices for a plug loaddensity of 1.7 W/ft2 (18.3 W/m2). Each kitchen contains arefrigerator and an electric range. The refrigerator wasassumed to be very efficient with an average power consump-tion of 76 W, and the range was assumed to have a peak powerof 1,500 W. There are 14 washing machines in the building(four on the first floor and five on the second and third floors).With a 90% occupancy rate for the building, there are 140 occu-pants. Three loads per occupant per week for 420 loads/weekor 60 loads/day were assumed. ENERGY STAR® commercialwashing machines use approximately 20 gal (75.7 L) of waterper load and 0.60 kWh of electricity per load. The dryers wereassumed to use 1.5 kWh of electricity per load. Table 7 lists theschedules for the loads.
HVAC AND HOT WATER BOILER
The UEPH baseline HVAC system uses a DOAS (Dedi-cated Outdoor Air System) with condenser reheat. The spaceloads are met with 4-pipe fan coil units connected to a centralchiller and boiler in the baseline model and with radiant heat-ing and cooling in one of the energy efficient models. Thedomestic water-heating system in the baseline buildingmodels uses an 80 percent efficient boiler and the energy effi-cient models use a 95 percent efficient condensing boiler.
The ventilation was set to provide 90 cfm (42.5 L/s) ofoutside air to each apartment unit to make up for the bathroomexhaust and control humidity, which is greater than the venti-lation requirements from ASHRAE 62.1-2004 for the baselinemodel. Additional outside air was added to the whole buildingto make up for the leakage rate at 0.02 inch w.c. (5 Pa) pres-surization as shown in Table 5. For the efficient model, the
ventilation air was reduced to 65 cfm (30.7 L/s) per living unitwith excess ventilation air as listed in Table 5. The 65 cfm(30.7 L/s) was based on the standard design provided by theCOS.
The baseline HVAC system uses packaged single zone airconditioning (PSZ-AC) units with a natural gas furnace ineach room or zone. A high efficiency version of the baselineand a dedicated outdoor air system (DOAS) with fan coil unitswere considered for the energy efficient cases. The first systemwas modeled with an increase in coefficient of performance(COP) to 3.5, increased gas furnace efficiency to 0.9, andimproved fan efficiency. In the second case, the DOASprovided the building ventilation air and zone level fan coilunits were used to control zone loads. The DOAS included apackaged direct expansion coil for cooling and humiditycontrol, hot water coil for heating energy, and an energy recov-ery ventilator (ERV). The ERV was modeled with sensibleheat recovery only at 75% to 70% effectiveness at 75% to100% air flow. Later simulations included latent heat recovery.Frost control for the ERV was handled with the exhaust onlymethod in EnergyPlus, which bypasses the supply air aroundthe ERV to avoid frost conditions. The system was operatedwith an outdoor air temperature (OAT) reset on supply airtemperature (SAT). The SAT set point schedule was colderwith higher OAT and warmer with colder OAT. The set pointat high OAT was lower in the humid climates for better humid-ity control and higher in the dry climates for more energysavings. The space loads are met with 4-pipe fan coil unitsconnected to a central chiller and boiler.
The general HVAC strategy for Army buildings was toprovide high-efficiency HVAC systems that offset the sensibleheating and cooling loads in the spaces and to provide separatehigh-efficiency dedicated outdoor air systems (DOAS), whichincludes a Total Energy Recovery (TER) exhaust air system tohandle the ventilation requirements and the latent (moisture)load in the spaces. The outdoor air ventilation quantityprovided by the DOAS should maintain the building, includ-ing the hallways, at a slightly positive pressure relative tooutside to eliminate uncontrolled infiltration into the building.High-efficiency, variable-speed pumps and fans should beused throughout the HVAC system. High-efficiency boilersand chillers should be used in all cases.
The HVAC strategies and contained in the following listof energy efficient options that were considered:
• DOAS with condenser reheat and individual room fancoils for soldier comfort
• advanced HVAC systems; DOAS for ventilation, pres-surization and make-up air, with condenser heat recov-ery and Energy Recovery Ventilators, both sensible andtotal
• central exhaust that is used for heat recovery to pre-con-dition the ventilation air with Energy Recovery, sensibleand total recovery at 80 percent
CH-12-008 11

• High Efficiency Air Cooled Chiller package, COP from2.87 to 4.4
• condensing boilers, 80 percent to 95 percent efficient
• variable and high-efficiency fans and pumps.
• radiant heating and cooling in the ceilings
• ground-source heat pump (GSHP).
• Indirect Evaporative Pre-Cooling, the Sensible heatrecovery coil in the exhaust air stream is sprayed withwater to pre-cool outside air in the DOAS
• radiant heating and cooling in the ceilings
SOLAR HOT WATER
The Sustainable Design and Development Policy Update,dated October 27, 2010 from the Assistant Secretary of theArmy – Installations, Energy, and Environment, mandatesthat, beginning in FY13, all new construction projects with anaverage daily non-industrial hot water requirement of 50 gal(189 L) or more, and located in an area receiving an annualaverage of 4 kWh/m2/day (147 kBtu/ft2/day) or more will bedesigned to provide a minimum of 30 percent of the facility’shot water demand by solar water heating. EISA 2007, Section523, has a similar requirement for all new Federal buildings in
Table 7. UEPH Apartment Unit Internal Load Schedules
Hr Occupancy Lighting Plug Loads Service Hot Water
Wk Sat Sun Wk Sat Sun Wk Sat Sun Wk Sat Sun
1 0.80 0.75 0.75 0.10 0.10 0.10 0.30 0.30 0.30 0.00 0.00 0.00
2 0.80 0.75 0.75 0.10 0.10 0.10 0.30 0.30 0.30 0.00 0.00 0.00
3 0.80 0.75 0.75 0.10 0.10 0.10 0.30 0.30 0.30 0.00 0.00 0.00
4 0.80 0.75 0.75 0.10 0.10 0.10 0.30 0.30 0.30 0.00 0.00 0.00
5 0.80 0.75 0.75 0.20 0.20 0.20 0.30 0.30 0.30 0.00 0.00 0.00
6 0.80 0.75 0.75 0.40 0.30 0.30 0.30 0.30 0.30 0.10 0.10 0.10
7 0.70 0.65 0.75 0.50 0.50 0.50 0.30 0.30 0.30 0.20 0.20 0.20
8 0.60 0.60 0.70 0.70 0.50 0.70 0.50 0.35 0.30 0.10 0.10 0.10
9 0.50 0.50 1.00 0.20 0.20 0.20 0.50 0.40 0.50 0.00 0.00 0.00
10 0.25 0.25 0.00 0.20 0.20 0.20 0.30 0.40 0.50 0.00 0.00 0.00
11 0.20 0.20 0.20 0.20 0.20 0.20 0.30 0.30 0.50 0.00 0.00 0.00
12 0.20 0.20 0.20 0.20 0.20 0.20 0.30 0.30 0.50 0.00 0.00 0.00
13 0.20 0.20 0.20 0.20 0.20 0.20 0.30 0.30 0.50 0.00 0.00 0.00
14 0.20 0.20 0.20 0.20 0.20 0.20 0.30 0.30 0.50 0.00 0.00 0.00
15 0.20 0.20 0.20 0.10 0.20 0.20 0.30 0.30 0.50 0.00 0.00 0.00
16 0.20 0.20 0.20 0.10 0.20 0.20 0.30 0.30 0.50 0.00 0.00 0.00
17 0.20 0.20 0.20 0.20 0.20 0.20 0.30 0.30 0.50 0.00 0.00 0.00
18 0.20 0.20 0.20 0.50 0.50 0.50 0.30 0.30 0.50 0.10 0.10 0.10
19 0.30 0.30 0.30 0.70 0.50 0.50 0.50 0.50 0.50 0.10 0.10 0.10
20 0.50 0.50 0.50 0.70 0.50 0.50 0.60 0.50 0.40 0.10 0.10 0.10
21 0.50 0.50 0.50 0.70 0.50 0.50 0.70 0.50 0.40 0.00 0.00 0.00
22 0.70 0.50 0.50 0.50 0.50 0.50 0.70 0.50 0.40 0.00 0.00 0.00
23 0.70 0.50 0.50 0.40 0.40 0.40 0.50 0.50 0.40 0.00 0.00 0.00
24 0.80 0.75 0.75 0.20 0.20 0.20 0.30 0.50 0.30 0.00 0.00 0.00
Peak 2 occ/unit 0.6 W/ft2 (6.5 W/m2) 0.835 W/ft2 (9 W/m2) 1.5 gpm/shower (0.11 L/s)
12 CH-12-008

all locations if cost-effective. In the United States, differenttypes of solar water heating systems are available for use instandalone buildings. For this study, solar hot water wasdeemed feasible for UEPH based on the 30 percent renewableenergy requirement; energy savings were modeled for thisbuilding type.
RESULTS
For the UEPH, the Dormitory/Fraternity/Sorority cate-gory was chosen from the CBECS, because it was determinedto be the closest match to the UEPH facility. As will be seenfrom the results in this section, CBECS building categoriesand their related EUIs are not directly comparable to Armybuilding types. This directly affects whether a building meetsor falls short of the EISA 2007 targets for 2015. Annual EUIfor each climate zone was determined from the CBECS dataand compared to the energy baseline for the designed building.The target EUI is 35 percent of the CBECS values, or a 65percent increase in efficiency, which is a very aggressive targetrequired by the EISA 2007 legislation.
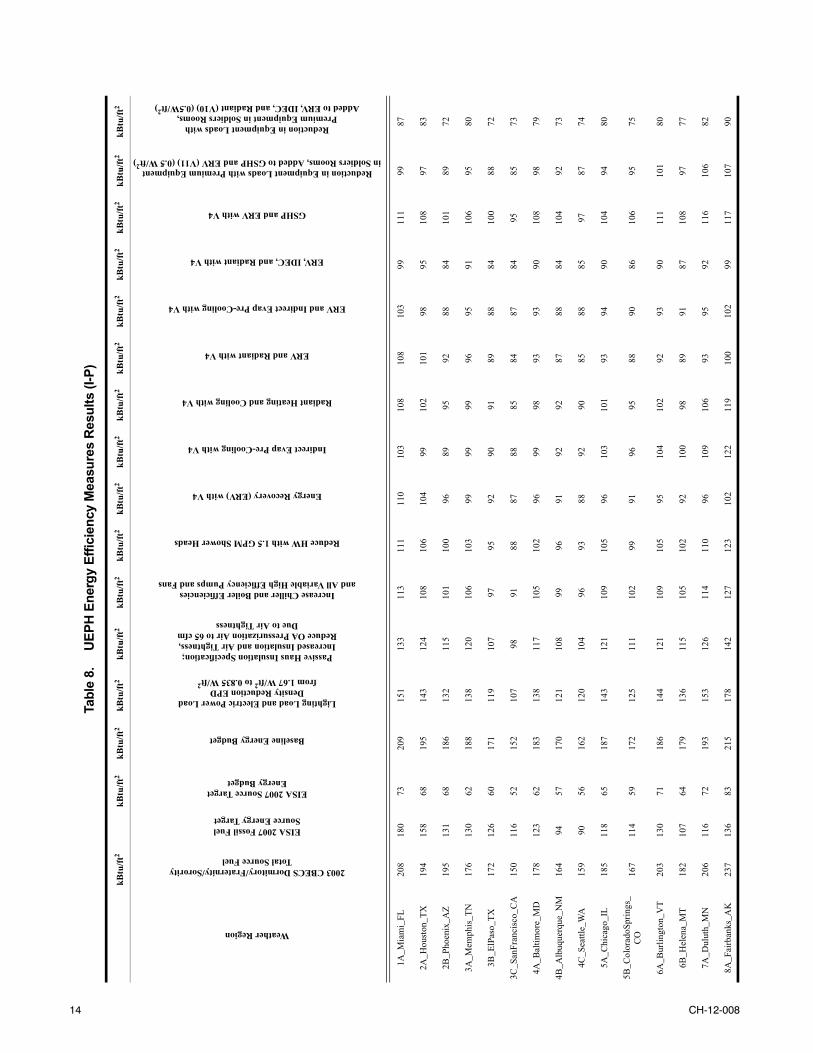
Modeling was completed for each baseline building plusadditional EEM packages for all 15 climate zones. LowEnergy Packages for all building types included increasedexterior insulation, daylighting and daylighting controls,DOAS HVAC systems, improved pumps and fans, pressuriza-tion and make-up air, top-tier ENERGY STAR® appliancesand products, and solar hot water. The results are shown intables and figures below with the cumulative percent savingscompared to the baseline building. In the tables and figuresbelow, the Baseline Building is the base building model fromeach of the COS standard designs. Each EEM or Low EnergyVersion is applied cumulatively to the baseline, starting withV1 (e.g., lighting load and electric power load density reduc-tion for UEPH), then V2, V3, and finally V4. V4 is consideredthe baseline high-performance or low-energy package foreach building. Then EEMs V5–V13 are applied individuallyor in combination to V4 to compare the different HVAC alter-natives. Table 8 lists and Figure 5 shows the source resultsnecessary for EISA 2007 compliance for each building.
As shown in Figure 5, the initial EEMs show goodimprovement and then there are diminishing returns. Evenwith all of these technologies applied, the targets could not beachieved; only when internal loads (building mission) arereduced further do we start seeing further improvements.Another interesting result is that when source fuels are calcu-lated and not just site energy, the savings from Ground SourceHeat Pumps (GSHP) are not as good as expected since muchof the advantages are negated when the source fuels for elec-tricity energy production are considered.
Buildings built or retrofitted to “passive house” require-ments and using advanced “low exergy” systems to satisfyremaining heating and cooling needs eventually become inter-nal load dominated. The remaining energy requirements willbe dominated by electrical power needs for lighting, appli-ances and internal processes and by domestic hot water needs.
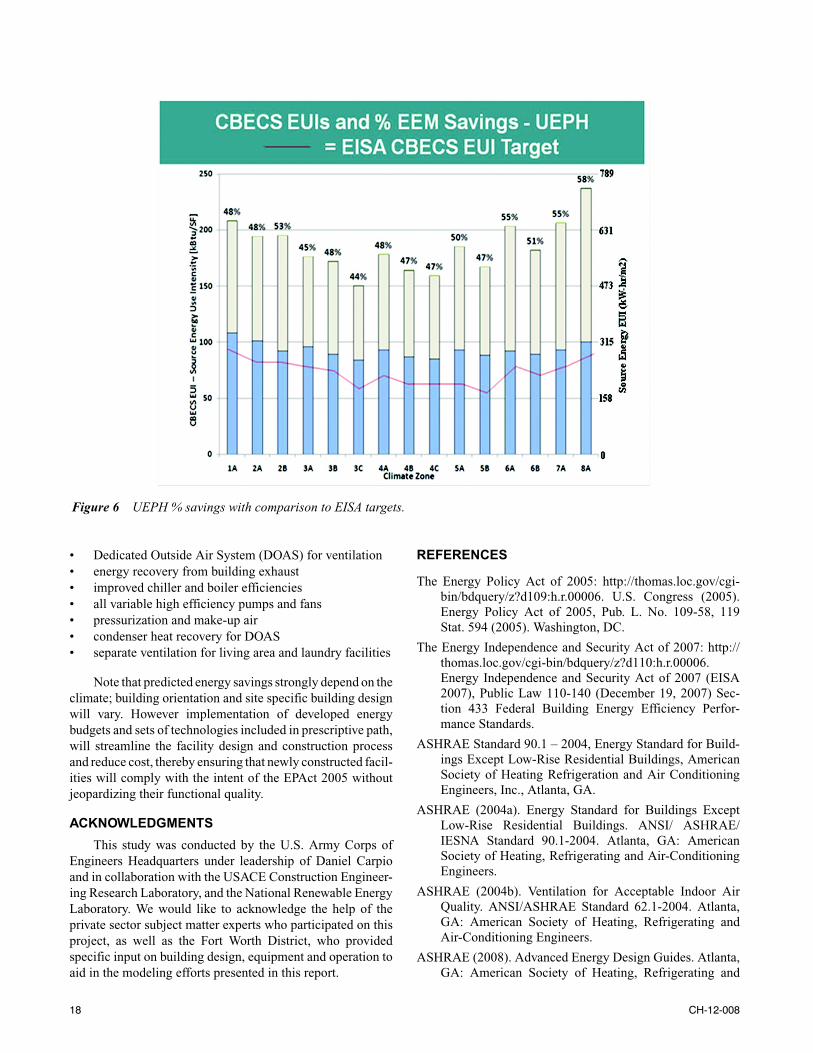
Figure 6 shows the improvements made toward the EISAgoals, and illustrates that, without considering further internalload reduction and the addition of solar hot water (buildingmission), the EISA targets cannot be met by EEMs alone.
Tables 9 and 10 list the baseline component energy for theUEPH by climate zone, and indicate that the mission (lights,plug loads, and hot water) make up from 50 to 86% of the loadvarying by climate zone.
Figure 6 shows that even after the improved lightingdesign, reducing hot water consumption with low flow showerheads and the improving plug loads by 50%, there is a signif-icant percentage of load that remains, ranging from 75 to 94%of the load. With EISA 2007, the total energy is now consid-ered and important. Unlike the EPAct 2005, in which the plugloads were considered unregulated, they are now a significantpart of the problem.
According to the Office of the Assistant Secretary of theArmy, installations must first implement aggressive conserva-tion and efficiency efforts while benchmarking energyconsumption to identify further opportunities. The next step isto utilize waste energy or to “re-purpose” energy. Boiler stackexhaust, building exhausts or other thermal energy streamscan all be utilized for a secondary purpose. Co-generationrecovers heat from the electricity generation process. Thebalance of energy needs then are reduced and can be met byrenewable energy projects.
Figure 7 shows Point 1 is the base case building, which iseither an existing building, or one that must be built to localcode body requirements. If you add renewables at this point,the total annual cost of the net zero energy building will be asshown in point 8. The normal path was explained in the“Approach” section above, where reaching Point 4 was theindividual building “Net Zero Ready” point. Depending on themix of buildings in the cluster, the combined fossil fuel basedenergy reduction in this cluster can reach 30 to 60%. Addingrenewables from point 4 characterizing building cluster willresult in total annual cost of the net zero energy cluster ofbuilding as shown in point 7. Alternatively, the cluster ofbuildings characterized from point 4 can be connected to a co-generation plant, which will require relatively minor invest-ments compared to the cost of decentralized boilers and chill-ers for single buildings, but results in a significant fossil fuelreduction due to utilization of waste heat accompanying elec-tricity generation. This heat can be used either to satisfy heat-ing, cooling and domestic hot water needs of the cluster ofbuildings under consideration, or be exported to another build-ing cluster. By connecting to CHP plant (Combined Heat andPower), fossil fuel usage by the building cluster (point 5) canbe further reduced by 15-20% in a cost effective way. Frompoint 5, adding renewable generation becomes the cost effec-tive supply option. This point, by definition, occurs when thebuilding “cluster” is “Net Zero Ready.” Figure 7 shows thisprocess.
From the building cluster process diagram (Figure 7), itcan be seen that using combined heat and power (CHP) or
CH-12-008 13
14 CH-12-008
Ta
ble
8. U
EP
H E
nerg
y E
ffic
ienc
y M
easu
res
Res
ults
(I-P
)
kBtu
/ft2
kBtu
/ft2
kBtu
/ft2
kBtu
/ft2
kBtu
/ft2
kBtu
/ft2
kBtu
/ft2
kBtu
/ft2
kBtu
/ft2
kBtu
/ft2
kBtu
/ft2
kBtu
/ft2
kBtu
/ft2
kBtu
/ft2
kBtu
/ft2
kBtu
/ft2
Weather Region
2003 CBECS Dormitory/Fraternity/SororityTotal Source Fuel
EISA 2007 Fossil FuelSource Energy Target
EISA 2007 Source TargetEnergy Budget
Baseline Energy Budget
Lighting Load and Electric Power LoadDensity Reduction EPD
from 1.67 W/ft2 to 0.835 W/ft2
Passive Haus Insulation Specification;Increased Insulation and Air Tightness,Reduce OA Pressurization Air to 65 cfm
Due to Air Tightness
Increase Chiller and Boiler Efficienciesand All Variable High Efficiency Pumps and Fans
Reduce HW with 1.5 GPM Shower Heads
Energy Recovery (ERV) with V4
Indirect Evap Pre-Cooling with V4
Radiant Heating and Cooling with V4
ERV and Radiant with V4
ERV and Indirect Evap Pre-Cooling with V4
ERV, IDEC, and Radiant with V4
GSHP and ERV with V4
Reduction in Equipment Loads with Premium Equipmentin Soldiers Rooms, Added to GSHP and ERV (V11) (0.5 W/ft2)
Reduction in Equipment Loads withPremium Equipment in Soldiers Rooms,
Added to ERV, IDEC, and Radiant (V10) (0.5W/ft2)
1A_M
iam
i_FL
208
180
7320
915
113
311
311
111
010
310
810
810
399
111
9987
2A_H
oust
on_T
X19
415
868
195
143
124
108
106
104
9910
210
198
9510
897
83
2B_P
hoen
ix_A
Z19
513
168
186
132
115
101
100
9689
9592
8884
101
8972
3A_M
emph
is_T
N17
613
062
188
138
120
106
103
9999
9996
9591
106
9580
3B_E
lPas
o_T
X17
212
660
171
119
107
9795
9290
9189
8884
100
8872
3C_S
anFr
anci
sco_
CA
150
116
5215
210
798
9188
8788
8584
8784
9585
73
4A_B
altim
ore_
MD
178
123
6218
313
811
710
510
296
9998
9393
9010
898
79
4B_A
lbuq
uerq
ue_N
M16
494
5717
012
110
899
9691
9292
8788
8410
492
73
4C_S
eattl
e_W
A15
990
5616
212
010
496
9388
9290
8588
8597
8774
5A_C
hica
go_I
L18
511
865
187
143
121
109
105
9610
310
193
9490
104
9480
5B_C
olor
adoS
prin
gs_
CO
167
114
5917
212
511
110
299
9196
9588
9086
106
9575
6A_B
urlin
gton
_VT
203
130
7118
614
412
110
910
595
104
102
9293
9011
110
180
6B_H
elen
a_M
T18
210
764
179
136
115
105
102
9210
098
8991
8710
897
77
7A_D
ulut
h_M
N20
611
672
193
153
126
114
110
9610
910
693
9592
116
106
82
8A_F
airb
anks
_AK
237
136
8321
517
814
212
712
310
212
211
910
010
299
117
107
90

CH-12-008 15
Tabl
e 8.
UE
PH
Ene
rgy
Eff
icie
ncy
Mea
sure
s R
esu
lts (S
I)
kW·h
/m2
kW·h
/m2
kW·h
/m2
kW·h
/m2
kW·h
/m2
kW·h
/m2
kW·h
/m2
kW·h
/m2
kW·h
/m2
kW·h
/m2
kW·h
/m2
kW·h
/m2
kW·h
/m2
kW·h
/m2
kW·h
/m2
kW·h
/m2
Weather Region
2003 CBECS Dormitory/Fraternity/SororityTotal Source Fuel
EISA 2007 Fossil FuelSource Energy Target
EISA 2007 Source TargetEnergy Budget
Baseline Energy Budget
Lighting Load and Electric Power LoadDensity Reduction EPD from 18 W/m2 to 9 W/m2
Passive Haus Insulation Specification;Increased Insulation and Air Tightness,
Reduce OA Pressurization Air to 30.7 L/s Due to Air Tightness
Increase Chiller and Boiler Efficienciesand All Variable High Efficiency Pumps and Fans
Reduce HW with 0.11 L/s Shower Heads
Energy Recovery (ERV) with V4
Indirect Evap Pre-Cooling with V4
Radiant Heating and Cooling with V4
ERV and Radiant with V4
ERV and Indirect Evap Pre-Cooling with V4
ERV, IDEC and Radiant with V4
GSHP and ERV with V4
Reduction in Equipment Loads with Premium Equipmentin Soldiers Rooms, Added to GSHP and ERV (V11)
Reduction in Equipment Loads with Premium Equipmentin Soldiers Rooms, Added to ERV, IDEC, and Radiant (V10)
1A_M
iam
i_FL
655
568
229
658
477
420
355
351
348
324
340
340
325
314
350
311
276
2A_H
oust
on_T
X61
149
821
461
545
239
133
933
332
731
332
131
831
029
834
130
526
3
2B_P
hoen
ix_A
Z61
541
321
558
841
836
231
931
430
327
929
929
227
726
431
828
122
6
3A_M
emph
is_T
N55
641
019
559
243
737
833
432
631
331
131
330
230
128
833
530
125
3
3B_E
lPas
o_T
X54
339
719
054
037
433
930
630
029
128
328
728
027
726
531
427
722
8
3C_S
anFr
anci
sco_
CA
472
366
165
479
338
308
288
279
275
277
269
266
274
264
300
267
231
4A_B
altim
ore_
MD
562
388
197
577
434
370
331
322
303
313
310
292
294
283
341
308
249
4B_A
lbuq
uerq
ue_N
M51
629
718
153
638
134
131
130
228
729
229
027
627
826
632
729
123
0
4C_S
eattl
e_W
A50
128
417
551
037
932
830
429
427
929
128
326
927
726
730
727
523
5
5A_C
hica
go_I
L58
437
220
558
945
038
134
233
230
332
531
929
229
728
532
829
625
3
5B_C
olor
adoS
prin
gs_
CO
528
360
185
543
395
351
321
311
288
304
299
278
283
272
336
301
237
6A_B
urlin
gton
_VT
639
410
224
587
455
380
344
332
299
328
320
289
295
284
350
319
252
6B_H
elen
a_M
T57
533
820
156
342
836
433
232
128
931
631
028
028
627
534
030
724
2
7A_D
ulut
h_M
N64
936
622
760
848
339
836
034
630
334
433
529
330
129
136
533
426
0
8A_F
airb
anks
_AK
746
429
261
678
561
449
401
387
323
385
376
315
323
313
368
338
283

16 CH-12-008
Tabl
e 8.
UE
PH
Ene
rgy
Eff
icie
ncy
Mea
sure
s C
umu
lativ
e %
Sav
ings
(I-P
and
SI)
V0
V1
V2
V3
V4
V5
V6
V7
V8
V9
V10
V11
V12
V13
Cum
ulat
ive
% S
avin
gs
V
1-V
0V
2-V
0V
3-V
0V
4-V
0V
5-V
0V
6-V
0V
7-V
0V
8-V
0V
9-V
0V
10-V
0V
11-V
0V
12-V
0V
13-V
0
1A–2
8%–3
6%–4
6%–4
7%–4
7%–5
1%–4
8%–4
8%–5
1%–5
2%–4
7%–5
3%–5
8%
2A–2
7%–3
6%–4
5%–4
6%–4
7%–4
9%–4
8%–4
8%–5
0%–5
1%–4
5%–5
0%–5
7%
2B–2
9%–3
8%–4
6%–4
7%–4
8%–5
2%–4
9%–5
0%–5
3%–5
5%–4
6%–5
2%–6
2%
3A–2
6%–3
6%–4
4%–4
5%–4
7%–4
7%–4
7%–4
9%–4
9%–5
1%–4
3%–4
9%–5
7%
3B–3
1%–3
7%–4
3%–4
4%–4
6%–4
8%–4
7%–4
8%–4
9%–5
1%–4
2%–4
9%–5
8%
3C–3
0%–3
6%–4
0%–4
2%–4
3%–4
2%–4
4%–4
4%–4
3%–4
5%–3
7%–4
4%–5
2%
4A–2
5%–3
6%–4
3%–4
4%–4
8%–4
6%–4
6%–4
9%–4
9%–5
1%–4
1%–4
7%–5
7%
4B–2
9%–3
7%–4
2%–4
4%–4
7%–4
6%–4
6%–4
9%–4
8%–5
0%–3
9%–4
6%–5
7%
4C–2
6%–3
6%–4
0%–4
2%–4
5%–4
3%–4
5%–4
7%–4
6%–4
8%–4
0%–4
6%–5
4%
5A–2
4%–3
5%–4
2%–4
4%–4
9%–4
5%–4
6%–5
0%–5
0%–5
2%–4
4%–5
0%–5
7%
5B–2
7%–3
5%–4
1%–4
3%–4
7%–4
4%–4
5%–4
9%–4
8%–5
0%–3
8%–4
5%–5
6%
6A–2
2%–3
5%–4
1%–4
3%–4
9%–4
4%–4
5%–5
1%–5
0%–5
2%–4
0%–4
6%–5
7%
6B–2
4%–3
5%–4
1%–4
3%–4
9%–4
4%–4
5%–5
0%–4
9%–5
1%–4
0%–4
6%–5
7%
7A–2
1%–3
4%–4
1%–4
3%–5
0%–4
3%–4
5%–5
2%–5
1%–5
2%–4
0%–4
5%–5
7%
8A–1
7%–3
4%–4
1%–4
3%–5
2%–4
3%–4
5%–5
4%–5
2%–5
4%–4
6%–5
0%–5
8%
Ave
rage
% S
avin
gs–2
6%–3
6%–4
2%–4
4%–4
8%–4
6%–4
6%–4
9%–4
9%–5
1%–4
2%–4
8%–5
7%

co-generation can lead to a more cost effective overall highperformance building solution. To get an idea of the magni-tude of the energy performance with CHP, a theoretical exer-cise was done to explore the limit of efficiency increase with100% electrical tracking. A moderate efficiency CHPmachine was chosen with an electrical efficiency of 36%and thermal efficiency of 44% to show the gains. Thisconcept can result in gains of another ~20 to 30%, whichprovide the means to meet the EISA requirements for 2015.Table 11 shows the results.
CONCLUSIONS
This study showed that the application of a Passive Housebuilding envelope concept (improved insulation package andair tightness specifications), advanced lighting strategies, andefficient HVAC systems can result in significant energysavings (site and source) in Army barracks in all climates. Thebarracks site energy can be reduced by 50 to 70% (dependingon climate) compared to the EPACT 2005 baseline. However,source energy use reduction goals of EISA 2007 (starting2015) cannot be achieved.
The application of the Passive House building envelopeconcept significantly reduces heating and cooling loads on theHVAC systems, and minimizes the size of different systemtypes selected. The HVAC system type can be selected usingmultiple criteria (e.g., greater energy efficiency, ease of oper-ation and maintenance, and ease of installation). Some heatingand cooling technologies that can reduce building site energy
use will result in increased use of source fuel. For example,while the use of ground-source heat pumps (GSHPs) mayappear to be an attractive choice to reduce building site energyconsumption, calculations made back to the source fuelsnegate many of the gains related to the use of GSHPs, and insome locations, show that GSHPs use more source fuel thanalternative technologies.
When buildings built or retrofitted to Passive Houserequirements with advanced lighting systems and highly effi-cient “low exergy” HVAC systems reach a theoretical mini-mum, the largest percentage of the remaining energy use in thebuilding will be related to its “mission”: lighting, plug loads,and domestic hot water usage. It is important to understandthese loads, to improve their efficiency, and to reduce their use.Additional savings may be achieved with measures related toimproved efficiency of power generation supplied to the build-ing (co- and tri-generation) and use of energy supplied fromrenewable energy sources. Connecting a building to aCombined Heat and Power (CHP) plant can further reduce thebuilding’s fossil fuel usage by 20-30% depending on the ther-mal-to-electric load ratio.
Results of this study will be incorporated in the Design-Build process under MILCON Transformation Program andthe suggested sets of energy conservation technologiesallowed for 44 to 58% energy savings in UEPH barracks. Therecommended HVAC requirements for the UnaccompaniedEnlisted Personnel Housing (UEPH) are:
Figure 5 UEPH energy efficiency measures (EEMs).
CH-12-008 17
• Dedicated Outside Air System (DOAS) for ventilation• energy recovery from building exhaust• improved chiller and boiler efficiencies• all variable high efficiency pumps and fans• pressurization and make-up air• condenser heat recovery for DOAS• separate ventilation for living area and laundry facilities
Note that predicted energy savings strongly depend on theclimate; building orientation and site specific building designwill vary. However implementation of developed energybudgets and sets of technologies included in prescriptive path,will streamline the facility design and construction processand reduce cost, thereby ensuring that newly constructed facil-ities will comply with the intent of the EPAct 2005 withoutjeopardizing their functional quality.
ACKNOWLEDGMENTS
This study was conducted by the U.S. Army Corps ofEngineers Headquarters under leadership of Daniel Carpioand in collaboration with the USACE Construction Engineer-ing Research Laboratory, and the National Renewable EnergyLaboratory. We would like to acknowledge the help of theprivate sector subject matter experts who participated on thisproject, as well as the Fort Worth District, who providedspecific input on building design, equipment and operation toaid in the modeling efforts presented in this report.
REFERENCES
The Energy Policy Act of 2005: http://thomas.loc.gov/cgi-bin/bdquery/z?d109:h.r.00006. U.S. Congress (2005).Energy Policy Act of 2005, Pub. L. No. 109-58, 119Stat. 594 (2005). Washington, DC.
The Energy Independence and Security Act of 2007: http://thomas.loc.gov/cgi-bin/bdquery/z?d110:h.r.00006.Energy Independence and Security Act of 2007 (EISA2007), Public Law 110-140 (December 19, 2007) Sec-tion 433 Federal Building Energy Efficiency Perfor-mance Standards.
ASHRAE Standard 90.1 – 2004, Energy Standard for Build-ings Except Low-Rise Residential Buildings, AmericanSociety of Heating Refrigeration and Air ConditioningEngineers, Inc., Atlanta, GA.
ASHRAE (2004a). Energy Standard for Buildings ExceptLow-Rise Residential Buildings. ANSI/ ASHRAE/IESNA Standard 90.1-2004. Atlanta, GA: AmericanSociety of Heating, Refrigerating and Air-ConditioningEngineers.
ASHRAE (2004b). Ventilation for Acceptable Indoor AirQuality. ANSI/ASHRAE Standard 62.1-2004. Atlanta,GA: American Society of Heating, Refrigerating andAir-Conditioning Engineers.
ASHRAE (2008). Advanced Energy Design Guides. Atlanta,GA: American Society of Heating, Refrigerating and
Figure 6 UEPH % savings with comparison to EISA targets.
18 CH-12-008

Air-Conditioning Engineers. www.ashrae.org/publica-tions/page/1604.
Zhivov, A., D. Herron, and M. Deru. 2009. AchievingEnergy Efficiency and Improving Indoor Air Quality inArmy Maintenance Facilities. ASHRAE Transactions.ASHRAE Annual Meeting, Louisville, KY, June 2009.
Herron, D., A. Zhivov, and M. Deru. 2009. Energy DesignGuides for Army Barracks. ASHRAE Transactions.ASHRAE Annual Meeting, Louisville, KY, June 2009.
Deru M., A. Zhivov, D. Herron, D. Fisher and V. Smith.2009. Improving Energy Performance of Army DiningFacilities. ASHRAE Transactions. ASHRAE AnnualMeeting, Louisville, KY, June 2009.
Briggs, R.S., Lucas, R.G., and Taylor, T. (2003). ClimateClassification for Building Energy Codes and Stan-dards: Part 2 - Zone Definitions, Maps and Compari-sons, Technical and Symposium Papers, ASHRAEWinter Meeting, Chicago, IL, January, 2003. Atlanta,
GA: American Society of Heating Refrigerating, andAir-Conditioning Engineers.
DOE (2008). EnergyPlus, Building Energy Simulation Soft-ware web site. Washington, DC: U.S. Department ofEnergy. www.EnergyPlus.gov.
FEMP (2005). Heat Recovery from Wastewater Using aGravity-Film Heat Exchanger. DOE/EE-0247 Revised,Federal Energy Management Program, Washington,D.C.: U.S. Department of Energy.
Army vision for Net Zero. Net Zero is a force multiplier. 15December 2010. Office of the Assistant Secretary of theArmy (Installations, Energy & Environment), Washing-ton, DC.
Army MILCON Energy Efficiency and Sustainability Studyof Five Types of Army Buildings, USACE, ERDC-CERL, NREL, and PNNL, U.S. Army Corps of Engi-neers Summary Report, April 2011.
Table 9. Baseline UEPH (Site Energy)
Wea
ther
Reg
ion
Ele
c H
eati
ng, k
Btu
/ft2
Ele
c C
oolin
g, k
Btu
/ft2
Ele
c In
t. L
ight
s, k
Btu
/ft2
Ele
c In
teri
or E
quip
, kB
tu/f
t2
Ele
c F
ans,
kB
tu/f
t2
Ele
c P
umps
, kB
tu/f
t2
Ele
c H
eat
Rec
over
y, k
Btu
/ft2
Nat
Gas
Hea
ting
, kB
tu/f
t2
Nat
Gas
Hot
Wat
er, k
Btu
/ft2
Tot
al, k
Btu
/ft2
Tot
al E
lect
ric,
kB
tu/f
t2
Tot
al N
at G
as, k
Btu
/ft2
1A_Miami_FL 0 23 11 22 2.2 0.9 0.00 0.1 9 69 60 9
2A_Houston_TX 0 17 11 22 2.2 0.7 0.00 3.2 12 69 54 15
2B_Phoenix_AZ 0 15 11 22 2.4 0.6 0.00 1.3 10 64 52 12
3A_Memphis_TN 0 13 11 22 2.3 0.6 0.00 8.5 14 72 49 23
3B_ElPaso_TX 0 9 11 22 2.2 0.5 0.00 4.2 14 63 46 18
3C_SanFrancisco_CA
0 3 11 22 2.1 0.3 0.00 2.4 17 59 39 19
4A_Baltimore_MD 0 8 11 22 2.2 0.5 0.00 14.9 17 77 45 32
4B_Albuquerque_NM
0 6 11 22 2.4 0.4 0.00 9.5 17 69 43 26
4C_Seattle_WA 0 3 11 22 2.1 0.3 0.00 11.3 18 69 39 30
5A_Chicago_IL 0 7 11 22 2.2 0.4 0.00 22 19 84 43 41
5B_ColoradoSprings_CO
0 4 11 22 2.4 0.4 0.00 15 20 75 41 35
6A_Burlington_VT 0 5 11 22 2.1 0.4 0.00 27 21 88 41 48
6B_Helena_MT 0 3 11 22 2.3 0.3 0.00 23 21 84 40 44
7A_Duluth_MN 0 3 11 22 2.1 0.3 0.00 35 24 98 39 59
8A_Fairbanks_AK 0 2.0 11 22 2.2 0.3 0.00 57 27 122 38 84
CH-12-008 19
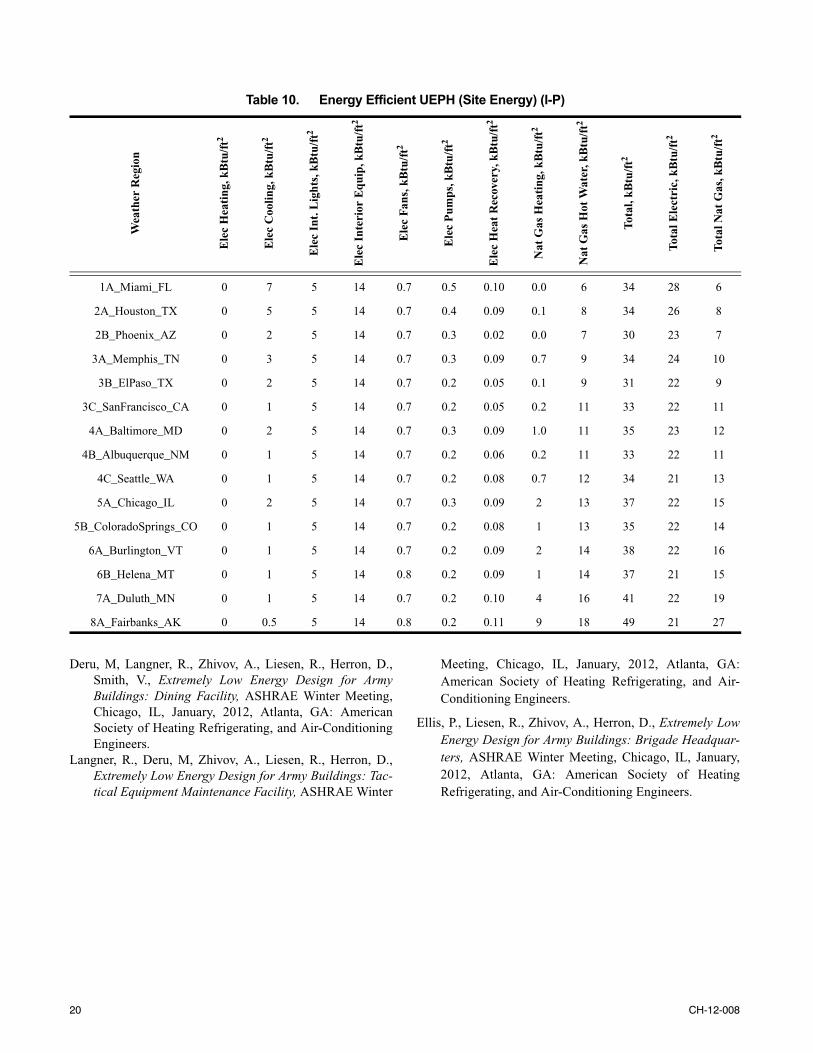
Deru, M, Langner, R., Zhivov, A., Liesen, R., Herron, D.,Smith, V., Extremely Low Energy Design for ArmyBuildings: Dining Facility, ASHRAE Winter Meeting,Chicago, IL, January, 2012, Atlanta, GA: AmericanSociety of Heating Refrigerating, and Air-ConditioningEngineers.
Langner, R., Deru, M, Zhivov, A., Liesen, R., Herron, D.,Extremely Low Energy Design for Army Buildings: Tac-tical Equipment Maintenance Facility, ASHRAE Winter
Meeting, Chicago, IL, January, 2012, Atlanta, GA:American Society of Heating Refrigerating, and Air-Conditioning Engineers.
Ellis, P., Liesen, R., Zhivov, A., Herron, D., Extremely LowEnergy Design for Army Buildings: Brigade Headquar-ters, ASHRAE Winter Meeting, Chicago, IL, January,2012, Atlanta, GA: American Society of HeatingRefrigerating, and Air-Conditioning Engineers.
Table 10. Energy Efficient UEPH (Site Energy) (I-P)
Wea
ther
Reg
ion
Ele
c H
eati
ng, k
Btu
/ft2
Ele
c C
oolin
g, k
Btu
/ft2
Ele
c In
t. L
ight
s, k
Btu
/ft2
Ele
c In
teri
or E
quip
, kB
tu/f
t2
Ele
c F
ans,
kB
tu/f
t2
Ele
c P
umps
, kB
tu/f
t2
Ele
c H
eat
Rec
over
y, k
Btu
/ft2
Nat
Gas
Hea
ting
, kB
tu/f
t2
Nat
Gas
Hot
Wat
er, k
Btu
/ft2
Tot
al, k
Btu
/ft2
Tot
al E
lect
ric,
kB
tu/f
t2
Tot
al N
at G
as, k
Btu
/ft2
1A_Miami_FL 0 7 5 14 0.7 0.5 0.10 0.0 6 34 28 6
2A_Houston_TX 0 5 5 14 0.7 0.4 0.09 0.1 8 34 26 8
2B_Phoenix_AZ 0 2 5 14 0.7 0.3 0.02 0.0 7 30 23 7
3A_Memphis_TN 0 3 5 14 0.7 0.3 0.09 0.7 9 34 24 10
3B_ElPaso_TX 0 2 5 14 0.7 0.2 0.05 0.1 9 31 22 9
3C_SanFrancisco_CA 0 1 5 14 0.7 0.2 0.05 0.2 11 33 22 11
4A_Baltimore_MD 0 2 5 14 0.7 0.3 0.09 1.0 11 35 23 12
4B_Albuquerque_NM 0 1 5 14 0.7 0.2 0.06 0.2 11 33 22 11
4C_Seattle_WA 0 1 5 14 0.7 0.2 0.08 0.7 12 34 21 13
5A_Chicago_IL 0 2 5 14 0.7 0.3 0.09 2 13 37 22 15
5B_ColoradoSprings_CO 0 1 5 14 0.7 0.2 0.08 1 13 35 22 14
6A_Burlington_VT 0 1 5 14 0.7 0.2 0.09 2 14 38 22 16
6B_Helena_MT 0 1 5 14 0.8 0.2 0.09 1 14 37 21 15
7A_Duluth_MN 0 1 5 14 0.7 0.2 0.10 4 16 41 22 19
8A_Fairbanks_AK 0 0.5 5 14 0.8 0.2 0.11 9 18 49 21 27
20 CH-12-008

CH-12-008 21
Table 10. Energy Efficient UEPH (Site Energy) (SI)W
eath
er R
egio
n
Ele
c H
eati
ng, k
Wh/
m2
Ele
c C
oolin
g, k
Wh/
m2
Ele
c In
t. L
ight
s, k
Wh/
m2
Ele
c In
teri
or E
quip
, kW
h/m
2
Ele
c F
ans,
kW
h/m
2
Ele
c P
umps
, kW
h/m
2
Ele
c H
eat
Rec
over
y, k
Wh/
m2
Nat
Gas
Hea
ting
, kW
h/m
2
Nat
Gas
Hot
Wat
er, k
Wh/
m2
Tot
al, k
Wh/
m2
Tot
al E
lect
ric,
kW
h/m
2
Tot
al N
at G
as, k
Wh/
m2
1A_Miami_FL 0 22 17 45 2 2 0.3 0.0 19 107 88 19
2A_Houston_TX 0 16 17 45 2 1 0.3 0.4 25 107 81 26
2B_Phoenix_AZ 0 7 17 45 2 1 0.1 0.1 22 94 72 22
3A_Memphis_TN 0 11 17 45 2 1 0.3 2.1 30 108 76 32
3B_ElPaso_TX 0 5 17 45 2 1 0.1 0.2 28 99 70 29
3C_SanFrancisco_CA 0 3 17 45 2 1 0.1 0.6 35 104 68 36
4A_Baltimore_MD 0 7 17 45 2 1 0.3 3.2 36 111 72 39
4B_Albuquerque_NM 0 4 17 45 2 1 0.2 0.5 35 104 69 35
4C_Seattle_WA 0 2 17 45 2 1 0.3 2.2 38 108 67 40
5A_Chicago_IL 0 6 17 45 2 1 0.3 6.5 40 117 71 46
5B_ColoradoSprings_CO 0 3 17 45 2 1 0.3 2.0 41 111 68 43
6A_Burlington_VT 0 4 17 45 2 1 0.3 7.5 44 120 69 51
6B_Helena_MT 0 2 17 45 2 1 0.3 4.3 44 116 67 48
7A_Duluth_MN 0 3 17 45 2 1 0.3 11.9 49 129 68 61
8A_Fairbanks_AK 0 1 17 45 2 1 0.3 29.9 57 153 67 86
Figure 7 Building cluster fossil fuel reduction optimizationprocess.

22 CH-12-008
Tabl
e 11
. T
heo
retic
al C
HP
Lim
it E
lect
ric
Trac
kin
g (I-
P)
kBtu
/ft2
kBtu
/ft2
kBtu
/ft2
kBtu
/ft2
kBtu
/ft2
kBtu
/ft2
kBtu
/ft2
kBtu
/ft2
kBtu
/ft2
kBtu
/ft2
kBtu
/ft2
kBtu
/ft2
kBtu
/ft2
Wea
ther
Reg
ion
Site 2003 CBECSDormitory/Fraternity/Sorority
Site Energy Budget
Source 2003 CBECSDormitory/Fraternity/Sorority
EISA 2007 Source Target Energy Budget
Ele
ctri
c T
rack
ing
of D
HW
; A
ssum
e Sa
le o
fT
herm
al t
o A
djoi
ning
Bui
ldin
g or
the
The
oret
ical
Lim
it o
f C
HP
;C
onve
rsio
n to
Sou
rce
Usi
ng G
as E
ff. o
f 1.
05
Ass
ume
100%
Sol
ar-T
herm
al fo
r D
HW
;T
heor
etic
al S
olar
The
rmal
Lim
it
Site
P
urch
E
lec
CoG
en
Pur
ch N
at
Gas
Exc
ess
The
rmal
or
Hea
t
Tot
Sit
e E
UI
Tot
So
urce
E
UI
% S
ourc
e E
nerg
y R
educ
tion
Site
Pur
ch
Ele
cSi
te P
urch
N
at G
asT
ot S
ite
EU
IT
ot S
ourc
e E
UI
1A_M
iam
i_FL
6824
208
730
6724
4446
78%
240
2481
2A_H
oust
on_T
X69
2419
468
062
1943
4577
%22
023
75
2B_P
hoen
ix_A
Z67
2319
568
053
1737
3980
%19
019
64
3A_M
emph
is_T
N68
2417
662
057
1543
4574
%21
122
70
3B_E
lPas
o_T
X64
2217
260
052
1438
4077
%19
019
63
3C_S
anFr
anci
sco_
CA
5820
150
520
5111
4042
72%
181
1962
4A_B
altim
ore_
MD
7526
178
620
5411
4446
74%
202
2167
4B_A
lbuq
uerq
ue_N
M66
2316
457
051
1140
4274
%18
019
61
4C_S
eattl
e_W
A68
2415
956
050
842
4472
%18
120
62
5A_C
hica
go_I
L84
2918
565
053
845
4874
%19
322
67
5B_C
olor
adoS
prin
gs_C
O73
2616
759
050
842
4474
%18
119
61
6A_B
urlin
gton
_VT
9734
203
710
525
4648
76%
193
2265
6B_H
elen
a_M
T86
3018
264
050
644
4675
%18
220
62
7A_D
ulut
h_M
N10
537
206
720
512
4951
75%
185
2366
8A_F
airb
anks
_AK
135
4723
783
049
–757
5975
%18
1129
71

CH-12-008 23
Tabl
e 11
. T
heo
retic
al C
HP
Lim
it E
lect
ric
Trac
kin
g (S
I)
kW·h
/m2
kW·h
/m2
kW·h
/m2
kW·h
/m2
kW·h
/m2
kW·h
/m2
kW·h
/m2
kW·h
/m2
kW·h
/m2
kW·h
/m2
kW·h
/m2
kW·h
/m2
kW·h
/m2
Wea
ther
Reg
ion
Site 2003 CBECSDormitory/Fraternity/Sorority
Site Energy Budget
Source 2003 CBECSDormitory/Fraternity/Sorority
EISA 2007 SourceTarget Energy Budget
Ele
ctri
c T
rack
ing
of D
HW
; A
ssum
e Sa
le o
f T
herm
al t
o A
djoi
ning
B
uild
ing
or t
he T
heor
etic
al L
imit
of
CH
P;
Con
vers
ion
to S
ourc
e us
ing
Gas
Eff
. Of
1.05
Ass
ume
100%
Sol
ar-T
herm
al fo
r D
HW
;T
heor
etic
al S
olar
The
rmal
Lim
it
Site
Pur
ch
Ele
c
CoG
en
Pur
ch N
at
Gas
Exc
ess
The
rmal
or
Hea
t
Tot
Sit
e E
UI
Tot
So
urce
E
UI
% S
ourc
e E
nerg
y R
educ
tion
Site
Pur
ch
Ele
cSi
te P
urch
N
at G
asT
ot S
ite
EU
IT
ot S
ourc
e E
UI
1A_M
iam
i_FL
216
7665
522
90
213
7513
814
578
%77
077
256
2A_H
oust
on_T
X21
676
611
214
019
560
136
143
77%
701
7223
6
2B_P
hoen
ix_A
Z21
174
615
215
016
952
117
122
80%
610
6120
3
3A_M
emph
is_T
N21
375
556
195
018
146
135
142
74%
654
6922
2
3B_E
lPas
o_T
X20
170
543
190
016
443
121
127
77%
591
6019
8
3C_S
anFr
anci
sco_
CA
182
6447
216
50
160
3312
613
372
%58
259
194
4A_B
altim
ore_
MD
236
8356
219
70
171
3413
714
474
%62
567
212
4B_A
lbuq
uerq
ue_N
M20
973
516
181
016
034
126
132
74%
581
5919
4
4C_S
eattl
e_W
A21
375
501
175
015
827
131
138
72%
575
6219
5
5A_C
hica
go_I
L26
492
584
205
016
724
143
150
74%
609
7021
1
5B_C
olor
adoS
prin
gs_C
O23
181
528
185
015
825
133
140
74%
573
6019
4
6A_B
urlin
gton
_VT
304
107
639
224
016
317
145
153
76%
5911
6920
7
6B_H
elen
a_M
T27
094
575
201
015
718
139
146
75%
567
6319
6
7A_D
ulut
h_M
N33
111
664
922
70
159
515
416
275
%57
1573
208
8A_F
airb
anks
_AK
425
149
746
261
015
6-2
317
918
875
%56
3591
224


