International Journal of Mechanical Engineering
ISSN : 2277-7059 Volume 2 Issue 8 (August 2012)
http://www.ijmejournal.com/ https://sites.google.com/site/journalijme/
1
A simple mathematical model for evaluating the
effectiveness of solar water heating system with
thermosyphon heat exchanger
A.Srinivas [email protected], S. Venkataiah [email protected]
Associate Professors,Department Of Mechanical Engineering,
Vasavi College Of Engineering, Ibrahimbagh, Hyderabad-31.INDIA.
Abstract: A simple mathematical model for estimating energy transfer in a solar hot water tank
fitted with thermosyphon heat exchanger and operating in a thermosyphon loop is developed.
The model is used for evaluating the effectiveness of the heat exchanger operating under
different mass flow rates. An experimental test facility for the heat exchanger is fabricated in
which an electric geyser is used for hot water supply. Comparison of experimental results with
the theoretical results yielded the effectiveness of the heat exchanger. It is found to vary
between 0.7 to 1.0 for the normal range of flow rates encountered in a thermosphon solar water
heating system.
Keywords: Solar water heating, Heat Exchanger, Effectivenes.
Introduction:
Thermosyphon solar water heating systems are widely used in many countries. The major
factor that comes in the way of good performance of the system is the use of raw or untreated
water having high total hardness, which results in scale formation. To overcome this problem,
a heat exchanger is normally installed in hot water tank of the system. In the thermosyphon
solar water heating system, during a day the collector mass flow rate does not remain constant
due to solar radiation variation. To evaluate the effectiveness of any designed heat exchanger it
is essential ot maintain steady flows inside and outside the heat exchanger. In this paper the
effectiveness o f an existing heat exchanger of 1.5 sqm of surface area suitable for 100 lpd
system is evaluated for varying operating conditions. An experimental testing facility with a
geyser as a source of heat is used for studying the performance of the system consisting of a
hot water tank with heat exchanger. A simple mathematical model for energy transfer in solar
International Journal of Mechanical Engineering
ISSN : 2277-7059 Volume 2 Issue 8 (August 2012)
http://www.ijmejournal.com/ https://sites.google.com/site/journalijme/
2
hot water tank with heat exchanger is developed. Using the model, temperatures at various
sections within hot water tank and heat exchanger were evaluated for constant flow rates.
Comparisons are made between theoretical and experimental results.
Literature: Heat exchangers fitted in the storage water tank are used in domestic solar water
heating systems to transfer energy from collector fluid to the storage tank fluid. Water flow in
the system is driven by the difference in hydrostatic pressure arising due to thermal gradients in
the storage tank and the collector including the connecting pipes. To predict system
performance, the simulation models require empirical heat transfer correlations for the heat
exchanger. Because water flow rates are low and the flow passage is short the flow is likely to
be developing, both thermally and hydro dynamically. Smith, et al [1] tested an unpressurized
drain back system with a load side heat exchanger. They used a coiled tube, which carries the
hot fluid placed inside a vertical cylindrical tank containing cold fluid (load side fluid) to be
heated. They carried out analytical calculations for the heat exchanger effectiveness by
dividing the tank with the heat exchanger into eight equal segments. The heat exchanger
effectiveness was calculated at each data point by the equation
minmax
.
.
max TTp
Cf
m
inT
outT
pC
dm
Q
Q
and average effectiveness was obtained by summing all calculated
effectiveness divided by the total number of data points and was found as 0.78.
The overall thermal resistance of the heat exchanger is comprised of three
terms: Resistance due to the inside convective coefficient due to t he forced
flow. Resistance through copper tubing Resistance due to outside convective
heat transfer coefficient (natural convection). The inside convective coefficient
h i was determined using the Dittus -Boelter relationship
4.0Pr8.0Re023.0Dk
Di
h
iNu for Re = 19,104(the flow was turbulent). The Nu
was found to be 109. Neglecting conductance through the copper tubing the

International Journal of Mechanical Engineering
ISSN : 2277-7059 Volume 2 Issue 8 (August 2012)
http://www.ijmejournal.com/ https://sites.google.com/site/journalijme/
3
overall heat transfer conductance was calculated from
111
DiA
ih
DoA
oh
Ao
U .
Different empirical correlations were used for evaluating h o. They obtained best
agreement with experimental results for the outside heat transfer coefficient for
using correlation of free convection from horizontal tube. Heat transfer correlations
for thermosyphon heat exchanger of tube in shell type are given by few researchers. The
correlations are determined for uniform heat flux on the tube walls. Gruszezynski and
Viskanta[2] and Hallinan and Viskanta [3] presented correlations for the Nusselt number for
the thermosyphon water flows in triangular and rectangular arrays with P/D ratios of 1.25 and
1.33 inside a circular shell. On the tube side constant temperature water was mechanically
pumped through the tubes giving a constant flux boundary condition.
For seven tubes triangular array inside a circular shell
43.08.0 PrRe067.0Nu (Counter flow), 43.0Pr8.0Re081.0Nu (parallel flow) For operating
condition of 80< Re < 500 and Pr ≈ 5.0
For 21 tube rectangular array inside a circular shell
43.0Pr93.0Re026.0Nu (Counter flow), 43.0Pr8.0Re051.0Nu (parallel flow) For
operating condition of 80< Re < 500 and Pr ≈ 5.0
Because the flow rate in this study was not controlled independently from the temperature
difference, the authors did not differentiate between forced convection and natural convection
effects. El-Genk and co workers [4] presented mixed convection heat transfer correlations for
uniform heat flux boundary conditions. Kim and El-Genk[5] studied triangular arrays of seven
tubes with P/D ratio of 1.38 and 1.51 enclosed in a hexagonal shroud. Their correlation was
given as 282.0Re163.0762.2 Ri
MNu for 38.1
DP
,
404.0Re25.095.0 RiM
Nu for
51.1D
P . The parameter typically used to characterize mixed convection in tube bundles is
the Richardson number, 2Re
GrRi . Richardson numbers up to 500 are well within the
typical range of mixed convection flows. These studies covered a wide range of Reynolds
number (80 < Re < 2300) and Raleigh numbers (5X10⁵
< Ra < 7X10⁸) corresponding to
International Journal of Mechanical Engineering
ISSN : 2277-7059 Volume 2 Issue 8 (August 2012)
http://www.ijmejournal.com/ https://sites.google.com/site/journalijme/
4
Richardson numbers up to 500. Dahl and Davidson [6] presented mixed convection heat
transfer and pressure drop correlations under uniform heat flux boundary conditions for three
types tube in shell heat exchangers. The correlations are presented in the form of
nnN
NunF
NuM
Nu
1
, where n = 4, was first proposed by Churchill [7]. This expression
separates the contribution of forced and natural convection to the total heat transfer. The
negative sign corresponds to opposing flow conditions and the positive sign is for aiding the
flow conditions. There is no clear method of comparing mixed convection heat transfer
correlations for tube bundles with different D
P ratio and geometrics.
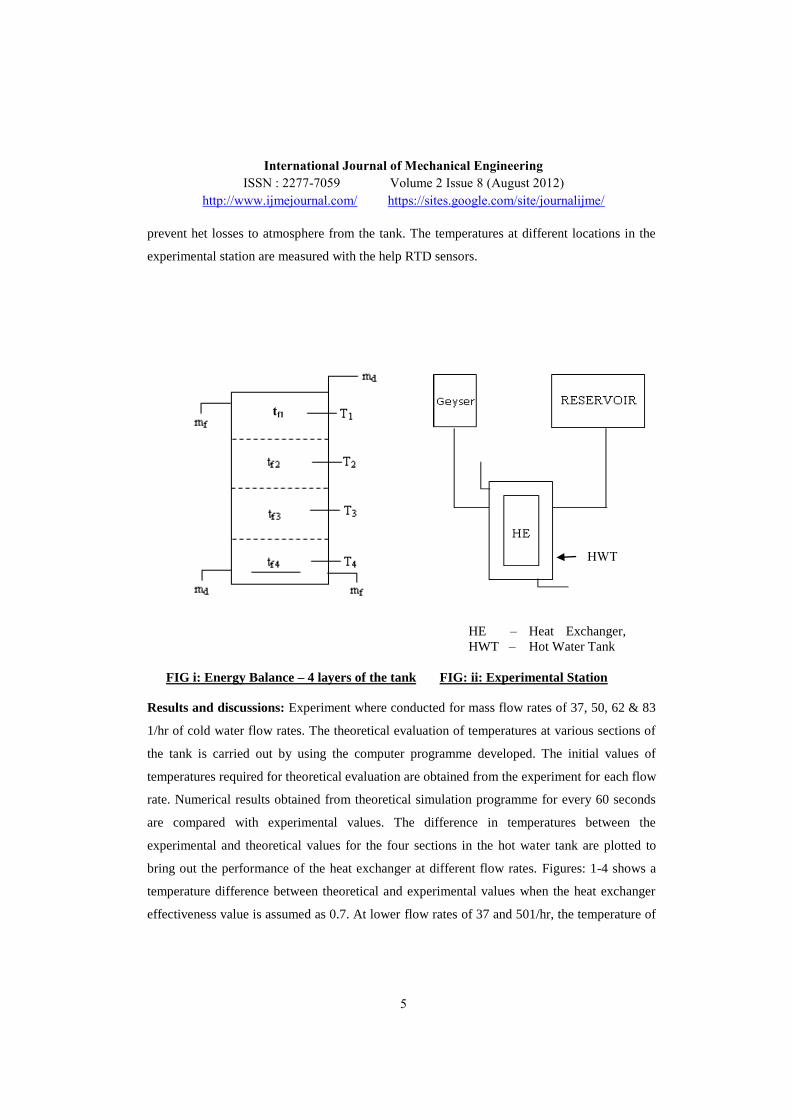
Formulation: Schematic arrangement of the hot water tank consisting of the heat exchange is
shown in Figure: i. Hot water is assumed to be divided into 4 distinct layer of water causing
temperature variation along the vertical height of, each layer. For each layer internal energy
change is equal to the heat loss and water transport loss including the draw off for the utility
from storage tank. During draw off an equal amount of makeup water is assumed to displace
water from the tank. The following equations are formulated for each section of the tank.
[ Cp Vi]w [(T’ i – Ti) / ] = md Cp (Ti+1 – Ti) + mf cp e(tf,i-1 – tf, i) - U Ai (Ti – Ta) _____________ (1)
Where i = 1, 2, 3 & 4. i represent layers of the system. mf = 0 for top layer i = 1 and
T4 = Ti for bottom layer
For fluid flow in heat exchanger the individual energy balance of each section is given by
[ Cp V]f,i [(t’ f,i – t f,i)/ ] = h ai (Ti - t f,i) ___________ _______(2)
Where i = 2, 3, &4, represents the layer in heat exchanger.
Heat exchanger fluid temperature is given by t f,i = [(Ti + T i+1)/2]
The fluid temperatures tf i of water in the heat exchanger are first evaluated from equation 2 and
their values are substituted in equation 1 to get the hot water tank temperatures Ti. The
obtained temperatures are used in subsequent time to get new temperatures.
Experimental station: The experimental station Figure: ii consists of an electric geyser, hot
water tank with the heat exchanger and a reservoir which supplies water to hot water tank is
fabricated. The hot water tank is insulated all round with rock wool to a thickness of 0,05m to
International Journal of Mechanical Engineering
ISSN : 2277-7059 Volume 2 Issue 8 (August 2012)
http://www.ijmejournal.com/ https://sites.google.com/site/journalijme/
5
prevent het losses to atmosphere from the tank. The temperatures at different locations in the
experimental station are measured with the help RTD sensors.
HE – Heat Exchanger,
HWT – Hot Water Tank
FIG i: Energy Balance – 4 layers of the tank FIG: ii: Experimental Station
Results and discussions: Experiment where conducted for mass flow rates of 37, 50, 62 & 83
1/hr of cold water flow rates. The theoretical evaluation of temperatures at various sections of
the tank is carried out by using the computer programme developed. The initial values of
temperatures required for theoretical evaluation are obtained from the experiment for each flow
rate. Numerical results obtained from theoretical simulation programme for every 60 seconds
are compared with experimental values. The difference in temperatures between the
experimental and theoretical values for the four sections in the hot water tank are plotted to
bring out the performance of the heat exchanger at different flow rates. Figures: 1-4 shows a
temperature difference between theoretical and experimental values when the heat exchanger
effectiveness value is assumed as 0.7. At lower flow rates of 37 and 501/hr, the temperature of
HWT
tf1
International Journal of Mechanical Engineering
ISSN : 2277-7059 Volume 2 Issue 8 (August 2012)
http://www.ijmejournal.com/ https://sites.google.com/site/journalijme/
6
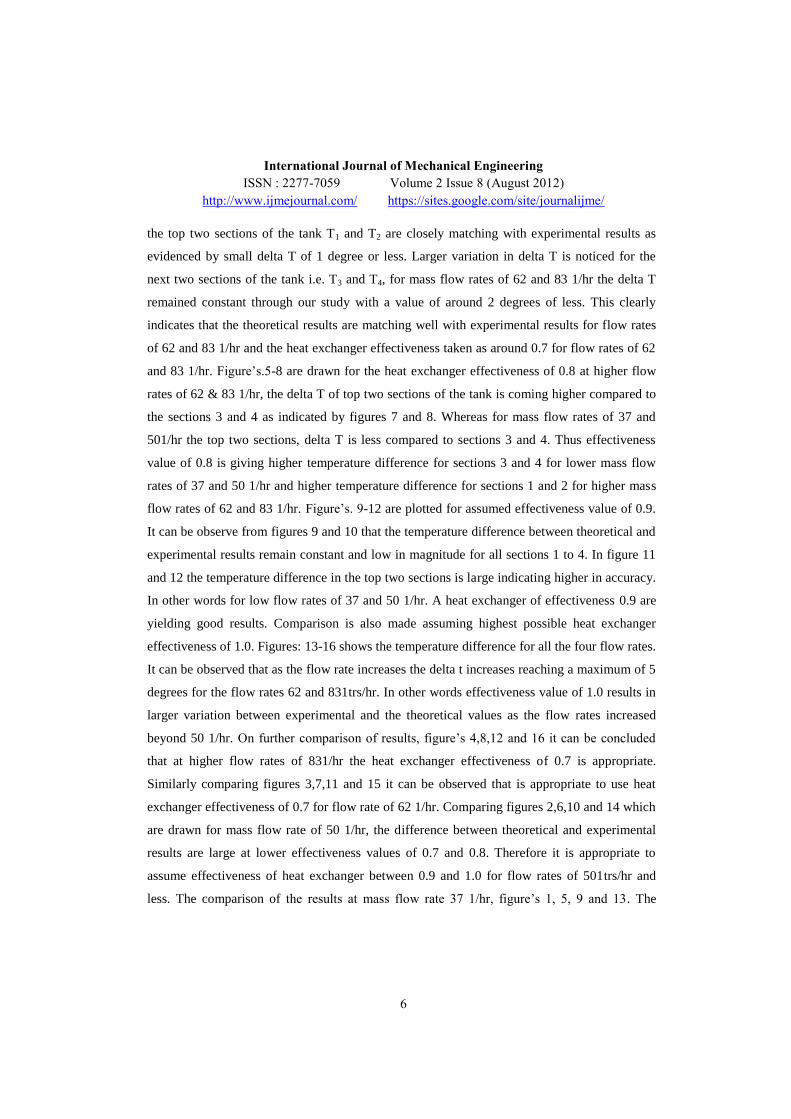
the top two sections of the tank T1 and T2 are closely matching with experimental results as
evidenced by small delta T of 1 degree or less. Larger variation in delta T is noticed for the
next two sections of the tank i.e. T3 and T4, for mass flow rates of 62 and 83 1/hr the delta T
remained constant through our study with a value of around 2 degrees of less. This clearly
indicates that the theoretical results are matching well with experimental results for flow rates
of 62 and 83 1/hr and the heat exchanger effectiveness taken as around 0.7 for flow rates of 62
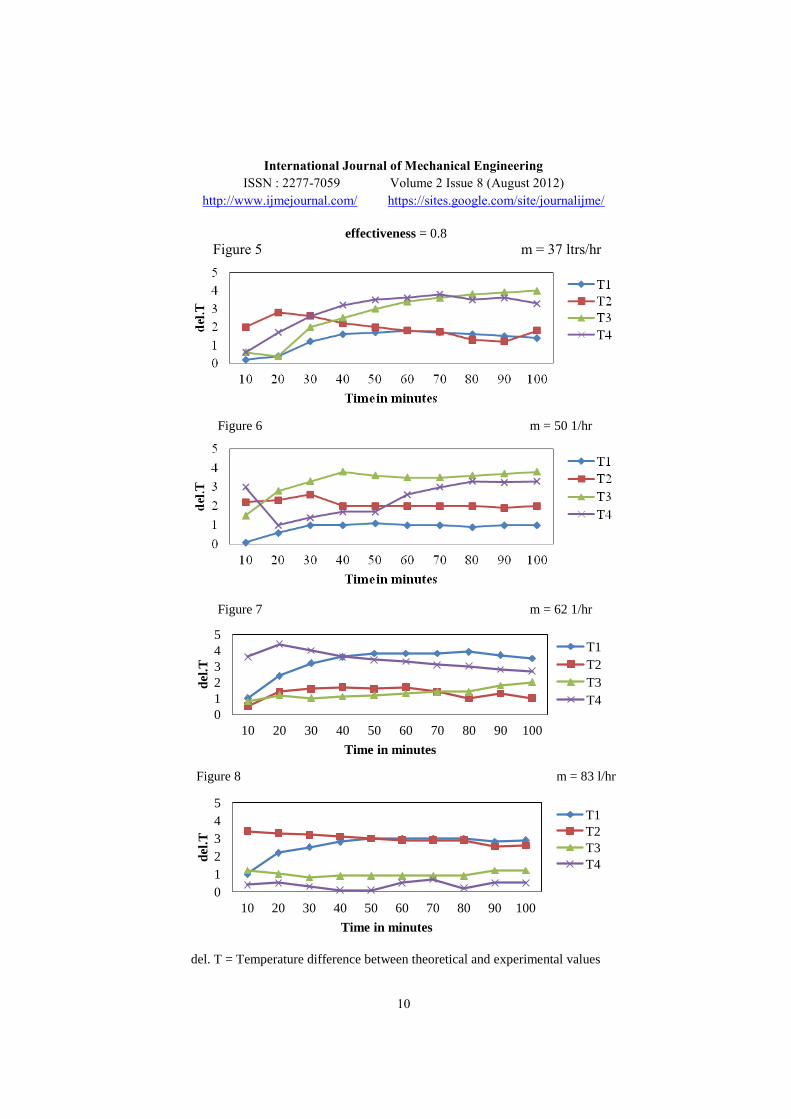
and 83 1/hr. Figure’s.5-8 are drawn for the heat exchanger effectiveness of 0.8 at higher flow
rates of 62 & 83 1/hr, the delta T of top two sections of the tank is coming higher compared to
the sections 3 and 4 as indicated by figures 7 and 8. Whereas for mass flow rates of 37 and
501/hr the top two sections, delta T is less compared to sections 3 and 4. Thus effectiveness
value of 0.8 is giving higher temperature difference for sections 3 and 4 for lower mass flow
rates of 37 and 50 1/hr and higher temperature difference for sections 1 and 2 for higher mass
flow rates of 62 and 83 1/hr. Figure’s. 9-12 are plotted for assumed effectiveness value of 0.9.
It can be observe from figures 9 and 10 that the temperature difference between theoretical and
experimental results remain constant and low in magnitude for all sections 1 to 4. In figure 11
and 12 the temperature difference in the top two sections is large indicating higher in accuracy.
In other words for low flow rates of 37 and 50 1/hr. A heat exchanger of effectiveness 0.9 are
yielding good results. Comparison is also made assuming highest possible heat exchanger
effectiveness of 1.0. Figures: 13-16 shows the temperature difference for all the four flow rates.
It can be observed that as the flow rate increases the delta t increases reaching a maximum of 5
degrees for the flow rates 62 and 831trs/hr. In other words effectiveness value of 1.0 results in
larger variation between experimental and the theoretical values as the flow rates increased
beyond 50 1/hr. On further comparison of results, figure’s 4,8,12 and 16 it can be concluded
that at higher flow rates of 831/hr the heat exchanger effectiveness of 0.7 is appropriate.
Similarly comparing figures 3,7,11 and 15 it can be observed that is appropriate to use heat
exchanger effectiveness of 0.7 for flow rate of 62 1/hr. Comparing figures 2,6,10 and 14 which
are drawn for mass flow rate of 50 1/hr, the difference between theoretical and experimental
results are large at lower effectiveness values of 0.7 and 0.8. Therefore it is appropriate to
assume effectiveness of heat exchanger between 0.9 and 1.0 for flow rates of 501trs/hr and
less. The comparison of the results at mass flow rate 37 1/hr, figure’s 1, 5, 9 and 13. The
International Journal of Mechanical Engineering
ISSN : 2277-7059 Volume 2 Issue 8 (August 2012)
http://www.ijmejournal.com/ https://sites.google.com/site/journalijme/
7
temperature difference between theoretical and experimental values is higher with
effectiveness value of 0.7 and 0.8. That is 37 1/hr mass flow rate it is appropriate to use
effectiveness values of 0.9 to 1.0.
Conclusions: A simple mathematical model for the energy transfer in a solar hot water tank
fitted with a heat exchanger is developed. The model is able to estimate precisely the energy
transfer with in the tank under varying mass flow rates of collector fluid and service water. The
model is also used for evaluating the effectiveness of a given heat exchanger. Using the
experimental setup fabricated the heat exchanger effectiveness is evaluated at difference mass
flow rates. The results indicate that at higher flow rates of 62 and 831/hr, the heat exchanger
effectiveness is found to be around 0.7 and at low flow rates the value lie around 0.9 reaching
unity for very low flow rates of 32 1/hr.
Nomenclature: A : Surface area of the tank, m2
a : Surface area of the heat exchanger, m2
Cp : Specific heat exchanger.
h : Heat transfer coefficient, W/m2 K
mf : Mass flow rate of hot fluid, Kg/s
md : Mass flow rate of cold fluid, Kg/s
T : Temperature of the fluid in the tank, º C
Ta : Ambient temperature, º C
TI : Inlet temperature of cold fluid, º C
TI : Initial temperature, º C
t :Temperature of fluid in the heat
exchanger, ºC.
U : Overall heat transfer coefficient, W/m2K.
V : Volume, m3
: Density, kg/m3.
: Time interval, s.
Suffixes: i = 1, 2, 3&4 represents sections with
respect to tank.
f,i = 2,3&4 represents sections with respect
to heat exchanger.
w = Tank with fluid
References:
1. Smith.T.R, Burns.P.J and Hittle D.C., “Analysis of a load-side heat exchanger for a solar
domestic hot water heating system”. Transactions of the ASME, Vol.120, pp.270-274 (1998).
2. Gruszezynski. M.J. and Viskanta.R. “Heat Transfer from a vertical tube bundle under natural
circulation condition”, Proceedings, ASME/JSME Thermal engineering joint conference,
Vol.3, pp. 403-410 (1983).
3. Hallinan.K.P. and Viskanta,R “Heat transfer from a vertical tube bundle under natural
circulation conditions” International journal of heat & fluid flow, vol. 6, pp. 256-264 (1985).
4. El.- Genk M.S, Su.B and Guo,Z., “Experimental studies of forced. Combined and natural
convection of water in vertical nine rod bundles with square lattice”, International journal of
heat and mass transfer, Vol. 36, No.9, pp. 2359-2374 (1993).
5. Kim. S.H. and El-Genk.M.S., “Heat transfer experiments for low flow of water in rod
bundles”, International journal of heat and mass transfer, Vol. 32, No.7, pp1321-1336 (1989).
6. Dahl S.D. and Davidson J.H., “ Mixed convection heat transfer and pressure drop correlations
for tube-in-shell thermosyphon heat exchangers with uniform heat flux”, Journal of Solar
Energy Engineering, Vol. 120, pp.260-269 (1998).

International Journal of Mechanical Engineering
ISSN : 2277-7059 Volume 2 Issue 8 (August 2012)
http://www.ijmejournal.com/ https://sites.google.com/site/journalijme/
8
7. Churchill,S.W. “Comprehence correlating equation for laminar, assisting, forced and free
convection”, AIChE, Vol.23, No.1, pp.10-16, 1977.

International Journal of Mechanical Engineering
ISSN : 2277-7059 Volume 2 Issue 8 (August 2012)
http://www.ijmejournal.com/ https://sites.google.com/site/journalijme/
9
effectiveness = 0.7
Figure 1 m = 37 1/hr
Figure 2 m = 50 1/hr
Figure 3 m = 62 1/hr
Figure 4 m = 83 1/hr
del. T = Temperature difference between theoretical and experimental values
International Journal of Mechanical Engineering
ISSN : 2277-7059 Volume 2 Issue 8 (August 2012)
http://www.ijmejournal.com/ https://sites.google.com/site/journalijme/
10
effectiveness = 0.8
Figure 5 m = 37 ltrs/hr
Figure 6 m = 50 1/hr
Figure 7 m = 62 1/hr
0
1
2
3
4
5
10 20 30 40 50 60 70 80 90 100
del
.T
Time in minutes
T1
T2
T3
T4
Figure 8 m = 83 l/hr
0
1
2
3
4
5
10 20 30 40 50 60 70 80 90 100
del
.T
Time in minutes
T1
T2
T3
T4
del. T = Temperature difference between theoretical and experimental values

International Journal of Mechanical Engineering
ISSN : 2277-7059 Volume 2 Issue 8 (August 2012)
http://www.ijmejournal.com/ https://sites.google.com/site/journalijme/
11
effectiveness = 0.9
Figure 9 m = 37 1/hr
Figure 10 m = 50 1/hr
0
1
2
3
4
5
10 20 30 40 50 60 70 80 90 100
del
.T
Time in minutes
T1
T2
T3
T4
Figure 11 m = 62 1/hr
0
1
2
3
4
5
10 20 30 40 50 60 70 80 90 100
del
.T
Time in minutes
T1
T2
T3
T4
Figure 12 m = 83 1/hr
0
1
2
3
4
5
10 20 30 40 50 60 70 80 90 100
del.
T
Time in minutes
T1
T2
T3
T4
del. T = Temperature difference between theoretical and experimental values

International Journal of Mechanical Engineering
ISSN : 2277-7059 Volume 2 Issue 8 (August 2012)
http://www.ijmejournal.com/ https://sites.google.com/site/journalijme/
12
effectiveness = 1.0
Figure 13 m = 37 1/hr
0
1
2
3
4
5
10 20 30 40 50 60 70 80 90 100
del
.T
Time in minutes
T1
T2
T3
T4
Figure 14 m = 50 1/hr
Figure 15 m = 62 1/hr
0
1
2
3
4
5
10 20 30 40 50 60 70 80 90 100
del
.T
Time in minutes
T1
T2
T3
T4
Figure 16 m = 83 1/hr
01del. T = Temperature difference between theoretical and experimental values


