
bbbbbbbbbb
© Rocket Science UK Ltd 2015
Dundee City Council for Dundee Partnership
A Step Change in Improvement of Employability Outcomes in Dundee Project
Final Report February 2016
Richard Scothorne Director Rocket Science UK Ltd 2 Melville Street Edinburgh EH3 7NS 07774 141 610 [email protected]
Rocket Science and the galaxy logo are registered trademarks of
Rocket Science UK Ltd.
Final Report – Improving employability outcomes 5 February 16
5 February 16

Final Report – Improving employability outcomes Page 2
Rocket Science 2015
Contents
Executive Summary ............................................................................................................................................................... 3
1 Context and background ............................................................................................................................................... 8
2 The socio-economic context .................................................................................................................................... 15
3 Reframing the ‘Dundee Pipeline’ .......................................................................................................................... 22
4 What works?....................................................................................................................................................................... 25
5 The preventative approach ...................................................................................................................................... 26
6 Developing a ‘whole service’ approach ............................................................................................................ 34
7 Practical action required ............................................................................................................................................ 56
8 Towards a world class service ................................................................................................................................ 69
9 Conclusions and recommendations .................................................................................................................... 73
Appendix 1: Socio economic and employment analysis ........................................................................... 78
Appendix 2: Performance of the DCC/ESF pipeline in Dundee .......................................................... 111
Appendix 3: The cost of unemployment in Dundee .................................................................................. 128
Appendix 4: Interviews carried out ...................................................................................................................... 129
Appendix 5: Output from Dundee Partnership Forum ............................................................................. 131

Final Report – Improving employability outcomes Page 3
Rocket Science 2015
Executive Summary
Rocket Science were appointed to identify ways of enhancing the outcomes from employability
support in Dundee. In this Final Report we describe:
The policy and socio-economic context for the development of an enhanced employability
approach in Dundee
How outcomes can be improved by:
o Reframing of the ‘Dundee Pipeline’
o Putting in place a coherent ‘whole service’ approach to employability
o Taking practical action in key areas across this service
The main areas for action by the Dundee Partnership agencies.
There are seven main features of a new approach to employability in Dundee which will lead to
improved outcomes:
Creating a coherent design for a city wide ‘Dundee Employability Service’ which incorporates the
services of all organisations and providers and assesses performance on both the outcomes
achieved and the experience of both the employer and the individual client. This will provide the
partners with a way of pinpointing the interventions needed to improve performance. The
premise behind this service design is that all the partners in Dundee need to work closely
together to create a coherent and progressive service which understands and responds to the
needs of each individual client and to the needs of employers. One of the ways of helping
partners assess the coherence and performance of this all-organisation service will be to collect
and analyse regular feedback from both employers and individual clients.
We have placed a detailed understanding of the labour market at the heart of this new design. This
will draw on both current data and a wide range of existing engagements with employers. There
will be a shared interpretation of this information and an understanding of the main areas of
demand will infuse every part of the service and so contribute to better decision making by school
pupils and those seeking work, an improved match between training and employer needs, and a
better match of recruits with vacancies.
Reframing the current ‘Dundee Pipeline’ from being mainly a way of contracting and monitoring a
part of employability resources in Dundee (DCC/ESF funding) to being a framework for all
employability resources. This will provide the Local Employability Partnership (Employability
Group) with a practical way of understanding:
o The current array of services and resources, how well they complement each other and
where the gaps and overlaps are
o Where each provider and their services fits in and who they need to relate to perform
effectively
o What the current resource distribution is like and how this may need to change

Final Report – Improving employability outcomes Page 4
Rocket Science 2015
o Where the strong and weak points are in terms of performance and what needs to change
to improve performance.
Focusing the Employability Group on the active management of the performance of the whole
service. All the main agencies and providers will report on their performance to this group in an
open and transparent way, highlighting areas of good and weaker performance. The partners will
work together to identify actions to respond to areas of weaker performance, responsibility for
action and how they will assess whether the response has produced the required improvement.
Ensuring that the actions of each partner on service design, delivery and commissioning are carried out collaboratively to ensure that individual services make up a comprehensive and coherent
whole.
Creating a shared Dundee wide approach to the development of a wide range of work experience and job placements which provide either destinations or stepping stones to permanent jobs for
those seeking work.
Using a preventative approach to service design, targeting and delivery by identifying and prioritising those at risk of long term unemployment.
Dundee is not starting from scratch – we have identified a wide range of good practice and some of
the actions we recommend are about learning from these and scaling them up or transferring them
elsewhere.
Within the proposed service we have identified the following areas for action and we describe these
in this report. These actions can be summarised as follows:
Improving the understanding of the current and emerging labour market and infusing all parts
of the employability service with this shared source of reliable insight and intelligence. This
will combine existing data sources with a wide range of insights drawn from those working
with employers across Dundee, mainly through an annual workshop of all relevant staff. This
should lead to:
o Improved decision making by pupils
o Improved match between advice/training and the market
o Improved match between recruits and employer needs
o Employers more confident of finding the right staff – more jobs?
o Greater likelihood of sustainability in work
Creating a ‘whole service’ focus in terms of performance management. The Employability
Group will be supported in its performance management role by regular independent
telephone surveys of employers and individual clients to gain feedback on their experience of
the service.
For employers this will explore:
o The quality and responsiveness of service
o The quality and match of recruits
Final Report – Improving employability outcomes Page 5
Rocket Science 2015
o Any scope for improvement.
For individual clients this will explore:
o The quality and responsiveness of service – did it understand and respond to your
specific situation and needs?
o The extent to which a clear pathway for progress was developed and agreed?
o The extent to which clients felt in charge of their progress?
o The extent to which they have had the support they needed along the way?
o Have they gained a job and to what extent does it match their skills and aspirations?
Recognise the significance of micro businesses (employing less than 10) by:
o Increasing the investment in HR support for micro-businesses to help them realise job
creation potential and growth
o Piloting a micro-business academy with FSB/members to help clients gain the
distinctive skills and behaviours that will help them thrive in a micro-business and
contribute effectively:
Reliability
Team-work
Appreciation of demands on business leader
Flexibility and responsiveness
Range of skills.
o Working with the FSB to help micro business owners further strengthen their
management skills with the aim of enhancing business performance.
o Exploring ways of helping micro businesses to engage with schools to promote the
value of enterprise and the appeal of working in a smaller business – and the skills
required to thrive in this employment.
Strengthening the match between recruits and employer demand by
o Building on academy approach and good practice in Dundee:
Coordinating academy approaches
Creating a strong ‘Dundee approach’ to academy design, delivery and
performance through co-design with employers and the regular review and
adoption of learning to ensure a best practice model.
o Pioneering an independent ‘graduate school’ which takes all work ready clients and
tests for ‘job readiness’ to refine the match between recruits and the needs of
employers:
Those graduating can be confidently recommended to employers
Those not graduating will receive detailed, supportive feedback and
personalised development.
Final Report – Improving employability outcomes Page 6
Rocket Science 2015
Supporting progress in work by the creation of a career advancement service and by working
with businesses in key sectors to improved productivity and skills, so providing opportunities
for progression to more secure and higher paying jobs.
Ensuring a strongly targeted approach – at those individuals most vulnerable to long term
unemployment and those areas which have the highest unemployment – by clear and agreed
targeting of support:
o Improving the coordination of Stage 1/2 services in areas of highest unemployment
o Building on current joint asset-based training to create a shared team approach
across local services
o Targeting clients based on risk assessment – those particularly vulnerable to long
term unemployment or at risk of losing their job.
Ensuring the availability and quality of front line support by
o Developing a partnership approach to front line staff training as a long term
investment
o Exploring the scope to build on current volunteering approaches.
Enhancing service quality and relevance through designing approaches with clients. This will
ensure that the client voice is significant in the design and delivery of services:
o It will build on – and form an integral part of – the asset-based approach
o It will apply to the service as a whole, individual services within it and engagement
with each client
o It will be built into joint staff development.
Encourage more effective approaches to design and delivery by creating an innovation fund,
with an open brief – attracting bids for ‘something worth trying’ that builds on evidence and
may deliver more sustainable, better (higher paid, more skilled), quicker outcomes.
Using a preventative approach to service design and delivery as part of the strongly targeted
approach above by: o Enhancing work to identify and support young people at risk of unemployment o Identifying early those who are unemployed and at risk of becoming long term
unemployed o Identifying those who find work who are at risk of not sustaining their progress in
work and becoming unemployed again.
The approach has important practical implications for both the Community Planning Partnership
and Dundee City Council:
Each of the CPP partners needs to commit to making the changes required – and ensuring that
their staff are clear about this priority and that playing a full role in the transformation will be
a key expectation of staff.

Final Report – Improving employability outcomes Page 7
Rocket Science 2015
Dundee City Council has a number of key services, an important ‘employability footprint’ and
an important leadership role. What this means is that the Council needs to:
o Fulfil its strategic leadership role
o Maximise its own impact on employability through its role as an employer,
commissioner and provider of key services
o Play an important role as a contributor to the creation of an infrastructure for
service delivery that can encourage and support the integration of services around
the needs of individuals, families and neighbourhoods.
This Report provides the background research and strategic context for the work of 7 Working Groups
which will be developing jointly agreed action plans which cover the areas for action identified above.

Final Report – Improving employability outcomes Page 8
Rocket Science 2015
1 Context and background
In this section we summarise the policy context for a new approach to employability in
Dundee.
The policy and programme context
The approach taken by the partners in Dundee needs to take account of the changing policy and
programme context. The main features of this are:
Welfare reform, which involves a range of changes to welfare status, eligibility and funding,
together with the introduction of Universal Credit.
The devolution to the Scottish Government of DWP’s programmes for long term unemployed
people and those with disabilities and the Scottish Government’s proposed ‘Scottish
Approach’ in terms of developing a successor programme.
The response by the Department for Work and Pensions (DWP) to the need to find significant funding reductions as a consequent of the Comprehensive Spending Review in November
2015.
Related to this, the financial constraints on the other public partners, including the City
Council.
The implementation of the recommendations of the Wood Commission following the
publication of Developing the Young Workforce, the Scottish Government’s response to the
Wood Commission’s Report.
Welfare reform
For many on benefits there has been a reduction in income - and for many of these the
reductions will get larger. For those who are unemployed, the largest reductions in income
focus on those with disabilities or with large families. But for many others affected by smaller
reductions the aggregate effect may create a much wider problem of indebtedness and it is
this broader impact that will have the greatest effect on the city. For those in work the
reductions in working tax credits together with the increase in the proportion of low paid and
zero hours contracts mean that gaining work may no longer provide a route out of poverty, so
progression in work to higher paid jobs (and/or more hours) is becoming increasingly
important.
Universal Credit combines a number of benefits into one payment that will vary by income
for those who are in employment – as advised by employers. It reduces the marginal tax rates
that apply as income increases and is therefore aimed at helping to smooth the path to work.
In other words it should increase the likelihood that increasing work income will more than
replace reducing benefit income. In addition the whole payment (eg including housing
benefit) is made to a nominated member of a household so there is a greater requirement for
effective budgeting by households – the aim being to help households develop the practices
they will need to have in place when they are being paid in employment.
Final Report – Improving employability outcomes Page 9
Rocket Science 2015
Universal Credit in Dundee is being applied currently to the simplest cases and is using a parallel
software system to that which will manage Universal Credit for all in due course. Although the UK
Government has re-committed to the introduction of Universal Credit there remain some doubts
about whether it will be possible to introduce the complex software required to deal with more
typical households and its live information requirements.
There are a number of practical implications of these changes that need to be considered:
Many of those on benefits (in and out of work) are facing reductions in income. This is likely to
lead to increased demands on support services and may be related to a need either to get a
job or, for those in work, to increase hours or make progress to better paid jobs. For others it
could be about money management and debt advice. There is a clear risk that the reductions
will lead to increased household stresses if it does not prove possible to reduce costs (eg by
moving to a smaller home) or increase income (eg by gaining a job or working more hours).
The DWP stresses the significance of the array of welfare reforms in encouraging new forms
of behaviour. However, the opportunity for the changes to become reflected in ‘behaviour
change’ may be challenged by the both the skill levels of claimants and the quantity and range
of jobs on the market.
Devolution of Work Programme and Work Choice
The Scottish Government recently completed a consultation on the best way of responding to the
opportunity of designing and procuring a devolved successor to DWP programmes for long term
unemployed people (Work Programme) and those with disabilities (Work Choice). The consultation
document made clear that the Scottish Government sees this next step of devolution as an
opportunity to explore how a successor programme can fit into and complement wider employability
support which it calls the ‘Scottish Approach’.
Work Programme is important because it is the main source of support for long term unemployed
people. This client group was traditionally the main focus for action by local authorities and their
partners, and the introduction of what has become in practice a separate and distinct service has left
partnerships struggling in terms of an appropriate focus, given that most shorter term unemployed
people find work with relatively little support.
The successor programme to the Work Programme in England and Wales – the Work and Health
Programme – has now been announced and it now seems likely that it will be in place in
September/October 2017. It has a focus on those clients who are most distant from work and/or
face health barriers to employment. This much tighter focus is likely to be reflected in the design of
the devolved successor programme in Scotland as part of the wider proposed ‘Scottish Approach’ –
not least because the funding is significantly lower than for the combined funding for Work
Programme and Work Choice.
Final Report – Improving employability outcomes Page 10
Rocket Science 2015
The ‘Scottish Approach’ to the successor programme is likely to involve a greater integration of this
national service into local partnership action. This does not mean that it will be locally procured –
procurement is likely to be at a regional basis in Scotland – but the approach in Dundee needs to be
able to incorporate the successor programme as part of a wider collaborative service with the aim of
enhancing performance – particularly for those furthest from work.
The Scottish Government see a more coherent and distinctive ‘Scottish Approach’ as having six
features:
A focus on those furthest from work
An emphasis on the quality of jobs (eg a bonus for placement in Fair Work may be a
possibility) and on progression in work (eg to Fair Work or higher qualifications and
responsibility/pay)
A shift to prevention
A shared monitoring system – able to review and share performance, lessons and
outcomes/cost
Strengthened links between economic development, employability and skills
A sustained shift in school/employment connections as part of a much greater exposure of
pupils to the ‘world of work’.
Reductions in DWP budgets
The DWP was among the ‘unprotected’ Departments that were required to identify significant cuts
in spending as part of the November 2016 Comprehensive Spending Review (CSR). The outcome
was a cut in their administration budget of 14% - with an explicit mention of the savings that could be
achieved by co-locating their Jobcentres with partners’ services. However much more substantial
cuts are proposed to the combined Work Programme and Work Choice budget, and the proposed
Scottish approach is currently being re-thought in the light of the much greater than expected cuts.
To respond to the required spending cuts DWP has been carrying out a fundamental review of how
their spend aligns with that of others and they are developing a strong focus on joint working with
others who engage with those who are unemployed. There is a particular focus for this around the
joining up of support for unemployed people with disabilities and the health at work agenda
(supported in Scotland by NHS Health Scotland through Healthy Working Lives). This has now been
reflected in the CSR announcement that the joint DWP/Department for Health Work and Health
Unit will receive £115 million of funding, including at least £40 million for a Health and Work
Innovation Fund, to pilot new ways to join up across the health and employment systems. It is not
clear to what extent this spend will be reflected in a Scottish budget.

Final Report – Improving employability outcomes Page 11
Rocket Science 2015
The purpose of this work is both to tackle the ‘gap’ between work placements for people with
disabilities and that for other clients (the former have a placement rate which is half that for other
clients), and reducing the drop out from jobs of those who face health issues – in terms of both
physical and mental health.
This creates an opportunity for new kinds of ways for JCP to work with partner organisations.
Although this also means that there is a strengthening focus on reducing benefit payments (rather
than necessarily finding people work) this creates some opportunities for some radical cost benefit
based approaches to how JCP staff carry out their work (eg could they become part of the ‘asset
based’ approach?), how they can intervene earlier with those at risk of long term unemployment, and
how they can contribute to approaches that reduce in work tax credits by supporting progression in
work.
These budget cuts will drive accommodation savings on the JCP estate and will create an
opportunity in Dundee for collocating Jobcentre Plus alongside a range of related services.
Practical implications for the successor programme
The Scottish Government is currently working through the way in which it will design and deliver a
devolved successor programme as part of a wider ‘Scottish Approach’. In the meantime it is worth
noting the practical implications of the successor programme – the Work and Health Programme –
that has been announced for England and Wales as these will be reflected in any likely approach put
together by the Scottish Government.
The most important implication is that the Work and Health Programme (WHP) – and the successor programme in Scotland - will be very different from Work Programme and it is important to approach it as a new kind of programme. The client group for WHP is exactly the group which has been failed
by Work Programme – in other words those furthest from work who have in many cases been
‘parked’ because even the significant difference in potential financial reward has not incentivised the
provision of support.
So the task will be very different. There will be much more emphasis on assessment and the
management of a client’s route and progression through a range of services – and on coordinating
services around the needs of individual clients and their households. So staff skills and administrative
systems will need to be very different. And because many clients will have disabilities there will be a
need to help employers meet clients half way in terms of adaptations of approach and work places
and the provision of appropriate support in work.
Finally, the programme will only succeed if there is a different kind of relationship between local
mainstream providers and WHP/successor programme contractors. There have been real issues
around this in terms of Work Programme across the UK, including Scotland – with most Local
Authorities refusing to collaborate locally and many local and national services unable to provide
support as they have seen this as unpaid while enhancing WP performance and so Prime Contractor
income. It will be important for WHP/successor programme to develop a new kind of local persona
particularly where the Prime Contractor is a private sector organisation. This is likely to involve both
a different kind of financial model (which includes the explicit sharing of income) and an integrated
model of partnership behaviour around the needs of individual clients.

Final Report – Improving employability outcomes Page 12
Rocket Science 2015
So the most significant features of the new service are likely to be the following:
There will be a much greater need for the service to be integrated locally with mainstream and specialist services. Recent work on City Deals – and bids from some areas for the devolution
of aspects of Work Programme – has recognised that the main way in which Work
Programme performance for those furthest from work could be improved is by embedding
the service in a genuinely integrated array of local services. This will have a number of
important practical implications:
o The need to develop agreed approaches to the assessment of client needs and associated
design of personalised routes to work that can be shared between a number of providers
o The need to ensure the effective ‘account management’ of clients through a progressive
route to (and through) work which will involve a number of providers – including
mainstream services, specialist services, and sub-contracted services
o The need to help clients get to the point where they are able to make a contribution in the workplace from the time of their recruitment – and compete with more experienced
people who are looking for work or for a change of role.
A greater emphasis on developing working relationships with a wide range of employers and
providing post recruitment support to both clients and employers to ensure both that
appropriate adaptations can be made in the workplace and that new recruits become
embedded in the world of work and are helped to make progress towards more secure and
better paid roles.
There will need to be a financial model which allows non-contracted partners to gain reward from providing support which enhances WHP/successor programme outcomes and therefore
income – or, possibly in Scotland, new forms of contractor models which use private/public
consortia approaches to share rewards.
This has significant implications for potential providers of WHP/successor programme in terms of the
required approach:
The choice of partners/sub-contractors will need to take into account the very different
requirements of the WHP client group. The fact that an organisation has been part of a WP
supply chain will be no guarantee that they will be able to perform with this client group (as
WP performance has been weak overall for those most distant from work). Partners/sub-
contractors will need to be able to display a track record in terms of:
o Building successful relationships with mainstream providers
o Working with those most distant from work and their specialist requirements
o Getting those most distant from work to a position where they can compete for jobs
on the open market.
Final Report – Improving employability outcomes Page 13
Rocket Science 2015
There will be a need for prior work with key local partners – in terms of financial modelling,
the development of assessment models, referral protocols and progress management
approaches. The key to this will be a clear commitment to effective partnership working for
the benefit of clients – and working through the practical implications of this in terms of the
financial model. The implication of this is that those areas which have an integrated model on
the ground – or working towards one – will be in a position to make explicit ‘asks’ of potential
contractors, so ensuring that they will bring added value with their contract.
The financial model will need to ensure that contributing services gain a share of the
increased income that flows from enhanced performance. Without this there is a real risk that
vital local partners will see any expression by contractors of commitment to partnership
working as window dressing – in other words, it will need to be expressed in the sharing of
financial returns. This in turn will have implications for the commercial viability of the model.
The delivery model will need to be built around the basic components of assessment, route
design, management of progress, pre-placement preparation, placement and support in work.
There are significant implications for the required quality of front line staff. The demands on
staff will be of a different order from the requirements of Work Programme. They will need to
be skilled and confident in partnership working approaches and in the effective management
of client progress through an array of services – some mainstream, some local specialist
services and some sub-contracted. This is likely to be reflected in staff wages – again with
implications for the financial model and commercial viability.
Finally, there will be a need to take account of any existing or pending City Deal arrangements
– which may have implications for different aspects of the programme depending on what has
been agreed.
Financial constraints on the wider partnership
All the partners engaged in the employability agenda will see reductions in their budget for
the foreseeable future. This will drive the search for new and more effective ways of
providing services and support, aligning budgets and services around the needs of
individuals, families and communities, and rationalising the physical infrastructure.
Developing the Young Workforce
The implementation of the Wood Commission report is putting in place a set of actions and
processes to help young people make a more successful transition to work and
subsequently make progress in work. The industry-led Dundee and Angus Regional Invest
in Youth Group has now been created which is leading the implementation of the
recommended actions which include a range of actions to break down the distance
between school and the world of work, including for example the creation of long term
working relationships between schools and employers.

Final Report – Improving employability outcomes Page 14
Rocket Science 2015
This significant effort – backed by Scottish Government resources – needs to be an integral
part of any wider employability approach in Dundee. Some feel that the focus on investing
in young people has gone too far at the expense of – for example – the growing problem of
older unemployed people. Cambridge Policy Consultants have pointed out that young
people form one quarter of the unemployed but attract over half the total spend on
employability support.
The Dundee approach needs to recognise and support the significance of this focused
effort on young people and ensure that some of its most important features (for example,
the quality of labour market intelligence) clearly complement this work.
Summary The main practical implications for Dundee of the policy context and trends are:
The need to develop practical ways of managing the performance of the whole
employability service in Dundee – and ensuring that this can include a Work
Programme/Work Choice successor programme in a much more integrated way.
The need to develop a physical infrastructure for the service which allows Dundee
to be at the forefront of the growing emphasis on service integration around client
needs – and on the alignment of budgets to deliver a progressive pathway for each
client.
In particular there is a strong trend in the alignment of services at a neighbourhood
level around the needs of those clients furthest from work – services which include
housing, health, social care and parents’ engagement with schools.
The strengthening focus on progression in work and on the value of ‘Fair Work’ requires a two
pronged effort: the creation of a service to help people to make progress in work, and a
business development effort which helps key sectors enhance productivity and
competitiveness through skills development.
Final Report – Improving employability outcomes Page 15
Rocket Science 2015
2 The socio-economic context
In this section we summarise the socio-economic context for a new approach to
employability in Dundee. Our detailed analysis is set out in Appendix 1. (To ensure a
narrative flow to this summary and the Appendix a few of the Figures are repeated).
The main features and trends are:
Dundee’s population is forecast to grow significantly faster than Scotland’s over the next 25
years. Currently Dundee’s demographic profile shows that it has more young people, fewer
older people and a higher proportion of working age people when compared with Scotland.
Over the next 25 years, the proportion of those of working age is expected to decline but not
as fast as the forecast Scottish decline, with a significant gap emerging towards the end of the
period.
Unemployment has for a long time been significantly higher than in Scotland as a whole. The gap between Dundee City and Scotland has grown over the last three years, although over the past year there has been a considerable fall in the unemployment rate in Dundee. The annual population survey Jan2014-Dec2014 shows an unemployment rate of 7% in Dundee, compared with 5% in Scotland. Economic inactivity is also higher in Dundee, with 31% of the working age population being economically inactive, compared to 23% in Scotland.
In both Dundee and across Scotland, the largest group of benefit claimants is the ESA and Incapacity Benefits group, which comprises almost 10% of the working age population in Dundee. Figure 1 overleaf shows that this group is much larger than the JSA group and provides a greater challenge in terms of the array of support needed and, often, the length of time over which support is needed to take people into secure work.

Interim Report – Improving employability outcomes Page 16
Rocket Science 2015
Figure 1: Profile of unemployed and inactive people in Dundee. [Source: National data sources as set out: presentation by Rocket Science]
Employed60,100
62%Unemployed6,700
7%
Economically inactive30,400
31%
62%
7%
10%
7%
2%
8%
3% 2%
Unemployed, no benefits**, 2.3%
Job seeker***, 4.0%
ESA and incapacity benefits, 9.9%
Lone parent, 1.4%
Others on income related benefit, 0.5%
Other economically inactive people, 20.1%
Dundee City
DW
P W
ork
ing
Ag
e C
lie
nt
Sta
tist
ica
l Ty
po
log
ies
Reasons for Economic Inactivity:
Student
Looking after family / home
Temporary sick
Long term sick
Retired
Other *
*Other economically inactive people: most of these are not claiming benefits but includes some claiming non-income related benefits or other benefits (carers, disabled, bereaved)
** This figure is based on a UK wide estimate that 33% of unemployed are not claiming benefits (eg if between jobs). Based on 2009/10 national estimate of take-up of JSA(IB), see https://goo.gl/e6dj2t
*** This figure includes some people who are not unemployed, but working on average less than 16 hours per week.
Sources: Annual Population Survey, Jan 2014-Dec 2014. Averaged quarterly data from DWP Work and Pensions Longitudinal Study, Feb 2014, May 2014, Aug 2014, Nov 2014.
More information about statistical groups is found here:
Economic activity and out of work benefits among working age (16 - 64) residents
Final Report – Improving employability outcomes Page 17
© Rocket Science UK Ltd 2015
The JSA group is quite dynamic. With roughly 3,500 registered as unemployed in
September 2015, there are approximately 600 people who started a new period of
claiming JSA (either claiming for the first time or a repeat claimant), comprising nearly
one-fifth of the total claimant count in that month, compared with 765 flowing off the
register.
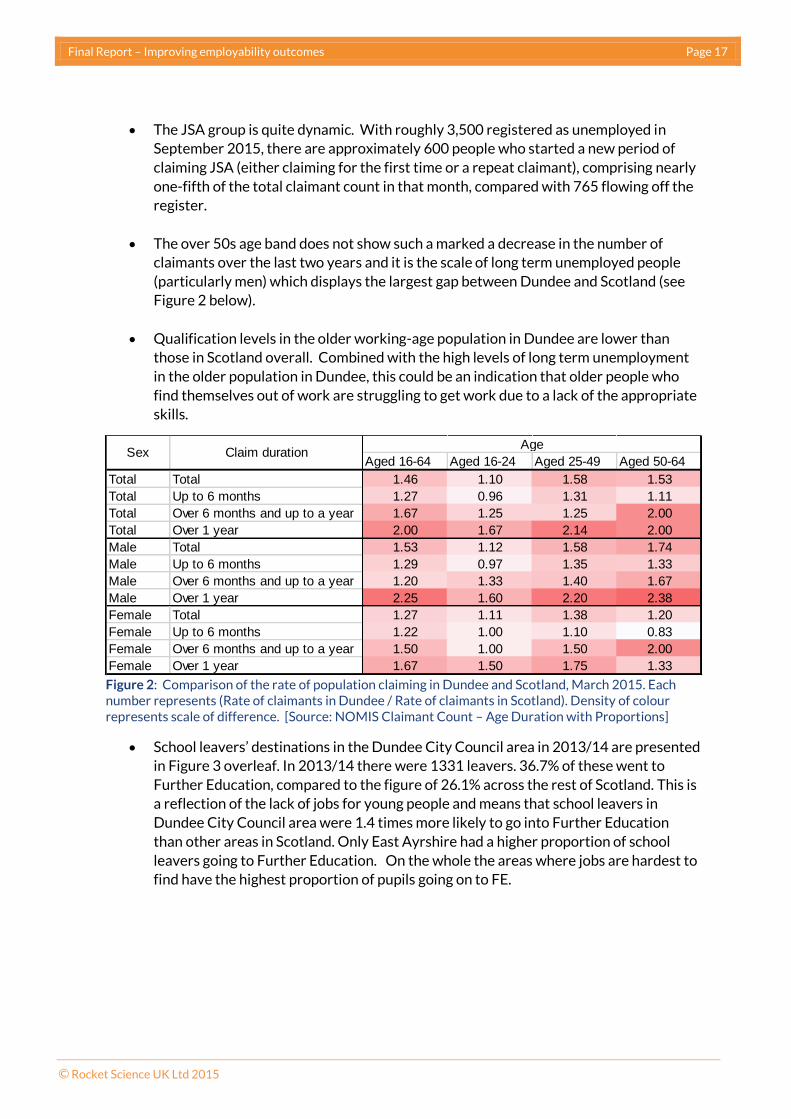
The over 50s age band does not show such a marked a decrease in the number of
claimants over the last two years and it is the scale of long term unemployed people
(particularly men) which displays the largest gap between Dundee and Scotland (see
Figure 2 below).
Qualification levels in the older working-age population in Dundee are lower than
those in Scotland overall. Combined with the high levels of long term unemployment
in the older population in Dundee, this could be an indication that older people who
find themselves out of work are struggling to get work due to a lack of the appropriate
skills.
Figure 2: Comparison of the rate of population claiming in Dundee and Scotland, March 2015. Each number represents (Rate of claimants in Dundee / Rate of claimants in Scotland). Density of colour represents scale of difference. [Source: NOMIS Claimant Count – Age Duration with Proportions]
School leavers’ destinations in the Dundee City Council area in 2013/14 are presented
in Figure 3 overleaf. In 2013/14 there were 1331 leavers. 36.7% of these went to
Further Education, compared to the figure of 26.1% across the rest of Scotland. This is
a reflection of the lack of jobs for young people and means that school leavers in
Dundee City Council area were 1.4 times more likely to go into Further Education
than other areas in Scotland. Only East Ayrshire had a higher proportion of school
leavers going to Further Education. On the whole the areas where jobs are hardest to
find have the highest proportion of pupils going on to FE.
Aged 16-64 Aged 16-24 Aged 25-49 Aged 50-64
Total Total 1.46 1.10 1.58 1.53
Total Up to 6 months 1.27 0.96 1.31 1.11
Total Over 6 months and up to a year 1.67 1.25 1.25 2.00
Total Over 1 year 2.00 1.67 2.14 2.00
Male Total 1.53 1.12 1.58 1.74
Male Up to 6 months 1.29 0.97 1.35 1.33
Male Over 6 months and up to a year 1.20 1.33 1.40 1.67
Male Over 1 year 2.25 1.60 2.20 2.38
Female Total 1.27 1.11 1.38 1.20
Female Up to 6 months 1.22 1.00 1.10 0.83
Female Over 6 months and up to a year 1.50 1.00 1.50 2.00
Female Over 1 year 1.67 1.50 1.75 1.33
AgeSex Claim duration
Final Report – Improving employability outcomes Page 18
Rocket Science 2015
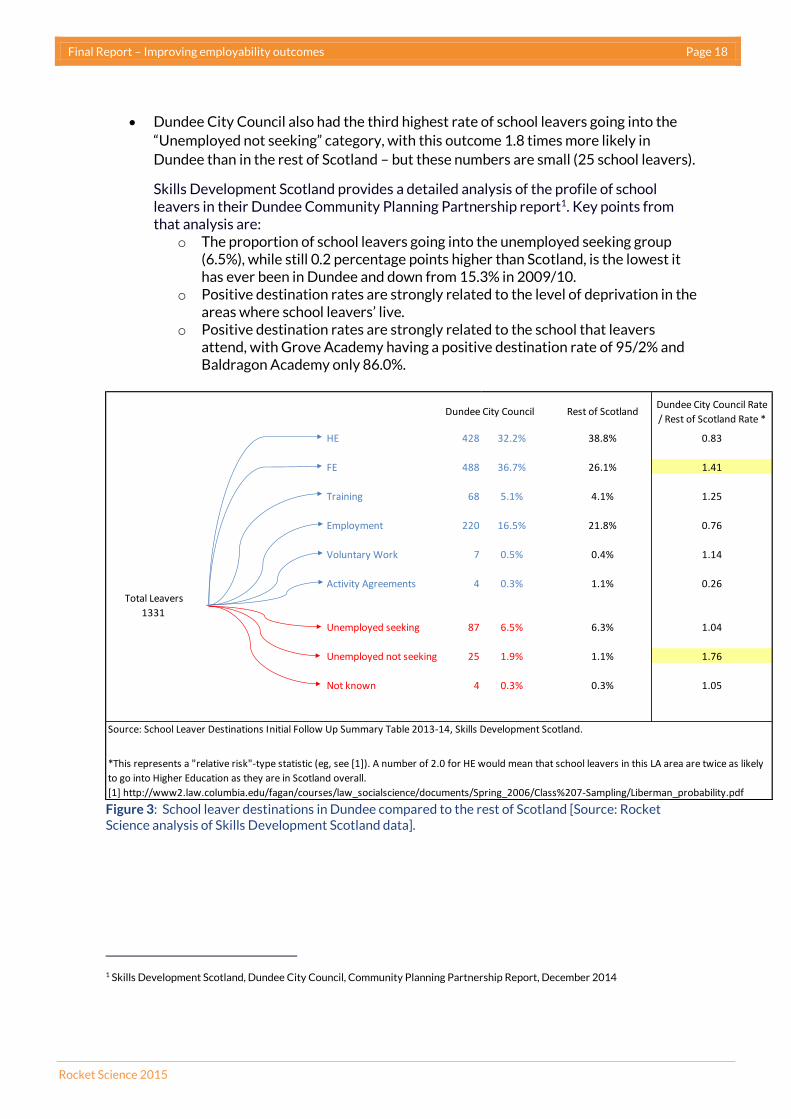
Dundee City Council also had the third highest rate of school leavers going into the
“Unemployed not seeking” category, with this outcome 1.8 times more likely in
Dundee than in the rest of Scotland – but these numbers are small (25 school leavers).
Skills Development Scotland provides a detailed analysis of the profile of school leavers in their Dundee Community Planning Partnership report1. Key points from that analysis are:
o The proportion of school leavers going into the unemployed seeking group (6.5%), while still 0.2 percentage points higher than Scotland, is the lowest it has ever been in Dundee and down from 15.3% in 2009/10.
o Positive destination rates are strongly related to the level of deprivation in the areas where school leavers’ live.
o Positive destination rates are strongly related to the school that leavers attend, with Grove Academy having a positive destination rate of 95/2% and Baldragon Academy only 86.0%.
Figure 3: School leaver destinations in Dundee compared to the rest of Scotland [Source: Rocket Science analysis of Skills Development Scotland data].
1 Skills Development Scotland, Dundee City Council, Community Planning Partnership Report, December 2014
Rest of ScotlandDundee City Council Rate
/ Rest of Scotland Rate *
HE 428 32.2% 38.8% 0.83
FE 488 36.7% 26.1% 1.41
Training 68 5.1% 4.1% 1.25
Employment 220 16.5% 21.8% 0.76
Voluntary Work 7 0.5% 0.4% 1.14
Activity Agreements 4 0.3% 1.1% 0.26
Total Leavers
1331
Unemployed seeking 87 6.5% 6.3% 1.04
Unemployed not seeking 25 1.9% 1.1% 1.76
Not known 4 0.3% 0.3% 1.05
Source: School Leaver Destinations Initial Follow Up Summary Table 2013-14, Skills Development Scotland.
Dundee City Council
*This represents a "relative risk"-type statistic (eg, see [1]). A number of 2.0 for HE would mean that school leavers in this LA area are twice as likely
to go into Higher Education as they are in Scotland overall.
[1] http://www2.law.columbia.edu/fagan/courses/law_socialscience/documents/Spring_2006/Class%207-Sampling/Liberman_probability.pdf

Final Report – Improving employability outcomes Page 19
Rocket Science 2015
Employment
The longer term pattern of employment change is presented in Figure 4. There are three
notable features of Figure 4:
The sustained decline of the manufacturing sector by c10,000 jobs since 1990.
This has been more than compensated for (in numbers, though not in the type of work
or employee) by the growth in public sector employment (which includes DCC, NHS
and the FE and HE sectors) which is now at an historic high, following a minimum in
1999.
Unemployment is significantly lower than during the 1990s, though much higher than
in the period before 2008. In the late 1990s many were encouraged to move to
incapacity benefit and it is clear from a range of anecdotes that some of these people
have remained on IB since. This policy of reducing unemployment figures in this way is
in contrast to the current policy in a very different unemployment context where
through Work Capability Assessments those on IB are being encouraged to become
actively work seeking on JSA.
Figure 4: Dundee employment trends 1990 – 2014 by sector [Source: Cogentsi, DREAM model]
0
10 000
20 000
30 000
40 000
50 000
60 000
70 000
80 000
90 000
1990 1991 1992 1993 1994 1995 1996 1997 1998 1999 2000 2001 2002 2003 2004 2005 2006 2007 2008 2009 2010 2011 2012 2013 2014
Emp
loye
e-jo
bs
Dundee employee-jobs
Claimant count (job seekers)
Non-manufacturing production
Other services and household activities
Public administration; education; health
Business service activities
Real estate activities
Financial and insurance activities
Information and communication
Distribution; transport; accommodation and food
Construction
Manufacturing
Agriculture, forestry and fishing
Source: DREAM®fi le:///D:\Emp\HEE15\CouncilHEE07\Dundee.xlsx
All industries

Final Report – Improving employability outcomes Page 20
Rocket Science 2015
Skills Development Scotland’s 2014 Regional Skills Assessment found that 23% of
establishments in Tayside had skills gaps, compared to 19% across Scotland. Tayside
employers reported that new recruits including school leavers, college leavers and
university graduates were generally well or very well prepared for work, although less
well prepared for work than average for employers in Scotland. 2
The largest skills gaps by occupation in Tayside, as identified by the Regional Skills
Assessment, are for process and machine operatives (14% of all in employment have a
skills gap) and caring, leisure and other service occupations (12% of all in employment
have a skills gap). For both these occupational classifications, the skills gap in Tayside
is around twice the national skills gap.
In Scotland there are 3.9 unemployed people for every job vacancy. In Tayside, this
jobs gap is slightly higher at 4.5 unemployed people for every job vacancy. Although
there is a jobs gap in Tayside and across Scotland, there is an additional challenge for
getting people into employment, namely skills shortages preventing job vacancies
from being filled.
In Tayside, there are two employment types with a particularly high level of vacancies
– machine operatives and skilled trade’s occupations. For both types of employment,
over a quarter of the vacancies are deemed to be unfilled due to a skills shortage.
While half of the manager position vacancies are deemed to be due to skills shortages,
these vacancies comprise a small proportion (less than 1%) of the optimal employment
in this sector. There are notably fewer vacancies for “professionals” and “caring,
leisure and other services staff” in Tayside compared to Scotland.
Summary
The situation described in these statistics has some important features:
Unemployment remains stubbornly high in Dundee compared with Scotland. This
applies across the age groups. The gap with Scotland widens with duration of
unemployment and is at its widest for long term unemployed men over 50.
In part this is a reflection of the changing employment structure of Dundee, in
particular with a sustained long term decline in manufacturing jobs, and some clear
echoes from the period of particularly high unemployment in the late 1990s.
While the on flows and off flows in the labour market show considerable dynamism,
there is evidence of a ‘jobs gaps’ – in other words there is a mismatch between those
seeking work and the numbers and types of jobs available. This may have implications
for the job search area of young people.
2 Regional Skills Assessment for Tayside, Nov 2014, quoting UKCES Employer Skills Survey 2013
Final Report – Improving employability outcomes Page 21
Rocket Science 2015
Overall, the unemployed client group is further from work than in many other areas,
and this has significant implications for the design and focus of a local employability
service, and for the need to integrate or at least align Work Programme 2 after its
introduction in April 2017.
The implications of this are:
There is a need to maximise the creation of jobs and the filling of vacancies by ensuring a high quality match between the skills and aptitudes of recruits and the needs of employers.
The main issue for Dundee is about those on ESA rather than JSA (most of whom find work of their own accord) – and for those not in work who are at risk of long term unemployment. There is therefore need to develop more effective integrated support for those on ESA – and to develop a much stronger ‘risk based’ focus for those on JSA –in terms of targeting those at risk of becoming longer term unemployed, and intervening as early as possible.
There is a need to ensure the greatest return from the significant local investment in employability services by ensuring both that they are closely aligned with an agreed service design – and that the performance of the whole service is actively managed and improved by the partners.
• Given the number of those who are furthest from work and require intensive support, there is a need for the Partnership to consider how one to one services can be delivered, particularly in the most deprived neighbourhoods. The use of mainstream partner resources already applied in these communities, and/or the potential to work with community members/volunteers to support those individuals who can aspire to work, are approaches that should be tested.

Final Report – Improving employability outcomes Page 22
Rocket Science 2015
3 Reframing the ‘Dundee Pipeline’
The idea of a strategic skills pipeline for each Local Authority area was introduced in the Scottish Governments first employability framework, ‘ Workforce Plus’. This introduced the idea of the pipeline as a framework which would allow local partners to:
Understand the distribution of the services of all partners (public, private, third sector) across the 5 stages locally
Use this to identify gaps and duplications Use this to review the distribution of spend across Stages 1-5 and move towards
desired profile Actively manage client progress through the stages.
It was therefore intended to be a framework for service positioning, review and management which included all the components of a local employability service. In Dundee today, the ‘Dundee Pipeline’ refers primarily to the contracting of the DCC/ESF component. Last year spending on this aspect of employability was £400,000 out of an estimated £18m for the pipeline as a whole. The figure of £18m has been roughly estimated by drawing on the recent analysis of Scottish spend on employability and reducing in terms of the working age population of Dundee. Figure 5 below sets out the sources of investment in employability services across Scotland
Figure 5: Total annual spend on employability support in Scotland by source [Source: CPC 2014, presentation by Rocket Science]
236/36%
103/16%
176/27%
43/6%
43/7%
27/ 4%
17/3%5/1%
Estimate of expenditure (£m) 2012/13/% of total(Source CPC review except where identified)
SFC - Stage 3 Vocational Training(Vocational Courses)
SFC - Stage 5 In Work Support(Vocational Courses)
Local Authorities / LEPs specificemployability expenditure+SDS [2]European Funding 2013 (LUPSP1,P2,P3,P5; H&I P1,P2,P3)without match [1]
DWP Work Programme(Estimated Revenue for Scotland)
Final Report – Improving employability outcomes Page 23
Rocket Science 2015
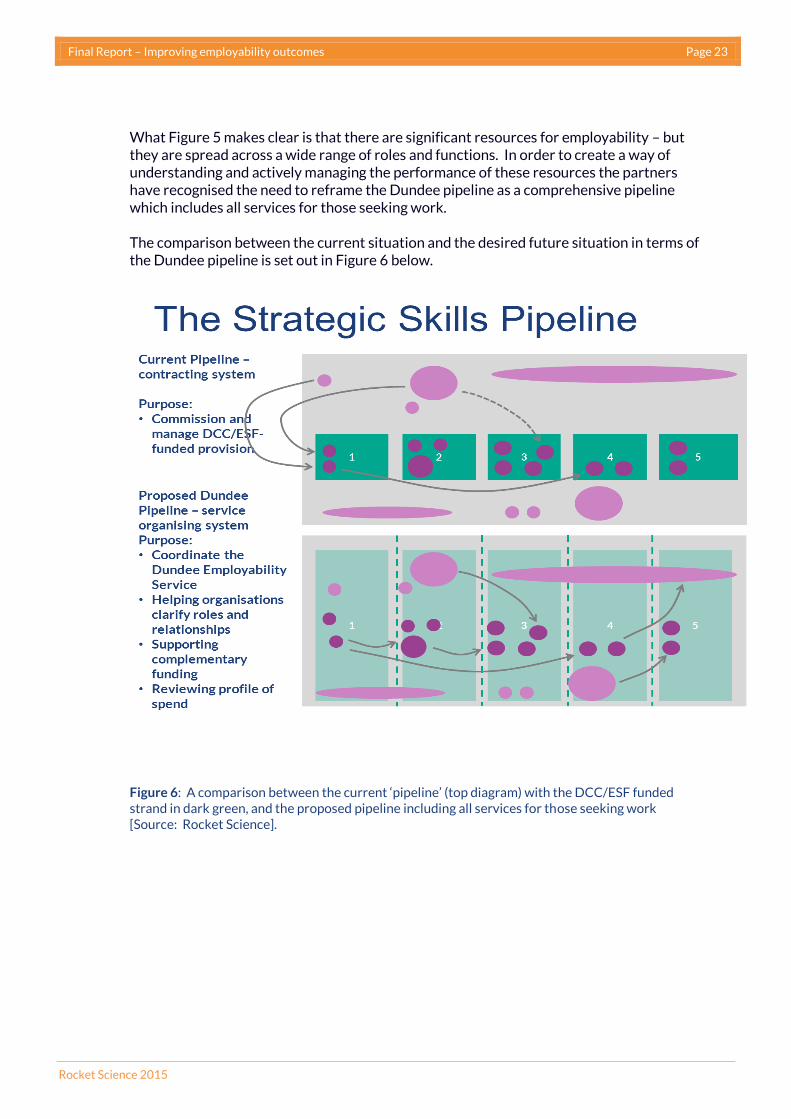
What Figure 5 makes clear is that there are significant resources for employability – but they are spread across a wide range of roles and functions. In order to create a way of understanding and actively managing the performance of these resources the partners have recognised the need to reframe the Dundee pipeline as a comprehensive pipeline which includes all services for those seeking work. The comparison between the current situation and the desired future situation in terms of the Dundee pipeline is set out in Figure 6 below.
Figure 6: A comparison between the current ‘pipeline’ (top diagram) with the DCC/ESF funded strand in dark green, and the proposed pipeline including all services for those seeking work [Source: Rocket Science].

Final Report – Improving employability outcomes Page 24
Rocket Science 2015
The ‘Dundee pipeline’ therefore becomes a way of organising all services into a coherent model, and can be much more than a way of contracting one funding stream:
It will help providers to position themselves and understand flow of client into and out of their service and the relationships they need to have with complementary services
It will provide partners with a way of analysing spend and its distribution and acting on this
It will provide a framework for active management of the whole service.

Final Report – Improving employability outcomes Page 25
Rocket Science 2015
4 What works?
We have drawn on the recent work of Cambridge Policy Consultants and our own evaluation
work to produce Figure 7 below which summarise the elements of good practice at each stage
of the Strategic Skills Pipeline:
Figure 7: Elements of good practice by pipeline stage [Source: CPC and Rocket Science]
We have drawn on these good practice elements to develop our whole service approach
which is described in the next section. A valuable recent literature review has been produce
by the Learning and Work Institute which has been designed to provide insights to inform the
Scottish Government’s design and procurement of the devolved successor programme (to
Work Programme and Work Choice)3
3 http://www.learningandwork.org.uk/sites/niace_en/files/resources/Scotlands%20future%20employment%20services%20final%20report.pdf

Final Report – Improving employability outcomes Page 26
Rocket Science 2015
5 The preventative approach
Rocket Science were also commissioned by the Dundee Employability Partnership to explore
how the Partnership could develop a stronger focus on prevention in tackling employability in
Dundee and make specific recommendations. This chapter summarises the findings and
recommendations of this work, as it is relevant to this report’s recommendations.
Prevention has been firmly on the Scottish Government agenda since the publication of the
Christie Report, and was most recently reflected in the ‘Working for Growth’ Scottish
Employability Framework which stressed the importance of offering preventative support to
those who would be furthest from the labour market.
When it is done effectively prevention can reduce the costs of later support, reduce the
demand on a range of services which are under pressure, reduce spending on benefits and –
perhaps most important – reduce the significant impacts of long term unemployment on
individuals, their families and their communities. These impacts include health issues, loss of
confidence, the perishing of skills and demoralisation, as well as the knock on effects of
reduced household incomes.
However, moving towards a stronger focus on prevention is not without its challenges, and
most regions around Scotland are still in the early stages of trying to explore what it means for
them in practice. Insufficient budget flexibility, the mismatch between who funds action and
who gains from the benefits from preventative action, risk and uncertainty about future
impacts of upfront investment and the timescales for a return on this investment, and the
opportunity costs associated with re-prioritising resources towards preventative action are
all pressures faced by areas looking at ways to implement prevention.
The Dundee Partnership has developed a Prevention Framework which explores prevention
in terms of universal services delivered prior to the development of risk and problems,
targeted prevention for high risk individuals before problems emerge, and early intervention
which looks to prevent emerging problems from worsening. We found that many services
currently provided in Dundee contribute to preventing employability issues, although they
are not always identified by service providers or users as preventative action. This indicates
that a more explicit understanding of prevention would reveal a reasonable level of current
activity that could be built on.
Final Report – Improving employability outcomes Page 27
Rocket Science 2015
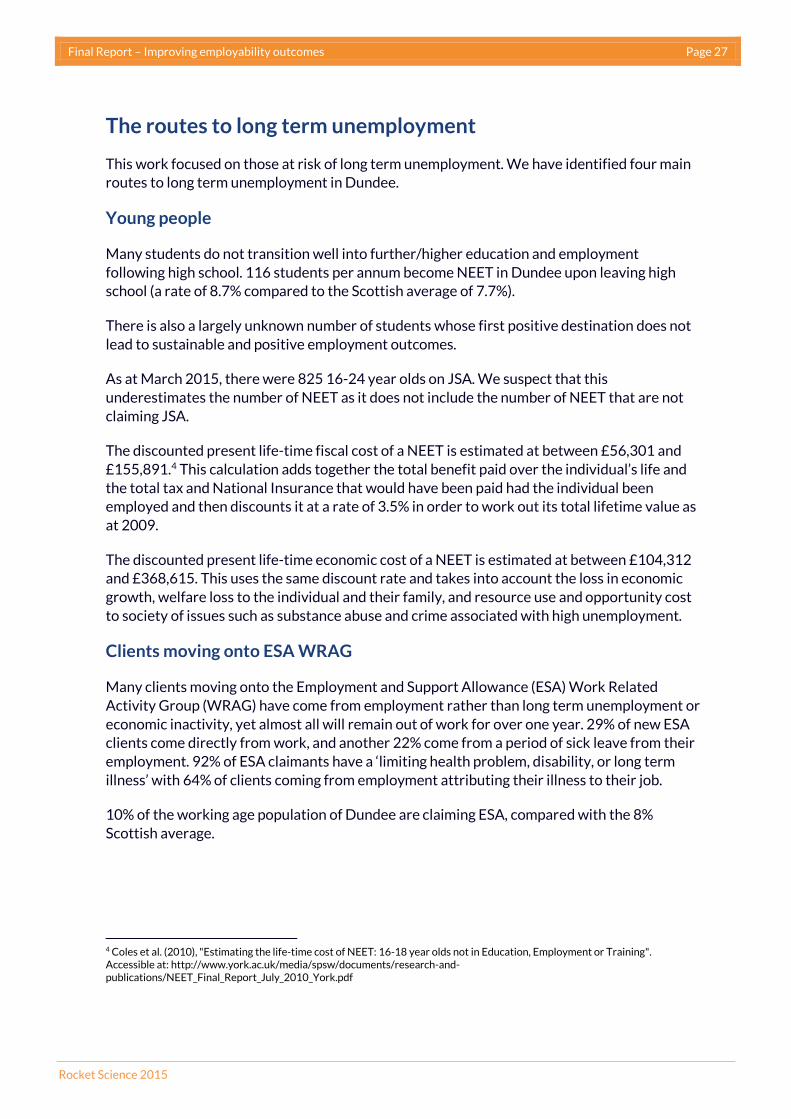
The routes to long term unemployment
This work focused on those at risk of long term unemployment. We have identified four main
routes to long term unemployment in Dundee.
Young people
Many students do not transition well into further/higher education and employment
following high school. 116 students per annum become NEET in Dundee upon leaving high
school (a rate of 8.7% compared to the Scottish average of 7.7%).
There is also a largely unknown number of students whose first positive destination does not
lead to sustainable and positive employment outcomes.
As at March 2015, there were 825 16-24 year olds on JSA. We suspect that this
underestimates the number of NEET as it does not include the number of NEET that are not
claiming JSA.
The discounted present life-time fiscal cost of a NEET is estimated at between £56,301 and
£155,891.4 This calculation adds together the total benefit paid over the individual’s life and
the total tax and National Insurance that would have been paid had the individual been
employed and then discounts it at a rate of 3.5% in order to work out its total lifetime value as
at 2009.
The discounted present life-time economic cost of a NEET is estimated at between £104,312
and £368,615. This uses the same discount rate and takes into account the loss in economic
growth, welfare loss to the individual and their family, and resource use and opportunity cost
to society of issues such as substance abuse and crime associated with high unemployment.
Clients moving onto ESA WRAG
Many clients moving onto the Employment and Support Allowance (ESA) Work Related
Activity Group (WRAG) have come from employment rather than long term unemployment or
economic inactivity, yet almost all will remain out of work for over one year. 29% of new ESA
clients come directly from work, and another 22% come from a period of sick leave from their
employment. 92% of ESA claimants have a ‘limiting health problem, disability, or long term
illness’ with 64% of clients coming from employment attributing their illness to their job.
10% of the working age population of Dundee are claiming ESA, compared with the 8%
Scottish average.
4 Coles et al. (2010), "Estimating the life-time cost of NEET: 16-18 year olds not in Education, Employment or Training". Accessible at: http://www.york.ac.uk/media/spsw/documents/research-and-publications/NEET_Final_Report_July_2010_York.pdf

Final Report – Improving employability outcomes Page 28
Rocket Science 2015
71% of ESA clients have been claiming for more than 1 year. The current median duration of
claim is between 1 and 2 years, however this understates the real duration out of employment
due to the transfer of clients from Incapacity Benefit to ESA from 2009.
The annual cost of an individual on ESA is:
Programme Fiscal Value Economic Value
ESA £9,091 £13,236
· The fiscal cost includes the annual cost to DWP of benefit payments and the
associated administration cost, and the increased service demand on the NHS for an
individual out of work
· The economic cost includes the lost economic growth that would have occurred had
the individual been in employment for a year
· These costs do not include the cost to other bodies such as Dundee City Council or Skills Development Scotland.
Reducing the duration of an ESA claim has the following fiscal and economic benefits per
individual:
reducing unemployment by
monthly
cost 3
months 6
months 9
months 12
months 18
months 24
months
fiscal cost £758 £2,273 £4,545 £6,818 £9,091 £13,636 £18,181
economic cost £1,103 £3,309 £6,618 £9,927 £13,236 £19,854 £26,472
For example, reducing the duration of an ESA claim by 18 months has a fiscal benefit of
c£13,600 and economic benefit of c£19,900.
If an improved Work Programme for ESA clients were to accelerate return to employment by
an average of 3 months, with an average of 1,416 new ESA WRAG claimants a year, this would
result in £19.3 million of fiscal benefits and £28 million of economic benefits from this group.
The largest limitation to this analysis is the assumption that the 1,416 new ESA WRAG
claimants are all individual claimants rather than individuals who are moving on and off ESA
WRAG due to regular reassessments from or to JSA or WRAG Support Group. We are unable
to determine this based on the data available.
Clients moving onto JSA
Dundee has a higher rate of unemployment than the Scottish average – this is particularly
noticeable in terms of the proportion of male and older claimants.
Final Report – Improving employability outcomes Page 29
Rocket Science 2015
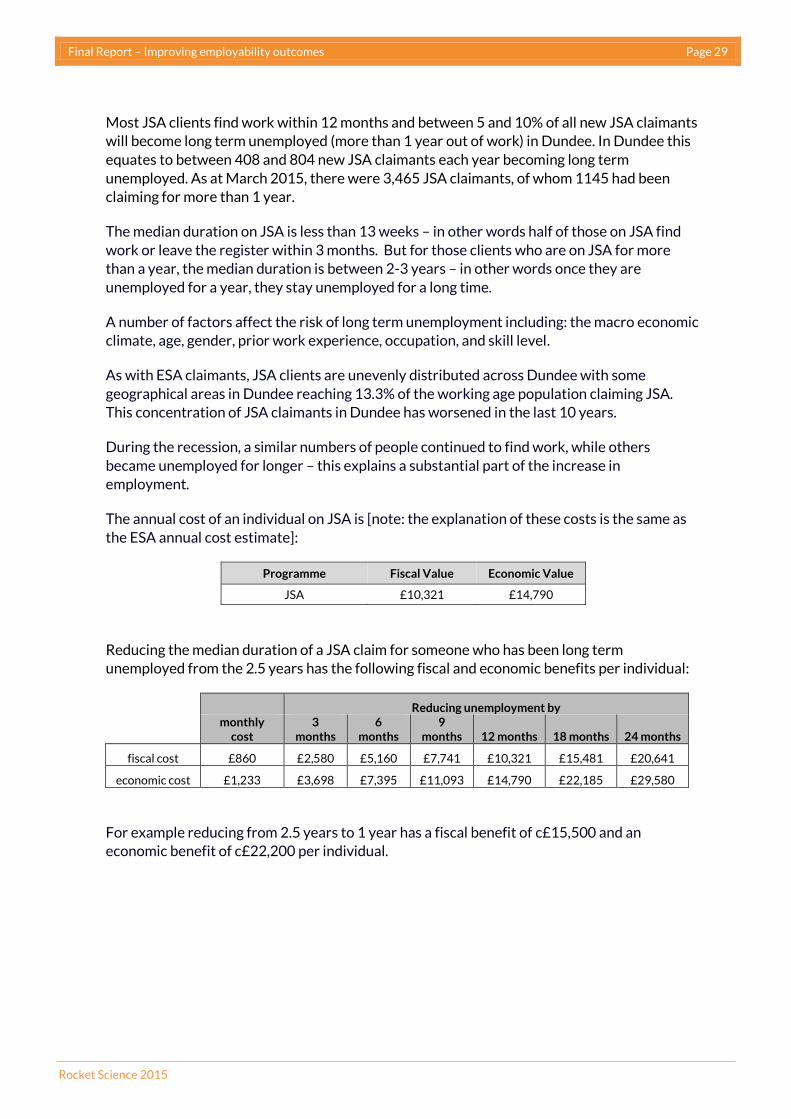
Most JSA clients find work within 12 months and between 5 and 10% of all new JSA claimants
will become long term unemployed (more than 1 year out of work) in Dundee. In Dundee this
equates to between 408 and 804 new JSA claimants each year becoming long term
unemployed. As at March 2015, there were 3,465 JSA claimants, of whom 1145 had been
claiming for more than 1 year.
The median duration on JSA is less than 13 weeks – in other words half of those on JSA find
work or leave the register within 3 months. But for those clients who are on JSA for more
than a year, the median duration is between 2-3 years – in other words once they are
unemployed for a year, they stay unemployed for a long time.
A number of factors affect the risk of long term unemployment including: the macro economic
climate, age, gender, prior work experience, occupation, and skill level.
As with ESA claimants, JSA clients are unevenly distributed across Dundee with some
geographical areas in Dundee reaching 13.3% of the working age population claiming JSA.
This concentration of JSA claimants in Dundee has worsened in the last 10 years.
During the recession, a similar numbers of people continued to find work, while others
became unemployed for longer – this explains a substantial part of the increase in
employment.
The annual cost of an individual on JSA is [note: the explanation of these costs is the same as
the ESA annual cost estimate]:
Programme Fiscal Value Economic Value
JSA £10,321 £14,790
Reducing the median duration of a JSA claim for someone who has been long term
unemployed from the 2.5 years has the following fiscal and economic benefits per individual:
Reducing unemployment by
monthly
cost 3
months 6
months 9
months 12 months 18 months 24 months
fiscal cost £860 £2,580 £5,160 £7,741 £10,321 £15,481 £20,641
economic cost £1,233 £3,698 £7,395 £11,093 £14,790 £22,185 £29,580
For example reducing from 2.5 years to 1 year has a fiscal benefit of c£15,500 and an
economic benefit of c£22,200 per individual.

Final Report – Improving employability outcomes Page 30
Rocket Science 2015
Between 408 and 804 people per annum currently starting on JSA are at risk of long term
unemployment. If interventions reduced unemployment duration by 9 months for this group
then the savings per annum arising from reduced claim duration would be between £3.2 and
£6.2 million fiscal savings and between £4.5 and between £8.9 million and £3.2 million in
economic gain over the course of the individuals’ claim periods. Include explanation about
applying the DWP tool picks up a larger number of people, not all are accurate.
Clients re-entering unemployment after finding work
The National Audit Office estimates that 40% of all JSA clients that find employment will be
claiming JSA again within 6 months. Around 30% of clients that used the ESF/Dundee City
Council contracted pipeline services repeated their use of services on a different journey on
JSA or ESA since 2008 (we expect that this understates the level of recycling back into
unemployment that occurs in Dundee as it does not consider clients that did not use the
contracted services). So both local and national evidence suggests that there is an important
issue about job sustainability: both in terms of ‘getting it (the match between individual and
job) right first time’, about job quality and about the scope for progression in work and
support to make this progression.
Using the National Audit Office estimate, roughly 1,420 JSA claimants in Dundee will return
to JSA within 6 months of finding employment.
The number of ESA WRAG clients who return to ESA after finding employment is unknown.
The factors that increase the risk of returning to unemployment include:
· Job related risks (for example short term contracts and inadequate pay or
employment conditions)
· The degree to which the job matches the employee’s skills
· Client characteristics that might prevent a smooth transition into employment (for
example practical issues like money and money management, childcare, or personal
attributes and understanding of the norms of employment).
The benefits associated with reducing this ‘re-cycling’ are only able to be calculated for JSA
given the data available. The analysis clearly indicates that getting a job is in many cases not
the end of the fiscal cost of an individual on JSA.
Final Report – Improving employability outcomes Page 31
Rocket Science 2015
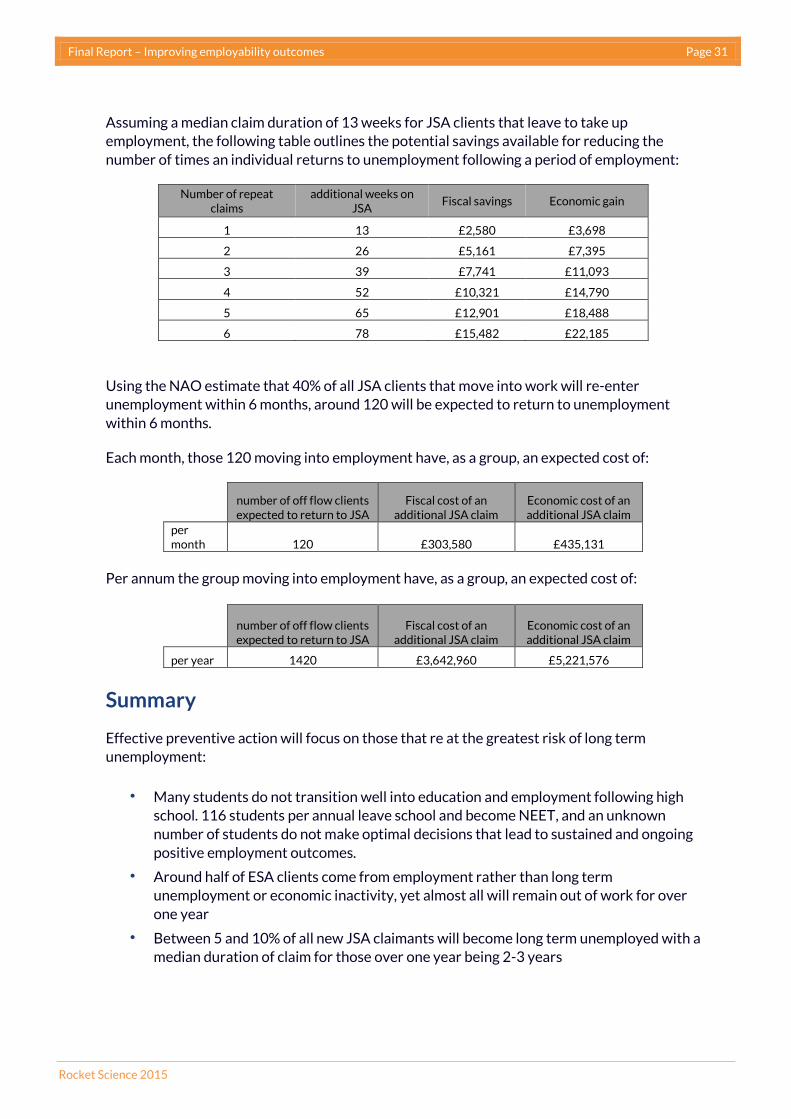
Assuming a median claim duration of 13 weeks for JSA clients that leave to take up
employment, the following table outlines the potential savings available for reducing the
number of times an individual returns to unemployment following a period of employment:
Number of repeat claims
additional weeks on JSA
Fiscal savings Economic gain
1 13 £2,580 £3,698
2 26 £5,161 £7,395
3 39 £7,741 £11,093
4 52 £10,321 £14,790
5 65 £12,901 £18,488
6 78 £15,482 £22,185
Using the NAO estimate that 40% of all JSA clients that move into work will re-enter
unemployment within 6 months, around 120 will be expected to return to unemployment
within 6 months.
Each month, those 120 moving into employment have, as a group, an expected cost of:
number of off flow clients expected to return to JSA
Fiscal cost of an additional JSA claim
Economic cost of an additional JSA claim
per month 120 £303,580 £435,131
Per annum the group moving into employment have, as a group, an expected cost of:
number of off flow clients expected to return to JSA
Fiscal cost of an additional JSA claim
Economic cost of an additional JSA claim
per year 1420 £3,642,960 £5,221,576
Summary
Effective preventive action will focus on those that re at the greatest risk of long term
unemployment:
· Many students do not transition well into education and employment following high
school. 116 students per annual leave school and become NEET, and an unknown
number of students do not make optimal decisions that lead to sustained and ongoing
positive employment outcomes.
· Around half of ESA clients come from employment rather than long term
unemployment or economic inactivity, yet almost all will remain out of work for over
one year
· Between 5 and 10% of all new JSA claimants will become long term unemployed with a
median duration of claim for those over one year being 2-3 years
Final Report – Improving employability outcomes Page 32
Rocket Science 2015
· In 2007, the National Audit Office estimated that 40% of all JSA clients that find
employment will be claiming JSA again within 6 months, the number of clients that
become unemployed again who move from ESA into employment is unknown.
Negative labour market outcomes following school and risk of long term unemployment
appear to be positively correlated to the level of background deprivation of an individual.
Effective preventative services will require both early identification of individuals at risk, and
early targeted intervention. Therefore, we recommend the following:
· That the Dundee Partnership present the findings of this research to the Scottish
Government in terms of the implications for the local design and delivery of the
replacement programme(s) for the devolved Work Programme and Work Choice
programme powers and resources, specifically for ESA WRAG clients and their need
for a rounded service involving personalisation and the involvement of a range of
existing local mainstream and specialist services.
· That the Dundee Partnership enter into discussion with Working Links, Ingeus and
Triage as their local subcontractor with a view to designing and piloting more
integrated local responses for those on ESA WRAG being referred into Work
Programme.
· That DWP carry out a local pilot to identify those JSA clients who are at risk of long
term unemployment using the DWP research conclusions (risk assessment model).
· That Dundee City Council develop, as part of the joint City Deal approach and in
consultation with neighbouring Local Authorities, the development and funding of two
new services with the cost allocated in proportion to estimated savings to DWP and
Local Authorities:
· An Accelerated Job Finding Service (AJF) for all new JSA claimants at risk of
long term unemployment (as identified through the tool developed using
DWP research)
· A Career Advancement Service (CAS) for clients at risk of returning to
unemployment. All AJF clients and others flagged by service providers as at
risk will be eligible for this service
· The Dundee Partnership should explore with Healthy Working Lives the scope to
enhance local support provision around health at work for employers and employees
and promotion of support.
· The Developing Young Workforce Regional Group should:
· Develop school/employer engagement approach, KPIs that require SME and public
sector to participate, with and appropriate support structures to help small businesses
participate
· Focus on schools in the highest unemployment and lowest local business areas
· Develop a range of ways to including teachers in small business and public sector
engagement approaches

Final Report – Improving employability outcomes Page 33
Rocket Science 2015
· Consider how best to use the agreed labour market analysis to be produced by the
LEP.
· That members of the Dundee Partnership actively engage with schools as employers
as part of the Developing Scotland’s Young Workforce agenda given they represent
32.5% of Dundee employment.
· That Dundee City Council engage with the Scottish Government to identify ways of
restoring ERI support routes to work for those young people at risk of NEET, or
including this group in the eligibility criteria for the replacement programme(s)
following the end of Work Programme and Work Choice.
· That Dundee City Council do further work to detail the specific scale and cost of
interventions with the four identified priority groups and the estimated savings to
DWP (in terms of reduced benefit payments) and savings to other partners. These
should be used as the basis of a City Deal proposal.
Final Report – Improving employability outcomes Page 34
Rocket Science 2015
6 Developing a ‘whole service’ approach
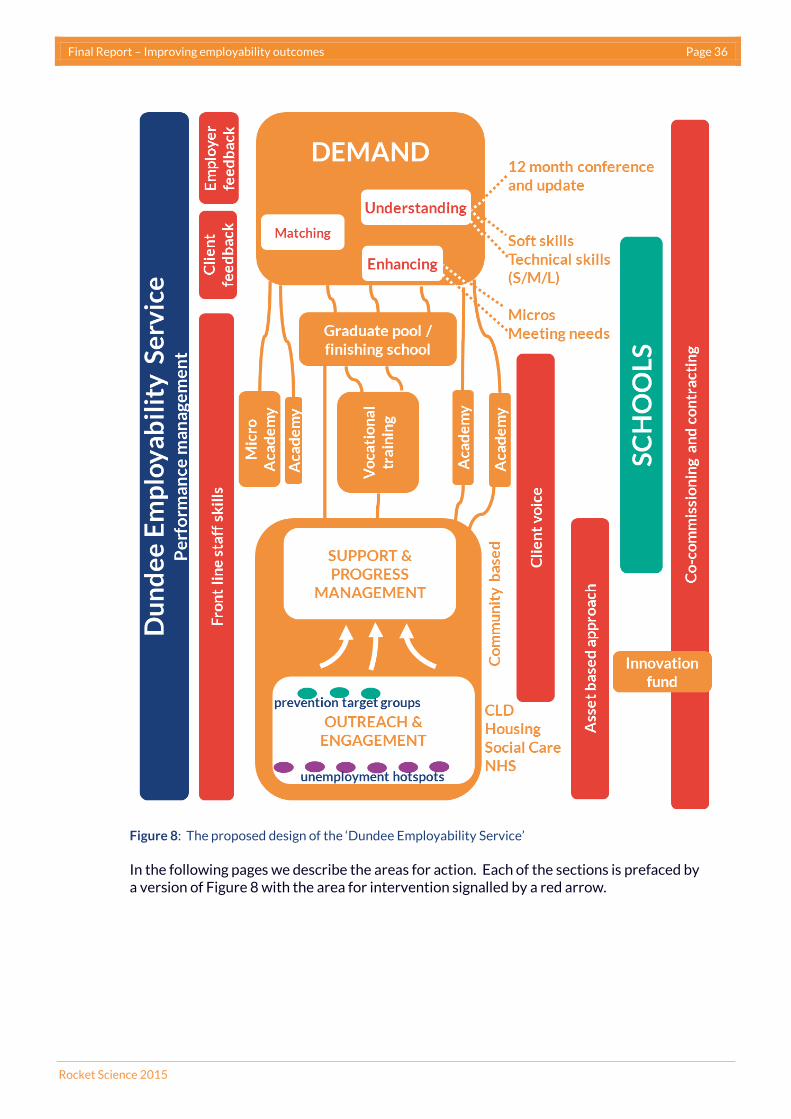
Working with the staff of local partners we have developed the design of a ‘Dundee
Employability Service’ (Figure 8 overleaf). This has 8 main features:
· It starts and ends with an understanding of the demand for labour. The service is built
on the importance of the partners working with employers to ensure that every aspect
of the service is infused with high quality insights and intelligence about the current
and emerging job market: what employers are looking for and how they are recruiting.
· A high quality employability service can of itself enhance demand: if employers are
confident that they can get high quality recruits they will recruit more people.
Specifically there is now considerable practical evidence that helping micro-
businesses with HR support leads to more recruitment by this important sector of the
job market.
· We emphasise the need to have as much as possible ‘close to work’ training co-designed with employers using the ‘academy’ model – with more generic vocational
training leading to an independent ‘graduate’ or finishing school which will help clients
gain the final skills and approaches they will need to thrive in work.
· The service does not end when clients find work. There is a strong focus on progression in work – to more secure and better paid work. We are proposing that this
includes both a ‘career enhancement service’ and a business development effort in key
employment sectors to promote progression through enhancing business productivity
and competitiveness
· Stage 1 (outreach and engagement) and Stage 2 (support and progress management)
involve a wide range of community based services. These take an asset based approach
(that is, working with clients to identify and build on existing strengths to promote
motivation and a sense of empowerment).
· The quality, responsiveness and impact of the service will be captured in a range of
ways – but one of the most important will be regular feedback from both employers and clients. It is important to note that this feedback will be about their experience of
the service as a whole - not of one particular provider. This will be a strong driver of
more coherent and collaborative behaviours.

Final Report – Improving employability outcomes Page 35
Rocket Science 2015
· There is an emphasis on the skills of front line staff. All the evaluations of major
employability programmes highlight the significance of personal advisers and stress
the importance of having experienced and effective staff in these roles. The partners
will therefore develop a focus on the appointment and development of high quality
front line staff and their effective support.
· Finally, all the partners will take a co-commissioning approach to the design and delivery of their services – and where services are contracted they will make sure that
they complement existing services.
Final Report – Improving employability outcomes Page 36
Rocket Science 2015
Figure 8: The proposed design of the ‘Dundee Employability Service’
In the following pages we describe the areas for action. Each of the sections is prefaced by a version of Figure 8 with the area for intervention signalled by a red arrow.

Final Report – Improving employability outcomes Page 37
Rocket Science 2015
Action 1: Transforming the quality and value of labour market intelligence
Action in this area will involve:
· Creating a shared source of practically useful intelligence and insight about short,
medium and longer term requirements
· Ensuring the development of a shared interpretation of the information and the
practical implications of this.
· Infusing the whole employability service (providers, College) and schools with this
useable information which is robust enough to base decisions upon
The information will be drawn from:
· SDS Regional Skills Assessment and Skills Investment Plan
· Industrial Advisory Boards for sectors at Dundee and Angus College
· College destination returns
· DCC Labour Market Bulletin
· UKCES reports
· JCP vacancies
· SDI inward investment project requirements
· Planning/Building Control/Trading Standards/Licensing
· SE Account Managers
· Business Gateway advisers
· FSB/Dundee and Angus Chamber of Commerce

Final Report – Improving employability outcomes Page 38
Rocket Science 2015
· Employer engagement staff (JCP, SDS, College, training providers).
To bring together these hard and soft sources it is proposed that the partners
will hold an annual workshop of LMI specialists and all those engaging with
businesses. At this workshop participants will:
• Identifying current and emerging needs
• Explore the practical implications
• Agree on the reliability and robustness of the insights
• Identify areas for more detailed exploration
• Develop agreed summaries of useable information for:
– Training providers
– Guidance teachers, SDS IAG staff, pupils, parents
– Personal advisers.
The practical benefits of this will be:
• Improved decision making by pupils
• Improved match between advice/training and the market
• Improved match between recruits and employer needs
• Employers more confident of finding the right staff – more jobs?
• Greater likelihood of sustainability in work.
Action 2: Ensuring the quality of the whole service
To ensure that partners have regular insights into the quality and performance
of the service as whole they will commission regular surveys of both employers
and individual clients.

Final Report – Improving employability outcomes Page 39
Rocket Science 2015
The regular (6 months) independent surveys of employers will cover:
· The quality and responsiveness of service
· The quality and match of recruits
· The scope for improvement.
The regular (6 months) independent surveys of individual clients will include:
· The quality and responsiveness of service – did it understand and respond to your
specific situation and needs?
· Did you agree a clear pathway for progress? Have you felt in charge of your progress?
· Have you had the support you need along the way?
· Have you gained a job which matches your skills and aspirations?
There will be a standing item every 6 months on the agenda of the Employability
Group which will cover the following questions:
· What does this tell us about our progress in creating a clear, coherent and progressive
service focusing on situation of the client and needs of employers?
· What is heading in the right direction and what do we need to take action on?
· What shall we do, who will do it and how will we check whether it is making the
improvement we need?
· Are there any areas which require more detailed research? How shall we do this?
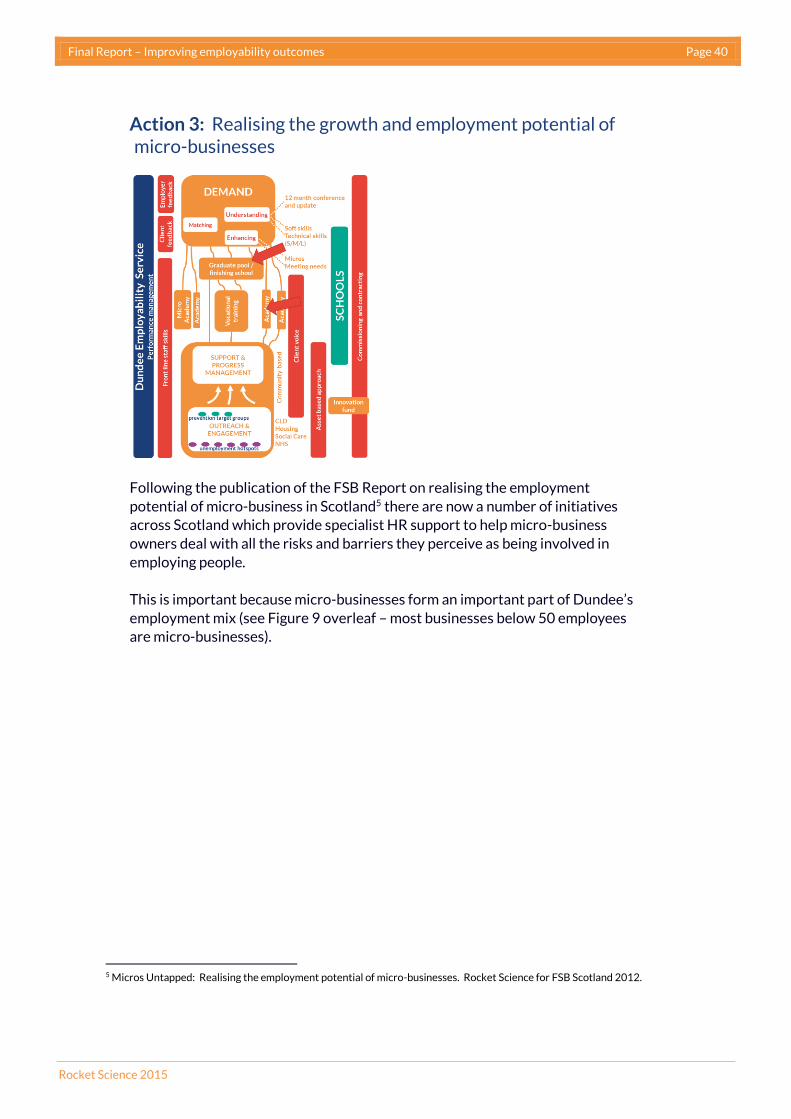
Final Report – Improving employability outcomes Page 40
Rocket Science 2015
Action 3: Realising the growth and employment potential of micro-businesses
Following the publication of the FSB Report on realising the employment
potential of micro-business in Scotland5 there are now a number of initiatives
across Scotland which provide specialist HR support to help micro-business
owners deal with all the risks and barriers they perceive as being involved in
employing people.
This is important because micro-businesses form an important part of Dundee’s
employment mix (see Figure 9 overleaf – most businesses below 50 employees
are micro-businesses).
5 Micros Untapped: Realising the employment potential of micro-businesses. Rocket Science for FSB Scotland 2012.
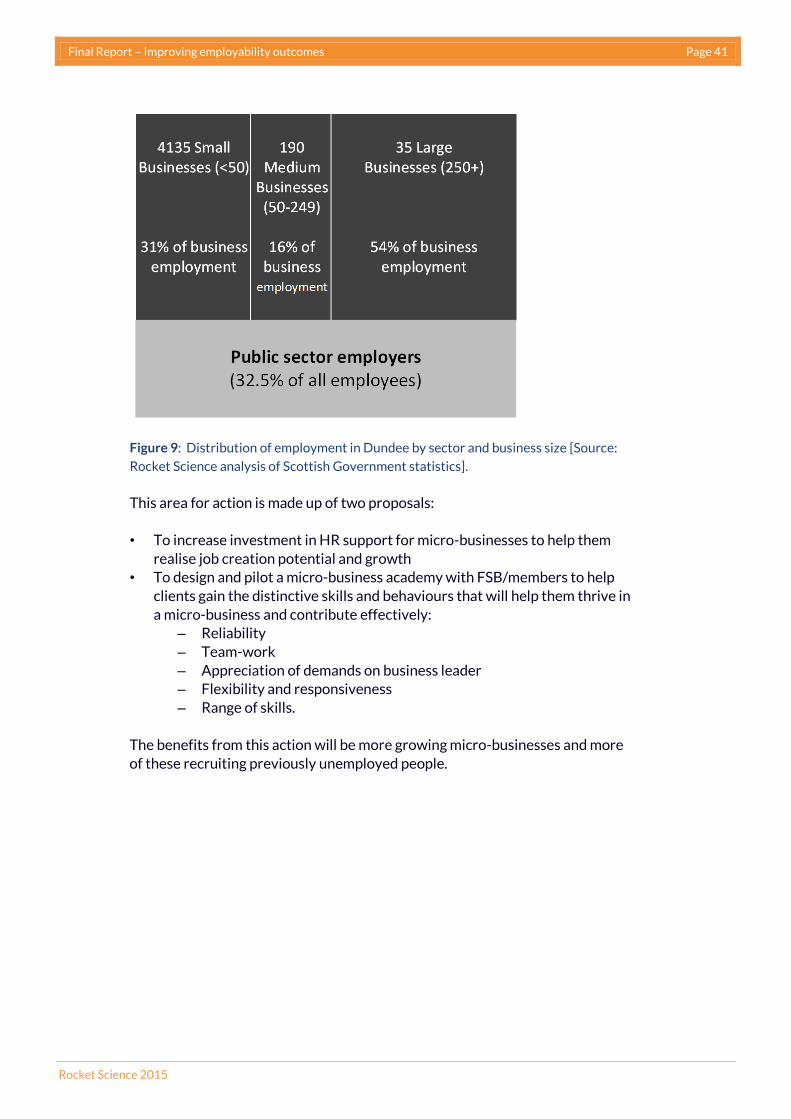
Final Report – Improving employability outcomes Page 41
Rocket Science 2015
Figure 9: Distribution of employment in Dundee by sector and business size [Source:
Rocket Science analysis of Scottish Government statistics].
This area for action is made up of two proposals:
• To increase investment in HR support for micro-businesses to help them
realise job creation potential and growth
• To design and pilot a micro-business academy with FSB/members to help
clients gain the distinctive skills and behaviours that will help them thrive in
a micro-business and contribute effectively:
– Reliability
– Team-work
– Appreciation of demands on business leader
– Flexibility and responsiveness
– Range of skills.
The benefits from this action will be more growing micro-businesses and more
of these recruiting previously unemployed people.

Final Report – Improving employability outcomes Page 42
Rocket Science 2015
Action 4: Strengthening demand led training
There are two proposed actions in terms of demand led training
• To build on the academy approach and good practice in Dundee by:
– Actively coordinating academy approaches across Dundee to create
a more coherent, high quality approach with regular review and
improvement of service design and delivery and a clear consistent
offer for employers.
– Building on existing good practice (eg the Health and Social Care
Academy)
– Developing clear and effective co-design processes with employers.
• The commissioning of an independent ‘finishing school’ which takes all work
ready clients and tests for ‘job readiness’
– Those graduating can be confidently recommended to employers
– Those not graduating will receive detailed, supportive feedback and
personalised development.

Final Report – Improving employability outcomes Page 43
Rocket Science 2015
Action 5: Supporting progression in work
The partners will develop a two strand approach to helping people make
progress in work to more secure, skilled and better paid jobs. This will involve:
· Working with business development staff to develop approaches to businesses in key
employment sectors with a view to helping them enhance their productivity and
competitiveness through staff development.
· Creating a career advancement service (potentially as part of a City Deal with DWP)
which provides one to one support for people in work who wish to make progress to
more secure and better paid work.

Final Report – Improving employability outcomes Page 44
Rocket Science 2015
Action 6: Effective targeting of those furthest from work
The partners will develop a clear and agreed targeting of support. It is proposed
that this will have three components:
• The coordination of Stage 1/2 services in areas of highest unemployment
• Building on current joint asset-based training to create shared team
approach across local services
• Developing client targeting based on risk assessment – using evidence
based tools to identify those particularly vulnerable to long term
unemployment and following up with intensive support early in their
experience of unemployment.
• Exploring opportunities to further enhance the scale and scope of
volunteering, involving:
– The creation of more structured and supported volunteering
opportunities as a stepping stone to work
– The development of volunteers as providers of peer to peer support
within their communities.

Final Report – Improving employability outcomes Page 45
Rocket Science 2015
Action 7: Client co-design of services
We have identified widespread support for the adoption of client co-design of
services and we propose that this take a number of forms:
• Ensuring the client voice is drawn on in service design and delivery
– This is an important part of the established asset-based approach
and will provide clients with the opportunity to engage with service
providers in an ‘expert’ role
– This would apply to the design of the service as a whole, to the
design of individual services within this and to the engagement with
each client
– Client voice approaches would be built into joint staff development
to ensure that the client perspective was actively drawn on in
refining and improving approaches.
Progress in the use of client voice could be checked using the regular client
surveys.
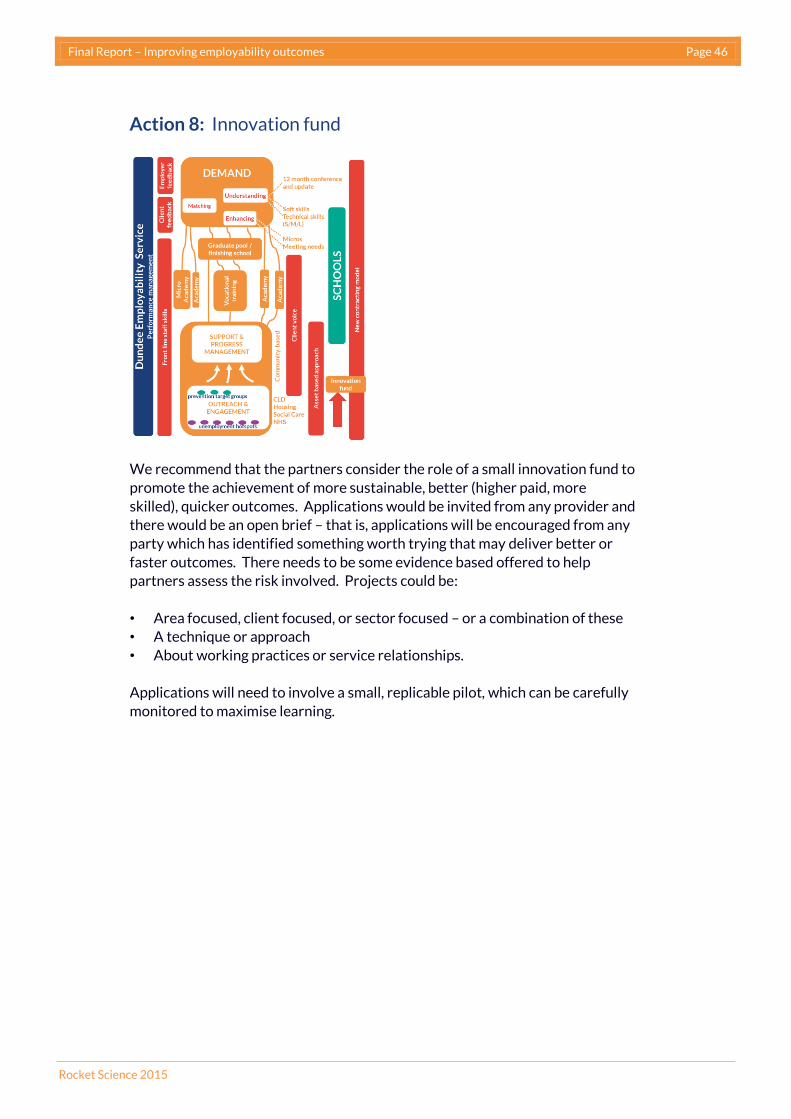
Final Report – Improving employability outcomes Page 46
Rocket Science 2015
Action 8: Innovation fund
We recommend that the partners consider the role of a small innovation fund to
promote the achievement of more sustainable, better (higher paid, more
skilled), quicker outcomes. Applications would be invited from any provider and
there would be an open brief – that is, applications will be encouraged from any
party which has identified something worth trying that may deliver better or
faster outcomes. There needs to be some evidence based offered to help
partners assess the risk involved. Projects could be:
• Area focused, client focused, or sector focused – or a combination of these
• A technique or approach
• About working practices or service relationships.
Applications will need to involve a small, replicable pilot, which can be carefully
monitored to maximise learning.

Final Report – Improving employability outcomes Page 47
Rocket Science 2015
Action 9: Performance management
One of the most important conclusions from our work is the nee d for the
Employability Group to focus on active performance management. This will be
its main role and it will need to involve:
• Transparent reporting by partners:
– What is working well? What is the scope to learn, apply, transfer,
and expand?
– What is not working well? How can this be improved? Should we
stop doing it?
– What do we need to know more about?
– What should we take action on?
• The identification of areas of focus: Where should we drill down into issues
and practice? This work could be done by selected short life working groups
which would be commissioned to investigate and report back on
recommended actions to improve performance to the Employability Group.
• Drawing on the regular Feedback analysis (from both employers and
individual clients) to identify areas for improvement and appropriate action,
timescales and accountability.
•

Final Report – Improving employability outcomes Page 48
Rocket Science 2015

Final Report – Improving employability outcomes Page 49
Rocket Science 2015
Action 10: Preventative action
From our analysis of the routes into long term unemployment as part of our parallel
assignment on preventative action has allowed us to identify a range of appropriate
interventions to enhance the prevention of long term unemployment.
Action 10.1
It would be valuable for the Dundee Partnership present the findings of this research to the
Scottish Government in terms of the implications for the local design and delivery of the
replacement programme(s) for the devolved Work Programme and Work Choice programme
powers and resources, specifically for ESA WRAG clients and their need for a rounded service
involving personalisation and the involvement of a range of existing local mainstream and
specialist services.
Action 10.2
The Dundee Partnership should enter into discussion with Working Links, Ingeus and Triage
as their local subcontractor with a view to designing and piloting more integrated local
responses for those on ESA WRAG being referred into Work Programme.
Action 10.3
The DWP should carry out a local pilot to identify those JSA clients who are at risk of long
term unemployment using the DWP research conclusions (risk assessment model).
In Dundee, between 5 and 10% of all new entrants onto JSA will be unemployed for more than
a year, with their median journey on JSA being 2.5 years in duration. DWP has developed a
risk assessment tool for JSA clients that can be used to predict an individual’s risk of long term
unemployment. It uses logistic regression to develop a scoring system that converts the
answers to the risk factors into a probability that an individual will become long term
unemployed. Further information on the tool is outlined in the best practice chapter of this
report. Many countries use similar tools with proven success.
The DWP model is 33% accurate at predicting the 8% highest risk individuals, and 20%
accurate at predicting the 30% highest risk individuals.6 Interestingly, the model is far more
accurate at predicting those in the lower risk categories. It was 94% accurate at predicting the
8% lowest risk, and 96% accurate at predicting the 30% lowest risk cohort.7
Conversations with DWP staff have identified that use of the model is doable within the
current 40 minute initial meeting, or regular subsequent meetings with their customers, and
would therefore require no additional resources to use. In addition, DWP staff have identified
6Matty, S (2013). Predicting the likelihood of long-term unemployment: the development of a UK jobseekers’ classification instrument. https://www.gov.uk/government/uploads/system/uploads/attachment_data/file/210303/WP116.pdf 7 Ibid.

Final Report – Improving employability outcomes Page 50
Rocket Science 2015
that they are interested in anything that would be able to be used to help Work Coaches
identify the needs of their customers.
We recommend that Work Coaches begin to use this assessment tool with all their JSA clients
in order to identify the 5-10% at risk of long term unemployment and refer these clients to the
Accelerated Job Finding Service.
Using the DWP Risk Assessment Model
The table below is drawn from the DWP working paper on the Risk Assessment Tool and
outlines the accuracy of predicting high and lower risk of long term unemployment for
different groups. For example, if you take the 10% most risky clients in the assessment, then
the accuracy of predicting long term unemployment is 31% and 94% for predicting that the
remaining 90% of clients are at a lower risk of long term unemployment.
The JSCI score indicates that in the national trial, scores above 24 put clients in the ‘10% most
risky’ group.
The DWP Risk Assessment tool predicts long term unemployment with 31% accuracy for the top 10%
of clients
top x% of clients
JSCI score
high risk long term unemployed accuracy
lower risk long term unemployed accuracy
10% 24 31% 94%
20% 14 23% 95%
30% 8 20% 9%
40% 5 17% 98%
50% 3 15% 98%
60% 2 13% 98%
70% 2 11% 99%
80% 1 10% 99%
90% 1 9% 100%
100% 8% -
DWP Risk Assessment Tool accuracy rates at different cut off points [Source: Matty, S (2013). Predicting the likelihood of long-term unemployment: the development of a UK jobseekers’ classification instrument]
The table below applies these accuracy rates to the number of new JSA claimants in Dundee.
With an annual on flow to JSA of 8,076, we expect that between 408 and 804 individuals will
become long term unemployed. Using a JSCI score of 24 or higher would identify the 10%
‘riskiest clients’. In Dundee that equates to identifying 808 as the top 10% riskiest clients, with
the remaining 7,272 having a lower risk. Of those 808 clients, 250 will become long term
unemployed while 558 will not. Of the 7,272 classified as lower risk, 436 will go on to become
long term unemployed. In other words, an additional 558 people are identified as high risk and
436 people turn out to be high risk but are missed.

Final Report – Improving employability outcomes Page 51
Rocket Science 2015
Referring the 10% most ‘risky’ clients will result in 808 referrals to the Accelerated Job Finding Service
per annum
total JSA on flow per annum 8,080
total # expected to become LTU 408-804
top x% of clients # identified as high
risk of LTU # right # wrong # identified as
lower risk of LTU # right # wrong
10% 808 250 558 7272 6836 436
20% 1616 372 1244 6464 6141 323
30% 2424 485 1939 5656 5430 226
40% 3232 549 2683 4848 4751 97
Outcomes of DWP Risk Assessment Tool accuracy in Dundee [Source: Rocket Science analysis drawing on NOMIS unemployment numbers and the DWP Risk Assessment Tool]
We recommend that all JSCI scores above 24 (or the ‘riskiest 10 %’) be referred to the
Accelerated Job Finding Service given that the additional 558 ‘wrongly identified’ will likely
be a higher risk group overall and will have their return to employment accelerated by the
service which derives a fiscal and economic benefit regardless of whether their
unemployment would tip over the 1 year mark.
There are two elements of the model that we suggest are recalibrated on a regular basis,
perhaps annually:
· In the national modelling a JSCI score of over 24 equates to the top 10% riskiest
clients. This may not be the case in Dundee. Therefore the JSCI score that is used to
refer clients to the Accelerated Job Finding Service needs to be adjusted based on
empirical evidence of the number of clients identified and referred in the first year of
the service’s operation
· The top 10% threshold, as testing the use of this model may indicate that to capture
the 5-10% at risk will require looking at the top 20%
· The 5-10% risk of long term unemployment is based on the latest Dundee specific
data. However, this figure should be updated regularly and ideally tested against
alternative prediction methods that use individual-level client tracking data as it will
be influenced by external factors, including the macro economic climate.
Action 10.4
Dundee City Council should develop, as part of the joint City Deal approach and in
consultation with neighbouring Local Authorities, the development and funding of two new
services with the cost allocated in proportion to estimated savings to DWP and Local
Authorities:
An Accelerated Job Finding Service (AJF) for all new JSA claimants at risk of long term
unemployment (as identified through the tool developed using DWP research). Between 5
and 10% of individuals that start claiming JSA will go on to become long term unemployed.
Almost all new ESA claimants will become unemployed long term. Intensive and heavily
Final Report – Improving employability outcomes Page 52
Rocket Science 2015
tailored support provided early in their period of unemployment is likely to reduce their time
out of work. We recommend that the AJF provide the following to clients at risk of long term
unemployment:
· An in depth needs assessment and personalised support plan
· Active one-to-one case management
· The flexibility to provide services in-house, as well as purchase services from other
current providers
· Facilitating engagement for the client across other public sector provision, eg health,
in order to help the client address their barriers to employment
· Services such as confidence and motivation building, mental health support, literacy
and numeracy, and a pre-work finishing school about the norms and rights of
employment.
While bespoke pathways will be developed for each client to reflect their individual needs, we
have identified several themes of services that are likely to be required, but are not provided
in sufficient quantity presently:
· Guidance to ex-offenders on when and how to discuss their criminal record with
potential employers
· Confidence and motivation building – particularly for ESA clients
· Literacy and numeracy – we understand that the current provision is regarded as high
quality, but insufficient in quantity for the level of demand
· A pre-employment finishing school in order to provide clients with an understanding
of their employment and in-work benefit rights and the norms of employment.
We envisage that the criteria for referral into this programme will be:
· All ESA WRAG clients
· All JSA clients identified as high risk of long term unemployment by DWP Work
Coaches, using the DWP risk assessment tool.
A Career Advancement Service (CAS) for clients at risk of returning to unemployment. All AJF
clients and others flagged by service providers as at risk will be eligible for this service which
would include:
· Mentoring of individuals for financial management, employment rights and norms
· In-work progression advice and training
· Practical in-work support to manage the transition to employment, eg childcare advice
and support

Final Report – Improving employability outcomes Page 53
Rocket Science 2015
· For clients that move into short term or seasonal employment, ongoing support to find
more sustainable employment when their current employment ends.
We envisage that the criteria for entry would be:
· Anyone that participated in the EAS scheme deemed to benefit from the service by
their EAS case manager
· Anyone flagged by other service providers, eg DWP or Skills Development Scotland.
Both these services should be taken forward focusing on those most in need of such support.
We estimate the following demand for these services, but the scale of the service will need to
be tailored to the resources available:
o Accelerated Job Finding Service – c800 new JSA clients per annum
o Career Advancement Service – c1,400 JSA claimants per annum and a
currently unknown number of ESA claimants per annum.
We recommend that these two services be contracted as one contract in order to enable a
seamless service that is big enough to achieve economies of scale and service provision
flexibility and tailoring for individual needs.
In order to develop and cost the services in the contract, we recommend that the Dundee City
Council engage with several of the larger employability service providers in order to inform
their contract design and costings.
Action 10.5
The Dundee Partnership should explore with Healthy Working Lives the scope to:
· Enhance local support provision around health at work for employers and employees
· Enhance local promotion of existing support.
About half of ESA new entrants are coming from a period of employment, almost all of whom
will remain out of work for more than one year. Most attribute illness or disability as the
reason for leaving work.
It is clear that health at work is an issue. Supporting individuals to manage health conditions in
employment, and ensuring that there are healthy working environments, is likely to reduce
the number of individuals in Dundee moving onto ESA.

Final Report – Improving employability outcomes Page 54
Rocket Science 2015
Action 10.6
The Developing Young Workforce Regional Group should:
· Develop a school/employer engagement approach that includes public sector and
SMEs given that 32.5% of employment in Dundee is in the public sector, just over 20%
are in businesses with less than 50 employees, and another 10% are in businesses with
50-249 employees.
· Develop appropriate KPIs related to this approach
· Provide appropriate support and structures to help small businesses (those employing
fewer than 10 people) to engage with schools - and schools engage with small
businesses, given the fact that engagement with smaller businesses requires
proportionately more time and resources for both schools and smaller businesses than
for larger businesses
· Help those schools in the highest unemployment (and lowest local business) areas
work collaboratively with other schools to gain access to small business opportunities
· Develop a range of ways of including teachers in small business and public sector
engagement approaches
· Consider how best to use the agreed labour market analysis to be produced by the
LEP – in terms of:
o Use by teachers in developing Curriculum for Excellence
o Use by pupils and teachers/SDS advisers in focusing and refining career
choices
o Use by parents in supporting their child’s decision making
o Use by schools in targeting their business engagement approaches.
Action 10.7
Members of the Dundee Partnership should actively engage with schools as employers as part
of the Developing Scotland’s Young Workforce agenda given they represent 32.5% of Dundee
employment.
Action 10.8
Dundee City Council should engage with the Scottish Government to identify ways of
restoring ERI support routes to work for those young people at risk of NEET, or including this
group in the eligibility criteria for the replacement programme(s) following the end of Work
Programme and Work Choice.
Action 10.9
Dundee City Council should do further work to detail the specific scale and cost of
interventions with the four identified priority groups and the estimated savings to DWP (in
terms of reduced benefit payments) and savings to other partners. These should be used as
the basis of a City Deal proposal.
Final Report – Improving employability outcomes Page 55
Rocket Science 2015
Many of the recommendations we have made will incur marginal costs to parties in terms of
time. The two recommendations that are likely to incur cost are:
· Contracting a specialised Accelerated Job Finding service that supports those JSA
claimants identified at risk of long term unemployment.
· Career Advancement Service offered for those deemed eligible.
In order to develop and cost the services in the contract, we recommend that the Dundee City
Council and DWP engage with several of the larger employability service providers in order to
inform their contract design and costings.
We recommend that the Accelerated Job Finding Service, Career Advancement Service and in
work health support services be partly funded by parties apportioned in a way that reflects
the likely savings they will make from reducing the duration and incidence of unemployment
in Dundee.
This means that DWP should pay the largest share of the cost of the new services given they
will accrue savings from both:
· Reduced future benefit payments
· Reduced client work load for Jobcentre Plus as the high risk clients are referred to the
Accelerated Job Finding Service.

Final Report – Improving employability outcomes Page 56
Rocket Science 2015
7 Practical action required
The practical response to this new service design takes three main forms:
· Setting up seven short life workstreams which will draw on local skills and experience
and work to a brief produced by Rocket Science to design in detail the practical ways
forward in ways that will be fully owned by all the relevant partners.
· Action by the Council to maximise its own employability footprint
· Action by the Council in its strategic leadership role.
In this section we set out the proposed way forward under each of these
headings.
The seven workstreams
The activities described above can be grouped into 7 workstreams. We are
proposing that short life cross organisational workstreams be established to
work to briefs that we will produce. They will be able to call on our support as
needed, but the main purpose will be to develop highly practical action plans to
take forward the action set out above and are widely owned by the partners.
Working Group 1: Labour market intelligence
Workstream Relevant action Lead: partners
1: Labour Market
Intelligence
Action 1: Transforming the
quality and value of labour
market intelligence
SDS: DCC, DWP/JCP,
Business Gateway, TSI
Action 1: School/employer
engagement to enhance pupils
career decisions and
awareness of opportunities
DYW Regional Group
Final Report – Improving employability outcomes Page 57
Rocket Science 2015
Working Group 1 Brief: The working group will identify the practical ways in
which information and insight can be collected, analysed, interpreted and
presented in ways which are useful by the full range of users across Dundee
including:
Career Guidance staff in schools
Other teachers, pupils and their parents/carers
SDS staff working with young people
Other DCC staff (youth workers, adult learning staff etc)
JCP advisers
Training providers
Employability project staff.
The group will make detailed recommendations about:
The target audiences for the information and the best form of the
information and intelligence for each of them
How to build on the Regional Skills Assessment and add to it using local
data
Gather insights from all those working with employers – and ensure all
of them are geared up to spot cues about current and emerging
recruitment and skill needs and asking appropriate questions. This
could take the form of an annual conference. These people will include:
o Scottish Enterprise Account Managers
o Business Gateway staff
o SDS staff working with businesses
o FSB and Chamber of Commerce
o JCP advisers
o Employer engagement staff at Dundee and Angus College, DWP
o Relevant employability project staff who are engaging with
employers.
How to combine data and insights into easily accessible and useable
information for each of the target audiences, how to get this to them and
how often it should be updated.

Final Report – Improving employability outcomes Page 58
Rocket Science 2015
Working Group 2: Demand led approaches
Workstream Relevant action Lead: partners
2: Strengthening the
demand led approach
Action 3 Realising the
employment potential of
micro-businesses
Rocket Science
Action 4: Strengthening the
demand led approach
DCC: Business Gateway,
FSB, Chamber of
Commerce
Working Group 2 Brief: The working group will identify ways of enhancing the quality of the
match between client skills, aptitudes and habits and the needs of employers.
They will do this by:
Identifying the scope to build on current academy approaches (eg expanding the
leading practice approach of the Health and Social Care Academy), the skills/sectors
where this may be appropriate and how these approaches could be funded
Identifying the elements of effective academy design and practice and using this to
create a clear and succinct design guide for academy approaches
Creating a way of ensuring that the partners and providers are working together to
ensure a coherent and coordinated academy approach that is clear to employers
Identifying the features of a short ‘finishing school’ model which will ensure that the
partners are confident that all clients who are presented to employers by partners are
job ready as well as work ready and can be effective contributors from their first day.
This experience will include:
o Work routines and disciplines
o Work structures – working in teams and with supervisors
o Dealing with difficult colleagues and supervisors
o Managing the first weeks in work – contracts, money, child care, travel.
Identifying costs, funding sources and appropriate contracting procedures.

Final Report – Improving employability outcomes Page 59
Rocket Science 2015
Working Group 3: Neighbourhood action for those distant from work
Workstream Relevant action Lead: partners
3. Integrating services
for those furthest from
work
Action 6: Effective targeting
of those furthest from work
Action 7: Client co-design of
services
DCC: NHS, DWP/JCP, TSI
Working Group 3 Brief: The working group will identify ways of delivering a neighbourhood
integrated service for those furthest from work – but on their journey towards work. This will
involve:
Identifying services/staff who are in touch with those who are furthest from work in a
neighbourhood setting
Identifying the extent to which they currently see themselves as part of an
employability service – and:
o If they do, what they feel they need to help them in this role: in terms of
assessing immediate support needs and appropriate referrals
o If they don’t what will help them play this role and consider not just their own
service contribution but how their client can be helped start their journey to
work
Identifying the current scale and scope of volunteer engagement with those furthest
from work and how this can be integrated into the wider local service
Identify the scale of current volunteering opportunities available to clients as part of
their progress to work and the potential for expanding this
Considering the scope for more local ownership of the neighbourhood based service
involving local people and clients in its design, improvement and management
Identifying the issues that get in the way of more a service which is more integrated
and progressive for clients and how to tackle these.
This task may best be done in one neighbourhood on a pilot basis.
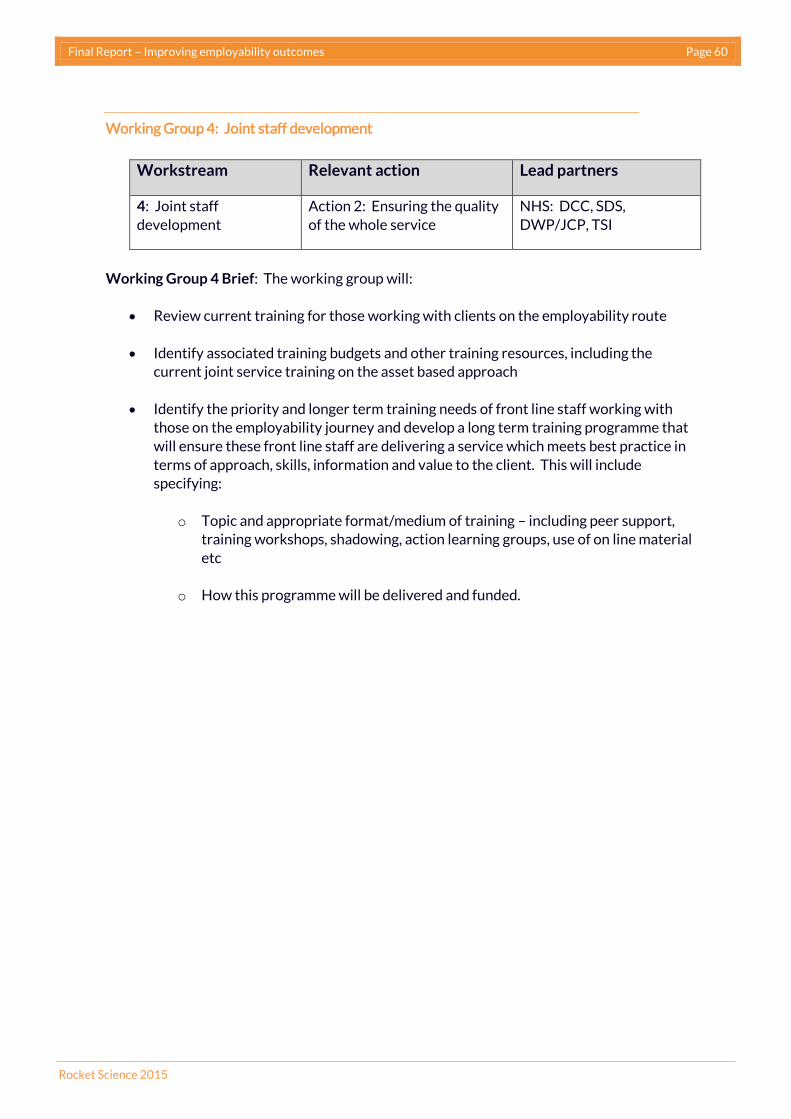
Final Report – Improving employability outcomes Page 60
Rocket Science 2015
Working Group 4: Joint staff development
Workstream Relevant action Lead partners
4: Joint staff
development
Action 2: Ensuring the quality
of the whole service
NHS: DCC, SDS,
DWP/JCP, TSI
Working Group 4 Brief: The working group will:
Review current training for those working with clients on the employability route
Identify associated training budgets and other training resources, including the
current joint service training on the asset based approach
Identify the priority and longer term training needs of front line staff working with
those on the employability journey and develop a long term training programme that
will ensure these front line staff are delivering a service which meets best practice in
terms of approach, skills, information and value to the client. This will include
specifying:
o Topic and appropriate format/medium of training – including peer support,
training workshops, shadowing, action learning groups, use of on line material
etc
o How this programme will be delivered and funded.
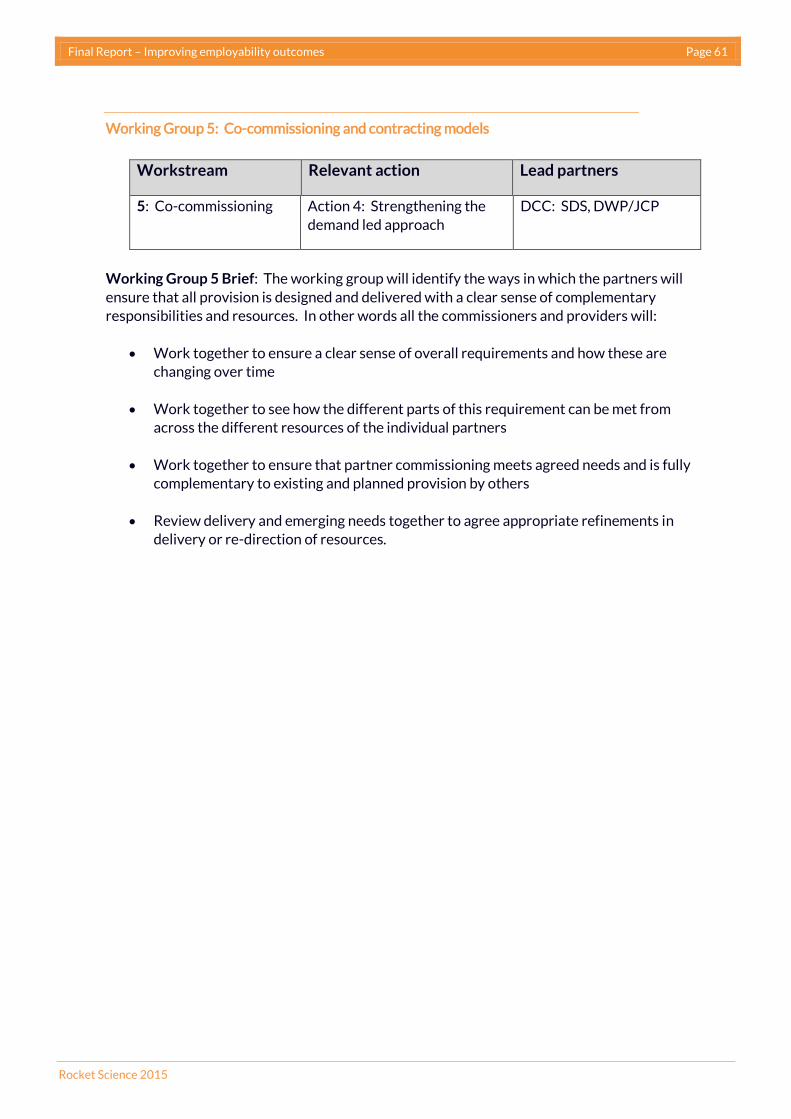
Final Report – Improving employability outcomes Page 61
Rocket Science 2015
Working Group 5: Co-commissioning and contracting models
Workstream Relevant action Lead partners
5: Co-commissioning Action 4: Strengthening the
demand led approach
DCC: SDS, DWP/JCP
Working Group 5 Brief: The working group will identify the ways in which the partners will
ensure that all provision is designed and delivered with a clear sense of complementary
responsibilities and resources. In other words all the commissioners and providers will:
Work together to ensure a clear sense of overall requirements and how these are
changing over time
Work together to see how the different parts of this requirement can be met from
across the different resources of the individual partners
Work together to ensure that partner commissioning meets agreed needs and is fully
complementary to existing and planned provision by others
Review delivery and emerging needs together to agree appropriate refinements in
delivery or re-direction of resources.
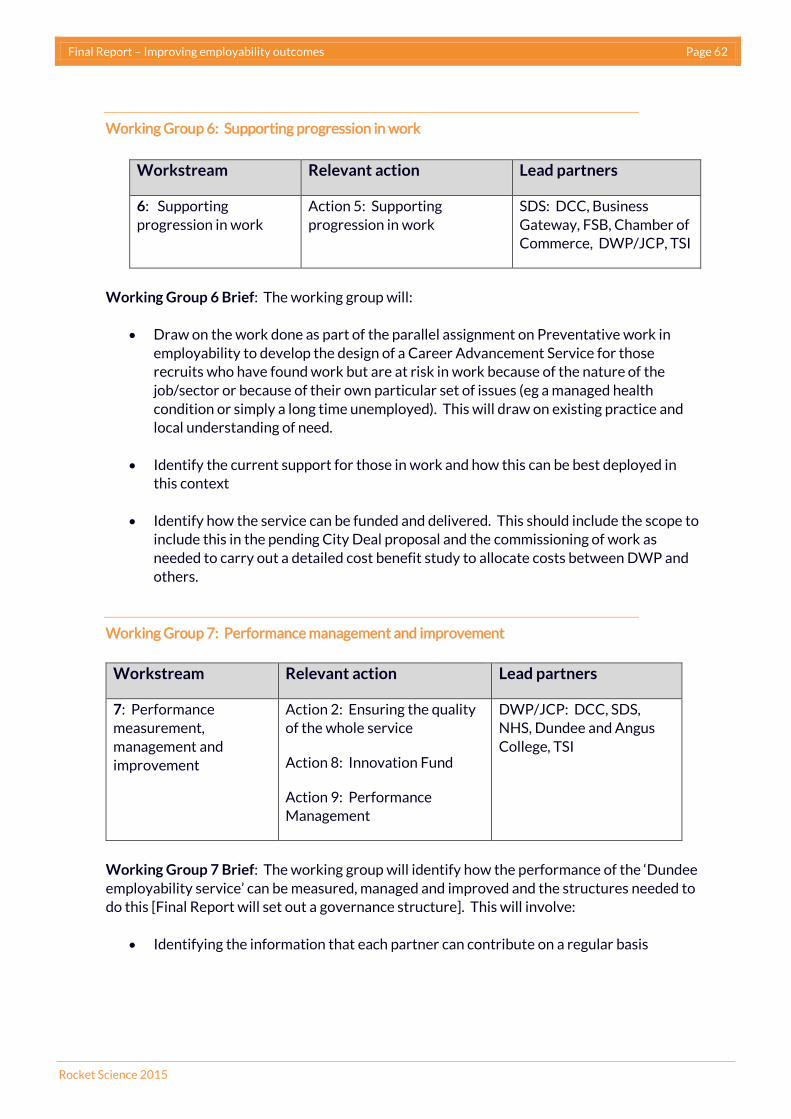
Final Report – Improving employability outcomes Page 62
Rocket Science 2015
Working Group 6: Supporting progression in work
Workstream Relevant action Lead partners
6: Supporting
progression in work
Action 5: Supporting
progression in work
SDS: DCC, Business
Gateway, FSB, Chamber of
Commerce, DWP/JCP, TSI
Working Group 6 Brief: The working group will:
Draw on the work done as part of the parallel assignment on Preventative work in
employability to develop the design of a Career Advancement Service for those
recruits who have found work but are at risk in work because of the nature of the
job/sector or because of their own particular set of issues (eg a managed health
condition or simply a long time unemployed). This will draw on existing practice and
local understanding of need.
Identify the current support for those in work and how this can be best deployed in
this context
Identify how the service can be funded and delivered. This should include the scope to
include this in the pending City Deal proposal and the commissioning of work as
needed to carry out a detailed cost benefit study to allocate costs between DWP and
others.
Working Group 7: Performance management and improvement
Working Group 7 Brief: The working group will identify how the performance of the ‘Dundee
employability service’ can be measured, managed and improved and the structures needed to
do this [Final Report will set out a governance structure]. This will involve:
Identifying the information that each partner can contribute on a regular basis
Workstream Relevant action Lead partners
7: Performance
measurement,
management and
improvement
Action 2: Ensuring the quality
of the whole service
Action 8: Innovation Fund
Action 9: Performance
Management
DWP/JCP: DCC, SDS,
NHS, Dundee and Angus
College, TSI
Final Report – Improving employability outcomes Page 63
Rocket Science 2015
Identifying how the partners will work together to:
o Collate and interpret this information
o Use it to identify performance issues.
o Use it to pinpoint areas for more intensive research in order to understand
what lies behind low performance in a particular area/service/client
group/activity.
Identifying the way in which partners will be accountable for subsequent action and
responses to performance issues
Designing systems to gain regular insights into both individual experience of the whole
service and employer experience of engagement with the service and the quality of
recruits gained from the service.
Action by the Council to maximise its own employability footprint
We explored with different service areas across the Council the extent of the Council’s
current contribution in terms of employability (the Council’s ‘employability footprint’) and on
the basis of this have identified the main areas where there seems to be scope for further
enhancing this footprint. Other partners may have been through a similar process to ensure
they are realising their potential in terms of their ‘employability footprint’.
Overall, our view is that the current footprint is commendable and ahead of many other
Councils which we have reviewed.
Working with staff we have identified scope for further action in four areas:
The Council as an employer. The Council is involved in providing a range of
opportunities for young people, including MAs, work experience and the
limited use of staff as mentors and there are a number of examples of good
practice. There is a clear recognition that there is scope to do more in all
these areas. However, we recommend that this should be taken forward on
a much more significant scale as part of an initiative by a wide range of
employers across Dundee, with strategic leadership being provided by the
Council and with a specific focus on joint work with NHS Tayside. By taking
it forward in this way it will provide a much wider range of opportunities, an
array of pathways through the different types of experience that can be
provided by a wider range of employers, and a more effective way of
engaging with schools and the College.
The Council as a provider of housing. The Council holds a significant
housing stock and many of the priority clients of an employability service
are tenants of the Council. The housing service is thinking hard about ways
of providing support to its tenants to help them make progress to and
through work and have identified a number of areas for further

Final Report – Improving employability outcomes Page 64
Rocket Science 2015
development. There is scope to do more, particularly in terms of further
developing the role of housing officers and supporting tenants through their
transition to work. In the next stage of our assignment we will be working
with them to refine these ideas and develop some practical ways forward.
The Council as a provider of key services for priority clients. The Council
runs many of the services that support those furthest from work, in other
words the services that are relevant at Stages 1 and 2 of the pipeline. We
have heard from these services a consistent view that there is scope for
greater local integration and the need for this to be supported by facilities
which can support integrated service delivery. These services are not all
owned by the Council, notably health services and some third sector
provision, and there is a need for wider integration to meet the distinctive
needs of different individuals, families and neighbourhoods. The main
opportunities are to do with:
o Joint staff training, particularly in terms of further strengthening and
deepening the asset based approach
o Improved systems of shared assessment, referral and progression
management
o The development of joint service centres
o The development of skilled volunteers to provide the scale of one to one
support needed.
Behind this lie a range of issues which need to be explored as part of this
agenda: notably around the scope for helping individuals gain the insights
and techniques to support their own progress – and how to draw on
community based support and insights to help them on their journey.
The Council as a funder/commissioner of DCC/ESF supported services.
The Council faces some imminent decisions about the focus of Council/ESF
supported services. The proposed service design provides a basis for this in
terms of helping the Council identify:
o Areas where there is a need to complement or supplement current
services by others.
o Areas which other funders are unable to fund because of the constraints
around their funding.
o Areas where current approaches appear to be working and which can be
scaled up or rolled out.
The timing is not straightforward because during the current funding round
an entirely new approach in terms of the successor programme to Work
Programme/Work Choice will be starting (in April 2017). Because of this
there is some appeal in continuing the current funding pattern for a year.

Final Report – Improving employability outcomes Page 65
Rocket Science 2015
However, there does appear to be scope to develop a focus on:
o Those who are emerging from 2 years on Work Programme with no job,
and particularly men over 50.
o Those who are identified as at risk of long term unemployment.
o The development of an ‘academy’ based approach targeted at micro-
businesses.
It is likely that the proposed ‘Scottish Approach’ being developed by the
Scottish Government will have similar features to that presented by DWP –
that is, a focus on those more than 2 years unemployed and/or facing health
barriers to work. This has two important implications:
The need for the partners to develop an integrated approach to those
furthest from work so Dundee is well positioned to gain maximum
benefit from the successor programme.
The scope to develop a focus on those unemployed for more than 12
months – most of whom subsequently become 2 years unemployed.
The Council as a strategic leader
We have identified four areas where it is important for the Council to play a
strategic leadership role:
The service design that has been developed has important implications
in terms of physical infrastructure and staffing. We have set out above
both the significance of the trend for greater service integration and
alignment and the implications this has for neighbourhood service
centres. These will provide the base for much of the support for clients
at Stage 1 and 2 of the pipeline. For those at Stage 3 and beyond, it will
be important that the service is delivered close to where the main job
opportunities are – as part of helping clients develop the skills and
routines needed for them to gain and make progress in work. In a
compact city like Dundee it makes sense therefore for Stage 1 and 2
services to be placed within neighbourhoods and Stage 3, 4 and 5
services to be provided close to work opportunities, so a city centre
location makes sense for the latter range of services. Given the current
pressure on a range of relevant providers there does seem to be scope
for some ambitious thinking in terms of the co-location of Stage 3, 4 and
5 services in the city centre. Although the Wellgate JCP office is the
largest in Scotland there is little or no scope for co-locating other
services there. Given the pressures on the JCP estate we believe it
would be worth discussing with DWP the scope to develop a new centre
together with a range of related services, in particular those of SDS,
Final Report – Improving employability outcomes Page 66
Rocket Science 2015
relevant Council services and possibly with space for a range of training
activities (eg the proposed ‘finishing school’).
The development of a city wide approach to providing a range of
opportunities and support for those seeking work. While it might be
possible for the Council to, say, double the current number of MAs
through its own employment, our view is that this would miss a larger
opportunity. This would be to develop a much more widely owned
approach among a range of city based employers and using this to create
a wide range of different pathways which may involve two or more
employers. The Council is well placed to provide the leadership to drive
this initiative and in our next stage we will be articulating clearly the
scope for this and what it could involve.
The existence of two universities and a strong FE College provides the
city with a great opportunity to draw on good practice elsewhere in
terms of engagement both with schools and the most deprived
communities to create new skills, confidence and aspirations. There may
be scope, for example, to work with Glasgow Caledonian University who
are working in a unique way with communities in North Glasgow as a
supporter and service provider rather than just widening access to the
University as a destination.
Finally, there are some powerful new approaches being developed to
data management through the holding of ‘personal data stores’ by
individuals. This turns data management issues on their head – in other
words, instead of individual data being held by service provides (eg by an
array of employability, health and care services) it is held by the clients
themselves and it is they who provide access to it by service providers.
This transforms the problems around data sharing between
organisations and would support, for example, common assessment and
progress management approaches. DWP have created a framework for
client focused data piloting and are committed to contributing their own
data to this that NHS and a range of other services (including charities)
are signed up to pilots in other areas. DWP are now keen to see one or
two personal data pilots in Scotland and they are currently talking to
Glasgow City Council about this. There is definitely scope to have a pilot
in Dundee and this would be entirely consistent with the strong asset
based approach that exists at Stage 1 and 2 in Dundee.
Final Report – Improving employability outcomes Page 67
Rocket Science 2015
The opportunities provided by City Deal
The proposed City Deal being put together by the Council with adjacent
Councils provides a vital opportunity to support the new service design by
proposing some significant changes by DWP. Our discussions with and
involvement in other City Deals and our awareness of the flexibility now being
displayed by DWP suggests that there are three ‘asks’ of DWP that should be
included in a City Deal proposal:
The scope for JCP staff to become part of an ‘asset based’ approach.
There have been a number of initiatives in the past which have enabled
JCP advisers to become part of a wider service team and this has always
resulted in an enhancement of their value to clients. Particularly at a
time of heavy and often counter-productive use of sanctions it would be
worthwhile to propose that JCP staff provide their support in a way
which is consistent with the asset based approach, and become part of
the joint service training around this approach.
The development of a career progression service. This is already an
explicit part of some other City Deal proposals and it is highly likely that
a strong proposal for a dedicated one-to-one service to help those who
have found work to make progress to higher skills and higher earnings
would be supported.
A more substantial form of intensive support for those emerging from Work
Programme along the lines of the ‘Working Well’ approach being pioneered by
Greater Manchester with DWP support.
The development of a significant early identification effort to identify those newly
unemployed or entering the labour market who are most at risk of long term
unemployment and for whom early intensive support will be likely to at worst
accelerate job finding and at best prevent long term unemployment with its
associated personal and benefit costs. We are developing the detail of such an
approach in our parallel assignment on the preventative agenda in employability in
Dundee.
Final Report – Improving employability outcomes Page 68
Rocket Science 2015
An aspiration to deliver a world class employability service
Based on our analysis and interviews, our judgement is that, given the good
practice that exists and the commitment to transform the quality of the service,
it is entirely reasonable for the partners to aspire to deliver a service which is on
a par with the world’s best. A world class service would be characterised by:
The availability of up to date, relevant and accurate insights into the
current and emerging needs of employers, and all partners drawing on
this to create support which provides clients with opportunities to
match their skills, aptitudes and aspirations with real opportunities in
the labour market.
The existence of highly skilled and experienced staff working with those
furthest from work to provide them with long term support along a
bespoke pathway to and through work.
The use of regular insights from providers and from employers and
clients to identify the scope for improvement in service design and
delivery and active responses to this to tackle any issues arising. Clients
and employers would both provide evidence for their experience as
being highly relevant, based on their specific needs and achieving their
own objectives.
The active management of the whole service by all the partners, leading
to outcomes showing consistent improvement both in terms of work
placements and progression to sustainable ‘Fair Work’ opportunities.
In the next Chapter we develop this benchmark and assess the extent to which
the current service matches up to it – and propose some key indicators that the
partnership can use to assess progress towards this world class status.
Final Report – Improving employability outcomes Page 69
Rocket Science 2015
8 Towards a world class service
In the matrix overleaf we build on our diagnosis to create a matrix setting out the main
features of a world class employability service, together with our initial assessment of
current status of the ‘Dundee employability service’ on each of these.
The 7 working groups will develop practical recommendations which will help the
partners make rapid progress on a number of these. When the Working Groups report
we recommend that the partners set out their intended position on this matrix for the
end of 2016.
We also set out a small number suggested key performance indicators. These would
complement the partners assessment of progress using the matrix and taken together
these will provide the partners with a real feel of how much progress is being made and
where the main development priorities should lie.

Final Report – Improving employability outcomes Page 70
© Rocket Science UK Ltd 2015
Towards a world class employability service in Dundee
Service feature Few or no
aspects of
feature in
place
Some
aspects in
place
Most
aspects in
place
All aspects
securely in
place
Notes
Strong commitment by public partners and employers to creating outstanding
employability service with exceptional performance
Clear leadership of and accountability for the ‘employability service’
Strong demand led approach, engaging with employers in terms of needs,
performance and service design
Supply – of support and training – closely linked with demand
All partners using shared high quality shared intelligence – regularly refreshed -
on current and future employer requirements
Explicit recognition by partners and staff of priority of employability
Highly accessible neighbourhood support centres with co-located services
covering most client support needs
High quality shared assessment process with agreed referral protocols
Strong asset based approach to client assessment and engagement adopted by
all those working with clients and all staff skilled in approach
Personalised pathway to and through work
Later stages of pathway explicitly related to specific job opportunities and
gaining the soft skills needed to thrive in work
Services designed with clients (individuals and employers)

Final Report – Improving employability outcomes Page 71
Rocket Science 2015
Service feature - continued Few or no
aspects of
feature in
place
Some
aspects in
place
Most
aspects in
place
All aspects
securely in
place
Notes
Managed multi-service approach to meeting individual needs – particularly for
those distant from work
Experienced front line staff with high quality development programme shared
across main services
Staff of all services engaging with those distant from work have strong
appreciation of their employability role
Active management of performance including identification of areas of weakness
and actions to deal with these
Performance management informed by regular systematic feedback from
employers and individual clients
Comprehensive support for those at work – particularly those vulnerable to job
loss and lack of career progression
Emphasis on identifying/supporting those at risk – of becoming unemployed, of
becoming long term unemployed, and of losing their job or not progressing in
work
Clear alignment of funding from different partners and sources to support a
coherent service
Clear integration of national employment programme in local delivery and
support system
Effective in work support service helping those vulnerable to job loss to continue
in work and make progress – particularly those with disabilities and mental
health issues
Final Report – Improving employability outcomes Page 72
© Rocket Science UK Ltd 2015
Our suggested key performance indicators (KPIs) are based on the main features of the
approach:
A focus on those furthest from work – so there is a measure of the extent to which the
number of clients in the most vulnerable group (ie ESA WRAG) is reducing.
Ensuring a strong focus on understanding and responding to the needs and situation of both individuals and employers. This would be measured using the satisfaction level
from the systematic feedback being collected from both individual clients and
employers.
The development of a strong demand led focus – so there is a final KPI which explores
the proportion of recruits at Stage 4 of the strategic skills pipeline who have been on a
demand led experience (ie ‘finishing school’ or academy).
Finally, the development of a strongly preventative approach – which we suggest is
measured by the numbers of those reaching 12 months of unemployment.
So our recommended KPIs are:
The number of those in the ESA WRAG group – with the objective of achieving a year
on year reduction – the scale of the intended reduction to be agreed by the partners
on an annual basis.
A high and increasing satisfaction level from both employers and individuals as
follows:
Employers: Are you satisfied with the quality of recruits you have gained from the
Dundee Employability Service and the extent to which they meet your needs?
Initially 60% rising to 90% in year 3, to be agreed by the partners. In practice it will
be difficult to set a planned level until the first round of feedback establishes the
current feedback.
Individual clients: Are you satisfied with the support you received in terms of how
it helped you get a job? Initially 60% rising to 80% in year 2, to be agreed by the
partners. In practice it will be difficult to set a planned level until the first round of
feedback establishes the current feedback.
The proportion of priority clients at Stage 4 who are on or have experienced directly
demand led support – ie an academy experience or a ‘finishing school’. It should be
possible to establish the current level and the partners should set themselves
demanding year on year targets, with a view to achieving a level of c90%.
Finally, the proportion of those joining ESA WRAG and JSA who reach 1 year
unemployment. Based on the current benchmark the partners should be aiming at a
year on year reduction.
Final Report – Improving employability outcomes Page 73
Rocket Science 2015
9 Conclusions and recommendations
There are seven main features of a new approach to employability in Dundee which will lead
to improved outcomes:
Creating a coherent design for a city wide ‘Dundee Employability Service’ which
incorporates the services of all organisations and providers and assesses performance
on both the outcomes achieved and the experience of both the employer and the
individual client. This will provide the partners with a way of pinpointing the
interventions needed to improve performance. The premise behind this service
design is that all the partners in Dundee need to work closely together to create a
coherent and progressive service which understands and responds to the needs of
each individual client and to the needs of employers. One of the ways of helping
partners assess the coherence and performance of this all-organisation service will be
to collect and analyse regular feedback from both employers and individual clients.
We have placed a detailed understanding of the labour market at the heart of this new
design. This will draw on both current data and a wide range of existing engagements
with employers. There will be a shared interpretation of this information and an
understanding of the main areas of demand will infuse every part of the service and so
contribute to better decision making by school pupils and those seeking work, an
improved match between training and employer needs, and a better match of recruits
with vacancies.
Reframing the current ‘Dundee Pipeline’ from being mainly a way of contracting and
monitoring a part of employability resources in Dundee (DCC/ESF funding) to being a
framework for all employability resources. This will provide the Local Employability
Partnership (Employability Group) with a practical way of understanding:
o The current array of services and resources, how well they complement each
other and where the gaps and overlaps are
o Where each provider and their services fits in and who they need to relate to
perform effectively
o What the current resource distribution is like and how this may need to change
o Where the strong and weak points are in terms of performance and what
needs to change to improve performance.
Focusing the Employability Group on the active management of the performance of the
whole service. All the main agencies and providers will report on their performance to
this group in an open and transparent way, highlighting areas of good and weaker
performance. The partners will work together to identify actions to respond to areas
of weaker performance, responsibility for action and how they will assess whether the
response has produced the required improvement.
Final Report – Improving employability outcomes Page 74
Rocket Science 2015
Ensuring that the actions of each partner on service design, delivery and commissioning are carried out collaboratively to ensure that individual services make up a
comprehensive and coherent whole.
Creating a shared Dundee wide approach to the development of a wide range of work experience and job placements which provide either destinations or stepping stones to
permanent jobs for those seeking work.
Using a preventative approach to service design, targeting and delivery by identifying and prioritising those at risk of long term unemployment.
Dundee is not starting from scratch – we have identified a wide range of good practice and
some of the actions we recommend are about learning from these and scaling them up or
transferring them elsewhere.
Within the proposed service we have identified the following areas for action and we describe
these in this report. These actions can be summarised as follows:
Improving the understanding of the current and emerging labour market and infusing
all parts of the employability service with this shared source of reliable insight and
intelligence. This will combine existing data sources with a wide range of insights
drawn from those working with employers across Dundee, mainly through an annual
workshop of all relevant staff. This should lead to:
o Improved decision making by pupils
o Improved match between advice/training and the market
o Improved match between recruits and employer needs
o Employers more confident of finding the right staff – more jobs?
o Greater likelihood of sustainability in work
Creating a ‘whole service’ focus in terms of performance management. The
Employability Group will be supported in its performance management role by regular
independent telephone surveys of employers and individual clients to gain feedback
on their experience of the service.
For employers this will explore:
o The quality and responsiveness of service
o The quality and match of recruits
o Any scope for improvement.

Final Report – Improving employability outcomes Page 75
Rocket Science 2015
For individual clients this will explore:
o The quality and responsiveness of service – did it understand and respond to
your specific situation and needs?
o The extent to which a clear pathway for progress was developed and agreed?
o The extent to which clients felt in charge of their progress?
o The extent to which they have had the support they needed along the way?
o Have they gained a job and to what extent does it match their skills and
aspirations?
Recognise the significance of micro businesses (employing less than 10) by:
o Increasing the investment in HR support for micro-businesses to help them
realise job creation potential and growth
o Piloting a micro-business academy with FSB/members to help clients gain the
distinctive skills and behaviours that will help them thrive in a micro-business
and contribute effectively:
Reliability
Team-work
Appreciation of demands on business leader
Flexibility and responsiveness
Range of skills.
o Working with the FSB to help micro business owners further strengthen their
management skills with the aim of enhancing business performance.
o Exploring ways of helping micro businesses to engage with schools to promote
the value of enterprise and the appeal of working in a smaller business – and
the skills required to thrive in this employment.
Strengthening the match between recruits and employer demand by
o Building on academy approach and good practice in Dundee:
Coordinating academy approaches
Creating a strong ‘Dundee approach’ to academy design, delivery and
performance through co-design with employers and the regular review
and adoption of learning to ensure a best practice model.
o Pioneering an independent ‘graduate school’ which takes all work ready clients
and tests for ‘job readiness’ to refine the match between recruits and the needs
of employers:
Those graduating can be confidently recommended to employers
Those not graduating will receive detailed, supportive feedback and
personalised development.
Final Report – Improving employability outcomes Page 76
Rocket Science 2015
Supporting progress in work by the creation of a career advancement service and by
working with businesses in key sectors to improved productivity and skills, so
providing opportunities for progression to more secure and higher paying jobs.
Ensuring a strongly targeted approach – at those individuals most vulnerable to long
term unemployment and those areas which have the highest unemployment – by clear
and agreed targeting of support:
o Improving the coordination of Stage 1/2 services in areas of highest
unemployment
o Building on current joint asset-based training to create a shared team
approach across local services
o Targeting clients based on risk assessment – those particularly vulnerable to
long term unemployment or at risk of losing their job.
Using a preventative approach to service design and delivery as part of the strongly
targeted approach above by:
The Dundee Partnership:
o Exploring with Healthy Working Lives the scope to enhance local support
provision and its promotion around health at work for employers and
employees
o Entering into discussion with Working Links, Ingeus and Triage as their local
subcontractor with a view to designing and piloting more integrated local
responses for those on ESA WRAG being referred into Work Programme
o Engaging with schools as employers as part of the Developing Scotland’s
Young Workforce
o Presenting our prevention research findings to the Scottish Government in
terms of the implications for the local design and delivery of the replacement
programme(s)
Dundee City Council:
o Developing and fund two new services (Accelerated Job Finding Service and
Career Advancement Service) with the cost allocated in proportion to
estimated savings to DWP and Local Authorities
o Engaging with Scottish Government to identify ways of restoring ERI support
routes to work for those young people at risk of NEET
o Doing further work to detail the specific scale and costs of interventions with
the four identified priority groups and the estimated savings to partners as the
basis of a city deal
The Developing Young Workforce Regional Group:
o Developing a school/employer engagement approach, KPIs and appropriate
support that enables the public sector and SMEs to participate
o Helping those schools in the highest unemployment (and lowest local business)
areas work collaboratively with other schools to gain access to small business
opportunities
Final Report – Improving employability outcomes Page 77
Rocket Science 2015
o Developing a range of ways of including teachers in small business and public
sector engagement approaches
o Considering how best to use the agreed labour market analysis to be produced
by the LEP.
And DWP:
o Carrying out a local pilot to identify those JSA clients who are at risk of long
term unemployment using the DWP risk assessment tool.
Ensuring the availability and quality of front line support by:
o Developing a partnership approach to front line staff training as a long term
investment
o Exploring the scope to build on current volunteering approaches.
Enhancing service quality and relevance through designing approaches with clients.
This will ensure that the client voice is significant in the design and delivery of
services:
o It will build on – and form an integral part of – the asset-based approach
o It will apply to the service as a whole, individual services within it and
engagement with each client
o It will be built into joint staff development.
Encourage more effective approaches to design and delivery by creating an
innovation fund, with an open brief – attracting bids for ‘something worth trying’ that
builds on evidence and may deliver more sustainable, better (higher paid, more skilled), quicker outcomes.
Final Report – Improving employability outcomes Page 78
Rocket Science 2015
Appendix 1: Socio economic and employment
Contents
Population demographics 78
Summary 78
A changing population 79
Poverty 80
The supply of labour 81
Summary 81
Age, duration and sex of unemployed people Dundee 85
The dynamic nature of unemployment 89
The ESA WRAG group 89
Geographic Inequality in Unemployment 91
Lone parents 92
Qualifications 94
Young people 98
Working conditions in Dundee 103
Travel to work patterns in Dundee 104
The demand for labour 104
Summary 104
Main areas of employment in Dundee 105
Jobs gaps 108
Skills gaps in Dundee (people in employment) 109
Vacancies and skills shortages (unemployed people) 109
Population demographics
Summary
The working age population will continue to make up a higher proportion of the total
population than in other areas of Scotland. Viewed differently, this either presents a
great opportunity for Dundee in terms of a strong workforce base or a significant
challenge in terms of providing employability and quality employment to move away
from the negative economic outcomes seen at present (Figure 1: ).
Nevertheless, the Dundee population is ageing. Between 2012 and 2037, the number
of people aged 75+ is expected to grow by 45%. This has significant implications for
the support and care required for older people, including the need for skilled workers
in health and social care.
Poverty is a significant issue in Dundee City, with 29.3% of the population living in one
of the 15% most deprived areas of Scotland.
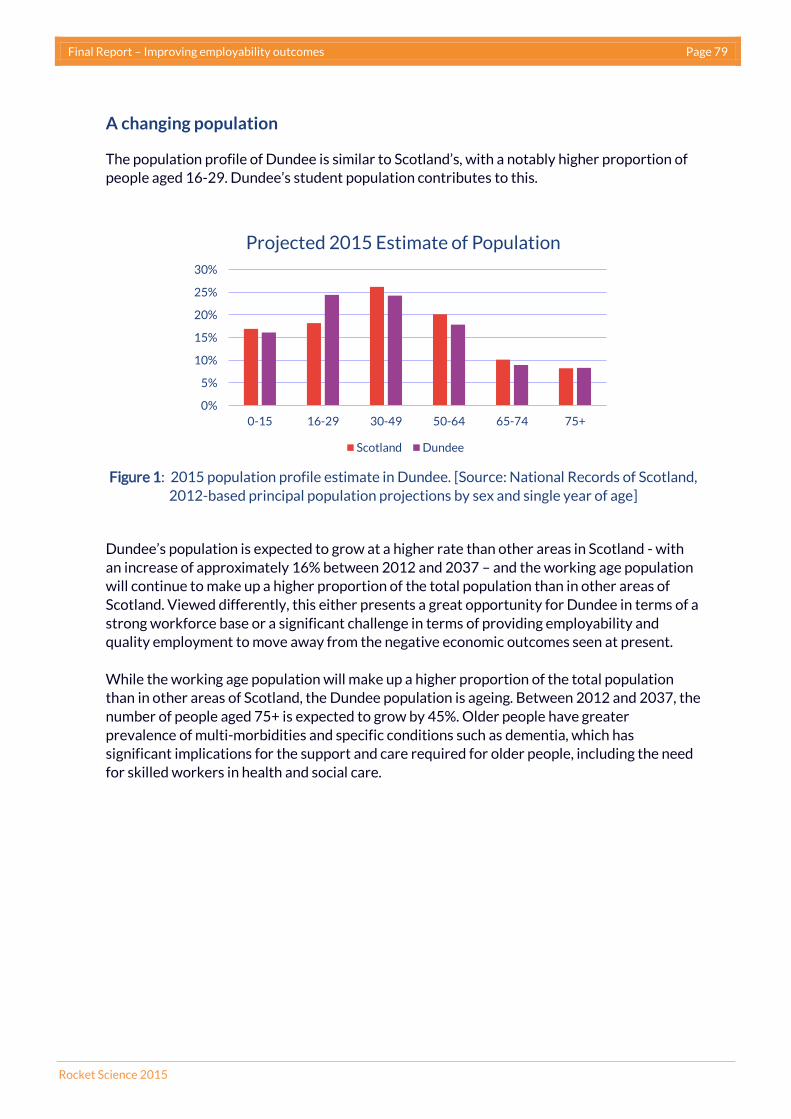
Final Report – Improving employability outcomes Page 79
Rocket Science 2015
A changing population
The population profile of Dundee is similar to Scotland’s, with a notably higher proportion of
people aged 16-29. Dundee’s student population contributes to this.
Figure 1: 2015 population profile estimate in Dundee. [Source: National Records of Scotland,
2012-based principal population projections by sex and single year of age]
Dundee’s population is expected to grow at a higher rate than other areas in Scotland - with
an increase of approximately 16% between 2012 and 2037 – and the working age population
will continue to make up a higher proportion of the total population than in other areas of
Scotland. Viewed differently, this either presents a great opportunity for Dundee in terms of a
strong workforce base or a significant challenge in terms of providing employability and
quality employment to move away from the negative economic outcomes seen at present.
While the working age population will make up a higher proportion of the total population
than in other areas of Scotland, the Dundee population is ageing. Between 2012 and 2037, the
number of people aged 75+ is expected to grow by 45%. Older people have greater
prevalence of multi-morbidities and specific conditions such as dementia, which has
significant implications for the support and care required for older people, including the need
for skilled workers in health and social care.
0%
5%
10%
15%
20%
25%
30%
0-15 16-29 30-49 50-64 65-74 75+
Projected 2015 Estimate of Population
Scotland Dundee
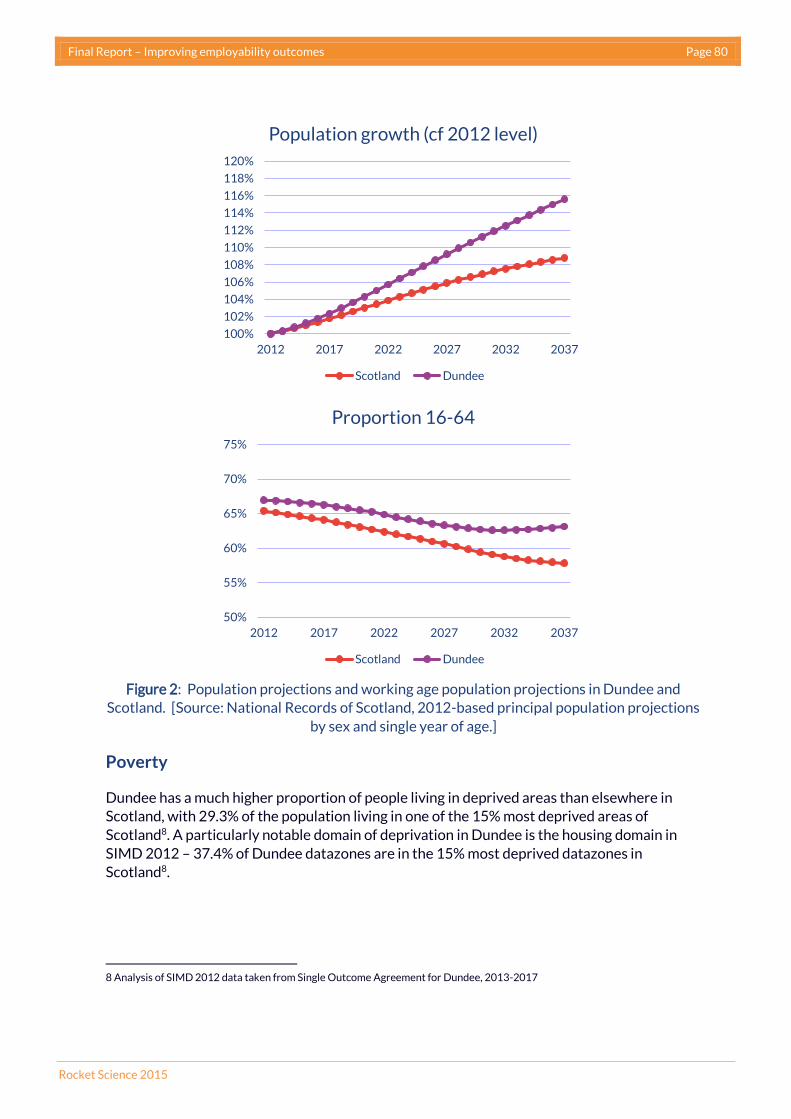
Final Report – Improving employability outcomes Page 80
Rocket Science 2015
Figure 2: Population projections and working age population projections in Dundee and
Scotland. [Source: National Records of Scotland, 2012-based principal population projections
by sex and single year of age.]
Poverty
Dundee has a much higher proportion of people living in deprived areas than elsewhere in
Scotland, with 29.3% of the population living in one of the 15% most deprived areas of
Scotland8. A particularly notable domain of deprivation in Dundee is the housing domain in
SIMD 2012 – 37.4% of Dundee datazones are in the 15% most deprived datazones in
Scotland8.
8 Analysis of SIMD 2012 data taken from Single Outcome Agreement for Dundee, 2013-2017
100%
102%
104%
106%
108%
110%
112%
114%
116%
118%
120%
2012 2017 2022 2027 2032 2037
Population growth (cf 2012 level)
Scotland Dundee
50%
55%
60%
65%
70%
75%
2012 2017 2022 2027 2032 2037
Proportion 16-64
Scotland Dundee

Final Report – Improving employability outcomes Page 81
Rocket Science 2015
The supply of labour
Summary
· In Dundee unemployment and economic inactivity are significantly higher than the
Scotland level and the employment rate is significantly lower (Figure and Figure ).
· One third (1,145) of claimants in March 2015 were claiming for over 1 year, indicating
significant long term unemployment in Dundee (Figure ).
· According to claimant count data, particularly over-represented groups in terms of
unemployment are long term unemployed people, males and people aged 25+ (Figure).
· Part of the reason that older unemployed people are now over-represented in Dundee
is that this group has not had the same level of employment recovery in the last two-
three years after the peak of unemployment in the economic downturn (Figure 2).
· Unemployment in Dundee is dynamic, with high numbers of people flowing onto and
off the claimant register each month (Figure ).
· The high proportion of people in the Employment Support Allowance (ESA) Income
Based Work Related Activity Group (WRAG) – all of whom are expected to carry out
work related activity - represents a significant “complexity demand” for employability
providers in Dundee.
· In February 2015, over 50% of the people claiming JSA were in just 9 of the 31
intermediate data zones. Dundee’s unemployment is now slightly more concentrated
in these “hot spots” than it was ten years ago (Figure ).
· School leavers in Dundee City Council area were 1.4 times more likely to go into
Further Education than other areas in Scotland (Figure ).
· Alongside recent improvements in school leaver positive destination rates, there is a
widespread increasing awareness that early positive destination rates are not enough
to really understand longer term outcomes for young people. Recent developmental
data from SDS show that the proportion of young people whose destination is
negative or unknown increases with age from 16 to 19, showing that there is
significant work to be done to really understand the routes that young people take
(Figure ).
· In terms of working conditions, underemployment has been a more significant issue in
Dundee over the last ten years than in other areas in Scotland (Figure 7) and average
pay remains lower than elsewhere in Scotland (Figure 8)
· Recent downward trends in the proportion of working age people who are employed
are associated both with increasing unemployment and increasing economic inactivity
(Figure ). Economic inactivity in 2014 was significantly higher than in 2010/2011,
showing important recent changes.

Final Report – Improving employability outcomes Page 82
Rocket Science 2015
· The parts of the economically inactive population that appear to be higher in Dundee
than elsewhere in Scotland (though not at a strong level of statistical significance) are
the student population, the number of long term sick people and people looking after
the family or home.
Figure 3: Working Age Economic Activity in Dundee. [Source: Annual Population Survey,
NOMIS]
0%
10%
20%
30%
40%
50%
60%
70%
80%
20
05
-03
20
05
-09
20
06
-03
20
06
-09
20
07
-03
20
07
-09
20
08
-03
20
08
-09
20
09
-03
20
09
-09
20
10
-03
20
10
-09
20
11
-03
20
11
-09
20
12
-03
20
12
-09
20
13
-03
20
13
-09
20
14
-03
20
14
-09
Economic Activity in Dundee, Aged 16-64
Proportion of 16-64 Population in Employment
Proportion of 16-64 Population Economically Inactive
Proportion of 16-64 Population in Unemployment
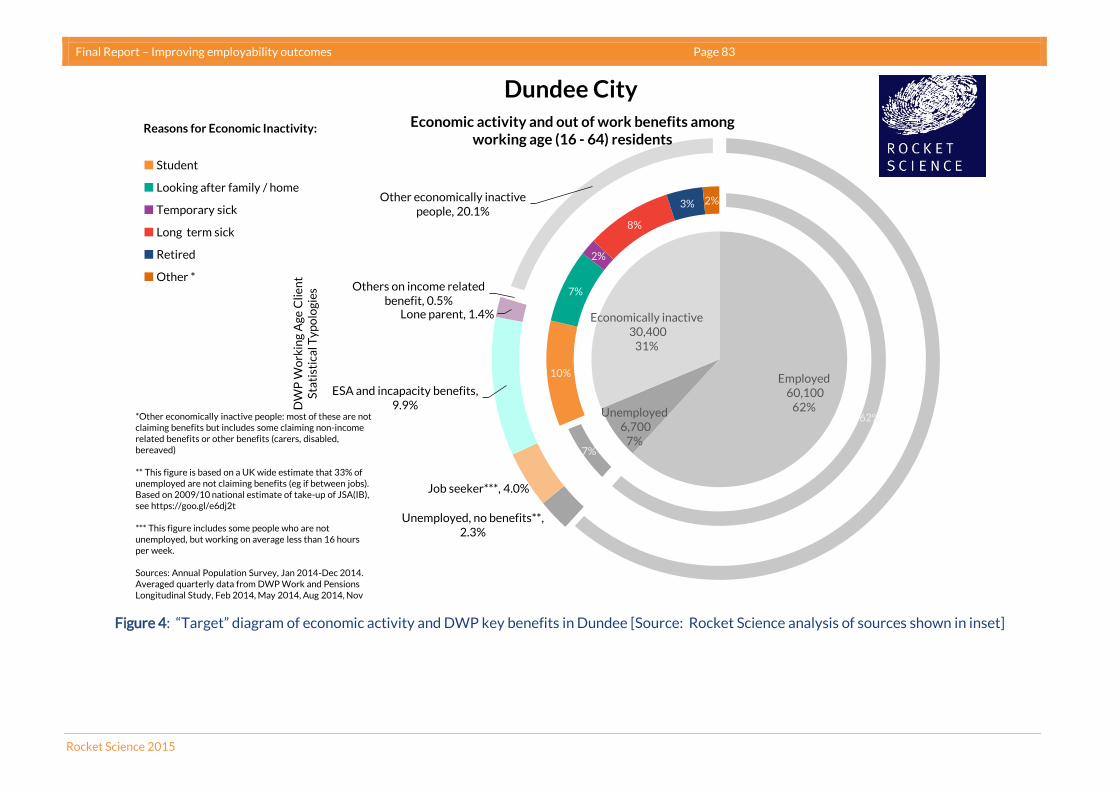
Final Report – Improving employability outcomes Page 83
Rocket Science 2015
Figure 4: “Target” diagram of economic activity and DWP key benefits in Dundee [Source: Rocket Science analysis of sources shown in inset]
Employed60,100
62%Unemployed6,700
7%
Economically inactive30,400
31%
62%
7%
10%
7%
2%
8%
3% 2%
Unemployed, no benefits**, 2.3%
Job seeker***, 4.0%
ESA and incapacity benefits, 9.9%
Lone parent, 1.4%
Others on income related benefit, 0.5%
Other economically inactive people, 20.1%
Dundee City
DW
P W
ork
ing
Ag
e C
lie
nt
Sta
tist
ica
l Ty
po
log
ies
Reasons for Economic Inactivity:
Student
Looking after family / home
Temporary sick
Long term sick
Retired
Other *
*Other economically inactive people: most of these are not claiming benefits but includes some claiming non-income related benefits or other benefits (carers, disabled, bereaved)
** This figure is based on a UK wide estimate that 33% of unemployed are not claiming benefits (eg if between jobs). Based on 2009/10 national estimate of take-up of JSA(IB), see https://goo.gl/e6dj2t
*** This figure includes some people who are not unemployed, but working on average less than 16 hours per week.
Sources: Annual Population Survey, Jan 2014-Dec 2014. Averaged quarterly data from DWP Work and Pensions Longitudinal Study, Feb 2014, May 2014, Aug 2014, Nov
Economic activity and out of work benefits among working age (16 - 64) residents

Final Report – Improving employability outcomes Page 84
Rocket Science 2015
Figure 5: “Target” diagram of economic activity and DWP key benefits in Scotland [Source: Rocket Science analysis of sources shown in
inset]
Employed2,478,500
73%
Unemployed166,900
5%
Economically inactive768,800
23%
73%
5%
6%
5%
1%
6%
4% 2%
Unemployed, no benefits**, 1.6%
Job seeker***, 2.7%
ESA and incapacity benefits, 7.9%
Lone parent, 1.1%
Others on income related benefit, 0.3%
Other economically inactive people, 13.8%
Scotland
DW
P W
ork
ing
Ag
e C
lie
nt
Sta
tist
ica
l Ty
po
log
ies
Reasons for Economic Inactivity:
Student
Looking after family / home
Temporary sick
Long term sick
Retired
Other *
*Other economically inactive people: most of these are not claiming benefits but includes some claiming non-income related benefits or other benefits (carers, disabled, bereaved)
** This figure is based on a UK wide estimate that 33% of unemployed are not claiming benefits (eg if between jobs). Based on 2009/10 national estimate of take-up of JSA(IB), see https://goo.gl/e6dj2t
*** This figure includes some people who are not unemployed, but working on average less than 16 hours per week.
Sources: Annual Population Survey, Jan 2014-Dec 2014. Averaged quarterly data from DWP Work and Pensions
Economic activity and out of work benefits among working age (16 - 64) residents
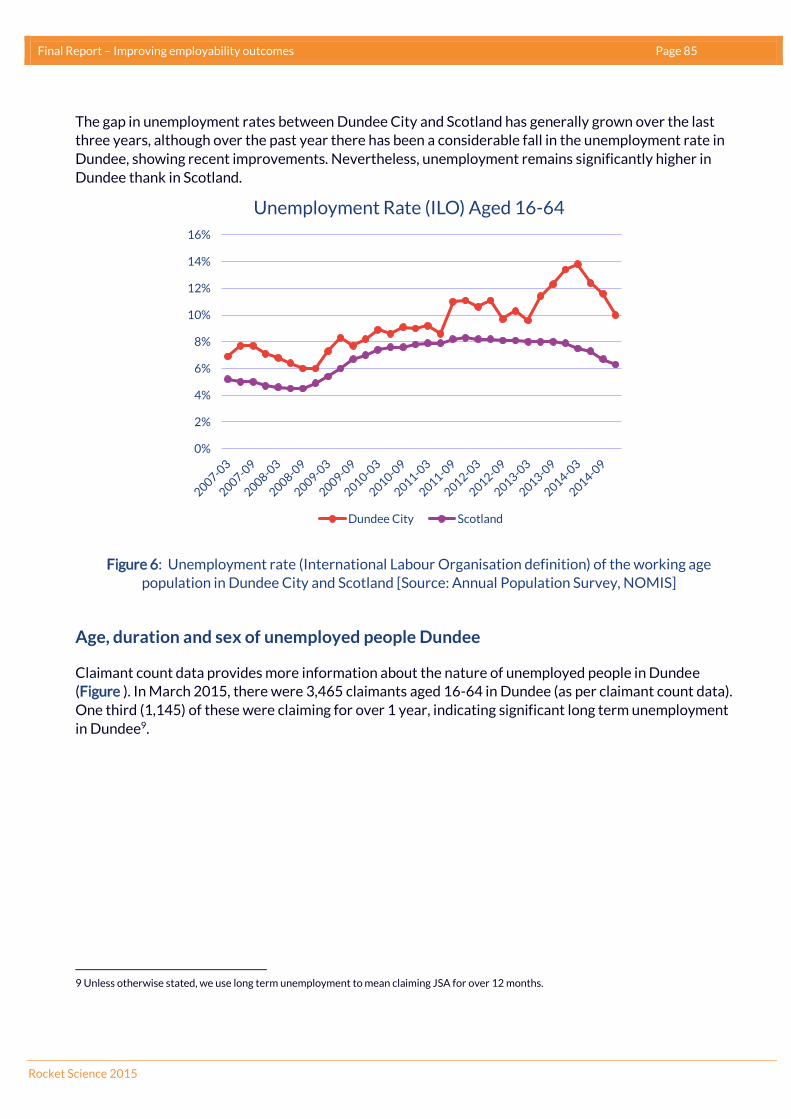
Final Report – Improving employability outcomes Page 85
Rocket Science 2015
The gap in unemployment rates between Dundee City and Scotland has generally grown over the last
three years, although over the past year there has been a considerable fall in the unemployment rate in
Dundee, showing recent improvements. Nevertheless, unemployment remains significantly higher in
Dundee thank in Scotland.
Figure 6: Unemployment rate (International Labour Organisation definition) of the working age
population in Dundee City and Scotland [Source: Annual Population Survey, NOMIS]
Age, duration and sex of unemployed people Dundee
Claimant count data provides more information about the nature of unemployed people in Dundee
(Figure ). In March 2015, there were 3,465 claimants aged 16-64 in Dundee (as per claimant count data).
One third (1,145) of these were claiming for over 1 year, indicating significant long term unemployment
in Dundee9.
9 Unless otherwise stated, we use long term unemployment to mean claiming JSA for over 12 months.
0%
2%
4%
6%
8%
10%
12%
14%
16%
Unemployment Rate (ILO) Aged 16-64
Dundee City Scotland

Final Report – Improving employability outcomes Page 86
Rocket Science 2015
Figure 7: Duration, Sex and Age of claimants in Dundee (claimant count, March 2015) [Source: NOMIS]
To place this in context, the proportion of the population claiming in Dundee is compared to the
proportion of the population claiming in Scotland, broken down by age, duration and sex (Figure). Overall,
the rate of claimants in Dundee is greater than the Scottish level by a factor of 1.46. According to the
claimant count, the particularly over-represented groups in unemployment in Dundee, March 2015
were10:
Long term unemployed
Males
People aged 25 and over.
As an example, in Dundee, 1.9% of males aged 50-64 were long term unemployed (ie claiming for over 1
year). Nationally, only 0.8% of males of this age were long term unemployed.
10 We note that here that the claimant count is a poor representation of unemployment for young people aged 16 and 17
1,860, 54%
460, 13%
1,145, 33%
Dundee Claimant Count -March 2015: Duration
Up to 6months
Over 6months andup to a year
Over 1 year
2,510, 72%
955, 28%
Dundee Claimant Count -March 2015: Sex
Male
Female
825, 24%
1,965, 57%
680, 19%
Dundee Claimant Count -March 2015: Age
Aged 16-24
Aged 25-49
Aged 50-64

Final Report – Improving employability outcomes Page 87
Rocket Science 2015
Figure 8: Age and duration of claimants in Dundee, March 2015. Numbers denote number of claimants
[Source: NOMIS Claimant Count – Age Duration with Proportions]
Figure9: Comparison of the rate of population claiming in Dundee and Scotland, March 2015. Each
number represents (Rate of claimants in Dundee / Rate of claimants in Scotland) [Source: NOMIS
Claimant Count – Age Duration with Proportions]
Overall, there are more than twice as many people aged 25+ in Dundee who have been unemployed for
over 1 year compared to the Scotland level –many of these people may have had little or no work
experience.
Part of the reason that older unemployed people are now over-represented in Dundee is that this group
has not had the same level of employment recovery in the last two-three years after the peak of
unemployment in the economic downturn (Figure 2). This may be associated with the longer impact of
recession on long term unemployed people, many of whom are older - the trend of the peak
unemployment in the recession shows a ‘lag’ for those who have been claiming longer (Figure).
Aged 16-64 Aged 16-24 Aged 25-49 Aged 50-64
Total Total 3465 825 1965 680
Total Up to 6 months 1860 570 1020 275
Total Over 6 months and up to a year 460 135 235 95
Total Over 1 year 1145 125 715 310
Male Total 2510 565 1435 515
Male Up to 6 months 1330 375 750 205
Male Over 6 months and up to a year 315 95 155 60
Male Over 1 year 870 90 530 250
Female Total 955 260 530 165
Female Up to 6 months 535 190 270 70
Female Over 6 months and up to a year 150 35 75 35
Female Over 1 year 275 30 185 60
Sex Claim durationAge
Aged 16-64 Aged 16-24 Aged 25-49 Aged 50-64
Total Total 1.46 1.10 1.58 1.53
Total Up to 6 months 1.27 0.96 1.31 1.11
Total Over 6 months and up to a year 1.67 1.25 1.25 2.00
Total Over 1 year 2.00 1.67 2.14 2.00
Male Total 1.53 1.12 1.58 1.74
Male Up to 6 months 1.29 0.97 1.35 1.33
Male Over 6 months and up to a year 1.20 1.33 1.40 1.67
Male Over 1 year 2.25 1.60 2.20 2.38
Female Total 1.27 1.11 1.38 1.20
Female Up to 6 months 1.22 1.00 1.10 0.83
Female Over 6 months and up to a year 1.50 1.00 1.50 2.00
Female Over 1 year 1.67 1.50 1.75 1.33
AgeSex Claim duration

Final Report – Improving employability outcomes Page 88
Rocket Science 2015
Figure 2: Trends in claimant count from May 2005 to March 20015 by age band [Source: Claimant Count,
NOMIS]
Figure 12: Trends in claimant count numbers in Dundee by duration of claiming, showing the expected
“lag” in peak unemployment in the recession by duration of claim [Source: Claimant Count, NOMIS]
0
500
1000
1500
2000
2500M
ar-
06
Ma
r-0
7M
ar-
08
Ma
r-0
9M
ar-
10
Ma
r-1
1M
ar-
12
Ma
r-1
3M
ar-
14
Ma
r-1
5
18-24
0
1000
2000
3000
4000
Ma
r-0
6M
ar-
07
Ma
r-0
8M
ar-
09
Ma
r-1
0M
ar-
11
Ma
r-1
2M
ar-
13
Ma
r-1
4M
ar-
15
25-49
0200
400
600800
1000
Ma
r-0
6M
ar-
07
Ma
r-0
8M
ar-
09
Ma
r-1
0M
ar-
11
Ma
r-1
2M
ar-
13
Ma
r-1
4M
ar-
15
50 plus
0
500
1000
1500
2000
2500
3000
Ma
r-0
6M
ar-
07
Ma
r-0
8M
ar-
09
Ma
r-1
0M
ar-
11
Ma
r-1
2M
ar-
13
Ma
r-1
4M
ar-
15
13 weeks or less
0
500
1000
1500
Ma
r-0
6M
ar-
07
Ma
r-0
8M
ar-
09
Ma
r-1
0M
ar-
11
Ma
r-1
2M
ar-
13
Ma
r-1
4M
ar-
15
over 13 and up to 26 weeks
0
500
1000
1500
2000
Ma
r-0
6M
ar-
07
Ma
r-0
8M
ar-
09
Ma
r-1
0M
ar-
11
Ma
r-1
2M
ar-
13
Ma
r-1
4M
ar-
15
over 26 and up to 52 weeks
0200400600800
1000
Ma
r-0
6M
ar-
07
Ma
r-0
8M
ar-
09
Ma
r-1
0M
ar-
11
Ma
r-1
2M
ar-
13
Ma
r-1
4M
ar-
15
over 52 and up to 78 weeks
0
200
400
600
800
Ma
r-0
6M
ar-
07
Ma
r-0
8M
ar-
09
Ma
r-1
0M
ar-
11
Ma
r-1
2M
ar-
13
Ma
r-1
4M
ar-
15
over 78 and up to 104 weeks
0
200
400
600
800
1000
1200
Ma
r-0
6M
ar-
07
Ma
r-0
8M
ar-
09
Ma
r-1
0M
ar-
11
Ma
r-1
2M
ar-
13
Ma
r-1
4M
ar-
15
over 104 weeks
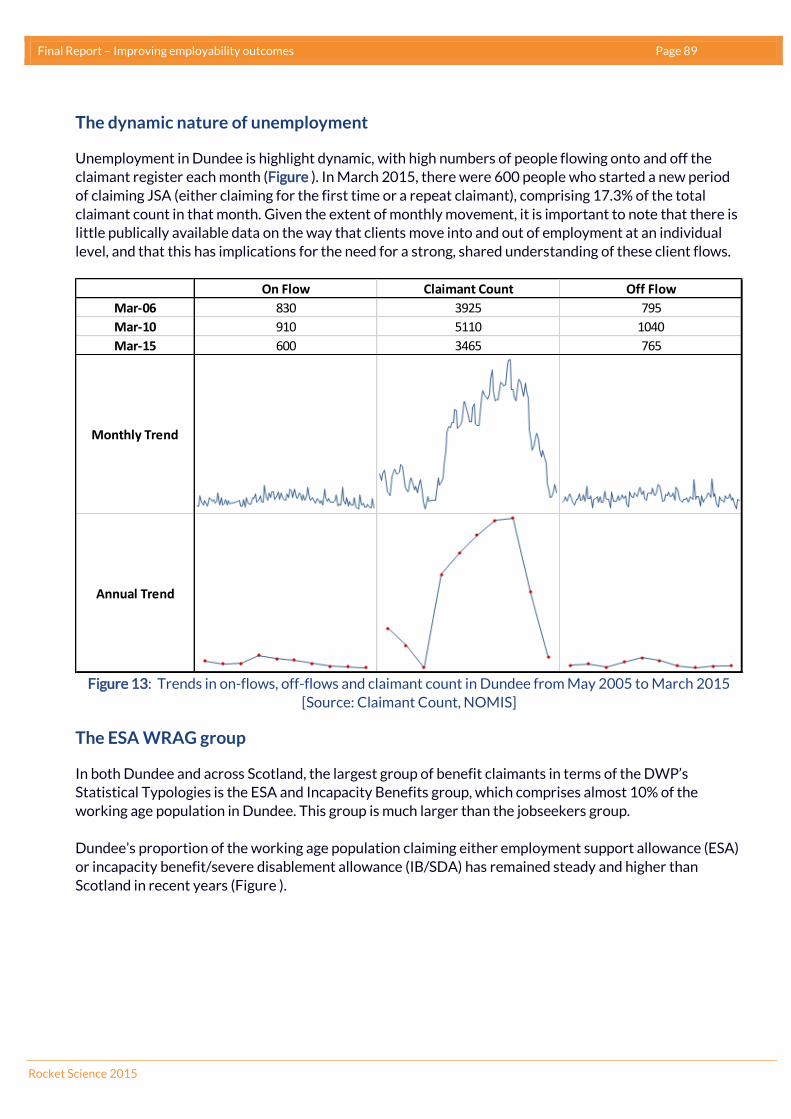
Final Report – Improving employability outcomes Page 89
Rocket Science 2015
The dynamic nature of unemployment
Unemployment in Dundee is highlight dynamic, with high numbers of people flowing onto and off the
claimant register each month (Figure ). In March 2015, there were 600 people who started a new period
of claiming JSA (either claiming for the first time or a repeat claimant), comprising 17.3% of the total
claimant count in that month. Given the extent of monthly movement, it is important to note that there is
little publically available data on the way that clients move into and out of employment at an individual
level, and that this has implications for the need for a strong, shared understanding of these client flows.
Figure 13: Trends in on-flows, off-flows and claimant count in Dundee from May 2005 to March 2015
[Source: Claimant Count, NOMIS]
The ESA WRAG group
In both Dundee and across Scotland, the largest group of benefit claimants in terms of the DWP’s
Statistical Typologies is the ESA and Incapacity Benefits group, which comprises almost 10% of the
working age population in Dundee. This group is much larger than the jobseekers group.
Dundee’s proportion of the working age population claiming either employment support allowance (ESA)
or incapacity benefit/severe disablement allowance (IB/SDA) has remained steady and higher than
Scotland in recent years (Figure ).
On Flow Claimant Count Off Flow
Mar-06 830 3925 795
Mar-10 910 5110 1040
Mar-15 600 3465 765
Monthly Trend
Annual Trend

Final Report – Improving employability outcomes Page 90
Rocket Science 2015
Figure 14: The proportion of people aged 16-64 claiming ESA or IB/SDA in Dundee and Scotland [Source:
NOMIS DWP Benefits data]
Due to benefit changes, the number of ESA claimants now dominates over those claiming Incapacity
Benefits, thus warranting further focussed investigation. The breakdown of ESA by phase and payment
type is shown below, along with the comparison of working age population rate against that of Scotland
(eg someone in the working age population in Dundee is 1.51 times more likely to be claiming ESA in the
Work Related Activity group). The high proportion of people in the ESA Income Based WRAG group – all
of whom are expected to carry out work related activity - represents a significant “complexity demand”
for employability providers in Dundee.
Figure 15: Comparison between Dundee ESA numbers and those in Scotland [Source: NOMIS DWP
Benefits data]
0.0%
2.0%
4.0%
6.0%
8.0%
10.0%
12.0%
No
ve
mb
er
20
08
Ma
y 2
00
9
No
ve
mb
er
20
09
Ma
y 2
01
0
No
ve
mb
er
20
10
Ma
y 2
01
1
No
ve
mb
er
20
11
Ma
y 2
01
2
No
ve
mb
er
20
12
Ma
y 2
01
3
No
ve
mb
er
20
13
Ma
y 2
01
4
No
ve
mb
er
20
14
Proportion of 16-64 Population Claiming ESA or IB/SDA
Dundee
Scotland
Both Contributions
and Income Based
Contributions
BasedIncome Based
No Payments -
Credits OnlyTotal
Assessment phase 20 280 1330 40 1670
Support group 920 1310 1790 20 4030
Work related activity group 40 110 2500 220 2880
Total 980 1700 5620 450 8760
Both Contributions
and Income Based
Contributions
BasedIncome Based
No Payments -
Credits OnlyTotal
Assessment phase - 0.95 1.29 - 1.21
Support group 1.19 1.06 1.14 - 1.12
Work related activity group - 1.40 1.56 1.07 1.51
Total 1.20 1.05 1.34 1.02 1.24
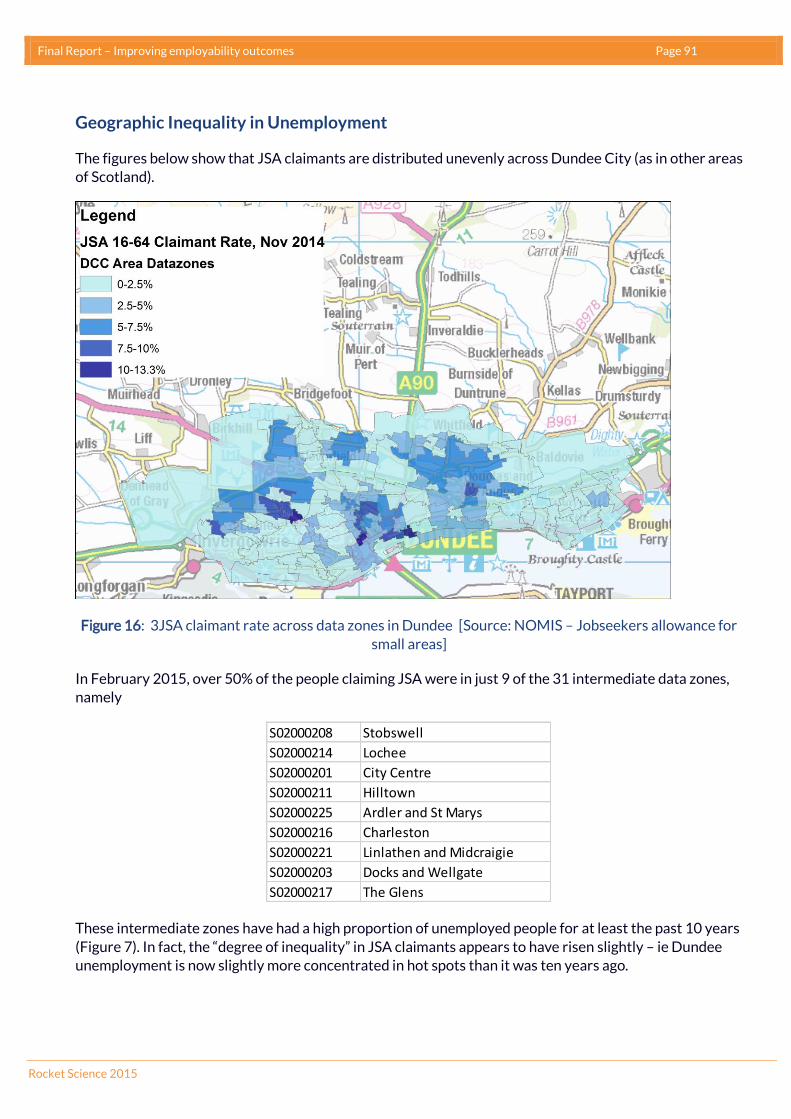
Final Report – Improving employability outcomes Page 91
Rocket Science 2015
Geographic Inequality in Unemployment
The figures below show that JSA claimants are distributed unevenly across Dundee City (as in other areas
of Scotland).
Figure 16: 3JSA claimant rate across data zones in Dundee [Source: NOMIS – Jobseekers allowance for
small areas]
In February 2015, over 50% of the people claiming JSA were in just 9 of the 31 intermediate data zones,
namely
These intermediate zones have had a high proportion of unemployed people for at least the past 10 years
(Figure 7). In fact, the “degree of inequality” in JSA claimants appears to have risen slightly – ie Dundee
unemployment is now slightly more concentrated in hot spots than it was ten years ago.
S02000208 Stobswell
S02000214 Lochee
S02000201 City Centre
S02000211 Hilltown
S02000225 Ardler and St Marys
S02000216 Charleston
S02000221 Linlathen and Midcraigie
S02000203 Docks and Wellgate
S02000217 The Glens

Final Report – Improving employability outcomes Page 92
Rocket Science 2015
Figure 17: The historic trend of the proportion of JSA claimants who are in the top 9 intermediate zones
as at 2015 [Source: NOMIS – Jobseekers allowance for small areas]
Lone parents
Understanding the profile of lone parents, and their key benefits, is challenging. A key benefit for lone
parents has historically been Income Support. In Dundee, as for the rest of the UK, claimants of Income
Support have steadily fallen:
Figure 18: Downward trend in those claiming income support in Dundee [Source: NOMIS DWP Benefits
data]
0.0%
25.0%
50.0%
75.0%
100.0%
Fe
b-0
5
Jul-
05
De
c-0
5
Ma
y-0
6
Oct
-06
Ma
r-0
7
Au
g-0
7
Jan
-08
Jun
-08
No
v-0
8
Ap
r-0
9
Se
p-0
9
Fe
b-1
0
Jul-
10
De
c-1
0
Ma
y-1
1
Oct
-11
Ma
r-1
2
Au
g-1
2
Jan
-13
Jun
-13
No
v-1
3
Ap
r-1
4
Se
p-1
4
Fe
b-1
5
Proportion of JSA claimants in the top 9 Intermediate Zones (Feb 2015)
01,0002,0003,0004,0005,0006,0007,0008,0009,000
10,000
Fe
bru
ary
20
05
Se
pte
mb
er
20
05
Ap
ril 2
00
6
No
ve
mb
er
20
06
Jun
e 2
00
7
Jan
ua
ry 2
00
8
Au
gu
st 2
00
8
Ma
rch
20
09
Oct
ob
er
20
09
Ma
y 2
01
0
De
cem
be
r 2
01
0
July
20
11
Fe
bru
ary
20
12
Se
pte
mb
er
20
12
Ap
ril 2
01
3
No
ve
mb
er
20
13
Jun
e 2
01
4
Number of people claiming Income Support in Dundee
Total
Lone Parents

Final Report – Improving employability outcomes Page 93
Rocket Science 2015
This fall is linked to changes in the eligibility criteria for benefits. From November 2008 “most lone parents with older children are no longer entitled to Income Support if they are only claiming it because they are a lone parent”11. Instead, lone parents able to work may claim Jobseekers Allowance. Across the
UK, there has indeed been an increase in lone parents on the (JSA) claimant count:
Figure 19: Total claimant count and lone parent proportion in UK [Source: Lone parents receiving JSA:
monthly claimant count, March 2015, DWP Statistics]
It is difficult to disaggregate changes in the economy with changes to the benefit regime12. The table
below compares two points in time with similar levels of claimant count. We note that, across the UK, the
fall in numbers of lone parents claiming Income Support far outweighs the rise in lone parents claiming
JSA.
February 2008 November 2014
Claimant Count 821,36013 792,25014
Lone Parents on Claimant Count 6,96015 87,18516
Lone Parents claiming Income Support 859,40017 472,44018
11 Lone parents receiving JSA: monthly claimant count, March 2015, DWP Statistics. 12 See an excellent discussion on this at https://www.teesvalleyunlimited.gov.uk/media/107866/benfchangepatterns08-11.pdf 13 Lone parents receiving JSA: monthly claimant count, March 2015, DWP Statistics 14 Lone parents receiving JSA: monthly claimant count, March 2015, DWP Statistics 15 Lone parents receiving JSA: monthly claimant count, March 2015, DWP Statistics 16 Lone parents receiving JSA: monthly claimant count, March 2015, DWP Statistics 17 NOMIS DWP Benefits Data, Income Support, claimants with no partner and one or more children. 18 NOMIS DWP Benefits Data, Income Support, claimants with no partner and one or more children.
0
200,000
400,000
600,000
800,000
1,000,000
1,200,000
1,400,000
1,600,000
1,800,000
Ap
r-0
5
Jan
-06
Oct
-06
Jul-
07
Ap
r-0
8
Jan
-09
Oct
-09
Jul-
10
Ap
r-1
1
Jan
-12
Oct
-12
Jul-
13
Ap
r-1
4
Jan
-15
UK Claimant Count
Claimant Count
0%
2%
4%
6%
8%
10%
12%
Ap
r-0
5
Jan
-06
Oct
-06
Jul-
07
Ap
r-0
8
Jan
-09
Oct
-09
Jul-
10
Ap
r-1
1
Jan
-12
Oct
-12
Jul-
13
Ap
r-1
4
Jan
-15
% of Claimants who are Lone Parents (across the UK)
% of CC who are Lone Parents
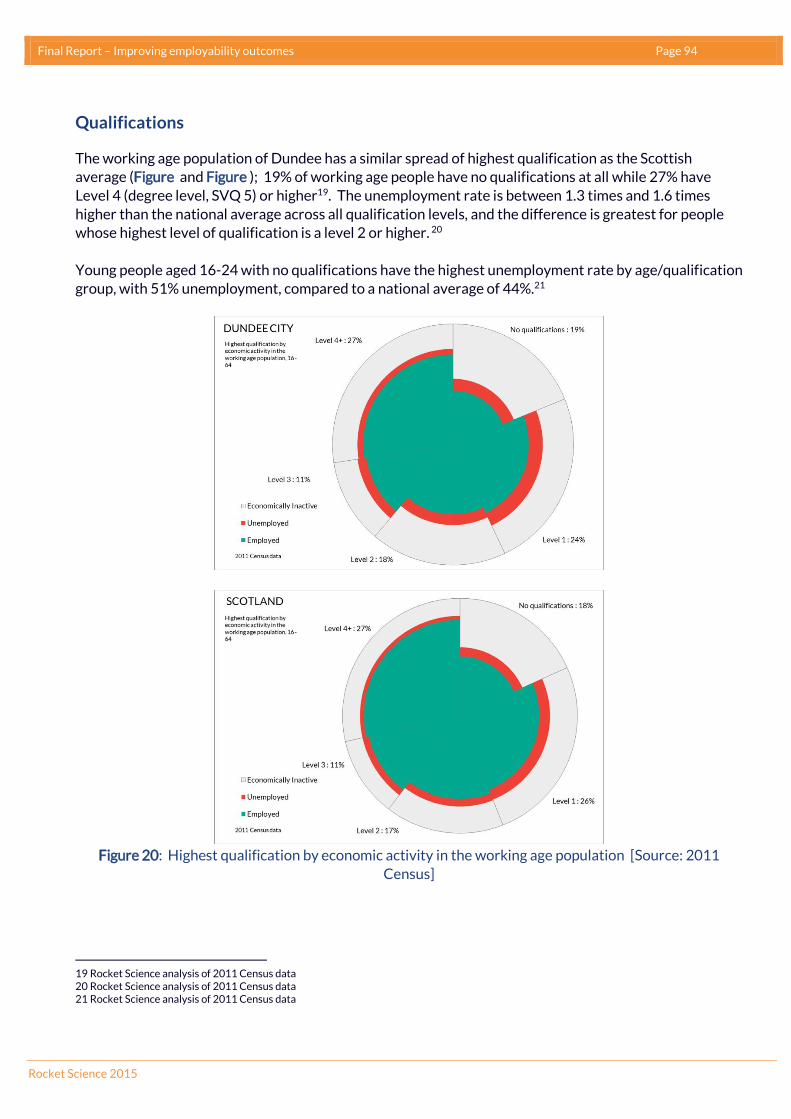
Final Report – Improving employability outcomes Page 94
Rocket Science 2015
Qualifications
The working age population of Dundee has a similar spread of highest qualification as the Scottish
average (Figure and Figure ); 19% of working age people have no qualifications at all while 27% have
Level 4 (degree level, SVQ 5) or higher19. The unemployment rate is between 1.3 times and 1.6 times
higher than the national average across all qualification levels, and the difference is greatest for people
whose highest level of qualification is a level 2 or higher. 20
Young people aged 16-24 with no qualifications have the highest unemployment rate by age/qualification
group, with 51% unemployment, compared to a national average of 44%.21
Figure 20: Highest qualification by economic activity in the working age population [Source: 2011
Census]
19 Rocket Science analysis of 2011 Census data 20 Rocket Science analysis of 2011 Census data 21 Rocket Science analysis of 2011 Census data

Final Report – Improving employability outcomes Page 95
Rocket Science 2015
Figure 21: Unemployment rate by age and qualifications in the working age population [Source: 2011
Census]
Figure 4 shows the proportion of people aged 16-64 who are in employment broken down by their
highest level of qualification. Generally across the last decade there is a clear pattern of higher
employment rates amongst people with higher levels of qualifications. Interestingly, those people with no
qualifications or only a Higher or Standard Grade qualification have appeared to fare increasingly less
well in terms of their employment since 2006. While difficult to tease apart, there could be an
increasingly significant issue of displacement, where people with higher level of qualifications are
increasingly taking lower skilled jobs and removing the availability of these jobs for lower skilled people.
The rise in numbers with degree level qualifications is shown in Figure 5.
0%
10%
20%
30%
40%
50%
60%
Noqualifications
Level 1 Level 2 Level 3 Level 4 andabove
Unemployment rate by age and qualifications: Dundee City
Aged 16 to 24:
Aged 25 to 49:
Aged 50 to 64:
2011 Census data
0%
10%
20%
30%
40%
50%
60%
Noqualifications
Level 1 Level 2 Level 3 Level 4 andabove
Unemployment rate by age and qualifications: Scotland
Aged 16 to 24:
Aged 25 to 49:
Aged 50 to 64:
2011 Census data
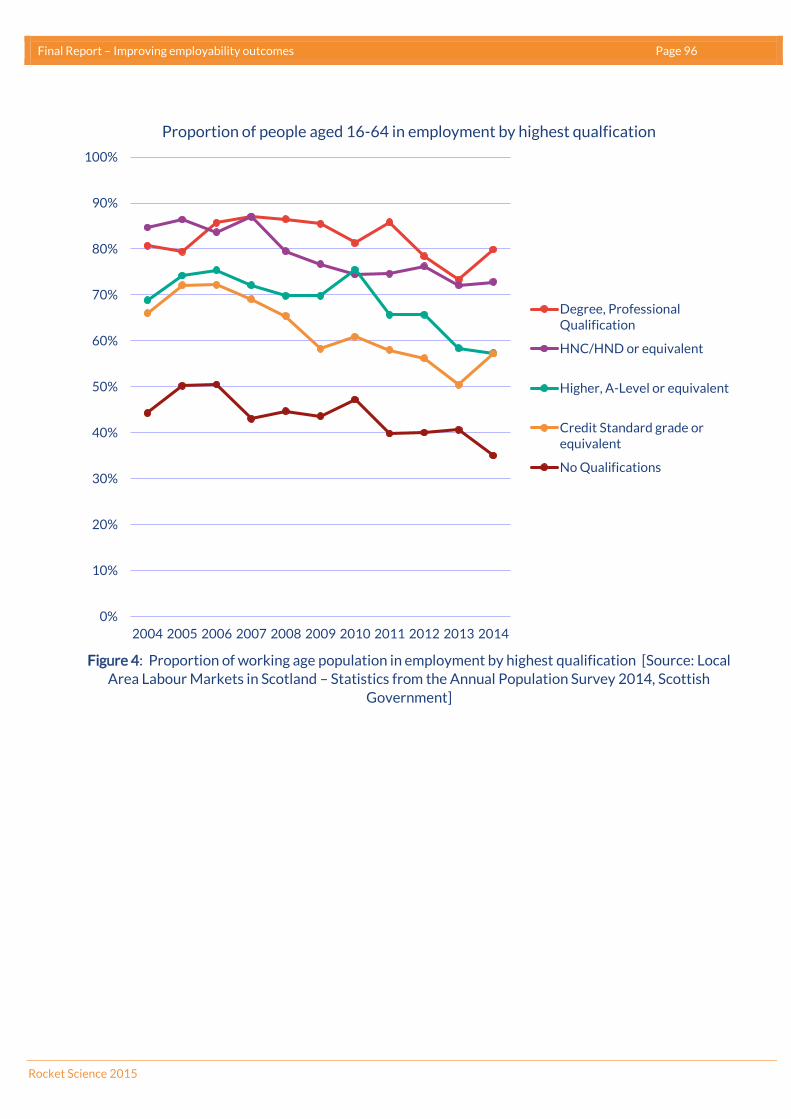
Final Report – Improving employability outcomes Page 96
Rocket Science 2015
Figure 4: Proportion of working age population in employment by highest qualification [Source: Local
Area Labour Markets in Scotland – Statistics from the Annual Population Survey 2014, Scottish
Government]
0%
10%
20%
30%
40%
50%
60%
70%
80%
90%
100%
2004 2005 2006 2007 2008 2009 2010 2011 2012 2013 2014
Proportion of people aged 16-64 in employment by highest qualfication
Degree, ProfessionalQualification
HNC/HND or equivalent
Higher, A-Level or equivalent
Credit Standard grade orequivalent
No Qualifications
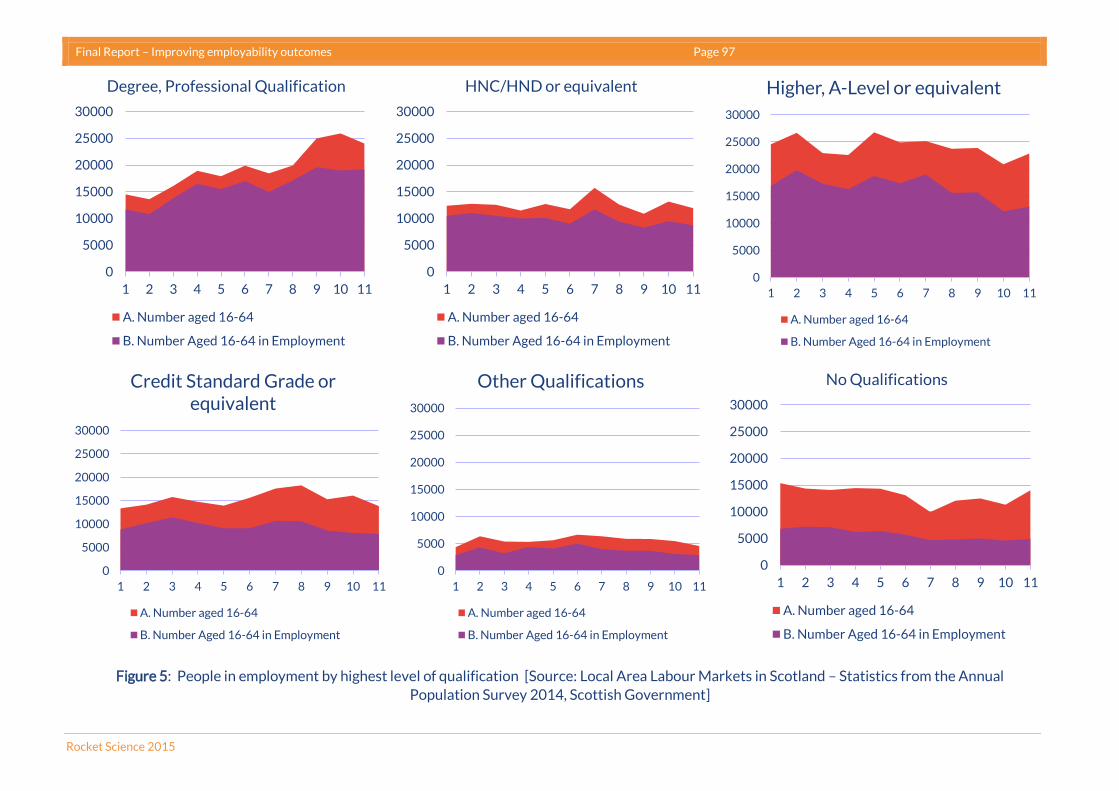
Final Report – Improving employability outcomes Page 97
Rocket Science 2015
Figure 5: People in employment by highest level of qualification [Source: Local Area Labour Markets in Scotland – Statistics from the Annual
Population Survey 2014, Scottish Government]
0
5000
10000
15000
20000
25000
30000
1 2 3 4 5 6 7 8 9 10 11
Degree, Professional Qualification
A. Number aged 16-64
B. Number Aged 16-64 in Employment
0
5000
10000
15000
20000
25000
30000
1 2 3 4 5 6 7 8 9 10 11
HNC/HND or equivalent
A. Number aged 16-64
B. Number Aged 16-64 in Employment
0
5000
10000
15000
20000
25000
30000
1 2 3 4 5 6 7 8 9 10 11
Higher, A-Level or equivalent
A. Number aged 16-64
B. Number Aged 16-64 in Employment
0
5000
10000
15000
20000
25000
30000
1 2 3 4 5 6 7 8 9 10 11
Credit Standard Grade or equivalent
A. Number aged 16-64
B. Number Aged 16-64 in Employment
0
5000
10000
15000
20000
25000
30000
1 2 3 4 5 6 7 8 9 10 11
Other Qualifications
A. Number aged 16-64
B. Number Aged 16-64 in Employment
0
5000
10000
15000
20000
25000
30000
1 2 3 4 5 6 7 8 9 10 11
No Qualifications
A. Number aged 16-64
B. Number Aged 16-64 in Employment

Final Report – Improving employability outcomes Page 98
Rocket Science 2015
Young people
School leavers’ destinations in the Dundee City Council area in 2013/14 are presented in (Figure ). In
2013/14 there were 1331 leavers in total. 36.7% of these went to Further Education, compared to the
figure of 26.1% across the rest of Scotland. This means that school leavers in Dundee City Council area
were 1.4 times more likely to go into Further Education than other areas in Scotland. Only East Ayrshire
had a higher proportion of school leavers going to Further Education.
Dundee City Council also had the third highest rate of school leavers going into the “Unemployed not
seeking” category, with this outcome 1.8 times more likely in Dundee than in the rest of Scotland. We
note that these numbers are small (25 Dundee school leavers).
Figure 24: School leaver destinations in Dundee compared to the rest of Scotland [Source: Rocket
Science analysis of Skills Development Scotland data]
Rest of ScotlandDundee City Council Rate
/ Rest of Scotland Rate *
HE 428 32.2% 38.8% 0.83
FE 488 36.7% 26.1% 1.41
Training 68 5.1% 4.1% 1.25
Employment 220 16.5% 21.8% 0.76
Voluntary Work 7 0.5% 0.4% 1.14
Activity Agreements 4 0.3% 1.1% 0.26
Total Leavers
1331
Unemployed seeking 87 6.5% 6.3% 1.04
Unemployed not seeking 25 1.9% 1.1% 1.76
Not known 4 0.3% 0.3% 1.05
Source: School Leaver Destinations Initial Follow Up Summary Table 2013-14, Skills Development Scotland.
Dundee City Council
*This represents a "relative risk"-type statistic (eg, see [1]). A number of 2.0 for HE would mean that school leavers in this LA area are twice as likely
to go into Higher Education as they are in Scotland overall.
[1] http://www2.law.columbia.edu/fagan/courses/law_socialscience/documents/Spring_2006/Class%207-Sampling/Liberman_probability.pdf

Final Report – Improving employability outcomes Page 99
Rocket Science 2015
Skills Development Scotland provides greater detail on the profile of school leavers in their Dundee
Community Planning Partnership report22. Key points from that analysis are:
The proportion of school leavers going into the unemployed seeking group (6.5%), while still 0.2
percentage points higher than Scotland, is the lowest it has ever been in Dundee and down from
15.3% in 2009/10.
Positive destination rates are strongly related to the level of deprivation in the areas where
school leavers’ live.
Positive destination rates are strongly related to the school that leavers attend, with Grove
Academy having a positive destination rate of 95/2% and Baldragon Academy only 86.0%.
With the apparent improvements in the positive destination rates of young people in Dundee (in terms of
unemployment outcomes) since 2009/10, it is tempting to view this as a problem that is being solved.
However, there is a widespread increasing awareness that early positive destination rates are not enough
to really understand whether school leaver outcomes are indeed the best outcome for each individual,
and that a much better system of longitudinally tracking young people would be needed to assess
whether early intervention and prevention approaches are working.
For the first time, in August 2015 Skills Development Scotland (SDS) published experimental statistics on
the participation rates of all young people (16-19 year olds) at April 2015. This data set aims to provide a
far richer picture of the pathways that young people take, and presents a real opportunity for
understanding the 16-19 cohort in a way that has not previously been possible.
Overall, at April 2015 in Dundee City there were 649 people aged 16-19 who were unemployed, with a
further 267 whose status was unknown23. The age breakdown of this group, and comparison with
Scotland, is shown in Figure 25 below. While caution must be used to interpret these early statistics, it
appears that in each of the individual age groups the proportion in unemployment is higher in Dundee
than other Scotland overall. A notable feature of the data is that the proportion of people whose
destination is unknown increases with age, such that in Dundee 10% of 19 year olds’ participation
category is not known – this exemplifies the kind of joined up approach to tracking young people which is
currently lacking.
22 Skills Development Scotland, Dundee City Council, Community Planning Partnership Report, December 2014 23 Skills Development Scotland, Participation Measure for 16 – 19 year olds in Scotland, August 2015
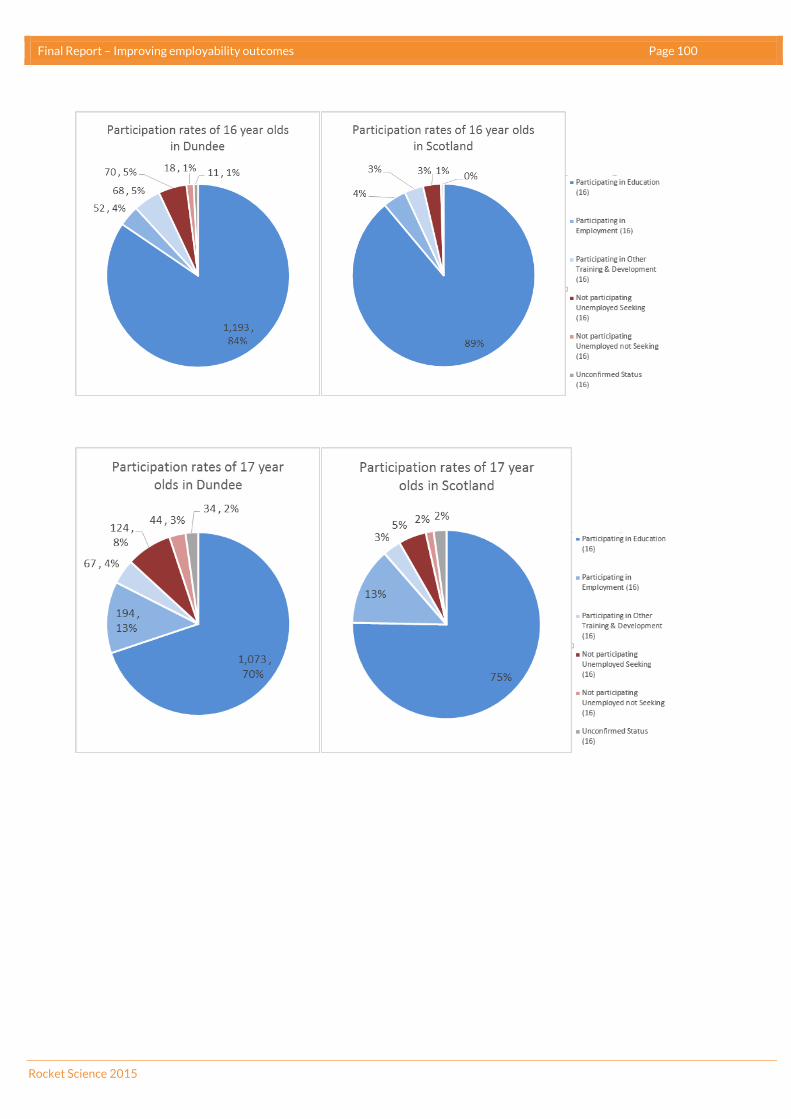
Final Report – Improving employability outcomes Page 100
Rocket Science 2015

Final Report – Improving employability outcomes Page 101
Rocket Science 2015
Figure 25: Participation rates amongst 16-19 year olds in Dundee and Scotland at April 2015 [Source:
Skills Development Scotland, Participation Measure for 16 – 19 year olds in Scotland, August 2015]
Investigating how the profile of participation changes with age in Dundee (which gives some insight into
progression routes of young people), we note that the proportion of 18 year olds in Dundee who are
unemployed and not seeking work is particularly high, both in comparison with the proportion of 17 year
olds in Dundee and with the proportion of 18 year olds across Scotland (Figure 6). Presenting these data
by age group shows that across Scotland the proportion of young people whose destination is negative or
unknown increases with age, showing that there is significant work to be done to really understand the
sub-optimal routes that young people may be taking and addressing these early.

Final Report – Improving employability outcomes Page 102
Rocket Science 2015
SDS analysis also presented the extent to which the unemployed seeking group varied with deprivation
Figure 6 and found that there was a very clear link between higher levels of unemployment and
deprivation.
Figure 6: Deprivation profile of young people in the “unemployed seeking” [work] group, December 2014
snapshot [Source: Skills Development Scotland, Dundee City Council, Community Planning Partnership
Report, December 2014]
0
20
40
60
80
100
120
Nu
mb
er U
nem
plo
yed
See
kin
g
SIMD 2012 Decile
Figure 26: Negative or not known destinations of 16-19 year olds in Dundee and Scotland
at April 2015 [Source: Skills Development Scotland, Participation Measure for 16 – 19 year
olds in Scotland, August 2015]

Final Report – Improving employability outcomes Page 103
Rocket Science 2015
Working conditions in Dundee
Underemployment has been a more significant issue in Dundee over the last ten years than in other areas
in Scotland (Figure 7). An exception to this was the latest data (2014), in which there was an apparent
dramatic fall in the underemployment level in Dundee. It is not clear from the data what this can be
attributed to - at a national level, the 2014 fall in underemployment was seen in male workers and people
aged 25+
Figure 7: Underemployed people 16+ in Dundee and Scotland [Source: Local Area Labour Markets in
Scotland – Statistics from the Annual Population Survey 2014, Scottish Government]
Average earnings in Dundee are lower than the Scottish average (Figure 8):
Figure 8: Median gross pay for Dundee residents still lags behind Scottish pay levels [Source: Annual
Survey of Hours and Earnings – Resident Analysis]
0%
5%
10%
15%
20%
2004 2005 2006 2007 2008 2009 2010 2011 2012 2013 2014
The proportion of employed people aged 16+ who are underemployed
Scotland Dundee City
80%
85%
90%
95%
100%
2008 2009 2010 2011 2012 2013 2014
Median gross pay (Dundee / Scotland)
Full Time Workers All Workers

Final Report – Improving employability outcomes Page 104
Rocket Science 2015
Travel to work patterns in Dundee
Dundee City has a positive commuter balance, with 22,600 people travelling into Dundee City from other
local authorities for work, and 8,700 residents travelling out to work in other areas. The table below
shows Dundee’s main areas for exchange of commuters.24
Inward commuters Outward commuters Net balance
Angus 11,400 2,900 8,500
Fife 5,100 1,400 3,700
Perth and Kinross 4,700 2,300 2,400
City of Edinburgh 280 250 30
The demand for labour
Summary
The historic decline in overall jobs has recently been halted with a steady number of jobs over
2011-2013.
There is still high dependency on public sector jobs in Dundee.
In key growth sectors, growing numbers of enterprises have not resulted in growing numbers of
jobs – this is linked to the new enterprises having very low staff numbers.
Although there had been a slower business growth rate relative to Scotland, 2013 saw a large rise
in the number of active enterprises in Dundee. However, business density per head of population
remains lower than Scotland.
Business survival rates have fallen slightly in recent years in Dundee and lag behind Scotland.
Dundee has a higher proportion of its employment in public administration, education and health
and in distribution, hotels and restaurants, but a lower proportion in the banking, finance and
insurance sector. However, since 2007, the proportion employed in the banking, finance and
insurance sector has grown in Dundee (Figure ).
UKCES 2013 data show significant jobs gaps across Scotland equating to 3.9 unemployed people
for every job vacancy. In Tayside, this jobs gap is slightly higher at 4.5 unemployed people for
every job vacancy.
The largest skills gaps by occupation in Tayside, as identified by the Regional Skills Assessment,
are for process and machine operatives (14% of all in employment have a skills gap) and caring,
leisure and other service occupations (12% of all in employment have a skills gap). For both these
occupational classifications, the skills gap in Tayside is around twice the national skills gap.
24 2011 Census data, accessed via http://www.neighbourhood.statistics.gov.uk data visualiser

Final Report – Improving employability outcomes Page 105
Rocket Science 2015
Although there is a jobs gap in Tayside and across Scotland, there is an additional challenge for
getting people into employment, namely skills shortages preventing job vacancies from being
filled. In Tayside, there are two employment types with a particularly high level of vacancies –
machine operatives and skilled trades occupations. For both types of employment, over a quarter
of the vacancies are deemed to be unfilled due to a skills shortage (Figure 10).
Main areas of employment in Dundee
The Dundee Partnership Economic Strategy and Action Plan 2013-17 makes a number of key
observations about the “demand side” of employability in Dundee. We have updated and expanded upon
these in Figure , and note some of the key updated observations:
While there had been a falling number of jobs overall, the historic decline in overall jobs has
recently been halted with a steady number of jobs over 2011-2013.
There is still high dependency on public sector jobs in Dundee.
In key growth sectors, growing numbers of enterprises have not resulted in growing numbers of
jobs – this is linked to the new enterprises having very low staff numbers.
Although there had been a slower business growth rate relative to Scotland, 2013 saw a large
rise in the number of active enterprises in Dundee. However, business density per head of
population remains lower than Scotland.
Business survival rates have fallen slightly in recent years in Dundee and lag behind Scotland.

Final Report – Improving employability outcomes Page 106
Rocket Science 2015
Figure 30: Key “demand side” observations on Dundee [Source: [1] Business Register and Employment Survey; [2] Local Government
Growth Sectors Database; [3] ONS Business Demography; [4] ONS Mid Year Population Estimates]
Key Observation (2011 data) Indicator 2009 2010 2011 2012 2013 2014 Trend Updated Observation (Latest Data) Source
Falling number of jobs overallVolume of jobs
(employees)75,600 73,300 72,000 71,400 71,800
Decline halted with steady number of jobs over
2011-2013. [1]
High dependency on public sector
Proportion of
employees in
private sector
33.4% 35.4% 33.7% 33.2% 32.5% Still high dependency on public sector, but reducing slightly[1]
Major sectors are health, retail, education
and public administration, with
manufacturing continuing to decline from a
historically high base.
Volume of jobs
(employees)[Not updated - requires restricted BRES access] [1]
Number of
enterprises990 985 1030 1055 1145
Number of enterprises continuing to rise, but all
of this due to rise of enterprises with zero
employees or 1-49 employees. There are now
fewer big employers (250+) in the growth
sectors.
[2]
Employment 15000 12700 11900 12100
Falling employment in growth sectors (including
in the key tourism and financial & business
services sectors)
[2]
High and increasing employment in
knowledge-intensive industries
% of employee
jobs in knowledge
intensive
industries
48.3% 49.4% [Not updated - requires restricted BRES access] [1]
Slower business growth rate relative to
Scotland
Number of active
enterprises325 345 335 400 515
Large recent increase in the number of active
enterprises[3]
Low business density per head
Number of
businesses per
adult (16-64)
26.1 27.0 26.0 26.8 27.7Number of businesses per 1000 adults remains
below Scotland (36.7 in 2013)[3];[4]
Low business start up rate per head, with
no growth in this trend
Number of
business births per
head
2.67 2.83 2.71 3.23 4.14
Recent growth in the business start ups per
1000 adults, although still slightly below
Scotland (4.9 in 2013)
[3];[4]
Modestly positive business churn rate
(1.1%) but lower than Scotland
Business churn
rate ((births-
deaths)/stock)
0.2% -0.8% 1.1% 0.9% 5.2%Churn rate now higher than Scotland (4.1% in
2013)[3]
Slightly lower business 3 year survival rate
than Scotland
3 year survival
rate58.5% 53.8% 55.1%
Business survival rates fallen slightly and still
below Scotland[3]
Growing number of enterprises but falling
employment in growth sectors. Tourism
and financial and business services
dominate growth sectors -

Final Report – Improving employability outcomes Page 107
Rocket Science 2015
Figure shows the industries of employment in Dundee. Considering the three largest industry sectors,
Dundee has a higher proportion of its employment in public administration, education and health and in
distribution, hotels and restaurants, but a lower proportion in the banking, finance and insurance sector.
However, since 2007, the proportion employed in the banking, finance and insurance sector has grown in
Dundee.
Tayside overall has high employment in the food and drink, life sciences and tourism industries25.
Figure 31: Industry of employment in Dundee [Source: Annual Population Survey, NOMIS]
25 Regional Skills Assessment for Tayside, Nov 2014
0
5
10
15
20
25
30
35
40
45
20
07
-03
20
07
-06
20
07
-09
20
07
-12
20
08
-03
20
08
-06
20
08
-09
20
08
-12
20
09
-03
20
09
-06
20
09
-09
20
09
-12
20
10
-03
20
10
-06
20
10
-09
20
10
-12
20
11
-03
20
11
-06
20
11
-09
20
11
-12
20
12
-03
20
12
-06
20
12
-09
20
12
-12
20
13
-03
20
13
-06
20
13
-09
20
13
-12
20
14
-03
20
14
-06
20
14
-09
20
14
-12
Industry of Employment - Dundee. Aged 16-64
% aged 16-64 in employment who work in - Cmanufacturing (SIC 2007)
% aged 16-64 in employment who work in - Fconstruction (SIC 2007)
% aged 16-64 in employment who work in - G,Idistribution, hotels and restaurants(SIC 2007)
% aged 16-64 in employment who work in - H,Jtransport and communications (SIC2007)
% aged 16-64 in employment who work in - K-Nbanking, finance and insurance (SIC2007)
% aged 16-64 in employment who work in - O-Qpublic admin. education and health(SIC 2007)
% aged 16-64 in employment who work in - R-Uother services (SIC 2007)
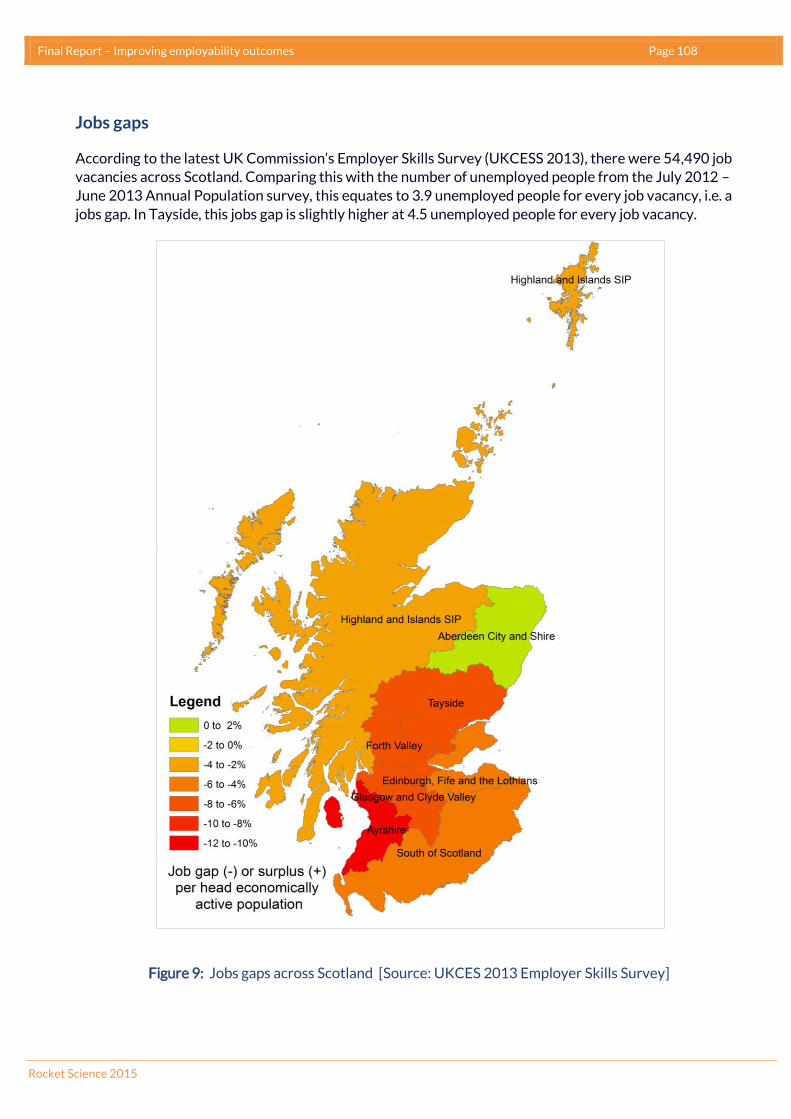
Final Report – Improving employability outcomes Page 108
Rocket Science 2015
Jobs gaps
According to the latest UK Commission’s Employer Skills Survey (UKCESS 2013), there were 54,490 job
vacancies across Scotland. Comparing this with the number of unemployed people from the July 2012 –
June 2013 Annual Population survey, this equates to 3.9 unemployed people for every job vacancy, i.e. a
jobs gap. In Tayside, this jobs gap is slightly higher at 4.5 unemployed people for every job vacancy.
Figure 9: Jobs gaps across Scotland [Source: UKCES 2013 Employer Skills Survey]

Final Report – Improving employability outcomes Page 109
Rocket Science 2015
Skills gaps in Dundee (people in employment)
Skills Development Scotland’s 2014 Regional Skills Assessment found that 23% of establishments in
Tayside had skills gaps, compared to 19% across Scotland. Tayside employers reported that new recruits
including school leavers, college leavers and university graduates were generally well or very well
prepared for work, although less well for work prepared than average for employers in Scotland. 26
The largest skills gaps by occupation in Tayside, as identified by the Regional Skills Assessment, are for
process and machine operatives (14% of all in employment have a skills gap) and caring, leisure and other
service occupations (12% of all in employment have a skills gap). For both these occupational
classifications, the skills gap in Tayside is around twice the national skills gap.
Vacancies and skills shortages (unemployed people)
Although there is a jobs gap in Tayside and across Scotland, there is an additional challenge for getting
people into employment, namely skills shortages preventing job vacancies from being filled.
The maps in Figure 10 show vacancies and skills shortage vacancies for different types of employment.
The horizontal axis shows the number of vacancies as a proportion of “optimal employment” (ie,
vacancies + employment) – points further along the axis show employment sectors with a higher
proportion of vacancies. The vertical axis shows the proportion of these vacancies that are deemed to be
due to a skills shortage – points further along the axis show employment sectors that are facing issues
with a lack of the required skills in the area.
In Tayside, there are two employment types with a particularly high level of vacancies – machine
operatives and skilled trades occupations. For both types of employment, over a quarter of the vacancies
are deemed to be unfilled due to a skills shortage. While half of the manager position vacancies are
deemed to be due to skills shortages, these vacancies comprise a small proportion (less than 1%) of the
optimal employment in this sector. There are notably fewer vacancies for “professionals” and “caring,
leisure and other services staff” in Tayside compared to Scotland. It is interesting to note that in “caring,
leisure and other services staff”, there appears not to be a skills shortage, yet we showed above that this
was one of the employment types with the highest skills gaps (ie of those in employment) in Tayside.
26 Regional Skills Assessment for Tayside, Nov 2014, quoting UKCES Employer Skills Survey 2013
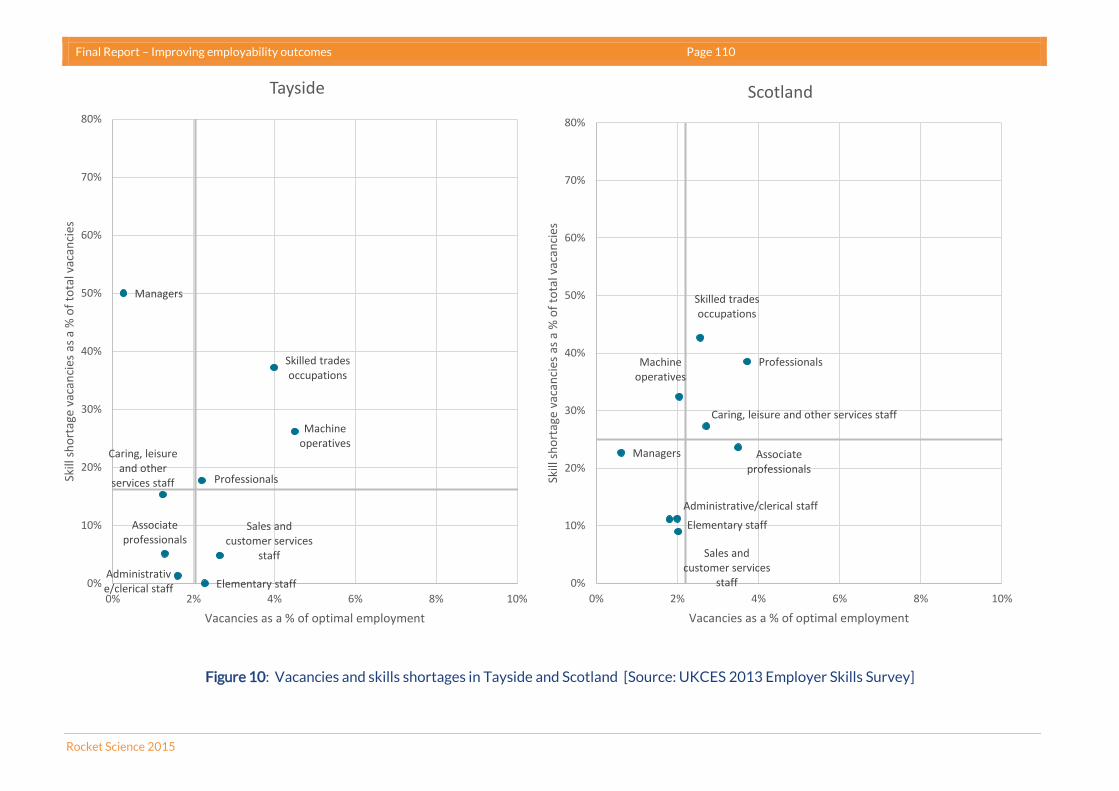
Final Report – Improving employability outcomes Page 110
Rocket Science 2015
Figure 10: Vacancies and skills shortages in Tayside and Scotland [Source: UKCES 2013 Employer Skills Survey]
Managers
Professionals
Associate professionals
Administrative/clerical staff
Skilled trades occupations
Caring, leisure and other
services staff
Sales and customer services
staff
Machine operatives
Elementary staff0%
10%
20%
30%
40%
50%
60%
70%
80%
0% 2% 4% 6% 8% 10%
Skill
sh
ort
age
vaca
nci
es a
s a
% o
f to
tal v
acan
cies
Vacancies as a % of optimal employment
Tayside
Managers
Professionals
Associate professionals
Administrative/clerical staff
Skilled trades occupations
Caring, leisure and other services staff
Sales and customer services
staff
Machine operatives
Elementary staff
0%
10%
20%
30%
40%
50%
60%
70%
80%
0% 2% 4% 6% 8% 10%
Skill
sh
ort
age
vaca
nci
es a
s a
% o
f to
tal v
acan
cies
Vacancies as a % of optimal employment
Scotland

Final Report – Improving employability outcomes in Dundee Page 111
Rocket Science 2015
Appendix 2: Performance of the DCC/ESF pipeline in Dundee
Dundee City Council obtained European Structural Fund grants towards an integrated programme of
employability provision along the Employability Pipeline, first in 2008 and again with a re-worked
Pipeline model in 2013-14. The first Pipeline was funded as part of the first phase of the Dundee
European Programme (DEP), using ESF and ERDF funds. The second Pipeline was funded under the DEP
phase three. In this Appendix we set out an analysis of the main features and performance of these
Pipelines.
2008-2014 Pipeline
Pipeline structure
The 2008+ Employability Pipeline Model consisted of three parallel eight-stage pipelines, targeting
young people, people with health problems and unemployed adults respectively. The eight stages
referred to in each pipeline were as follows:
Stage 1: referral/engagement
Stage 2: initial needs assessment
Stage 3: specialist intervention
Stage 4: employability training
Stage 5: accredited training
Stage 6: work placement
Stage 7: job brokerage and job matching
Stage 8: in-work aftercare
While all clients entered the pipeline through stages 1 and 2, thereafter clients could be referred through
to any stage, including skipping stages, being referred “backwards” along the pathway, repeating stages
or repeatedly re-entering the pathway, so that the maximum number of pipeline progressions recorded is
higher than 7.
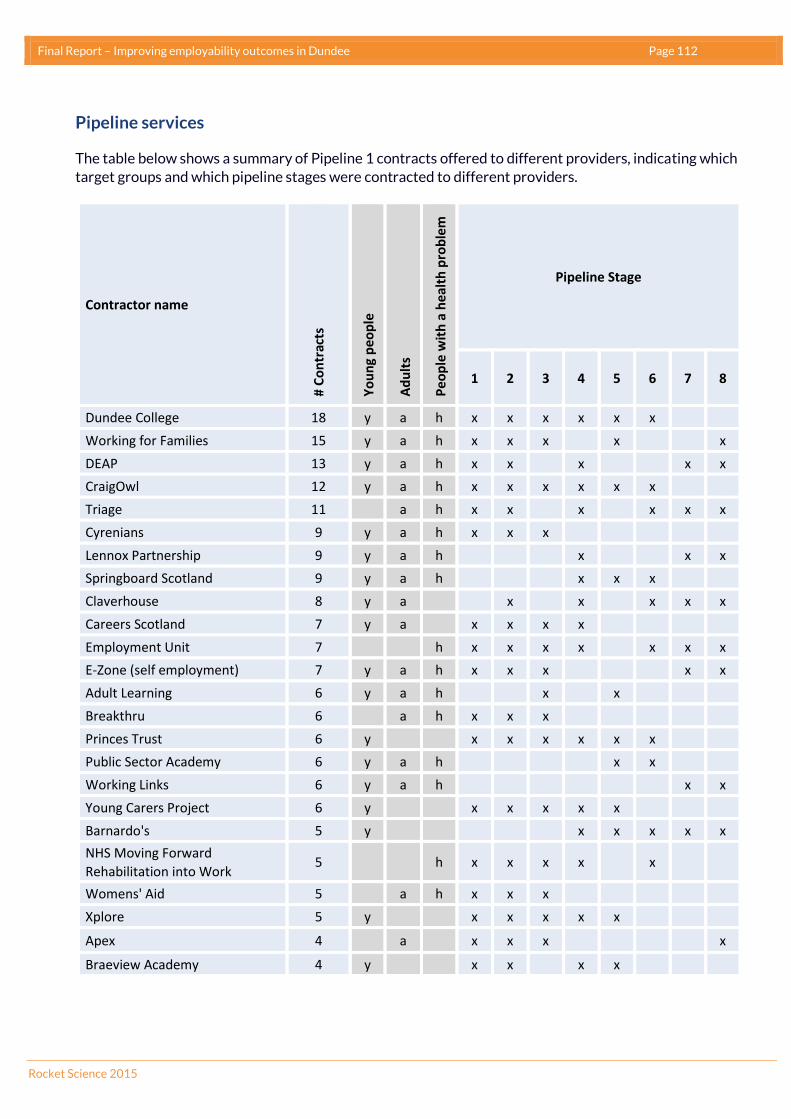
Final Report – Improving employability outcomes in Dundee Page 112
Rocket Science 2015
Pipeline services
The table below shows a summary of Pipeline 1 contracts offered to different providers, indicating which
target groups and which pipeline stages were contracted to different providers.
Contractor name #
Co
ntr
acts
Yo
un
g p
eop
le
Ad
ult
s
Pe
op
le w
ith
a h
ealt
h p
rob
lem
Pipeline Stage
1 2 3 4 5 6 7 8
Dundee College 18 y a h x x x x x x
Working for Families 15 y a h x x x x x
DEAP 13 y a h x x x x x
CraigOwl 12 y a h x x x x x x
Triage 11 a h x x x x x x
Cyrenians 9 y a h x x x
Lennox Partnership 9 y a h x x x
Springboard Scotland 9 y a h x x x
Claverhouse 8 y a x x x x x
Careers Scotland 7 y a x x x x
Employment Unit 7 h x x x x x x x
E-Zone (self employment) 7 y a h x x x x x
Adult Learning 6 y a h x x
Breakthru 6 a h x x x
Princes Trust 6 y x x x x x x
Public Sector Academy 6 y a h x x
Working Links 6 y a h x x
Young Carers Project 6 y x x x x x
Barnardo's 5 y x x x x x
NHS Moving Forward
Rehabilitation into Work 5 h x x x x x
Womens' Aid 5 a h x x x
Xplore 5 y x x x x x
Apex 4 a x x x x
Braeview Academy 4 y x x x x
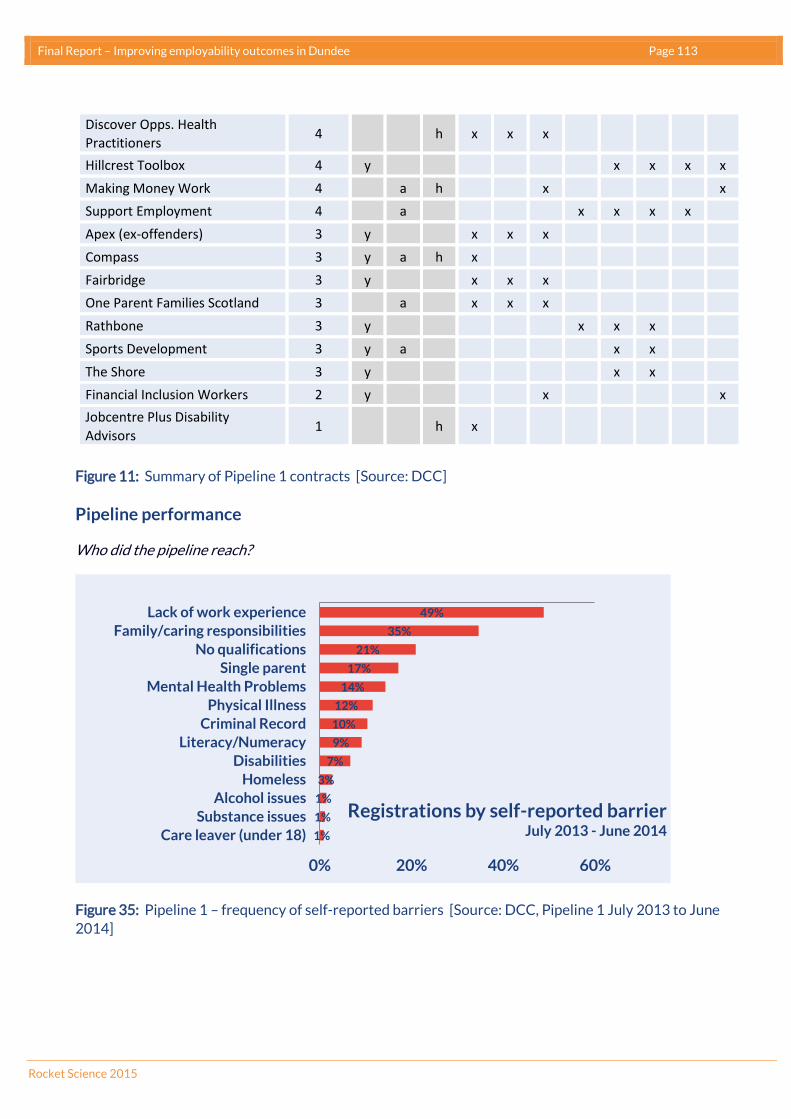
Final Report – Improving employability outcomes in Dundee Page 113
Rocket Science 2015
Discover Opps. Health
Practitioners 4 h x x x
Hillcrest Toolbox 4 y x x x x
Making Money Work 4 a h x x
Support Employment 4 a x x x x
Apex (ex-offenders) 3 y x x x
Compass 3 y a h x
Fairbridge 3 y x x x
One Parent Families Scotland 3 a x x x
Rathbone 3 y x x x
Sports Development 3 y a x x
The Shore 3 y x x
Financial Inclusion Workers 2 y x x
Jobcentre Plus Disability
Advisors 1 h x
Figure 11: Summary of Pipeline 1 contracts [Source: DCC]
Pipeline performance
Who did the pipeline reach?
Figure 35: Pipeline 1 – frequency of self-reported barriers [Source: DCC, Pipeline 1 July 2013 to June
2014]
49%
35%
21%
17%
14%
12%
10%
9%
7%
3%
1%
1%
1%
0% 20% 40% 60%
Lack of work experience
Family/caring responsibilities
No qualifications
Single parent
Mental Health Problems
Physical Illness
Criminal Record
Literacy/Numeracy
Disabilities
Homeless
Alcohol issues
Substance issues
Care leaver (under 18)
Registrations by self-reported barrierJuly 2013 - June 2014

Final Report – Improving employability outcomes in Dundee Page 114
Rocket Science 2015
Outcomes by age and barrier- Pipeline 1, July 2013 to June 2014
Figure 36: Pipeline 1 – outcomes by age and gender [Source: DCC, Pipeline 1 July 2013 to June 2014]
Outcomes by employment status- Pipeline 1, July 2013 to June 2014
Figure 37: Pipeline 1 – outcomes by employment status [Source: DCC, Pipeline 1 July 2013 to June
2014]
Roughly half of all clients on Pipeline 1 were economically inactive and jobless (e.g. claiming ESA, Carers’
Allowance or isability benefits). Job outcome rates were slightly higher for Registered Unemployed
clients (claiming JSA) while more Inactive Jobless clients achieved training outcomes.
38%
30%
35%
26%
784
1087
881
1250
0 500 1000 1500
Males under 25
Males 25 or over
Females under 25
Females 25 or over
Outcomes by age and genderJuly 2013 - June 2014 leavers
Job outcome Training outcome No outcome
5%
36%
31%
284
1734
1973
0 500 1000 1500 2000 2500
Employed
Registered Unemployed
Inactive Jobless
Outcomes by Employment StatusJuly 2013 - June 2014 leavers
Job outcome Training outcome Left without outcome

Final Report – Improving employability outcomes in Dundee Page 115
Rocket Science 2015
Outcomes by Qualification- Pipeline 1, July 2013 to June 2014
Figure 38: Pipeline 1 – outcomes by highest qualification [Source: DCC, Pipeline 1 July 2013 to June
2014]
Pipeline 1 had the highest rate of job outcomes for people whose highest qualification were level 3
qualifications- Highers or equivalent. The majority of registrations in 2013/14 (just over 50%) had
qualifications equivalent to Standard Grade as their highest level of qualification attained.
23%
16%
34%
41%
33%
29%
880
67
2000
316
305
434
0 500 1000 1500 2000 2500
None
Level 1
Level 2
Level 3
Level 4
Level 5
Outcomes by Highest qualification
Job outcome Training Outcome No outcome

Final Report – Improving employability outcomes in Dundee Page 116
Rocket Science 2015
Figure 39: Pipeline 1 – geographical distribution of clients [Source: DCC, Pipeline 1 July 2013 to June
2014]
Figure 39 shows the extent to which Pipeline 1 employability provision was geographically matched to
need. Intermediate zones below the red line (indicating the lower quartile rate of pipeline registrations
per resident claimant. Two areas with relatively high claimant count stand out as under-serviced by
Pipeline 1: Douglas West and Docks and Wellgate.
Areas above the green 1:1 line show where the total number of registrations in the area exceeds the
number of people claiming out-of-work benefits in the area at the time, according to DWP statistics.
Ardler and St Marys
Balgay
Barnhill
Baxter Park
Broughty Ferry East
Broughty Ferry West
Caird Park
Charleston
Craigie and Craigiebank
Docks and Wellgate
Douglas East
Douglas West
DownfieldFairmuir
Fintry
Hilltown
KirktonLaw
Linlathen and Midcraigie
Logie and Blackness
Menzieshill
Perth Road
The Glens
West Ferry
West PitkerroWestend
Western Edge
Whitfield
00
20
40
60
80
100
120
140
160
180
200
0 50 100 150 200
Tota
l pip
eli
ne
re
gis
tra
tio
ns
20
13
/14
Claimant count
1:1 line
lower quartile line

Final Report – Improving employability outcomes in Dundee Page 117
Rocket Science 2015
Geographical distribution of Pipeline 1 outcomes- Job outcomes by Intermediate Zone
Figure 40: Pipeline 1 – job outcomes by geography [Source: DCC, Pipeline 1 July 2013 to June 2014]
Looking at the number of job outcomes achieved through Pipeline 1 activity per intermediate zone
(Figure 40), performance in terms of outcomes per out-of-work benefit claimant also stand out as
unusually low for Douglas West and Docks and Wellgate; this time Charleston joins them as an area with
particularly low performance on job outcomes relative to the number of out-of-work benefit claimants.
Ardler and St Marys
Balgay
Barnhill
Baxter Park
Broughty Ferry East
Broughty Ferry West
Caird Park
Charleston
Craigie and CraigiebankDocks and Wellgate
Douglas East Douglas West
Downfield
Fairmuir
Fintry
Hilltown
KirktonLaw
Linlathen and Midcraigie
Logie and Blackness
Menzieshill
Perth Road
The Glens
West Ferry
West Pitkerro
Westend
Western Edge
Whitfield
0
10
20
30
40
50
60
70
80
90
100
0 50 100 150 200
Ind
ivid
ua
ls w
ith
pip
eli
ne
ou
tco
me
s 2
01
3/1
4
Claimant count
1:1 line
lower quartile line

Final Report – Improving employability outcomes in Dundee Page 118
Rocket Science 2015
Figure 41: Pipeline 1 – job outcomes by geography as a proportion of registrations [Source: DCC, Pipeline
1 July 2013 to June 2014]
Figure 41 shows the geographic distribution of performance in terms of job outcomes, and highlights that
areas with low numbers of registrations (such as West Pitkerro, West Ferry, Baxter Park, Downfield and
Balgay) are able to produce very high job outcome rates. This is likely to reflect a combination of less
stretched local resources, and less deprived areas. Again, Docks and Wellgate stands out as an area with
an unusually low job outcome rate.
Ardler and St Marys
Balgay
Barnhill
Baxter Park
Broughty Ferry East
Broughty Ferry West
Caird Park
Charleston
Craigie and Craigiebank
Docks and Wellgate
Douglas East
Douglas West
Downfield
FairmuirFintry
Hilltown
Kirkton
Law
Linlathen and Midcraigie
Lochee
Logie and Blackness
Menzieshill
Perth RoadStobswell
The Glens
West Ferry
West Pitkerro
Westend
Western Edge
Whitfield
0%
10%
20%
30%
40%
50%
60%
70%
80%
90%
100%
0 50 100 150 200
Job
ou
tco
me
ra
te 2
01
3/1
4
Pipeline registrations 2013/14
lower quartile line

Final Report – Improving employability outcomes in Dundee Page 119
Rocket Science 2015
2014+ Pipeline
Pipeline structure
The second pipeline was commissioned from 2013 and came into operation in July 2014. This pipeline
consists of a single five-stage pipeline, with stages as follows:
Stage 1 Registration, Assessment, Case Management
Stage 2 Overcoming Barriers
Stage 3 Work Focussed Training
Stage 4 Work Activity Stage
Stage 5 Job sustainability and In-work development.
Some services at each stage are targeted at key groups such as young people, people with health
conditions, or adults, while other services are generic. Services for different groups were not
commissioned separately, and the three (overlapping) groups interact in the same pathway.
Focus of delivery Pipeline services
Contractors – Pipeline 2
Contractor Contracts Pipeline Stage
1 2 3 4 5
Lifeskills 9 9
Claverhouse 7 3 4
Employment Support Service 5 2 1 2
CraigOwl 4 1 1 2
The Shore 3 1 1 1
Working for Families 3 3
Youth Employability Team 2 1 1
Community Learning and Development 2 1 1
Welfare Rights 2 1 1
E-Zone (self employment) 1 1
Venture Trust 1 1

Final Report – Improving employability outcomes in Dundee Page 120
Rocket Science 2015
Pipeline performance
Who registered?
411
470
312
188
147
104
143
114
79
43
0 200 400 600
Aged 16-19
Aged 20-24
Aged 25-29
Aged 30-34
Aged 35-39
Aged 40-44
Aged 45-49
Aged 50-54
Aged 55-59
Aged 60+
Pipeline registrations by age, July 2014-June 2015
973
920
769
693
565
255
192
190
159
156
121
92
49
48
16
15
0 500 1000 1500
Young Person (Aged 25 and Under)
Adult (Aged 26 and Over)
Living in a Jobless Household
Lack of Work Experience
Family/Caring Responsibilities
No Qualifications
Mental Health Problems
Criminal Record
Literacy/Numeracy
Disabilities
Physical Illness
Migrant/Foreign…
Care Leaver (Under 18)
Homeless
Substance Issues
Alcohol Issues
Pipeline registrations by barrier, July 2014 -June 2015
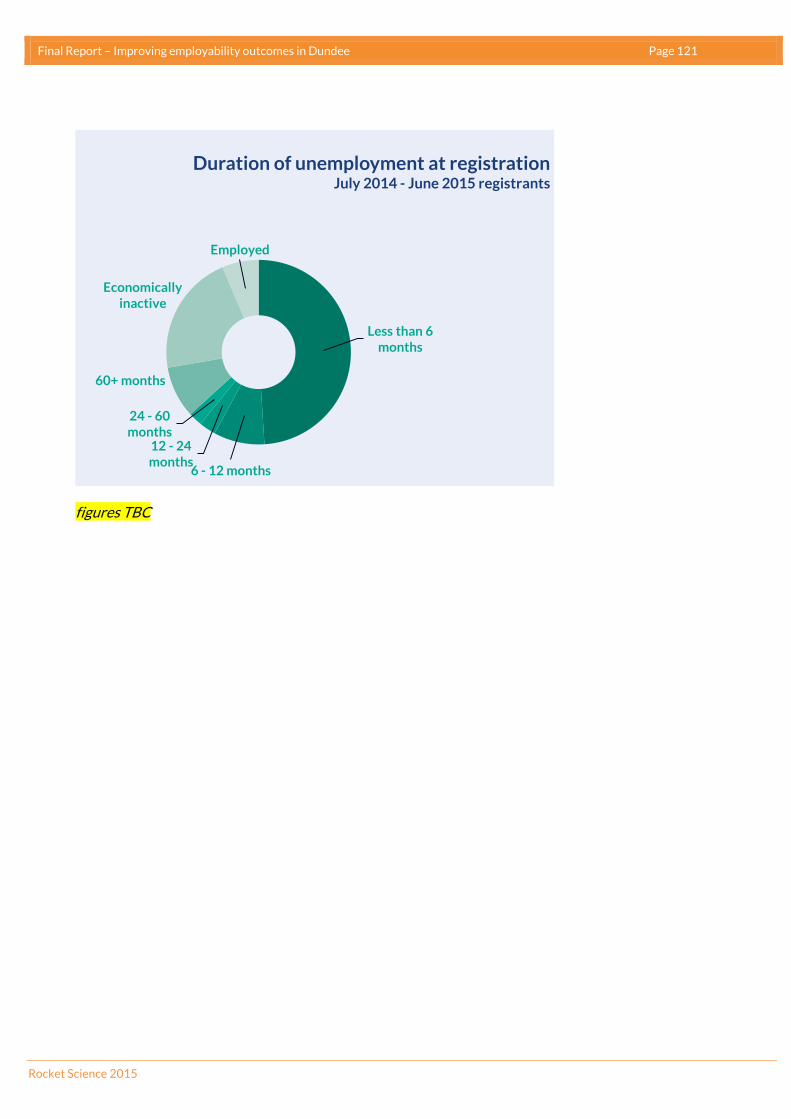
Final Report – Improving employability outcomes in Dundee Page 121
Rocket Science 2015
figures TBC
Less than 6 months
6 - 12 months
12 - 24 months
24 - 60 months
60+ months
Economically inactive
Employed
Duration of unemployment at registrationJuly 2014 - June 2015 registrants

Final Report – Improving employability outcomes in Dundee Page 122
Rocket Science 2015
Who benefitted?
Pipeline performance data in terms of job outcomes are limited, due to a) the early stage of the second
pipeline and b) some issues around the case management system, resulting in suspected under-counting
of outcomes.

Final Report – Improving employability outcomes in Dundee Page 123
Rocket Science 2015
Registrations by level of qualification– Pipeline 2
Level 1: Access 1; Access 2
Level 2: Access 3; Foundation Standard Grade; Intermediate 1; General Standard Grade; Intermediate 2; Credit Standard Grade; SVQ Level 1 & 2.
Level 3: Higher; SVQ Level 3.
78
149
87
65
55
36
44
46
34
14
76
83
35
1
1
0 50 100 150 200 250
16-19
20-24
25-29
30-34
35-39
40-44
45-49
50-54
55-59
60+
Referrals to Job Brokerage programmes by age cohort, July 2014 to June 2015
Job Brokerage, Make it Work (CraigOwl)
16%
31%
23%
33%
25%
24%
31%
312
29
1,060
212
126
205
39
0 500 1000 1500
No qualifications
Level 1
Level 2
Level 3
Level 4
Level 5
Level 6
Outcomes by qualification levelJuly 2014 - June 2015 registrants
Job outcome Education outcome Self-employment No outcome yet
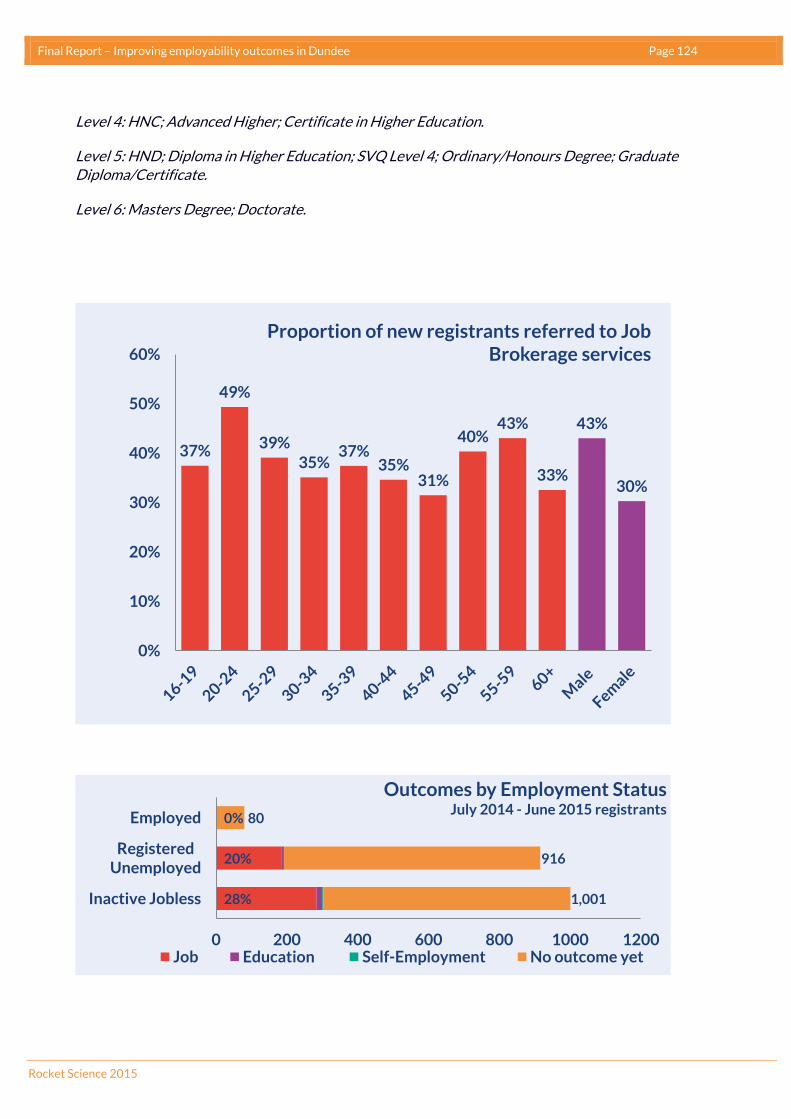
Final Report – Improving employability outcomes in Dundee Page 124
Rocket Science 2015
Level 4: HNC; Advanced Higher; Certificate in Higher Education.
Level 5: HND; Diploma in Higher Education; SVQ Level 4; Ordinary/Honours Degree; Graduate Diploma/Certificate.
Level 6: Masters Degree; Doctorate.
37%
49%
39%35%
37%35%
31%
40%43%
33%
43%
30%
0%
10%
20%
30%
40%
50%
60%
Proportion of new registrants referred to Job Brokerage services
28%
20%
0%
1,001
916
80
0 200 400 600 800 1000 1200
Inactive Jobless
RegisteredUnemployed
Employed
Outcomes by Employment StatusJuly 2014 - June 2015 registrants
Job Education Self-Employment No outcome yet
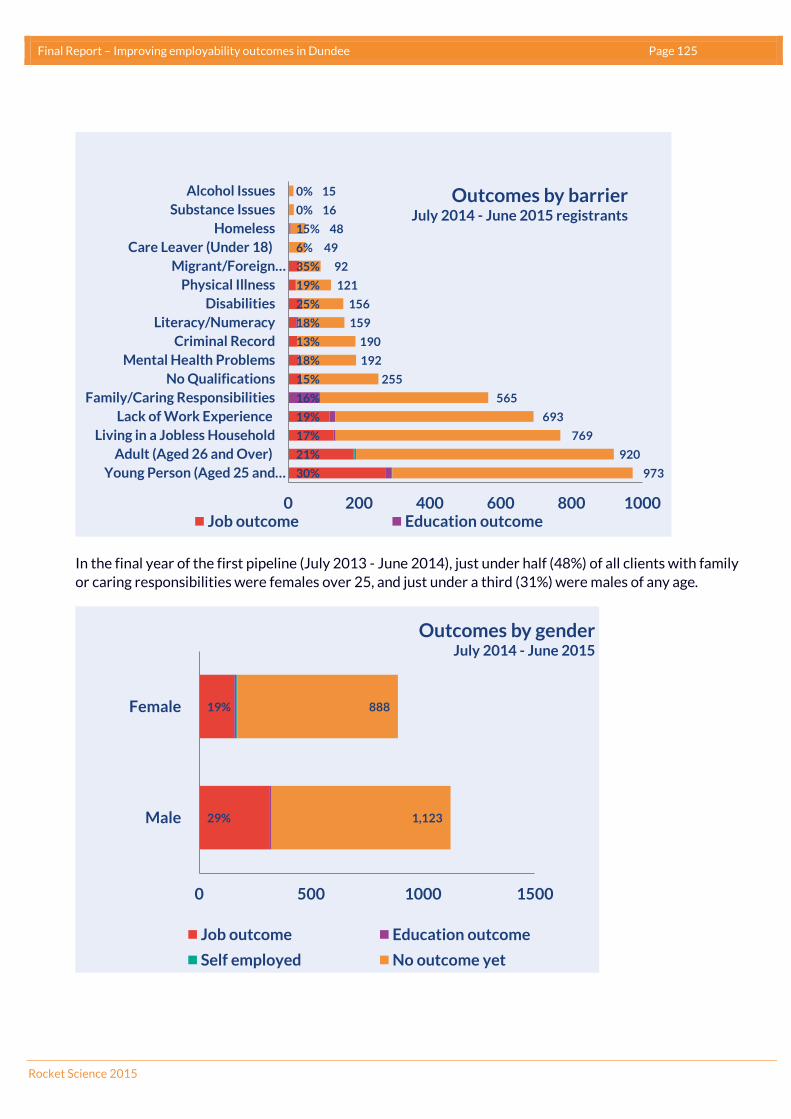
Final Report – Improving employability outcomes in Dundee Page 125
Rocket Science 2015
In the final year of the first pipeline (July 2013 - June 2014), just under half (48%) of all clients with family
or caring responsibilities were females over 25, and just under a third (31%) were males of any age.
30%
21%
17%
19%
16%
15%
18%
13%
18%
25%
19%
35%
6%
15%
0%
0%
973
920
769
693
565
255
192
190
159
156
121
92
49
48
16
15
0 200 400 600 800 1000
Young Person (Aged 25 and…
Adult (Aged 26 and Over)
Living in a Jobless Household
Lack of Work Experience
Family/Caring Responsibilities
No Qualifications
Mental Health Problems
Criminal Record
Literacy/Numeracy
Disabilities
Physical Illness
Migrant/Foreign…
Care Leaver (Under 18)
Homeless
Substance Issues
Alcohol Issues Outcomes by barrierJuly 2014 - June 2015 registrants
Job outcome Education outcome
29%
19%
1,123
888
0 500 1000 1500
Male
Female
Outcomes by genderJuly 2014 - June 2015
Job outcome Education outcome
Self employed No outcome yet

Final Report – Improving employability outcomes in Dundee Page 126
Rocket Science 2015
What changed?
In this section we compare the approach and focus of the two pipelines - deliberately avoiding direct
comparisons of pipeline performance. The two pipelines differed in focus, structure and payment model.
· From grant funding to a stronger focus on payment by results
· Services offered: from holistic to job-focused
· Scope: from inclusive to targeted
· From a multi-player game to integrated contact management
· Many small contracts working across all pipeline stages to fewer, larger contracts.
Pipeline
1
STAGE 1
Referral/
Engagement
STAGE 2
Initial
Needs
Assessment
STAGE 3
Specialist
Intervention
STAGE 4
Employability
Training
STAGE 5
Accredited
Training
STAGE 6
Work
Placement
STAGE 7
Job
brokerage
& job
matching
STAGE 8
In-Work
Aftercare
#
contracts 38 31 35 29 29 22 20 24
Pipeline
2
Stage 1 Registration,
Assessment,
Case Management
Stage 2 Overcoming
Barriers
Stage 3
Work
Focussed
Training
Stage 4 Work Activity
Stage 5 Job
sustainability
& In-work
development
#
contracts 3 11 17 5 3
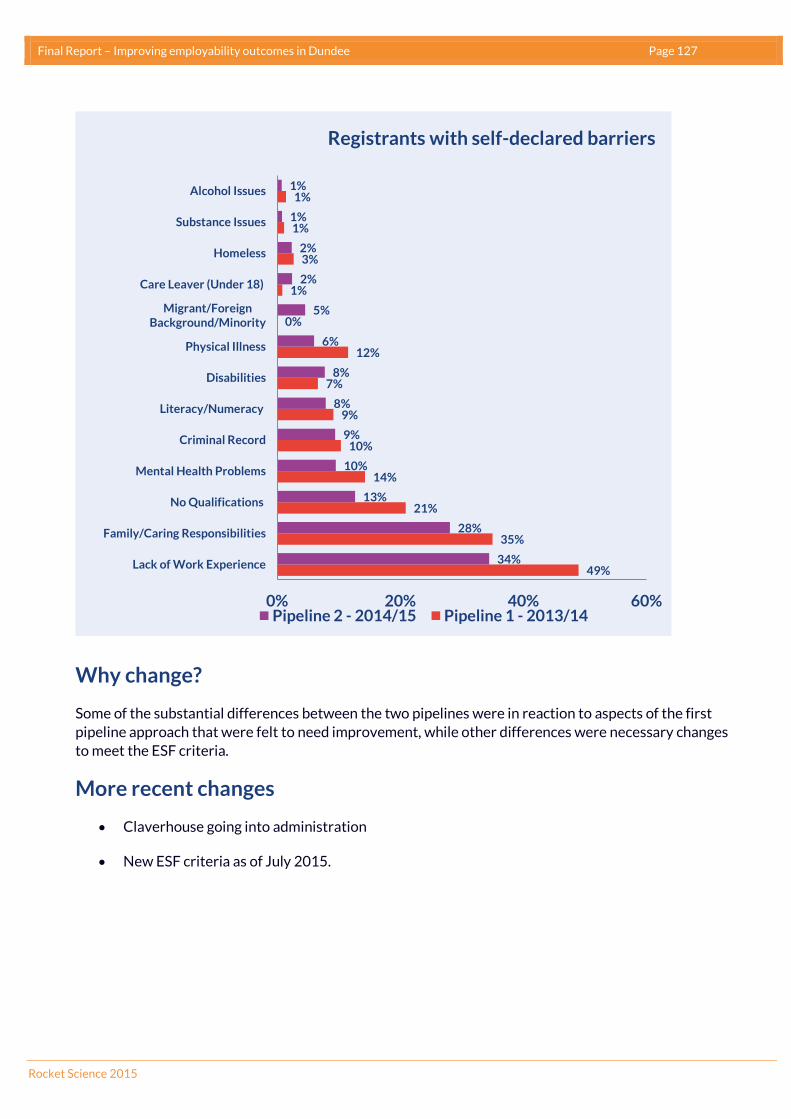
Final Report – Improving employability outcomes in Dundee Page 127
Rocket Science 2015
Why change?
Some of the substantial differences between the two pipelines were in reaction to aspects of the first
pipeline approach that were felt to need improvement, while other differences were necessary changes
to meet the ESF criteria.
More recent changes
Claverhouse going into administration
New ESF criteria as of July 2015.
49%
35%
21%
14%
10%
9%
7%
12%
0%
1%
3%
1%
1%
34%
28%
13%
10%
9%
8%
8%
6%
5%
2%
2%
1%
1%
0% 20% 40% 60%
Lack of Work Experience
Family/Caring Responsibilities
No Qualifications
Mental Health Problems
Criminal Record
Literacy/Numeracy
Disabilities
Physical Illness
Migrant/ForeignBackground/Minority
Care Leaver (Under 18)
Homeless
Substance Issues
Alcohol Issues
Registrants with self-declared barriers
Pipeline 2 - 2014/15 Pipeline 1 - 2013/14
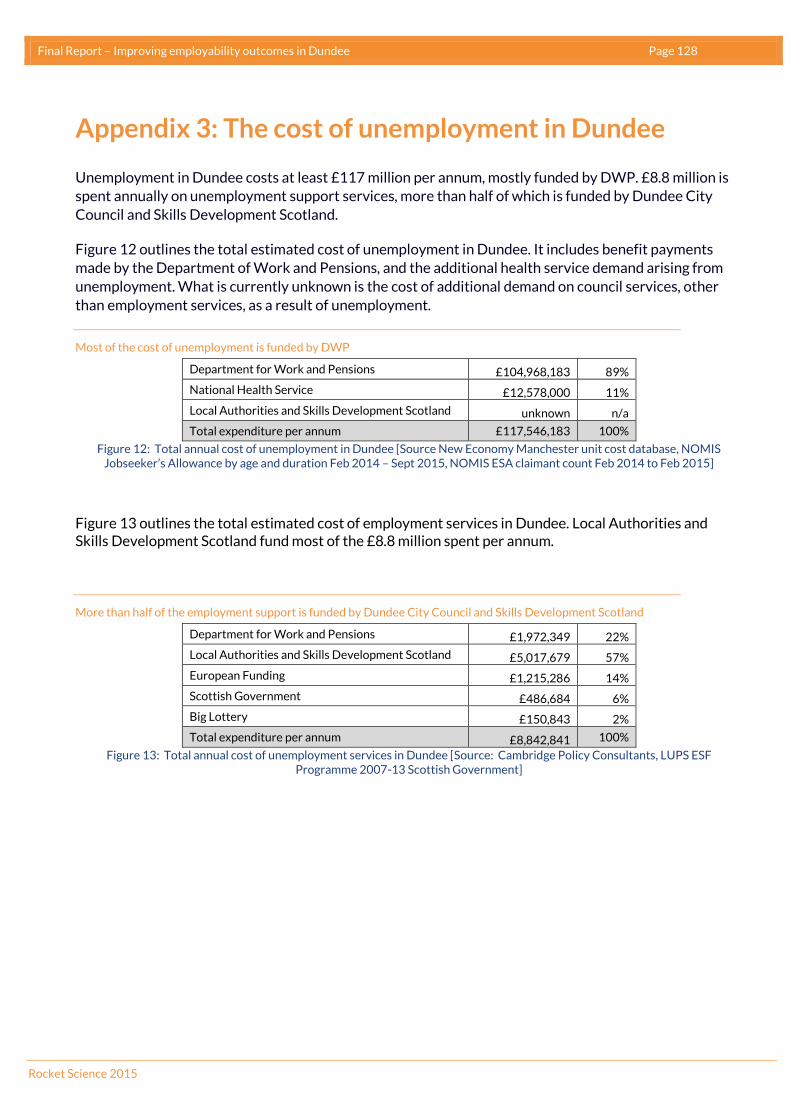
Final Report – Improving employability outcomes in Dundee Page 128
Rocket Science 2015
Appendix 3: The cost of unemployment in Dundee
Unemployment in Dundee costs at least £117 million per annum, mostly funded by DWP. £8.8 million is
spent annually on unemployment support services, more than half of which is funded by Dundee City
Council and Skills Development Scotland.
Figure 12 outlines the total estimated cost of unemployment in Dundee. It includes benefit payments
made by the Department of Work and Pensions, and the additional health service demand arising from
unemployment. What is currently unknown is the cost of additional demand on council services, other
than employment services, as a result of unemployment.
Most of the cost of unemployment is funded by DWP
Department for Work and Pensions £104,968,183 89%
National Health Service £12,578,000 11%
Local Authorities and Skills Development Scotland unknown n/a
Total expenditure per annum £117,546,183 100%
Figure 12: Total annual cost of unemployment in Dundee [Source New Economy Manchester unit cost database, NOMIS Jobseeker’s Allowance by age and duration Feb 2014 – Sept 2015, NOMIS ESA claimant count Feb 2014 to Feb 2015]
Figure 13 outlines the total estimated cost of employment services in Dundee. Local Authorities and Skills Development Scotland fund most of the £8.8 million spent per annum.
More than half of the employment support is funded by Dundee City Council and Skills Development Scotland
Department for Work and Pensions £1,972,349 22%
Local Authorities and Skills Development Scotland £5,017,679 57%
European Funding £1,215,286 14%
Scottish Government £486,684 6%
Big Lottery £150,843 2%
Total expenditure per annum £8,842,841 100%
Figure 13: Total annual cost of unemployment services in Dundee [Source: Cambridge Policy Consultants, LUPS ESF Programme 2007-13 Scottish Government]
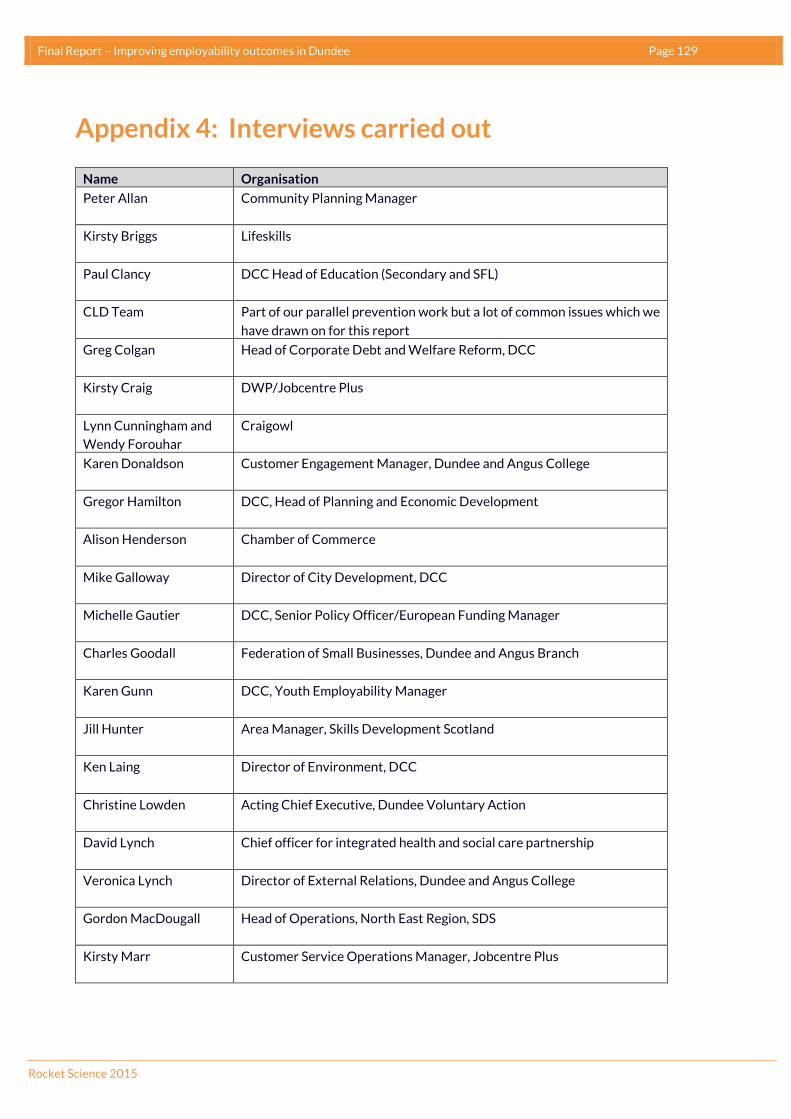
Final Report – Improving employability outcomes in Dundee Page 129
Rocket Science 2015
Appendix 4: Interviews carried out
Name Organisation
Peter Allan
Community Planning Manager
Kirsty Briggs Lifeskills
Paul Clancy
DCC Head of Education (Secondary and SFL)
CLD Team
Part of our parallel prevention work but a lot of common issues which we
have drawn on for this report
Greg Colgan Head of Corporate Debt and Welfare Reform, DCC
Kirsty Craig DWP/Jobcentre Plus
Lynn Cunningham and
Wendy Forouhar
Craigowl
Karen Donaldson
Customer Engagement Manager, Dundee and Angus College
Gregor Hamilton
DCC, Head of Planning and Economic Development
Alison Henderson Chamber of Commerce
Mike Galloway Director of City Development, DCC
Michelle Gautier
DCC, Senior Policy Officer/European Funding Manager
Charles Goodall
Federation of Small Businesses, Dundee and Angus Branch
Karen Gunn
DCC, Youth Employability Manager
Jill Hunter
Area Manager, Skills Development Scotland
Ken Laing Director of Environment, DCC
Christine Lowden
Acting Chief Executive, Dundee Voluntary Action
David Lynch Chief officer for integrated health and social care partnership
Veronica Lynch
Director of External Relations, Dundee and Angus College
Gordon MacDougall
Head of Operations, North East Region, SDS
Kirsty Marr
Customer Service Operations Manager, Jobcentre Plus

Final Report – Improving employability outcomes in Dundee Page 130
Rocket Science 2015
Name Organisation
David Martin Chief Executive, DCC
Craig Mason Welfare Rights Team
Allan Millar
Employability Manager, DCC
Stewart Murdoch Director, Leisure and Communities, DCC
Paul de Paulette Ingeus
Lucy Rennie
Strategy and Performance Manager, NHS Tayside
Janet Robertson Head of Human Resources and Business Support, DCC
Bert Sandeman
DCC, Manager, Integrated Children’s Services
Jaqui Spence Modern Apprentice Coordinator, DCC
Marjory Stewart
Director of Corporate Services, DCC
Victoria Sutherland TERU (about national review of Strategic Skills Pipeline)
Rachael Thomas
Public Sector Recruitment Approach Manager, DCC
Kiley West
Opportunities for All Manager, DCC

Final Report – Improving employability outcomes in Dundee Page 131
Rocket Science 2015
Appendix 5: Output from Dundee Partnership Forum
The new approach to employability in Dundee as set out in this Report was the focus of the Dundee
Partnership Forum on 28th October 2015. The theme was ‘Creating a World Class Employability Service
for Dundee’. In this Appendix we set out the main points and issues that were raised in the breakout
group discussions.
What are the most important opportunities for improvement from you experience and perspective?
Ideas identified as most important included:
We need to have a more targeted approach – not one size fits all
We need to ensure that the different support services are integrated around the specific needs of
individual clients and households – and communities
Services need to be tailored to the needs of each client – and so need to be flexible enough to
allow this to happen
We need to identify better approaches to client engagement approaches and providing clear
support pathways
We believe we will enhance performance if clients are better incentivised with ‘more carrot, less stick’
There should be a coherent partnership plan to capitalise on employer engagement
Public sector leadership of job creation and budgeting to achieve this
We need to positively support people into work. It’s not enough to say to them ‘get a job’. Some
people have chaotic lifestyles
We need to ensure that we are able to offer pre-employment support for those furthest from
work
Simplify and co-ordinate employability contacts More focus on employer needs and working to match this with our claimants.
Ensuring that clients are familiar with in-work etiquette.
Develop collaborative approaches that enhance partnership working for the benefit of clients and
remove competition between providers
Need some basic life-skills first and foremost, and having meaningful things to do. Employment is
about more than earning money – it builds confidence, gains skills, fills days, makes relationships
Early intervention and preventative action
Be responsive to clients (individuals and employers)
Targeting those that need the most help to find work.
Breakout session 2 : Imagine it is October 2020. What are the main features of the excellent service we have built for Dundee since 2015? 1 Who does it serve really well?
Everyone – service users, especially most disadvantaged, employers, service providers
The whole community, as the positive benefits of people being in work have been widely felt
City of Dundee – all are now equal, especially those who were disadvantaged; increased diversity, we are
a Living Wage City
Final Report – Improving employability outcomes in Dundee Page 132
Rocket Science 2015
Employers, families, young people and long-term unemployed people, whole communities
Half of disabled people are into work
Employers
The customers of the businesses as they get a great service
The workforce – they are being developed and valued
Good for young people going into good jobs
Dundee – it has leapt to second place in the Quality of Life index
Every individual in the city – serves the people who, in 2015, didn’t think they would need a service but
now do
Children in the city – serves the City, Scotland and the world well
Serves the people of 2030, 2040 and 2050
Employers - because no skills gaps and they have a good workforce
2 What makes it so good? a General
We make best use of technology and social media
We have de-stigmatised poverty and benefits dependency
Employability is something which employers accept is part of their offer if they are based in Dundee
Ethos of employability in every organisation who comes into contact with every member of their
community
Shared goals to help citizens to improve health, financial circumstances, integrated opportunities – co-
designed and co-located
No longer a tale of two cities – everyone shares in the city’s success; co-design with agencies, employers,
community; co-located service hubs; community-based and person-centred; Dundee does not stigmatise
the poor and the unemployed
Makes a long-term sustainable difference to people’ lives
It raised aspirations and it offers jobs with real progression
Some evidence developing to show inter-generational cycle of worklessness improving
Flexible approach to creating confident, motivated people, who will self-direct and control their own lives
The ‘system’ is fair, open and inclusive
Trust and full confidence in the support available; good employment opportunities for people
Population of Dundee and the Business Community focus on the communities with the highest levels of
deprivation and poverty
The population has an opportunity to share in the growing success of Dundee
b Client viewpoint
Better off financially
Clients feel the service is for them regardless of their needs; may need to be layered, depending on needs
Tailored to individual needs promptly
Holistic approach
Accessible services
People are the focus, not organisations protecting themselves with small funding streams
We are now listening and acting on their views
We are all one service (not labelled separately)

Final Report – Improving employability outcomes in Dundee Page 133
Rocket Science 2015
We helped create it
We’ve had wrap-around support
Everyone tells us to go there
Equality of opportunity
Inclusion regardless of funding sources
Impact on communities
Trust the service
Voice within the service, including evaluation
People are getting and keeping jobs
It promotes client aspirations (not just ‘get a job’)
Integrated services – joined up well
Takes culture into account – range of opportunities to give choice
Don’t feel like a statistic
Proud to be part of the service
Ambassador of the future
In employment
Earning
Feel different
Person-centred
Motivated to participate
Produces results
Post-service support to sustain employment
Opportunity for support to move up to career ladder
Meets the needs of people not in the mainstream; communication; wider outcomes recognised
A job – sustainable, positive outcome and it pays well
I feel valued, I have a purpose, it is accessible, it is useful, I think it’s valuable
It is tailored to me, I got a job, it’s voluntary and it’s something I wanted to do, it motivated me, I knew
about it
No empty promises; well marketed
Living wage; asked what we need; we’re empowered; space for vulnerable to progress slowly
Our co-located staff are ‘off the leash’
The incentives meet people’s expectations
Integrated, co-located, easy to access, one-stop point of contact, delivered where people need services at
ward and community level
Where are the customers in this process today?
c Service provider viewpoint Clear about our unique contributions
Collaboration, not competition
Now clear understanding of what each other does
Job satisfaction is high
Networking is excellent
Now using our own initiative – beyond pre-defined role)
Part of design with clients
Ownership
We all know what everyone’s doing
We share data freely

Final Report – Improving employability outcomes in Dundee Page 134
Rocket Science 2015
Funding not solely based on job outcomes
Joined up, collaborative, no duplication, one point of contact. Holistic approach, utilize the resources in
the best way
No over / under servicing, reduce bureaucracy, fair price paid, non-judgemental unbiased service, scope
for development and innovation
It’s an enjoyable experience; common processes help minimise bureaucracy; systems aren’t getting in the
way; collaborative and supportive; opportunity to combine through learning; routine to ask staff what
works for them and continuously improve; inclusive of a wider range of services – including some that
don’t focus on employability e.g. libraries, health services; help given to people with addiction issues,
leading to fewer with them, leading to better communities overall; agencies informed so that all know
what else is out there; strong, collective leadership
Outcome based funding reflects the time, effort and expertise to support clients
Less competition and more collaboration
Longer term contracts
Responsive to needs
We are person-centred, streamlined, in the community
We think positively about careers and we help employers fill skill shortages
We offer proper, meaningful engagement with clients
Decent funding and resources to deliver the services
People are engaging
We trust the other providers
We have an ambition to be part of the Dundee Employability Service, and it’s great
We deliver what the client and the employer need
Working together; not working in competition; flexible approach to support; not being driven by system
but has positive outcomes; not having to chase funding; all being credited with results
d Employer viewpoint Employers engaged in process
Know where to go to recruit
Been involved in design
Performance has improved
Continuous HR support once client is in work
Sustainability has improved
Got right people
Sense of working together to expand business
High satisfaction with strong feedback mechanisms
Right people, right place, right skills / attitudes, right time
Opportunity to day what works and what doesn’t
Co-design of programmes
Employers are engaged, trust the services, getting people into work, people with work, believe they have
a professional recruitment service, not having multiple approaches from organisations, skills match
positive experience
Private sector enjoy being involved
Our academies are based on care and retail
Such a good source of recruits that some employers are willing to start paying for it as they would a
recruitment agency
Good employers want good employees and vice versa – that’s what makes it work

Final Report – Improving employability outcomes in Dundee Page 135
Rocket Science 2015
Access to skilled workforce
Opportunity to grow workforce
Training quality mark for staff to ensure skills of staff are enhanced
Employers being part of the Network
Trust in our employability service from employers
It’s easy, joined-up and responsive to employers needs
After-care for employees
Well trained staff and support in the City when needed
Delivers skilled, trained, work-ready people
It is responsive to changes in my business
It listens to me
Skills are matched
Skilled workforce meets demand; they understand what’s available to them (e.g. Modern Apprentices);
able to shape training and learning; more informed on overseas qualifications; more responsible / active
in ‘supply’ side; make use of practical opportunities to develop future workers; all signed up to the Living
Wage; support people to remain in work; trust in skills of people coming out of the Pipeline
Breakout session 3 : What main changes would you / your organisation want to make in order to bring about this result? The following notes provide (as best I can) holistic reports from individual table groups. The identity of the tables is not known; some tables used more than one note-taker, so it’s not possible to be sure which tables said what. Clearly there were not 22 tables (A-V). But where possible, I have assembled the views of individual tables into a table report. Table A Long-term leadership commitment to funding
Guaranteed funding
Employability Service for people in work
Move away from process driven to asset based approach
Flexibility to run specific training for individuals
Peer mentoring
Better trust with partnership organisations
Re-prioritise all Council staff into considering employability agenda
Re-locate existing staff into joint working establishment
Cross-organisational approach on staff and training
Creating positivity focus on the progress
Re-design of Work Programme
Table B
Better networking and knowledge Perception of other companies
Depth of partnership – knowing people through face-to-face interaction
Knowing the difference between leadership and management
Created better links between children and adult services
Seat for smaller organisations at the decision making table (not just TSI)
Final Report – Improving employability outcomes in Dundee Page 136
Rocket Science 2015
Taking work into communities – pop-up events; in schools etc
Information sharing needs to be better (esp from DWP) – common systems
Being clear on what we want to achieve Clear vision
Clear priorities
Clear priority areas
Involve wider range of people in working groups
Working Groups need to deliver tangible change – should involve service users
Robust long-term funding plans are needed
Everyone signing up to key priorities to enable joint, long-term funding to be organised
Shared risk
Table C
Sharing information and encouraging people / organisations to share information in real time about
people who are needing support
Share information that we get from employers more widely – more collaborative work, sharing the
outcomes and sharing the rewards
Cultural change – just now it is a competitive environment regarding how founders commission services;
could this be done to promote collaboration through how we fund providers
Reward for the success of the Employability Service not just for individual performance
What we would not do – silo working; competing
Better knowledge and better future planning including information sharing
Change the questions that we, as an organisation, ask of employers and share this
Assessment processes – done to the best possible standards, sharing this across the service and use it to
ensure that the client gets the best service
More targeting of people that are most disadvantaged , need most help
Table D
College
Roll out more academies in collaboration with employers and stakeholders
Need to report in more detail on core student activity in relation to employability
Consider how we recruit for future employees to ensure we reach out to more vulnerable groups
Continue to establish Finishing Schools, closely aligned to the pipeline into employment
Continue to create Industry Advisory Boards where they don’t currently exist to shape curriculum offer,
co-design, and agree volumes
Table E
Not pushing everyone through the same process
Pilot working with the same people over a protracted period
Be allowed to fail
Measure distance travelled
Be allowed to take risks – failure is OK as long as lessons are learned

Final Report – Improving employability outcomes in Dundee Page 137
Rocket Science 2015
Table F
Get employability and non-employability workers working together to get client input into service design
and engagement
Longer term contracts to providers, so they can spend more time planning and not worry so much about
funding
Contractors not having the same outcomes to encourage collaboration
Joint staff training (ref the point about good quality staff)
Turn employability around – start with stage 4 (employers’ needs) and work service back from that
Co-location of all employability services
Provide financial incentives to clients to engage, not just financial penalty for not engaging
Table G
How did we get there? Involved young people in design; good intelligent evaluation of meaningful
success indicators
How did we get there? Peer and business mentors; partnership working; flexible funding; funding for
longer timescales to work with young people
Co-location with partners in targeted communities of high unemployment
Lose the labels – for service groups and for clients
Neighbourhood focus – funding linked to the non cognitive skills which have biggest impact on life
chances
Funding to prevent mistrust of working with others – people will otherwise protect organisation, not
prioritise people
Time to develop trust with partners
Customer-led focus groups; listen to them and if possible implement what they propose
Shared budgets
Table H
2020 : Living Wage City; World Host City
Measurement needs to be proportionate – less administration, but have shared outcomes
Staff should know they are worth it – invest in staff health
Zero tolerance of workforce negativity / poor values#
More sharing of information and understanding that information is being used amongst employability
partnership
Locality-based integrated planning
Table I Greater devolution of decision making to managers and staff
Less focus on numerical outputs / processes and more on outcomes
Agreed quality management system for employability services
Lift restrictions
Collaborate with other organisations and exploit their knowledge
Build relationships with local employers
Encourage the BME community to be pro-active

Final Report – Improving employability outcomes in Dundee Page 138
Rocket Science 2015
Table J
Investment in employers to support new employees to understand their concerns / barriers / needs
Real focus and understanding of localized management information so we can have a truly demand-led
service
Shared portal for employers so they can understand the offer for their staff in Dundee – training and
work experience
Investment in joined-up working; development / up-skilling of staff; funding structures which innovate;
meeting employers requirements; recognition when things aren’t working; need a focus on prevention
Data-sharing – currently too many systems, protocols, and not enough mutual understanding
Earlier engagement with schools including primary schools
Competition for referrals
Table K
Co-planning; co-finance; co-decision-making; co-location; co-commissioning; integrated services;
create a central agency
Tailored approaches; share knowledge; map existing provision / assess fitness for purpose; determing
consistent quality success KPIs
Volunteering where job doesn’t exist
Longer term planning and funding allocations
Shared data system
Stop doing : all agencies filling out same information; over-servicing; silo mentality; paying peanuts for
services
College : map existing offer for all curriculum areas e.g. hospitality; identify step-on / step-off points and
relate to what sort of jobs could be done at each level of qualifications
Table L
Need leadership not competition at all levels
Stop people hiding behind policy – get a ‘can do’ attitude
Schools closer to the employability agenda
Less bureaucracy; too much evidence, paperwork; need a balance; too much time justifying need to
measure
Front end skills and abilities of staff – need to be of the highest standard
Person-centred approach
Listen to people – build it around their needs
Listen to front-line staff, and accept what they say
People should know we value them because they are worth it
Table M
Partnership leaders to remove obstacles and demand or drive improvements
Target services and support locally
Public sector working together on HR / recruitment; and providing opportunities for young people and
those furthest from jobs
Plan on a regional basis – especially the travel-to-work area
Final Report – Improving employability outcomes in Dundee Page 139
Rocket Science 2015
A new funding model that provides sustainability and removes duplication
Join up collective approaches across our big private sector employers
Build on the DOC common front end to genuinely collaborate employability services
Better bang for existing buck across public sector employment practice
Table N To have a seat at the discussion / decision-making table so that the views and opinions of the BME client
group are considered
Be recognised as a genuine employability service provider with unique skills
Take the work into the community – remove the barriers
Systemic change – mandatory training on faith and cultural sensitivities
Where we locate staff – multi-agency teams in communities
Better access to information (incl DWP) so we can go out and find people
Less reporting and more face-to-face work (just some common big measures for all)
Services for adolescents – transition
Peer support networks
Table O
Support and educate employers to understand their responsibility to help grow people who are in work
for the first time
Will need to develop a framework for work placements
I will have a conversation with Dundee and Angus College to simulate real working situations for young
people, leading them more easily towards and into the workplace
Table P
The Chamber co-ordinates a shared work placement project – not just one business with just one job
seeker
Review why the Lochee Model is or was working, and is supported by the community
Regular (6 monthly) and deep (not just a select few businesses) collaboration with businesses
Inspire citizens to feel that they want to input and shape services
Listen to front-line staff in doing what works – job-shops in the community
Table Q
Increase the understanding of, and differences between leadership and management
Extending leadership at all levels across all sectors
Quotes from Sir Alex Ferguson – ‘management can make the possible happen; leadership can make the
impossible happen’
Organisational culture is a top priority across the Forum
As a third sector organisation, reliant on short-term funding, the ability to implement long-term planning
would be a significant change to improve the services we deliver, and would allow for more innovation
As a partnership we are clear what success looks like, how we measure it, and there exists a collective will
to achieve
Much better understanding of demand, communicating this effectively to influence approaches

Final Report – Improving employability outcomes in Dundee Page 140
Rocket Science 2015
Increase our network knowledge of local provision; fewer superficial relationships
Need better communication; more willingness to take risks and try new things; better development
opportunities for front-line staff
Table R
More delivery in the community
Regular secondment in and out of partners
Shared professional qualifications at various levels
Table S
More focus on individuals – not just a number but a person, and better support for both staff and clients
Sharing more skills and services with other providers; open events, talks on what we do and how we do it
Providing your service and experience to other providers – a qualification in employability skills
Table T
Further development of collaborative working at local area level
Focused on neighbourhoods in greatest need e.g. local learning partnerships
The development of a more inclusive employability pipeline, bringing in a wider range of services
Stronger focus on asset-based approaches around individual needs
Table U
Sharing and dispersing knowledge, experience, and understanding of sustainability – offer to every
service provider
Contact / support centre; bring in health professionals; involve clients in creating the better service we
want
Involve employers and clients in co-design of better service
Understand funding streams and offer centre of expertise available to all
Engage at level of 54 neighbourhoods, not just City
As a City Partnership, focus on a few significant steps at a time
Support workforce / providers / clients
Build a data base of employers in Dundee
Build awareness regarding diversity and its importance to local employers
Table V
Emphasis on co-production
Better at sharing knowledge and understanding
More active engagement with employers
Much greater engagement with young people
Improved understanding of partners
Work out how to secure better and more consistent quality across the system
Willy Roe 03 November 2015

Final Report – Improving employability outcomes in Dundee Page 141
Rocket Science 2015


