A STUDY OF CUSTOMER SATISFACTION, RETURN
INTENTION, AND WORD-OF-MOUTH
ENDORSEMENT IN UNIVERSITY DINING
FACILITIES
By
YEN NEE NG
Bachelor of Science
Oklahoma State University
Stillwater, Oklahoma
2001
Submitted to the Faculty of theGraduate College of the
Oklahoma State Universityin partial fulfillment of
the requirements forthe Degree of
MASTER OF SCIENCEJuly, 2005
ii
A STUDY OF CUSTOMER SATISFACTION, RETURN
INTENTION, AND WORD-OF-MOUTH
ENDORSEMENT IN UNIVERSITY DINING
FACILITIES
Thesis Approved:
Woo Gon Kim
Thesis Adviser
Bill Ryan
Jerrold Leong
A. Gordon Emslie
Dean of the Graduate College
iii
ACKNOWLEDGEMENT
The thesis would not have been completed without the support and assistance of
many people. I would like to take this opportunity to thank all of you who have helped
and encouraged me in undertaking my master’s degree. I wish to express my sincere
appreciation to my thesis advisor, Dr. Woo Gon (Woody) Kim, for his supervision,
constructive guidance, inspiration and encouragement throughout my graduate program
and ready to help me in any way towards making this study my best. I would also like to
thank my committee members, Dr. Bill Ryan and Dr. Jerrold Leong for their time, effort,
concern and expertise.
My thanks also go to Mrs. Carol Hackerott, Mr. Bob Huss, Mrs. Njoki
Mwarumba, Mr. Leonard Edmond, and Miss Laura Cooper who generously helped me
and advised me on my survey, and gave me courteous encouragement. Thanks for Ms.
Belinda Butler, who spent hours painstakingly in proofreading the manual script. My
gratitude also goes to my graduate friends, Ms. Pimtong Tavitiyaman, Ms. MinYen Ku,
Ms. ShuChuan Liu, Ms. Seungsuk Lee, Mr. Baker Ayoun, Mr. Hae Young Lee, Mr. D.J.
Kim, and Mr. Shih-Ming Hu for their kindness.
A very special appreciation to my mom, my sister - one and all – who were
always there to offer endless love, support, and understanding. I wish to express my
deepest thanks to my husband, Jerome Keong, for his love, patience, understanding,
encouragement and support.
iv
TABLE OF CONTENTS
Chapter Page
I. INTRODUCTION......................................................................................................1
Background ..............................................................................................................1Significance of the Study and Research Purpose ....................................................5Organization of the Study ........................................................................................6
II. REVIEW OF LITERATURE
Introduction..............................................................................................................8Attributes Selection..................................................................................................9Customer Satisfaction ............................................................................................17Return Intention .....................................................................................................19Word-of-Mouth Endorsement................................................................................19Hypotheses.............................................................................................................21The Conceptual Model...........................................................................................22
III. METHODLOGY
Introduction............................................................................................................23Research Design.....................................................................................................23The Research Instrument .......................................................................................24Sampling ................................................................................................................26Data Analysis .........................................................................................................29
IV. FINDINGS.............................................................................................................31
Response Rate........................................................................................................31Characteristics of the Respondents ........................................................................31Attributes of the Institutional DINESERV Dimensions ........................................36Significant Difference among Gender, Types of meal plan and Age GroupIn Overall Satisfaction ...........................................................................................38The Factor Analysis ...............................................................................................41The Regression Analysis........................................................................................44
v
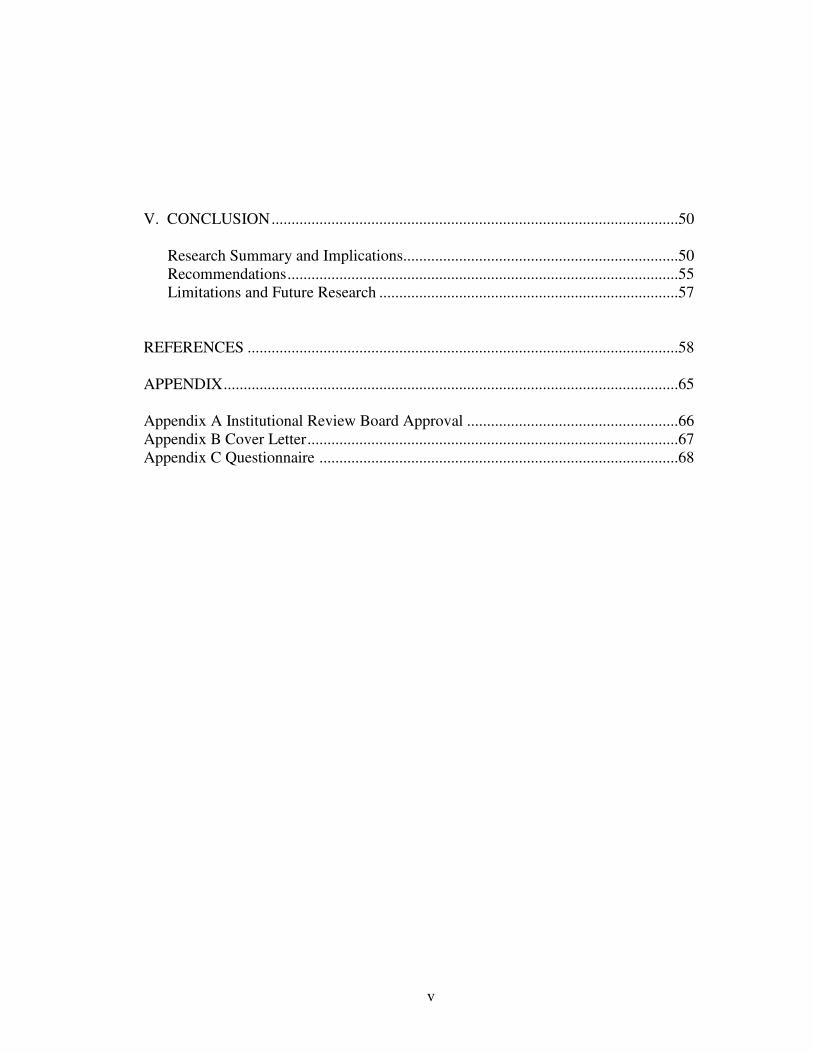
V. CONCLUSION......................................................................................................50
Research Summary and Implications.....................................................................50Recommendations..................................................................................................55Limitations and Future Research ...........................................................................57
REFERENCES ............................................................................................................58
APPENDIX..................................................................................................................65
Appendix A Institutional Review Board Approval .....................................................66Appendix B Cover Letter.............................................................................................67Appendix C Questionnaire ..........................................................................................68
vi
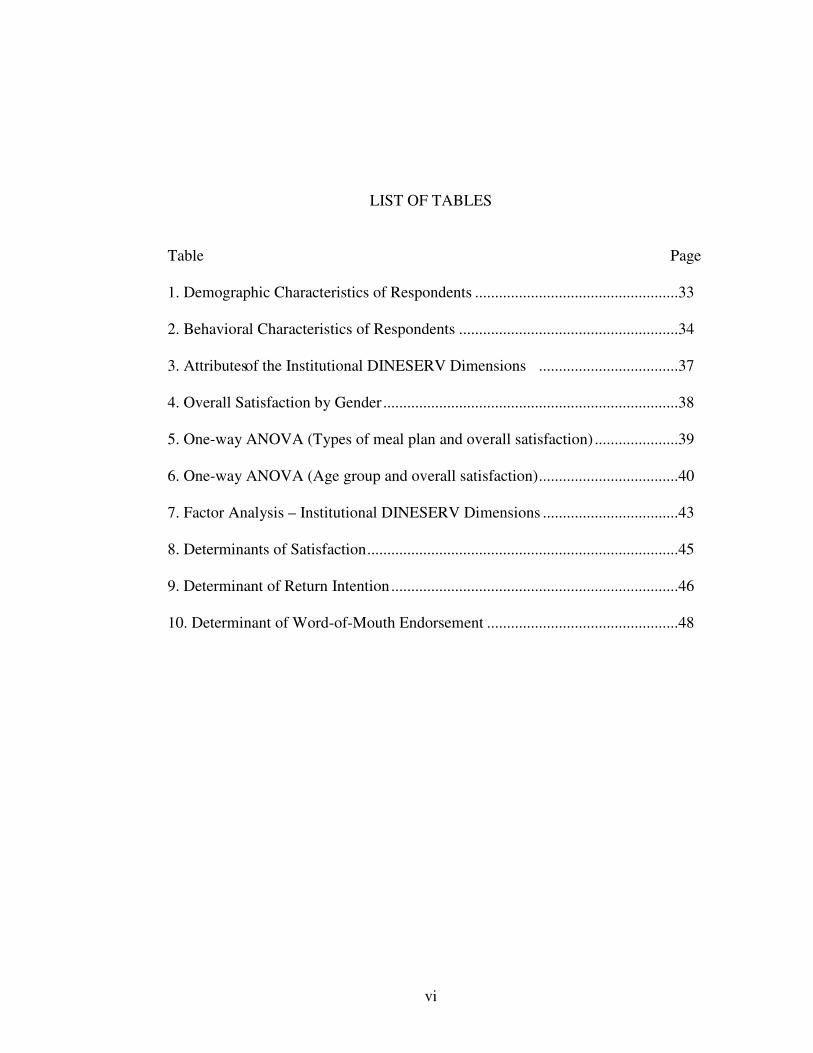
LIST OF TABLES
Table Page
1. Demographic Characteristics of Respondents ...................................................33
2. Behavioral Characteristics of Respondents .......................................................34
3. Attributes of the Institutional DINESERV Dimensions ...................................37
4. Overall Satisfaction by Gender..........................................................................38
5. One-way ANOVA (Types of meal plan and overall satisfaction) .....................39
6. One-way ANOVA (Age group and overall satisfaction)...................................40
7. Factor Analysis – Institutional DINESERV Dimensions ..................................43
8. Determinants of Satisfaction..............................................................................45
9. Determinant of Return Intention........................................................................46
10. Determinant of Word-of-Mouth Endorsement ................................................48
vii
LIST OF FIGURES
Figure Page
1. Organization of the Study ....................................................................................7
2. The Conceptual Model.......................................................................................21
3. Behavioral characteristics of Respondents ......................................................35
1
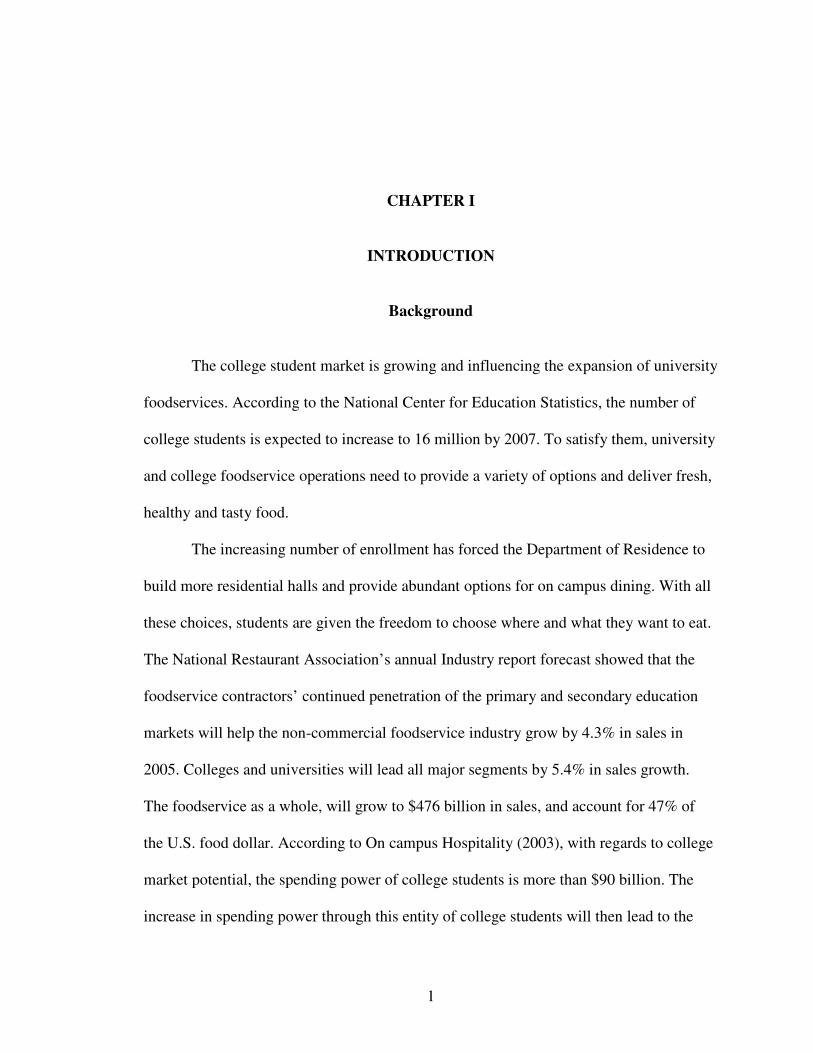
CHAPTER I
INTRODUCTION
Background
The college student market is growing and influencing the expansion of university
foodservices. According to the National Center for Education Statistics, the number of
college students is expected to increase to 16 million by 2007. To satisfy them, university
and college foodservice operations need to provide a variety of options and deliver fresh,
healthy and tasty food.
The increasing number of enrollment has forced the Department of Residence to
build more residential halls and provide abundant options for on campus dining. With all
these choices, students are given the freedom to choose where and what they want to eat.
The National Restaurant Association’s annual Industry report forecast showed that the
foodservice contractors’ continued penetration of the primary and secondary education
markets will help the non-commercial foodservice industry grow by 4.3% in sales in
2005. Colleges and universities will lead all major segments by 5.4% in sales growth.
The foodservice as a whole, will grow to $476 billion in sales, and account for 47% of
the U.S. food dollar. According to On campus Hospitality (2003), with regards to college
market potential, the spending power of college students is more than $90 billion. The
increase in spending power through this entity of college students will then lead to the
2
growth of revenue for dining facilities. Therefore, it is important for foodservice
operators to acknowledge the wants and needs of their students in order to satisfy them
and at the same time retain its market power in the industry.
University foodservice is expanding by adapting new concepts and moving
towards the commercial foodservice trend. They are offering more food options and
extending their operation hours just to capture the student market. Commercial
foodservice and non-commercial foodservice are parallel, and they have the same
goals – each entity desires to make a profit and exceed their customer’s expectations.
Therefore, the researcher believes that the selected independent variables, which were
known as important to commercial foodservice research, are also important to the
university foodservice perspective.
Customer satisfaction is often used as an indicator of whether customers will
return to a restaurant. While there is no guarantee of a satisfied customer’s repeat visit, it
is almost certain that an unsatisfied customer will not return. Numerous research studies
have shown that customer satisfaction is an important topic for foodservice managers. A
high level of customer satisfaction leads to an increase in repeat patronage, brand loyalty,
as well as recruiting new customers by enhancing an organization’s reputation. Other
than customer satisfaction, most of the research also shows that the most important
factors influencing a consumer’s decision when choosing a restaurant are food quality,
service quality, value, cleanliness, and whether their food is prepared to order.
Among all the possible determinants of customer satisfaction in restaurants,
studies have found that food quality is rated as the most powerful predictor of customer
intent to return. Pettijohn, Pettijohn, and Luke (1997) studied fast food restaurant
3
customer satisfaction where they found that food quality had the highest mean among all
the variables. Even though Shoemaker’s (1998) study about university foodservice did
not use food quality to predict the customer’s intention to return, it did show that food
quality had the highest rating among all of the variables which was used in the market
segmentation study. Therefore, it is logical to surmise that customer satisfaction with a
university’s food quality is influential in determining intentions to return.
Other than food quality, the restaurant’s physical setting may also affect customer
satisfaction and return intentions. Sulek and Hensley (2004) proved that atmosphere of
the dining area was a significant predictor of satisfaction in the overall dining experience.
University dining facilities have begun to emphasize décor, music, and lighting as a
selling point to customers. This helps to create an expectation of the dining experience.
Hence, it is rational to believe that the customer’s perceptions of service quality and a
restaurant’s atmosphere may be influential in determining their return intentions.
In addition to atmosphere, service quality has been found to be a significant
factor in determining customer satisfaction and their return intentions. Yuksel and Yuksel
(2002) found that service quality had the most significant effect on dining satisfaction at
the aggregate market level. Qu (1997) also discovered that service quality was
significantly related to the customer’s return intention. Kivela, Inbakaran, and Reece
(2000) found that convenience is also a significant issue in determining return intentions.
Shoemaker (1998) discovered that a short walking distance from the class or office was
the main concern for most undergraduate students. Thus, the researcher believes that
convenience is another factor to be considered, especially for students.
4
Price and value is also an important factor. A study by Qu (1997) regarding
determinant factors and choice intention for dining at Chinese restaurants found that price
and value was significantly related to the customer’s satisfaction and their intention to
return. Furthermore, Shoemaker (1998) found that students considered reasonable price
an important variable when deciding where to eat. As a result, the researcher believes that
price and value is a critical factor to be included in this study in determining the
customers’ satisfaction and their return intention.
University foodservice is growing rapidly and operators are trying to meet the
diverse needs and wants of the students. Even though the literature supports the idea that
food quality, atmosphere, service quality, convenience, and price and value are predictors
of customer satisfaction, few studies have been done to investigate these factors in
relation to university foodservice facilities. Thus, the lack of studies in this area is the
driving factor behind this current research study. The results of the study may provide
operational insight for the university foodservice directors and managers, namely
identifying those influencing factors used to improve the operational efficiency of the
dining units. Also, the study will provide foodservice directors and managers a
conceptual insight into methods for improving delivery systems to meet the needs of the
customers. Ultimately, the study can also pinpoint those attributes the customers’ deem
important, allowing the foodservice directors and managers to focus on those attributes
that will make the greatest impact on customer satisfaction. Therefore, the researcher
believes exploring this topic will contribute to the overall college and university
foodservice industry.
5
Significance of the Study and Research Purpose
University dining facility operators need to be more aware of the relative
influence of various foodservice-attributes in determining customers’ intention to return.
With all the options available, students can use their meal plan anywhere on campus, not
only in the dining facility, but also in the convenience stores. Also, mandatory meal plans
on college and university campuses can enhance a steady source of income for a
foodservice department, securing good value and leveraging their purchasing volume.
Therefore, it is important for foodservice operators to know what their customers’
satisfaction level ought to be and how to retain their patronage. The researcher hopes that
the study will benefit the university foodservice operators in providing best practices as
well as provide a contribution to the body of knowledge, useful to the academician in
hotel and restaurant management programs. This research will aim to support these
benefits in terms of food quality, atmosphere, service quality, convenience, and price and
value.
The objectives of this study are:
1) To explore those attributes that customers perceive as “meet their expectation
level” in their selection of a university dining facility
2) To determine the influence of food quality, atmosphere, service quality,
convenience, and price and value on customer satisfaction, return intention,
and word-of-mouth endorsement.
6
Organization of the Study
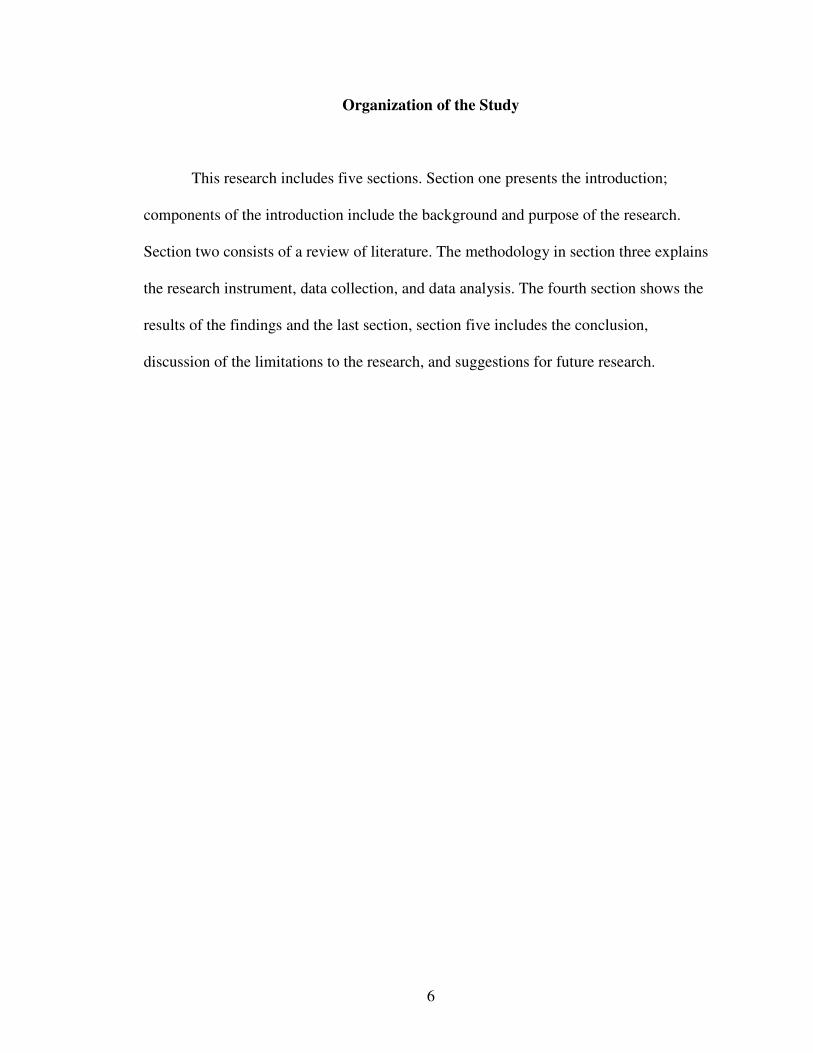
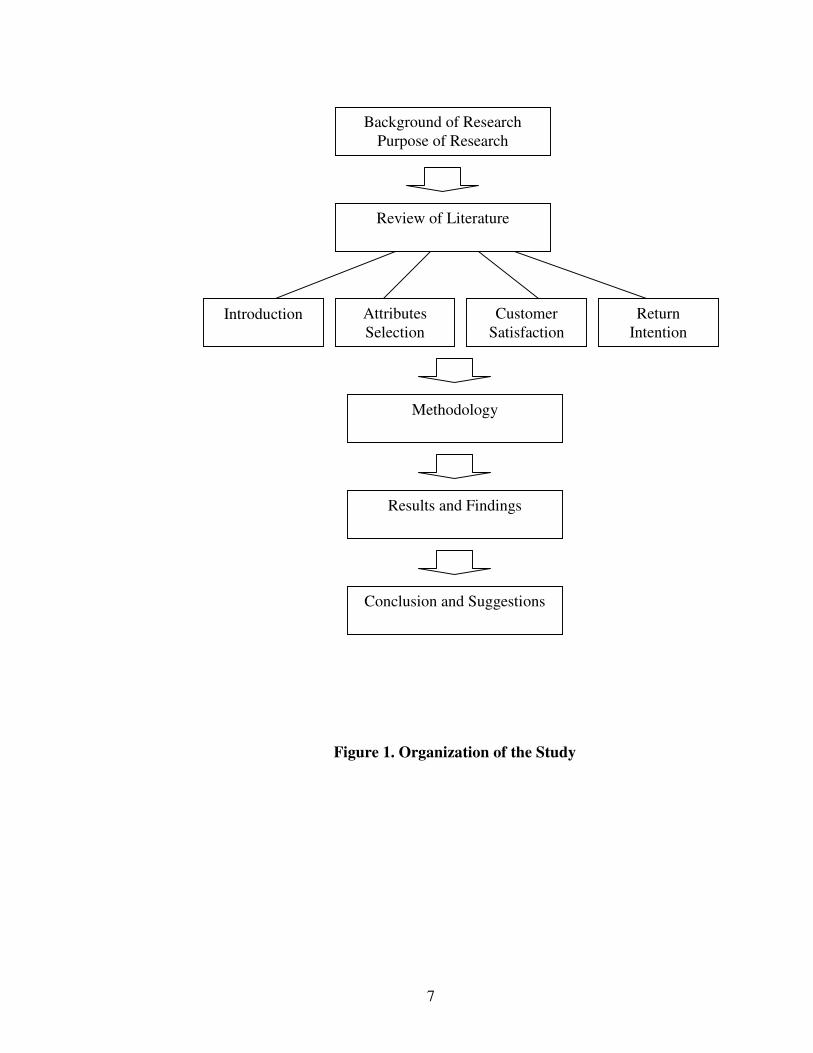
This research includes five sections. Section one presents the introduction;
components of the introduction include the background and purpose of the research.
Section two consists of a review of literature. The methodology in section three explains
the research instrument, data collection, and data analysis. The fourth section shows the
results of the findings and the last section, section five includes the conclusion,
discussion of the limitations to the research, and suggestions for future research.
7
Figure 1. Organization of the Study
Background of ResearchPurpose of Research
Review of Literature
Introduction Attributes Selection
CustomerSatisfaction
Return Intention
Methodology
Results and Findings
Conclusion and Suggestions
8
CHAPTER II
REVIEW OF LITERATURE
Introduction
Numerous studies (Qu, 1997; Kivela, Reece & Inbakaran, 1999; Pettijohn,
Pettijohn & Luke, 1997; Lee, 2004) have shown that food quality, atmosphere, service
quality, convenience, and price and value have a favorable effect on dining satisfaction
and return intention as it has been related to increase sales, revenue, and customer
loyalty. However, according to Lee (2004), dining environment, price and nutrition
information, and employee competency are considered the most influential factors in
determining college student’s satisfaction level.
Interestingly enough, restaurants or university dining facilities are generally
assumed to be in the business of only selling food. They are mainly retailers of a
“foodservice experience.” Yuksel and Yuksel (2002) mentioned that food plays a key
part but by no means is the only part in satisfying the customer. Previous studies reported
that restaurant service was a blend of tangible and intangible components. The service
encounter is an individually experienced process where production and consumption
activities take place at the same time. There is a concept called “moments of truth” that
occurs between customers and the service providers. A “moment of truth” can be defined
as the “time and place” and the “when and where” the service provider has the
opportunity to show the customer the quality of its service. Therefore, what happens in
9
these interactions will obviously have a significant impact on consumer satisfaction
within service organizations.
In addition to assessing customer satisfaction in foodservice industry, it is also
essential to find out which restaurant or dining attributes are most important to customers.
Therefore, in the following section, the researcher will present the attributes selection
according to the literature review.
Attributes Selection
It is generally accepted that multi-attribute scale is appropriate for use in
measuring customer satisfaction in restaurants (Stevens, Knutson, & Patton, 1995;
Kivela, Reece, & Inbakaran, 1999; Qu, 1997). A study by Dube, Renaghan, & Miller
(1994) used attribute importance scores to find out the relative importance of various
upscale restaurants’ attributes to determine customers’ repeat purchase intentions. The
authors theorized that customer satisfaction in restaurants is a function of multiple
elements of the dining experience. They found that all of the elements studied, such as
atmosphere, helpful server, attentive server, menu variety, waiting time, consistent food,
and tasty food, had a significant influence on diners’ intent to return to the restaurant.
However, the elements had different importance scores that varied based on patrons’ type
of dining occasion. Pleasure diners were less sensitive to the waiting time but cared about
menu variety, while business diners were less concerned about menu variety but cared
10
about waiting time. However, tasty food, attentive service, and atmosphere were ranked
with high importance whether the patron was dining for a business or pleasure occasion.
Mattila (2001) studied about emotional bonding and restaurant loyalty. Her study
on the casual-dining restaurant indicated that customers’ emotional bonding with the
service provider is strongly linked to their future purchase intentions. The study also
indicated that the top three reasons the respondents gave for patronizing their target
restaurant were food quality, service, and atmosphere. Furthermore, value for money and
convenient location were also important motivations for the respondents in the low-
commitment group.
A study conducted by Pettijohn, Pettijohn & Luke (1997) determined which
restaurant attributes were most important in contributing to customer satisfaction of fast
food restaurant patrons. They found that food quality was rated as most important,
followed by cleanliness and value. Menu variety and store atmosphere were ranked as
least important. These findings were significant because they helped fast food restaurant
managers use their resources to make improvements on the store elements considered
most influential in determining customer satisfaction.
Qu (1997) studied Chinese restaurant patrons in order to find out which restaurant
attributes were most critical in their selection of a Chinese restaurant and which attributes
were most influential in predicting their intent to return to the restaurant. He found that
the same four restaurant dimensions were significant in customer selection of a Chinese
restaurant and repeat patronage intention. These dimensions included food and
environment, service and courtesy, price and value, and location advertising and
promotion.
11
Lee (2004) studied college student’s perception and preference of brand name
foodservice in university dining operations. Her results indicated that dining
environment, competency of employee, quality of menu and food selection, and price and
nutrition information had an influence on the college students’ overall satisfaction level.
Dining environment was the most influential dimension in determining colleges’
students’ overall satisfaction level.
As service quality continues to be a major part of foodservice business practices,
it is important to be able to measure service quality and to research its effectiveness.
After an extensive review of the literature for the foodservice industry, this study draws
on the most relevant foodservice studies and foodservice attributes which are applicable
to the university foodservice.
Food Quality
Some studies have found that customer satisfaction with a restaurant’s food
quality is a powerful predictor of customer intent to return to a given restaurant (Oh,
2000; Qu, 1997; Pettijohn, Pettijohn, & Luke, 1997). In studies of both fast food
restaurants (Pettijohn, Pettijohn, & Luke, 1997) and Chinese restaurants (Qu, 1997), food
quality was ranked as one of the most important determinants of a customer’s decision to
return to a given restaurant. Pettijohn, Pettijohn, and Luke (1997) found that food quality
was the most important dimension in determining satisfaction. This element is
significantly more important than any other dimension such as cleanliness, value, price,
and convenience, which ranked second, third, fourth, and fifth.
12
Lee (2004) conducted a study to determine college students’ perception of brand
name foodservice quality, the overall satisfaction level of college students, and the
perception of brand name foodservice at Big Twelve Schools in the Midwestern region.
After examining the data, the study indicated that “quality of food” was ranked the
second, among the twelve variables, which accounted for 87%. Also, Aramak “Current
Trends In Campus Dining” conducted a survey in 2002 on 2,300 full-time college
students. The results indicated that food quality was deemed important, and nearly 70%
of the students said they would eat on campus more often if the food quality improved
(Hume, Perlik, Sheridan & Yee, 2002).
Mattila (2001) conducted a study related to emotional bonding and restaurant
loyalty on the casual-dining restaurants. Her study indicated that food quality was the
most important reason for the respondents to patronize their target restaurant.
Sulek and Hensley (2004) conducted a case study related to a full-service
restaurant. They discovered that of all the components in a full-service restaurant, food
quality is the most important. Although a customer evaluates multiple attributes when
determining food quality, he or she is really judging three general food characteristics -
namely safety, appeal, and dietary acceptability.
Soriano’s (2002) study mentioned that quality of food and fresh ingredients were
the reason why customers return to a restaurant. Soriano also found that quality of food
was significantly (P < 0.05) more important than any other attribute. The most important
reason for customers’ intention of return to the restaurant was the quality of food. This
result is consistent with the traditional concept that quality of food is still the most
important reason for the general population of the restaurant being studied.
13
Clark and Wood (1996) studied consumer loyalty in the restaurant industry. In
their study, respondents were asked to choose five of the factors, which were range of
food, quality of food, price of food, atmosphere, and speed of service.
The respondents were asked to rank them using a Likert scale, ranging from 1
(very satisfactory) to 5 (very unsatisfactory) in terms of their general importance in
choosing a restaurant. The study surveyed 31 respondents, in which only 20 respondents
provided usable responses; 19 of the respondents ranked quality of food as the most
important variable related to restaurant choice. Therefore, it is critical to include food
quality in this study.
Atmosphere
In service settings such as restaurants and hotels, the atmosphere in which the
service takes place may be crucial in determining the customer’s perception and
satisfaction with the service encounter (Bitner, 1992). Soriano (2002) mentioned that the
importance of a comfortable atmosphere will continue to increase with time. Therefore,
the most important thing is design and concept.
According to Purdue University, they are serving 66% more customers than it
anticipated at its new Fred and Mary Ford Dining Court, which offers students a
restaurant-like atmosphere and with a varied menu. The ambience of the facility, which
decorated with upscale furniture, colors, and finishes, is the major factor that keeps
students coming back to the dining facility (FoodService Director, 2005). The University
of Tampa, Florida reported that their customer counts went up to 85% after the
renovation of one residence dining hall (FoodService Director, 2003).
14
Yuksel and Yuksel’s (2002) study about tourist satisfaction with restaurant
service stated that “service environment holds a central role in shaping the nature of
customers’ behavior, their reactions to places and their social interactions.” “Customers
are likely to
spend their time and money in an establishment where the service environment prompts a
feeling of pleasure.”
Auty’s (1992) study about consumer choice and segmentation in the restaurant
industry found that image and atmosphere were ranked fourth among the eight variables.
Auty (1992) concluded that, after food type, quality, and price, atmosphere then becomes
the main way of making a distinction between alternatives. Thus, literature on
atmosphere attributes provides a clear reasoning into why this attributes is a part of the
study.
Service Quality
Many studies have quoted the importance of service quality in determining
customer satisfaction with a service encounter (Stevens, Knutson, & Patton, 1995; Qu,
1997; Pettijohn, Pettijohn, & Luke, 1997). In restaurant settings, service quality has been
found to be important in determining customer satisfaction and return intention as well.
Qu (1997)’s survey of Chinese restaurant patrons found that the service and courtesy
dimension was second only to the food and environment dimension in determining
customer probability of returning to a given restaurant. In addition, the results of a study
of ambient restaurant patrons in Hong Kong, confirmed that the service quality
15
dimension contributed strongly to customer intent to return to a given restaurant (Kivela,
Inbakaran, & Reece, 2000).
In the study of customer expectation factors, Soriano (2002) found that after
quality of food, quality of service was ranked the second most important factor in
determining the customer’s decision to return to the restaurant. Then, the study of the
measurement of tourist satisfaction with restaurant service, a segment-based approach
indicated that there were different segments seeking different benefits (Yuksel & Yuksel,
2002). Yuksel and Yuksel (2002) mentioned these differences and proved that service
quality had the most significant effect on dining satisfaction at the aggregate market
level. Based on the previous literature, the researcher believes it is important to include
service quality in this study.
Convenience
Providing appropriate food services in a campus setting is increasing important
due to more demanding customers; students have less time to go off-campus when they
need to eat (Klassen, Trybus, & Kumar, 2005). Klassen, Trybus, & Kumar (2005) studied
about planning food services for a campus setting. Their results indicated that most
students prefer short walking distance for a quick meal or snack, and the students tend to
eat close to the building they are in. Also, Mattila’s (2001) study indicated that
convenient location was an important motivation for respondents in the low-commitment
group.
Kivela, Inbakaran and Reece (2000) conducted a research in various theme
restaurants in Hong Kong. They categorized telephone reservations and parking under
16
convenhience. In this study, Kivela, Inbakaran, & Reece tested reservations and parking
with logistic regression analysis, which resulted in a significant level of model
improvement (P< 0.001).
Shoemaker (1998) studied about a strategic approach to segmentation in
university foodservice. After analyzing the data with cluster analysis, the study indicated
that “short walking distance to classes and offices” was grouped under convenience of
location, with a mean of 8.37.
According to Towson University at Maryland, extended service hours seemed to
have had a positive impact on the Newell dining hall’s volume. Since increasing their
service hours, they have managed to attract new diners, including faculty and staff
(FoodService Director, 2003). On the other hand, the Foodservice Department at
Michigan State University in East Lansing, reported that convenience, variety and off-
campus options increased participation and sales. The department’s mission is to provide
convenience, value and a variety of dining options to more than 43,000 students on
campus. The school in 2002 enjoyed a 6.5% year-over-year increase in meal plan
enrollment (Sheridan, 2003). As a result, the researcher believes convenience is important
in determining customer satisfaction.
Price and Value
The majorities of customers tend to visit restaurants not only because of good
food, quality service and a pleasant service environment, but also because they feel the
price they are paying represents value for money (Yuksel & Yuksel, 2002). Value may
have a different meaning to different individuals. It might be considered as low price, or
17
whatever the consumer wants in a product, or the quality the consumer gets for the price
and/or value is what the consumer gets for what they give (Yuksel & Yuksel, 2002).
In Klassen, Trybus, & Kumar’s (2005) study about planning food services for a
campus setting at California State University, Northridge, their results showed that price
is the most important criterion, with 62 percent of the respondents choosing price. Even
though most of the food outlet’s pricing is discounted, students still consider price when
making a decision.
In Soriano’s (2002) study about customer expectation factors in restaurants, he
stated that the price to be paid for a service determines the level of quality to be
demanded. Customers have raised their expectations with regard to quality and good
service, while seeking a better value for their money. In this study, Soriano (2003) found
that service and value of meal are equally important when compared with all the other
factors.
Zeithaml (1987) argues that price is irrelevant to service quality and therefore not
a quality attribute. However, according to Johns and Howard (1998), based on the present
evidence, customers definitely regarded price and value considerations as part of the
“service bundle.” Consequently, the researcher deem price and value is essential to
include in the study.
Customer Satisfaction
Yuksel and Yuksel’s (2002) study about tourist satisfaction with restaurant
service found that customer satisfaction is an important topic for both researchers and
18
managers. It is because a high level of customer satisfaction will leads to an increase in
repeat customers. Being able to judge customers’ satisfaction levels and to apply that
knowledge are critical starting points for ascertaining and maintaining long-term
customers retention and competitiveness. Moreover, Yuksel and Yuksel (2002)
mentioned that the majority of satisfaction theories state that satisfaction is a relative
concept, always judged in relation to a standard.
The selection of an appropriate standard of comparison for use in a research,
however, represents a dilemma for both managers and researchers. This is partly because
there is not sufficient research evidence available to respond precisely to what
comparison standard customers use in different situations. Different forms of service
standards have been proposed in the marketing and consumer behavior literature; with the
exception of predictive expectations, other standards have received little empirical
research in the tourism and hospitality literature. There is also limited understanding of
whether the use of different comparison standards, yields different results in terms of
satisfaction as it applies to the university foodservice system.
According to Oh and Jeong (2000), even though the notable progress in customer
satisfaction research has been made and there is a significant demand for research from
the industry, customer satisfaction has remained seriously under-researched in the
hospitality industry. Furthermore, studies applying customer satisfaction models are
rarely found in the foodservice industry. Thus, in this developing stage of hospitality
customer satisfaction research, more tests and applications of the customer satisfaction
models seems appropriate.
19
Return Intention
Weiss (2003) conducted a research study to find out the relationship between
restaurant attribute satisfactions and return intention in U.S Theme restaurants. The study
concluded that customer satisfaction with restaurant attributes is influential in predicting
repeat purchase behavior (intent to return). Also, the study‘s empirical results indicating
that customer satisfaction with the theme restaurant attributes, food quality and
atmosphere, were influential in determining customer’s return intention.
Lee (2004) studied about college student’s perception of brand name food service
quality and the overall satisfaction level of college students in university at the
Midwestern region. The findings indicated that dining environment and competency of
employees were the most influential dimension of intention to revisit a brand name
foodservice in a university dining service. Steven et al (1995) also indicated that high
customer satisfaction level of service quality leads to the prepense to revisit the dining
unit. Therefore, the researcher believes return intention is valuable to be included in this
study.
Word-of-Mouth Endorsement
Word-of-mouth communication simply involves people sharing their assessment
of their experiences. Word-of-mouth communication, which relates both to positive and
negative evaluations of service encounters, has been shown to influence other people’s
purchase behavior. Positive word-of-mouth communication is reported to emerge from
20
satisfying service encounters, while negative communication generally emerges from
dissatisfying encounters (Susskind, 2002).
Struebing (1996) mentioned that a new academic study shows that revenue
streams can be generated from attracting new customers via word-of-mouth
recommendations, increasing the percentage of retained customers, and increasing
spending or usage by existing customers. Rust (1996) stated that managers tend to believe
that an overall increase in revenue will result only by increasing advertising and
promotional efforts. His study also mentioned that word-of-mouth recommendations
from friends, family, and colleagues who are satisfied with a company have a measurable
impact on sales.
Ranaweera and Prabhu (2003) conducted a research study to examine the
combined effects of customer satisfaction and trust on customer retention and positive
word-of-mouth (WOM). Data from a large-scale survey of fixed line telephone users in
the United Kingdom confirmed that both satisfaction and trust have strong positive
association with customer retention and positive word-of-mouth. Therefore, the
researcher believes it is significant to include word-of-mouth endorsement in this
research study.
21
Research Hypothesis
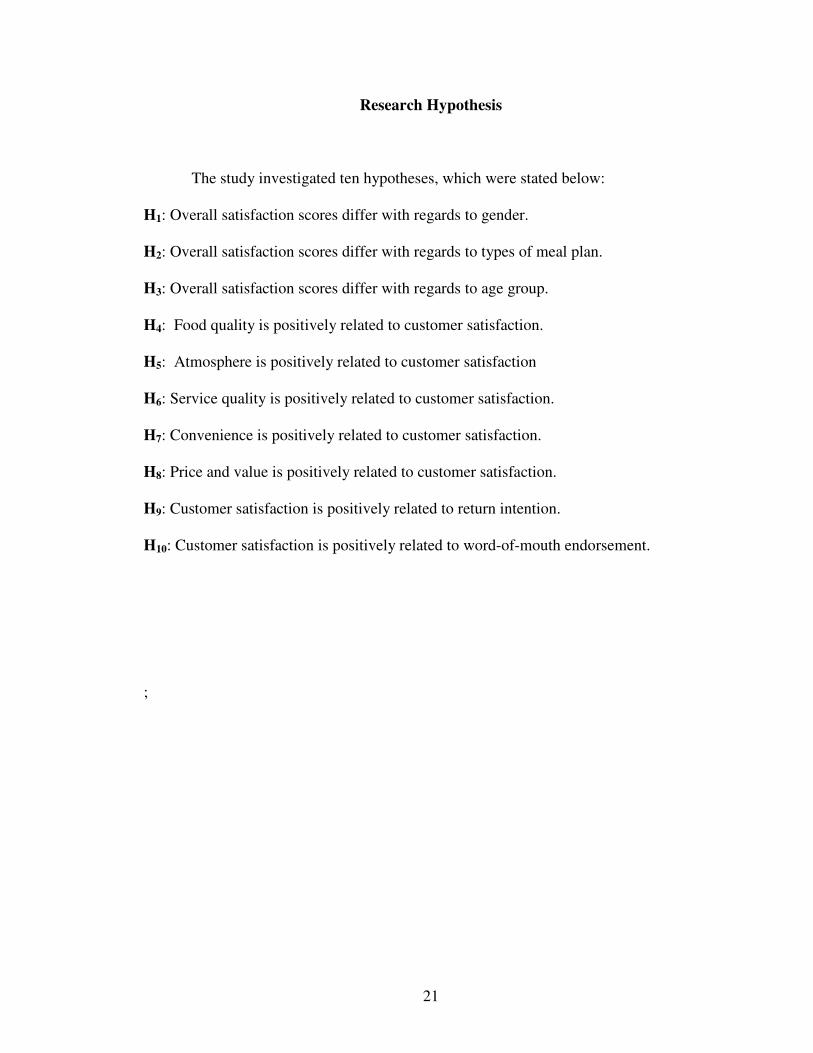
The study investigated ten hypotheses, which were stated below:
H1: Overall satisfaction scores differ with regards to gender.
H2: Overall satisfaction scores differ with regards to types of meal plan.
H3: Overall satisfaction scores differ with regards to age group.
H4: Food quality is positively related to customer satisfaction.
H5: Atmosphere is positively related to customer satisfaction
H6: Service quality is positively related to customer satisfaction.
H7: Convenience is positively related to customer satisfaction.
H8: Price and value is positively related to customer satisfaction.
H9: Customer satisfaction is positively related to return intention.
H10: Customer satisfaction is positively related to word-of-mouth endorsement.
;
22
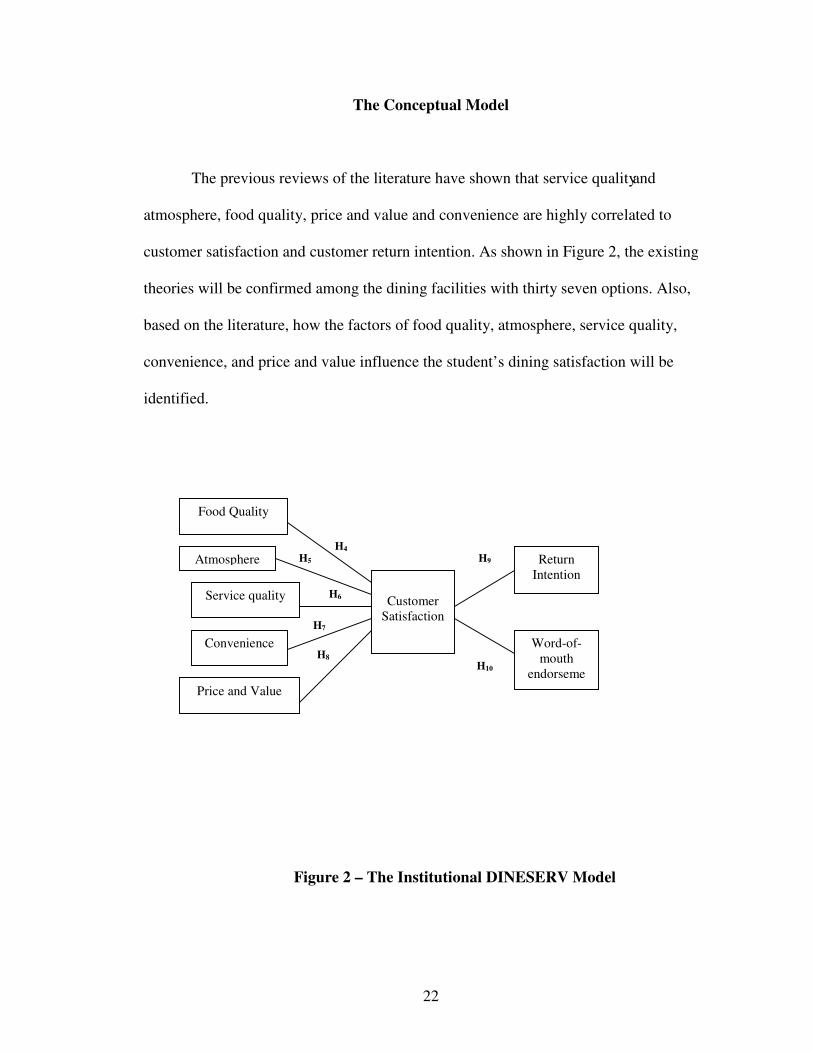
The Conceptual Model
The previous reviews of the literature have shown that service quality and
atmosphere, food quality, price and value and convenience are highly correlated to
customer satisfaction and customer return intention. As shown in Figure 2, the existing
theories will be confirmed among the dining facilities with thirty seven options. Also,
based on the literature, how the factors of food quality, atmosphere, service quality,
convenience, and price and value influence the student’s dining satisfaction will be
identified.
Figure 2 – The Institutional DINESERV Model
Food Quality
Price and Value
Convenience
Atmosphere
Service quality Customer Satisfaction
ReturnIntention
H4
H5
H6
H7
H8
H9
Word-of-mouth
endorsemeH10
23
CHAPTER III
RESEARCH METHODOLOGY
Introduction
The review of literature indicated that limited information was available
regarding the food quality, service quality, atmosphere, price and value, and convenience
in university dining facilities, and how these factors have an influence on customer
satisfaction, return intention, and word-of-mouth endorsement. This chapter describes the
research design, research instrument, sampling, and data analysis used in this study.
Research Design
The research design of the study entailed descriptive research. According to Gay
(1992), “Descriptive research involves collecting data in order to test hypotheses or to
answer questions concerning the current status of the subjects of the study.”
Closed-ended web survey questionnaires were used in this study because they were more
convenient for the participants to answer and for the researcher to interpret the
respondent’s results.
24
The Research Instrument
In order to ensure the validity of the variables in the questionnaire, the researcher
conducted a focus group study with four experts:
1. Dr. Bob Huss, Director of the Residential Life at Oklahoma State University.
2. Dr. Woo Gon (Woody) Kim, Assistant Professor of the School of Hotel and
Restaurant Administration at Oklahoma State University.
3. Dr. Bill Ryan, Associate Professor of the School of Hotel and Restaurant
Administration at Oklahoma State University.
4. Dr. Jerrold Leong, Associate Professor of the School of Hotel and Restaurant
Administration at Oklahoma State University.
A questionnaire instrument was developed based on the results of the focus group
discussion, an annual survey from the Department of Residential Life at Oklahoma State
University and the relevant literature by the previous study.
The questionnaire consisted of three parts. The first part was designed to measure
demographic information. The demographic information included gender, ethnicity,
designation, age, types of meal plan, and a dining facility they dined at two or more times
in the past week.
The second part was aimed at identifying customers’ perceptions about food
quality, atmosphere, service quality, convenience, and price and value and their
expectation level. The twenty-two questions were identified based on the literature
review and the annual survey from the Department of Residential Life. The researcher
25
revised and added ten more attributes in the previous annual survey in the hopes of
increasing the accuracy of the questionnaire.
The researcher adapted eleven items, overall food quality, taste of food, eye
appeal of the food, nutrition content of the food, variety of menu options, cleanliness of
facilities, dining room environment, service hours, and convenient location, from the
Residential Life annual survey. Four items, level of comfort in the dining, dining staff’s
knowledge about food, parking convenience, and reasonable price item, were adapted
from Kivela, Reece, and Inbakaran’s (1999) “Dining Experience Survey” and modified to
suit the university foodservice area. Two items, staff appearance and attentive staff were
selected from “The DINESERV Per Interview” survey (Steven, Knutson, & Patton, 1995)
and three items, friendly dining managers, short walking distance, and good value for the
price were chosen from Shoemaker’s (1998) research study and modified to fit the
research purpose. One item, appropriate portion size was selected from the study of
Yuksel & Yuksel’s (2002); and the last item, overall value of the dining experience was
decided based on the focus group discussion. The respondents were asked to respond on a
five-point scale. The descriptors ranged from “much worse than I expected (1),” “Just as I
expected (3),” to “much better than I expected (5).”
The third section requested the respondents to rate their overall evaluation on the
dining facility and their return intention. The first three questions asked about
respondent’s satisfaction level of the dining facility, quality of service, and their dining
experience. Two questions were adapted from Kim (in press) and one question was from
Residential Life’s survey. Then, three questions ask about respondent’s word-of-mouth
endorsement, were adapted from Kim, Han, and Lee (2001). The last three questions
26
asked about respondent’s return intention. Three questions were adapted from Kivela,
Reece, and Inbakaran (1999). This section called for a rating on a scale of 1 to 5, with 1
representing very low and 5 representing very high.
A cover letter was carefully drafted to enhance the response rate which stated the
importance of the study and the confidentiality of the responses. A research faculty was
invited to review the questionnaire instrument to improve the comprehensiveness and
clarity. There were some changes in the wording of the instrument as a result of the
review.
Sampling
The target population for this study was students from the freshman level to the
graduate level who were enrolled at Oklahoma State University in the spring semester of
2005. Since this is the Oklahoma State University annual dining survey, with the
collaboration from the Department of Residential Life at Oklahoma State University, a
stratified sampling method, a probability sample that is distinguished by a two step
proceduce, was used to choose the sample. In a stratified sample, the parent population is
divided into mutually exclusive and exhaustive subsets, and a simple random sample of
elements is chosen independently from each group of subset (Churchill & Brown, 2004).
Therefore, stratified samples are usually representative of the population.
Fifty percent of meal plan holders, which were 3500 participants, and ten percent
of non-meal plan holders, which equal 1600 participants, were chosen to participate in
this study. Putting together the list for the dining survey was extraordinarily tricky. To
27
obtain the e-mail addresses for the meal plan holders, the Residential Life department
only needed the e-mail addresses of those meal plan holders who have used their meal
plan during the semester in progress, and whose meal plan balance is greater then zero.
The meal plan data includes ID number but not names. The Residential Life department
used a program that matched an ID number for each name and then switched to a web-
based, manual-lookup system to see if the match was correct. Finally, if they could not
find an email address for a meal plan holder, they had to omit that participant from the
list.
For the non-meal plan holders, the department started with a list of ID numbers
from the card reader system where the meal plan field is blank; participants could be an
employee, a student, or both. The Residential Life department had a program that picked
up home addresses for the possible participants. If they had a home address in Stillwater,
Perry, Perkins, Glencoe, Ripley, Fairfax, Pawnee, Red Rock, Marland, Yale, Coyle,
Langston, Morrison, Orlando, Piedmont, Kingfisher, Edmond, Spencer, Harrah, Guthrie,
or Nichols Hills and were flagged as an employee or student, then they were included in
the survey population. After that, they searched for email addresses for the non-meal plan
holder participants. The Residential Life department had to determine participants’
residency and email address status before they could make the random selection of 10%.
Once the residency and email address fields were satisfactory, they used the wed-based
randomizer program to select the records for the survey.
When they used the web-based randomizer, located at
http://www.randomizer.org, they entered:
1. A total number of records in the pool to be selected from
28
2. The number of records the department wanted to select
3. A sort order
4. A delimiter
Next they clicked the button to do the selection and the results of the selection came
back as a series of integers separated by commas. They dragged across the series of
numbers returned by the randomizer and copied the list back to Focus Program, (FoxPro)
for Windows, version 2.6a, where the department had a program that took the contents of
the Windows clipboard and pasted it into a text file.
The final list was in the form of a text file, with one record per line, according to
the format required by the contract survey company. When the department uploaded the
list to the contract survey company website, it did a quick check to find any names where
the first or last name was blank or only one letter. It also reported any duplicate records.
When it reported the faulty records, they returned to Focus Program (FoxPro), fixed the
problem if possible (or deleted the record if it could not be fixed or if it was a duplicate),
and created a new text file to upload. Eventually, all the faulty records were fixed and the
data were accepted by the contract survey company website.
After obtaining the names and email addresses, an invitation e-mail along with the
cover letter was sent to all the selected respondents on May 10, 2005 to May 24, 2005 to
participate in a web survey on university foodservice customer satisfaction. With the
development of the Internet, using e-mail or web survey is very easy to access, by simply
clicking on the appropriate buttons to indicate their answers. Also, using a web survey
can save a lot of time, postage, and to prevent the return survey to lost in the mail.
29
Data Analysis
Data was processed and analyzed by the Statistical Package for the Social
Sciences Window Version 11.5 (SPSS) program. In order to achieve the objective of the
study, different statistical tests, such as frequency, mean, independent sample t-test factor
analysis, one-way analysis of variance (ANOVA), and multiple regressions, were used.
First, descriptive statistics employing frequency and mean were used. Frequency
was first computed to examine demographic and behavioral characteristics of the
respondents. The mean score of the 22 attributes were ranked. Second, independent
sample t-test and one-way ANOVA was used to identify if there is any difference
between overall satisfaction and demographic (gender and age group) and behavioral
variables (types of meal plan).
Third, factor analysis was employed to identify underlying dimensions of the
student’s expectations towards food quality, atmosphere, service quality, convenience,
and price and value in the university foodservice. These factors were used to determine
their return intention and word-of-mouth endorsement to the university dining facilities.
To assess the reliability of measure, Cronbach’s alpha was calculated to test the reliability
of each variable retained in each factor. Only items with eigenvalues equal to or greater
than one and a factor loading of 0.5 or above was retained (Hair et al, 1998). The Kaiser-
Meyer-Olkin (KMO) measure of sampling adequacy (MSA) and the Bartlett Test of
Sphericity were used to the appropriateness of applying factor analysis.
Finally, based on the underlying dimensions (factors) derived from the factor
analysis, multiple regression analysis was used to predict and examine the strength of
30
associations between dependent and independent variables (Hair et al., 1998). In this
study, multiple regression analysis was employed to measure the relative impact of
Institutional DINESERV Dimensions on customer satisfaction; and the impact of
customer satisfaction on return intention, and word-of-mouth endorsement.
31
CHAPTER IV
ANALYSES & RESULTS
Response Rate
Four thousand six hundred and fifty nine (4,659) respondents were randomly selected
and contacted to participate in the survey. Seven hundred and seventy (770)
questionnaires were returned, indicating a response rate of 16.53%. Some incentives such
as DVD player and dining gift certificates were to encourage the respondents to
participate in this study and in the hopes of increasing the response rate. Of the 770
respondents, 489 were student meal plan holders, 69 were faculty or staff meal plan
holders, and 212 respondents had no meal plan.
Characteristics of the Respondents
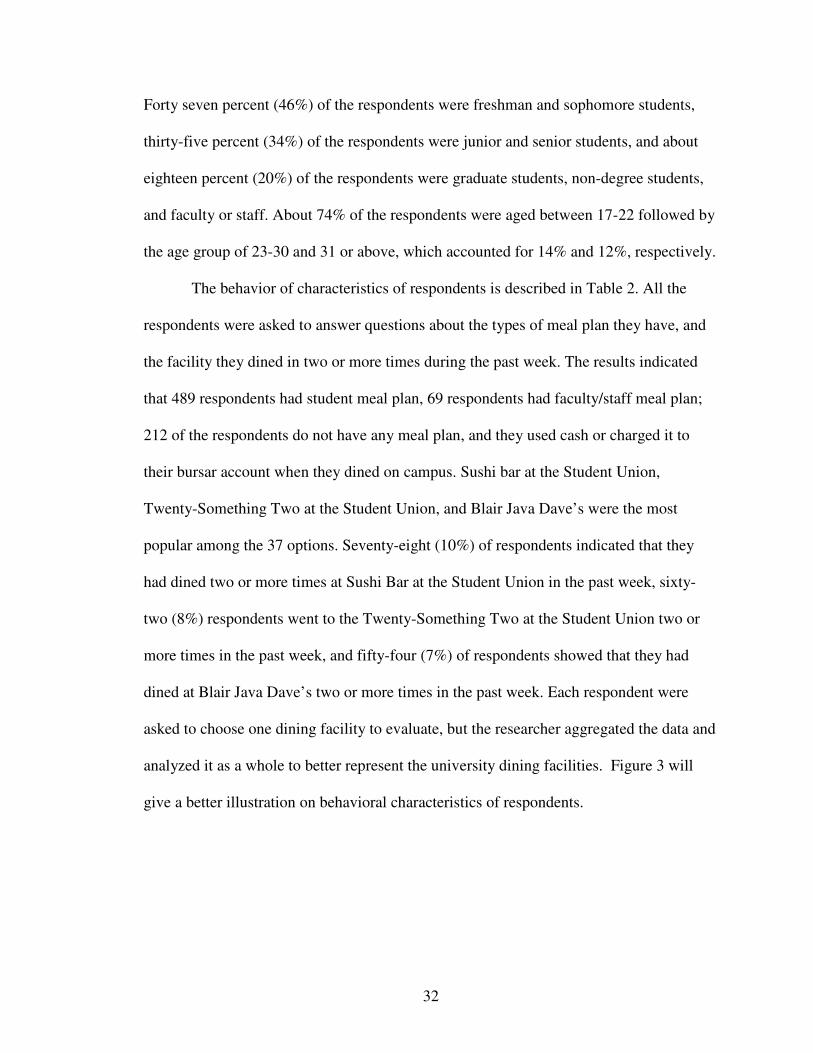
As shown in Table 1, the sample consisted of 330 male respondents (42.9%) and
440 female respondents (57.1%). Among the 770 respondents, 621 respondents were
white American, 54 respondents were other, 41 respondents were Native American
Indian, 19 respondents were African American, 13 respondents were multiracial, 12
were Asian American, and 10 respondents were of Latino/Chicano/Spanish origin.
32
Forty seven percent (46%) of the respondents were freshman and sophomore students,
thirty-five percent (34%) of the respondents were junior and senior students, and about
eighteen percent (20%) of the respondents were graduate students, non-degree students,
and faculty or staff. About 74% of the respondents were aged between 17-22 followed by
the age group of 23-30 and 31 or above, which accounted for 14% and 12%, respectively.
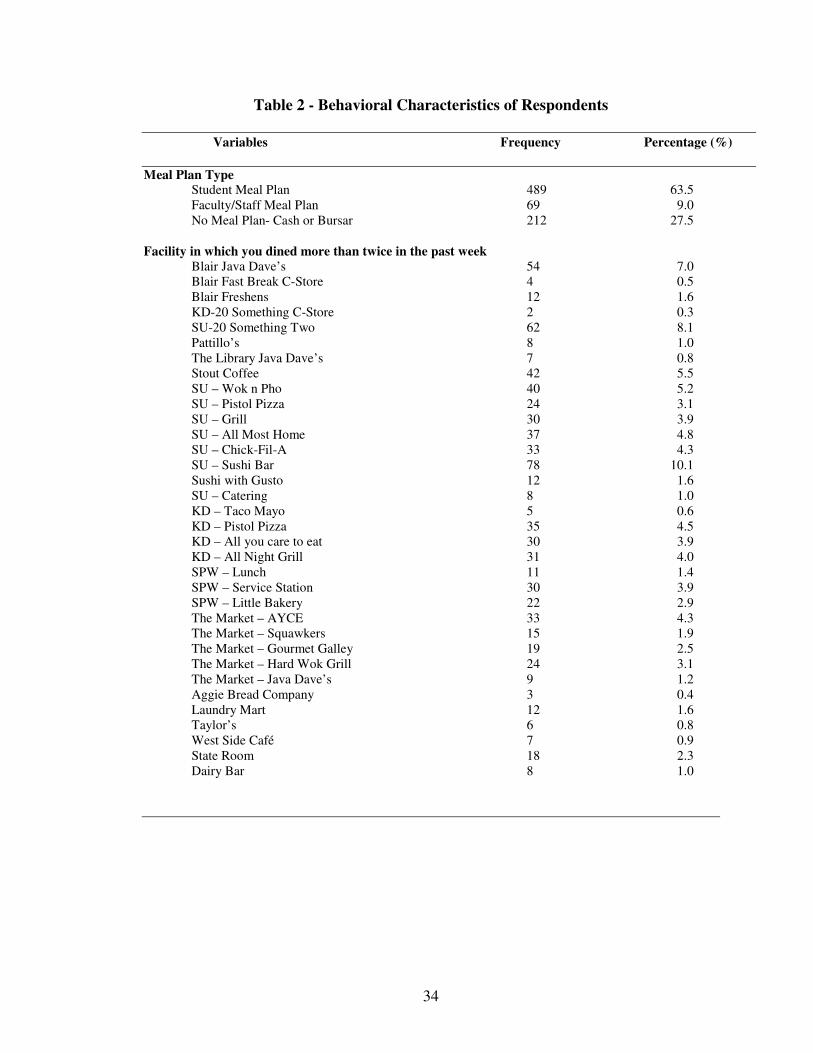
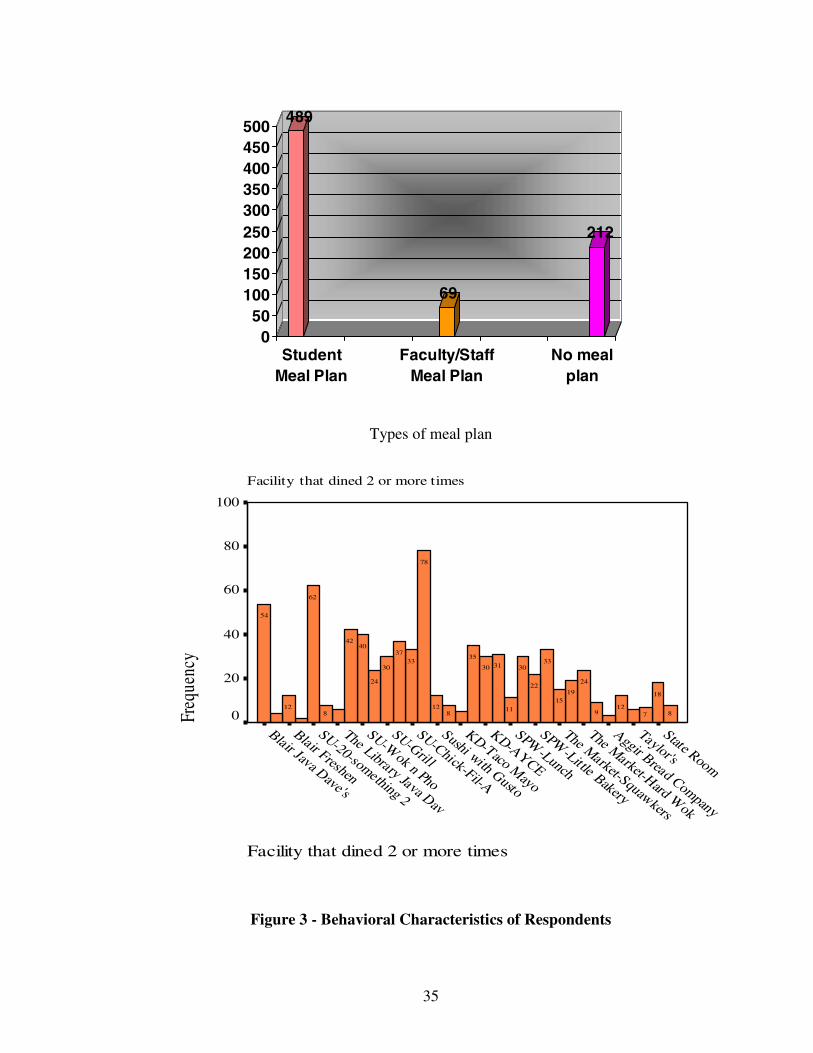
The behavior of characteristics of respondents is described in Table 2. All the
respondents were asked to answer questions about the types of meal plan they have, and
the facility they dined in two or more times during the past week. The results indicated
that 489 respondents had student meal plan, 69 respondents had faculty/staff meal plan;
212 of the respondents do not have any meal plan, and they used cash or charged it to
their bursar account when they dined on campus. Sushi bar at the Student Union,
Twenty-Something Two at the Student Union, and Blair Java Dave’s were the most
popular among the 37 options. Seventy-eight (10%) of respondents indicated that they
had dined two or more times at Sushi Bar at the Student Union in the past week, sixty-
two (8%) respondents went to the Twenty-Something Two at the Student Union two or
more times in the past week, and fifty-four (7%) of respondents showed that they had
dined at Blair Java Dave’s two or more times in the past week. Each respondent were
asked to choose one dining facility to evaluate, but the researcher aggregated the data and
analyzed it as a whole to better represent the university dining facilities. Figure 3 will
give a better illustration on behavioral characteristics of respondents.
33
Table 1 - Demographic Characteristics of Respondents
Variables Frequency Percentage (%)
GenderMale 330 42.9Female 440 57.1
EthnicityMultiracial 13 1.7African American 19 2.5Native American Indian 41 5.3Asian American 12 1.6Latino/Chicano/Spanish origin 10 1.3White American 621 80.6Other 54 7.0
ClassificationFreshman 207 26.9Sophomore 146 19.0Junior 163 21.2Senior 98 12.7Graduate Student 63 8.2Non-degree Student 1 0.1Faculty/Staff 92 11.9
Age17-19 231 30.020-22 335 43.523-25 78 10.126-30 32 4.231 and above 94 12.2
34
Table 2 - Behavioral Characteristics of Respondents
Variables Frequency Percentage (%)
Meal Plan TypeStudent Meal Plan 489 63.5Faculty/Staff Meal Plan 69 9.0No Meal Plan- Cash or Bursar 212 27.5
Facility in which you dined more than twice in the past weekBlair Java Dave’s 54 7.0Blair Fast Break C-Store 4 0.5Blair Freshens 12 1.6KD-20 Something C-Store 2 0.3SU-20 Something Two 62 8.1Pattillo’s 8 1.0The Library Java Dave’s 7 0.8Stout Coffee 42 5.5SU – Wok n Pho 40 5.2SU – Pistol Pizza 24 3.1SU – Grill 30 3.9SU – All Most Home 37 4.8SU – Chick-Fil-A 33 4.3SU – Sushi Bar 78 10.1Sushi with Gusto 12 1.6SU – Catering 8 1.0KD – Taco Mayo 5 0.6KD – Pistol Pizza 35 4.5KD – All you care to eat 30 3.9KD – All Night Grill 31 4.0SPW – Lunch 11 1.4SPW – Service Station 30 3.9SPW – Little Bakery 22 2.9The Market – AYCE 33 4.3The Market – Squawkers 15 1.9The Market – Gourmet Galley 19 2.5The Market – Hard Wok Grill 24 3.1The Market – Java Dave’s 9 1.2Aggie Bread Company 3 0.4Laundry Mart 12 1.6Taylor’s 6 0.8West Side Café 7 0.9State Room 18 2.3Dairy Bar 8 1.0
35
489
69
212
050
100150200250300350400450500
StudentMeal Plan
Faculty/StaffMeal Plan
No mealplan
Types of meal plan
Facility that dined 2 or more times
Facility that dined 2 or more times
State Room
Taylor's
Aggir Bread Company
The Market-Hard Wok
The Market-Squawkers
SPW-Little Bakery
SPW-Lunch
KD-AYCE
KD-Taco Mayo
Sushi with Gusto
SU-Chick-Fil-A
SU-Grill
SU-Wok n Pho
The Library Java Dav
SU-20-something 2
Blair Freshen
Blair Java Dave's
Freq
uenc
y
100
80
60
40
20
0 8
18
712
9
24
1915
33
22
30
11
3130
35
812
78
3337
30
24
4042
8
62
12
54
Figure 3 - Behavioral Characteristics of Respondents
36
Attributes of Institutional DINESERV Dimensions
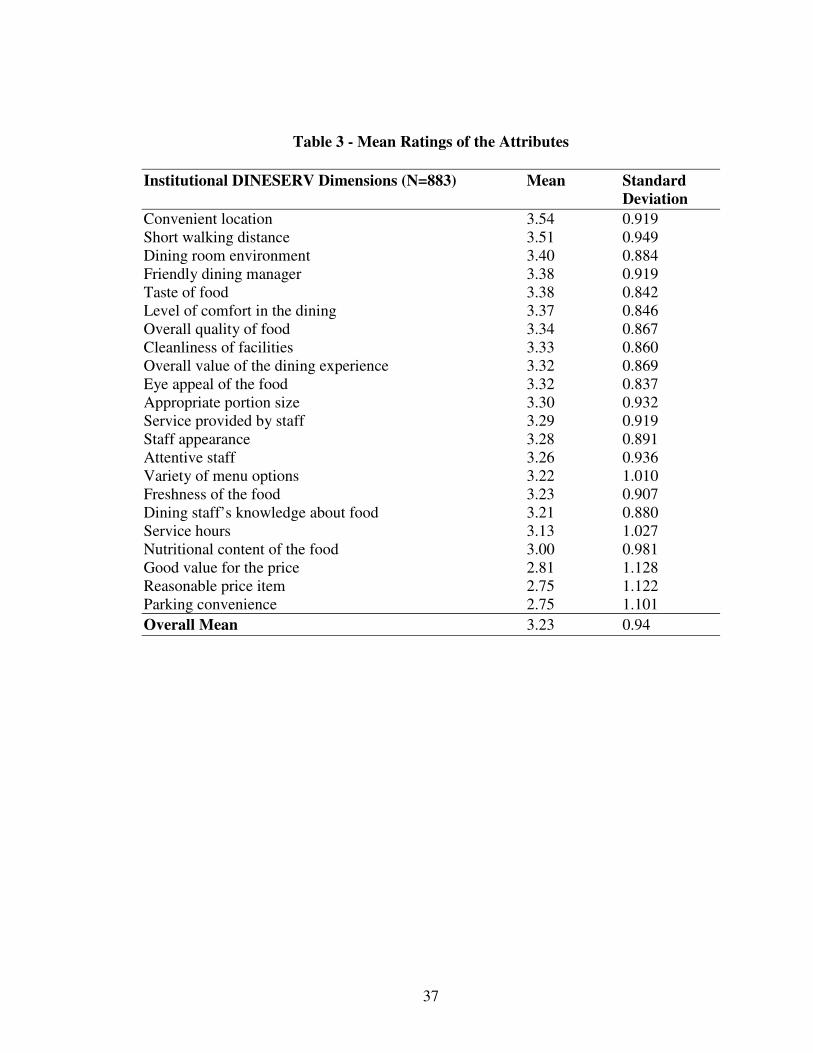
The objective of identifying the respondents’ expectations level with the attributes
of Institutional DIVESERV was achieved through mean rating of 22 attributes listed in
Table 3. To assess the respondents’ expectation level, the Institutional DINESERV
attributes were measured by asking the respondents to rate the 22 attributes on a five-
point Likert scale: 1 = “much worse than I expected” to 5 = “much better than I
expected.”
Table 3 highlights the mean scores and the ranking of student’s expectations level
about the 22 attributes. The higher mean scores indicate that the attributes exceeded the
respondent’s expectations; while the lower mean scores indicate the attributes did not
meet the respondent’s expectations. The ranking indicated that most of the attributes were
just above the midpoint of the scale. This indicated that these 22 attributes met the
respondent’s expectation level, but did not exceed their expectations.
The overall mean score was 3.23. Those attributes such as convenient location,
short walking distance, dining room environment, friendly dining manager, taste of food,
and level of comfort in the dining room were considered “met the student’s expectation”
level. All of the attributes were rated 3.35 or higher.
There were several attributes rated below average. They were parking
convenience, reasonable price item, and good value for the price. Their mean ratings
ranged from 2.81 to 2.75.
37
Table 3 - Mean Ratings of the Attributes
Institutional DINESERV Dimensions (N=883) Mean StandardDeviation
Convenient location 3.54 0.919Short walking distance 3.51 0.949Dining room environment 3.40 0.884Friendly dining manager 3.38 0.919Taste of food 3.38 0.842Level of comfort in the dining 3.37 0.846Overall quality of food 3.34 0.867Cleanliness of facilities 3.33 0.860Overall value of the dining experience 3.32 0.869Eye appeal of the food 3.32 0.837Appropriate portion size 3.30 0.932Service provided by staff 3.29 0.919Staff appearance 3.28 0.891Attentive staff 3.26 0.936Variety of menu options 3.22 1.010Freshness of the food 3.23 0.907Dining staff’s knowledge about food 3.21 0.880Service hours 3.13 1.027Nutritional content of the food 3.00 0.981Good value for the price 2.81 1.128Reasonable price item 2.75 1.122Parking convenience 2.75 1.101Overall Mean 3.23 0.94
38
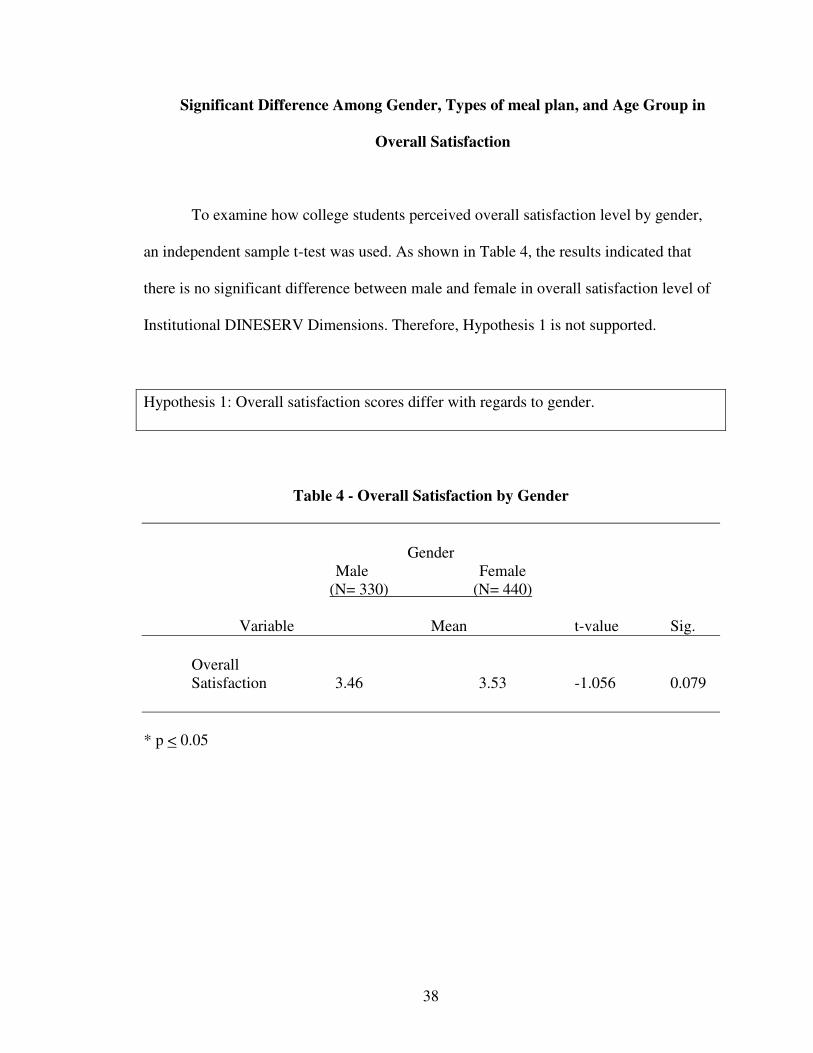
Significant Difference Among Gender, Types of meal plan, and Age Group in
Overall Satisfaction
To examine how college students perceived overall satisfaction level by gender,
an independent sample t-test was used. As shown in Table 4, the results indicated that
there is no significant difference between male and female in overall satisfaction level of
Institutional DINESERV Dimensions. Therefore, Hypothesis 1 is not supported.
Hypothesis 1: Overall satisfaction scores differ with regards to gender.
Table 4 - Overall Satisfaction by Gender
GenderMale Female
(N= 330) (N= 440)
Variable Mean t-value Sig.
OverallSatisfaction 3.46 3.53 -1.056 0.079
* p < 0.05
39
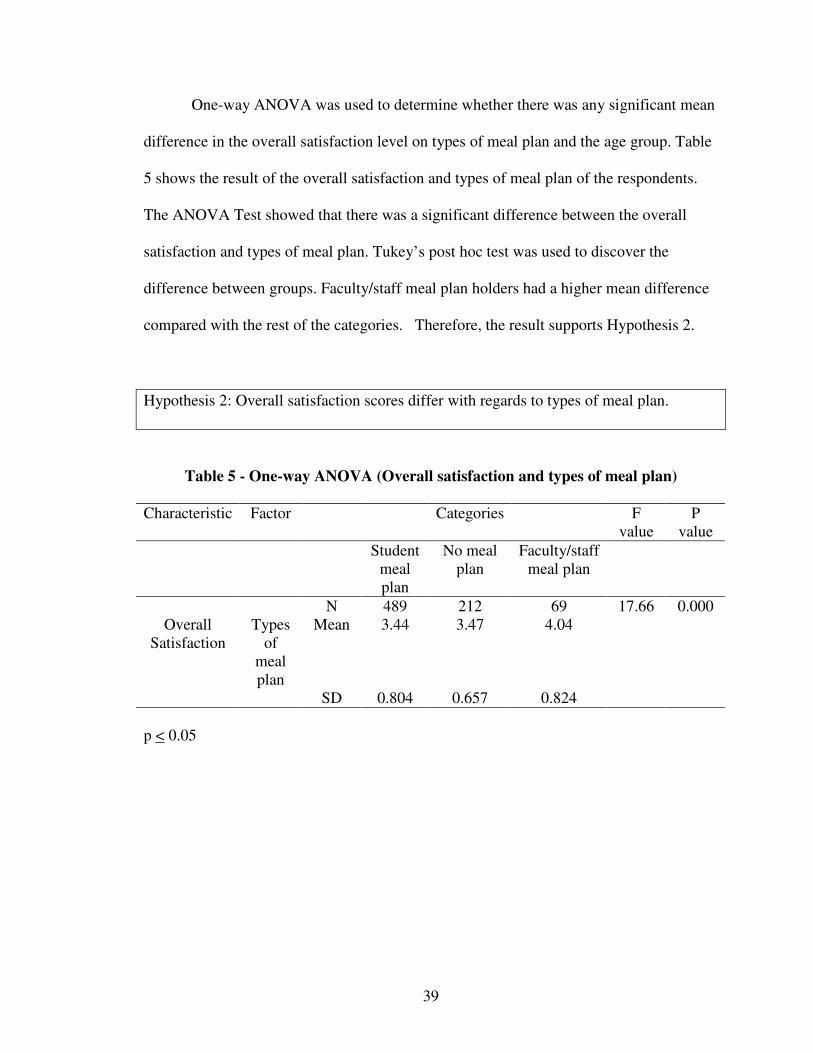
One-way ANOVA was used to determine whether there was any significant mean
difference in the overall satisfaction level on types of meal plan and the age group. Table
5 shows the result of the overall satisfaction and types of meal plan of the respondents.
The ANOVA Test showed that there was a significant difference between the overall
satisfaction and types of meal plan. Tukey’s post hoc test was used to discover the
difference between groups. Faculty/staff meal plan holders had a higher mean difference
compared with the rest of the categories. Therefore, the result supports Hypothesis 2.
Hypothesis 2: Overall satisfaction scores differ with regards to types of meal plan.
Table 5 - One-way ANOVA (Overall satisfaction and types of meal plan)
Characteristic Factor Categories F value
P value
Student meal plan
No meal plan
Faculty/staff meal plan
N 489 212 69 17.66 0.000Overall
SatisfactionTypes
of meal plan
Mean 3.44 3.47 4.04
SD 0.804 0.657 0.824
p < 0.05
40
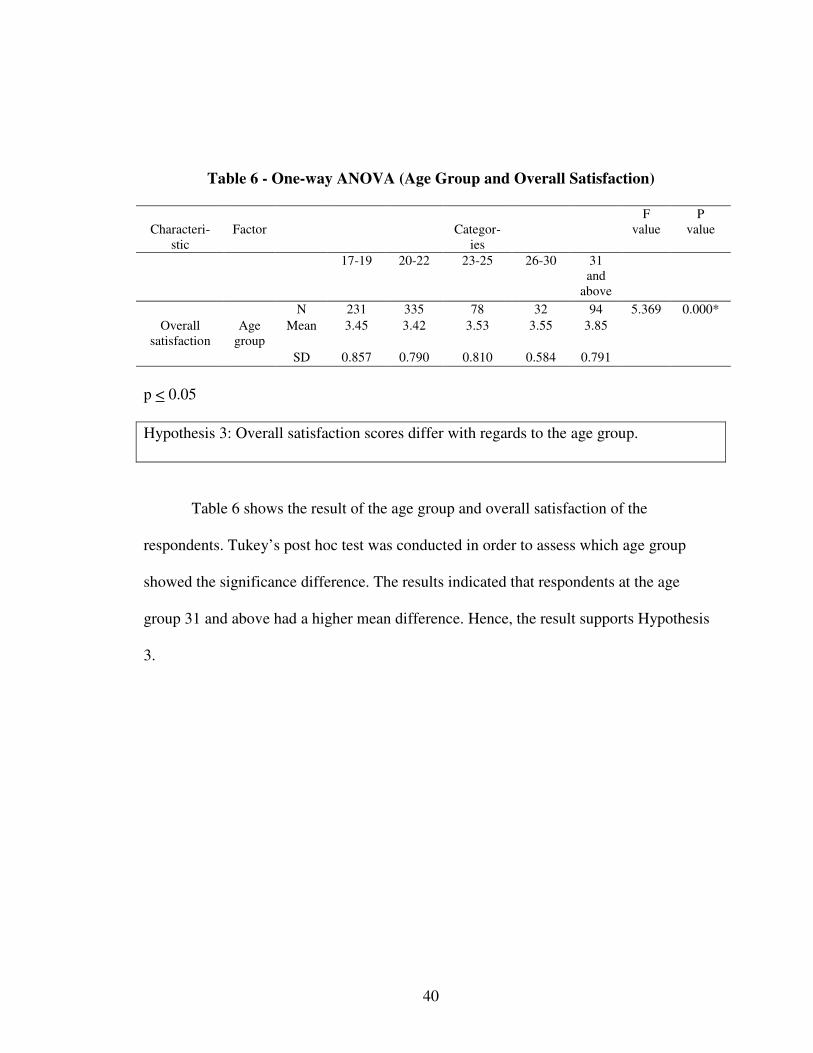
Table 6 - One-way ANOVA (Age Group and Overall Satisfaction)
Characteri-stic
Factor Categor-ies
F value
P value
17-19 20-22 23-25 26-30 31 and
aboveN 231 335 78 32 94 5.369 0.000*
Overall satisfaction
Age group
Mean 3.45 3.42 3.53 3.55 3.85
SD 0.857 0.790 0.810 0.584 0.791
p < 0.05
Hypothesis 3: Overall satisfaction scores differ with regards to the age group.
Table 6 shows the result of the age group and overall satisfaction of the
respondents. Tukey’s post hoc test was conducted in order to assess which age group
showed the significance difference. The results indicated that respondents at the age
group 31 and above had a higher mean difference. Hence, the result supports Hypothesis
3.
41
The Factor Analysis
To determine whether the data were appropriate for factor analysis, the data set
was examined to ensure that the variables were not inter-correlated and that the variables
were grouped properly. Bartlett’s test of sphericity (using a chi-square test) was applied
to test for inter-correlation, and Kaiser-Meyer- Olkins (KMO) measure of sampling
adequacy was used to make sure that the variables were grouped properly. For data to be
appropriate for factor analysis, the results of the Bartlett’s test should be significant and
the KMO value should be greater than .50. In the study, the value of KMO was .924,
which was marvelous (Kaiser, 1974), and verified that the use of factor analysis was
appropriate in the study. Bartlett test of sphericity value (χ2) was 11362.496, with the
overall significance of the correlation matrix of .000, indicating that the data were
suitable for factor analysis.
Varimax rotation, a method of orthogonal rotation that centers on simplifying the
factor matrix by maximizing variance and producing conceptually pure factors, was
applied. The criteria for the number of factors to be extracted were based on eigenvalue,
percentage of variance, significance of factor loading, and assessment of structure. A
loading cut-off on 0.50 was adopted in this study. Only the factors with eigenvalue equal
to or greater than 1 were considered as significant. The solution that accounted for at least
50% of the total variance was regarded as a satisfactory solution.
After analyzing the data with Principal Component Analysis of factor analysis
with a VARIMAX rotation, 19 variables with a factor loading of .50 or greater were
retained and it grouped the 18 variables into 5 groups. Four variables were reduced from
42
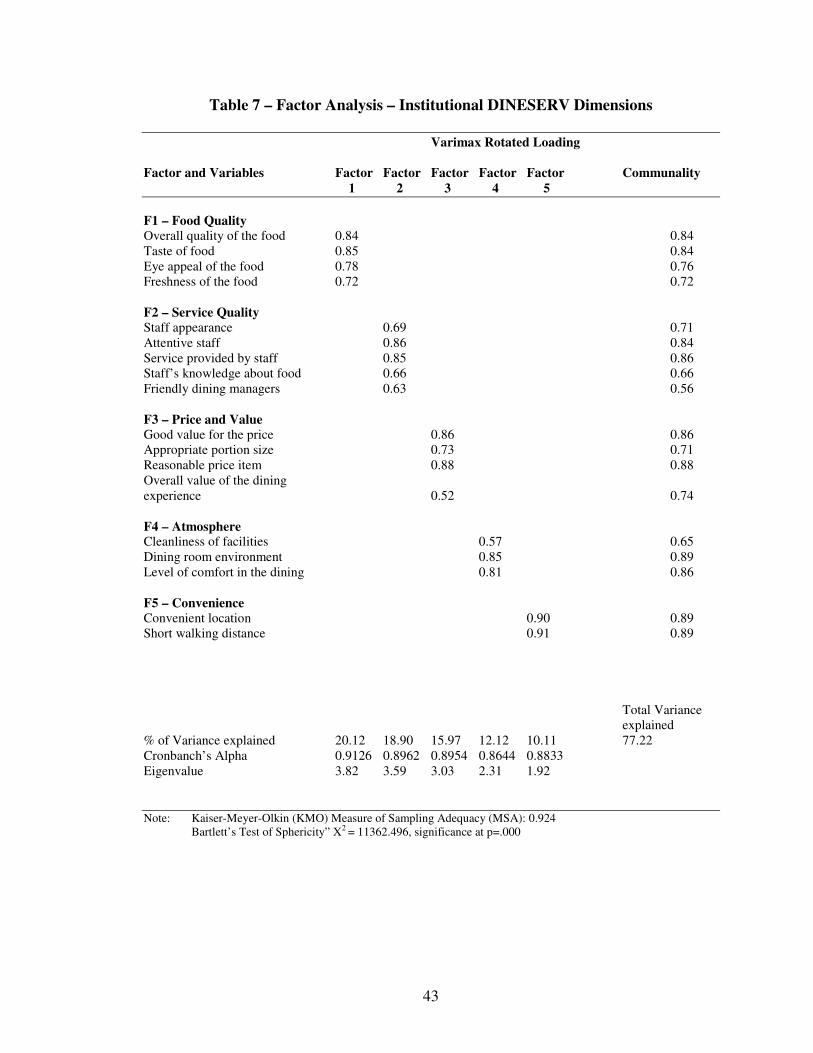
the original 22 variables because only factor loadings equal or greater than 0.5 were
considered acceptable in a factor analysis (Hair et al., 1998). The first factor was labeled
as “Food Quality.” It involved four variables and explained 20.12% of the variance in the
data, with an eigenvalue of 3.82. It consisted of overall quality of the food, taste of the
food, freshness of the food, and eye appeal of the food. The second factor was labeled as
“Service Quality.” It included staff appearance, attentive staff, service provided by staff,
staff’s knowledge about food, and friendly managers. It explained 18.9% of the variance,
with an eigenvalue of 3.59.
The third factor was labeled as “Price and Value”, with four variables – good
value for the price, appropriate portion size, reasonable price item, and overall value of
the dining experience. It had an eigenvalue of 3.03 and total variance explained was
15.97%. The fourth factor was labeled as “Atmosphere.” It included cleanliness of
facilities, dining room environment and level of comfort in the dining. It explained
12.16% of the variance, with an eigenvalue of 2.31. Finally, the fifth factor was labeled
as “convenience” With an eigenvalue of 1.92; this factor explained 10.11% of the
variance. It consisted of two variables – convenient location and short walking distance.
The researcher named these five factors as Institutional DINESERV Dimensions.
43
Table 7 – Factor Analysis – Institutional DINESERV Dimensions
Varimax Rotated Loading
Factor and Variables Factor Factor Factor Factor Factor Communality 1 2 3 4 5
F1 – Food QualityOverall quality of the food 0.84 0.84Taste of food 0.85 0.84Eye appeal of the food 0.78 0.76Freshness of the food 0.72 0.72
F2 – Service QualityStaff appearance 0.69 0.71Attentive staff 0.86 0.84Service provided by staff 0.85 0.86Staff’s knowledge about food 0.66 0.66Friendly dining managers 0.63 0.56
F3 – Price and ValueGood value for the price 0.86 0.86Appropriate portion size 0.73 0.71Reasonable price item 0.88 0.88Overall value of the dining experience 0.52 0.74
F4 – AtmosphereCleanliness of facilities 0.57 0.65Dining room environment 0.85 0.89Level of comfort in the dining 0.81 0.86
F5 – ConvenienceConvenient location 0.90 0.89Short walking distance 0.91 0.89
Total Varianceexplained
% of Variance explained 20.12 18.90 15.97 12.12 10.11 77.22Cronbanch’s Alpha 0.9126 0.8962 0.8954 0.8644 0.8833Eigenvalue 3.82 3.59 3.03 2.31 1.92
Note: Kaiser-Meyer-Olkin (KMO) Measure of Sampling Adequacy (MSA): 0.924Bartlett’s Test of Sphericity” X2 = 11362.496, significance at p=.000
44
The Regression Analysis
To investigate whether the Institutional DINESERV Dimensions could be an
influence on customer satisfaction, the customer satisfaction score was regressed against
the summated scale of the five dimensions derived from the factor analysis. Then, to find
out whether satisfaction could be an influence on customer return intention and word-of-
mouth endorsement, the return intention score and word-of-mouth endorsement score
were regressed against the summated scale of the customer satisfaction score.
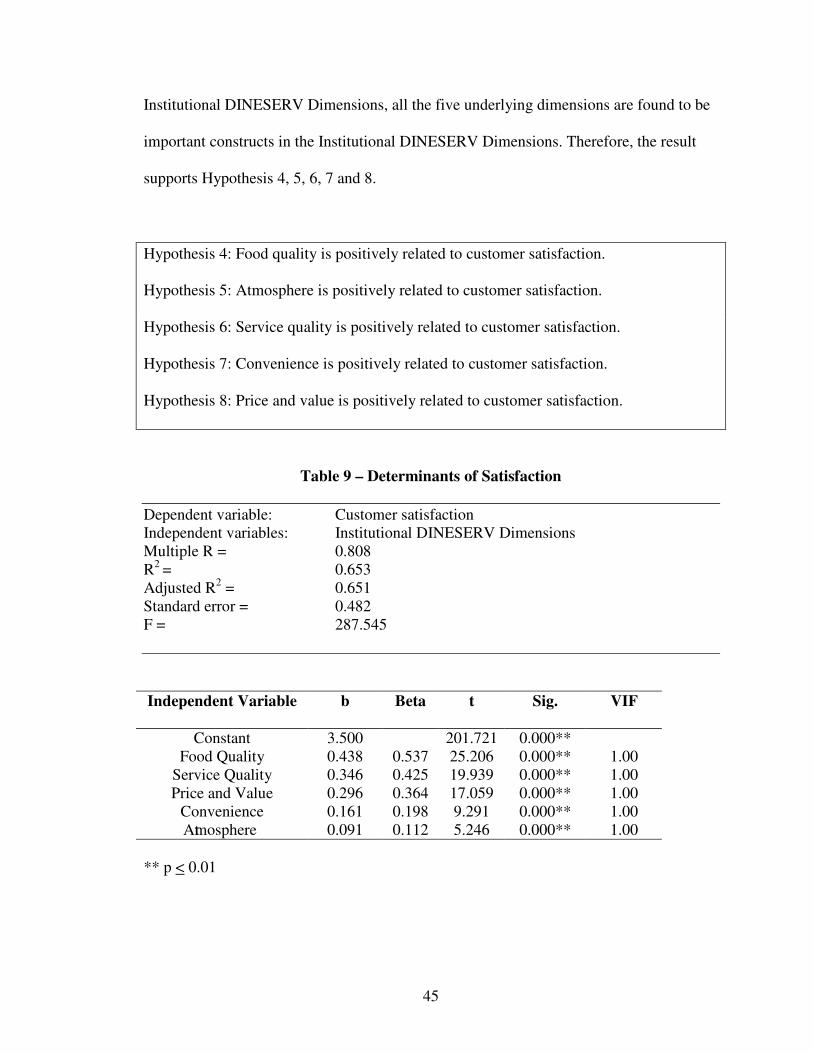
Table 9 describes the results of the regression analysis of the Institutional
DINESERV Dimensions as independent variables with the customer satisfaction as the
dependent variable. The coefficient of determination (R2) of 0.653 indicated that 65.3%
of the variance in the customer satisfaction was explained by the Institutional
DINESERV Dimensions. The R of independent variables, Institutional DINESERV
Dimensions, on the dependent variable, customer satisfaction is 0.808, which represents
that the respondents had a positive and high satisfaction level with food quality, service
quality, price and value, convenience, and atmosphere. The F-ratio of 287.545 was
significant (p < 0.01).
To detect the presence of multicollinearity, the variance inflation factor (VIF) is
calculated and presented in Table 9. The value of variance of inflation (VIF) indicated
that there was no multicollinearity. All the five underlying dimensions, food quality,
service quality, price and value, convenience, and atmosphere appear to be significant
independent variables that influence the customer satisfaction in the university dining
facilities. In other words, when we consider the relationship between satisfaction and the
45
Institutional DINESERV Dimensions, all the five underlying dimensions are found to be
important constructs in the Institutional DINESERV Dimensions. Therefore, the result
supports Hypothesis 4, 5, 6, 7 and 8.
Hypothesis 4: Food quality is positively related to customer satisfaction.
Hypothesis 5: Atmosphere is positively related to customer satisfaction.
Hypothesis 6: Service quality is positively related to customer satisfaction.
Hypothesis 7: Convenience is positively related to customer satisfaction.
Hypothesis 8: Price and value is positively related to customer satisfaction.
Table 9 – Determinants of Satisfaction
Dependent variable: Customer satisfactionIndependent variables: Institutional DINESERV DimensionsMultiple R = 0.808R2 = 0.653Adjusted R2 = 0.651Standard error = 0.482F = 287.545
Independent Variable b Beta t Sig. VIF
Constant 3.500 201.721 0.000**Food Quality 0.438 0.537 25.206 0.000** 1.00
Service Quality 0.346 0.425 19.939 0.000** 1.00Price and Value 0.296 0.364 17.059 0.000** 1.00
Convenience 0.161 0.198 9.291 0.000** 1.00Atmosphere 0.091 0.112 5.246 0.000** 1.00
** p < 0.01
46
Table 10 – Determinant of Return Intention
Dependent variable: Return intentionIndependent variable: Customer satisfactionMultiple R = 0.754R2 = 0.569Adjusted R2 = 0.568Standard error = 0.588F = 1012.945
Independent Variable b Beta t Sig. VIF
Constant 0.93 9.945 0.000**Customer Satisfaction 0.83 0.754 31.827 0.000** 1.00
** p < 0.01
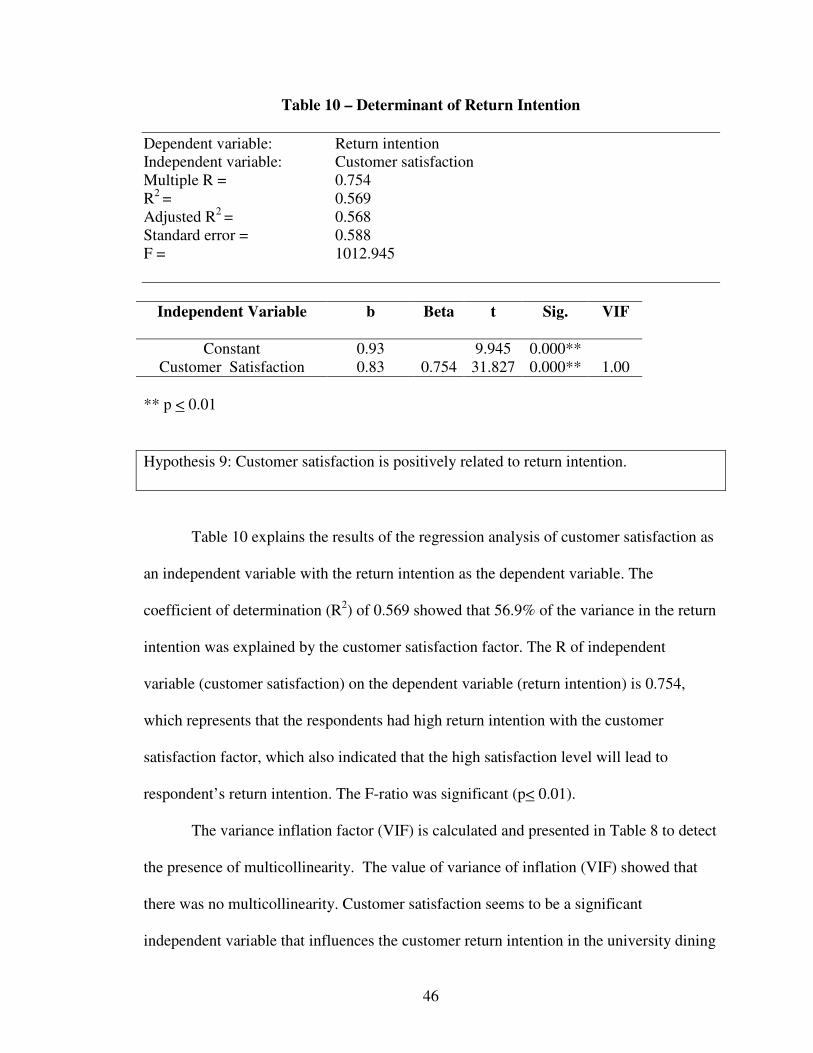
Hypothesis 9: Customer satisfaction is positively related to return intention.
Table 10 explains the results of the regression analysis of customer satisfaction as
an independent variable with the return intention as the dependent variable. The
coefficient of determination (R2) of 0.569 showed that 56.9% of the variance in the return
intention was explained by the customer satisfaction factor. The R of independent
variable (customer satisfaction) on the dependent variable (return intention) is 0.754,
which represents that the respondents had high return intention with the customer
satisfaction factor, which also indicated that the high satisfaction level will lead to
respondent’s return intention. The F-ratio was significant (p< 0.01).
The variance inflation factor (VIF) is calculated and presented in Table 8 to detect
the presence of multicollinearity. The value of variance of inflation (VIF) showed that
there was no multicollinearity. Customer satisfaction seems to be a significant
independent variable that influences the customer return intention in the university dining
47
facilities. In other words, when we consider the relationship between return intention and
satisfaction, customer satisfaction has a strong impact in determining their return
intention. Students who have a high satisfaction level towards the university dining
facilities also have a high return intention. Thus, the result supports Hypothesis 9.
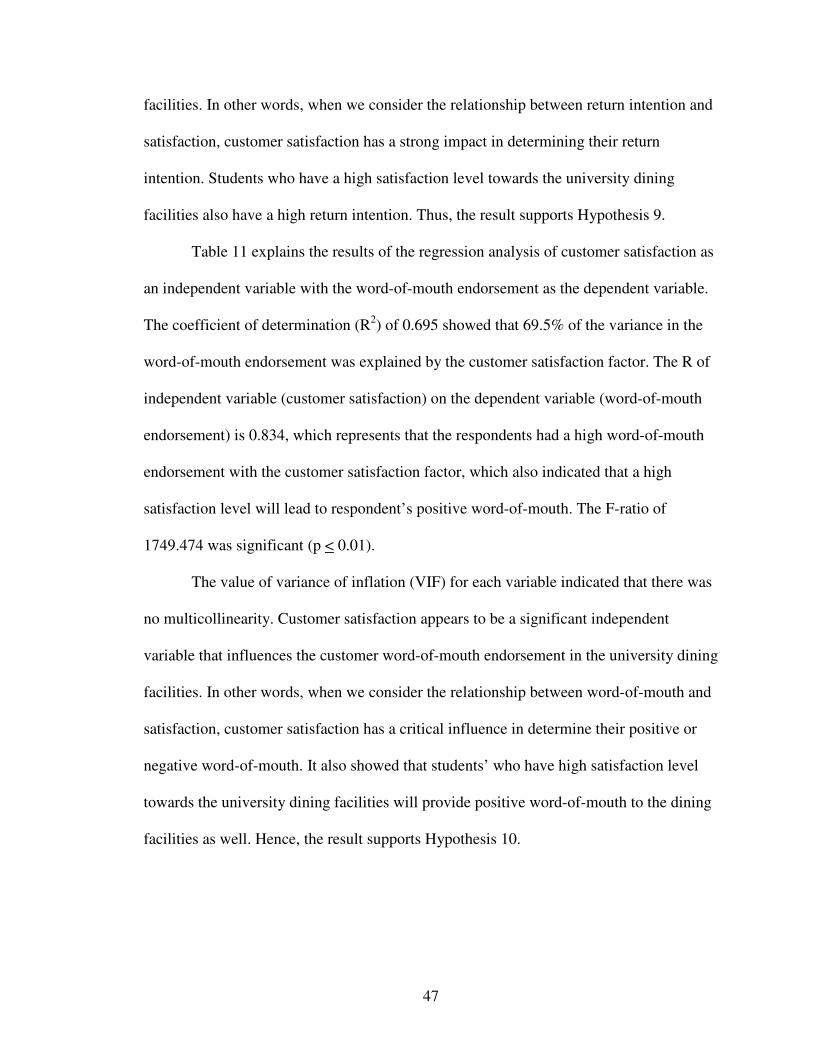
Table 11 explains the results of the regression analysis of customer satisfaction as
an independent variable with the word-of-mouth endorsement as the dependent variable.
The coefficient of determination (R2) of 0.695 showed that 69.5% of the variance in the
word-of-mouth endorsement was explained by the customer satisfaction factor. The R of
independent variable (customer satisfaction) on the dependent variable (word-of-mouth
endorsement) is 0.834, which represents that the respondents had a high word-of-mouth
endorsement with the customer satisfaction factor, which also indicated that a high
satisfaction level will lead to respondent’s positive word-of-mouth. The F-ratio of
1749.474 was significant (p < 0.01).
The value of variance of inflation (VIF) for each variable indicated that there was
no multicollinearity. Customer satisfaction appears to be a significant independent
variable that influences the customer word-of-mouth endorsement in the university dining
facilities. In other words, when we consider the relationship between word-of-mouth and
satisfaction, customer satisfaction has a critical influence in determine their positive or
negative word-of-mouth. It also showed that students’ who have high satisfaction level
towards the university dining facilities will provide positive word-of-mouth to the dining
facilities as well. Hence, the result supports Hypothesis 10.
48
Table 11 – Determinant of Word-of-Mouth Endorsement
Dependent variable: Word-of-mouth endorsementIndependent variable: Customer satisfactionMultiple R = 0.834R2 = 0.695Adjusted R2 = 0.695Standard error = 0.523F = 1749.474
Independent Variable b Beta t Sig. VIFConstant 0.09 0.106 0.915
Customer Satisfaction 0.97 0.834 41.827 0.000** 1.00
** p < 0.01
Hypothesis 10: Customer satisfaction is positively related to word-of-mouth endorsement.
Based on the coefficient of each independent variable, one can assess the impact
of each variable on the dependent variable. From Table 9, it could be noted that the
variable “Food quality” was the most important determinant factor in explaining college
student’s overall satisfaction; it has the highest coefficient value (0.438), as well as the
t-value (25.206). Service quality (Beta = 0.346), price and value (Beta = 0.296),
convenience (0.161), and atmosphere (0.091) followed in importance. Since all the
dimensions turned out to be significant, the coefficient value is important. In addition, it
would indicate that the student’s satisfaction level with food quality, service quality, price
and value, convenience and atmosphere have a complete relationship with each other.
In summary, overall satisfaction, defined from the three underlying attributes, has
shown a significant positive effect in determining student’s return intention and word-of-
mouth endorsement. Institutional DINESERVE Dimensions are found positively related

49
to customer satisfaction. The results also indicated that a high satisfaction level will lead
to a high return intention and positive word-of-mouth endorsement.
50
CHAPTER V
CONCLUSION
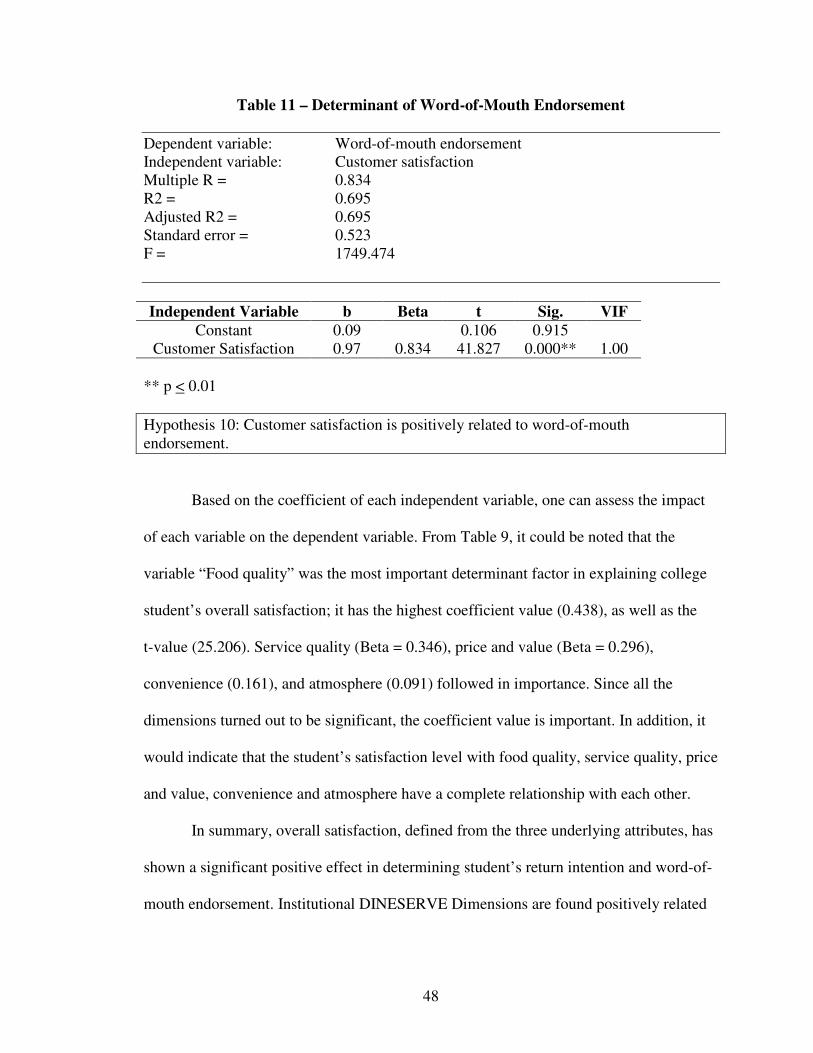
Research Summary and Implications
As the perceptions on importance of customer satisfaction have grown in the business
world, studies on customer satisfaction have been constantly performed. This study
determined the influence of Institutional DINESERV Dimensions on customer
satisfaction, return intention, and word-of-mouth endorsement in the university dining
facilities at Oklahoma State University. The results of descriptive statistics showed that
gender distribution was 42.9% of male and 57.1% of female. About 81 percent of the
respondents were white American, and 46 percent of the respondents were freshman and
sophomore. About 74 percent of the respondents were categorized in the age group of 17
to 22. Sixty four percent (64%) of the respondents were holding student meal plan, nine
percent (9%) of the respondents were holding staff/faculty meal plan, and twenty eight
percent (28%) of the respondents with no meal plan. The respondents were asked to
choose the facility they dined in twice or more during the past week, the results showed
that Sushi Bar at the Student Union ranked the first, Twenty-Something Two at the
Student Union ranked the second, and Blair Java Dave’s ranked the third among the 37
options.
51
Hypotheses 1 - 3 were established to examine any differences of respondents’ overall
satisfaction scores with regards to demographic (gender and age group) and behavioral
variables (types of meal plan). When comparing the overall satisfaction among male and
female, the results indicated that there was no significant difference among male and
female respondents. But when comparing the overall satisfaction with types of meal plan,
the results indicated that there is a significant difference between faculty/staff meal plan
holders and student meal plan holders, and faculty/staff meal plan holders and no meal
plan holders. The researcher believes faculty/staff meal plan holders will have higher
overall satisfaction mainly because they have been treated differently in the dining
facilities compared with the students. Faculty or staff has a recognizable status in the
university, and therefore, might be treated with more respect and courtesy by the
employees when they dined on campus. Also, students who are in their freshman year are
required to stay on campus and buy a meal plan; and staff who work in the university
foodservice facilities and the residential life department are given a forty dollar meal plan
per week. Therefore, when comparing with staff or faculty, students do not have many
options in selecting dining places, while staff or faculty have freedom to choose their
dining options. In other words, those staff and faculty who selected university dining
facilities would be the people who prefer to eat at the university dining.
52
The age group of 31 and above showed a higher satisfaction scores compared with the
rest of the age group. Most of the faculty/staff and graduate students were being
categorized in the age group of 31 and above. Therefore, the age group of 31 and above
will have higher overall satisfaction mostly because they prefer to dine on campus.
Furthermore, faculty/staff mostly have one hour for their lunch break, convenient
location and short walking distance of the dining facilities might have some influence on
their overall satisfaction as well.
The purpose of this study was to explore those attributes that customers perceive as
“meet their expectation level” in their selection of a university dining facility, and to
determine the influence of food quality, service quality, atmosphere, price and value, and
convenience on customer satisfaction, return intention, and word-of-mouth endorsement.
The attributes such as convenient location, short walking distance, dining room
environment, friendly dining manager, taste of food, and level of comfort in the dining
room were rated by the respondents as “meet their expectation.” Most of the students
prefer not to walk too far, have their meal or snack in a comfortable dining environment,
and enjoy the taste of their food at the same time. The mean ranking indicated that most
of the attributes were just above the midpoint of the scale. This indicated that these 22
attributes met the respondent’s expectation level, but did not exceed their expectations.
Therefore, the foodservice operators should try their best to improve all the attributes in
order to exceed the student’s expectations.
After analyzing the data with Principal Component Analysis of factor analysis with a
VARIMAX rotation, 18 variables with a factor loading of .50 or greater were retained
and it grouped the 18 variables into 5 factors, and the researcher named these five factors
53
as Institutional DINESERV Dimensions. Hypothesis 4 - 8 were to find the relationship
between food quality, service quality, price and value, convenience, and atmosphere with
customer satisfaction. When analyzing the Institutional DINESERV Dimensions with
customer satisfaction by multiple regression, all dimensions, food quality, service quality,
price and value, convenience, and atmosphere, showed a significant effect on customer
satisfaction. Since all five dimensions have a critical impact on customer satisfaction, the
foodservice operators should pay more attention; continue to improve themselves in
every aspect of their operation in order to exceed their customer’s expectation.
This study clarified that food quality has the most critical impact in determining
customer satisfaction. Overall quality of the food, taste of food, freshness of the food, and
eye appeal of the food were classified under food quality dimension. The improvement of
eye appeal of the food might help the foodservice operators achieve or exceed customer
satisfaction and return intention. This result supports the previous findings of Pettijohn,
Pettijohn, & Luke (1997) and Sulek & Hensley (2004).
After food quality, came the service quality dimension, which includes staff
appearance, attentive staff, service provided by the staff, staff’s knowledge about food,
and friendly dining managers; price and value dimension, good value for the price,
appropriate portion size, reasonable price item, and overall value of the dining
experience. The atmosphere dimension includes cleanliness of facilities, dining room
environment, and level of comfort in the dining room, and the convenience dimension
includes convenient location and short walking distance. The foodservice operators
should consider improving the service quality, the price and value, the convenience, and
the atmosphere in order to meet their customer’s expectation. Furthermore, the
54
foodservice operators should greet their customers in a polite manner, maintain the dining
facilities, keep the building clean, and have reasonable pricing to help increase customer
satisfaction. In addition, with a good transportation system on campus, students can
easily access the dining facilities on campus. Therefore, the convenience dimension may
be a “salient” or “striking point” dimension in the mind of most students. Foodservice
operators might take the convenience dimension into consideration before they open any
new outlets.
Hypothesis 9 and hypothesis 10 were to find the relationship between customer
satisfaction with return intention and word-of-mouth endorsement. When analyzing the
customer satisfaction with return intention, and word-of-mouth endorsement by multiple
regression, the results showed a significant effect on both return intention and word-of-
mouth endorsement. Weiss’s (2003) study also concluded that customer satisfaction with
restaurant attributes in influential in predicting customer’s return intention. Also,
Ranaweera and Prabhu (2003) study on customer satisfaction and trust confirmed that
both satisfaction and trust have strong positive association with customer retention and
positive word-of-mouth. As a result, the researcher believes higher customer satisfaction
will increase higher return intention and provide positive word-of-mouth endorsement to
the university dining facilities.
This result provide a good implications to the foodservice operators that they have to
meet or exceed their customer expectation in order to satisfied their customers, increase
their return intention, and increase word-of-mouth endorsement as well.
55
Recommendations
These findings suggest some important implications for university foodservice
operators. First, the university dining managers should recognize the student’s
characteristics such as age group and types of meal plan that have an impact on campus
dining. The foodservice managers should pay more attention to the age group of 17 to 25,
student meal plan holders, and no meal plan holders because they are less satisfied
compared with the age group 31 and above and faculty/staff meal plan holders. The
results of the study indicated that age group 31 and above and faculty/staff meal plan
holders have higher overall satisfaction. Thus, to improve in this area, the managers can
enhance their service quality by dealing with their customers in a more polite and friendly
manner, and try to meet their needs and exceed their expectations to increase their overall
satisfaction towards the university dining facilities.
Even though food quality, service quality, price and value, convenience, and
atmosphere showed a positive effect in determining customer satisfaction, university
foodservice operators should continue to maintain the cleanliness of the facilities, level of
comfort, the dining room environment, and train their employees well so they can deliver
a better service to the students, staff, faculty, and even the walk-in customers. The
foodservice operators should continue to improving all the dimensions in order to exceed
their expectation. Besides, a sanitation management program and foodservice guiding
principles are the best practices in order to provide and deliver high quality food.
Another important implication for foodservice operators is that they should carefully
design cafeteria interior and exterior to deliver a relaxed and comfortable dining
56
atmosphere to attract the new customers and retain the return customers. Not only is this
good for their business, but it strengthen the customer loyalty as well.
Campus operators and foodservice managers need to understand that overall
satisfaction levels based on the Institutional DINESERV Dimensions could be an
influencing factor to enhance the customer’s satisfaction level, their return intention, and
word-of-mouth endorsement. The foodservice operators and management team can
always use the customer survey to observe whether the Institutional DINESERV
Dimensions attributes meet the students, faculty, and staff’s satisfaction level. It is
enormously important to generate revenue through management efforts as this could lead
to an increase in customer’s return intention by enhancing the university dining’s
reputation. Moreover, the customers who are satisfied with their dining experience are
more likely to return to the facilities, and also provide positive word-of-mouth
endorsement. Therefore, the most important implication is to increase their customer’s
satisfaction, keep them happy and keep them returning to the university dining facilities.
Improving customer satisfaction, return intention, and word-of-mouth endorsement in the
university dining facilities not only can strengthen customer loyalty; it also can increase
the dining facility’s reputation, sales and revenue in the long run.
57
Limitations and Future Research
The present study has some limitations, and the recognition of these should help
refine future research efforts. First, the study is limited in that the one university studied
is not representative of all the universities across the country. Second, the survey
questionnaire was sent during finals week; the students may not have taken it seriously
when they filled out the survey, and some of them may not have had time to respond to
the survey questionnaire.
For the future research, more related attributes can be added into the Institutional
DINESERV Dimensions to make the survey more precise and more applicable to the
foodservice industry. Longitudinal studies should be recommended over time; other
variables such as expenditures data may be used to replace the current dependent
variables. Different customers have different perceptions and expectations towards food
quality, service quality, price and value, convenience, and atmosphere. Therefore,
implementation of this study to the restaurant industry might yield different results,
which might be beneficial to the industry.
58
REFERENCES
Almanza, B. A., Jaffe, W., & Lin, L. (1994). Use of the service attribute matrix to measure
consumer satisfaction. Hospitality Research Journal, 17 (2), 63-74.
Auty, S. (1992). Consumer choice and segmentation in the restaurant industry. The Service
Industries Journal, 12 (3), 324-339.
Bahn, K. D., & Granzin, K. L. (1985). Benefit segmentation in the restaurant industry.
Journal of the Academy of Marketing Science, 13 (3), 226-247.
Barsky, J. D. & Labagh, R. (1992). A strategy for customer satisfaction. Cornell Hotel and
Restaurant Administration Quarterly, 33 (5), 32-40.
Bojanic, D. C., & Shea, L. J. (1997). Segmentation for a multiunit restaurant operation.
Cornell Hotel and Restaurant Administration Quarterly, 38 (4), 56.
Bowen, J. T. (1998). Market segmentation in hospitality research: no longer a sequential
process. International Journal of Contemporary Hospitality Management, 10 (7),
289-296.
Crawford-Welch, S. (1991). Market segmentation in the hospitality industry. Hospitality
Research Journal, 295-308.
Davidow, M. (2003). Have you heard the word? The effect of word of mouth perceive
justice, satisfaction and repurchase intentions following complaint handling.
Journal of Consumer Satisfaction, Dissatisfaction and Complaining Behavior, 16,
67.
59
Dube, L., Renaghan, L. M., & Miller, J. M. (1994). Measuring customer satisfaction for
strategic management. Cornell Hotel and Restaurant Administration Quarterly, 35
(1), 39-48.
Gay, L. R. (1992). Educational research: Competencies for analysis and application (4th
Ed). New York: Macmillan Publishing Company.
Hair, J. F. (1998). Multivariate data analysis. Upper Saddle River, N.J.: Prentice Hall.
FoodService Director. (2003, February). James Pond, 16 (2).
FoodService Director. (2005, February). James Pond, 18 (3).
Fulkerson, J. A., & French, S. A. (2002). Foodservice staff perceptions of their influence
of student food choices. Journal of The American Dietetic Association, 102 (1), 97-
99.
Haley, R. (1995). Benefit segmentation: a decision-oriented research tool. Marketing
Management, 4 (1), 59-62.
Heung, C. S., Wong, M. Y. & Qu, H. (2000). Airport-restaurant service quality in Hong
Kong: An application of SERVQUAL. Cornell Hotel and Restaurant
Administration Quarterly, 41 (3), 86-96.
Johns, N., & Howard, A. (1998). Customer expectations versus perceptions of service
performance in the foodservice industry. International Journal of Service Industry
Management, 9 (3), 248-265.
Kara, A., Kaynak, E., & Kucukemiroglu, O. (1997). Marketing strategies for fast-food
restaurants: a customer view. British Food Journal, 99 (9), 318-324.
60
Kim, W. G., Han, J. S., & Lee, E. (2001). Effects of relationship marketing on repeat
purchase and word-of-mouth. Journal of Hospitality and Tourism Research, 25(3),
272-228.
Kim, W.G., Lee Y., & Yoo, Y. Predictor of relationship quality and relationship outcomes
in luxury restaurants. Journal of Hospitality and Tourism Research, In Press.
Kivela, J. J. (1997). Restaurant marketing: selection and segmentation in Hong Kong.
International Journal of Contemporary Hospitality Management, 9 (3), 116-123.
Kivela, J., Inbakaran, R., & Reece, J. (1999). Consumer research in the restaurant
environment, part 1: A conceptual model of dining satisfaction and return
patronage. International Journal of Contemporary Hospitality Management, 11
(5), 205-222.
Kivela, J., Inbakaran, R., & Reece, J. (1999). Consumer research in the restaurant
environment, part 2: Research design and analytical methods. International
Journal of Contemporary Hospitality Management, 11 (6), 269-286.
Kivela, J., Inbakaran, R., Reece, J. (2000). Consumer research in the restaurant
environment, part 3: Analysis, findings, and conclusions. International Journal of
Contemporary Hospitality Management, 12 (1), 13-30.
Klassen, J. K., Trybus, E., & Kumar, A. (2005). Planning food services for a campus
setting. Hospitality Management, In Press.
Koo, L. C., Tao, K.C., & Yeung, H. C. (1999). Preferential segmentation of restaurant
attributes through conjoint analysis. International Journal of Contemporary
Hospitality Management, 11 (5), 242-250.
61
Lee, S. S. (2004). College student’s perception and preference of brand name foodservice
in university dining operations. Unpublished masters thesis, Oklahoma State
University, Stillwater, Oklahoma, United States.
Lee, W., & Lambert, C. (2000). Impact of waiting time on evaluation of service quality
and customer satisfaction in foodservice operations. Foodservice Research
International, 12 (4), 241-154.
Lewis, R. (1981). Restaurant advertising: appeals and consumers’ intentions. Journal of
Advertising Research, 21 (5), 69.
Mattila, A. S. (2001). Emotional bonding and restaurant loyalty. Cornell Hotel and
Restaurant Administration Quarterly, 42 (6), 73.
Mooradian, T. & Olver, J. (1997). “I can’t get no satisfaction:” The impact of personality
and emotion on postpurchase processes. Psychology & Marketing, 14 (4), 379.
Meyer, M.K., & Conklin, M.T. (1998). Variables affecting high school students’
perceptions of school foodservice. Journal of The American Dietetic Association,
98 (12), 1424-1431.
Ness, M., Gorton, M., & Kuznesof, S. (2002). The student food shopper: segmentation on
the basis of attitudes to store features and shopping behavior. British Food Journal,
104 (7), 506.
Oh, H. (1999). Service quality, customer satisfaction, and customer value: A holistic
perspective. International Journal of Hospitality management, 18, 67-82.
Oh, H (2000). Diners’ perception of quality, value, and satisfaction: A practical viewpoint.
Cornell Hotel and Restaurant Administration Quarterly, 41 (3), 58-66.
62
Oh, H., & Jeong, M. (1996) Improving marketers’ predictive power of customer
satisfaction on expectation-based target market levels. Hospitality Research
Journal, 19 (4), 65-85.
Oliver, R. L. (1981). Measurement and evaluation of satisfaction processes in retail
settings. Journal of Retailing, 57 (3), 25-47.
Oliver, R. L., & Bearden, W. O. (1985). Disconfirmation processes and consumer
evaluation in product usage. Journal of Business Research, 13, 235-246.
On campus Hospitality. (2003). College market expansion. Westbury, NY: Author.
Parasuraman, A., Zeithaml, V. A., & Berry, L. L. (1988). SEVQUAL: A multiple-item
scale for measuring consumer perceptions of service quality. Journal of Retailing,
64 (1), 12-40.
Pettijohn, L. S., Pettijohn, C. E., & Luke, R. H. (1997). An evaluation of fast food
restaurant satisfaction: Determinants, competitive comparisons, and impact on
future patronage. Journal of Restaurant and Foodservice Marketing, 2 (3), 3-20.
Punj, G., & Steward, D.W. (1983). Cluster analysis in marketing research: review and
suggestions for application. Journal of Marketing Research, 20 (2), 134-148.
Romm, D. (1989). “Restauration” theater: giving direction to service. Cornell Hotel and
Restaurant Administration Quarterly, 29 (4), 30-39.
Ranaweera, C., & Prabhu, J. (2003). On the relative importance of customer satisfaction
and trust as determinants of customer retention and positive word of mouth.
Journal of Targeting, Measurement and Analysis for Marketing, 12 (1), 82.
Sheridan, M. (2003). Colleges / universities. Restaurants & Institutions, 113 (21), 51.
63
Qu, H. (1997). Determinant factors and choice intention for Chinese restaurant dining: A
multivariate approach. Journal of Restaurant and Foodservice Marketing, 2 (2),
35-49.
Shoemaker, S. (1998). A strategic approach to segmentation in university foodservice.
Journal of Restaurant and Foodservice Marketing, 3 (1).
Stevens, P., Knutson, B., & Patton, M. (1995) DINESERV: A tool for measuring service
quality in restaurants. Cornell Hotel and Restaurant Administration Quarterly, 36
(2), 56-60.
Struebing, L. (1996). Word-of-mouth recommendations promote service quality. Quality
Progress, 29 (10), 18.
Sulek, J. M., & Hensley, R. L. (2004). The relative importance of food, atmosphere, and
fairness of wait. Cornell Hotel and Restaurant Administration Quarterly, 45 (3),
235-247.
Susskind, A. (2002). I told you so: restaurant customers’ word-of-mouth communication
patterns. Cornell Hotel and Restaurant Administration Quarterly, 43 (2), 75-85.
Weiss, R. (2003). The relationship between restaurant attributes satisfaction and return
intent in U.S. theme restaurants. Unpublished masters thesis, University of Nevada,
Las Vegas, United States.
White, P. (1998). A perfect fit. School foodservice & Nutrition, 52 (11), 18.
Woo, K. S. (1998). Using quality perception to segment customers in services. Marketing
Intelligence & Planning, 16 (7), 418-424.
Yuksel, A., & Remmington, M. (1998). Customer satisfaction measurement. Cornell Hotel
and Restaurant Administration Quarterly, 39 (1), 60.
64
Yuksel, A., & Yuksel, F. (2002). Market segmentation based on tourists’ dining
preferences. Journal of Hospitality & Tourism Research, 26 (4), 315-331.
Yuksel, A., & Yuksel, F. (2002). Measurement of tourist satisfaction with restaurant
services: a segment-based approach. Journal of Vacation Marketing, 9 (1), 52-68.

65
APPENDIXES
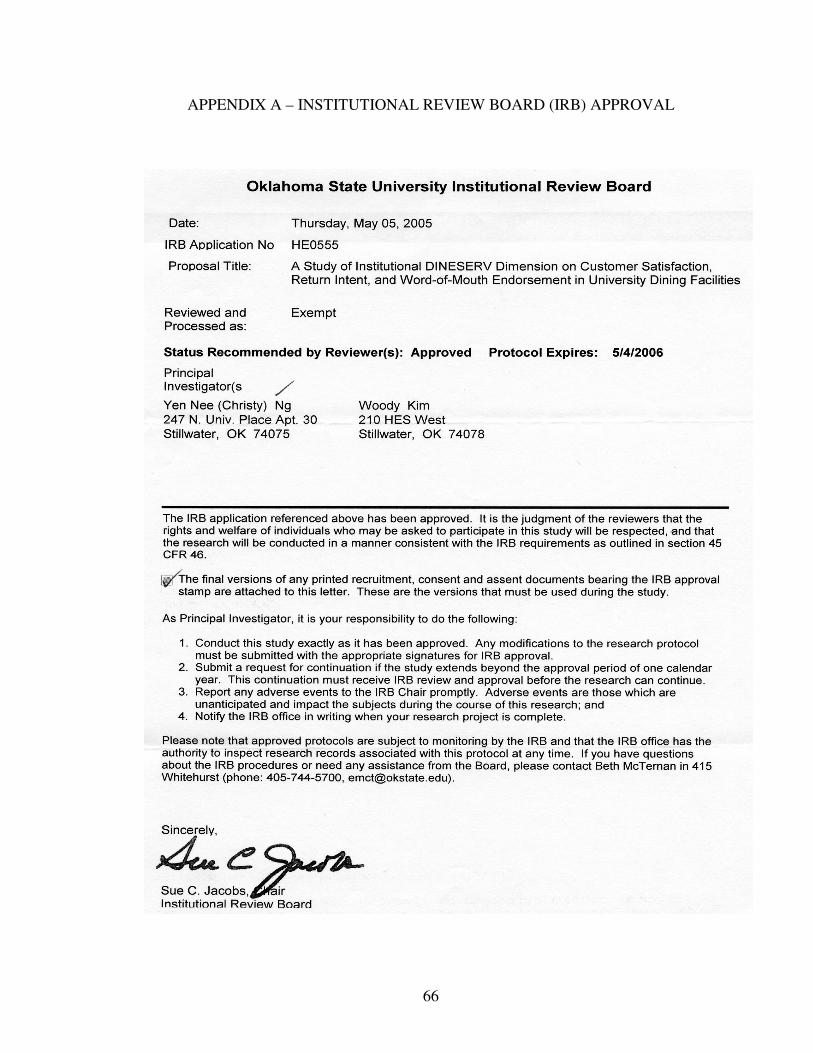
66
APPENDIX A – INSTITUTIONAL REVIEW BOARD (IRB) APPROVAL
67
APPENDIX B – COVER LETTER
Dear Participants,
May I take a few minutes of your time? I am Yen Nee (Christy) Ng, Master of
Science student in the College of Human Environmental Sciences at Oklahoma State
University, majoring in Hospitality Administration. This survey is designed to evaluate
the customer satisfaction and return intent in university dining facilities. This survey will
enable the researcher to make suggestions to improve dining services in Oklahoma State
University. Your voluntary participation in this survey is greatly appreciated. Your
opinions and comments will be a great value to me. The completion of this survey
implies consent to all conditions.
The data collected will be kept strictly confidential and anonymous. At no time
will your name be reported along with any of your responses. All the responses will be
aggregated, summarized, and analyzed for University Dining Services at Oklahoma State
University. If you have any questions regarding this research, please feel free to contact
me, Yen Nee (Christy) Ng, at 405-742-2603. For inquiry about rights as a research
participants, feel free to contact Dr. Carol Olson, Institutional Review Board Chair, 415
Whitehurst Hall, Oklahoma State University, Stillwater, Oklahoma 74078 at 405-744-
1976.
Thank you for your consideration.
Sincerely,
Yen Nee (Christy) Ng Woo Gon (Woody) Kim, Ph.D,Graduate Student Assistant ProfessorOklahoma State University Oklahoma State UniversityCollege of Human Environmental Sciences College of Human Environmental SciencesSchool of Hotel & Restaurant Administration School of Hotel & Restaurant AdministrationEmail: [email protected] Email: [email protected]: 405-742-2603 Phone: 405-744-8483
68
APPENDIX C – THE QUESTIONNAIRE
Oklahoma State University Dining Study
Section 1
Which one of these statements best applies to you?Please check one box only
Gender○ Male ○ Female
U.S Ethnic Group or Nationality○ Multiracial○ African American○ American Indian○ Asian American○ Latino/Chicano/Spanish origin○ White American○ Other
Designation○ Freshman○ Sophomore○ Junior○ Senior○ Graduate Student○ Non-Degree Student○ Faculty/Staff
Age○ 17 – 19 years old○ 20 – 22 years old○ 23 – 25 years old○ 26 – 30 years old○ 31 and above
What meal plan do you currently have?○ Student Meal Plan○ Faculty/Staff Meal Plan○ No meal plan, cash or Bursar charges
69
Please choose a facility in which you dined two or more times in the past week.
○ Blair Dining (all you care to eat including the Euro Kitchen, pizza, sandwiches, and grill)○ Blair Java Dave’s○ Blair Fast Break Convenience Store○ Blair Freshens○ Custom Catering○ Twenty Something Convenience Store in Kerr/Drummond○ Twenty Something Two Convenience Store in Student Union○ Pattillo’s in Kamm, Peterson/Friend○ The Library Java Dave’s○ Stout Coffee○ Student Union – Wok n Pho○ Student Union – Pistol Pizza○ Student Union – Grill○ Student Union – All Most Home○ Student Union – Chick-Fil-A ○ Student Union – Sushi Bar○ Sushi with Gusto○ Student Union – Catering○ Kerr/Drummond – Taco Mayo○ Kerr/Drummond – Pistol Pizza○ Kerr/Drummond – All you care to eat○ Kerr/Drummond – All Night Grill○ SPW Service Station (Lunch)○ SPW Service Station (Dinner)○ SPW Little Bakery○ The Market Buffet all you care to eat○ Squawkers at the Market○ Gourmet Galley at the Market○ The Hard Wok Grill and the Market○ Java Dave’s at the Market○ Aggie Bread in Griffith’s Community Center○ Laundry Mart○ Sidewinder at Vet Med○ Taylor’s○ West Side Café○ State Room○ Dairy Bar
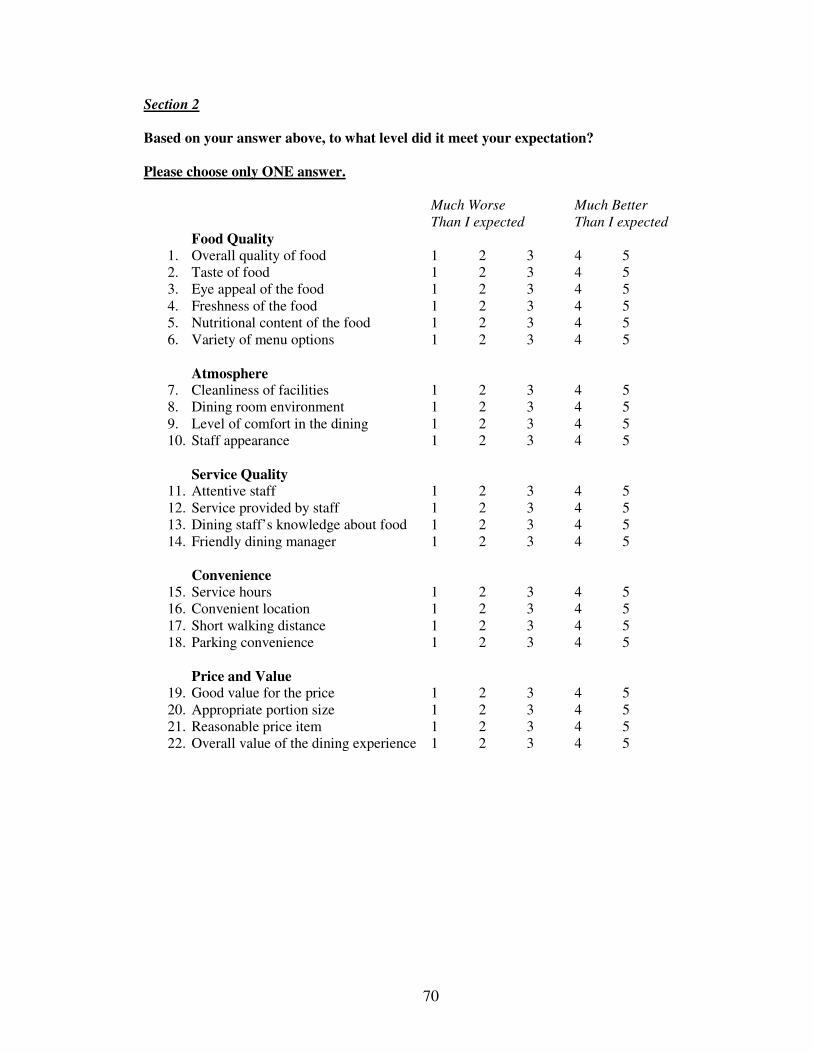
70
Section 2
Based on your answer above, to what level did it meet your expectation?
Please choose only ONE answer.
Much Worse Much BetterThan I expected Than I expected
Food Quality1. Overall quality of food 1 2 3 4 52. Taste of food 1 2 3 4 53. Eye appeal of the food 1 2 3 4 54. Freshness of the food 1 2 3 4 55. Nutritional content of the food 1 2 3 4 56. Variety of menu options 1 2 3 4 5
Atmosphere7. Cleanliness of facilities 1 2 3 4 58. Dining room environment 1 2 3 4 59. Level of comfort in the dining 1 2 3 4 510. Staff appearance 1 2 3 4 5
Service Quality11. Attentive staff 1 2 3 4 512. Service provided by staff 1 2 3 4 513. Dining staff’s knowledge about food 1 2 3 4 514. Friendly dining manager 1 2 3 4 5
Convenience15. Service hours 1 2 3 4 516. Convenient location 1 2 3 4 517. Short walking distance 1 2 3 4 518. Parking convenience 1 2 3 4 5
Price and Value19. Good value for the price 1 2 3 4 520. Appropriate portion size 1 2 3 4 521. Reasonable price item 1 2 3 4 522. Overall value of the dining experience 1 2 3 4 5
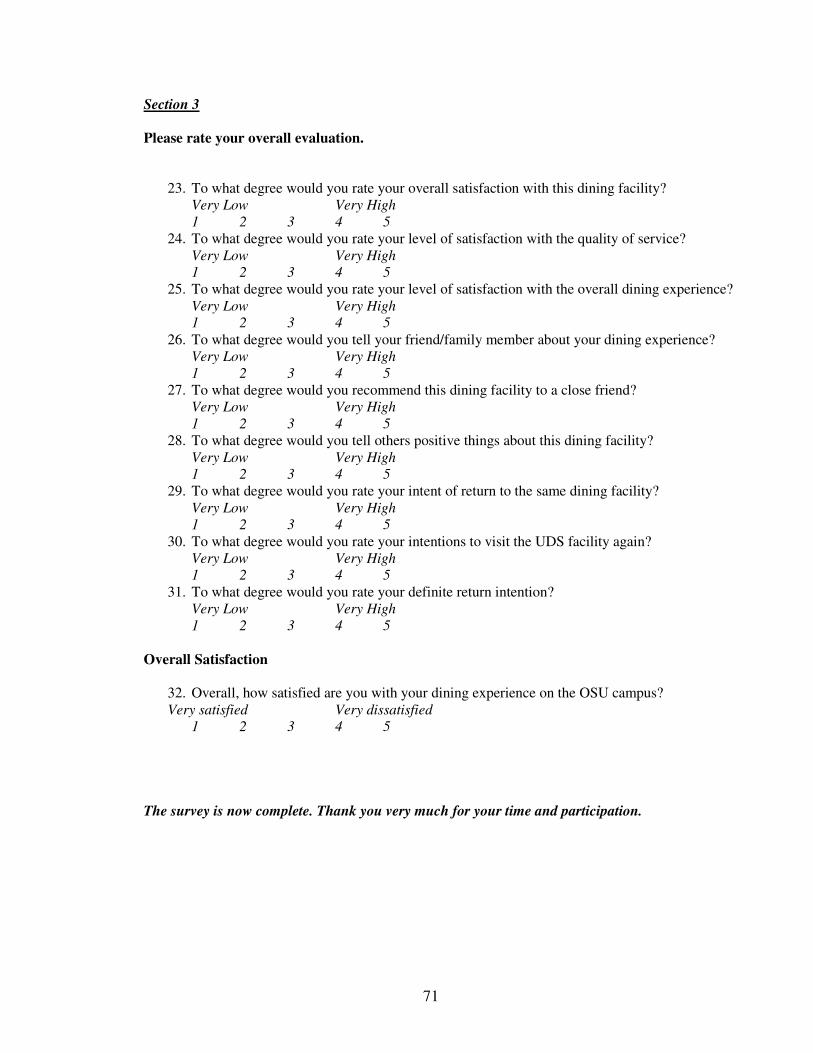
71
Section 3
Please rate your overall evaluation.
23. To what degree would you rate your overall satisfaction with this dining facility?Very Low Very High1 2 3 4 5
24. To what degree would you rate your level of satisfaction with the quality of service?Very Low Very High1 2 3 4 5
25. To what degree would you rate your level of satisfaction with the overall dining experience?Very Low Very High1 2 3 4 5
26. To what degree would you tell your friend/family member about your dining experience?Very Low Very High1 2 3 4 5
27. To what degree would you recommend this dining facility to a close friend?Very Low Very High1 2 3 4 5
28. To what degree would you tell others positive things about this dining facility?Very Low Very High1 2 3 4 5
29. To what degree would you rate your intent of return to the same dining facility?Very Low Very High1 2 3 4 5
30. To what degree would you rate your intentions to visit the UDS facility again?Very Low Very High1 2 3 4 5
31. To what degree would you rate your definite return intention?Very Low Very High1 2 3 4 5
Overall Satisfaction
32. Overall, how satisfied are you with your dining experience on the OSU campus?Very satisfied Very dissatisfied
1 2 3 4 5
The survey is now complete. Thank you very much for your time and participation.
VITA
Yen Nee Ng
Candidate for the Degree of
Master of Science
Thesis: A STUDY OF CUSTOMER SATISFACTION, RETURN INTENTION, AND WORD-OF-MOUTH ENDORSEMENT IN UNIVERSITY DINING FACILITIES
Major Field: Hospitality Administration
Biographical:
Education: Received Bachelor of Science in Marketing and Finance from Oklahoma State University, Stillwater, Oklahoma, May 2001. Completed requirements for Master of Science degree, Oklahoma State University, July 2005.
Experience: Employed by Oklahoma State University, Residential Life as dining graduate assistant from 2002 to 2005; employed by Ritz-Carlton Malaysia as liaison intern for summer 2004.
Memberships: OSU Chapter The National Honor Society of Kappa Omicron Nu


