
A Study of Factors That Influence Green Purchase
Authors: Sandra Larsson Muhammad Arif Khan
Supervisor: Zsuzsanna Vinzce
Student
Umeå School of Business and Economics
Spring semester 2011
Master thesis, two-year, 15 hp

ACKNOWLEDGEMENTS
We would like to thank several people who made this work possible for us with their
continuous support and encouragement. First of all we are grateful to our thesis supervisor
Associate Professor Zsuzsanna Vinzce, for her patience, advice and support during our entire
thesis work. She guided and motivated us during the whole process of our research. Secondly,
we would also like to thank all the respondents who participated in our survey and we believe
that without them this thesis couldn t be possible.
We want to thank Professor Kenny Brännberg from the statistics department and Dr. Mojgan
Pedyab for their assistance with our data analysis. We appreciate their time and valuable
discussion which we got for the statistical assistance regarding our data analysis. We are
thankful to our friends KhanZeb Khan and Rais Ahmed Ganai for their time and support.
Special thanks go to our families and friends for their continuous support. Finally, we want to
extend our thanks to Umeå School of Business and Economics (USBE) for building our solid
base of marketing knowledge especially in consumer behavior which helped us in conducting
this research.
Thank you!!
Sandra Isabel Larsson
Muhammad Arif Khan
Umeå, October, 2012

Dedications
I dedicate this thesis to my late father (Nasr Ullah Jan). His words of inspiration and encouragement in pursuit of excellence, still linger on.
Muhammad Arif Khan
Jag vill tillägna denna uppsats till min framlidna mormor (Ulla Britt Larsson).
För alltid saknad för sin generositet, sitt snälla och hjälpande sätt. Tack!
Sandra Larsson

ABSTRACT
Title: “A Study of Factors That Affect Green Purchase”
Due to the environmental issues, green products have got more attention during the latest
years and the availability of such products is increasing in many food stores. The appearance
of eco-label assists the consumers in the store to buy eco-friendly products which are less
harmful to the environment. Eco-labels which are frequently available in the food stores are;
The Nordic eco-label (Svanen), Krav, The Euro Flower, MSC label (Marine stewardship
council) and Bra Miljöval. Governments in some countries are supporting these labels to
ensure the sustainable development and a better quality of life for everyone, and for the
generations to come. A question, which arises here, is that what compels the consumers to
choose eco-labelled products over conventional ones. We have short-listed several factors
during literature review which can influence the consumers green purchase behavior and these
factors are; Eco-motivation, Eco-knowledge, Gender, Peer influence, Price and Shelf space.
The purpose of this study is to get a deeper understanding of the factors that can affect green
purchase of food products in the store. Thus our main research question that we want to
answer with our study is: “Which are the most important factors that influence the purchase
behavior of eco-labelled products?” Along with this main research question we are also
interested to know if ‘shelf space’ is an important factor that can affect the consumer’s choice
of eco-labelled products in the store. Due to lack of data there is still no clear understanding
about the role of shelf space in the purchase decision of green products. To answer these
questions we will investigate all these factors and try to understand their influence on
consumer green purchase behavior.
This quantitative study is carried out in Umeå, Sweden with 150 respondents and focuses
mainly on the food market consumers. We stand on objectivist position for this study and we
believe that cross-sectional research design is most suitable to fulfill our research purpose. We
developed several null hypotheses and for this purpose we distributed our research
questionnaire at the entrance of different super markets in Umeå, Sweden to collect our data
from the respondents. We applied convenience sampling with simple quota to this research.
We evaluated the gathered data with help of SPSS.
Results proved that eco-motivation and shelf space plays vital role (positive correlated) in the
purchase decision of eco-labelled products. We have provided statistical evidence that eco-
motivation and shelf space induce actual purchase of green products. Eco-knowledge shows
to induce interest in eco-labelled product but does not help in actual purchase of eco-labelled
products. Surprisingly price and gender has not shown any influence on the consumer green
purchase. We believe that our findings and recommendations can contribute in the area of
consumer’s ecological behavior research. Due to our sampling technique (convenience) and
small size of our respondent we cannot generalize the results of this study.
Key words: Purchase decision, Green marketing, Eco-labeling, Shelf space, Eco-motivation,
Eco-knowledge, Gender, Price, Peer influence.

Table of contents 1. Introduction .................................................................................................................................... 1
1.1 Problem background ........................................................................................................... 1
1.2 Research purpose and research questions ................................................................................. 3
1.3 Limitations ................................................................................................................................ 4
1.4 Definitions of key terms:........................................................................................................ 4
1.5 Disposition of the study: ........................................................................................................ 6
2. Literature review............................................................................................................................. 7
2.1 Green marketing ....................................................................................................................... 7
2.1.1 Green consumer behavior; consumer confusion ................................................................. 8
2.2 Eco-labeling; a part of green marketing ..................................................................................... 8
2.2.1 The background of eco-labeling .......................................................................................... 8
2.2.2 Eco-market ......................................................................................................................... 9
2.2.3 Can Eco-labeling be used as a Consumer Decision Tool? ..................................................... 9
2.3. Consumer purchase behavior ............................................................................................. 11
2.3.1 The consumers purchase process ..................................................................................... 11
2.3.2 The Green consumer purchasing model ............................................................................ 12
2.4 Consumer categories ........................................................................................................... 13
2.5 The Attitude-norm-behavior Relationship............................................................................ 14
2.5.1 The Fishbein Model .......................................................................................................... 15
2.6 Factors having influence on Consumers purchase Behavior ................................................. 16
2.6.1 Consumer Awareness and Knowledge .............................................................................. 17
2.6.2 Eco-motivation ................................................................................................................. 19
2.6.3 Price, Packaging, package resealability or Brand ............................................................... 19
2.6.4 Importance of Shelf-space ................................................................................................ 20
2.6.5 Demographic Factors influencing the consumer ............................................................... 21
2.7 Our Study Framework.......................................................................................................... 23
2.7.1. Suggested Research Testing Model and positioning of study............................................ 23
3. Research Methodology ................................................................................................................. 26
3.1 Research Philosophy or Perception of Knowledge ................................................................... 26
3.2 Research Approach and Strategy ............................................................................................. 27
3.3 Research Design ...................................................................................................................... 29
3.4 Data Collection Methods ......................................................................................................... 30

3.5 Social-Survey Questionnaire .................................................................................................... 31
3.6 Ethical Consideration .............................................................................................................. 32
3.7 Truth Criteria........................................................................................................................... 33
3.7.1 Reliability.......................................................................................................................... 33
3.7.2 Validity ............................................................................................................................. 33
3.7.3 Replication ....................................................................................................................... 34
3.8 Practical Methodology ......................................................................................................... 34
3.8.1. Research Sample ............................................................................................................. 34
3.8.2. Research Preconception .................................................................................................. 35
3.8.3. Designing and Pre-testing of the Questionnaire ............................................................... 35
3.8.4. Statistical Tests ................................................................................................................ 36
3.8.5. Questionnaire coding ...................................................................................................... 36
3.9. Measurement ..................................................................................................................... 37
3.10. Literature Selection .......................................................................................................... 38
4. Data Analysis and results discussion .............................................................................................. 39
4.1 Eco- motivation ................................................................................................................... 39
4.1.1 Eco- motivation Discussion ............................................................................................... 40
4.2 Gender ................................................................................................................................ 41
4.2.1 Gender Discussion ............................................................................................................ 42
4.3 Eco-Knowledge .................................................................................................................... 42
4.3.1 Eco-Knowledge Discussion ................................................................................................ 43
4.4 Peer Influence ..................................................................................................................... 44
4.4.1 Peer Influence Discussion ................................................................................................. 44
4.5 Price .................................................................................................................................... 45
4.5.1 Price Discussion ................................................................................................................ 46
4.6 Shelf Space .......................................................................................................................... 46
4.6.1 Shelf Space Discussion ...................................................................................................... 48
4.7 Relationship Measurement.................................................................................................. 48
4.7.1 Relationship between shelf-space and purchase of eco-labelled product .......................... 49
4.7.2 Relationship between eco-motivation and purchase of eco-labelled product .................... 50
4.7.3 Relationship between eco-knowledge and purchase of eco-labelled product.................... 50
4.8 Comparison of Findings with the Research Model ............................................................... 51
5. Conclusion of the Study................................................................................................................. 53
5.1 The Influencing Factors ........................................................................................................... 53

5.1.1 Our Research Contribution ............................................................................................... 54
5.1.2 Research Recommendations............................................................................................. 55
References ........................................................................................................................................ 56
Appendices
Appendix 1: Questionnaire in English
Appendix 2: Questionnaire in Swedish
Appendix 3: Eco-motivation and interest of eco-labelled products cross tabulation
Appendix 4: Shelf space and interest of eco-labelled products cross tabulation
Appendix 5: Peer influence and interest of eco-labelled products cross tabulation
Appendix 6: Eco-knowledge and interest of eco-labelled products cross tabulation
Appendix 7: Price influence and interest of eco-labelled products cross tabulation
Appendix 8: Gender and interest of eco-labelled products cross tabulation
List of figures Page
Figure 1: Green consumer purchasing model………………………………………………...13
Figure 2: Consumer Categories…………..………………………………………...…………14
Figure 3: The Causal Path Model…………………………………………………………….17
Figure 4: Phases, Stages and Determining Factors………………………………………...…18
Figure 5: Comparison of Eco-motivation …………...………………………………...……..39
Figure 6: Histogram on Shelf Space Effect………………………………………………….47
List of Tables
Table 1: European consumers spending on food and beverage……………………………….9
Table 2: Common contrasts between Quantitative and Qualitative research...…………........29
Table 3: Cross-Sectional Research Data Rectangle……………………………………….....30
Table 4: Research sample……………………………………………………………..……...34
Table 5: Coding of survey…………………………………………………….…….……36-37
Table 6: Measurement………………………………………………………..……..………..38

Table 7: Reliability statistics………………………………………………………..………..38
Table 8: Statistics on eco-motivation …………………………………………………….…39
Table 9: Chi-square test on eco-motivation ………………………………………………...40
Table 10: Chi-square test on gender ……………………………………………….….........41
Table 11: Statistics on peer influence………………..……………………………….……..42
Table 12: Chi-square test on peer influence ………………………………………………..43
Table 13: Chi-square test on Eco-knowledge 1..…………………………………………...44
Table 14: Chi-square test on Eco-knowledge 2……………………………….…………....44
Table 15: Chi-square test on price effect ………………………………………………...45
Table 16: Statistics on shelf space…………………………………………………….........47
Table 17: Chi-square test on shelf space …………………………………………………..47
Table 18: Correlation test on eco-label buying intention and shelf space effect…………..49
Table 19: Correlation test on Eco-label buying intention and eco-motivation…………….50
Table 20: Correlation on eco-label buying intention and eco-knowledge…………………51
List of models
Suggested Research Model……….……………………………………………….24 & 52

1
1. Introduction
Environmental friendly (Green) products have got more attention during the recent years and
the availability of these products is increasing in many food stores. One form of
environmental friendly products is eco-labelled products which have got more relevance for
the consumers in their buying decision and there are now more products to choose among
them. The first chapter of this thesis is going through the influencing factors that can have a
possible impact on the consumer’s ´green purchase behavior. The main purpose of this
research is to study the factors that influence the purchase behavior of eco-labelled products.
Secondly we are also looking for the possible impact of shelf space on the purchase behavior
of eco-labelled products. We start with introducing our problem background and the research
subject. Further on we define some important terms for the study. Finally, in this introductory
chapter we will go through the limitations with the study too.
1.1 Problem background
Environmental issues are becoming more important when it comes to climate change, scarcity
of water, natural resources and other ecological challenges. It is becoming obvious that
traditional corporate environmental management approaches based mostly on conformity and
smaller risk assessments will not be sufficient to successfully deal with the 21st century
sustainability challenges (United Nations, 2011). It is clear now that we humans do have an
impact on the environment. At the same time toxic gases are polluting the atmosphere and
dramatic changes can thereafter occur in the climate (World Wide foundation, 2011). The
released carbon dioxide gas in the atmosphere is more than what can be absorbed by the
ecosystems, oceans and geological systems. There are already some signs that the global
pollution is too much for the planet to handle in the form of a warmer climate that is causing
the glaciers to melt, sea levels to rise and at the same time droughts and flooding are
increasing. It could potentially affect life on the planet, while others may argue that this is just
some natural phenomena’s. When mentioning these sustainability challenges one important
tool for environmental protection is the concept of “sustainable development”. Sustainable
development is offering a “vision of progress that integrates immediate and longer-term
objectives, local and global actions”. This sustainable development also regards social,
economic and environmental issues as inseparable and interdependent components of human
progress (European community, 2011). To be more sustainable and to protect the environment
during production and consumption of products, governments in most developed countries
have implemented policies to reduce the environmental harm done by consumption (e.g.
Pantamera in Sweden). Such reduction in pollution has done by banning polluting ingredients
or by imposing taxes on unsustainable practices (Thøgersen & Ölander, 2006, p. 1758-1759).
Following the Rio Earth Summit in 1992, when the United Nations held their climate
conference; a global action program for sustainable development was introduced with the
name of ‘Agenda 21’. In this meeting ‘eco-labeling’ was identified as a way to encourage
consumers to do more sustainable consumption choices. Nowadays more eco-labelled
products are available when it comes to almost all kind of products in the stores, especially in
the food stores. Some of the available eco-labels in Sweden are: the Nordic eco-label
(Svanen), the EU flower (which is the common label in the European Union), KRAV

2
(promoting organic food), Bra Miljöval (Naturskyddsforeningen, 2012) and finally the MSC
label (Marine stewardship council) which is promoting sustainable fishery.
Presently, it is more obvious for companies what happens to products once they have been
produced (Senge, 2009, p. 2). Unsustainable patterns of production and consumption have
been identified and need further attention. One of the major reasons for these patterns is that it
is considered as a prime cause of environmental degradation, particularly in industrialized
nations (Erskine & Collins, 1997, p. 126). Industrial competitiveness and environmental goals
demand different kinds of trade-off for companies. Competitive advantage can be gained from
companies’ innovation and improvement capability to solve different constraints. Many
companies constantly try to reduce their costs as much as possible and unfortunately some
companies believe that environmental regulations can raise their costs without improving their
competitiveness (Porter & van der Linde, 1995, p. 97-98). Furthermore, some companies
believe that putting efforts into environmental friendliness will affect their competitiveness by
increasing their costs and these efforts will not deliver direct financial benefits to them
(Nidumolu, Prahalad & Rangaswami, 2009, p. 57). Porter & van der Linde (1995, p. 133)
believes that there exists another paradigm that has put environmental improvement and
competitiveness together, in which it is of importance to use different resources productively.
The precondition for environmental progress demands that companies innovate to raise
resources productivity. This increase will then be a comparative advantage for the innovative
companies.
The growing interest of consumers in environmental protection has compelled many
companies to be actively involved in making their products greener. This growing interest in
climate change during the past couple of decades led to increased demand for green labeling,
which allow the consumers to differentiate between more and less sustainable options (Horne,
2009, p. 175). It has also been shown that the interest in being green and the purchasing of
eco-friendly products continues to grow (Orange, 2010, p. 29). All the different selections
between products that consumers make on a daily basis have an impact on the environment.
In some cases, the consumers have to make trade-offs when it comes to choices between
green products and products that have other benefits which a customer prefers. This trade-off
may be among the environmental performance, quality of the service characteristics or price
of the product. In this case, a question arises regarding what a consumer prefers: an
environmental cleaner product that may have low performance or a better product with more
pollution (Windrum, Ciarli & Birchenhall, 2009, p. 552). It has also been found that some
consumers do not want to sacrifice product function for ethics and price often matters to them.
Consumers who shopped on truly ethical bases show far smaller purchase than what most
observers believe which is they are quite liberal at the time of the survey, but economic
conservative at check out points. There is a gap between what consumers say and what they
do in reality (Devinney, Auger & Eckhardt, 2011, p. 1- 2).
It is believed that different factors can affect the customers during the evaluation process of
eco-labelled products and therefore there are different reasons underlying the purchase
decision such as the price difference. Thøgersen suggests avoidance of too large a price gap
between eco-labelled and conventional products (Thøgersen, 2006, p. 1774-1776). When it
comes to knowledge about eco-labels, there exist some potential barriers for some consumers
because they face problems understanding the contents of different eco-labels in the store,
while others find the information’s hard to read (Leire & Thidell, 2004, p. 1068; D´Souza
Taghian & Lamb, 2006, p. 168-170). Some of the consumers distrust the eco-labels and their
credibility has also been questioned by several researchers (Erskine & Collins, 1997, p. 125;
Nilsson, Tuncer & Thidell, 2004, p. 517; Orange, 2010, p. 29; Horne, 2009, p. 176). Some

3
companies use the symbol of a leaf, flower or fish on their labels (though these are not eco-
labels) which has the potential to confuse the consumers (Naturskyddsföreningen, 2012).
Leire & Thidell (2004) and Thøgersen (2000) discuss the importance of eco-motivation
(which influences the purchase behavior of eco-labelled products) in their separate studies. It
has been investigated whether demographic factors can affect consumer behavior and the
potential influence of attitudes (Fransson & Gärling, 1999, p. 371). During purchase decisions
people may consider others opinions which may be their friends or family members
(Solomon, Bamossy, Askegaard & Hogg, 2006, p. 155-156). When companies are trying to
reach new consumers, shelf space is often a retailer’s critical resource to allocate. The
growing number of products has posed a challenge to many retailers and they need to know
how to efficiently allocate the shelf space available to the different products in the store
(Gajjar & Adil, 2011, p. 144). The importance of availability of eco-labelled products in the
retail sector is also one of the key factors to increase attention towards eco-labels and the
consumer’s ability to recognize and understand such products have not been tested due to lack
of data (Thøgersen, 2000, p. 305-307). Thøgersen (2000) has missed to measure the direct
relationship between availability and purchase of eco-labelled products and it is hard to ignore
the importance of shelf space in today’s competitive environment where brands are in
competition for scarce space in the stores. Would the consumer buy an eco-labelled product
depending on the size of shelf space available for these products in the stores? Due to lack of
data there is still no clear understanding about the role of shelf space in the purchase decision
of eco-labelled products. Hence, we take this as an opportunity to include shelf space in our
research and therefore we consider shelf space as an important factor to be evaluated for the
impact it has in the purchase decision of eco-labelled products.
Statistics show annual increase in the consumption of ecological products in Europe and this
yearly increase is being estimated at 10-15% (European commission, 2012). This trend shows
a good potential and motivates us to conduct the study in a Nordic country such as Sweden
(Umeå). Eco-labelling of food products is an important but still rather unexplored field in
literature. One of the few available academic studies in this area which has investigated
several factors at the same time was conducted by Thøgersen in 2000. A lot has happened in
this area since then. This infact means that some of the studied factors may have changed, for
example the global economy (which may affect the price sensitivity), values, norms, attitudes,
consumer behaviour, and technical development. This may give us totally different results
today. Furthermore, we found some factors which were not explored in the earlier Thøgersen
(2000) “Causal path model” (see figure 3). We believe the addition of these factors can
contribute in the development of this subject, these added factors are: Shelf space, peer
influence, price and demographics (gender). This study tries to investigate the influence of
above-mentioned factors on the purchase behavior of eco-labelled food products. To
understand the influence of these factors on the purchase behavior of eco-labelled products,
being authors, we are motivated to do an empirical study which targets the customers of
Umeå, Sweden. These factors have mostly been investigated separately by different
researchers; in contrast, here we study them together for their influence on the purchase
decision of eco-labelled food products. This study will give us an opportunity to understand
which factors have more influence in stimulating green purchase of food products.
1.2 Research purpose and research questions
The purpose of this study is to get a deeper understanding of the factors that can affect green
purchase of food products in the store. It is of importance to know what is having the greatest
impact on the consumers in choosing eco-labelled products and to know which factors force

4
consumers to buy or not to buy these eco-labelled products. The main research question that
we want to answer with our study is: “Which are the most important factors that influence the
purchase behavior of eco-labelled products?” Along with this main research question we are
also interested to know if shelf space is an important factor that can affect the consumer’s
choice of eco-labelled products in the store. Can shelf space influence the consumers purchase
decision of eco-labelled (food) products in the store? Previously shelf space was not directly
investigated for its influence on the purchase of eco-labelled products.
1.3 Limitations
We have restricted this study to food products where an eco-label can be applied. This
decision was done due to limited resources; it will be beneficial to extend this study to other
products too. The study was carried in Umeå, Sweden which can not represent the
characteristics of whole consumer food market. Our sample size is quite small as we have
planned to have 100-200 respondents, in comparison with the whole Umeå population
(approximately 120,000). Beside this, our method of data collection is convenience sampling
which cannot result in a representative sampling, so it is quite hard to generalize our results to
the whole food market. During data analysis we faced several problems which are concerned
about the responses about several questions. For some questions we have got more than 95%
responses for one option in the question, which limits our testing capacity. Finally, we have
limited this research to evaluate only six factors due to time constraints and we suggest to
include other factors too for example; age, education, income, lack of time, guilt for the
environment, habits, norms, values, packaging, and brand name.
1.4 Definitions of key terms:
Agenda 21: Agenda 21 is a comprehensive plan of action to be taken globally, nationally and
locally by organizations of the United Nations System, governments and major Groups in
every area in which human impacts on the environment. Agenda 21, the Rio Declaration on
Environment and Development, and the Statement of principles for the Sustainable
Management of Forests were adopted by more than 178 Governments at the United Nations
Conference on Environment and Development (UNCED) held in Rio de Janerio, Brazil, 3 to
14 June 1992 (United Nations, 2011).
Availability: the fact that something can be bought, used or reached, or whether or how much
it can (dictionary.cambridge.org)
Bra miljöval: Bra miljöval is Sweden’s biggest independent nature and environmental
organization. It is considered as one of the world’s toughest environmental label
(Naturskyddsforeningen, 2011).
Eco-labeling: Eco-labels can be a tool for assisting the consumers in their decision making
(Thøgersen, Haugaard & Olesen, 2010, p.1789). It can also be defined as a way to encourage
consumers to change their consumption patterns and to make wiser use of resources and
energy in the drive for sustainable development (Erskine & Collins, 1997, p. 125).
Green marketing: Environmental or “green” marketing has been seen as a tool towards
sustainable development and satisfaction of different stakeholders. Peattie (1995) cited in
Kärnä, Hansen & Juslin (2001) defines green marketing as “the holistic management process
responsible for identifying, anticipating and satisfying the requirements of customers and

5
society in a profitable and sustainable way”. The basic question for green marketing is: how
should environmental and social responsibility become integrated into traditional useful
business and marketing planning (Kärnä, Hansen & Juslin, 2001, p. 849). For business
worldwide ecological marketing and its practical applications have become a choice for
modern business performance (Grundey & Zaharia, 2008, p. 130).
ISO (International standards organization): ISO (International Organization for
Standardization) is the world's largest developer and publisher of International Standards. ISO
is a non-governmental organization that forms a bridge between the public and private
sectors. ISO enables a consensus to be reached on solutions that meet both the requirements
of business and the broader needs of society (www.iso.org). The ISO 14000 family is
addressing various aspects of environmental management. Some of the standards and
guidelines address specific environmental aspects such as: labeling, performance evaluation
and communication to mention some of them (ISO, 2012).
KRAV: KRAV is Sweden´s most famous eco-label for ecological food. It is also a key player
in the organic market in Sweden since 1985. They develop organic standards and promote the
KRAV-label. The KRAV label stands for: A sound, natural environment, solid care for
animals, good health and social responsibility (KRAV, 2011).
Organic food: The goal with organic food is to provide fresh and authentic processed food
designed to respect nature and its systems. The farmers and processor sector making organic
food must follow certain legal requirements if their products should carry the organic logos
and labeling. Important principles for the processing of organic products include the: strict
restriction of which additives and processing aids can be used, strict restriction of chemically
synthesized inputs, prohibition of the use of genetically modified organisms (European
commission, 2012).
Shelf space: The total amount of space available in a store to display goods for sale, or the
amount of space for particular goods: (dictionary.cambridge.org)
Sustainable development
Sustainability is defined by Peter Senge (2009) as: paying attention to very fundamental needs
such as food, water, and energy and the waste and toxicity they produce and the fact that the
world is becoming smaller (Senge, 2009, p. 4). Sustainable Development stands for meeting
the needs of present generations without jeopardizing the ability of futures generations to
meet their own needs in other words, a better quality of life for everyone, now and for
generations to come. It can also be said that sustainable development will not be brought
about by policies only, it must be taken up by society at large as a principle guiding the many
choices each citizen makes every day, as well as the big political and economic decisions.
This requires profound changes in thinking, in economic and social structures and in
consumption and production patterns (European commission, 2012).
The EU eco-label (euroleaf)
The European eco-label is a voluntary scheme established in 1992 to encourage business to
market products and services that is kinder to the environment (www.ec.europa.eu). The EU-

6
flower is the common label in the European Union. It stands for a sustainable society were
coming generations should have the same opportunities and chances as people have today
(Regeringen, 2011).
The marine stewardship council (certified sustainable seafood)
The marine stewardship council (MSC) is an independent, global and non-profit organization
who was started to raise the issue about overfishing (Naturskyddsforeningen, 2012). The
vision of this organization is to protect the life in the ocean and the seafood supply for this
and future generations to come (MSC, 2011).
The Nordic eco-label (Svanenmärkt)
In the year of 1989 the Nordic Eco-label became the official Eco-label for the Nordic
countries. The purpose was to provide consumers with a tool (the Nordic Eco-label logo) to
help them choose among the best, from an environmental standpoint, products on the
market. The criteria’s were developed by using a life-cycle perspective. That means that they
judge the environmental effects a product has from several aspects: energy and water usage,
kinds of chemicals used, recycling and reuse of waste products. If it is believed that by
providing Nordic Eco-label criteria for this group it can positively influence the production
processes for that product group. The Nordic Eco-label is a Type 1 eco-label (Svanen, 2011).
1.5 Disposition of the study:
The research is divided into the following sections:
Theory
The earlier research in the field is discussed and evaluated. The main topics in the theory are:
Eco-labeling, Shelf space, Fishbein Model and other influencing factors that might have an
influence on the consumers regarding the purchase of eco-labelled products. In the end of this
chapter we introduc our research model which we have developed from the literature review
in this chapter. In this chapter we also introduced our null hypotheses.
Methodology
In this chapter of the thesis we present the choice of research methodology, research
philosophy, research strategy, research design, data collection methods, ethical consideration
and practical methodology.
Data Analysis and Results Discussion
In this chapter, we present an analysis of the study results. Here we also compared our study
results with our theory. In the end of this chapter, we compare our model with the study
findings.
Conclusion of the Study
In the last chapter the main findings in the research is discussed and evaluated. We have
included recommendations too for further research.

7
2. Literature review
In this part of the thesis, previous research in green marketing area is shortly presented and
discussed. In this case, we are focusing on eco-labeling of products from the consumer’s
perspective to be able to get a deeper understanding of the influence of different factors on
the consumers purchase behavior of eco-labelled products. To get more knowledge about the
factors which can affect the consumers while purchasing products in the store, we find it
important to go through consumer behavioral theory. Important factors might be for example:
Shelf space, the consumer s knowledge/awareness, Eco- motivation (trust and belief), peer
influence, price and demographics (gender). All these influencing factors can possibly affect
the final product choice when evaluating and choosing a product in the store.
2.1 Green marketing
In the late 1980’s the idea of green marketing emerged (Peattie & Crane, 2005, p. 358).
During the 1990’s marketing research indicated that many consumers were concerned about
the environment. Many firms responded to this concern by adjusting their promotional
campaigns (Peattie & Crane, 2005, p. 360-361). There is now a growing interest in green
marketing and sustainable incentives via greening strategies and ecological labeling practices,
especially in Europe. Green marketing incorporates a broad range of activities including
product modification, changes of the production process, packaging changes as well as
modifying advertisement. Defining green marketing is not a simple task. A majority of people
believe that green marketing refers exclusively to the promotion or advertising the products
with environmental characteristics. Many terms that are often associated with green marketing
are recyclable, Ozone friendly and environmental friendly. Green marketing can also be seen
in a broader manner and can be applied to consumer goods, industrial goods and even services
(Grundey & Zaharia, 2008, p. 130). Green marketing is most frequently associated with the
greening of the different aspects of traditional marketing. This generally involves the
production of "green" products for sale to green consumers who are interested in recycling the
waste from their consumption.
Growing concerns for the environment at all levels in the society have led to a considerable
increase in number of products marked as environmentally friendly (Jansson, Marell &
Nordlund, 2010, p. 358). Green competition is shifting from a race to launch eco-friendly
products to a competition over what actually constitutes a green product. If the companies’ do
not engage in this debate and fail in shaping the rules, the risk increases that they will not
meet the sustainability standards (Unruh & Ettenson, 2010, p. 113). But it can be
barriers/facilitators for being able to participate and engage in this process. Technological
changes can also affect the possibility of recycling materials. New designs of products would
allow for easier disassembly and recycling of parts which has already entered the market. For
international business, green marketing has become competitive prerogative for modern
business performance (Grundey & Zaharia, 2008, p.137, 130). Kilbourne (1998) criticizes the
impact of green marketing as he believes that this behavior can be significantly short of what
would be considered as truly green marketing since they are often managerial strategies to
boost their sales and then becomes only secondarily green (Kilbourne, 1998, p. 642).
Research in green consumer behavior suggests that when it comes to the environmental
8
communications strategies to reach consumers, they should aim at overcoming cognitive
barriers that prevent the intending consumers from the actual purchase of green products. It is
recommended that green marketing communications should be factually based and
customized to the different requirements of the consumers (Tadajewski & Wagner-
Tsukamoto, 2006, p. 19).
2.1.1 Green consumer behavior; consumer confusion
According to a study, green consumer behavior consists of three dominant themes related to
uncertainty in the adoption of environmentally friendly behaviors. These themes are:
Consumer confusion, trust/credibility and compatibility (Carrete, Castano, Felix, Centeno,
Gonzalez, 2012, p. 470). Some people believe that green products may not only be confusing
but also deceptive (Ibid, p. 476). Some of the factors which drive the consumers to become
green are combination of: how they perceive the personal benefits, decreased risk and
uncertainty, control over costs and a change in deeply embedded cultural values and practices.
The study shows a low consumer trust in environmentally friendly products and that they are
not getting interest to know if the environmental claims are true or not (Ibid, p. 476). Different
factors that affect green consumer behavior are divided as internal, external and situational
factors. The external factors are: education, media, family or culture. Sometimes respondents
believe that companies and media misinform consumers and that they are not honest about the
implications of eco-friendly products (Ibid, p. 477). As mentioned above by Tadajewski &
Wagner-Tsukamoto (2006), it is important to use factual-based informations when
communicating with consumers. The internal factors are: knowledge, attitude, awareness or
involvement and the situational factors are: economic rewards and legislation (Carrete,
Castano, Felix, Centeno, Gonzalez, 2012, p. 471). The lack of specificity in many
environmental claims has resulted in consumers forming negative view of green
advertisement. This situation makes it less likely leads to the purchase of environmental
friendly products (Rahbar & Wahid, 2011, p. 80).
2.2 Eco-labeling; a part of green marketing
2.2.1 The background of eco-labeling
Eco-labeling is one of the measures proposed to achieve the sustainability goals in Agenda 21,
because it is thought as having the potential to increase the consumers´ awareness about the
environment. It also has the potential to affect different sectors in the industry and to produce
environmental friendly products (Erskine & Collins, 1997, p. 126). The embracing of eco-
labels can be seen as an opportunity to increase sales through product differentiation,
increased accountability or it can give an increased choice for the consumer in a store
environment that is becoming greener (Horne, 2009, p. 180). When it comes to classification
and categorization of eco-labelled Products, environmental labels can be classified and
categorized in many ways. There are for example two points of differentiation; this is based
on whether the scheme is mandatory or voluntary. Another way to differentiate these products
is to check if the certification is done independently or not. Mandatory environmental labeling
is prescribed by law. The international standards organization (ISO) use three categories for
voluntary labeling: type I, type II and type III labels. Type I labels are third-party certified

9
environmental labels schemes that provide the use of a logo associated with certified
products. This type of label is mostly referred to as an eco-label in the literature. Type II
labels are based on the self-declarations of manufacturers, importers, distributors or retailers
and finally, type III labels provide environmental data in a quantitative life cycle in a more
extensive report format (Horne, 2009, p. 176).
Four themes which indicate the strength of eco-labels:
Coverage (range of environmental issues covered, carrying capacity, range of label products
covered of relevant issues). The inclusion of stakeholder needs (participative democracy).
Uptake, independence and acceptance (evidence of influence of the label and participative
democracy). Measured environmental/sustainable consumption outcomes: (demonstrating
conservation of natural capital and intergenerational equity (Horne, 2009 p. 176). Below is the
consumption data of eco-labelled products of several European countries which shows the
difference in spending among these countries.
2.2.2 Eco-market
Together with North America, Europe is containing 96% of the global eco-market. The
greatest eco-consumption in Europe is in countries like: Denmark, Switzerland, Austria,
Luxemburg, Liechtenstein, Sweden and Germany (KRAV, 2012, p. 38). The entire sale of
ecological products of grocery and nonalcoholic beverages was 4 % in Sweden in the year of
2011. Fish falls in the products group where the sale of ecological products is the greatest. It
estimates at 8, 7% of the total sales (SCB, 2012). Here, we are going to present some statistics
of top ten European countries which spends on ecological food and beverages
European Consumers spending on ecological food
and beverage
Country Euro/capita
1. Denmark
2. Switzerland
3. Austria
4. Sweden
5. Germany
6. Italy
7. France
8. Great Britain
9. Spain
10. Portugal
1. 143.33
2. 138.22
3. 111.95
4. 76.92
5. 70.13
6. 49.42
7. 41.31
8. 39.43
9. 8.41
10. 7.62
Table 1. European Consumers spending on ecological food and beverage (Euro/Capita)
(KRAV, 2012, p. 8).
We will continue to discuss the potential of eco-labeling to understand if it can be used as a
consumer decision tool by highlighting different perceptions about eco-labeling
2.2.3 Can Eco-labeling be used as a Consumer Decision Tool?
From a consumer perspective an eco-label can be seen as a tool for supporting decision
making regarding environmentally essential products. A consumer may use an eco-labelling

10
as a decision making tool but they may still reject an eco-labelled product after going through
the different advantages and disadvantages with the product (Thøgersen, Haugaard & Olesen,
2010, p. 1801). Providing informations about the environmental outcomes offered by different
eco-labels have been shown to affect the consumers’ product preference (Grankvist,
Dahlstrand & Biel, 2004, p. 224). Eco-labeling has been seen as attractive and a good
example of optimistic environmental activity in contrast to the negative environmental
messages which was dominant during the late 1980’s and 1990’s. Eco-labeling alone cannot
be expected to change consumer’s behavior and to reduce environmental degradation. To be
effective, it needs to be used in conjunction with other voluntary measures and environmental
legislation as prescribed by both Agenda 21 and the European Commission´s 5th
Environmental Action Plan “5th
EAP” (Erskine & Collins, 1997, p. 131-132).
According to Thøgersen (2000), environmental labels are only useful from an environmental
policy perspective if they are noticed by the consumer in the shopping situation. Furthermore,
eco-labels have to be understood, trusted and valued as a tool for decision-making
(Thøgersen, 2000, p. 285). Several problems have been found associated with using the eco-
labels. One of them might be that Nordic consumers are more exposed to increased product
related environmental informations (Leire & Thidell, 2004, p. 1061). Consumers can be
attracted to simple eco-labels because they can make the decision process more clearly, but at
the same time simplicity has also been shown to weaken the effectiveness of environmental
claims. Furthermore, it has been found that there exist qualitative differences among some
eco-labels which can affect their effectiveness: the need of criteria consistency and the
difficulty of making direct functional comparisons between products which can also become a
barrier when it comes to simplicity aims. It is believed that the use of eco-labels alone is not
considered enough to protect the environment (Horne, 2009, p. 180). There is little evidence
that eco-labeling is benefiting the environment. Earlier studies have shown that consumers
distrust environmental claims made by manufacturers and retailers and they are confused by
the wide range of claims in the market place (Erskine & Collins, 1997, p. 125). Another
question arises about the relative strength of labels when it comes to classification and their
contribution to sustainable consumption (Horne, 2009, p. 176). These statements can also be
connected back to what was earlier mentioned by Kilbourne (1998) when he criticized the
concept of green marketing as a way to boost sales (Kilbourne, 1998, p. 642).
There is also some criticism when it comes to eco-labeling schemes. In practice, there have
been difficulties in making the schemes into workable and effective means of improving the
environment. According to Erskine and Colllins (1997), it is still not possible to say whether
eco-labeling is capable of contributing positively to sustainability which is similar to views
expressed by Horne (Horne, 2009, p. 176). If the EC eco-labelled scheme would have been
changed it would have gained the potential to be informative, thus raising the customer’s
awareness and the perception of environmental issues in relation to products. This would have
been seen as a first step in improving the environment (Erskine & Collins, 1997, p. 131-132).
This statement can be argued further when different eco-labels on quality assurance schemes
are increasing more and more in the market. This can certainly affect their credibility which
can be questioned when they become too many. It has been found that the majority of them
are not providing a credible assurance scheme. It has been suggested that it could be
appropriate to involve more stakeholders and to expand the responsibility of processors and
retailers (Nilsson, Tuncer & Thidell, 2004, p. 517). Consumer’s confusion and distrust over
manufacturer’s environmental claims has created a demand for third-party labeling schemes
(Horne, 2009, p. 175, Erskine & Collins, 1997, p. 125). Third party involvement or the use of
independent auditors is a common way to improve trustworthiness and objectivity. In this
case, care by the control systems is less transparent and audit reports are not often public

11
which could have been seen as a possibility to affect the consumers trust in eco-labelled
products. Contradicted to this, it is believed that the consumer seems to accept and trust the
presence of the control systems (Nilsson, Tuncer & Thidell, 2004, p. 522).
The above mentioned critics against eco-labeling are further strengthened by Orange (2010)
when she argues that: Eco-friendly green products are increasing in the marketplace but the
question is if this trend is actually benefiting the environment or not (Orange, 2010, p. 29).
Another author, states a similar thought: It is clear that eco-labels can affect consumer choice
although it is less clear whether this leads to reduced environmental impacts (Horne, 2009, p.
180). More than 98% of supposed, natural or environmentally friendly products in the U.S
supermarkets shelves are making potentially false or misleading claims. In reality, companies
that claim that they are environmental friendly may be doing very little that is beneficial for
the environment. Changes in the society are increasing and many companies will feel the
pressure from the social tides like “social responsibility” and “environmental friendliness”, in
this case transparency and authenticity is crucial. It can also be argued that by successfully
integrating eco-design principles into products and services companies will be able to gain a
competitive advantage (Orange, 2010, p. 30-32). After discussing the present problems with
eco-labeling as mentioned earlier, some consumers accept and trust the presence of the
available control systems (Nilsson, Tuncer & Thidell, 2004, p. 522). When it comes to how
the consumers are adopting to eco-labelled products. It has been found that early adopters of a
new eco-label mostly use a high effort adoption process. Research results have shown that
how quickly a consumer completes the adoption process depends on his/her motivation, past
experience with using eco-labels and also the reputation of the organization. A direct effect of
past experience indicates that experienced eco-label users go through a low-effort process,
going directly from awareness of the label to trial of a product. One reason for this may be
that experience reduces the perceived risk for a consumer (Thøgersen, Haugaard & Olesen,
2010, p. 1787-1801).
2.3. Consumer purchase behavior
Consumers make buying decisions on a daily basis and these decisions are the focal point of
the marketers’ efforts. Learning about the consumers buying behavior is not as simple and it
is deeply embedded inside the consumers mind. Consumers themselves do not always know
what precisely influence their purchases. For the companies to know how consumers respond
to marketing stimuli a “stimulus-response-model” has been developed to understand buyer’s
behavior. The companies marketing and other type of stimuli enters the consumers ‘black
box’ where they are turned into observable responses. Marketing stimuli can be: price,
product, place, promotion or forces and events like: economic, technological, political and
cultural. These inputs enter the ‘black box’ and are turned into buyer responses. The buyers
characteristics influence how they react to the stimuli and the decision process affects their
behavior (Kotler, 2011, p. 136-137).
2.3.1 The consumers purchase process
The buyers purchase process consists of the following five stages: Need recognition: The
buying process first start with the need recognition when the consumer realize a problem or a

12
need, this need can be triggered by external or internal stimuli (Kotler, 2011 p. 152).
Information search: An interested consumer may search for information about a product to
fulfill the need. The amount of information search depends on the strength of the drive. The
information can come from family, friends or marketing channels. Evaluation of
alternatives: How the consumer evaluates the purchase alternatives depends on the individual
consumer and the specific buying situation. It can be careful considerations or little
evaluation. Sometimes, a consumer makes his own decision or may involve others. Purchase
decision: In the evaluation stage the consumer ranks brands and form purchase intentions.
Two factors can come between the purchase intention and the purchase decision. The first
factor is the attitude of other people and the second one is unexpected situational factors; like
an economic downturn. Post-purchase behavior: After purchasing the product the consumer
may be satisfied or dissatisfied and will engage in post purchase behavior. This can include
buying the product again and talking to others positively about it (Kotler, 2011, p. 152-154).
After discussing the purchase process we will now briefly go through the green consumer
purchasing model.
2.3.2 The Green consumer purchasing model
The green consumer purchasing model summarizes the purchase process of green consumer
technology products. The model consists of five elements: General Green values and
knowledge, Green criteria for purchase, Barriers and facilitators, Product purchase and
feedback (Young, Hwang, McDonald & Oates, 2010, p. 28).
1. General Green values and knowledge: The consumers green values are affecting the
motivation to pursue the green criteria. It is influenced by the consumer’s knowledge about
relevant issues and earlier purchases experience (Young et. al, 2010, p. 28). 2. Green criteria
for purchase: When the consumer decides to investigate the product, primary and secondary
green criteria are formed from research to ethics of a product or manufacturer. This involves
talking to a family, friends or searching other informations. Regardless of the consumers
values the most common criterion for the consumers is; environmental performance of the
product. 3. Barriers and facilitators: During the purchase process consumers are affected by
different barriers and facilitators. If one barrier is to strong this may affect the consumers
green criteria. Examples of facilitators are: green labels on the products, availability and if the
consumer feels sense of guilt. The mentioned barriers could be: lack of time, price of the
product and lack of information. 4 & 5: Product purchase & Feedback: The purchase
experience and knowledge gained from each purchase process are fed back (feedback) into
the consumer’s values and knowledge which influences the consumers next purchase (Young
et. al, p. 28).

13
Figure 1: Green consumer purchasing model, (Young, Hwang, McDonald & Oates, 2010, p.
28).
Comparison of green versus non-green purchase process: when comparing the two types of
purchase processes it exist some differences and similarities. Some differences exist when it
comes to the need recognition stage; it is believed that some kind of need recognition is
necessary in all types of basic purchase processes. At first to get or have the right
knowledge/information is affecting the first stages in both models. There exist different
barriers and facilitators in the purchase process when comparing them with each other which
can affect the purchase decision such as economic factors. It is also true that in both processes
people are getting feedback from other people such as friends and families when making their
purchase choices. The last stage feedback/post purchase behavior is important for future
purchases in both purchase processes and has an impact on future purchases and other
potential consumers. In both processes, the decision depends on the individual consumer in
the form of internal factors such as values.
2.4 Consumer categories
To illustrate different consumer categories D´Souza (2004) has developed a two dimensional
model (See figure 2). The cognitive perspective in the model represents environmental label
information on the product, like symbols, codes, signs that are used to identify environmental
friendly products. The model classifies consumers into four different categories: emerging
green consumers, conventional consumers, environmentally green consumers and the price
sensitive green consumers. On the right side is the emerging green consumers and the
conventional consumers; they give emphasis to the inherent brands on the market. The
emerging green consumers can see the benefits with green products but they don´t have the
motivation to purchase them. The conventional consumer is not considering the
environmental-friendly products. On the other side are the consumers who are
environmentally concerned. They think broader and do not consider the risks with these
products; instead they consider the wider consequences of environmental products. The
environmentally green consumers buy green products anytime they get the opportunity to do
so. Finally, the price sensitive consumers are aware of the environmental labels, they are also
aware of the risks with the products and they are price sensitive. They might not pay more for
environmentally friendly products (D´Souza, 2004, p. 184).

14
“Consumer categories”
Perceived product benefits
Environmentally green consumers Emerging green consumers
Price sensitive green consumers’ Conventional consumers
Cognitive perspectives Product risks Non-cognitive perspectives
Figure 2. “Consumer categories”, source: (D´Souza, 2004, p. 184).
To understand how the consumer can get affected and motivated by different factors when
they purchase eco-labelled products, it is necessary to have some knowledge about consumer
attitudes. The consumer´s attitude and behavior can be important factors to measure when it
comes to understand what can influence the different product choices that are made.
2.5 The Attitude-norm-behavior Relationship
This study focuses on the consumer purchase behavior of eco-labelled products and how
different factors can influence this behavior and one the factors which influences the purchase
is attitude. Attitude describes the consumer’s ongoing evaluations, feelings and tendencies
towards an object or idea. People are categorized in to a frame of mind of likes or dislikes and
it is hard to change it (Kotler, 2011, p. 149). This makes attitude an important factor to
consider when it comes to eco-labelled products. It is believed in Thøgersen´s model that a
pro-environmental attitude can affect the purchase of an eco-labelled product (Thøgersen,
2000, p. 291-292). In a research done by Thøgersen & Ölander (2006) environmental friendly
buying behavior has been studied. Many product choices that a consumer makes can harm the
environment during the production and consumption process of products. It was stated that
consumers are affected by their personal norms in buying environmental friendly food
products compared to buying the conventional food products (Thøgersen & Ölander, 2006, p.
1762). It has also been found a high correlation between attitude and personal norms. This
indicates that consumers buying organic food are probably dominated by a moral attitude
(Thøgersen & Ölander, 2006, p. 1770). Another research in the green car industry indicates
similar results. It has been found that values, beliefs, norms and habits strengths the
willingness to cut back and also willingness for eco-innovation adoption. It has also been
found that personal norms have a positive influence on the willingness for green behaviors
and habit strength has a negative influence. Personal capabilities can therefore affect the
adoption of green products and eco-innovation (Jansson, Marell & Nordlund, 2010, p. 358-
360). The importance of values is further argued as one of the key factors that are helping the
green consumer’s purchase of technical products, but the conditions for this is that consumers
green value was strong (Young et. al, 2010, p. 29). The importance of norms and values is
further argued in a European research of organic food consumption comparing eight European
countries (Italy, Finland, Denmark, Sweden, Spain, UK, Germany and Greece). In this
research, the differences in antecedents of purchase intention of organic products that were

15
using cultural dimensions as moderators were studied. Differences were found between the
people´s antecedents of purchase intention of organic products which was related to the
countries cultural values. The main factor causing differences among people were subjective
norms. Furthermore, it was found that the consumers from Denmark and Sweden were more
conscious about what was socially acceptable. There is a clear association between cultural
dimensions and the relevance of social norms in society while purchasing organic products
(Maya, Lopez-Lopez & Munuera, 2011, p. 1773-1774). As values, norms and habits are very
personal it can be difficult to measure them directly as a quantitative study. Some of these
mentioned factors are included and measured in eco-motivation. When discussing customer
attitudes, a well-known model called the Fishbein model which will be briefly described
below. We are using this model to be able to clearly understand which underlying factors can
affect the consumer during the buying process.
2.5.1 The Fishbein Model
The model measures three components of attitude: Salient beliefs: the beliefs people have
about an attitude object which can be explained as those beliefs about the object that are
considered during evaluation (Solomon, Bamossy, Askegaard & Hogg, 2006, p. 153). The
second one is object-attribute linkages: it can be explained as the probability that a particular
object has an important attribute (Solomon et. al, p. 153). The last component is the
evaluation of each of the important attributes. By combining all these three elements the
consumer´s overall attitude towards an object can be counted (Solomon et. al, p. 153). A
version of the Fishbein model also exists which is called the “Theory of reasoned action”.
Intentions vs. behavior: this theory aims to measure behavioral intentions, recognizing that
certain uncontrollable factors inhibit the prediction of actual behavior (Solomon et. al, 2006,
p.155-156). The first factor is being a social pressure.
Social pressure: this theory also recognizes the power of other people in influencing behavior.
When a consumer is making the final product choice, he or she can thereby become affected
by others opinion about that choice (Solomon et. al, p. 155-156). This is similar to
Thøgersen´s opinion which means that among the factors influencing the consumers to buy
eco-labelled products can be: peer influence and other social and normative factors which
may play different roles in the diffusion process (Thøgersen, Haugaard & Olesen, 2010, p.
1787-1801). Confirming to this earlier statements about peer influence when it comes to
choose a green product, it has been found that when buying a new item in the store people
discuss with their friends and family in choosing the green criteria for that specific purchase
(Young, Hwang, McDonald & Oates, 2010, p. 28). The same fact is stated by Kotler (2011),
where he claims that consumer behavior is influenced by social factors like different small
groups and the family. In this case the family members can strongly affect the consumers
purchase behavior (Kotler, 2011, p. 139-143). Another study surprisingly indicated the
opposite result when it came to organic food the majority of consumers in Greece do not
consider others opinion while choosing a product (Chryssohoidis & Krystallis, 2005, p. 590).
One of the reasons for this difference in findings can be connected to the earlier mentioned
studies where cultural differences can affect social norms and the people´s intention to
purchase organic products (Maya, Lopez-Lopez & Munuera, 2011, p. 1773-1774).
The second influencing factor is attitude: The attitude towards buying: this model also
measures the attitude towards the act of buying rather than only measuring the attitude
towards the product itself. It focuses on the perceived consequences of a purchase Problems
of predicting behavior: Problems can also arise if the Fishbein model is misapplied; some

16
outcomes are for example, beyond the consumer control. At the same time knowledge of a
person´s attitude is not always a good predictor of behavior (Solomon et. al, p. 155-156). As
peer influence has been mentioned by several researches both in general and green consumer
behaviors. It can be seen as one of the relevant factor to be in focus instead of other
mentioned attitude factors in the Fishbein model. A study on organic food has found
tendencies of no impact of peer influence. It can be investigated further when it comes to the
purchase behavior of eco-labelled food products, therefore, we include peer influence in our
study to investigate whether it can influence the purchase of eco-labelled products or not.
2.6 Factors having influence on Consumers purchase Behavior
Several factors have been found that are affecting the attention and purchase of eco-labelled
products. These factors can be found in Thøgersen´s (2000) “Causal path model”. For a
person to be able to consciously buy an eco-labelled product he/she must have to: Form a
personal goal of protecting the environment (A pro-environmental attitude). The influence of
attitude is previously mentioned in the Fishbein model. Believing in a cautious buying is a
strategy to achieve this goal. Have knowledge about the eco-labels: that they are available,
how they look and also what they mean. Besides these factors the consumer also has to trust
the labels and the information provided is true (Thøgersen, 2000, p. 291-292). This factor has
also been pointed out in another research that it is important that information given is true,
when the customer uses it as a sole reason of choice (Leire & Thidell, 2004, p. 1068). In the
figure PCE stands for (perceived consumer effectiveness). PCE, a pro-environmental attitude,
a belief in environmentally friendly buying and trust, can all of them be thought of as
motivating factors which means that they are determining how hard a consumer will look for
eco-labels in the buying situation. Finally, in the buying situation the consumer has to pay
attention to the labels and decide to buy an eco-labelled product (Thøgersen, 2000, p. 291-
292). As pointed out in the “Causal path model” consumer purchases are influenced by for
example; cultural, social, personal and psychological characteristics. Many factors on
different levels affect the consumers buying behavior from cultural and social to motivation,
beliefs and attitudes that exist within the consumers (Kotler, 2011, p. 137). Thøgersen´s
model is the foundation for this literature review and therefore several factors from this model
will be used as factors to have influence on consumers purchase behavior of eco-labelled food
products. Now, we continue to present some of the earlier theories about several identified
factors in figure 3, to make the influence of these factors clearer for the readers.

17
(Figure 3: “Causal path model”; predicting paying attention to eco-labels and the purchase of
eco-labelled products”, (Thøgersen, 2000, p. 291-292).
2.6.1 Consumer Awareness and Knowledge
To have relevant knowledge of environmental issues is one of the first important stages when
making a green purchasing decision (Young, Hwang, McDonald & Oates, 2010, p. 28-29). Starting the adoption process of eco-friendly products depends on the individual’s subjective
knowledge, for example sustainable fishery and general knowledge about eco-labels
(Thøgersen, Haugaard & Olesen, 2010, p. 1798-1796). The ecological label is an important
way of communicating environmental justifications on products to the consumer since many
consumers always read the labels and they consider the information to be accurate, but
although some find it hard to read and understand (D´Souza, Taghian & Lamb, 2006, p. 168,
170). The importance of knowledge is further argued as green consumers get green labels
specialist informations and guilt work as a potential facilitator of green criteria in their
purchases. Another, important factor to consider as a possible barrier for green consumers has
been the lack of informations on the environmental and social performance of products and
manufacturers (Young et. al, 2010, p. 26-28). Although some consumers are more willing to
buy ecological products even if the quality is less and they would then look for the
environmental information on the product (D´Souza, Taghian & Lamb, 2006, p. 162). Nordic
consumers have knowledge about many eco-labels and the consumers perceive them as rather
trustworthy, some of them also have a tendency to overemphasize their purchases of eco-
labelled products (Leire & Thidell, 2004, p. 1061-1068). Another study shows that
consumer’s awareness about eco-labelled fruits and organic products was very high 86% but
awareness about the label meaning was limited (Dahm, Samonte & Shows, 2009, p. 196).
Furthermore, it has also been stated that the current problem does not seem to be the
insufficient environmental information, instead the consumers seem to consider the eco-
labelled products but they decide not to buy it. For some product groups the consumer
knowledge of environmental attributes and knowledge of the relevance of labeling criteria has
been very weak (Leire & Thidell, 2004, p. 1068). This means that there can also be some
smaller deficiencies in the consumer’s knowledge about these products. Informed product
choices are a prerequisite for consumers being able to make greener decisions. Some

18
consumers have also problems when it comes to confidence on the eco-labels. When
considering product related environmental information the dynamic context and the purchase
decision should also be considered in the evaluation of making a green decision. How the
product related environment information works in the marketplace is dependent on different
factors in the purchasing moment. Consumers who regularly purchase organic food show
loyalty to the label and therefore repeat their purchasing. Even if they have less information
they still have faith in the label (Nilsson, Tuncer & Thidell, 2004, p. 523).
In another consumer study, the information that was available about the environmental
outcomes on the eco-labels did not seem to affect the product preference. Consumers who
valued environmental consequences higher in their purchase criteria were more affected by
eco-labels than the consumers who were less interested in environmental consequences
(Grankvist, Dahlstrand & Biel, 2004, p. 224). It is also believed that if the labeling schemes
can more adequately document that there exist environmental improvements with the products
it can possibly further motivate the consumers (Leire & Thidell, 2004, p. 1068). One problem
in accomplishing this is that the eco-label initiatives cover various stages in the production
chain but some sections of them are not covered for example; transportation and packaging
which are features that some customers consider as important. There is no labeling system
that covers the entire food supply chain, the current schemes set criteria for selected actors in
the chain and ignore several of the other actors or aspects that can be of importance for the
overall objective that the consumer prioritize. It is also believed that the eco-label is giving a
neutral impression (Nilsson, Tuncer & Thidell, 2004, p. 524-525). Contradicted to this,
another study has investigated different factors that may affect consumer behavior when it
comes to environmental concern. These are for example; knowledge, personal responsibility
and perceived threats to personal health. Other influencing factors are attitude, norms and
values, awareness and habits (Fransson & Gärling, 1999, p. 369). Below figure shows
different factors that can possibly lead to the establishment of a new environmental friendly
habit. Some researchers’ claims that knowledge/awareness and information is important in
making a green purchase decision. Here we use the term knowledge instead of mentioning
several terms. The influence of habits is also relevant but hasto be done during the
observation of consumers in the store, therefore knowledge is considered as a more urgent
topic as it is important in the first stage of making a purchase decision.
Figure 4. “Phases, stages and determining factors of the process leading to the establishment
of a new (environmental friendly habit)”, Source: (Fransson & Gärling, 1999, p. 376).
Observable behavior
• Old habit
• new habit
Mental/process state
• Environmental awareness, attending present behavior.
• Considering alternatives, readiness for new behavior.
• Testing, evaluating
new behavior.
Determining factors
• General attitudes, norms and values.
• Specific beliefs and attitudes.

19
2.6.2 Eco-motivation
According to Kotler (2011) a need becomes a motive when it has come to an adequate level of
intensity. A motive or drive is a need that is affecting the person to seek fulfillment (Kotler,
2011, p. 146-147). To have the motivation for buying or searching for eco-labelled products is
important as mentioned by several authors such as (Leire & Thidell, 2004, p. 1068), and also
pointed out by Thøgersen (2000), in the “Causal path model” where motivation is one of the
important elements in the model. As earlier defined in the Thøgersen model motivation
consists of a pro-environmental attitude, PCE: (perceived consumer effectiveness), trust and a
belief in environmental friendly buying (Thøgersen, 2000, p. 291-292). The consumer’s
adoption process of eco-labelled products may depend on several factors such as motivation
and ability (Thøgersen, Haugaard & Olesen, 2010, p. 1787-1801). The motivational
antecedents explain from 44-73% of the variation in paying attention to eco-labels
(Thøgersen, 2000, p. 303). Motivation is also mentioned as one of the influencing but not a
main factor in the research about green consumer purchasing behavior (Young et. al, 2010, p.
28). The consumers motivation level is further explained and connected to the increasing
distance between the consumer and producers that can be a reason for the lack of trust but at
the same time: the farmer is no longer aware of the needs and wants of the consumer. There
is a need of farm freshly produced items that is bought and consumed nearby; one example of
this is the farmers market that is spreading through Europe (Nilsson, Tuncer & Thidell, 2004,
p. 523). The current knowledge gap in Nordic research highlight the need for more insight
into the determinants for consumer acceptance of the information such as trust and motivation
(Leire & Thidell, 2004, p. 1068) According to Devinney, Auger & Eckhardt, (2011, p. 2) the
respondents in a study believed that good practices involve labor, environment and
intellectual property and which is important for the society but at the same time some do not
consider them relevant to them personally. Further they added that cost matters for ordinary
people under ordinary circumstances. Eco-motivation may be an important factor to consider
especially as there are trust/credibility issues from the consumers side when it comes to green
marketing, eco-labelled products and its potential impact on the environment.
2.6.3 Price, Packaging, package resealability or Brand
Green packaging of products is becoming more common. Earlier research in consumer studies
done by Rokka and Uusitaloo (2008) indicated that consumers differ in their preferences
when it comes to: product packaging, brand, price and the package resealability (convenience
of the use) of daily products. It has also been found that larger customer segments are
favoring more environmental friendly products. The result from this research indicated that
the biggest consumer segment favored the environmental labeled packaging as important
criteria in their choice of products. The existing models in the environmental area have been
relying a lot on attitude models and therefore it has been suggested that the focus turns more
to the actual product choices. These research findings indicated the increased importance of
the ethical and environmental dimension when it comes to product choices. The following
four attributes were used in the study: brand, price, packaging and package reseal ability
(convenience of use). Pricing of eco-labelled products was shown to be one of the factors that
mostly could influence the consumer’s potential interest in these products. The average level
importance of Environmental packaging was a strongly preferred product attribute when
consumers chose among functional drink products that was 34% while the relative importance
of price was 35%, for resealability (convenience of use) 17% and for the brand 15% (Rokka
& Uusitaloo, 2008, p. 516-519). In another research about consumer habits and ethics it was

20
discussed if there is a possibility that the consumer is a cause-driven liberal when surveyed
but an economic conservative at the actual purchase time (Devinney, Auger, & Eckhardt,
2011, p. 1). This can be compared to a similar result where there existed a values-action gap
between how the consumers are concerned about environmental issues but at the same time
they were having problem to transform this concern into actual purchases (Young, Hwang,
McDonald & Oates, 2010, p. 20). From the companies point of view it has been recognized
that not all firms had tried to use environmental issues to earn more profit but short profit has
remained an objective for many firms. When it was clear that greening could create cost
savings many marketers became enthusiastic about the environment. The cost/benefits could
then be connected to more energy and material input efficiencies, packaging reductions and
logistic rationalization which provided strong incentives to develop environmental programs.
Although these products became cheaper to produce, it didn’t affect the customers in form of
cheaper and greener products. One reason for this may be that it relates to pricing strategies
that is trying to establish green products as premium products serving niche markets. The
expensive image of these products is also seen as one of the reason why green products have
had difficulties penetrating the market (Peattie & Crane, 2005, p. 362). This expensive image
of green products can be a potential disadvantage because there are other studies that indicate
that price is an important factor when it comes to green products. The perceived costs of
organic foods can have an effect on consumers. In this case one of the most important factors
is to avoid a large price gap between environment friendly and conventional products
(Thøgersen & Ölander, 2006, p. 1774-1776). The results of the study found that the less
expensive consumers perceive organic food the more willing they will be to buy it (Ibid, p.
1762). The same fact was appearing in another study about organic food it was found that
preference, taste and price again was seen as important factors in the buying decision (Dahm,
Samonte & Shows, 2009, p. 195). When it comes to the green purchasing process price often
reduced the influence of the interviewees` green values in the decision making process
(Young, Hwang, McDonald & Oates, 2010, p. 25). This possible effect of price on the green
values of the consumer might be an important factor to consider. The price factor has been
found to have influence as one of the consumer’s main issue. It was an obstacle for 12.5% of
the respondents when they are going to buy organic food (Chryssohoidis & Krystallis, 2005,
p. 591). This is indicating that price has an impact when it comes to consumer evaluation of
green products even if some consumers not always believe so when they are surveyed. The
importance of price was the strongest of the four above mentioned factors and also one of the
important main factors in the marketing stimuli of consumers. Therefore the focus in this
section was on the price factor and its influence on green purchase instead of focusing on all
four of them.
2.6.4 Importance of Shelf-space
In recent years, the competition for shelf space has intensified as more products compete for a
retail space in the stores (Martinez de Albéniz & Roels, 2001, p. 32). Shelf space can broadly
be classified into three categories: Commercial, experimental and optimization models (Chen,
Chen & Tung, 2006, p. 1505). One of the mentioned factors in influencing consumers in the
Thøgersen model was availability; in this thesis we have chosen to focus on shelf space
instead of availability (a broader and complex area) as we want to narrow down our study.
Shelf space has got attention in 1960s and 1970s and a number of experiments were
conducted to measure the effect of shelf space on sale, for example Brown and Tucker 1961,
Cox 1970, Curhan 1972 (cited in; Nierop & Franses, 2006, p. 1066). Allocation of scarce
shelf space is one of the major decisions that a retailer has to face in allocating a shelf space to

21
stock of various products. Such decisions are important determinants for sales and marketing
effectiveness of individual stock-keeping units (SKUs). In the end, shelf space allocation is an
important factor in generating profit as it bears some costs to the retailers as well (Nierop &
Franses, 2006. pp. 1065-1066). Furthermore, the decision of how to best allocate and manage
shelf space is critical to grocery retail profitability (Reyes & Frazier, 2005, p. 183). It has also
been found that the availability of eco-labelled products and that the consumer recognition
and understanding influences the attention towards eco-labels (Thøgersen, 2000, p. 305). In
the situation when consumers choose to use product related environmental information which
can be influenced by factors such as: the availability of eco-labelled products, time and
money, external stimuli, and motivation and understanding the relevance of different product
choices (Leire & Thidell, 2004, p.1068). Availability has also been studied by Chryssohoidis
& Krystallis (2005), it has then been found that one of the factors that can hinder a consumer
from buying organic food can be the limited availability in the store (Chryssohoidis &
Krystallis, 2005, p. 589-591; Dahm, 2009, p. 196). The availability of green products for
example; in mainstream retails have been found as one of the potential facilitators of the
consumers green criteria for the purchases (Young, Hwang, McDonald & Oates, 2010, p. 27-
28). In this article we haven´t found any data if there is any influence of shelf space on the
consumers green criteria for purchases. Earlier marketing studies have shown that in-store
environmental stimuli such as shelf space allocation and product display has a great influence
on consumer buying behavior and can create a considerable demand (Chen, Chen & Tung,
2006, p. 1503).
Shelf space has also some importance when it comes to impulse buying. Fruits and vegetables
are product categories that react more to shelf space. It can be said that there is a relationship
between space elasticity and impulse buying (Desmet & Renaudin, 1998, p. 453). In an earlier
study healthy and unhealthy foods have been compared and the impact of shelf space has been
investigated. It has been found that a direct relationship exists between the space occupied by
store brands and the market share. There is also an indirect relationship between the space and
the price differential gap, the number of national brands and the range of choice. In store
brands and shelf space had also an impact on different variables related to profitability,
market share and assortment (Suáres, 2005, p. 858). Another study on food products have
indicated the similar result that when stores make healthy items available, their accessibility
and prominence, as measured by the length of shelf space selected to them, can have a large
impact on sales (Farley, Rice, Bodor, Cohen, Bluthenthal, & Rose, 2009, p. 673). The over-
merchandising of the stores owned brands by retailers can damage the overall profitability of
the category. The outcome of this could be that they might lose sales if they do not assign the
necessary space to national brands which can also help to enhance store image (Suáres, 2005,
p. 873). In several researches shelf space has shown to increase the sale of healthier food
products but at the same time we have not found any research which measure direct
relationship between shelf space and eco-labelled food products. Therefore, we believe that it
will be valuable to include shelf space in this study as an influencing factor which may affect
the purchase behavior of eco-labelled products. After introducing and discussing shelf space
and its impact on the consumers purchase behavior we will go through some demographic
factors that may have relevance for consumer behavior.
2.6.5 Demographic Factors influencing the consumer
A research of Australian green consumers shows that their demographic profile was
connected to their attitude and towards green labels. The results indicate that all the
demographic variables upto some extent were associated with the eco-labels. The

22
demographic factors included in this study were: age, gender, income and employment
(D´Souza, Taghian, Lamb & Peretiatko, 2007, p. 373-375).
Age: It was found that label satisfaction/dissatisfaction level was higher for older and middle
age respondents compared to the younger respondents. The respondents who had the highest
dissatisfaction with labels were between: 50-60+ years had 53.8%, while the younger
respondents 18-29 years had only 3.8% dissatisfaction (D´Souza, Taghian, Lamb &
Peretiatko, 2007, p. 373-375).
Gender: There has been found a small correlation between demographic variables and
adoption indicators such as age and gender. It has been shown that gender has some kind of
affection on the adoption of eco-labels. In this case, women are more often being likely than
men to have noticed the new eco-labels and to know what it means (Thøgersen, Haugaard &
Olesen, 2010, p. 1798-1796). Another study indicates the opposite result and revealed that
there was no difference when it came to gender compared to understandability, past
experience, accuracy of labels, and satisfaction with the labels and the quality of green
products compared to other products (D´Souza, Taghian, Lamb & Peretiatko, 2007, p. 373)
Therefore, the possible impact of gender on the choice of eco-labelled products is ambiguous
and needs to be further investigated.
Income: When it comes to income influence on the purchase decision of eco-labelled
products there is a difference in attitude between low and high income groups. Employment: It
was found that full time working respondents were less likely to need instructions on
recycling to appear on product labels. It was also found a difference between students and
other employment categories regarding the satisfaction with the product labels and if they
were relying on past experience as a guide to make green product choices (D´Souza, Taghian,
Lamb & Peretiatko, 2007, p. 374). Another study, where they measured different factors that
could affect consumer behavior towords environmental concern, the correlations with
different background factors such as income and education were shown to be weak (Fransson
& Gärling, 1999, p. 369). This result was quite similar to another study comparing consumer
ethics and demographics such as differences influenced by gender, education, income, culture,
domicile and so on proved similarly unfounded (Devinney, Auger & Eckhardt, 2011, p. 2).
Another study by Straughan & Roberts (1999) has investigated the influence of several
demographic factors on ecologically conscious consumer behavior (ECCB) such as age,
income, education and place of residence to mention some of them. The results indicated that
the demographic variables age, gender and classification were significantly correlated with
ECCB when it was considered individually. The results from this study showed the age and
income factor as mentioned earlier by D´Souza, Taghian, Lamb & Peretiatko, (2007) might
have some influence on the green consumers but the influence of the income factor seem to be
ambiguous. It has also been found that environmental concern does not play an essential role
in ECCB. It is more important that the consumers believe in the effectiveness of individuals to
contest environmental destruction than to show concern for the environment (Straughan &
Roberts, 1999, p. 565-570). Another similar statement confirms almost the same opinion
where personal interest also plays an important role: In some cases the consumer don´t pay
attention to the eco-labels unless he or she is valuing to be protective to the environment. The
consumer then considers buying eco-labelled products as a way to achieve this goal. In this
case it is also important that environmental conscious consumers believe that the information
on the label is thought as useful for this purpose (Thøgersen, 2000, p. 305). Demographic
factors have been under consideration in this section and there are some similarities and
differences on some of these factors. Gender difference has been pointed out as one of the

23
possible factors. This was not confirmed by other researches. The income factor may be a
sensitive matter for some respondents and it can be difficult to focus on as one of the main
factors, there can be prestige and status issues when it comes to income and employment
questions asked to respondents. When it comes to the age, middle aged compared to younger
consumers has larger differences in satisfaction. Satisfaction can be difficult to measure as it
means different things for different people. For these reasons we are not including age and
income in our research as interesting factors. Therefore we select only gender as a
demographic factor that is considered to be investigating further to clear out if it influences
the purchase of eco-labelled products.
2.7 Our Study Framework
Green marketing of products is offering a competitive advantage in the form of giving an
alternative of products that can be less harmful to the environment. Many consumers are in
favor of green products but at the same time there is a risk that the companies can take
advantage of the consumer´s green interest and use it as a marketing tool instead of being
green for real. Some of this criticism about the marketing of eco-labelled products is critical
for exploitatation of eco-labelled products. It has been questioned whether the companies are
really eco-friendly or if they are using it as a way to gain more sales. From Thøgersen´s
(2000) “Causal path model”, several factors have been found that can affect the consumers
when they are purchasing eco-labelled products. These factors are: Motivation, knowledge,
availability and attitude. Several other important variables have also been found from other
studies that can affect the buying intention of these products such as: Peer influence, price and
demographics (gender). Shelf space has also been found as one of several important factors to
get consumer attention in the store and which have not been studied in connection to eco-
labelled products. A link has been established between shelf space and profitability when it
comes to influencing sales in the store. In this way, shelf space can be used as a tool to
increase revenue. In literature several similarities and differences have been found which
influence the consumer’s behavior towords eco-labels. Another factor that seems to have
some relevance in literature is how the price can affect the customer’s choice between eco-
labelled and conventional products. The different demographic factors can also have some
relevance; these factors can be e.g. gender, age, income, work, place of residence, which can
also have some importance during the buying process. The impact of some of these
demographic factors is still ambiguous as different researches have different findings for these
factors. It has been found some obstacles for the customers these are for example; that some
consumers have less knowledge about the eco-labels and find them hard to understand. The
customers have sometimes felt the lack of credibility and little trustworthiness when it comes
to eco-labels. This might be a problem because trustworthiness is an important factor for some
customers when they buy eco-labelled products. It is important that the labels are understood,
trusted and considered as a tool for making the purchase decision. Earlier research has
suggests to enough information on the label for the consumers. One important factor might be
that the customer has some kind of interest in protecting the nature and believes that the eco-
labelled products can be used as a means for this.
2.7.1. Suggested Research Testing Model and positioning of study
We have derived a model from a “Causal path model (see figure 3)”; predicting paying
attention to eco-labels and the purchase of eco-labelled products”, (Thøgersen, 2000, p. 291-
292). The aim of this model is to deeply understand the factors which may influence the

24
purchase behavior of eco-labeled products. We have also taken one component from the
Fishbein model in the development of this model which is ‘Peer influence’. We have broadly
divided this model into two visible parts internal and external factors. The Internal factors
are: Gender, Eco-motivation and Eco-knowledge. The reason for choosing them as internal
factors is, because they are the factors existing within or near the consumers which the
company cannot directly affect. The External factors are: Price, Shelf space, and Peer
influence. The reason for choosing these as external factors is that we believe that external
factors are mainly marketing tools by which companies communicate with consumers. The
internal factors are mainly taken from the consumer behavior field which is concerned about
for example; eco-motivation (trust, belief, attitude etc.). We believe that the marketing tools
and the consumer behavior factor overlap each other and the combined study of them will
give us a complete picture of what is important to consumers and it will help us to answer our
research questions. We shortlisted these six factors on the basis of theories studied in this
chapter, we believe that these factors are important to investigate as earlier researchers have
put greater emphasis on them.
Model: Suggested Research Model. Adopted from Thøgersen 2000, Causal path model
We are conducting this study from the company perspective and are interested to understand
the influence of above marketing tools on consumer purchase behavior of eco-labelled
products. From the existing literature available in this field we have developed several
hypotheses to answer our research questions (mentioned in chapter 1). In the first phase we
will test six hypotheses and if we find significance relationship between any of these factors
and interest to buy eco-labelled products then in the second phase we will develop further
hypotheses to uncover the association between these factors and the actual green purchase
decision. For this purpose we will do a customer survey to collect relevant data to test our
hypotheses with the help of statistical tools for example; SPSS. This data analysis will enable
us to accept or reject our null hypotheses which will enable us to answer our researcher
questions on the basis of concrete findings. Below are our phase 1 hypotheses:

25
Hypothesis for Phase 1 Tests:
H01: There is no association between Eco-Motivation and interest to buy eco-labelled
products in the store
H02: There is no association between Gender and interest to buy eco-labelled products in the
store
H03: There is no association between Eco-knowledge and interest to buy eco-labelled
products in the store
H04: There is no association between Peer influence and interest to buy eco-labelled
products in the store
H05: There is no association between Price and interest to buy eco-labelled products in the
store
H06: There is no association between Shelf Space and interest to buy eco-labelled products in
the store

26
3. Research Methodology
In previous chapters we discussed the background of our study its purpose and the research
question. We also reviewed the related literature about our topic which motivates us to carry
this study. In this chapter, we discuss in detail the research methods we applied in this
research for example; our research philosophy, research strategy, research design and
specific data collection methods, quality criteria as well as ethical issues are also discussed
to strengthen our logical position.
3.1 Research Philosophy or Perception of Knowledge
Research philosophy is related to the construction of knowledge and the nature of this
knowledge in relation to research. In literature, philosophy is defined as the ways to approach
and understand the world by researchers. Discussing these assumptions is a crucial point
because they decide the stance taken by the researcher while conducting research (Saunders,
Lewis & Thornhill, 2009, p 107; Creswell, 2007, p. 16-19). Research philosophy investigates
three features of research: ontology, epistemology and methodology. Peltomäki and Nummela
consider ontology as a researcher ‘assumption of phenomena’ (Peltomäki & Nummela, 2004,
p. 163). Ontological consideration concerns the question; what is reality? This means whether
reality should be considered as external to the social actors or whether it should be considered
as an entity constructed by the actions and perceptions of social actors/factors (Bryman &
Bell, 2007, p. 22-23). To understand the answer to this question, we have to study two
different research stances: objectivism and constructionism. In the objectivism stance, the
social phenomena and its meanings exist independently and there is no influence of social
actors on it. On the other hand, constructionism supports that social phenomena and it
meanings are constructed by social actors (Bryman & Bell, 2007, p. 22-23).
Epistemology mainly concerns the study of reality and the basics of knowledge (Peltomäki &
Nummela, 2004, p. 163). It deals with the question whether social science research can be
carried out in a similar way as natural science research, for example with the same principles,
procedures and ethos or what constitutes acceptable knowledge in a field of study (Bryman &
Bell, 2007, p. 16; Saunders et al. 2009, p. 112). The epistemological stance is further sub-
divided into positivism and interpretivism, and they contrast each other. In positivism, a
social phenomenon is studied with natural science’s rules. Objective analysis is the base for
researchers to take this position where they collect, analyze and process the data in a value-
free (contrast to feeling research) environment. Simply, we can say that the researcher is not
affected by or influences the subject of the research (Saunders et al., 2009, p. 113). Social
reality is considered the same for everyone because human involvement is neglected by
quantifying with a law-like generalization. On the other hand interpretivism contrasts the
objectivity of natural science and as a result human subjectivity is recognized and respected.
Researchers believe that natural science and social science cannot take the same stance
because human and organizations are totally different from each other. They use the method
of interpretation of human actions and give emphasis to the understanding and explaining
human actions and behaviors (Bryman & Bell, 2007, p. 17-18). The world of business and
management is highly complex and a number of other elements add complexity and
uncertainty to it; it is not always possible to study such behaviors by using the natural science
approach. Therefore it is valueable for the researcher to understand humans as social factors
because they contribute to the construction of reality (Saunders et al., 2009, p. 115-116).

27
For this study, we claim that there is reality that can be observed. In today’s business world, it
is possible to study those factors which can influence the consumer purchase decision of eco-
labelled products. Due to this reason, we look towards the objectivist position for the social
occurrences and positivist position for epistemological stance. The main reasons behind these
stances are we do not try to explore, explain or interpret the behaviors of the consumers, but
rather test our hypotheses which we developed in the light of existing literature about eco-
labeling, purchase behavior and factors that influence this behavior. We discussed in chapter
two that the eco-market is growing by 10-15% and companies are putting more efforts in eco-
labeling to ensure future profitability and this can be possible by knowing the most influential
factors that contribute in the purchase decision of eco-labelled products. To understand this
reality we want to do a customer survey to predict their behavior (towards the purchase of
eco-labelled products) by accepting or rejecting the null hypotheses and to know whether
these factors (e.g. Price, eco-knowledge, eco-motivation, gender, peer influence and shelf
space) has any role in influencing green purchase that can contributes in the selection of eco-
labelled products. For this purpose, we distribute a structured questionnaire and doing a
quantitative research and we think that the objectivist approach full fills our research
requirement because we need a solid evidence that if these above mentioned six factors have
any impact on the purchase decision of eco-labelled products. Being researchers we believe
that the objectivity of this study exists outside and independently of our mind. We want to
discover the rules and regulations that is followed by natural science approach to avoid the
immersion of the subject matter.
3.2 Research Approach and Strategy
Research approach which shows the relation between theory and research has split into two
key approaches: deductive and inductive approach. It is the way that shows how the
researcher will collect data and answer the research question (Saunders et al., 2009). In
deductive approach, theory or hypothesis is developed from the existing theories which then
guide the whole process of data collection. Development of theory or hypothesis needs
expertise of the researcher and later on it is accepted or rejected in the light of data analysis.
On the other hand in inductive approach the researcher infer the theory by using the
implications and findings of the research (Bryman & Bell, 2007, p. 11-12; Gratton & Jones,
2004, p. 26). The main aim of deductive approach is to test a theory with the help of collected
data while inductive approach deals to build a new theory with the help of understanding the
meanings human attach to events (Saunders et al,. 2009, p. 127). Deductive approach is
involved in quantitative research method while inductive approach deals with qualitative
research method. In this research, we start with the study of existing theories (literature) about
eco-labeling and the factors that may influence the purchase behavior of consumers while
buying green products. Problem gap was derived from the literature review which guides us to
decide on data collection method that will be suitable for this study. As the purpose of this
study is to understand the influence of these factors on the purchase behavior of eco-labelled
products, therefore we have decided to test the existing theories instead of building or
inferring a new theory. For this purpose, we follow deductive approach with quantitative
method. We developed null hypotheses to accept or reject by evaluating the collected data
with the help of SPSS. These hypotheses testing will enable us to understand the role of these
factors on the consumers purchase decision of eco-labelled (food) products in a store. We
have derived a model from Thøgersen 2000 to streamline the theories which will enable us to
accept or reject our null hypotheses.

28
According to Bryman and Bell (2007, p. 28), research strategy shows general direction about
how a social research will be conducted. Research strategy is divided into qualitative and
quantitative research and clear understanding of these two strategies will lead a researcher in a
correct direction while conducting a business research. It is upon a researcher to use single or
combination of these two strategies, later this strategy decides the data collection method that
will be use in the research (Kekäle, Weerd-Nederhof, Cervai & Borelli, 2009). Both strategies
(Qualitative & Quantitative) have their own strengths and weaknesses and their consideration
is a critical point in a research. We will discuss both these strategies in detail with their
strengths and weaknesses. We will also discuss our strategy for this research and choice of the
selection.
Generally, quantitative method concern with numbers and numerical calculations to test the
hypothesis or theory. In contrast, qualitative method focuses on words and for this purpose
relies on observation and fieldwork to understand a reality or to understand an object (Bryman
& Bell, 2007, p. 28). Quantitative research follows the norms and procedures of natural
science. In such a research, it is believed that social reality is a value free and external to
social actors. This strategy entails deductive approach as it concerns with the collection of
numerical data and testing of a hypothesis. This approach enables the researcher to reveal the
relationship between a theory and a research, preference a natural science approach (in
particular positivism) and lastly point out the social reality objectively. It focuses on
quantification of a data. In contrast, qualitative research focuses on words and entails
inductive approach. Such researches, answer complex phenomena by interpreting the words
and gestures of the participants (being an interpretivist) but it can be also constructionist as
this strategy is concerned with emergence of a social phenomena rather than describing a
phenomena (Bryman & Bell, 2007, p. 28). Qualitative research helps the researcher to better
understand social phenomena as it provides opportunity to deeply understand and investigate
the social phenomena or topic (Creswell, 2007, p. 37-43).
According to Leedy and Ormrod (2001, p. 101-103), the purpose of selection is different for
these two research methods. Quantitative research method offer opportunity to explain,
predict or control phenomena while qualitative research purpose is to understand and uncover
complex phenomena by interpreting the participant’s point of view. These two methods are
not only different by purpose but also follow differences in their processes, data collection
methods, data analysis and their findings. Bryman and Bell (2007) draw some common
contrasts between quantitative and qualitative research strategies in the form of a table, which
helps to visualize the strength and weakness of both methods. We display these common
contrasts in the table below so that the readers should clearly understand the differences
between them.
Numbers words
Point of view of researcher Point of view of participants
Researcher distant Researcher close
Theory testing Theory emergent
Some common Contrasts between Quantitative and Qualitative research
Quantitative Qualitative

29
Static Process
Structure Unstructured
Generalization Contextual understanding
Hard, reliable data Rich, deep data
Macro Micro
Behavior Meaning
Artificial setting Natural setting
Table 2. Some common contrasts between Quantitative and Qualitative research. Source:
Bryman & Bell, 2007, p. 426.
The Selection of the research strategy reflects our choice how to conduct this study. We
apply quantitative approach to our research which will enable us to answer our already
mentioned research questions. Due to following considerations we have chosen the
quantitative method. We are interested to predicate “the influence of several factors on the
consumers purchase decision of eco-labelled (food) products” in the grocery shops while
consumer are buying food items and not to understand the meanings they have behind this
behavior. Keeping in view this point we believe quantitative research match our research
approach appropriately. Applying quantitative approach allows us to view the relationships
between different variables (Bryman & Bell, 2007, p. 44), it has limitations also as we can
only see the relationships between these variables but not able to explain when, why or how it
come to be (Yin, 2003, p .9). Quantitative method is beneficial for our research as it allows us
to collect large number of data at a single point for evaluating through statistical tool. I
believe that this technique will guide us to evaluate the different variables for influencing
green purchase. Finally quantitative research allows the replication of our study which may be
helpful for the future researchers.
We believe, qualitative method cannot solve our research questions as it focuses on detail
informations from the respondents and it is not possible for us to get detail informations from
a large size sample. On the other hand, concrete data will help us to accept or reject our
hypotheses with the help of SPSS rather than to collect and interpret rich deep data from
fewer respondents.
3.3 Research Design
Research design guides a researcher throughout a study from a foundation to the analysis of a
study. We believe cross-sectional research design or social survey fulfills our research
purpose and for this purpose we chose to follow the cross-sectional research design. Cross
sectional research is defined as, “the collection of data on more than one case and at a single
point in time in order to collect a body of quantitative or quantifiable data in connection with
two or more variables, which are then examined to detect patterns of association” (Bryman &
Bell, 2007, p. 55). In cross-sectional design the researcher is concerned with selecting many
cases on the bases of variables, for example selecting individuals on the bases of geographical
area and data is recorded from each case. It contrasts experimental design as there is no pre-
test/post-test measures to compare because data is collected at one point in time (David &
Sutton, 2011, p. 207-209).

30
Obs1 Obs2 Obs3 Obs4 Obs5 …… …… …… Obsn
Case 1 ……… …… Case n
Table 3. “Cross-Sectional Research Data Rectangle” Source: Bryman & Bell, 2007, p. 59.
The selection of cross-sectional research design depends on several reasons, first higher
number (more than one) of cases can be included to generalize and find variations between
variables. Second, cross-sectional research design use positivist approach and mostly carried
out with quantitative data collection. Finally, collected data is submitted and analyzed with
the help of SPSS or other standard statistical procedures, which allows a researcher to make
comparison between variables. It is mostly used to imply a social survey research which
includes all the elements of cross-sectional research, in which data is frequently collected by
questionnaire or structure interview on more than one case and also in time (Bryman & Bell,
2007, p. 55-56). In this study our objective is to find the factors that influence the purchase
decision of eco-labelled products. Therefore survey as a research strategy will be used and it
will be carried by conducting customer survey to collect informations from customers who
buy consumer goods in Umeå, Sweden. This survey will cover consumer various purchase
behaviors and their opinion about eco-labelled products which will help us to submit and
analyze the data with the help of statistical tools for example SPSS. The dimensions of the
Thøgersen, 2000 model will be used to understand these factors in order to answer our
research questions. For this purpose, we will distribute self-complete questionnaire to allow
our respondents to give honest answers to our questionnaire. Since this questionnaire is
formulated from the components of Thøgersen, 2000 model so it is free from bias and makes
it objective.
3.4 Data Collection Methods
In this study we choose to use both primary and secondary sources of data. Primary data will
be gathered by distributing questionnaire to respondents at the entrance of grocery stores
while secondary data has acquired from university library, DIVA, EBSCO host etc. which
enabled us to identify various factors that can influence the purchase decision of eco-labelled
products. In fact, reliable secondary data (literature) enable us to understand eco-labeling,
consumer purchase decision and factors influencing this behavior.
Convenience, availability or opportunity sampling
For this study, we choose convenience sampling technique. Convenience, availability or
opportunity sampling is “simply a sample that is selected for ease of access” or “the
interviewers are asked to find respondents who happen to be conveniently accessible”. It is
good when population is unknown or the researcher is exploring a new research setting
(David & Sutton, 2011, p. 231; Kent, 2007, p. 235). The advantages of convenience sampling
are: easy to access the respondents, completed questionnaire can be collected on the spot and
response rate is good in this technique. The disadvantage related with this technique, not
generalizable to the population as sample is not the representative of population (David &
Sutton, 2011, p. 231, Bryman & Bell, 2007, p. 198).

31
Although, convenience sampling technique has some disadvantages but we choose it as our
sampling technique (with simple quotas) due to resources (Time & Cost) limitation. Due to
these reasons the use of probability sampling technique is not possible for us. Simple quota
can be applied in convenience sampling technique such as selecting equal number of both
male and females from the population (Kent, 2007, p. 235). Our aim is not only the equal
number of both genders but also to include all supermarkets which sell eco-labelled food
products along with conventional products. By this way we will access to other demographic
groups too other than just students. For this purpose we will distribute the questionnaire at
different places in Umeå, Sweden (for example; Willy’s, Coop Forum, ICA Maxi, ICA
Supermarket, Coop Konsum etc.) to get a representative sample of the population. Compare
to random selection of respondents’ simple quota (in convenience sampling technique) tends
to be more representative of the population.
3.5 Social-Survey Questionnaire
Social-survey questionnaire is also referred as self-complete or self-administer questionnaire.
According to Bryman and Bell (2011, p. 231) in this type of data collection method the
respondents complete questionnaire by themselves. Self-completion surveys are used for huge
data collection where a researcher may be present or not. Based on delivery and return self-
completion surveys can be conducted in different ways e.g. postal service, computer based
survey or delivery and collection questionnaire. In delivery and collection method
questionnaires are, “delivered by hand to each respondent and collected later” (David &
Sutton, 2011, p. 240; Saunders et al., 2009, p. 362-363). Bryman and Bell expressed the same
views about these methods, in the first option the researcher mail the questionnaire to the
selected respondent to complete it. To collect the completed questionnaires the researcher can
ask the respondents to send it back by post or they can return to a certain location such as
“supervisor’s office in a firm or on the top of a cashier’s desk in a restaurant” (Bryman &
Bell, 2011, p. 231). The second option is computer-based survey, where the respondents are
asked to complete the questions on the laptop (David & Sutton, 2011, p. 240). The third
option discussed by Bryman and Bell (2011, p. 231) is to choose a certain class in a particular
educational institute and distribute the questionnaire to the target group (students) in the class.
Here, the researchers can collect the answered questionnaires from the students as soon as
they complete their answers.
For this study, we choose the third option i.e. delivery and collection questionnaire method
which we discussed in the above paragraph. This decision is made after evaluating the
advantages and disadvantages of self-administered questionnaire. This evaluation gives us
confidence that self-administered questionnaire suits this study as the disadvantages with this
method will less affect our research. We discuss some advantages and disadvantages of Self-
administered Questionnaire below.
Advantages: Self-administered questionnaire is “cheaper to administer”, “Quick to
administer”, “Absence of interviewer effects”, “No interviewer variability”, and
importantly “Convenience for respondents” (Bryman & Bell 2011, p. 232-233).
As, we are collecting data by “delivery and collection method” where we collect the data at
the enterences of supermarkets by asking people to complete our questionnaire, so it lacks the
advantage of “convenience for respondents”. In this case, our respondents answer in limited
time because they cannot take the questionnaire with themselves. On the other hand, if we
compare to face-to-face interview or postal questionnaire, definitely it is cost saving and

32
quick to administer among respondents while they are visiting supermarkets in Umeå,
Sweden. We can also eliminate the role of interviewer by not staying with the respondents
while they are answering the survey. Importantly, self-administered questionnaire ‘do not
suffer from the problem of interviewers asking questions in a different order’ as all questions
are in the same order for all respondents (Bryman & Bell 2011, p. 233). In our case, we
distribute structured questionnaires to our respondents so the order of questions is same for all
respondents. Finally, by this method we can collect large amount of data in a particular
research.
Disadvantages: The disadvantages of self-administered questionnaire are “cannot
prompt”(as there is no one to assist the respondent if there is ambiguity), “cannot
probe”, cannot ask many questions that are not salient to represent”, “deficiency of
asking other kinds of question”, questionnaire can be read as a whole”, “do not know
who answer”, “cannot collect additional data”, “ lower response rates”, greater risk
of missing data” and “difficult to ask many questions” (Bryman & Bell 2011, p. 233-
234).
In our case some disadvantages, for example “lower response rate” and “do not know who
answer” are not applicable as it is related to postal questionnaire. On the other hand
disadvantages, for example “Cannot probe” and difficulty to ask a lot of questions” are
considered to have less effect on our research findings as we are not interesting to get
elaborated answers from them. We can avoid some of the disadvantages, for example to avoid
missing data we checked the questionnaire after collecting from the respondents to ensure that
all questions have been answered respectively. Since, we collected the data personally so the
return rate of questionnaires is very high because we were standing nearby the respondents
and collected the questionnaires after completion. In this way we tried to minimize the above
disadvantages to not hinder our research purpose.
3.6 Ethical Consideration
David & Sutton (2011, p. 43-49) described various ethical stances which a researcher
considers while conducting a social research. These ethical stances are, “informed consent”,
“privacy, confidentiality and anonymity” and “protection from harm”. Kent (2007, p. 38)
stated, “Ethics are moral principles or standards that guide the ways in which individuals treat
their fellow human beings in situations where they can cause actual or potential harm,
whether economic, physical or mental”. In this study, we followed the various ethical stances
to be honest with both the respondents and the findings of the study. Kent (2007, p. 38)
believes that “good ethical standards are good business” so it is of value to protect the
respondents from harm while conducting a marketing research. It is important for us to keep
the respondents (personal) data confidential and not to share the results with third party. On
the other hand, all the participants will be kept anonymous so to avoid any (personal or
professional) harm to them. We avoid deception in our research because we honestly explain
the purpose of our data collection to the respondents. We also informed our respondents about
the estimated time required for answering the questionnaire and for this purpose we conducted
a pilot test to estimate the average time required for answering the questionnaire.

33
3.7 Truth Criteria
Truth criteria may be referred as quality criteria. The importance of truth criteria cannot be
ignored in a particular research in order to confirm the quality of that research. Business and
management research can be evaluated by three most prominent criteria: Reliability,
Replication, and Validity (Bryman & Bell, 2011, p. 41). Under this section we will explain
these three criteria in accordance to our research.
3.7.1 Reliability
Reliability is primarily concerned with the question whether the results of a study are
repeatable or not. According to Saunders et al., (2009, p. 156), reliability refers to “the extent
to which your data collection techniques or analysis procedure will yield consistent findings”.
Basically, it concerns with consistency and stability of measures (devised for concepts
measurement) (Bryman & Bell, 2011, P. 41). The three prominent factors involved in
reliability are: stability, internal validity and inter observe consistency. Stability, concerns
with the stability of measure over time so that a researcher can be confident that the results do
not fluctuate. Internal reliability, concerns with the consistency of indicators which make up
the scale. Inter-observe consistency, concerns with the conformity of the decisions when more
than one observers participating in the data collection process (Bryman & Bell, 2011, p. 157-
158).
We have tried to establish stability in the process of measurement by attempting to find
indicators and avoid our subjective involvement while designing the questionnaire to avoid
the manipulation of our results by any external factors. We expect the measure will not
fluctuate over time and for this purpose we assess the cronbach’s alpha before conducing
statistical tests. We set a minimum cronbach’s alpha value i.e. 0.5 so that every summating
scale should have sufficient internal validity which comes from the derived measurement. The
critical level of cronbach’s alpha need to reach 0.7 for limited research, we accept a
cronbach’s alpha 0.5 as a critical value because we administer the questionnaire in such a way
to avoid the researcher effect on the results. We found good values for Cronbach alpha except
for one derived measure that was factor price.
3.7.2 Validity
Validity concerns with the integrity of a conclusion obtained from a piece of a research or
simply we can say, degrees the instrument represent for what actually it was designed to
represent (Bryman & Bell, 2011, p. 42). Validity is distinguished typically in four main types:
Measurement validity, internal validity, External validity and Ecological validity.
Measurement validity often referred as construct validity and applies in quantitative research.
It deals the question, do the measure of a concept really represent the concept. Internal
validity deals with the issue of causality which evaluates the casual relationship between two
or more variables which incorporate in the conclusion. External validity concerns with issue
of generalization results beyond the specific context. Ecological validity, concerns with the
application of social scientific findings to people’s every day, natural social setting (Bryman
& Bell, 2011, p. 42-43).
The measurement validity for this study is strong as the measurement used for evaluation can
reflect the true concept. The measurement was carried out at 95% level of significance to

34
affirm any causal relationship between the variables; therefore the internal validity is
trustable. We believe, the external validity of this study is weak as we selected our 150
respondents on convenient basis and due to this reason we have not covered the major part of
our population. Ecological validity is jeopardizing as we use self-completion questionnaire for
the collection of data and according to Bryman and Bell which may disrupt the natural habitat
(2011, p. 56).
3.7.3 Replication
For different reasons researchers replicate research findings of others, for this reason
researchers spell out his or her procedures of a study in great detail (Bryman & Bell, 2011, p.
41). For this purpose, we openly discuss the whole process of our study in great detail for
example, how we selected our respondents for this study, our measurement and analysis. We
believe that the replication of this study is good if other researcher want to replicate the results
of this study in the similar environment.
3.8 Practical Methodology
This part deals with the question, how we conduct the empirical study e.g. sample selection,
measurement, questionnaire design, coding of data for SPSS. We t draw the research
questions in the form of a model. This model will help us in answering our research questions
(See the Model In chapter 2).
3.8.1. Research Sample
The size of our research sample is 150 respondents in Umeå, Sweden. We tried to choose the
sample as representative as possible and for this purpose we collect our data at different
locations in Umeå, Sweden. We deliver our questionnaires at the main entrance of different
super markets in Umeå, Sweden. These supermarkets are ICA Supermarket Ålidhem, Coop
Konsum Ålidhem, Willy’s, Coop Forum, ICA Maxi, ICA Gourmet, Coop Matcity and ICA
Berghem. In this way, we can approach to different segments (age, income, store loyal etc.) of
the population in Umeå, Sweden. The number of male and female was also kept equal i.e. 75
each. In stores, it took longer time for us to collect data as many people were not willing to
answer the questionnaire while they were coming for shopping. Other thing, in pre-test we
estimated 6 minutes to be needed for the completion of a questionnaire but in reality there was
variation in the completion time. Some people took much longer time as they were
accompanied by kids.
Store Name
ICA Ålidhem
COOP Ålidhem
Willy’s COOP Forum
ICA Maxi
ICA Gourmet
Coop Mat City
ICA Berghem
Total
Size
Sample 23 27 10 10 25 10 10 35 150
Table 4. Research sample

35
3.8.2. Research Preconception
In the beginning of our study, we were interested in different areas of research but later on we
found that we can mix our preferred topics and conduct a combine research study. One of the
researcher was interested to conduct a research in the area of ‘eco-labeling/green marketing’
while the other one was interested in the ‘shelf space role’ but after literature review we came
to know that there is almost negligible work has done on the affect of shelf space regarding
green purchase. Later on, we have decided to carry out our research by studying various
factors which may influence the purchase behavior of eco-labelled products in the store. We
include shelf space in our study as one of the factor which may/may not influence the
purchase behavior of eco-labelled products. Previously no study is available about the role of
shelf space in the selection of eco-label products, so we want to study it as one the six factors
which we selected for this study.
3.8.3. Designing and Pre-testing of the Questionnaire
For the purpose to develop a questionnaire (to answer our research questions) we went back to
the purpose of our study and with the help of that we develop the research questionnaire from
the literature we reviewed in the chapter two. This questionnaire (Appendix1 & 2) contains
different parts with the aim to understand the influence of eco-motivation, eco-knowledge,
price, shelf space (availability in the store), peer influence and demographics on the consumer
purchase decision of eco-labelled products. Question number 1, deals with the awareness of
eco-labelled products which will show whether the respondents are buying eco-labelled
products or not (Yes, No or Don’t Know). Question 2, was aimed to check the interest of
buying eco-label products in future (Yes, No or It depends on the product). Question 3 and 8,
were placed to check the eco-knowledge of Swedish consumers. Question 5, 6 and 7, are
measuring the influence of shelf space on consumer purchase behavior while buying eco-
labelled products (Yes, NO and Don’t Know). Question 10, is designed to know the relation
of peer influence and eco-labelled products. Question 11, 12, 13, 14, 15, 16, 17 and 18, are
designed to check the eco-motivation of our respondents. The concept of eco-motivation is
mentioned in the Thøgersen model. Question 20 and 21 evaluate the possible influence of
price on the purchase decision of eco-labelled products. These questions are in a given
statements form and the respondents are required to rate them from 1 (strongly disagree) to 5
(strongly agree). All these questions are formulated from the theories which are described in
the theoretical framework and for this reason the data is highly connected to the theoretical
framework. We tried to formulate several questions to evaluate one variable, for example to
check the influence of shelf space we formulate three questions to ensure the respondents
response. Therefore, for getting accurate results we ask three questions on shelf space.
Question 5, tries to identify whether the respondents feel eco-labelled products deficiency in
the stores or not. Question 6, asks for the respondents purchase intention if there is more shelf
space allocated to eco-labelled products in the stores. Question 7, tries to know if the
consumers buy products which only stand on a shelf or they try to get what they want to buy.
Eco-knowledge, eco-motivation and price are treated in the same pattern. Question 22 to
question 26 covers the demographic information’s of our respondents for example; age, sex,
education and monthly income.
After designing, we discuss the questionnaire with our thesis supervisor and carried out a pre-
test for our questionnaire in order to identify mistakes and to assure that the respondents can
understand the questionnaire. For this purpose, we randomly selected 8 people to answer our

36
questionnaire and they detected mistakes in several questions. Later on, we corrected these
mistakes (Grammatical and misleading words in Swedish and English versions) accordingly.
In the pre-test, we have also calculated the average time taken by these 8 respondents which
was approximately 6 minutes.
The data collection was carried between April 10 and 20, 2012 in Umeå, Sweden. In the
beginning of this study we planned to collect 200 responses but in the end we collected 150
complete questionnaires. The reasons for this low response rate may be: at super markets
people feel time pressure, sometimes people do not want to share personal informations with
strangers, families accompanying children and no proper sitting arrangement.
3.8.4. Statistical Tests
We run Pearson chi-square and bivariate correlation tests for testing our hypotheses. The
reason for running chi-square test is that it fulfills our requirement of testing the null
hypotheses which we developed from the existing literature in chapter two. The null
hypotheses, state that there is no difference between the expected and actual results. After,
testing our hypotheses we found that shelf space, eco-motivation and eco-knowledge can
influence green purchase. Therefore, we decided to apply bivariate correlation test to measure
the true relationship between these variables and green purchase, for example to know the
actual relationship between the shelf space/eco-motivation/eco-knowledge and green
purchase. These two tests answer our research question, so we don’t need to run further
statistical tests.
3.8.5. Questionnaire coding
For the purpose to analyze the data obtained by the administration of questionnaire, the
statistical program Statistical Package for the Social Sciences (SPSS) has been selected to
use for the analysis of data. We can process a high amount of data with the help of SPSS. We
code the responses in order to gain inferential statistics. Below table shows codes for different
variables.
Variable Label Value
X1 Eco-buying Yes-0, No-1 & Don’t know-2
X2 Interest Yes-0, No-1 & Depends on the product-2
X3 Difference Yes-0, No-1 & Don’t know-2
X4 Frequency *EW-0, Less than EW-1, OM-2, Less than OM-3
X5 Deficiency Yes-0, No-1 & Don’t know-2
X6 Shelf space1 Yes-0, No-1 & Don’t know-2
X7 Shelf space2 Yes-0, No-1 & Don’t know-2
X8 Eco-knowledge Svanen-0, Arla-1, The keyhole symbol-2
X9 Enjoy Strongly disagree-1, Strongly Agree-5
X10 Peer influence Strongly disagree-1, Strongly Agree-5
X11 Important 1 Strongly disagree-1, Strongly Agree-5
X12 Compare Strongly disagree-1, Strongly Agree-5
X13 Beneficial Strongly disagree-1, Strongly Agree-5

37
X14 Credibility Strongly disagree-1, Strongly Agree-5
X15 Information Strongly disagree-1, Strongly Agree-5
X16 Intention Strongly disagree-1, Strongly Agree-5
X17 Important 2 Strongly disagree-1, Strongly Agree-5
X18 Transparency Strongly disagree-1, Strongly Agree-5
X19 Understandability Strongly disagree-1, Strongly Agree-5
X20 Price 1 Strongly disagree-1, Strongly Agree-5
X21 Price 2 Strongly disagree-1, Strongly Agree-5
X22 Gender Female-0, Male-1
X23 Age (20-29)-0, (30-39)-1, (40-49)-2, (50-59)-3, (60-69)-4
X24 Education Elementary school-0, High School-1, University-2, Other-3
X25 Activity Working-0, Studying-1, Pensioner-2, In search of job-3,
Other-4 X26 Income ≤5000 SEK-0, 5001-10000 SEK-1, 10001-15000 SEK-2,
15001-20000SEK-3, 20001-25000SEK-4
Table 5, “Coding of survey” (*EW- Every week, OM-once in a month)
Besides, the above codes we compute several variables by SPSS for eco-motivation, price,
Interest group and Shelf-space. The aim of these new variables is to test the model which we
developed for answering our research question.
X27. Totalprice, X27= (X20+X21)/2
X28. TotalSS, X28= (X5+X6+X7)/3……Where TotalSS is total shelf space
X29. TotalEM, X29=(X11+X12+X13+X14 +X16+X17+X18)/7….Where TotalEM is total
eco-motivation
X30. Int.gr. for statistical reasons, we recode variable X2 into new variable X30 Int.gr
(Interest group). In this new variable, we recode response No and don’t know into a single
response to get statistically significant results. Here, below comes the procedure of recording.
RECODE Interest (1 thru 2=1) INTO Int.gr. |VARIABLE LABELS Int.gr 'Interested to buy
eco-labelled products'. | RECODE Interest (0=3) (1 thru 2=4) INTO Int.gr. In the same way
we have recoded some other variables to get statistically significant results. These new
variables are X31 (Eco-motivation where 1-3=1 and 4, 5=2), X32 (Eco-knowledge1, where
0=1 and 1, 2= 2) and X33 (Eco-knowledge2, where 0=1, 1, 2= 2). The main reason behind
recoding was the low response rate to some options on the 3 and 5-point scale, which hinder
the significance of results.
3.9. Measurement
For the measurement of key concepts, we developed a derived measurement for example
TotalEM (Eco-Motivation), Totalprice and TotalSS (Shelf Space). Likert scale was used to
rate the respondents attitude from 1-5, where 1 indicates strongly disagree and 5 highly agree.
Likert scale was used to obtain a single average score; below we mention the scales and
measurement we use in the questionnaire.

38
Q/Number Type of Measure Scale
X1,X2,X3,X4,X5, Direct Measure Nominal Scale
X28 Derived Measure (TotalSS) Nominal Scale
X9,……..X21 Direct Measure Likert Scale
X22…….X26 Direct Measure Nominal Scale
X27 Derived Measure Likert scale
X29 Derived Measure Likert scale
Table 6. Measurement
We measure cronbach’s-alpha for the derived measure to ensure the reliability of the measure.
The Cronbach’s-alpha value calculated for three different variables (Eco-motivation, Shelf-
space and price) where we used a derived measure.
Reliability statistics
Eco-motivation Shelf-space Price
Cronbach’s Alpha 7.30 5.10 2.54
Table 7. Reliability statistics
3.10. Literature Selection
Relevant literature in this area was investigated and for this purpose we used the school
library and databases especially EBSCO and other reliable sources. As our topic is a quite
new concept in this field so it was hard to find too much related literature, to overcome this
problem we selected several related thesis in the respected area to get help from it, in finding
relevant literature. For this purpose, we selected several highly graded thesis in the relevant
area as for example:”Effectiveness of eco-label: A study of Swedish university students
choice on ecological food (2010)”, written by Lien Quynh Nguyen and Qian Du and Annie
Lefébure and Rafael Rosales Munoz thesis ”Communicating to consumers in Sweden with
eco-labels: Is the message getting through? (2011)”

39
4. Data Analysis and results discussion
In this chapter we will analyze our data with the help of SPSS. This chapter is divided into six
parts according to our hypothesis.
4.1 Eco- motivation
As stated in the methodology chapter, we have computed several new variables for the
purpose to answer our research question in a better way. In these new variables we have
computed a variable i.e. eco-motivation which consists of 7 variables which measure the eco-
motivation of a respondent. The Cronbach’s alpha (7.3) was checked in the beginning which
indicates that the scale taken for measuring eco-motivation is reliable. The below table shows
that the sample size is 150 without any missing data and it also visualize the mean, median
and mode of the respondent for the particular variable (Eco-motivation). Since this variable is
measured with the help of Likert scale where 1 indicates strongly disagree while 5 indicate
strongly agree. This shows that our respondents have moderately high eco-motivation which
is 3.42 (the middle point is 3 on a 5-point Likert scale).
Table 8. Statistics on Eco- motivation
Statistic
Eco-Motivation
N Valid 150
Missing 0
Mean 3.42
Median 3.40
Mode 3.80
Figure 5, Comparison of eco-motivation (1: strongly disagree, 5: strongly agree)
The above figure is used to compare the respondent’s perception level on 5 -point scale. It
shows a normal curve for eco- motivation with a standard deviation of 0.685 which is

40
relatively small and it’s indicate that the responses are close to the sample mean. From the
above statistics, we can conclude that the respondents of our sample have moderately high
eco-motivation. We have assumed a null hypothesis for eco-motivation to know whether eco-
motivation has any association with the decision to buy eco-labelled products. The null
hypothesis for evaluating eco-motivation is:
H01: There is no association between Eco-Motivation and interest to buy eco-labelled
products.
For understanding the relationship between eco-motivation and interest to buy eco-labelled
products, we run a chi-square test. The below table show chi-square value (27.108) which is
significant at the .000 level. We therefore reject the null hypothesis that there is no association
between the eco-motivation and the selection of eco-labelled products. Therefore, we can
conclude from the chi-square test that there is strong association between the eco-motivation
and interest to buy eco-labelled product (For further details see appendix 3).
Table 9. Chi-square test on eco-motivation
4.1.1 Eco- motivation Discussion
In this part of the analysis we have decided that Trustworthiness/credibility (trust and belief)
should be included in eco-motivation analysis. The reason for doing this is that we were
following Thøgersen´s “Causal path model” due to which we have decided to include trust
and belief in our definition of eco-motivation. In the research results it was found that the
interest for eco-labelled products was high among the respondents, the purchase decision rate
was 96.7% from the responses for this option. They also believed that eco-labelled products
are beneficial for the environment and that it is important to be environmentally friendly. In
the earlier theory motivation, trust and belief had been found as important factors for the
consumers in making their green purchase decisions. According to Leire and Thidell (2004) in
a situation when a consumer is using product related environmental information it could be
influenced by different factors, for example the consumer´s motivation and understanding of
the relevance of different product choices (Leire & Thidell, 2004, p. 1068). Earlier studies
were indicating that how fast a consumer completed the adoption process on eco-labelled
products depended on his/her motivation level, past experience with using eco-labels and also
the trust in the organization (Thøgersen, Haugaard & Olesen, 2010, p. 1787-1801). One of the

41
important factors from the “Causal path model” was that the consumer had to trust the labels
that the available information is true. The eco-labels had also to be understood, trusted and
valued as a tool for decision-making (Thøgersen, 2000, p. 291-292,285). It had also been
found that sometimes the consumer distrust the environmental claims in the market (Erskine
& Collins, 1997, p. 125). This might be an important factor to handle when it comes to trust
towords eco-labelled products. The importance of norms and values has been pointed out in
several researches. It had been stated that values, beliefs and norms could affect eco-
innovation adoption (Jansson, Marell & Nordlund, 2010, p. 358-360). In the purchase
decision the differences between consumer’s antecedents of purchase intention of organic
products were related to those specific countries cultural values. The main factor causing
differences among consumer were their subjective norms (Maya, Lopez-Lopez & Munuera,
2011, p. 1773-1774).
This was also mentioned as one of the factors in the Fishbein model from consumer behavior
where a belief about an object was considered during evaluation of a product (Solomon,
Bamossy, Askegaard & Hogg, 2006, p. 153). Due to significance results of eco-motivation
including trust and belief it can be an indication that the respondents in this research have
trust in eco-labelled products. Another indication can be that belief; motivation and trust are
all important preconditions for the consumers when they are choosing between eco-labelled
and conventional products. From this discussion, we can conclude that eco-motivation is one
of the strongest factors which influence the consumers to buy eco-labelled products.
4.2 Gender
In this study, we have selected 75 females and 75 males to understand the role of gender in
the selection of eco-labelled products. With the help of this test we can see that whether males
or females are more interested in eco-labelled products. To understand the association of
gender and selection of eco-labelled products we develop a null hypothesis. The null
hypothesis is;
H02: There is no association between gender and interest to buy eco-labelled products in the
store.
For this purpose, we run a chi-square test, in the below table we found that the chi-square
value (0.112) which is not significant at 0.737. Consequently we accept the null hypothesis
that there is no association between the gender and the selection of eco-labelled products. (See
appendix 4 for further understanding).
Chi-Square Tests
Value Df Asymp. Sig. (2-sided)
Pearson Chi-Square ,112a 1 ,737
Continuity Correctionb ,028 1 ,867
Likelihood Ratio ,112 1 ,737
Fisher's Exact Test
Linear-by-Linear
Association ,112 1 ,738
N of Valid Cases 150
Table 10. Chi-square test on gender

42
4.2.1 Gender Discussion
The study results indicate that gender is not an important factor to affect the choice between
eco-labelled products and conventional products. This was opposite finding to one of the
earlier theories findings. In the earlier theory, women were founded to be more aware and
more adaptable to try eco-labelled products than men (Thøgersen, Haugaard & Olesen, 2010,
p. 1798-1796). This factor is ambiguous as several researchers have found different results in
this matter. Another study with a similar finding on the influence of gender was investigating
ecologically conscious consumer behavior (ECCB) and the influence of demographic factors
such as gender. The results indicated that gender was one of the factors that were significantly
correlated with ECCB when it was considered individually but less important in other tests
(Straughan & Roberts, 1999, p. 565-570). At the same time some studies contradicts this
findings but some of the researches are showing the similar results as we have found in this
study about the influence of gender on the consumers green purchase decision. In one of those
studies there were no differences between genders when this factor was compared with
understandability, past experience, accuracy of labels, satisfaction with the labels and the
quality of green products compared to other products (D´Souza, Taghian, Lamb & Peretiatko,
2007, p. 373). Devinney et al. (2011) have also found similar results, so we can say that
gender has no such important role in the selection between eco-labelled and conventional
products.
4.3 Eco-Knowledge
For evaluating eco-knowledge of our respondents we put two questions in our questionnaire.
We evaluate these two questions separately; the reason behind this separate evaluation was
the difference in the scale which we used to measure these two questions. We will evaluate
the question no 3 and then question 8 accordingly. To understand the relationship between
eco-knowledge and selection of eco-labelled products, we develop a null hypothesis. The null
hypothesis is;
H03: There is no association between Eco-knowledge and interest to buy eco-labelled
products in the store.
Chi-Square Tests
Value Df Asymp.sig
(2-sided)
Pearson chi-square
Continuity correction
Likelihood Ratio
Fisher’s Exact Test
Linear-By-Linear
Association
N of valid cases
24.389
22.538
24.226
24.226
150
1
1
1
1
.000
.000
.000
.000
Table 11. Chi-square test on Eco-knowledge (1)
The above table shows chi-square value (24.389) which is highly significant at the .000 level.
Consequently, we reject null hypothesis that there is no association between the eco-
knowledge and the selection of eco-labelled products. As a result, we accept the alternative

43
hypothesis due to high significance level for this factor. Now we are running a chi-square for
question no 8. (See appendix 6 also).
Chi-Square Tests
Value Df Asymp.sig
(2-sided)
Pearson chi-square
Continuity correction
Likelihood Ratio
Fisher’s Exact Test
Linear-By-L inear
Association
N of valid cases
8.446
6.900
8.274
8.389
150
1
1
1
1
.004
.009
.004
.004
Table 12. Chi-square test on eco-knowledge (2)
In the above table Pearson chi-square value (8.446) is significant at the .004 level. Both the
chi-square tests are significant so we reject the null hypothesis and accept the alternative
hypothesis that there is association between eco-knowledge and interest to buy eco-label
products in the stores. We will further investigate this factor in next statistical test that this
association is true or just coincidence.
4.3.1 Eco-Knowledge Discussion
According to the study results the respondents have good basic knowledge about eco-labelled
products. This study is indicating the same results as the earlier studies, for example Nordic
consumers have good knowledge about many eco-labels but at the same time for some
product group their knowledge is weaker (Leire & Thidell, 2004, p. 1061-1068). Leire &
Thidell (2004), Dahm, Samonte & Shows, (2009) have a similar opinion about consumer
knowledge and they believe that the consumer awareness about organic products has also
been found to be high 86% (Dahm, Samonte & Shows, 2009, p. 196). Green consumers found
the green labels and specialist information (about technical products) as facilitators of their
green criteria in the purchase situation. If there is a deficiency of information on the
environmental and social performance of products and manufacturers it could be considered
as one barrier for the green consumers (Young, Hwang, McDonald & Oates, 2010, p. 26-28).
The importance of knowledge is further affirmed; to make informed product choices was also
a prerequisite for the consumers in being able to make green decisions (Nilsson, Tuncer &
Thidell, 2004, p.523).The high evidence for this factor is indicating that the consumers have
good basic knowledge of eco-labelled products, the difference between eco-labels and what
they mean. This can also be an indication that the consumers who are interested in these
products automatically try to get more knowledge about such products. As mentioned in
earlier study, lack of information and problem with understanding information about eco-
labelled products could be a problem for some consumers (D´Souza et al. 2006, p. 168-170).
This is not true in our case as most of our respondents show good eco-knowledge and has
interest to buy eco-labelled products though the relationship between eco-knowledge and
actual purchase is not statistically significant. This result also confirms to another study on the
influence of knowledge, as having knowledge of environmental issues was considered
important in the first stages of the purchase process of green products (Young, Hwang,
McDonald & Oates, 2010, p. 28-29).

44
4.4 Peer Influence
We took peer influence as one of the variable in our model to understand the green purchase.
The below table shows that the sample size is 150 without any missing data and it also show
the mean, median and mode of the respondent for this particular variable (Peer influence).
Since this variable is measured with the help of Likert scale where 1 indicates strongly
disagree while 5 indicate strongly agree. This shows that our respondents have slightly low
perception towards peer influence which is 2.84.
Statistics
Peer Influence
N Valid 150
Missing 0
Mean 2.8400
Median 3.0000
Mode 4.00
Table 13. Statistics on peer influence
For further understanding, we develop a null hypothesis and with the help of chi-square test
we can find out whether peer influence can play role in the selection of eco-labelled products
or not. Our null hypothesis for peer influence is;
H03: There is no association between peer influence and interest to buy eco-labelled products
in the store.
To understand the relationship between peer influence and interest to buy eco-labelled
products, we run a chi-square test. The below table show chi-square value (8.556), which is
not significant at the .073 level. Consequently, we accept the null hypothesis that there is no
association between the peer influence and interest to buy eco-labelled products. (See
appendix 5 for further details).
Chi-Square Tests
Value Df Asymp.sig
(2-sided)
Pearson chi-square
Likelihood Ratio
Linear-By-Linear
Association
N of valid cases
8.556
8.559
1.575
150
4
4
1
.073
.073
.209
Table 14. Chi-square test on peer influence
4.4.1 Peer Influence Discussion
One of our research hypotheses was to verify if there was any association between peer
influence and the selection of eco-labelled products. The research results indicated that it was
no association of peer influence on the respondents. This contradicts some of the earlier

45
theories to some extent. As the influence of other people were one of the possible factors
influencing consumer purchase behavior as mentioned in Fishbein model that social pressure
from other people can effect evaluation process of products (Solomon, Bamossy, Askegaard
& Hogg, 2006, p. 155-156). This factor has also been stated by other authors where it is
believed that the influence of social groups and family members could have an impact on the
consumers purchase behavior (Kotler, 2011, p. 139-143). We should also mention here that
this study was about peer influence in investigating consumer purchase behavior in general
and not on green purchase. But this didn´t make any difference when it comes to the
consumer’s purchase of green products and the similar fact has been found (Young, Hwang,
McDonald & Oates, 2010, p. 28). The importance of other people in the green purchase
decision was also mentioned by Thøgersen which means that one of the factors influencing
consumers in buying eco-labelled products could be peer influence (Thøgersen, Haugaard &
Olesen, 2010, p. 1787-1801). Our result may contradict to some extent what was found about
consumers from Denmark and Sweden which was more conscious about what was socially
acceptable (Maya, Lopez-Lopez & Munuera, 2011, p. 1773-1774). At the same time our study
results are similar to what was found in one of the earlier mentioned theories. When it comes
to consumer behavior of buying organic food the majority of the respondents were not taking
other people´s opinion into consideration before their buying choice (Chryssohoidis &
Krystallis, 2005, p. 590). Despite of the impact of peer influence in some of the earlier
research, our study shows that Swedish consumers are not so much affected by other people
when they are making their purchase decision between conventional and eco-labelled
products. This can confirm the statement that there are differences between the people´s
antecedents of purchase intention of organic products which can be related to countries
cultural values (Maya, Lopez-Lopez & Munuera, 2011, p. 1773-1774). One of the reasons for
these differences might be that several of these studies have been done in different countries
with different cultures and values.
4.5 Price
Price is one of the important elements of marketing 4 P’s as it generates revenue for
organizations. Sometimes price play important role in the purchase decision. To be able to
understand the role of price we put two questions for our respondents. We developed a null
hypothesis to uncover the role of price in the selection of eco-labelled products.
H05: There is no association between price and interest to buy eco-labelled products in the
store.
Chi-Square Tests
Value Df Asymp.sig
(2-sided)
Pearson chi-square
Continuity correction
Likelihood Ratio
Fisher’s Exact Test
Linear-By-Linear
Association
N of valid cases
.052
.000
.052
.051
150
1
1
1
1
.820
1.000
.820
.821
Table 15. Chi-square test on price effect

46
To uncover the effect of price on the selection of eco-labelled products we run a chi-square
test (See appendix 7). The above chi-square test indicate that the chi-square value (.052),
which is not significant at the 0.820 level. Consequently, we accept the null hypothesis that
there is no association between price and the selection of eco-labelled products.
4.5.1 Price Discussion
According to our study findings price has no influence on the decision to buy eco-labelled
products in the store. This finding are surprising as most of the earlier research findings has
indicated the opposite results, in these studies price has a great influence on the consumers
when choosing between eco-labelled products and conventional products. The importance of
price was for example, 35% when choosing eco-labelled products compared to the other
factors such as packaging, reseal ability and brand influence (Rokka & Uusitaloo, 2008, p.
516-519). Price was also confirmed by Thøgersen & Ölander, (2006) and they believed that a
large price gap between eco-friendly and conventional products should be avoided (Thøgersen
& Ölander, 2006, p. 1774-1776). In another study, the factor price was mentioned earlier as
one of the consumer’s problem/obstacle when it comes to the purchase of organic food
(Chryssohoidis & Krystallis, 2005, p. 591). It was also found that the consumer do not want to
sacrifice product function for ethics and that the cost of the product often matters for them
(Devinney, Auger, & Eckhardt, 2011, p.1-2). The impact of price on the consumers green
values in the green purchasing process were mentioned as an influencing factor (Young,
Hwang, McDonald & Oates, 2010, p. 25). This research result can be an indication of that the
customers are satisfied with the prices of available eco-labelled products in the store. It is also
possible that many of the respondents (Umeå citizens) have strong green values but more or
less purchase of eco-labelled products. Thi can be the sign of other factors such as good
quality, taste or motivation is compensating for the price factor. Another indication might be
that price is not important for the consumers in the store when they are choosing between eco-
labelled and conventional products and that they are prioritizing other factors and making
tradeoffs. Here we agree with Devinney et al. (2011) as they mentioned in their article that
people are cause-driven liberal during survey but economic conservative at purchase time, so
this may be true in our case too.
4.6 Shelf Space
Shelf space, as we mentioned in the earlier chapters is one of the variable we are interested to
know as previously there is no research conducted on its affect on the purchase behavior of
eco-labelled products. For this purpose, we have computed a new variable with the name of
total shelf space (TotalSS) to understand the total effect of shelf space on the consumer
purchase of eco-labelled product. The new variable was computed from three variables. The
Cronbach’s alpha was calculated to ensure the scale reliability. The below table shows that the
sample size is 150 without any missing data and it also visualize the mean, median and mode
of the respondents for this particular variable (shelf space). Since, this variable is measured
with the help of nominal scale from 0 to 2 where, 0: Yes, 1: No, 2: I don’t know. The mean
for shelf space is .9224 which is slightly below on 3-point scale (where the middle point is 1).
It shows a normal curve for shelf space with a standard deviation of 0.505 which is relatively
small and it indicates that the responses are close to the sample mean. From the below table
and diagram we conclude that our respondents show slightly low response to shelf space.

47
Table 16, statistics on shelf space
Statistic
Shelf-Space
N Valid 150
Missing 0
Mean .9224
Median 1.000
Mode 1.000
Figure 6, Histogram on shelf space effect
To understand the association between shelf space and interest of buying eco-labelled
products we have developed a hypothesis. The null hypothesis is;
H06: There is no association between Shelf Space and interest to buy eco-labelled products in
the store
Chi-Square Tests
Value Df Asymp.sig
(2-sided)
Pearson chi-square
Likelihood Ratio
Linear-By-Linear
Association
N of valid cases
14.905
15.218
8.366
150
6
6
1
.021
.019
.004
Table 17. Chi-square test on shelf space
For this purpose, we run a chi-square test (See appendix 4) to understand the relationship
between shelf space and interest to buy eco-labelled products. The above table shows chi-

48
square value (14.905), which is significant at the .021 level which is lower than .05 at 95%
confidence level. We therefore, reject the null hypothesis that there is no association between
shelf space and the interest to buy eco-labelled products. Therefore, we can conclude from the
chi-square test that there is association (though not strong as in eco-motivation) between the
shelf space and selection of eco-labelled product. We can conclude at this point that eco-
motivation has stronger association with the selection of eco-labelled products than the shelf-
space but we will further elaborate this association in the next statistical test (See Appendix
8).
4.6.1 Shelf Space Discussion
One of our research hypotheses and research question in this study was to verify if there is
any association between Shelf space and purchase intention of eco-labelled products. We have
found that shelf space has an influence on the selection of eco-labelled products. This study
has similar result as we have been found in the earlier theoretical findings. In this case, it is
important that the eco-labelled products should available for the consumers in the stores.
According to the earlier theory it has been found that availability can have an influence
towards the attention to eco-labelled products (Thøgersen, 2000, p. 307). Furthermore,
availability was one of the factors influencing the consumer during the situation of using
environmental information (Leire & Thidell, 2004, p. 1068). Other research shows that one of
the categories that could hinder consumers from buying organic food was limited availability
of those products (Chryssohoidis & Krystallis, 2005, p. 589-591). Shelf space allocation and
product display could also affect consumer purchase behavior (Chen, Chen & Tung, 2006, p.
1503). The same fact was found in another study on food products, it indicated the similar
result as when stores make healthy items available, the length of shelf space selected to them,
could have a large impact on sales (Farley, Rice, Bodor, Cohen, Bluthenthal, & Rose, 2009, p.
673). These researches also favor our findings and strengthen our position that shelf space
has an influence on the purchase behavior of eco-labelled products. Therefore, we can
conclude from this analysis that increased shelf space for eco-labelled products in the stores
could possibly increase the sales of green products. Increased shelf space can increase the
attention of consumers towards eco-labelled products as both this study and theory support
this statement.
4.7 Relationship Measurement
In this section, we are going to understand the direct relationship between the purchase
behavior towards available eco-labelled products (X16, see the table 5), shelf-space, eco-
motivation and eco-knowledge. We have excluded gender, price and peer influence as they
have shown no association with the purchase interest of eco-labelled products in the first
phase of our statistical analysis. This direct relationship measure will enable us to understand
the influence of eco-motivation, eco-knowledge and shelf space regarding the buying
behavior of eco-labelled products. It also clears our understanding that the association
between shelf space, eco-motivation, eco-knowledge and buying interest was just a
coincidence or if it have a real effect on the purchase behavior of eco-labelled products. To
find the direct relationship with the above stated variables, we decided to run a bivariate

49
correlation test and for this purpose we formulated three hypotheses to understand this
relationship.
H07: There is no relationship between shelf-space and purchase of eco-labelled product.
H08: There is no relationship between eco-knowledge and purchase of eco-labelled product.
H09: There is no relationship between eco-motivation and purchase of eco-labelled product.
4.7.1 Relationship between shelf-space and purchase of eco-labelled product
To understand this relationship we run a bivariate correlation test. In the correlation table we
found direct relationship between shelf-space and purchase of eco-labelled product. This
relationship is highly significant (.000) and positive. It means that the variable shelf space
have positive influence on the purchase behavior of eco-labelled products. In this case, we
reject the null hypothesis of no relationship and believe that there is relationship between
these two variables.
Correlations
Eco-labelled
products affect
buying
intention in the
store
Total Shelf space effect
Eco-labelled products
affect buying intention in
the store
Pearson Correlation 1 ,356**
Sig. (2-tailed) ,000
N 150 150
Total Shelf space effect
Pearson Correlation ,356** 1
Sig. (2-tailed) ,000
N 150 150
**. Correlation is significant at the 0.01 level (2-tailed).
Table 18. Correlation test on eco-label buying intention and shelf space effect.

50
4.7.2 Relationship between eco-motivation and purchase of eco-labelled product
In the below correlation table we found direct relation between eco-motivation and purchase
of eco-labelled products. This relationship is highly significant (.000) and positive which is
.710. It means that the variable eco-motivation has positive correlation with the buying
intention of eco-labelled products. In this case we reject the null hypothesis of no relationship
and believe that there is direct relationship between eco-motivation and purchase intention of
eco-labelled products in the store. This shows that if the eco-labelled products exist on the
shelf the eco-motivated customer will buy it and we conclude that eco-motivation plays vital
role in purchase of eco-labelled products.
Correlations
Eco-labelled
products affect
buying intention
in the store
Eco- motivation
Eco-labelled products affect
buying intention in the store
Pearson Correlation 1 ,710**
Sig. (2-tailed) ,000
N 150 150
Eco- motivation
Pearson Correlation ,710**
1
Sig. (2-tailed) ,000
N 150 150
**. Correlation is significant at the 0.01 level (2-tailed).
Table 19. Correlation test on Eco-label buying intention and eco-motivation
4.7.3 Relationship between eco-knowledge and purchase of eco-labelled product
To understand the direct relationship between eco-knowledge and purchase behavior of eco-
labelled products we put two questions regarding eco-knowledge to know their separate
relationship. The decision of separate analysis was done due to scale differences between the
questions asked for understanding eco-knowledge. Below table indicates that for eco-
knowledge1 the relationship is significant with the purchase behavior. This relationship is
significant (.024) but negative correlate i.e. (-.184). On the other hand, the relationship
between the eco-knowledge2 and purchase behavior is not significant (.951) though they are
positive correlated (.005) with each other. Therefore, we accept the null hypothesis of no
relationship. This may be explained by Devinney et al. (2011, p. 1-2) statements as they

51
mentioned in their research that the consumer is a cause-driven liberal during survey but
economic conservative at actual purchase time. We believe, that only knowledge cannot
motivate consumers to buy certain product, they may consider other aspects of their purchase
too.
Correlations
Eco-labelled
products
affect buying
intention in
the store
Eco-
knowledge
Eco-
knowledge
Eco-labelled products
affect buying intention
in the store
Pearson
Correlation 1 -,096 -,184
*
Sig. (2-tailed) ,244 ,024
N 150 150 150
Eco-knowledge
Pearson
Correlation -,096 1 ,005
Sig. (2-tailed) ,244 ,951
N 150 150 150
Eco-knowledge
Pearson
Correlation -,184
* ,005 1
Sig. (2-tailed) ,024 ,951
N 150 150 150
*. Correlation is significant at the 0.05 level (2-tailed).
Table 20. Correlation on eco-label buying intention and eco-knowledge
4.8 Comparison of Findings with the Research Model
One of our main research questions that we want to answer with our study is: “Which are the
most important factors that influence the purchase behavior of eco-labelled products?” For
this purpose, we developed a model in the second chapter to understand the relationship of
various factors (short listed from the previous literature) with the purchase behavior of eco-
labelled products. In the first phase, we compared interest in eco-labelled products with shelf
space, eco-motivation, eco-knowledge, gender, peer influence and price of eco-labelled
products. For this purpose, we run a chi-square test to know if there is any association

52
between these elements. We have found that the association between buying interest (gets
interest or buying intention of eco-labelled products) and shelf space (.021), eco-motivation
(.000) and eco-knowledge (.000 & .004) exist, which are statistically significant. While, the
association between interest in eco-labelled products and gender (.737), peer influence (.073)
and price (.820) is not statistically significant. In the second phase, we decided to run
bivariate correlation test to confirm the relationship of shelf space, eco-motivation and eco-
knowledge with actual purchase behavior. We found that the direct relationship between
purchase behavior and shelf space (.000) and eco-motivation (.000) is statistically significant
while the relationship between eco-knowledge and purchase behavior has no significant
relationship with each other. As previously shelf space was not directly investigated for its
influence on the purchase of eco-labelled products. Hence, the bivariate test gives us
sufficient evidences that shelf space has positive correlation with the purchase decision of
eco-labelled products.
Model, Made by Authors in chapter 2

53
5. Conclusion of the Study
In this part of the thesis, we discuss and interpret the meaning of our study results. We also
find out and discuss if we have answered our research questions and fulfill the purpose with
the study. Finally, in the end of this chapter of the thesis we will discuss our contribution with
our study and also try to give some further recommendations to other researchers.
5.1 The Influencing Factors
Eco-labeling; a marketing tool to help the consumers in their decision making plays a
substantial role in raising the consumer’s awareness about environmental protection and such
awareness guide the consumers in green purchasing. On the other hand, there are several
factors which may influence the purchase behavior of eco-labelled products, for example
shelf-space is a tool which ensures the availability of a product in the store. Store mangers
face pressure while allocating scarce shelf space to certain products as they have limited space
and numerous companies or products are competing for this space. Understanding the
influence/importance of these factors (regarding the purchase decision of eco-labelled
products) can help marketers in making effective marketing plans, for example; Shelf display
in the store can be used as a communicative instrument for a product. Most of the studies have
been conducted on the effectiveness of eco-labeling and consumer attitude towards
environmental products but many of them have missed to investigate shelf space, peer
influence and gender effect. Therefore, we have decided to include these three factors in our
study along with eco-motivation, eco-knowledge and price. There is limited combine research
available regarding eco-labeling and these factors; therefore, we have decided to investigate
the influence of various factors on the purchase decision of eco-labelled products in Umeå,
Sweden.
The purpose of this study is mainly to understand the most important factors that can
influence the purchase behavior of eco-labelled products. For this purpose, we select several
elements to understand the actual role of these factors regarding purchase behavior of eco-
labelled products. Eco-motivation, eco-knowledge, gender, peer influence and price was taken
along with shelf space. The relationship between these six elements and interest in eco-
labelled products were tested in the first phase of statistical analysis and successfully pointed
out the different elements which has the potential contribution in the interest development
towards eco-labelled products. We correlate these statistically proved significant variables to
another variable i.e. the ‘actual purchase of eco-label’ to understand that whether they have
direct relationship with it or not.
Eco-motivation, eco-knowledge and shelf space has shown strong relationship with the
interest to buy eco-labelled products. The correlation test shows that the relationship between
eco-motivation and purchase behavior of eco-labelled products has statistically significant
positive correlation while the correlation between eco-knowledge and purchase behavior of
eco-labelled products is statistically not significant. Which mean that eco-knowledge cannot

54
induce eco-buying of food items. We believe that sometimes people have good knowledge
about a product but they are not buying it due to various reasons, for example; financial
pressure, lack of taste or trust etc. Interest or attention towards eco-labelled products can be
transformed into environmental purchase. Strong influence of eco-motivation is showing that
this is an important factor in the purchase decision. The underlying trust, belief and attitude
are important antecedents. If the consumer has no trust or belief in the eco-labelled products
he/she will certainly not be motivated to buy these types of products. The consumer shows
good knowledge about the eco-labelled products but this was not totally significant in the
correlation test. On the other hand, our study shows statistically significant relationship
between shelf-space and interest in eco-labelled products, which indicates the role of shelf-
space in the selection of eco-labelled products. The correlation test shows statistically
significant positive relationship between shelf space and the actual purchase of eco-labelled
products. This result indicates the importance of dedicating enough shelf space to eco-labelled
products in the store. If the consumers find the item easily available in the store it will take
less time and effort to search for it which can lead to more sales and ultimately more profit for
the store. To get consumer attention is a first important step for products to be sold in the
market. An increased shelf space might make the consumers more aware and interested of
buying eco-labelled products. Once the consumers notice and try the product the possibility of
re-buying or re-trying increases.
Therefore eco-motivation is the most important factor that influences the purchase decision
and the focus should be mainly on eco-motivation and shelf space. The affect of price, gender
and peer influence was not found significant which is a bit surprising for us as previous
literature believes that they have positive influence on green purchase decision, especially the
factor price. If a consumer have a strong eco-motivation like many of the respondents in this
research have, it can also be a reason for the little influence of the factor price. Another reason
for the price factor may be that consumers are cause driven while answering a survey but are
economic conservative when it comes to pay for a product in an actual purchase situation.
When it comes to gender men and women had a similar opinion which is also an unexpected
result. This can be an indication that both men and women are getting more interest for these
products. Peer influence was not affecting the eco-label interest, one reason for this might be
that it can be difficult to become affected by other people´s interest of eco-labelled products if
you don´t have the interest and motivation by yourself. The result might also be affected by
what kind of items that is purchased and the type of buying situation in the store.
5.1.1 Our Research Contribution
We limit our research to the influence of above discussed six factors on the consumers
purchase behavior of eco-labelled products which is different from other researchers work as
mostly they have investigated ecological behaviors and eco-labeling. We believe that this
study will contribute with new valuable research in the area of eco-labeling in the Swedish
consumer food market. Our theoretical part investigates the available information about eco-
labeling, eco-motivation, eco-knowledge, price, peer influence, gender and shelf-space while
the empirical part has evaluated these variables which can influence the purchase behavior of

55
eco-labelled products. We have found that eco-motivation and shelf-space contributes in the
creation of actual purchase of eco-labelled products. As eco-labelled products in some cases
have had problem with penetrating the market so it is of value to have the right knowledge of
the valuable marketing tools that affect the consumers more or less while making their
purchasing decision of green products. This dimension of our research will help the researcher
while working on a similar topic. We recommend to producers and retailers to provide proper
shelf space to eco-labelled products in the stores as our research shows positive correlation
between shelf space and purchase behavior of eco-labelled products and they can increase the
sale of these products as there is sufficient eco-motivation.
5.1.2 Research Recommendations
For marketers, we strongly recommend to use eco-labeling as a one of the marketing strategy
(as a communication tool to satisfy various stakeholders) and to provide proper shelf space to
the eco-labelled products in the supermarket to ensure the availability of eco-labelled
products. The availability of eco-labelled products in the supermarkets can create the attention
or interest of the consumers, this interest can be changed into purchase by other tools (e.g.
right communication and pricing strategies). Though shelf space has not strong enough
influence compared to eco-motivation but marketer can consider it for the future development
of the company. The eco-motivation and eco-knowledge contributes strongly in the creation
of interest in eco-labelled products, so we suggest the marketers to increase the eco-
motivation and eco-knowledge of Swedish consumers. For this purpose, we think that in
stores eco-labelled products exhibitions, seminars and advertisement can play vital role. These
elements contribute in the development of interest towards eco-labelled products.
Eco-motivation is one of the strongest elements which create attention towards eco-labelled
products. If we look at the sub-variables of eco-motivation for example; in X17 (protect
environment attitude) many of the respondents believed that it is important to be
environmental friendly. Belief is also considered one of the strong element in developing eco-
motivation, we suggest marketers to increase the eco-motivation of Swedish consumers by
some promotional activities. One of the eco-motivation questions was covering if there were
any influence of transparency in the production process of eco-labelled products and for this
query we recommend to make it clearer and more visible for the consumers that how the
product has been produced, packaged, transported and delivered to make it more trustworthy
and to increase the eco-motivation of the consumers.
For further research in this area we recommend the researchers to conduct the research with
bigger sample in a bigger city or cities to be able to generalize the results to the whole
population. It will be also beneficial if someone can conduct study on the same topic with
qualitative approach as it will be valuable to know the point of view of supermarkets
managers regarding the role of shelf space in the selection of eco-labelled products. It is a
subject which we find in need of further research and there can be many underlying factors
that we haven´t found in this research which may affect the consumers in the store.

56
References
Baron, O., Berman, O., & Perry, D. (2010). Shelf Space Management When Demand
Depends on the Inventory Level. Production and Operations Management. 20(5), 714-726.
Bryman, A., & Bell, E. (2007). Business research methods, 2ed. Oxford University Press.
Bryman, A., & Bell, E. (2011). Business research methods, 3ed.Oxford University Press.
Carrete, L., Castano, R., Felix, R., Centeno, R., & Gonzalez, E. (2012). Green consumer
behavior in an emerging economy: confusion, credibility, and compatibility. Journal of
consumer marketing. 20 (7), 470-481.
Chen, Y-L., Chen J-M & Tung, C-W. (2006). A data mining approach for retail knowledge
discovery with consideration of the effect of shelf-space adjacency on sales. Elsevier, 1503-
1520.
Chryssohoidis, G.M., & Krystallis, A. (2005). Organic consumers’ personal values research:
Testing and validating the list of values (LOV) scale and implementing a value-based
segmentation task. Elsevier ltd. Food Quality and Preference, 585-599.
Creswell, J.W. (2007). From Qualitative inquiry and research design: Choosing among five
approaches. Thousand Oaks, CA: Sage.
Dahm, M.J., Samonte, A.V., & Shows, A.R. (2009). Organic foods, do eco-friendly attitudes
predict eco-friendly behaviours?. Journal of American College Health. 58(3), 195-202.
David, M., & Sutton, C. (2011). Social research an introduction. 2nd
edition, Thousand Oaks,
CA: SAGE Publications, Cop.
Desmet, P., & Renaudin, V., (1998). Estimation of product category sales responsiveness to
allocated shelf space. International Journal of Research in Marketing, 15, 443-457.
Devinney, T., Auger, P., & Eckhardt, G.M. (2011). Values vs. Value. Strategy+business,
Booz and Company Inc, 1-3.
D´Souza, C., Taghian, M., & Lamb, P. (2006). An empirical study on the influence of
environmental labels on consumers. Emerald. Corporate Communications: An International
Journal, 11(2), 162-173.
D´Souza, C., Taghian, M., Lamb, P., & Peretiatko, R. (2007). Green decisions: demographics
and consumer understanding of environmental labels. International Journal of Consumer
Studies, 371-376.
Erskine, C.C., & Collins, L. (1997). Eco-labeling: Success or failure? The Environmentalist,
125-133.
Farley, T.A., Rice, J,. Bodor, J. N., Cohen, D. A., Bluthenthal, R. N., & Rose, D. (2009).
Measuring the Food Environment: Shelf Space of Fruits, Vegetables and Snack Foods in
Stores. Journal of Urban Health, 86 (5), 672-682.

57
Fransson, N., & Gärling, T. (1999). Environmental concern: Conceptual definitions,
measurement methods and research findings. Journal of Environmental Psychology, 369-382.
Gajjar, K., &. Adil, K. (2011). Heuristics for retail shelf space allocation problem with linear
profit function. International Journal of Retail and Distribution Management, 39, 144-155.
Grankvist, G., Dahlstrand, U., & Biel, A. (2004). The impact of environmental labeling on
consumer preference: negative vs. positive labels. Journal of Consumer Policy. (27), 213-230.
Gratton, C., & Jones, I. (2004). Research methods for sport studies. London: Routledge, (e-
book).
Grundey, D., & Zaharia, R.M. (2008). Sustainable incentives in marketing and strategic
greening: the cases of Lithuania and Romania. Baltic Journal on Sustainability, 14(2), 130-
143.
Horne, R.E. (2009). Limits to labels: The role of eco-labels in the assessment of product
sustainability and routes to sustainable consumption. International Journal of Consumer
Studies, 175-182.
Hustvedt, G., Peterson H.H., & Chen Y. J. (2008). Labeling wool products for animal welfare
and environmental impact. International Journal of Consumer Studies, 427-437.
Jansson, J., Marell, A., & Nordlund, A. (2010). Green consumer behavior: determinants of
curtailment and eco-innovation adoption, Journal of Consumer Marketing, 358-370.
Kekäle, T., Weerd-Nederhof, P. de., Cervai, S. & Borelli, M. (2009), The Do´s and don’ts of
writing a journal article. Journal of Workplace Learning, 21(1), 71-80.
Kent, R. (2007) Marketing research: Approaches, methods and applications in Europe.
Thomson learning.
Kilbourne, W. E. (1998). Green marketing a theoretical perspective. Journal of Marketing
Management, 14, 641-655.
Kotler, P., & Armstrong, G. (2009). Marketing an introduction, 9 th edition. Prentice Hall.
Kotler, P., Armstrong, G., & Parment, A. (2011). Principles of marketing, Swedish edition.
Prentice Hall.
Kärnä, J.,Hansen, E., & Juslin, H. (2001). Social responsibility in environmental marketing
planning. European Journal of Marketing, 848-871.
Leedy, P.D., & Ormrod, J.E. (2001). Practical research, 7th
edition. New Jersey: Merrill
Prentice Hall.
Lefébure, A., & Rosales, R.M. (2011). Communicating to consumers in Sweden with eco-
labels: Is the message getting through? Magister thesis, Umeå: Umeå University.

58
Leire, C., & Thidell, Å., (2004). Product- related environmental information to guide
consumer purchases-a review and analysis of research on perceptions, understanding and use
among Nordic consumers. Journal of Cleaner Production. Elsevier, 1061-1070.
Martinez de Albéniz, V., & Roels, G., (2010). Competing for shelf space, “Production and
Operations Management, 32-46.
Menon, A., & Menon, A., (1997). Enviropreneurial marketing strategy: The emergence of
corporate environmentalism as marketing strategy. Journal of Marketing, 61, 51-67.
Nguyen, L.Q., & Du, Q. (2010). Effectiveness of eco-label: A study of Swedish university
students choice on ecological food. Magister thesis, Umeå: Umeå University.
Nidumolu, R., Prahalad, C.K., & Rangaswami, M.R., (2009), Why sustainability is now the
key driver of innovation. Harvard Business Review, 57-64.
Nierop, E., Franses, P.H., & Fok, D., (2006). Interaction between shelf layout and marketing
effectiveness and its impact on optimizing shelf arrangements. Marketing Science. 27, 1065-
1082.
Nilsson, H., Tuncer, B., & Thidell, Å. (2004). The use of eco-labeling like initiatives on food
products to promote quality assurance-is there enough credibility? Journal of Cleaner
Production, 517-526.
Orange, E. (2010). From eco-friendly to eco-intelligent. The Futurist, 28-33.
Peattie, K., & Crane, A. (2005). Green marketing: legend, myth, farce or prophesy? 8(4).
Qualitative Market Research: An International Journal, 357-370.
Peltomäki, L.H., & Nummela, N., (2004). First the sugar, then the eggs..or the other way
round? Mixing methods in International business studies, in Peikkari. R.M., Welch,
C. (2004) Handbook of Qualitative research Methods for International Business,
Cheltenham, Edward Elgar, 162-180.
Porter, M.E., & van der Linde, C. (1995). Toward a new conception of the environment-
competitiveness relationship. Journal of Economic Perspectives, 9, 97-118.
Porter, M.E., & van der Linde, C. (1995). Green and competitive,. Harvard Business Review,
120-134.
Rahbar, E., & Wahid, N.A. (2011). Investigation of green marketing tools' effect on
consumers' purchase behavior. Business strategy series. 12, 73-83.
Reyes, P.M., & Frazier, G.V. (2005). Initial shelf space considerations at new grocery stores:
An allocation problem with product switching and substitution. International
Entrepreneurship and Management Journal, 183-202.
Rokka, J., & Uusitalo, L. (2008). Preference for green packaging in consumer product
choices-do consumers’ care? International Journal of Consumer Studies, 516-525.

59
Ruiz de Maya,S., López-López, I., & Luis Munuera, J. (2011).Organic food consumption in
Europe: International segmentation based on value system differences. Ecological economics,
1767-1775.
Saunders, M., Lewis. P., & Thornhill, A. (2009). Research methods for business students.
fifth edition. Prentice hall, Financial Times.
Senge, P. (2009). Sustainability not what you think it is. MIT Sloan Management Review.
Solomon, M., Bamossy, G.,Askegaard, S., & Hogg, M.K. (2006). Consumer behavior-A
European perspective. Third edition. Prentice Hall.
Straughan, R. D., Roberts, J.A. (1999). Environmental segmentation alternatives: a look at
green consumer behavior in the new millennium. Journal of Consumer Marketing, 16, 558-
575.
Suáres, M.G. (2005). Shelf space assigned to store and national brands-A neural networks
analysis. International Journal of Retail and Distribution Management, 858-878.
Tadajewski, M., & Wagner-Tsukamoto, S. (2006). Anthropology and consumer research:
qualitative insights into green consumer behavior. Qualitative market research: An
international journal, 9, 8-25.
Thøgersen, J., &. Ölander, F. (2006). The dynamic interaction of personal norms and
environmental friendly buying behavior: a panel study. Journal of Applied Social Psychology,
1758-1780.
Thøgersen, J., Haugaard, P., & Olesen, A. (2010). Consumer responses to eco-labels.
European Journal of Marketing, 44, 1787-1810.
Thøgersen, J. (2000). Psychological determinants of paying attention to eco-labels in purchase
decisions: Model development and multinational validation. Journal of Consumer Policy,
285-313.
Unruh,G., & Ettenson, R. (2010). Winning in the green frenzy. Harvard Business Review. 88,
110-115
Windrum, P., Ciarli, T., & Birchenhall, C. (2009). Environmental impact, quality and price:
Consumer trade-offs and the development of environmentally friendly technologies.
Technological Forecasting and Social Change, 552-566.
Yin, R.K. (2003). Case study research: design and methods. 3rd
edition. Thousand Oaks, CA:
SAGE Publications, Cop.
Young, W., Hwang, K.,McDonald, S & Oates, C.J . (2010). Sustainable Consumption: Green
Consumer Behaviour when Purchasing Products. Sustainable development. 18, 20-31.
Cambridge dictionary: <http://dictionary.cambridge.org/dictionary/business-english/shelf-
space> [retrieval date: 2012-05-24].

60
Cambridge dictionary:
<http://dictionary.cambridge.org/dictionary/british/availability?q=availability>, [retrieval date:
2012-05-24].
European commission:
<ec.europa.eu/environment/ecolabel/about_ecolabel/what_is_ecolabel_en.htm>, [retrieval
date: 2011-12-08].
<http://ec.europa.eu/environment/eussd/>, [retrieval date: 2011-04-17].
<http://ec.europa.eu/agriculture/organic/organic-farming/what-organic/organic-food_en>
[retrieval date: 2012-05-15].
<www.ec.europa.eu/agriculture/organic/consumer-confidence/consumer-demand_sv,>,
[retrieval date]: 2012-12-29
ISO: International standards organization: (2012) <www.iso.org/iso/about.htm>, [retrieval
date: 2012-03-13].
ISO: <www.iso.org/iso/iso_14000_essentials> [retrieval date: 2012-03-27].
KRAV: (2011), <www.krav.se/System/Spraklankar/In-English/KRAV-/>, [retrieval date:
2011-10-10].
<www.krav.se/Documents/Marknadsrapporter/marknadsrapport2012/Marknadsrapport_2012.
pdf,>, [retrieval date]: 2012-12-27.
MSC (Marine Stewardship Council): (2011), <www.msc.org/about-us/vision-mission>,
[retrieval date: 2011-11-22].
Naturskyddsföreningen : (2012), <www.naturskyddsforeningen.se/gron-
guide/kopa/miljomarkningar/>, [retrieval date: 2012-01-27].
Naturskyddsföreningen: (2010, Augusti, 2012, Maj) <www.naturskyddsforeningen.se/bra-
miljoval/om-bra-miljoval/>, [retrieval dates: 2011-10-10], [2012-04-23].
The Statistical central bureau (SCB):
<www.scb.se/statistik/HA/HA0103/2011A01/HA0103_2011A01_SM_HA24SM1201.pdf,>,
[retrieval date]: 2012-12-29.
The Nordic eco-label: <www.svanen.se/en/Nordic-Ecolabel/>, [retrieval date: 2011-10-09].
The Swedish Government: (2011), <www.regeringen.se/sb/d/4767/a/58107>, [retrieval date:
2011-10-10].
UN (United nations), <www.un.org/esa/dsd/agenda21/>, [retrieval date: 2011-04-17].
UN (United nations), (2011), <www.unglobalcompact.org/Issues/Environment/>, [retrieval
date: 2011-04-17].

61
WWF (World Wide Foundation):
<wwf.panda.org/about_our_earth/teacher_resources/project_ideas/greenhouse_effect/>,
[retrieval date: 2011-11-22].
<www.wwf.se/vrt-arbete/ekologiska-fotavtryck/1127697-ekologiska-fotavtryck> [retrieval
date: 2011-10-12].
<www.wwf.se/source.php/1211289/An_Analysis_of_Swedens_Carbon_Footprint.pdf>,
[retrieval date: 2012-01-08. p.4].

62
Appendix 1: Questionnaire in English
Survey
Hi! We are two master students from USBE (Umeå school of business), Umeå University. We
are writing our thesis in marketing about eco-labelled products and consumer behavior. We
would be thankful if you would like to participate in our research. You will be anonymous
and your answers will only be used in this thesis. The survey takes approximately 5-6 min to
answer.
1. Have you ever bought an eco-labelled product?
Yes No I don´t know
2. Do you have an interest of buying eco-labelled products?
Yes No It depends of the product
3. Do you think that there is any difference between conventional products and eco-labelled
products?
Yes No I don´t know
4. How often are you buying eco-labelled products?
Every week Less than every week Once in a month Less than once in a month
5. Do you feel any deficiency of eco-labelled products in the stores?
Yes No I don´t know
6. If there were more shelf space for eco-labelled products would you buy more of these
products?
Yes No I don´t know
7. Do you buy products that stand out on the shelf in the store?
Yes No I don´t know

63
8. Which of these categories can mainly be considered as an eco-label?
The Nordic eco-label (Svanen)
Arla (Food)
The keyhole symbol (Nyckelhålsmärkta produkter)
Please read these following statements thoroughly and choose the number that
represents how you agree or disagree on them. Answer them by circle the number that
corresponds best with your own opinion. (Strongly disagree=1, Strongly agree=5).
9. I enjoy shopping products in the store
1 2 3 4 5
10. Do you believe that you are influenced by other people’s opinion such as friends, relatives
to affect you choice between conventional or eco-labelled products?
1 2 3 4 5
11. I believe it is of importance to evaluate different consequences before buying the products
1 2 3 4 5
12. It is easy to compare the available eco-labelled products on the market
1 2 3 4 5
13. Do you believe that eco-labelled products are beneficial for the environment?
1 2 3 4 5
14. Do you find the available eco-labels on the market trustworthy/credible when it comes to
taking responsibility for the environment?
1 2 3 4 5
15. Do you find the available information about the eco-labelled products sufficient?
1 2 3 4 5
16. Do eco-labelled products affect your buying intention in the store (Will you buy it)?

64
1 2 3 4 5
17. Do you believe it is important to be environmental friendly?
1 2 3 4 5
18. Is transparency in the whole production process, transportation, packaging etc. an
important factor in choosing eco-labelled products?
1 2 3 4 5
19. Do you find it easy to understand the information/content of the eco-labelled products?
1 2 3 4 5
20. Do you believe that the price for eco-labelled products is satisfying?
1 2 3 4 5
21. When choosing between conventional and eco-labelled products does the price affect your
product choice?
1 2 3 4 5
General information
22. What is your gender? :
Female Male
23. Please fill in your age
24. Education
Elementary school High school University Other
25. Present activity
Working Studying Pensioner In search of job Other
26. What is your approximated monthly income?
≤5000 SEK, 5001-10000 SEK, 10001-15000 SEK, 15001-20000, 20001-25000
Thank you for your kindly participation in this survey,
Best regards Sandra and Arif.
Appendix 2: Questionnaire in Swedish

65
Enkät
Hej! Vi är två master studenter från Handelshögskolan i Umeå. Vi skriver vår uppsats inom
marknadsföring om miljömärkta produkter (eco-labeling) och kundbeteende. Vi skulle vara
tacksamma om ni vill delta i vår undersökning. Ni kommer att vara anonyma och era svar
kommer bara att användas i denna uppsats. Enkäten tar ungefär 5-6 min att svara på.
1. Har du någonsin köpt en miljömärkt produkt?
Ja Nej Jag vet inte
2. Har du ett intresse för att köpa miljömärkta produkter?
Ja Nej Det beror på produkten
3. Tror du att det finns någon skillnad mellan ”vanliga” produkter och miljömärkta produkter?
Ja Nej Jag vet inte
4. Hur ofta köper du miljömärkta produkter?
Varje vecka Mindre än varje vecka En gång i månaden Mindre än en gång i
månaden
5. Känner du att det finns en brist på miljömärkta produkter i affärerna?
Ja Nej Jag vet inte
6. Om det fans mer hyllutrymme tillgängligt för miljömärkta produkter skulle du då köpa mer
av dessa produkter?
Ja Nej Jag vet inte
7. Köper du produkter som sticker ut på hyllan i affären?
Ja Nej Jag vet inte
8. Vilka/vilken av dessa kategorier kan huvudsakligen räknas som en miljömärkning?
Svanen

66
Arla
Nyckelhålsmärkta produkter
Var vänlig och läs igenom dessa antaganden noggrant och välj det nummer som
representerar hur du instämmer eller inte instämmer på dessa. Svara genom att ringa
in det numret som passar bäst med din åsikt. (Instämmer inte alls=1, instämmer
helt=5).
9. Jag gillar att shoppa produkter i affären
1 2 3 4 5
10. Anser du att du är påverkad av andra människors åsikter såsom vänner, släktingar, till att
påverka valet mellan ”vanliga” eller miljömärkta produkter?
1 2 3 4 5
11. Jag anser att det är viktigt att utvärdera olika konsekvenser innan jag köper produkterna?
1 2 3 4 5
12. Jag anser att det är lätt jämföra de tillgängliga miljömärkta produkterna på marknaden
1 2 3 4 5
13. Anser du att de miljömärkta produkterna är fördelaktiga för miljön?
1 2 3 4 5
14. Finner du de tillgängliga miljömärkta produkterna på marknaden som trovärdiga när de
kommer till miljöhänsyn?
1 2 3 4 5
15. Finner du informationen om de miljömärkta produkterna tillräcklig?
1 2 3 4 5
16. Påverkar miljömärkta produkter din köpintention i affären (Skulle du köpa dom)?

67
1 2 3 4 5
17. Anser du att det är viktigt att vara miljövänlig?
1 2 3 4 5
18. Är genomsynligheten i hela produktionsprocessen med transport, packning etc. en viktig
faktor när du väljer miljömärkta produkter?
1 2 3 4 5
19. Tycker du att det är lätt att förstå informationen/innehållet på de miljömärkta
produkterna?
1 2 3 4 5
20. Anser du att priset för miljömärkta produkter är tillfredsställande?
1 2 3 4 5
21. När du väljer mellan ”vanliga” och miljömärkta produkter påverkar priset ditt produktval?
1 2 3 4 5
Allmän information
22. Kön: Kvinna Man
23. Var vänlig och ange din ålder?
24. Utbildning
Grundskola Gymnasium Universitet Annat
25. Nuvarande sysselsättning
Arbetande Studerande Pensionär Arbetssökande Annat
26. Vilken är din genomsnittliga månadsinkomst?
≤5000 SEK, 5001-10000 SEK, 10001-15000 SEK, 15001-20000, 20001-25000
Tack för din medverkan i vår undersökning. MVH Sandra och Arif.

68
Appendix 3: Eco-Motivation
Eco- motivation * Interest of buying eco-labelled products, Cross tabulation
Interest of buying eco-
labelled products
Total
Yes No + It's
depend on the
product
Eco- motivation
1,40 Count 0 1 1
Expected Count ,6 ,4 1,0
1,60 Count 0 1 1
Expected Count ,6 ,4 1,0
Disagree Count 0 4 4
Expected Count 2,5 1,5 4,0
2,20 Count 1 2 3
Expected Count 1,8 1,2 3,0
2,40 Count 3 2 5
Expected Count 3,1 1,9 5,0
2,60 Count 1 7 8
Expected Count 4,9 3,1 8,0
2,80 Count 3 5 8
Expected Count 4,9 3,1 8,0
Neither Disagree nor agree Count 5 9 14
Expected Count 8,6 5,4 14,0
3,20 Count 13 5 18
Expected Count 11,0 7,0 18,0
3,40 Count 13 4 17
Expected Count 10,4 6,6 17,0
3,60 Count 10 9 19
Expected Count 11,7 7,3 19,0
3,80 Count 15 6 21
Expected Count 12,9 8,1 21,0
Agree Count 6 1 7
Expected Count 4,3 2,7 7,0
4,20 Count 8 0 8
Expected Count 4,9 3,1 8,0
4,40
Count 7 1 8
Expected Count 4,9 3,1 8,0
4,60 Count 4 0 4

69
Expected Count 2,5 1,5 4,0
4,80 Count 1 1 2
Expected Count 1,2 ,8 2,0
Strongly agree Count 2 0 2
Expected Count 1,2 ,8 2,0
Total
Count 92 58 150
Expected Count 92,0 58,0 150,
0

70
Appendix 4: Gender

71
Appendix 5: Peer influence
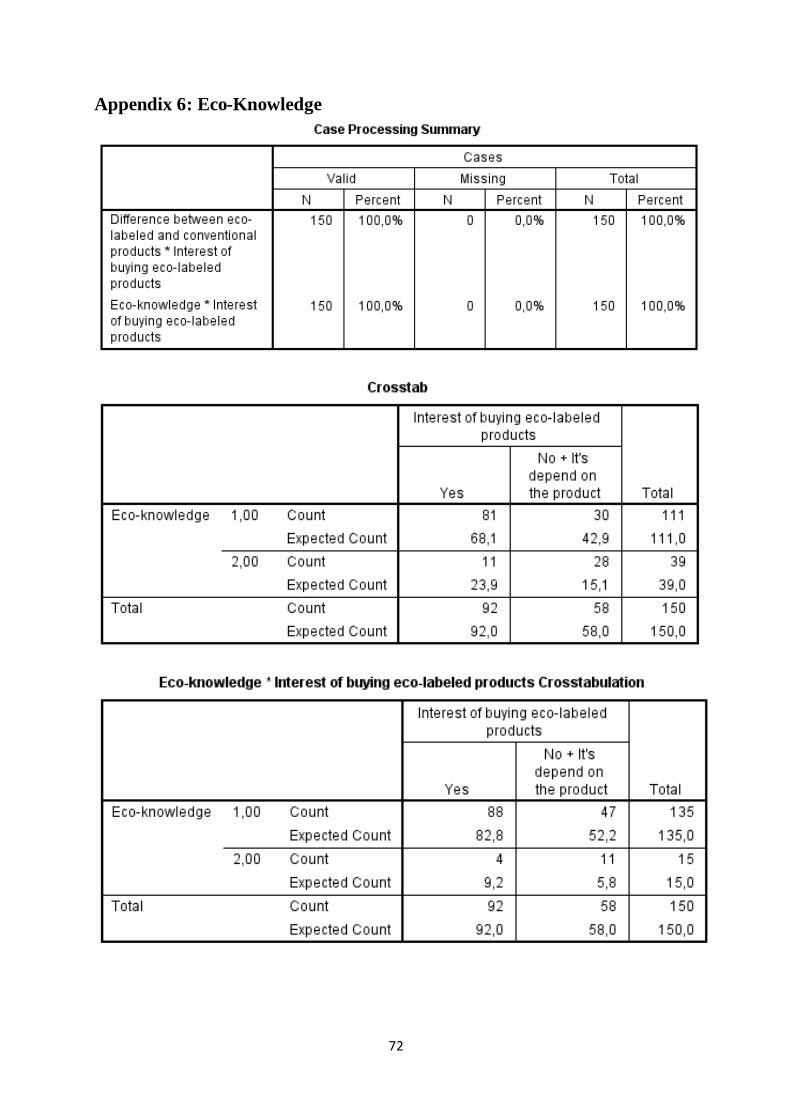
72
Appendix 6: Eco-Knowledge

73
Appendix 7: Price influence

74
Appendix 8: Shelf Space


