
I \
j.
LS 2337.5 .M6 S78x
A STUDY OF THE WORK/LOAN EXPECTATIONS
FACED BY RECIPIENTS OF
MINNESOTA STATE GRANTS AND SCHOLARSHIPS
STATE OF MINNESOTA DEPARTMENT OF FINANCE JANUARY, 1979
This document is made available electronically by the Minnesota Legislative Reference Library as part of an ongoing digital archiving project. http://www.leg.state.mn.us/lrl/lrl.asp

(
(
Acknowledgements
This project was made possible in part from a grant from the Washington
Office of the College Entrance Examination Board.
Staff of the Washington Office of CEEB, the ~Minnesota Higher Education
Coordinating Board, and the State Planning Agency provided valuable comments on
various drafts of this paper. However, the views reflected herein do not
necessarily represent the official position of any of the agencies whose
staff provided assistance.
Questions regarding this study should be directed to:
Ron Hackett Minnesota State Department of Finance 309 State Administration Building St. Paul, Minnesota 55155
Telephone: MWF 612/373-5313 TTh 612/296-5618
15 January 1979
(
Summary and Recommendations
This study of financial aids going to Minnesota State Grant and Scholarship
recipients has·focused on the concept "implied work/loan expectation". This is
simply the dollar amount of work or loans a student must raise after grant aid
from all sources and an estimated parental contribution are subtracted from the
expenses students will incur while in school. Symbollically this may be expressed as:
Implied Work/Loan Expectation= Budget - Parent Contr. -All Grant/Schol. Aid
In examining the amount of grant/scholarship aid from all sources going to
Minnesota Grant and Scholarship recipients, the study found two problems that
resul~ from the type of award formula used to determine award amounts:
1) For recipients attending the same post-secondary system, there is an
inverse relationship between implied work/loan expectations and
estimated family contributions. In other words, grant recipients
from less well-to-do families are facing larger work/loan expectations
than are grant recipients from families that are more affluent.
2) Compared with objectively derived criteria for deciding what a
reasonable amount of work/loan expectation should be, implied
work/loan expectations were found to be low for many groups of students.
Criteria for deciding what a tolerable or reasonable work/loan expectation
should be were based on research conducted by financial aid officers. This
research focused on the impact of part~time work on a full-time student's
scholastic performance. These criteria were used in designing several alternative
policies on the role of work/loans in student financial aid packages. Estimates
of the costs of a state grant/scholarship program based on these alternatives
are presented in the report.
While this study will make no specific recommendations regarding the dollar
Amounts of maximum awards, work/loan expectations, or student budgets, the findings
do suggest that policy-makers should give seriou~ consideration to changing the
current award formula. The following changes would eliminate many of the problems
inherent in that formula:
{ \
/ \
(2)
1) Place a limit on the amount of tuition and fees allowed in the
budgets for private institutions. This limit should be set at some
estimate of average direct and indirect costs per student in public
institutions judged by policy-makers to have similar missions.
2) In place of the current 50% or 75% of need rule, build into the award
formula a reasonable absolute dollar work/loan expectation that would
be the same for all same year-in-school grant recipients at all
institutions.
3) Begin coordinating receipt of all other grant aid funded from state
sources (including Indian Scholarships, Private College Contract
payments, University of Minnesota Tuition Grants, etc.) with the amount
of aid received by the student from the Minnesota State Grant and
Scholarship Program.
Symbolically, the proposed formula would be:
Award= Budget -Work/Loan Expectation -Parent Contr.- BEOG- Other State Grants
Simulations of several variations on this general formula reveal that many
of those variations could result in• substantial savings of state general fund
revenue. Some of this savings could be used to provide additional work-study funds
for institutions in communities not having adequate part-time private sector
employment opportunities for students. Or, it could be used to finance in part
various other modifications in the state grant program, including:
1) elimination of the application deadline;
2) al lowing students to apply for first-time awards in their junior or
senior years; or
3) allowing greater-than-9-month budgets for those students {primarily
vocational) whose courses of study require more than 9 months
a year of full-time classroom work (but not including paid internships).
[

(
(
(3)
Such modifications, if combined with the general recommendation for a formula
change, could utilize the same amount of dollars currently committed to these programs
while at the same time allowing state policy to move closer to assuring greater
access and choice, as these concepts have been operationally defined in this paper.
Those operational definitions embody the notions that: any capable student will be
able to study in any post-secondary institution that will admit him if he is
wilJing to assume a tolerable and reasonable work/loan burden.
\
I. Introductfon
In the biennial tucget message delivered in January 1977 Governor Perpich raised
several ~~estions about the direction ot Minnesota•s programs of financial aid
f9r stuce:nts in pest-secondary education. Concern was expressed about the degree
of ccord1nation of all the various types of state, federal, and institutional pro
gr~ providing financial assistance to students. In particular, there was
interest fn detenn1ning how much emphasis was being placed on work and loans 1n
putting together student aid packages. Was the emphasis being placed on work
and lcar.s unrealistically high or was it unrealistically low?
To f1nd answers to these questions, and to gather 1nfonnat1on that would allow
policy rr~iers to decide if any changes were necessary in the state's policy of
cccrdinating the several types of financial assistance available to students,
the Governor called for a study of student financial assistance in Minnesota.
The fo1low1r.g analysis which focuses only on Minnesota Grant and
Scholarship recipients 1s a response to the Governor 1 s request. While 1t will
pres~nt no policy recorrrr~ndations on award amounts or work/loan ~xpectations.
it will:
1) sus9est several quest1ons that policy-makers should consider 1n reaching ~ecisions about work/loan expectations for grant rec1p• ients;
2) sussest methcds policy-makers could use in deciding what is an a;propr1ate or tolerable a~ount of work/loan expectation;
3} pre~ent ~ata estimating the implied work/loan expectations faced by Minnesota Grant/Scholarship recipients after grant aid frcm all state, federal, and institutional sources has teen taken into consideration;
4) recomnend a general change in the award formula used for the.MSG/Sch program;
5) propose alternative grant award fonnulas, each based on d~ ffer€-r.t a!;swr,pt ions about appropr1 ate work/1 oan exrecta-t ior,s; and
6) provi'de estitr.ates of the costs of a state grant policy based on each alternative fonnula. · ·
..___.
11
,j
·,"\
i
I·.
"-.✓'
II. The Minnesota Grant and Scholarship Program
A. Description
To be eligible for _consideration for a Minnesota grant or sd:clarship.
students must:
1) be a United States citizen or a pennanent resi~ent of the l'nited States and a legal resident of Minnesota at the ti~e of the clcsing date fer filing application; and
2) be a graduate of a secondary school or its equivalent and haver.et or be able to rr.eet all requirements for acr:-ission as a fu11-tfrr,e student to an eligible institution. This inciudes:
a) applicants with no previous post-secondary education w~o wi1l enter an eligible institution as beginning first year stu~ents;
b) applicants who have completed at least cne acacer.-:ic year cf study at an eligible c!Xinunity college at the tir.,e of transfer to an eligible senior college or university;
c) applicants who will attend an elirible institut1oo as ful1-time second year students who did not receive a sta~e scrc1arship or grant-in-aid for their first year of post-secor.cary education; and
d} applicants who will be enrolled full-till'f in an eligih1e institution in a nursing education prc,grar.i leading to Hcensure as a registered nurse or a licensed practical nurse.
A holder of a Minnesota scholarship or grant may request renewal of his or
her award annually until a total of eight semesters or twelve quarters or
their equivalent has been covered. or a bacca1aureate degree obtained.
whichever occurs first.
A holder of an honorary scholarship (no monetary a~ard) may. at the annual
renewal date, request consideration for a monetary award.
To be eligible for.renewal of a monetary scholarship or a grant-in-aid. the
student must:
l} show a continuing need for financial assistance;
2} continue to be a United States citizen or a perr.~r.ent resident of the United States and a legal resident of the State of ~fnnesota.
3) have successfully completed the academic work of the pr-eceding year at an eligible institution; and
4) attend an eligible institution in the succeeding year.
Though the scholarship program and the grant program are separately f~r.ded.
and a pre-requisite for receiving aid from the fom~r 1s graduation 1n the
top 25% of one•s high school class. the size of the, ' for bot•• progra;ns
"""::::--..,,'
is t~sed on the stucent's f1nanc1al need. Financial need, for the purpose
of these programs. is defined as the dollar difference between the budget*
the stu~ent wi11 face at the institution he chooses to attend and an est1-
111oted amount of his family's contribution.-
Ffnancfal Need• Budget - Estimated Family Contribution
The atr.Cl;nt of the award 1n the 1976-77 school year was 50% of financial need up
to a 1:1axi .. ~~ cf $1100 provided the student was not receiving a Basic Educational
Opportunity Grant lBEur.). If the student was receiving a BEOG. and if the sum
of the BECG and the Minnesota State Gra_nt/Scholarship (henceforth, MSG/Sch)
exceeded lGO: of need, the MSG/Sch was reduced so that the sum of the two was
equal to the student's estimated need.
Soc-.e modifications were ~~de in the award fomula used in the 1977-78 school
year. The fcn.:ula rer.iained the same for students not eligible for a BEOG; but,
for those students who were eligible for a BEOG. the amount of the MSG/Sch was
the s~~11er of
1J 50: of need;
2) $1100; er
3} the difference between 75i of need and the amount of the BEOG for which the student was e11g1b1e.
S. Ar.a1ysis of the MNard forn:ula
1) I1i1Pl1ed Work/Loan Erpectatfons
One of the concerns expressed by the Governor was whether the emphasis
placed on the role of work or loans in assisting financially needy students
was appropriate. A later section will specifically address the matter of how
pol fey-makers might approach the problem of deciding what an appropriate or
•7..,r: t•;C:';:::ts u:;~d t~ cetr.nr.ine the awards fr.elude only: 1) tuition and fof!s; 2) c::ar:es for rec,~ and toard in a ccmitory if the student 1s livin~ in a ccrnitcry, or Sl,l01i 1f he is not; and 3) S400 for miscellaneous expenses.
'"'The far.-.1ly contribution ts estimated using a system jointly developed h.Y the kedcan Cclle<:;e Testing Serv1cP. (JI.CTS) and the College Entrance Examination E.carc (CEEE). rt inc1uces an esti~ate of the parent's expected contribution from income and assets as well as a contribution from any realized assets of the students. The procedures for esti~ating parental contributions from assets and income are based on a ccr:plicated co~bination of information about how fami1ies actually behave and value judg~~nts about how they should behave. If the legitimacy of these is ~uestioned, they could and should be dealt with separately in the process of· policy "11ulatior.. The basic points made in this analysis would apply regard•
~ less of ·, thods used to estimate parental contributions. -..,
'-
- ~
& I
' ,!
!'· I
'·
,__,
tolerable work/loan expectation might be. But, before this is done. an analysis
of the work/loan expectations implied by the current MSG/Sch award for:ruia is
in order.
a. Definition
The imolied work/loan P.Xpectation is the ar.iount of a stude~t•s
budget remaining after subtracting the estimated ta.7iily contribution•
and the amount of the grant award.
• b. Size of Implied Work/Loan Expectations for HSG/Sch P.ecipien:s
What size work/loan expectations are implied by the current rules
used to determine the amount of the MSG/Sch award? A few sic:o1e
examples will be used to clarify how these amounts are ca1cu1ated,
then a table will be introduced that w~re thoroughly describes t.~e
relationships among budget level. family contribution. and implied
work/loan expectation.
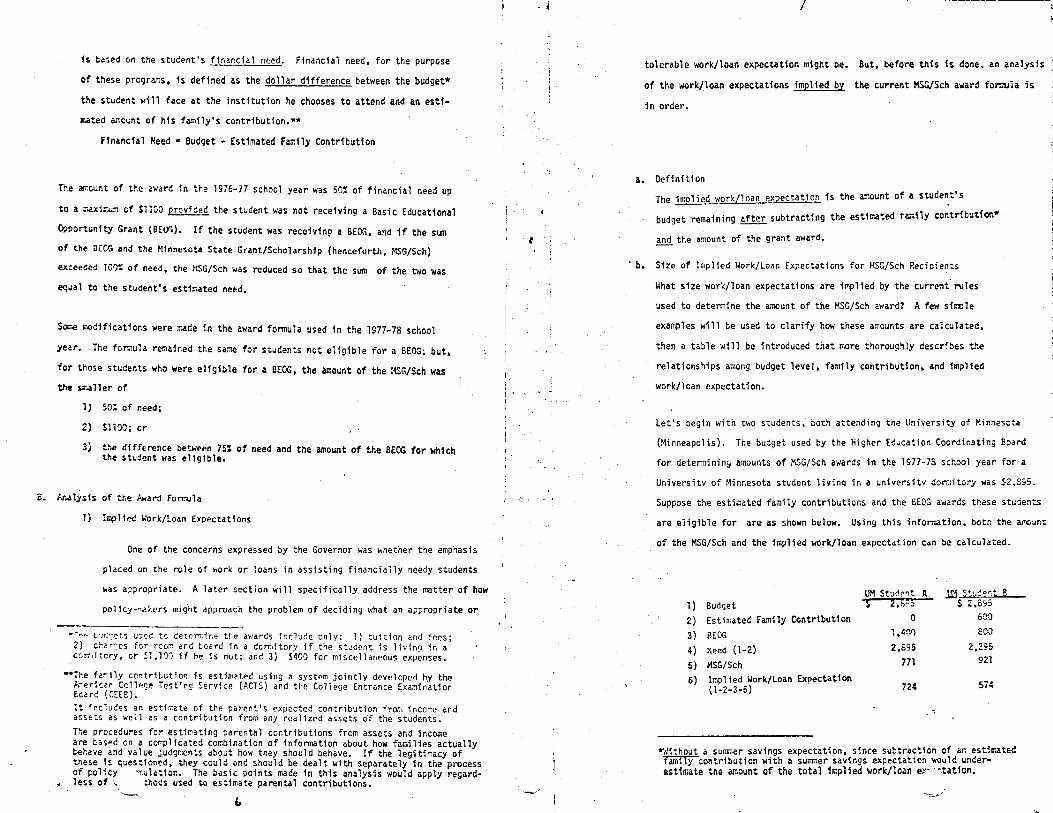
let's begin with two students, both attending the University of Minnesota
{Minneapolis). The budget used by the Higher Education Coordinating Board
for determining amounts of MSG/Sch awards in the 1977-78 school year for a
Universitv of Minnesota student livina in a universitv dormitory was SZ.895.
Suppose the estimated fami1y contributions and the BEOG awards these st~dents
are eligible for are as shown below. Using this information. both the aro~r.t
of the MSG/Sch and the implied work/loan expectation can be calculated.
UM Studrnt A .W S+!.ic 0 r,t ~ 1) Budget $ 2.!;t::, $ 2.ES5
2) Estimated Family Contr1bution 0 600
3) BEOG 1.4M soo
4) Need (1-2) 2.895 2,295
5) MSG/Sch 771 921
6) Implied Work/Loan Expectation {1-2-3-5) 724 574
•~J1thout a surrmer savings expectation, since subtract1cn of ar. estiir.at~ family contribution with a sullliler savings expectation would underestimate the amount of the total fmplied work/loan eY·- ~tat1cn.
~..,_/
l)
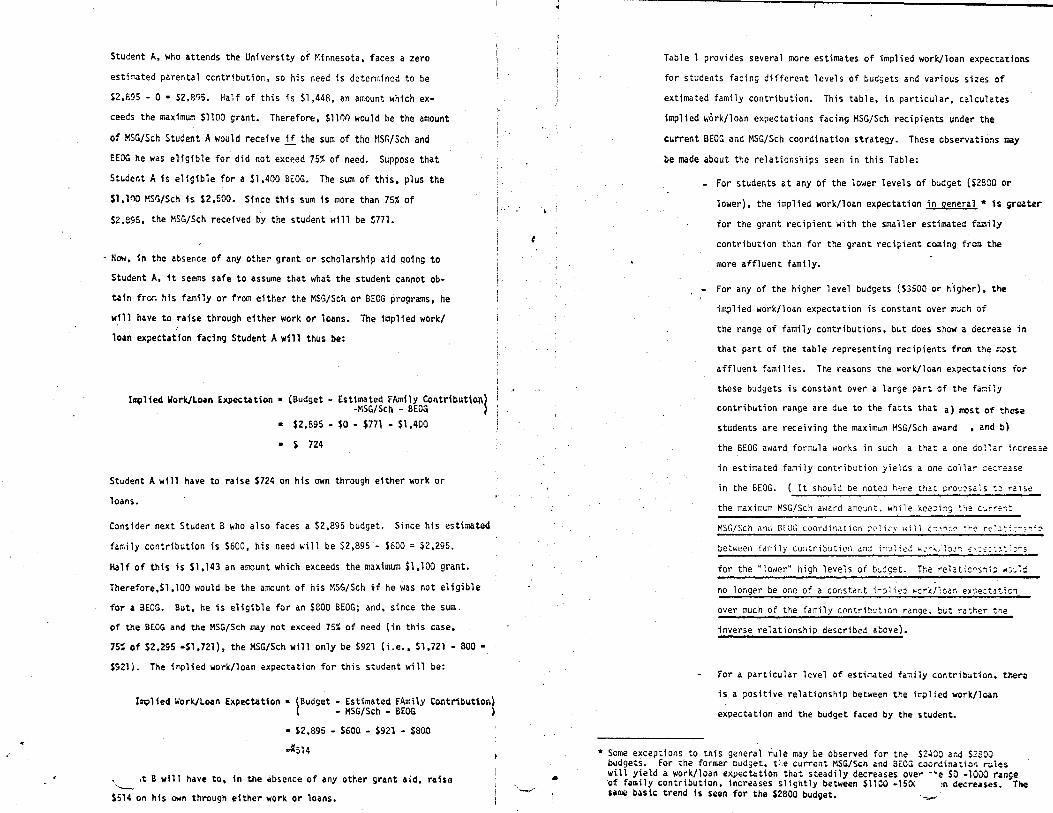
Student A, who attends the University of Minnesota, faces a zero
estimated parental contribution, so his need is detennined to be
$2,895 - 0 • s2,eq5_ Half of this is $1,448, an amount which ex
ceeds the maximum $1100 grant. Therefore, $1100 would be the amount
of MSG/Sch Student A would receive ii the sum of the MSra/Sch and
EEOG he was eligible for did not exceed 75% of need. Suppose that
Student A is eligible for a Sl,400 BEOG. The sum of this, plus the
$1.11)() ~S~/Sch is $2,500. Since this sum 1s more than 75% of
S2.895, the HSG/Sch received by the student will be $771.
- Now, in the absence of any other grant or scholarship a1d qo1ng to
Student A. it seems safe to assume that what the student cannot ob
tain fr~T. his family or from either the MSG/Sch or BEOG progra~s, he
w111 have to raise through either work or loans. Th~ implied work/
loan expectation facing Student A will thus be:
Iicplied Work/Loan Expectation• (Budget - Estimated FAmily Contribut1on) -MSG/Sch - BEOG )
$2,895 - $0 - $771 - $1,400
• S 724
Student A will have to raise $724 on his own through either work or
loans.
Consider next Student B who also faces a $2,895 budget. Since his estimated
family contribution is $600, his need will be $2,895 - $600 = $2,295.
Haif of this is Sl,143 an amount which exceeds the maximum $1,100 grant.
Therefore,Sl,100 would be the amount of his MSG/Sch if he was not eligible
for a BEOG. But, he is eligible for an $800 BEOG; and, since the sum.
of the BEOG and the HSG/Sch may not exceed 75% of need (in this case,
751 of $2,295 •Sl,721), the MSG/Sch will only be $921 (i.e., $1,721 - 800 •
$921). The implied work/loan expectation for this student will be:
I:nplied -ork/Loan Expectation• (Budget - Estimated rAm.ily Contrib~tio~) ( - MSG/Sch - BEOG )
• $2,895 - $600 - $921 - $800
.Jt514
,t B will have to, in the absence of any other grant aid, raise "-
S 5 l 4 on his own through either work or loans.
! 1:,
'-_,-·
I
'i
•• I
·•- i
•
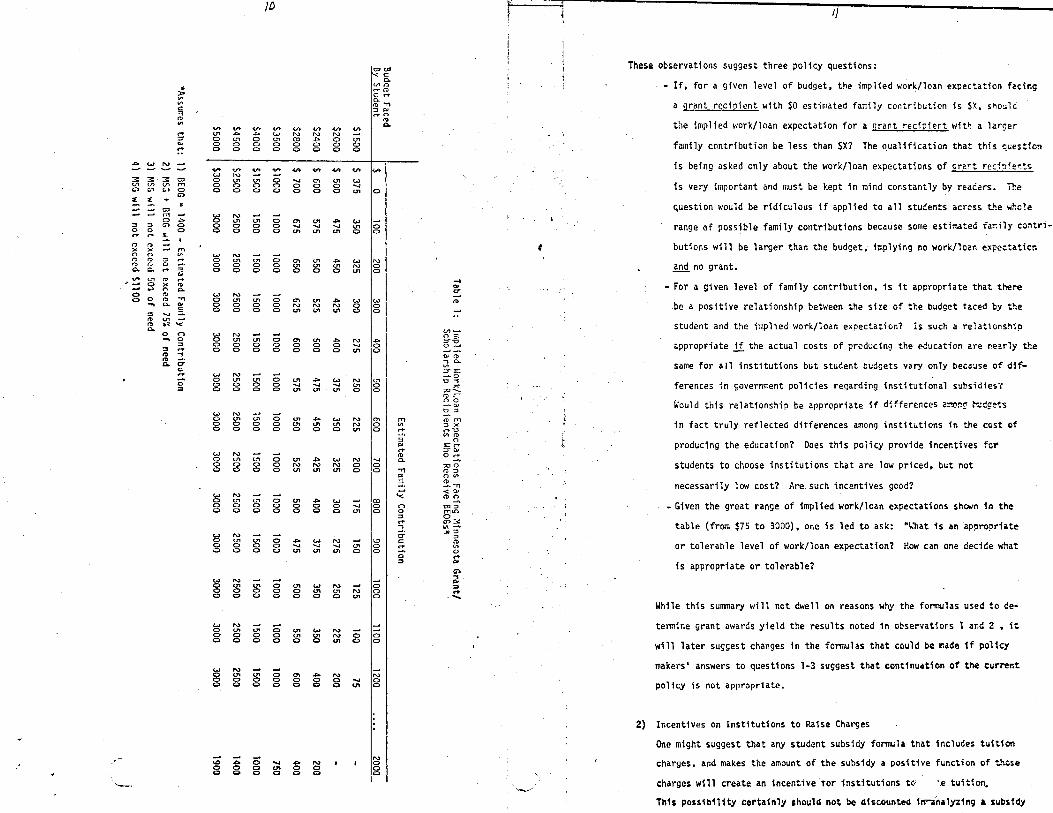
Table l provides several more estimates of implied work/loan expectations
for students facing different levels of budgets and various sizes of
extimated family contribution. This table, in particular, calculates
implied work/loan expectations facing MSG/Sch recipients under the
current BEOG and MSG/Sch coordination strategy. These observations may
be made about the relationships seen in this Table:
- For students at any of the lower levels of budget (S2800 or
lower), the implied work/loan expectation in general* is greater
for the grant recipient with the smaller estiw~ted family
contribution than for the grant recipient coming from the
more affluent family.
For any of the higher level budgets ($3500 or h·igher). the
implied work/loan expectation is constant over m~ch of
the range of family contributions, but does show a decrease in
that part of the table representing recipients frcm the ~.ost
affluent families. The reasons the work/lean expectations fer
these budgets is constant over a large part of the fa~ily
contribution range are due to the facts that a) lllOSt of thes~
students are receiving the maximum HSG/Sch award , and b)
the BEOG award formula works in such a that a one do11ar 1r~rease
in estimated family contribution yields a one do11ar =ecrease
in the BEOG. ( It should be noted h~re that pro~Jsa:s t~ raise
the maximum MSG/Sch award amount. while kee~ir.g tie c~rrer.t
MSG/Sch and BEOG coordinaticn rolicy will c"~~~c :~e re"J:!:-s~i~
bet11een family contribution an~ i;-:;.Jlid .... :··i..,"1:i~" e,.::::::;:'rs
for the "lower" high levels of b~dget. The relaticns~i; wJ~11
no longer be one of a constant i~Jlied wcrk/lca~ exse:tatic1
over much of the family contribution range, but ra:her the
inverse relationship described above).
For a particular level of estimated family contrib~tion. tr.era
is_a positive relationship between the impl!ed work/loan
expectation and the budget faced by the student •
* Some exceptions to this general rule may be observed for the $2400 and SZSOO budgets. For the former budget, t\e current MSG/Sch and BEOG coorc!ination n .. ies w.i.11 yie1d a work/loan expectation that steadily decreases ove.,. _..,e SO -1000 range ·of family contrtbution, increases slightly between $1100 -150( ?O decreues. The same basic trend 1s seen for the $2800 budget. '--,_., ·
JO I/
coco I These observations suggest three policy questions: < C l
~ ~l i - If, for a given level of budget, the implied work/loan expectation facing ~ c~
~ ~~ a grant recipient with $0 estimated family contributicn is SX, s~ould ~ rtn
~ v. V> v. v. V> v. V> v. ~ the implied work/loan expectation for a grant recioient wit~ a larger ,.. C.,,A~WNNN-' ~ OCJ10CJICX>~Otn • • • ~ g g g g g g g g family contribut1on be less than SX7 The qualification that th1s q~est1on
~ ~ ~:::: _ -v- ______ -v. is being asked only about the work/loan expectations of ara~t rec1~1er.ts W N - --' ::.:::.:::.:c:, oc.nc.no....,.a,u,w
~ ~ ~ 8 g g g g g g g ...... 0 is very important and must be kept in mind constantly by readers. The ~ (J"I
~ ; ; question would be ridiculous if applied to all students across tne wr.c?e ~8;;: ~~O::c5mui~W-' • • • -· •· g g ~ g g g g g ;:;: ;:;: ;:;: ~ g range of possible family contributions because some estimated rar.nly con .. r1-
,.. ,.... ::E
~ ~ : ~ I butions wi11 be larger than the budget, 1mpiyir.g no work/1oan expe.:taticn nn v- WN_...,,. r.>r:>:::i,.... O<.nu,Oc-,c.n~WN
a_ 2. ~ ~ g g g g ~ ~ ~ ~ g and no grant. - U'l I'!) ,.. -I
":: ~ ~ ~ ~ - For a given level of family contribution, 1s it appropriate that there 0 rt) (.JN_,_. _, oor:,-,, OU'IU'IOc-,u,~ww n, • ,
..., c. ~ g g g g ~ ~ ~ g g _. .be a positive relationship between the size of the budget tacE-d by the :::i ...... -Z. ~ '< (./)..... student and the imp11ed work/loan expectation? Is such a re1ationship
0 n W N _. -' 03
..., g g ~ ~ g ~ g: ~ ~ ~ 5~ appropriate if the actual costs of producino the education are nearly the ::, ~ 0 0 0 0 0 0 0 c.,, 0 _. ~- - -n> ~ llJ ro
~ o= ~ o. same for all 1nst1tut1ons but student budgets vary only bec:use of difc ~~ N W N __. _,J -'•0
g g g g g ~ ~ ~ ~ g :~ ferences in government pol1c1es reqarding institutional subsidies·/ ro r ~-~ j' Would this relationship be appropriate if differences al!!O:-:g M:cgets
W N - -0 u, '-"' 0 U'I +>- W N 0\ !Tl ro rr, • 0 0 0 o I.Tl "' u, N lo I ~ :::ix · in fact truly reflected ditferences among institutions 1n the cost cf 0 0 0 0 0 0 0 u, O ~ !ri~ ;I
~ ~~ t produc1ng the educat1on? Does this policy provide incentives for w N - .... t l ro ort OU'IU'IOU'l~WN-.J o. ~. , o o o o N N N o o ::ao students to choose institutions that are low priced, but not 0 0 0 0 u, U'l U'l O O ..,, (0::::1
i:,., n ~ 3 ~ • .,, necessarily low cost? Are such incentives good?
w N _. _. ! I¼ ~~ 0 <.n U'I O U'I .., W -' o:> -o a o a o o o ...... o n co:::i - Given the great range of implied work/loan expectations shown 1n the 0 0 0 0 0 0 0 U'l O O ITII.C
::, 0
S: ::;> ~ table (from $75 to 3000), one is led to ask: "\.'hat is an appropriate w N -- -- I I CT ·*::, g g: g: g ~ ~ ~ ;; ::g ~ a: or tolerable level of work/loan expectation? How can one decide what OOOOCJICJIU'lOO _,, O
0 ..,.
::, ;, is appropriate or tolerable?
w N _. - ,_. I ~ 0 u, U'l O U'I W N -' 0 ::, 0 0 0 0 0 I.Tl I.Tl N O rt ooooooou,o ......
While this surm,ary will not dwell on reasons why the fonnulas used to de-
w N _. - ,_. , tennine grant awards yield the results noted 1n observations 1 and 2 , i~ 0 U'I U, 0 U, W N -' -0 0 0 0 <.n ~ N O 0 0 0 0 0 0
c.n ° O will later suggest changes 1n the formulas that could be r.:ade 1f policy
I I makers• answers to questions 1-3 suggest that continuation of the current W N ~ ~ ~
0 ~ U, 0 ~ A N N
8 8 g g 8 8 8 ;:;: g policy is not appropriate.
2) Incentives on Institutions to Ra1se Charges
~ _ ... _. IN I One might suggest that any student subsidy formula that includes tuf1t:oo
' "° ~ o ....,. ~ N • • o charges, and makes the amount of the subsidy a positive function o t.!,cse 0 0 0 ~ 0 0 0 0 0 0 0 0 0 0
~. .__,.,...,1- charges w111 create an incentive tor institutions tc· ·.e tuition.
Th1s poss1b111ty certainly shou1d not be discounted 1~nalyz1ng a subs1dy
,j I
/)
fon:iula. However, a blanr.et stat('(T;ent that such incentives w111 obtain
for all fnstftutfons whose students are el1gible to receive the MSG/Sch is
net ap?ropriate. ~~re specffica11y, these incentives will not exist for
public institutions because tuition charges in public post-secondary
systems fn Minnesota are-treated as a~ from the systems' expenditure
authorizations that emerge from the appropriations process. Thus, we need
foc~s cnly on private institutions.
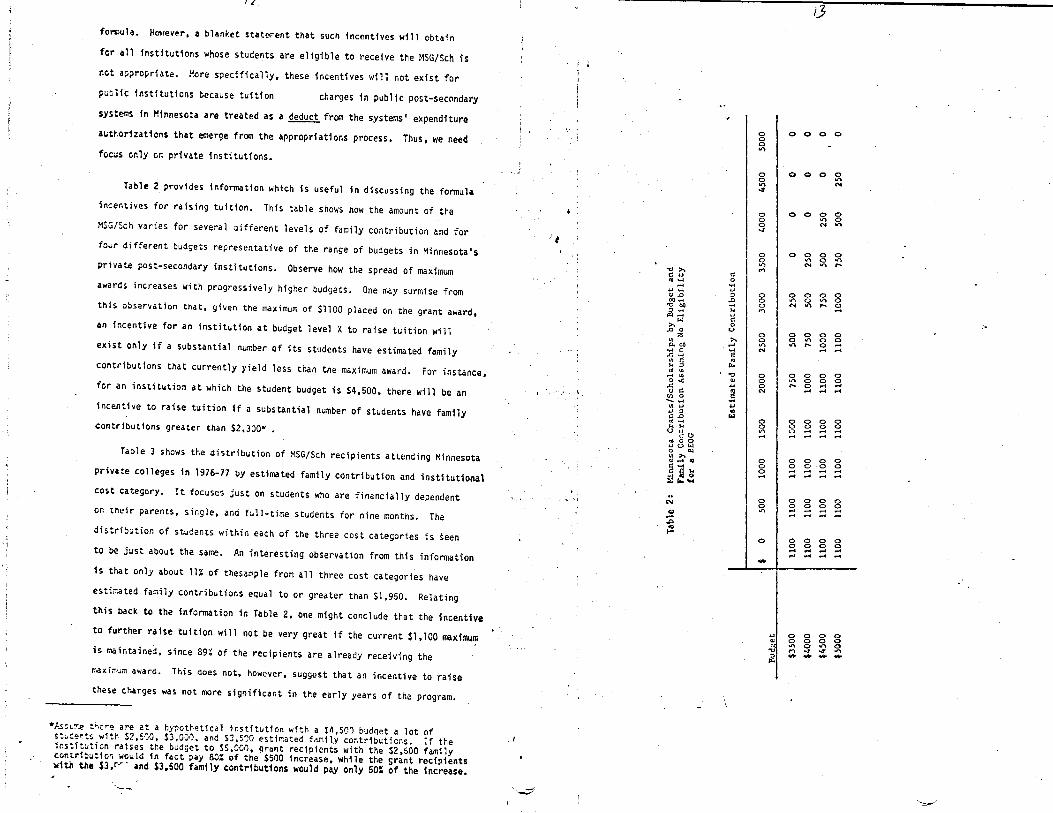
Table 2 provides information which is useful fn discussing the formula
incentives for raising tuition. This table shows how the amount of the
MSG/Sch varies for several different levels of family contribution and for
four different budgets representative of the range of budgets in Minnesota's
private post-secondary institutions. Observe how the spread of maximum
awards increases with progressively higher budgets. One may surmise from
this o~servation that, given the maximum of $1100 placed on the grant award,
an incentive for an institution at budget level X to raise tuition will
exist only if a substantial number of its students have estimated family
contributions that currently yield 1ess than the maximum award. For instance,
fer an institution at which the student budget is $4,500, there will be an
incentive to raise tuition if a substantial number of students have family
contributions greater than $2,300*.
Table 3 shows the distribution of MSG/Sch recipients attending Minnesota
private colleges in 1976-77 by estimated family contribution and institutional
cost category. It focuses just on students who are financially dependent
on their parents, single, and full-time students for nine months. The
distribution of students within each of the three cost categories is seen
to be just about the same. An interesting observation from this information
is that on1y about 11% of thesample from all three cost categories have
esti~~ted family contributions equal to or greater than $1,950. Relating
this back to the information in Table 2, one might conclude that the incentive
to further raise tuition will not be very great if the current $1,100 maximu~
is maintained, since 89% of the recipients are a1ready receiving the
rr~ximum award. This does not, however, suggest that an incentive to raise
these charges was not more significant in the early years of the program.
•;s~~~~ t~ere are at a hypothetical 1nst1tutfon with a $4,500 budqet a lot of s:u~e~ts w1th $2,500, $3,000, and SJ.500 estimated family contr1buticns. If the 1nstit~ticn ra1ses the budget to SS,000, qrant rec1pients with the $2,500 family ccr.tr1~ut1or. ~ould 1n fact pay ao: of the $500 increase, while the grant recip.1ents with the $3.~~- and $3,500 family contributions would pay only 50% of the increase.
--
.r'
,,_,, ·I
I
'~·
-0 >-i:: u i:: cu .... ~ ..... ,LI ..... u Q) .0 :, 00 .... .0
-0 00 .... :, .... ~ IQ ..... ....
tLI i:: >- 0
.0 0 u z ti) >-a. 00 ...
.... i:: .... ...c: • ...; e ti) E: l\l ~ :;I i,.. ro VI
..... ti) -0 o...; Cll
~ I:! ... m en o -.... ...
ti) u "' ... :::J "' i:: .0 ~ ro .,... ~ ~ lJ u
t! <!I ro o o uuw 0 IJ'l ti)::,-., QI ... IQ
§ 1 ~ S! fr,.~
N
::!-.&:;.
'° ...
0 0 0
"'
0 0
"' -:t
0 0 0 -.:r
0 0
I "' C'"I
I 0 0 0 C'"I
I 0 0
"' N
I 0 0 0 N
I 0 0
"' ....
0 0
~
0 0
"'
0
-
... ~
" -0 :,
l"I
I
I
I I
I
I
,3
0 0 0 0
0 0 0 0
"' N
0 0 0 0
"' 0 N "'
0 0 0 0
"' 0 .,... N "'
,....
0 0 0 0
"' 0 "' 0 N "'
,.... 0 ... 0 0 0 0 0 "' 0 0
"' ,.... 0 .... .... ....
0 0 0 0 If\ 0 0 0 ,.... 0 ..... .... ... ... ....
0 0 0 0 0 0 0 0 0 .... ... .... ... .... .... ... 0 0 0 0 0 0 0 0 .... ... .... .... ... ... ... -0 0 0 0 0 0 0 0 ... ... ..... .... ... ... .... ....
0 0 0 0
~ ~ ~ ~ .... ... ... ...
0 0 0 0 0 0 0 0 tJ"\ 0 Ill 0 C'"I....,. -:t "' ---.....
.__,

! .., C 0
C. -0 - 11 u .... <> '.s
::r:; C
0. ... ...... -l::.J .. ... >,. ~ .D
0 ,._ >,, ..,.: r-.. Ml :.I I 0
:.-i •O e4 .._ ... " ... 0- ....
::: -- "'JI
" u '- C u - .... ... .., 'II ~
.> ,..,I u ,:,. -.:.. ,:r,-:.,-:, c.- C: -:::- ., C -:, -uc :& 0
Cl,.. ..., J ....
0 • ::, >D
gfE - C: u ':a. C ::, = u .:;; --, --4--= >. '- c--' ~ ..... -- ..., = .... .... s O<"'-
M
~
:; Cl I-
4
I
"' 'I,/
l ,, ,., ...
cJ .... ~
~ i:<i
I
I
>,. .... e
... GIi .., 0 ...
0 g
"' 0 0
"' -0 0-..... .,,·
0
"' N
-~ -"' .... 0
..,r
"' ~ M -
"' C ... 0
-0 ...
" ::l ..,.;:,
~E w C .. 0 WU
·---~
I~
t ........ ., .... I .. il"t ,..._N0--411'\N 0 l"lN...... 0
I ...
I l°'"",-..,.._n~N 0 N -0 -0 l"l 11'1 N Z :::::::a-11'\NN ...
I I " ,, ·,, ........ .-t .,....CCr.Q\11'\.r)lll'l ..,r ......
I , ....... '°"° .... '°'° Z ~11'\l/"IN ... _. ...
I I t-! ~ ~ ~ ~ i,-! ~ -~ 0-r"l ....... ..,r-o-
c--'\ N ~ ~
I ,-o-o-oNooo Z -0- ,-..r"IO-N..-, COlfl;r-.N """"""
I 1 ~~~~~~~ it"f "' ......... """"""II'\...,. r'\ l"lNN ...
I I"',.. ....... N--o _."' ..,r 0- N..., ,.._
z """'"'"' ......
0- 0- 0- 0- 0, c,. •'r ... .z --7 ....-r .. 't ... -:.;r c,. ..,r o- ~ o, _.,.....NC',
I I t I I I+
oo o r:>o,:,~ .,....,...W"\-r.~11") ..r a- -3' °'...,. r,,
,...._.C-..N
I~
I§
,~ I~
I§
Ii J~
N
... ~ ~
VI .r::. .... i:::
~ m s.. ~ VI .... i::: a,
"C ::, .... VI
-~ .... I
::, .... "C C: tel
(1J
';, -~ VI
VI ....., i::: Q) s.. ,u Q,
s.. ·a:; .c: .... i::: 0
.... i::: Q)
"C C: cu 0. a,
"O
a, s.. ~ 0 .c: 3: VI .... C: a,
0.
u. Q) s.. a, VI 0
.s::: +>
~ C: 0
VI cu
"C ::, .... u C -...
'
''-....:;?
i.)
How might these future incentives be eliminated? A possibility is
suggested by the table. Policy could mandate that tuition abo~e a certai~
level, say $X, simply be recognized as only SX. The level. X, could be set
at the average per student direct and indirect instructional costs of
educating a student in a public post-secondary system (or un1t thereof}
with a similar educational mission•. Need would be determined using this
amount as a tuition base. and the responsibility of meeting any need
resulting from an institution's charges to students being greater wn
this amount would rest with the institution**.
.* Direct and indirect instructional costs per fu11-time equivalent student in various systems or units-within-systems for FY77 were estir.4ted·tc be:
System or Unit
AVTis (1)
Con~nun i ty Co 11 cges ( 2)
State University System (2)
UM-Morris (3)
UM-Undergrad Liberal Arts (Twin Cities) (3)
Sum of Direct and Indirect Costs
$ 2.803
l,825
2.100
2,931
2. 112
Sources: 1. 1979-81 Biennial Budget, Area Vocational-Technical Instit~tcs iwi th estimate of state contribution for retire:r.ent)
2. "A Review of Tuition Alternatives for Minnesota Post-Secondary Education: A Staff Technical Paper- Appendix~ MHECB. June 8. 1978, pp. 16-17.
3. Management Planning and Infonnation Services. University of l'!innc:
**Suchan approach would a1so help assure against the possibility of a student at a private institution being subsidized w~re heavily from public funds than a student in a similar-mission public institution •
·-...._~/,
b l s.,_ l,, C""'-l O ~ q c...) L,,."'J ~-~ J / ,. -.. 7· I f r u h •- I " t ~ 11"> CO M r--. N ~--4- re N _. N ~ \..o--, L.""')
S... CX:f- 0 00 0.0 U"l M ...-, :J .. .. .. .. • 0 N N _. N - :"..:
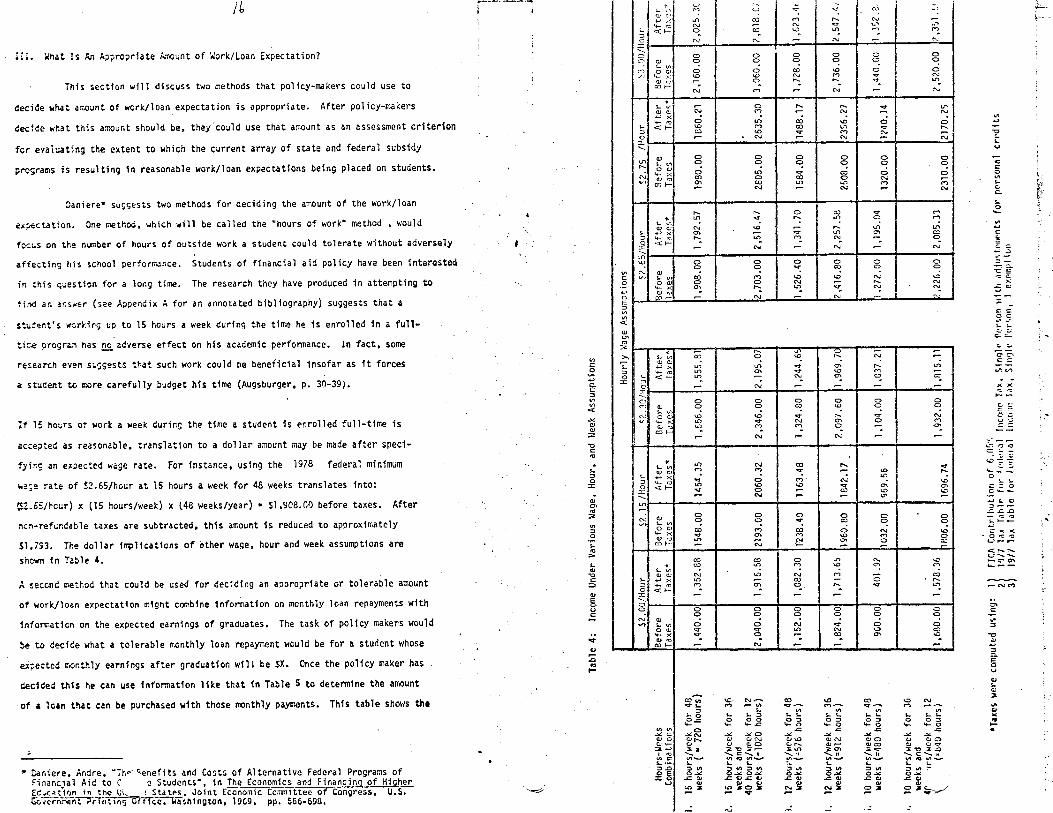
EI. What Is An A;:,;:,ropriate Amount of Work/Loan Expectation? I I~ o o o o o o ow o o o o a a S- u, • • • • •
...-, ow a a co 1.0 o o I/) 4-,-: \.0 ..a ("\J M -.:r- N
This sect1c,n wfl1 discuss two methods that po.1icy-makers could use to g;::_ 0 ,...__ ..... "'1'. ,.-,
N M ,- N - ~
4eci~e what a~ount of work/loan expectation is appropriate. After policy-makers s... ti .- o r--. r--. v IJ",
~~ ~ ': "! -. '""! ~ aecide what this amount should be, they·could use that amount as an assessment criterion s... ~~ ~ ~ ~ ~ ~ ~ =
:, 00 I.O V M N '-:1 0 ,.- N ,- N ,-. r,J -
for e·,a1uating the extent to which the current array of state and federal subsidy ~ !:i a., o o o o o o _. I
programs is resulting in reasonable work/loan expectations being placed on students. ~ ~ ~ ~ ~ 0 ~ ~ ~ ~ ! N 't;;; co ~ ~ ~ ~ !:: ~ ; v, a:ll- O'I CO l.i'> ,_-, M M S... ,.,,
.- N _. N .- C-... C; r· C. (,'
Caniere• suggests two methods for deciding the amount of the work/loan 1-..;..---1-----1------+----+---+---,1------i s.. ,," 0 ~'.' • r--. r-- 0 00 V M '- ,.,
expectation. One method, which will be called the "hours of work" method. would s... t ~ "": ,..... '-'"! ·a ,..., .,. \ QJClJ N I.O r- r--. ._.-, l1"> .... \; S- -t-> X O'\ ,- -.:;t" L.0 . m C:- C
focus on the number of hours of outside work a student could tolerate without adversely I ~ ~ ~ :, ~ :, ~ ~ ~ ~ = --J--•---.-----_.----+----f---• -----t _, .:i
affecting his school performance. Students of financial aid policy have been interested ~ g g ~ g g g i7.. (/1 N QJ • • • • • • "'"CE
in this Guestion for a long time. The research they have produced in attempting to a v, ~ ~ g ~ ~ ~ ~ ~ _: ~ ~ QJm .. .. • ,. .. • -i
fir.a an ar.s,1er (:;ee Appendix A for an annotated bibliography) suggests that a ~ 001- .- N ~ N ~ ,..,. :;:-.
Ill C C
s~ud~nt's wcr~ing up to 15 hours a week during the time he 1s enro1led in a full• ~ [ r w ~ -
. ~ ~~
t1:-.e prcgra.~ nas ~ adverse etfect on his academic perfonnance. ln fact. some :i1 l--r--~--.,,..--1----~-1----.--:-:~ .... -~-..----~--, "' ::.; ~ ~ ~ u w - --
re$earch even su~~ests that such work could be beneficial 1nsofar as it forces ~ ~ ~ ~ : ~ : : : LO ~ ~ 0 :, 4-rc, 11"> O'I V I.O M r- ..-,..,..,
a st:.il!ent to c:ore carefully budget Ms time (Augsburger, p. 31)-39). i !t. ~ <l: 1- :'.::- N ~ ~ S ~ xx 5 2_:i---l--..;.._.._ __ ....;~_.---+---i----•----~ ;:. ;:. Ill C- 0 0 0 0 0 0 1/1 M QJ O O 00 \Q O O c;_;c.;
c( N Ei~ 1.0 1.0 .; ~ .,,. ~ 8g If 15 hours ot work a weelc c!uring the time a student is enrolled full-time is ~ ..,.. t ~ ~ ;:,?; ~ g; ;?. ~ ~ i
.!!: cor= • • • • ~ ~ N ~ N - -
acce?ted as reasonable, translation to a dollar amount may be made after spec1- -c ,t;....-+----i~---+-----+-----i-----+----+------i ~~-;:;-;;; ~ ~~~
fy1ns an expected wage rate. for instance, using the 1978 federal minimum A s... ~ in N co ,-... ~ ...,ti So- OJ CJ M M ~ \0 I°' .__..._ :, S... .., X • • L."") • 0
.. -a~e rate of S2.65/hcur at i5 hours a week for 48 weeks translates into: !t. g ~ ~ ~ g :2 ~ ~ ~ ::: ~ ~ ::r: V O ,-- a.:, '-0 \D c,._M .......... r- N ,,_ r- O"I ..-
(S2.6S/hcur) x {15 hours/week} x (48 weeks/year) • Sl ,Y08.0I) before taxes. After ~ ....,1---+----+------1~--..----+--~-----4 ~.!:: ~ t'O - --~ :3: N a, 0 0 0 0 0 O :::-:; ..,
ncn-ref~ndable taxes are subtracted, this amount 1s reduced to approximately "' vi z ~ 0 ~ "': 0:; ~ ~ z ... - ·" g 't~ ~ ~ ~ g ~ ~ -~~~
Sl,793. Tr.e dollar ilr;llications of other wage, hour and week assumptions are ·s::: ro •-· ~ N e ::: ;?. ::: .._.,_,_ ~ <r--~
shewn fn Tat>le 4. > co co o u-i N .a !::;:::::~ S... +: oJ U"') M \D O"'I M ~;_QJ ~ V") .. • • •
"C QJQJ N I.O N M - CO
A seccnd cethod that could be used for deciding an appropriate or tolerable amount :5 g ~ 2 :q_ °!. ~ ;::: ~ ~ 1 ... "'M
a, :c ,-- ,-- ,--of work./loan expectation n:1ght combine 1nfonnation on monthly loan repayments with 5 cit---~---+-____ _,.. ___ ..., __ _,._. __ _.. ____ _. =
g O g g g g g g ~
infon:-~tfcn on the expected earnings of graduates. The task of policy makers would .... tt t Ill o o ~ .; o o ~ OQJ V «:" U"l N <D C::: -'+-><: ""° 0 .- CO 0\ ..;; -0
be to decide what a tolerable monthly loan repayment would be for a student whose "'T ~ ~ ,..: ~ ,.: ,..: ,..: ,=t ~ ~
ex?ectcd r~nthly earnings after graduation will be ~X. Once the policy maker has i g ~ V
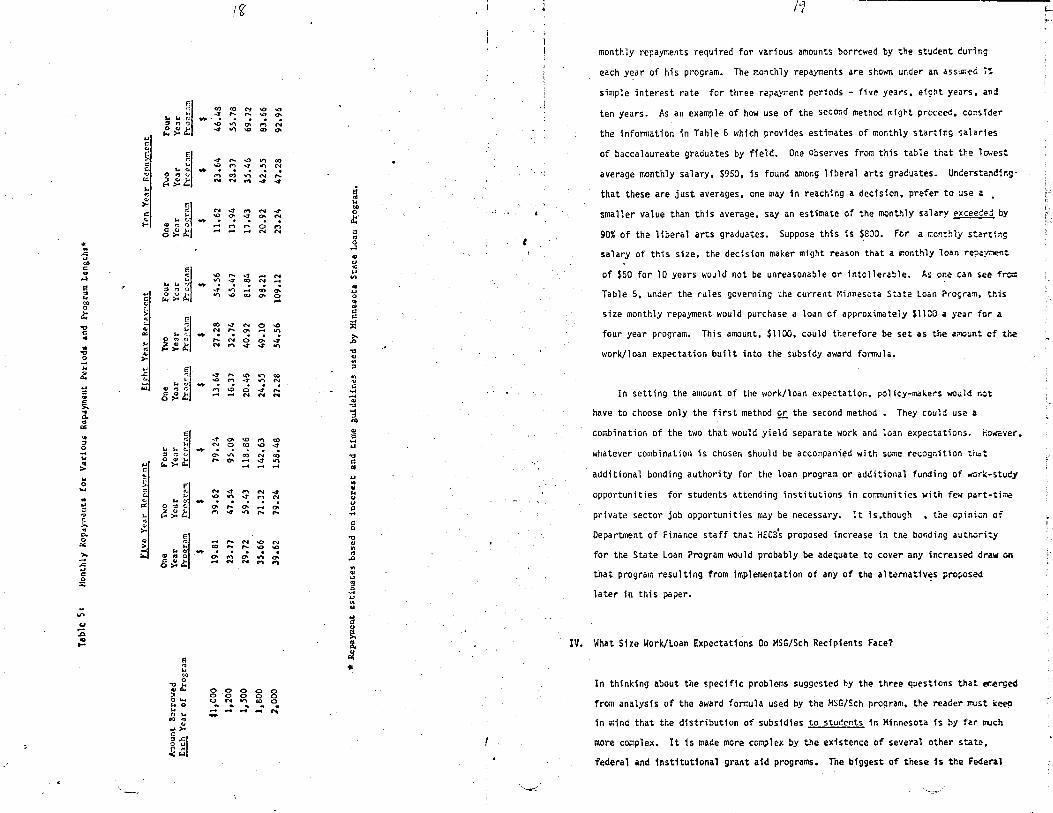
decided this he can use information like thJt 1n Table 5 to detenn1ne the amount ~ Q
- 3 of ~ 1 oan that can be purchased wf th those monthly payments. Thf s tab 1 e shows the ~ ~ ~- ~-:;;- ~ _ ~ _ ~ _ ~ ~ _ .,.
::, S... \It V'I VI it.II C, S.. 0 S... S..:::, S.. S... S.. S... S... I.. S.. S.. S... X O..:; 0 0 0 0 :::, 0 ::, 0 ::, 0 0 :::, "'
'+- '+- '+-..:: '+- 0 '+- 0 .._ 0 '+- '+- 0 ._ I/IV, 0 ..:; J::; ..:: ..:; • ~~ ~N ~ ~O ~ ~ ~ ~ = WO 0.Jr-,. OJ <ll N W \0 OJ N C.> 0 .:., .:., 0 QJ•r- QJ C1.J C.>O QJr-- OJ~ <1.JCO Cl~«:-
¥ ~~ ~• ~~~~ ~~ ~a, ~v ~~~~ I l'tJ ......_ ........ c,11 ,u ......._tl ......... 11 '--C:......._M VIC ~~ ~~~~ ~- ~~ ~~ ~~~S..•r- s... s... s.. ~ s.. s.. s.. s..
* Daniere, Andre, "Tr,p· 0-enefits and Costs of Alternative Federal Programs of 51) 5~ s11 s~ 5~ s~ s.: g.: :Fi:iancjal Aic to C" e Students", in The Economics and Financing of Higher , ::c.3 .cal .ca::.:~ .: &: .c ~ .: ~ .c ~ Ec ... c11t1on in the Uk_ J States, Joint Economic Committee of Congress, U.S. "-=::Y ~ ll: !!:? =-~ :ii ~:. !:: ;;s ;? :& != =-~~ ~--..~nn7Ti1trnr;.uffRC:wash1ngton, 1969, pp. 556-6!)$, ,,_; ·- ...: ·-
! '5 ~ C: Q
oJ
e :I ... eQ 0
~ -,:, C .. . ..., 0 ... w
~
"' ; s.. ~ Q
"' \0 :, 0 ... ~ ... 0 ... . IJ C: . ., ~ C. Q
"" >. --5 C 0 :.:
.;; c.,
D Cl ....
-J
IJ
~
-~ " J., .., " > C: ,;, ...
.., C: <,
~ <: C. <,
"' ,.. <: ... > .., ~ w
IJ C: ~
t r:: C. <,
ct:
I-,
"' C,I
>-Q > ~
r,I r;
...... ~ :, tTS '?
::. ~ t:
!<i
a)CON\0\0 ...,,,....,....'°°' ......... '°"'°'MN ...,, "' '° co °'
C: "" ,... '° F.I
II'\ co "' N N ,..._
,.. '° r"I ...,, s.. r.- ,.... • • •
0 "' <, r"I c,) "' ?. i!, C:, N M .... ...,, ...,,
r: N...,, r"I ""...:t "' ,o o, ...:t °' N (:I
s., t: .,,.. • • • • • 41,: 0 - r"I ,..._ 0 t"l 8:!::it ,....,,..NN
0: ,o,..._-:1'.-.N "' 11"1...,,CON_. F.I ... s.. 'J .... • • • • •
:,.,o """'-r.oo-~;;:,t "''°co°'~
r; <0 ...,, N O ,0 "' N ,..._ (J\ _. II'\ [:I
2~~-...:r:oo:..; ~:.t:. ........ ...,,...,,.,..
"'I
r; ~· ""t,,J. ...
o l'Q C
8 ~ t:
4,-.,0 .. -.00
~ r: ·1; ~ ~ r"I '° 0 ...,, ,.... ..... _. N N N
El r: ,-r a, 'ID r"I co I- NOC0-0-:1'
:,,:c 0-V'ICONCO Lo J.< e.1- • • • • • ~~&:; "°':::~~
Fl <: ,..
... ,:, -0 ::IC
?. :. t:.
N -:I' t"l N ...t
~ ~ ~ '; ~ 0,.,....0, .... c,. r"I ...,, II'\ ,.. .....
_.,._N-ON
~ cg,...,...'°'° s., .. -• • • • •
Cl Ill . 0- r"I 0- It\ 0-5 ~ l: ,..NN ........
e ~ J.< eQ 0 .,, ...
41A. 0 0 0 0 0 :< o ·o o o o Olw ONv"IWO J.10 .. - - - • Lo - - - - c-t 0... -
IQ "' 41 "'>-
5 .CI 0 <.J r!., <W
j ... l>O 0 ,t· C <O 0 ~
(II
IJ <O IJ
Cll
... IJ 0 <4 (II
g i! >, .0 .,, CIJ UI :,
<4 CIJ C:
~ 41
-0
l Cl
~ ~ .,, a ., IJ UI 41 ... Ill IJ C ~
C: 0 .,, (II <4 <O
.0 UI 41
j ..i <4 II
~
l :g, ~ ii
' -.
'-:::::'.
IV.
11
monthly repayments required for various amounts borrcwed by the student curing
each y~ar of his program. The month1y repayments are shown under an assu.r,ed i: simple interest rate for three repayment periods - five years, e1gtit years. and
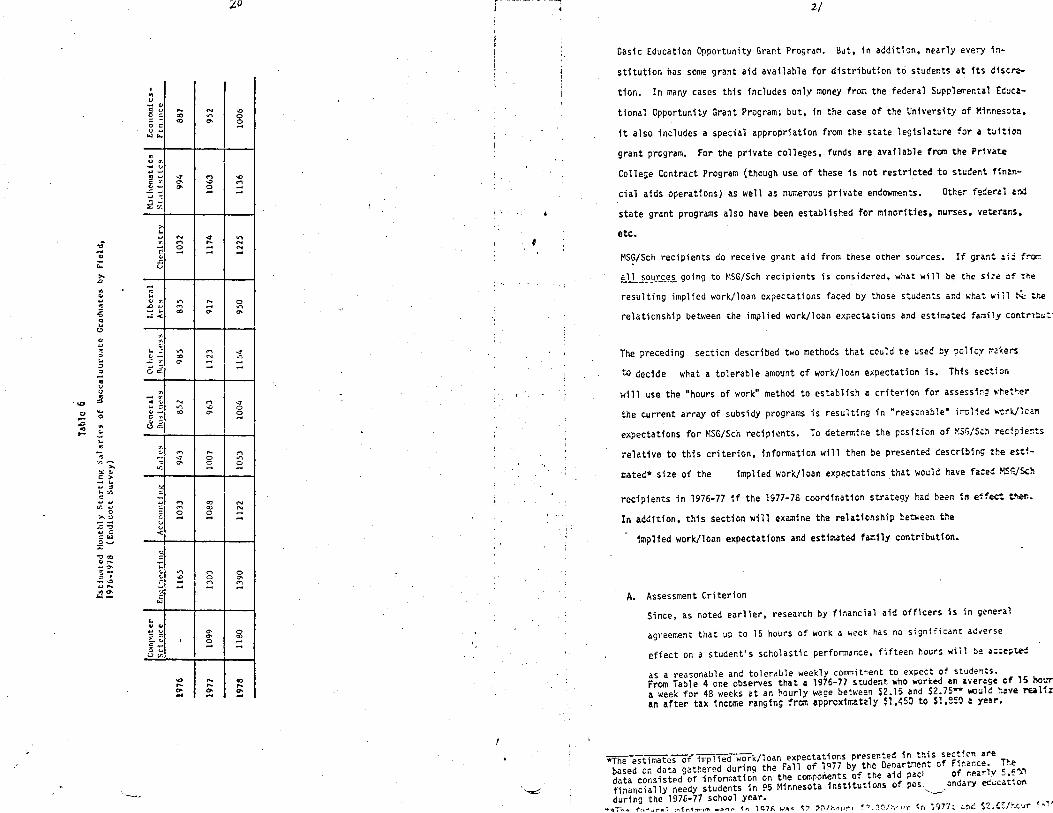
ten years. As an example of how use of the second method might proceed. consfder
the 1nfonnat1on in Table 6 which provides estimates of monthly starting saiaries
of baccalaureate graduates by field. One Observes fror.i this table that the lo..est
average monthly salary, $950. is found among liberal arts graduates. Understandir.g
that these are just averages, one may in reaching a decision. prefer to use a •
smaller value than this average. say an estimate of the w~nthly salary ~xceecej by
90% of the liberal arts graduates. Suppose this is $800. For a ~ont~ly starti~g
salary of th1s size, the decision maker might reason that a monthly loan re?a,;,tr.ient
of $50 for 10 years would not be unreasonable or intollerable. As one can see fro=
Table 5, under the rules governing the current Minnesota State Loan Program. this
size monthly repayment would purchase a loan of approximately $1100 a year for a
four year program. This amount, $1100, could therefore be set as the ajl]()unt cf the
work/loan expectation built into the subsidy award formula.
In setting the amount of the work/loan expectation. policy-makers would not
have to choose only the first method .Q!. the second method. They could use a
combination of the two that would yield separate work and loan expectations. However.
whatever combination is chosen should be accompanied with some recognition that
additional bonding authority for the loan program or additional funding of work-study
opportunities for students attending institutions in COITlTlunities with few part-ti~c
private sector job opportunities may be necessary. It is.though • the O?ini.;n of
Department of Finance staff that HECBs proposed increase in the bonding authority
for the State Loan Program would probably be adequate to cover any increased draw on
that program resulting from implementation of any of the alternativ~s proposed
later in this paper.
What Size Work/Loan Expectations Do MSG/Sch Recipients Face?
In thinking about the specific problems suggested by the three questions that er.-~rged
from analysis of the award fonnula used by the MSG/Sch program, the reader rr.ust keep
1n mind that the distribution of subsidies to students 1n Minnesota 1s by far 1nJch
more complex. It is made more complex by the existence of several other state,
federal and 1nst1tutional grant aid programs. The biggest of these is the Federal
"-,~-
L.. ~.,--
j\: i,·' ~ ..
L
i
. .., :,
:0 ,0
i--
-0 Cl
i:: >,
,.J
VI Gt ... "' .; ~ g .., ~ i.. :,
" 1111 u
~ .... 0
Ill
.: l,.o ,:,
. .,, ...... >,
~:. C: > - ... ... :, ~:
cr. ., 0
>. u :; ;; ... ::: ::: ~ ~'-'
-::, 00 Q,... .;-:,..
g-; - ,a ....... Illa,. w-
' _,,
I Ill u ... " ,:: u
2 = o ::: u -loJ 14.
Ill u er.
:: ~ ;!i., f .'.'.;
..:; .., u-: .::; ... '- ~
>
.... 00 00
~ a-0,.
!:;I N :r. C""""t
- 0 ,:: -~
"' w
r. u
""' ,.J..,
:1 ~
1 0
"' ... ~
& .,., :.
,r.
f;I: C:
... C. c., u <
:.. ,;. -~ ;::
t.:i
"' ""' ... .., ~~
" -5 <, u er.
"' ,., co
"" co c,,
..... ...., co
M ..,, a-
...., ,., ~
...., -0 ...
~ °' -
N
"' °'
,., ,0
~
~ ,... -
,... 0-
M N ...
...., -0 a-
,... 0 0 ...
a:, co ;:;
I""\ 0 M
aa-8
,.. ,... ~
"j.O
,0
0 ;:
'° !J -II'\ N N ...
~ ,,.
.j' ....,
..,, 0
8
M ...., 8
N N ...
0 a,., ...
0 co
co ,... :
I
'~
if
Casie Education Opportunity Grant Program. But, in addition. nearly every in
stitution has some grant aid available for distribution to students at 1ts discre
tion. In many cases this includes only money from the federal Supp1E?ff'.ental Ec~ca
tional Opportunity Grant Program; but, in the case of the University of ~innesota,
it also includes a special appropriation from the state 1eg1slatcre for a tu1t1on
grant program. For the private colleges, funds are available frcm the Private
College Contract Program (though use of these 1s not restricted to student finar.-
cial aids operations) as well as numerous private endowrr.~nts. Other federa1 Gnd
state grant programs also have been established for minorities, nurses, veterans,
etc.
MS~/Sch recipients do receive grant aid from these other so~rces. If grar.~ ail fror.:
all sources going to MSG/Sch recipients is consid~red, what will b~ the size of the
resulting implied work/loan expectations faced by those students ar.d ;.;hat win Ix: the
relationship between the implied work/loan expectations and estiw~ted family contrit~:i
The preceding section descrihed two methods that could be used by policy ~akers
to decide what a tolerable amount of work/loan expectation is. This section
will use the "hours of work" method to establish a criterion for assessing whet~er
the current array of subsidy programs is resulting in "reasonab1e" i~o1ied ~~rk/1can
expectations for MSG/Sch recipients. To determine the position of ~SG/Sch rectpie~ts
relative to this criterion, information will then be presented describing the esti-
mated* size of the implied work/loan expectations .that wcuid have faced MSG/Sch
recipients in 1976-77 if the 1977-78 coordinat1on strategy had b~n 1n etfect then.
In addition, this section will examine the relationship between t.~e
implied work/loan expectations and estimated family contribution.
A. Assessment Criterion
Since, as noted earlier, research by financial aid officers is in general
agreement that up to 15 hours of work a week has no significant acverse
effect on a student's scholastic performance, fifteen hours will be a;cepted
as a reasonable and tolerable weekly contnitment to expect of students. From Table 4 one observes that a \976-77 student who worked Bn 1vera9e cf 15 hour:; a week for 48 weeks at an hourly wage between $2.15 and $2.75- "WOu1d have ~liz~ an after tax 1ncome ranging from approx1~~tely Sl.~50 to $1,e:~ a year.
*The estimates of implied work/loan expectations presented in this sect1cn are based on data gathered during the Fa11 of 1~77 by the Denartnent of Finance. The data consisted of information on t~e components of the a1d pacf of nearlv 5,E"-'1 financially needy students 1n 95 Minnesota institutions of pos. ondary ec~cation during the 1976-77 school year. ~
•ia1'"l"I~ 'fe•~~r"'II-: l'"iin~.,,,,m ~~,,~~ -<n 1C7h ....,.,..c;, ~, ?11/h~·HJ~! ~.~~~C/hr_,tJ,'(" '\r, 197'"'/;. ~rre ~2.,$/'r .. cu·r ~~;,
... (..
a. The Position of MSG/Sch Recipients Relative to the Assessment Criterion
How r.any MSG/Sch recipients are facing yearly work/loan expectations
in the Sl,S0-1850 range? Before presenting infonnation that will answer
this ~uest1on. some observations about the complexity of estimating expected
fAmily contributions and student budgets are 1n order.
1. Estimates of Family Contribution
The estimates of expected family contribution used in the analysis that
follows are based on a methodology jointly derived by the Jlrner1can College
Test1ng Service (ACTS) and the College Entrance Examination Board (CEEB).
This system, in brief, uses infonnation on a family's 1ncome and assets.
taxes. parent's age. num~er of children, and any unusual-unescapable ex
p~ns~~ (l1ke ~edical bills) to assess the family's financial ahility to ccr.tr1b~te to a stu:ents' education. Consider1ng all these matters 1n deri,'rq an esti~atc of family contribution s~ems to he fair and just. But,
the prucess of taking each of these bits of infonnation on an 1ndiv1dual
f.-..m1ly and entering them into a system which outputs a number called "an
est1:::ated family contribution" is an exceedingly complicated process that
sw.e familfes will claim 1s not "fair" for their individual circumstances.
While this paper will not include an exhaustive discussion of
the ;,~thcds ACTS or CEEB use in deriving family contribution estimates,
suffice 1t to say r.cw that the process is hased on both value judr,ements
abcut how far.1111es shculd allocate their resources and on rigorously con-
d .. cted sti;dies of how families have traditionally actually allocated those
resources. It is a process that, for better or worse, tends to be geared
to the average family at each different level of financial strength.
Given this, one could reasonably expect that half the families will prob
ably Cetr.?lain that th~ expectations are too high, while the other half will
accept the estf~~tes as reasonable or too small. For the purposes of public
policy, the latter group is not a problem. The fonner group, however, 1s a
problei:: and should probably be divided into two subgroups: l) those who
have leg1t1mate reasons for complaining; and 2) those who could afford the
contribution but place less value on educatfon than on some nonessential
""-~
f· .. !
t
i.
i\•
~
·•,
.L)
item of expenditure. Ch2~ges in the needs analysis system that co~id ma~e
it more equitable for those 1n the first subgroup should be exar.inec •
But. how to satisfy the second subgroup. while at the same tf .. ~
. maintaining in the system commitment to certain traditional va1ues
fs indeed perplexing.
For the analysis that follows, it will be assumed that the estirr4tes of
family contribution that emerge from the ACTS-CEEB needs ar.a1ysis syst~
are, for the average family at any particular level of estirr~ted
contribution, realistic estimates of what a family can in fact co~tri~wte.
families who either cannot contribute these amounts or do not wa~t to.
this paper can only point out that the analytic sch~e prcpcsed here-
1n suggests basing an assessment criterion onlv on the a~~unt that
could be earned from a reasonable number of hours cf work. It t~es nc~
propose basing the size of the assessment crit~ricn en both l} the a""cunt
that could be earned from a reasonable number of hours cf work ~2) ar.
amount which ff borrowed would yeild loan reDayi:ents t~at are reascna~1e
in relation to the student's post-graduation expected income. This was
purposely done so as to provide some flexibility for those students \\'t:ose
parents contributed less than the estimated amount and who wou1d thus like
ly have to rely on both work and loans 1n orcer to meet the1r college ex~
penses.
2. Estimates of Student Budgets
Currently, the budgets used by the Higher Education Coord1nat1n9 Soard in
detennining the size of grant awards include the following ite."".s:
a. Tuition and fees;
b. A miscellaneous expense allowance of S400; and
c. For students who are living in college or university housing, the amount of the room and board char~es; or for stucents who are not living in college or university housfng. a roor:i and board a1lo,,;ance of $1,100.
Some financial aids officers and HECB staff have ind1cated to the author
of this paper the opinion that both the off-campus room and boarc allowance
and the miscellaneous expense allowance used by HECB are too sma11.
---.--::-
for
- ,•-~ ... '~-,,.1....,.,.,.,_,_..,. ...,, _._.,.-a..,·• 1.,•a.•~ .... -.... ~~ ... _,.,,~~ ..r., ... .. ,. __ 1fy.,1~·----.. .• ¼,.~,--........... ..1
J,'-{
~1th regard to the level of the mfscellaneous expense al10~1ance, figures
fran the CEEB 1ndicate that the average miscellaneous expense allowance
for the 1978-79 school year was around $800*. However. it should be point•
ed Out that this average was not computed for a fixed "market-basket" of
expense fter.:s considered minimally necessary for student maintenance.
Policy ,r.alcers. therefore. should be cautious 1n accepting this figure as
an est1~ate of minimal student needs for these expenses and should. 1n
arriving at the amount of this allowance, not simply focus on what average
student expenditures in this category are. Instead. they should first de
c1<!e what r.:1nimum "market basket" of services or items should comprise
thts categor1, ther. estimate their costs. Such an endeavor is not. however, ·
cor.s1cered to be wfthin the scope of this paper. So, the approach used be
low will ·be to presi?nt analyses w1th three alternative levels of miscellan
eous ex~ense allowance: 1) the current $400 allowance; 2) CEEB's estimate
cf the national average, S800, and 3) a value between these two, $600.
Estii::ates of room and board allo~1ances for off-campus students in the anal
ysis that fellows WP.re derived 1n the following manner:
a. Fer students attending 1nst1tut1ons with dormitories, the room and board allc.,.ance for all students was set equal to the donnitory room and beard charges;"and
b. For stu~ents attending 1nst1tutfons without student housing. the room anc! bcarc! a 11 er,.-ance was set eo_ua 1 to the approximate average donnitory rvc..i c:nc board char0e for those institutions having donnitories. This wa: about Sl.300 fer the 1976-77.school year and will be about $1,400 for the 1972-79 school year.
3. !:rp11ed ~orr./Loan Expectations Facing r~SG/Sch Recipients
Having discussed two caveats s1gn1f1cant in any consideration of implied
work/loan expectations, the paper will now address the mafn question of
thfs section, that 1s, "how many MSG/Sch recipients are facing implied
wcrk/loar. expectations less than or greater than the previously derived
assessr.~nt criterion range of $1450 to $1850 a year?
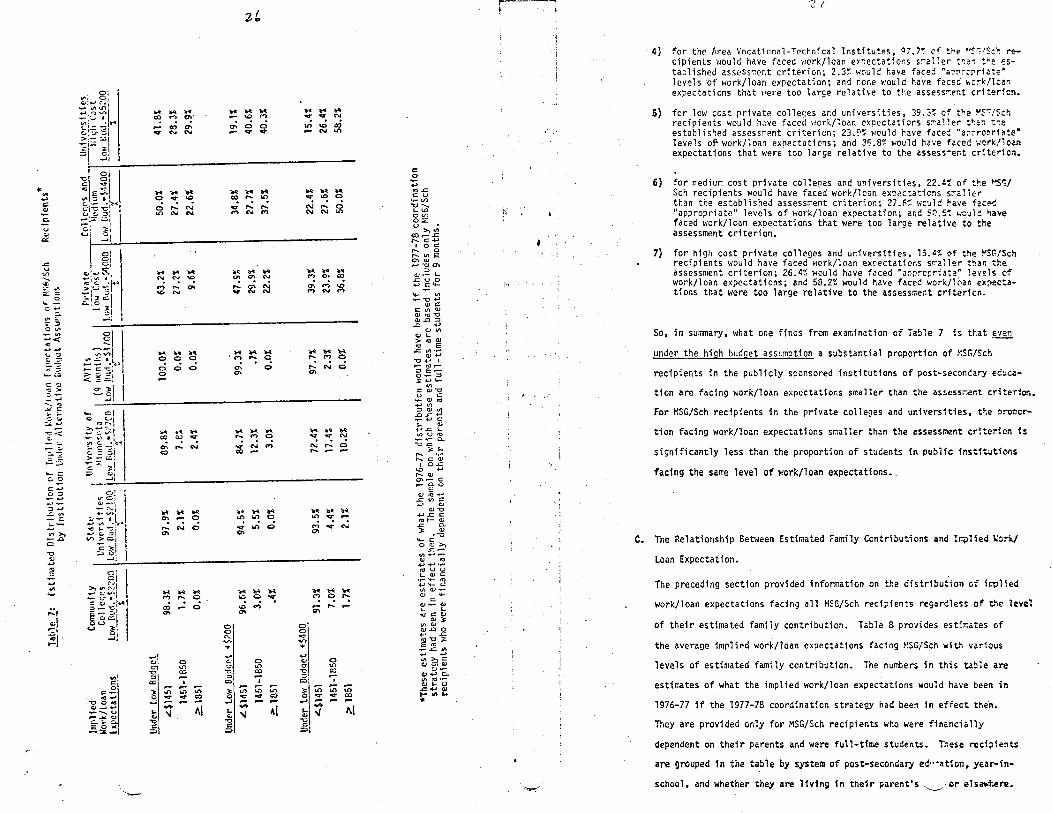
Ta~ie 7 shows the estimated distribution of implied work/loan expectations
that would have faced MSG/;ch recipients in 1976-77 if the 1977-78 award
forr-.ula had been in effect then. Recall that implied work/loan expectation
is defined as:
Irr.p11ed W/L Expec • Budget - F.C. - Total Grant Aid
•:r.for.-~fion o~tafnl!(., te1cphone conversation w1th staff of Washfn~ton Off1ce of errs. ,___,
~~;;.,..-.,~
___;)
:~~
t
I
·i
'1
·-'l
~
'~--~ ....... y •,·'-'-'' ·,__, •. .1J:· ·--.. , .. , ... 'I '''l••..i--,- ... - .
Z.5
Estimates of the distribution of implied work/loan expectations are Dre
sented by system under three alternative assu"'pt1ons about the ievel of the
miscellaneous expense allowance. The distribution 1s shown for three size_
categories of implied work/loan expectations: l) 1ess than Sl.(51;
2) $1,451 to $1,850; and 3) greater than or equal to $1,851.
Now, what does the information in Table 7 tell us. To make the disc~ssion
brief, attention will be given only to the d1strfbution inplied by the high
level of budget (i.e •• that with an $800 miscellaneous expense a11C\o':ance}.
This appears on Table 7 under the heading "Low Rudget ?1us ~in0••.
The infonnation in this table suggests that if the 1977-78 coorcir.ation
strategy had been in effect in 1976-77:
1) 91.3% of the MSG/Sch recipients in the State's Cornunity Colleces wc:.;ld have faced work/loan expectations s~aller than t~e esta~lis~e~ assessment criterion. 71 would have faced "appronrfatett levels of work/Joan expectation; and about 1.7: may have faced wcrk/loan expectations that were too large relative to the assess~ent criterion. ·
2) for the State Universities, 93.5~ of the MSG/Sch recioier.ts woulc have faced work/loan exrectaticns smaller than the esta~lis~ed assess~en: criterion; 4.4% would have faced "appropriate" levels of work/lean expectation and about 2.1% would have faced work/loan expectations that were too large relative to the assess~ent criterion.
3) for the University of Minnesota, 72.4~ of the MSG/Sch recipients wou1d have faced work/loan expectations s~aller than the esta~lishec assess-• ment criterion; 17.4,: wou1d have faced "aporo;-,riate" levels cf \.iork:/ loan expectation; and about 10.2% would have faced work/loan ex,ectat1or.s that were too large relative to the assessment criterion.
*The actual values of the low budget are shown at the top of the coli#.n each system, just below the system name.
'~
:--
;
· ... ... C:
~
u ::.I
a:.
.&: u
::'.?. ~ .... ~2 c~
~~ ~~ -'<C :; .... u r:.i
t~ X::; ..... ~
,:J -:: > =-_; _, -~-:, -"':: ... -C,"' :;:a,;..,
~< t., - :.. ~-; = = -=-.... :: co C:--'
~-3 _, .... ::::: _, .c. .... - :: z-..., >, -~ C
"'O
.::: 1 _. ..., .... ~, :;I ::! .
Oi .,..I c, G,.I ..., C'.J
...-,v,l.l")
~;C~r-• ~!~] -,= .::, ~ :::I c,
..JI
"t:;1 gl ,:;: ~ -:i ..,. -..,.,. v, ~ • I '"',- -~ .. ~~5·
:::•:::;: '-=-I C ~I
{,.) .S! o' c' . cl
c.,i..,i~'
~;~ ... ,' .... >IU~ ~l::r~! c;...'.o
_. ~I -'•
-~I ~~~ ::: ~~~~ ~ ~~i
°' ):I -s 'o 2l1 ..,,.._ ~--~ ... ...., C v~ - \,1 I V'I c.. •.¢~
t § 5i .;: i: ~i C 3:.
=:, o, ..... , ol <rOl i..i-
:: ;);1 r..,- = l ~ti( ~~C:.t
5 sl -':
o! ~I
>,"' N ......, c,;v,-.,... C" • ::: "' •t""'
~::;::: -g
oc::. u
V ):
.31
.,,~, 0 c:,a _,
"O O C. ~ ....... .... -.....u --e.i c..:.. ,!;~~I
-
.... lO'k ...
~ '; C7! ,- co a, "'1" N N
.......... ~~~ 0 ,.._ N l.n N N
~ "lr't ~
~ ~ "'! C""I ,._ en \0 N
~ ._.. ~" 0 0 0 C) C) C) ~
1r't ... _... c:o co ..,. a, ,._ N c:o
""lr't ~ a, ,... 0
,-.. N 0 a-.
~ 1t'I. ~ ("') .... 0
CO ~ 0 a,
! ~ -0 a:; .... CC I .... ,... -.,... .. ") .,...
"'7" ..,. co ..J ~ ... ,j "O C: ~
i,
......... - ,Q C"')
~ C) C) ,_..,...,.
.......... ~ "; ~ ..,. ,.._ ,.._ C"') NP>
~ 1t'I. ...
~ °! ~ ,-.. C\ N ..,- N N
_-z,.q ~" 'M ,.._ 0
0 0 N ,V,
-t"
+-' C".J 0 -0 ::,
'° ):: 0
m · o a-.
1,4' l,-1< ~ ,-.. M 0
"'7" NM cc
11~ ~ lr'I l,l') U') 0
.;. ~ C) O'I
1t'I. 11"'1 ~ "° 0..,. '° M • O'I
0 .,... c:o
' ,- .- ,... .,... I,() Ln 'C" ..,. c:o
_, ,- ... r-- 4( t "' -0 C: ;,
~'I ... l,'t ,q- "'1" N
\n \0 ai N l.n
lr'I ... ... ..,. \0 0
Nro:O N N 11'1
0 0 "'1" .,... -+-
1t'I. "lr't 1t'I. C"') 0\ c:o ~ M \.0 C"') NC"')
~ ... 1t'I. ,._ M 0
r--: N C O'I
~ ~ .. ~ .. ~ ~ ~ N f' 0 .... ,... ...
... 'a-It~ Ir) ..,.
M ¢ N 0\
N "b-'t 1t'I. "!~"'; ,... ....... Q\
i 0
.r, -0 a:i ::; .... co ' .... .- ,... '3: Ln ~ &.n 0 'Ct" ..:" CO -' r- ,.. r-
t ✓ /\I ""Ci C: ;,
C: 0
~ IQ .c C: u
.... (/l
"'0-..... I,... I.D 0 V) o:;: u • co~~ ,..._ C: .µ
' 0 C: ,.._ 0 ,._ VI E 0\ w ,- -0 C"I
::, w.- I,... .CU 0 +-' :: .... '6- .. ,.... V1
.... -0 +-' (I) C:
,:;: Vl (I) w ro -o w .0::, .0 +-'
(I) VI w I-> ,0 w IQ E .c V, .,...
CIJ+-' -0 +-' I ,- ro ..::, E.-0•..--::, .. ~ ..... C: w -0 0 C:
..- w r<I +-' Vl
~1 !I ..- +-' ,:;: I- (I) +-' .c I,... VI U It!
.,.... •r- a. "O .c:
:-:.: s.... ,..._ ..... ,..._,:: w
I o..:: I.D +-' ,..._ QJ
0\ .... C: .... 0.. 0
E <IJ ra +-'
..c: fl) C: +-' (I)
(I) -0 .µ .c C: It! I- (I) .c 0.. ): QJ
• "O '4-C: 0 (I)>,
.c .... VI+-',(I) ra +>+-'•rmu u E: W C •r '+- ,0 +-' 4- C: va a, .,... w .....
C Q) .,.... GJ I,... I,... <U C: Cl)
(I) 3:: VI (I) (l)..Q 0 ..... .c ra -o 3:: E ra
.,,.... .c 1/'t +-' +-'
~ ~~ QJ•.
(1) +-' a. v-. ro .,.. (I) '- u .c .... (I) t-111 ..
"'
I·•
',~·
·1 ! i
"2
· 4) for the Area Vocational-Technical Institutes, ()7.7'{. cf tl--e "Sr; 1Sc~ recipients would have faced work/loan expectations sraller t~a~ the established assessment criterion; 2.3~ would have faced "a~rrcrriate~ levels -Of work/loan expectation; and none would have faced hork/lcan expectations that l'lei·e too large relative to the assessi-:er.t criterfcn.
5) for low cost private colleges and universities, 39.3: of the ~S~/Sch recipients would have faced work/loan expectations s~aller t~an t~e established assessment criterion; 23.9~ would have faced nar~rc~riate• levels of work/loan expectations; and 36.B~ would have faced wcrk/loan expectat1ons that were too large relative to the assess~ent criterion.
6) for medium cost private colleges and universities, 22.t";; of the ~--S'i/ Sch recipients would have faced work/loan exo2cta~ions s~alier than the established assessment criterion;·21.F~ would ~ave faced "appropriate" lP.vels of work/loan expectation, and SQ.5~ 1-.-0:.ld 1-iave faced work/loan exoectations that were too laroe relative to the assessment criterion. .
7) for high cost private colleges and universities, 15.t~ of the ~SG/Sch recipients would have faced work/loan exnectations s~a1ler than the assessment criterion, 26.4: would have faced "apprcpriate• levels cf work/loan expectations, and 58.2% would have faced work/loan ex~ectations that were too large relative to the assessme~t crftericn.
So, in sunmary, what one finds from examination of Tab1e 7 is that~
under the high hudaet assumotion a sub~tantial proportion of ~SG/Sch
recipients in the publicly sponsored institutions of post-secondary ecuca
tion are facing work/loan expectations smaller than the assessner.t criterion.
For MSG/Sch recipients in the private colleges and universities. t~e ~roccr
tion facing work/loan expectations smaller than the assessment critericn is
significantly less than the proportion of students in public insti~ticr.s
facing the same level of work/loan expectations •.
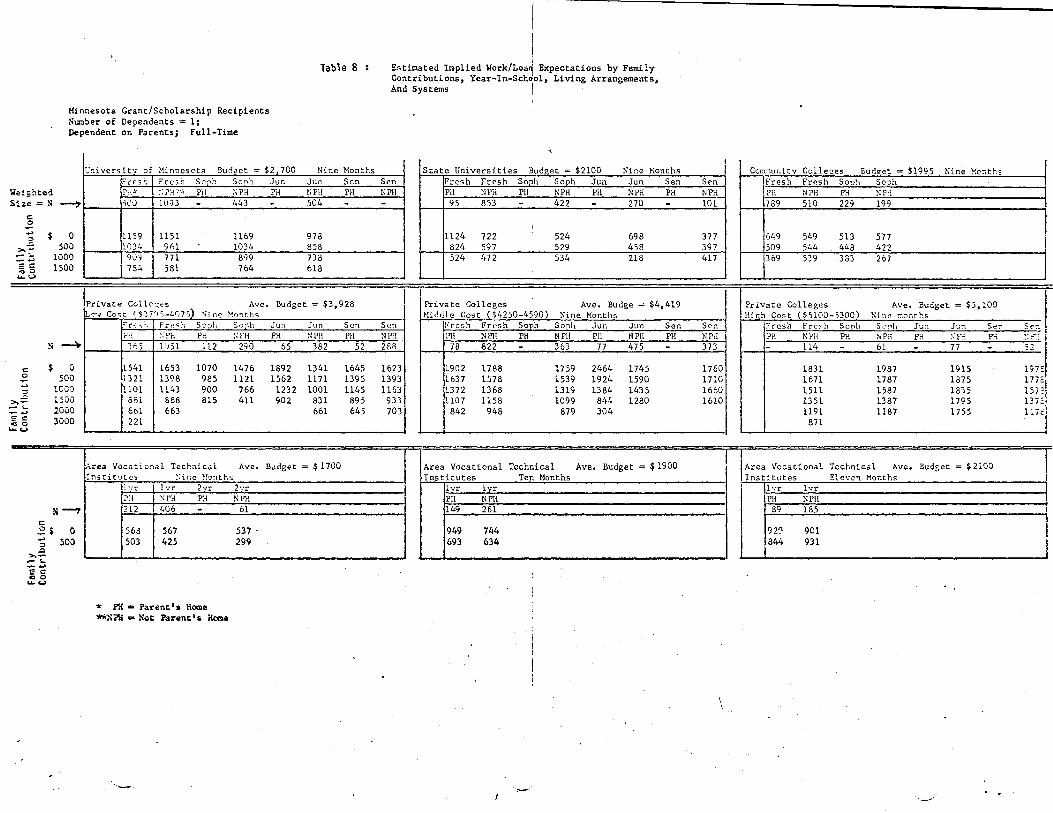
C. The Relationship Between Estimated Family Contributions and I~1ied York/
Loan Expectation.
The preceding section provided infonnation on the distribution cf iC"9lied
work/loan expectations facing all MSG/Sch recipients regarc1ess of the level
of their estimated family contribution. Table 8 provides estirr.ates of
the average implied work/loan expectations facing ~'.SG/Sch w1th various
levels of estimated family contribution. The numbers in this table are
estimates of what the implied work/loan expectations would have been in
1976-77 if the 1977-78 coordination strategy had been in effect then.
They are provided only for MSG/Sch recipients who were f1nancia11y
dependent on their parents and were full-time students. These recipients
are grouped 1n the table by system of post-secondary ed1·--at1on. year-in
school, and whether they are living fn their parent's . .__,.."or elsewhere.

... 0
For any particular 1evel of esti~ated family contrihution, an estimate of
the i~plied work/loan expectation is presented in Table 8 only if 5% or
more of the students 1n a group are at or above that level of estimated
fa~ily contribution. In addition, readers should keep in mind that ill est1~ates oresented in thfs table are based on the low budget assumption
(1.e., a mi~cellaneous expense allowance of $400). Estimates of implied
work/lean expectations under the middle level budget assumption would be
fc~nd by sf~ply add1ng $200 to each of the figures shewn in the table.
S1~ilarly, esti~4tes of implied work/loan expectations under the high bud
get assu~ption would be found by adding $400 to each of the figures shown
1n the table.
Whiie this paper will not discuss the information shown in this table for
each grou? separately, it will consider one group in detail so as to clarify
for the reader how the table should be interpreted.
Ccr.sider the first group of grant recipients shown 1n the University of
Minnesota section of the table. These grant recipients are freshmen who
are living 1n their parent's home. The samplfng and weighting procedures
used in ana1yzing the data vield an estimate of BOn grant recipients in·
this group fer those branches of the University of Minnesota returning
useable 1nfom.at1on. For this group of grant recipients:
1} those with esti~ated fa~ily contributions of Sn facP.d a work/loan ex• pectatfon of Sl,159 under the low budget assumption•;
2) those with esti~ated fa~ily contributions of $5no faced a work/loan e~rectot1on of Sl,034 under the low budget assumption•;
3) those with esti~ated fa~ily contribution of !1,0~0 faced a work/loan expectation of S9~9 under the low budget assumption•; and
4) these with esti~ated family ccntrihut1ons of $1,5~0 faced a work/loan expectation of 5784 under the low budget assumption*.
Readers interested in any other specific category of students should refer
to the tab1e. The following general observations, though, apply to most of
the gro1.:,s cf stud•=mts shown in the table:
1) After considering grant aid frO!ll all sources going to MSG/Sch recipients; the i~plir.d wor~/loan expectation is found to be greater for the grant recipient with the s~aller esti~ated fam11.Y contribution.
2) Fer a oarticular 1evel of family contribution, there is a positive relation t-et-,.,een the irr:p 11 ed work/loan expectation and the budget faced by the Stt,;CCnt.
3) There is no consistent relationship between imolied work/loan expectation ar.d either year-in-school or living arrange~ents.
~;~e low bu~;et a· -,tion uses a S400 miscellaneous expense allowance. Under the ~~~~~e le1e1 b~, JiS~mption • which uses a $600 miscellaneous expense allowance, t~~ i~~li~d work,..._.,n e~pcct~tion would be S200 greater. Under the high level budget ass~~1ot1on, which us.cs .rn SHOO miscelhneous. expense allcwoncc, the implied work/101.1n
• -_ :- ~ ' -- ·, • , rT h ~ 't -! r'!!"'i r..,,. ~'!I, ..... F' ..:i....,
i
I
;·
. I
: '
..
•
. '
,,
--
Minnesota Grant/Scholarship Recipients Nu..iber of Dependents= l; Dependent on Parents; Full-Time
Universitv of Minnesota Bu,foct = $2,700
'".leighted Siz.e = N --,.
C 0 ..., ::i
>.:e -~ _..., ~g i....U
$ 0 500
1000 1500
";"-rf' s !'". r::·:: ~00
1159 l•'}J!.
90·~
754
fre:;h S0:1h Sonh jun ~: PH·.':·:, Pt! ~;pf{ PH 1013 - 443 -
1151 1169 %1 1034 771 899 581 764
Table 8 :
Nine Months Jun Sen NP!l PH 504 -
978 858 738 618
Private Collc-:;es Ave. Budget= $3,928 IL~.,. Co-=.t ($",7'15-407',) 'iin~ Mrrnths
s~
i:::: $ 0 0 500 ...,
lCO•J
»= 1500
=z 2000 EC 3000 ,,::i 0 •U
N--'7 i::::
~$ a ..., ::i .0
:':'-:'" _..., EC 400 ~u
500
-;-r•: :.,f: frr,sh So::ih ?;, ::PH PH 365 1U51 112
1541 1653 1070 1321 1398 985 1101 1143 900 o~l 688 815 661 663 221
~rea Vocational Technical !nstit'.ltcs ~Ji r.c MQnths
1·:r lvr 2vr :':l :--PH PH 212 406 -568 567 503 425
* PH= Parent's Hoa.e ..wr~PH • Not Parent'& Home
-·
So:-,h Jun Jun Sen :,;rn PH NPH PH
290 65 382 52
1476 1892 1341 1645 1121 1562 1171 1395 766 1232 1001 1145 411 902 831 895
661 645
Ave. Budget = $ 1700
2vr NPH
61
537 · 299
Estimated Implied Work/Loa1 Expectations by Family Contributions, Year-In-School, Living Arrangements, And Systems \
State Universities Budget= $2100 Nine Months Sen Fresh Fresh Sooh Sooh Jun Jun Sen NPH PH NPH Pl! NPH PH NPH PH
- 95 853 - 422 - 270 -I
1124 722 524 698 824 597 529 458 524 472 534 218
I Private Colleges Ave. Budge= $4,419 I Middle Cost ($4250-4590) Nine Months
Sen Fresh Fn•sh Sot>h Sonh Jun Jun Sen NPII Pl! NPH PH NPH PH NPH PH 288 78 822 - 363 77 475 -1623 1902 1788 1759 2464 1745 1393 1637 1578 1539 1924 1590 1163 1372 1368 1319 1384 1435 933 1107 1158 1099 844 1280 703 842 948 879 304
Area Vocational Technical Ave. Budget = $ 1900 Institutes Ten Months
lvr lyr PH NPH 149 261
949 744 693 634
-.~
Cor.irnunitv ColleQes Budget= $19'15 Nine Xor;.ths Sen Fresh Fresh Soph Soah NPH PH NPH PH t:P:l 101 789 510 229 199
377 649 549 513 577 397 509 544 448 422 417 369 539 383 267
Private Colleges Ave. Budget= $5,100 Hit:?h Cost ($5100-5300) Nine r:io;--,ths
Sen fresh r·rc:-h Sonh Sorih Jun Ju:-1 Sen -e:-: NPH PH NPH PH };P,1 PH ~;f~ P:"1 ~ ~
373 - 114 - 61 - 77 - ,:.
1760 1831 1987 1915 197 1710 1671 1787 1875 177 1660 1511 1587 1335 157 1610 1351 1387 1795 137
1191 1187 1755 117 871
Area Vocational Technical Ave. Budget= $2100 I Instit:.utes Eleven. Months I
lvr lvr l PH NPH ! 89 185 '
92? 901 I 844 931 I
I
's._/
c).9
YI. The Costs/Savings From Alternative Grant Award Fonnulas for the MSG/Sch Program
In the preceding analysis, three basic problems were discussed:
1) Work/loan expectations for grant recipients with higher estimated family
contributions were smaller than the work/loan expectations of grant recipients
with 10'/l/er estf~~ted family contributions.
2) Many ~SG/Sch recipients 1n both public and private institutions were facing
work/loan expectations that were too low relative to an objectively derived
assess~ent criterion.
3) The formulas would, 1n the past, have provided built-in incentives for
private 1nstftut1ons to raise their charges. Such incentives are probably not
present now for the XSG/Sch program because the size of the maximum award
has not changed since the beginning of the program. But if this maximum 1s
raised, an incentive to raise charges above nonnal inflationary increases
"WGuld be present.
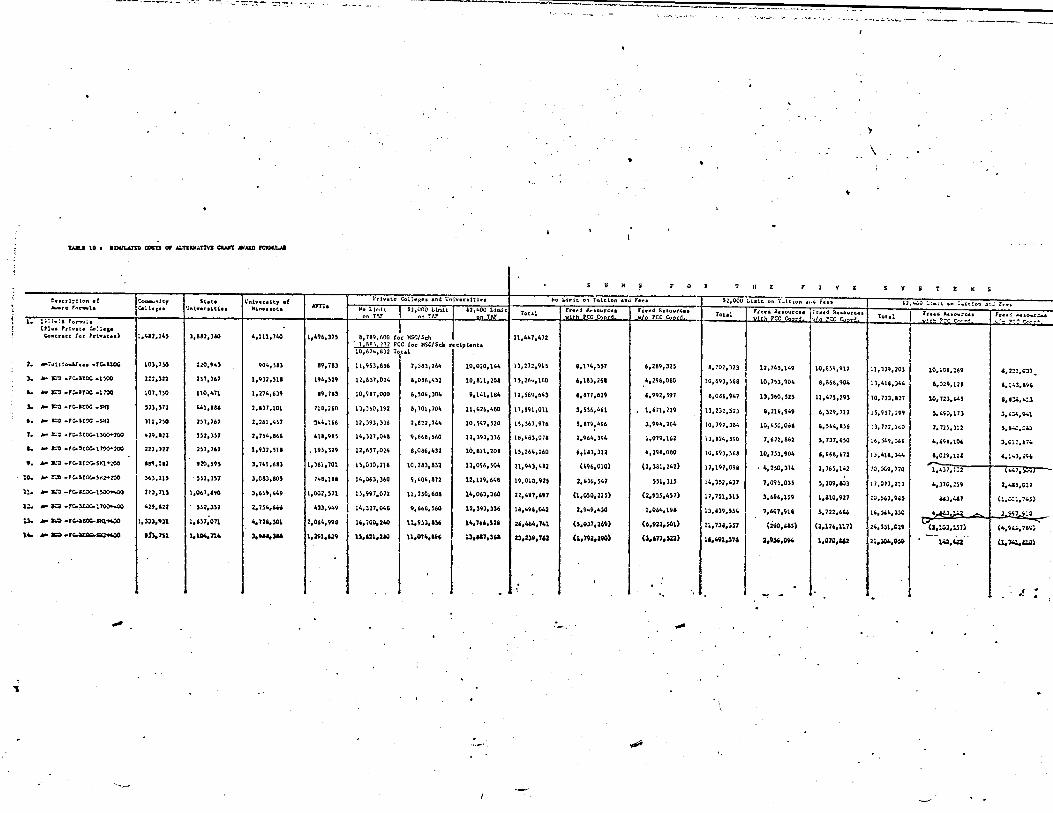
The ~ur?o~e of this section is to present alternative award formulas for the
~G/~ch prcgrar. that would eliminate these problems. Each alternative will be
brief1y ~escribed and an estimate of its cost will be presented. In the discus
sion that foliows. emphasis will only be on the total costs implied by each
alterr.at1ve. ?.eaders who are specifically interested in how any particular
post-secor.dary system fares under each alternative should refer to Table 10
fer this infonr~tion. Proprietary and health-hospital schools are excluded from
the analysis because of inadequate data. The cost figures apply only to the
~nivers1ty cf Hin~esota, the State universities. the Community Colleges, the
AVTis and the private colleges.
A. Alternative Grant Award Policies
Th1s section wfll provide estfmates*of the costs of several alternative
grant award po11cies fn F.Y. 78. For each alternative, two cost estimates
will be given. One will estimate the cost of the alternative with sub
traction fr0t:1 the student's budget of the total amount of the payment
mace tc ~r1vate colleges under the Private College Contract program for_
1'0'•17 -These esti~~tes were developed from a,sarnple of MSG/Sch recipients and not
a1l 77-78 act· ~ecipients. Therefore, the estimates provided of costs should te-vfewed only_ iugh approx1matfons. --
i-i
!··
t I
-~
'"''?,
MSG/Sch recipients. The other will estimate the cost of the alternative
without any reduction 1n the grant of a student atten~ing an institution
eligible to participate in the Private College Contract prcgra,~ (PCC).
1} Alternative
Alternative l is the formula used 1n FY78 • The dollar a..~1.-nts
shown for this alternative are the preliminary dollars a~arded in
fiscal year 1978 for the Minnesota State Scholarship Progra~. the
State Grant Program, and the Private College Contract Prcgra!!l ~ayr,.Ecr.ts
made for MSG/Sch recipients. The costs for these prograir:s for the
five systems shown on the table was $21,447,472 1n F.Y. 78 {of which
$1,885,232 was for Private College Contract Program
made for MSG/Sch recipients).
2) Alternative 2
pa.)'lr.ents
In alternative 2, the amount of the aware is based only on tuition
and fee charges. Specifically, the amount of the award would be
detennined by subtracting both the estimated family contributions and
the amount of the BEOG from tuition and fees. Living expenses and
miscellaneous expenses are not included in tr.e bud£ets used to detcn:nne
the amount of this award, so, in effect, these expenses represer.-;
the work/loan expectation. Not including these expenses could be
justified since examination of the estimates of lh·ing expenses used
by-HECB for resident sti.;dents* shows t.riat they are very si:::i1ar in
amount to many of the work/loan expectations derived by the •Hours
of work" method.
Three variations on this general award fonnu1a are presented in Table
10. One would set no upper limit on the tuition and fees recognized
by the grant award system. The total F.Y. 78 cost of this option
for the five post-secondary systems considered would have been ap
proximately $8.2 million less than the F.Y. 78 cormiitments for beth
the current MSG/Sch program and the Private College Contract Program
payments for MSG/Sch recipients. Without coordination with the PCC
program, the cost would have been S6.3 million less thar. the F.Y. 78
commitme11ts for both programs.
*Dormitory room and board charges ranged between $1,100 and $1,650 per year in the 1977-78 school year. So, these charges, plus a rnisce11aneo~s expense allowance between $400 - $600 would yield an estiu~te of living expenses ranging between $1,500 and $2,250.
)
\ ..
'tlJ:.I 10 1 IJX.'l.,UG Cl0n3 0, Ai.TIIII..TlW c:u,rr MIIMJ l'OIUCILAI
s u " ~ F 0 R T II E r I V it s y ' T z i,; s : .. ,t.rl;-tlo., •! St•t• Cntvor• lt7 of rrivatc C:OlleR~• and Univer1itle1 tio l.imit on Tuition and feca $2.000 L.imit on I':.it-.on 411i,U ices $2,~ :..:c.ir. ~n : .. t~!o:::. ,1:-;.; i~•• C-.•tt7
AVTlo JirwaTC:. Tnt"9U,lA c.11., •• 1;1\lver1lti•• Hinne1ot1 ~o Limit $2,000 Ll10it $2,•00 LillLit Total Freed P.e1ourc•a Vrccd P.c1ourca• Total 1recQ i.esourc•• freed a ... owru•
Total 1t••'- a. •owi-cc1 Fre•!. Ui-G-..r~ on T..._, O" TIJ' "" T~ '"''" PCC r ___ , vlh PCC r ___ , •.•• c "'"C r~-~-' ~, n l'CC ,.. ___ ,
uf,-\- 'P~C r,..,.. .. ,. •. , ... ,:-,-r-_,..,-.,.Jo 1. :;:7.;4 Tor"TU•• I I (P!w.1 , .. ~••t• Co: ~•I• Co•t.r•c~ for Pri••t••> ;,4U,14S ),682,3&0 4,111,740 1,496,375 8,789,600 Car MSC/Sch 21,447,472
~ PCC tor IISC/Sch redplanta 10,61•,8)2 Total
2. .--:-w.!c.to...s.r ••• -rc.&:OG 10),HO 220,9 .. ) 904,SU 89,783 11 0 953,856 7,383,264 10,020,144 ll,272,9U e,111o,sn 6,289,JU 8,702,323 12,745,149 10,U9, 917 ll,ll9,20l 10, lCl,269 ,.223,Cl7. :,. .. ,:,., .rc-noc -noo 222,JZZ 2H,167 l,9J2,HI 194,529 12,657,024 a,OB6,4J2 10,au,201 B,26,,160 ,, 183,268 4,298,060 10,693,568 10, 7SJ,904 8,i68,904 1),41&,)44 1,029, 12& l,l4l,a~ .. .- J;::> .r:,.lt.:X: •1700 107,750 110,,.,1 1,274,6)9 19,783 10,987,000 6,504,JOlt 9,141,l< 12,569,64) 1,&77,829 6,992,597 8,086,947 ll,l60,S2S 11,475,293 10,723,127 10, 723,64S 1,1::.i,4:,) ,. .- llt-:1 •FC..ltOC •SIil S33,S72 441,1&6 2,137,101 718,260 13, )60, 192 a, 101,104 11,426,480 17,891,011 ,, 556,461 , 1,671,229 ll,2l2,S2l 8,214,949 6, )29, 717 IS,9H,299 S,4SJ,17l l.l.:-4.~t •• .- J:.:D •fC-ltOC •!.112 )11,2~ 257,767 2,261,4)7 ~44,166 12,393,))6 7,822, 74,. 10,547,520 l S,567,976 S,179~496 J,994, 264 ID,997,Ja4 10,450,0i& i, 564, IS6 ll, 772,160 7,725,312 s.~.::~ 1 • .,. ::.:~ -rc.-?toc-1~00 •~.•n SS2,357 2,754,866 418,985 14,)27,048 .. ,~68,560 12,J9l,336 18,483,071 2,964,394 1,079,162 13,824,590 7,622,882 S,737,00 1,, S49,l66 4,iYl,1°' >.~i=.u. a. .. J:.1) .,c.noc..i,oo-+200 222,lll 2H,l6J l,932,nl : 195,529 12,657,024 1,086,4)2 10,111,201 15,264,160 6,181,312 4,298,080 10,693,568 10, 75),904 1,668,672 I J,41&,l44 -~029,12' ,.~-l•P' t. .- S:ll •1C.l[C<".,.Sl(1+200 199,211 920,SU l,741,Ul 1,361,701 n,oJo,216 10,28),832 13,096,504 21,94),482 H96,0l0) (2,JSl,242) 17,197,091 • 4,250,374 2,365,142 10,0C9,770 1,4l7, 7u2 (4.47,:,,;,;,i ~
10. ,,_ t;;ii •TC:-SE(X;.SK;t+:t,O )6),215 · SSZ,lS7 3,0aJ,80S 748,188 14,063,360 9,404,172 12,129,648 19,0l0,92S 2,4)6,547 SSl,lU 14,352,437 7,095,0lS S,209,110) 17,017,2.> 4,370,259 2, •. u,021 n. ,,. a::i-rc-1E-X-1~ 110,1u 1,067,&90 l,6591 449 1,002,571 15,997.072 11, 2500688 14,063,360 22,497,697 (1,oso,22s> (2,935,457) l7 1 7Sl,JU 3,696,159 l,il0,927 ~0,S6l,HS Ul,4&7 (l,C.::!, 7,;.~) 1: • .- Jw -~=1~ 429,122 · SS2,3S7 2,n,.,,_. 43::1,949 14,327,04& 9,668,560 12,393,336 18,4~&,042 2,9i.9,00 1,064,191 l3,i39,H4 7,607,911 s,122,,u 16,~,llO 4,.Ul.:....2 - 2.,;,;;_,;::1
(6,922,SOl) (zc;o,..as) '-•h •• 0:1,un ----u.. ,. )11:.1 .rc;..uo;..51il-KQO 1,lll,t>l 1,,n,011 •.n,,,01 2,064,991 16,700,240 U,9Sl,115' 14,766,521 26,ltM>,741 0,037,269) 2l,7li,lS7 (2,11,,111) 21o,ss1,c:, (4,9~,7i'i, d.>,1:n u.111.su (1,792,290) C>,,11,saa> --- ·-l~ .-a;;,.r~~ i,104,n4 30 911,lll 1,391,629 u,121,aao U,074,19' 2),2:1907'2 li,491,371 2,9.si,094 1,01;;,au 21,:,o.r.,o~ 1.U,4;ta U.74J...~)
... ! 4 - '• - "'
,,,,, ,,,,,
,
.,,;Ir
31
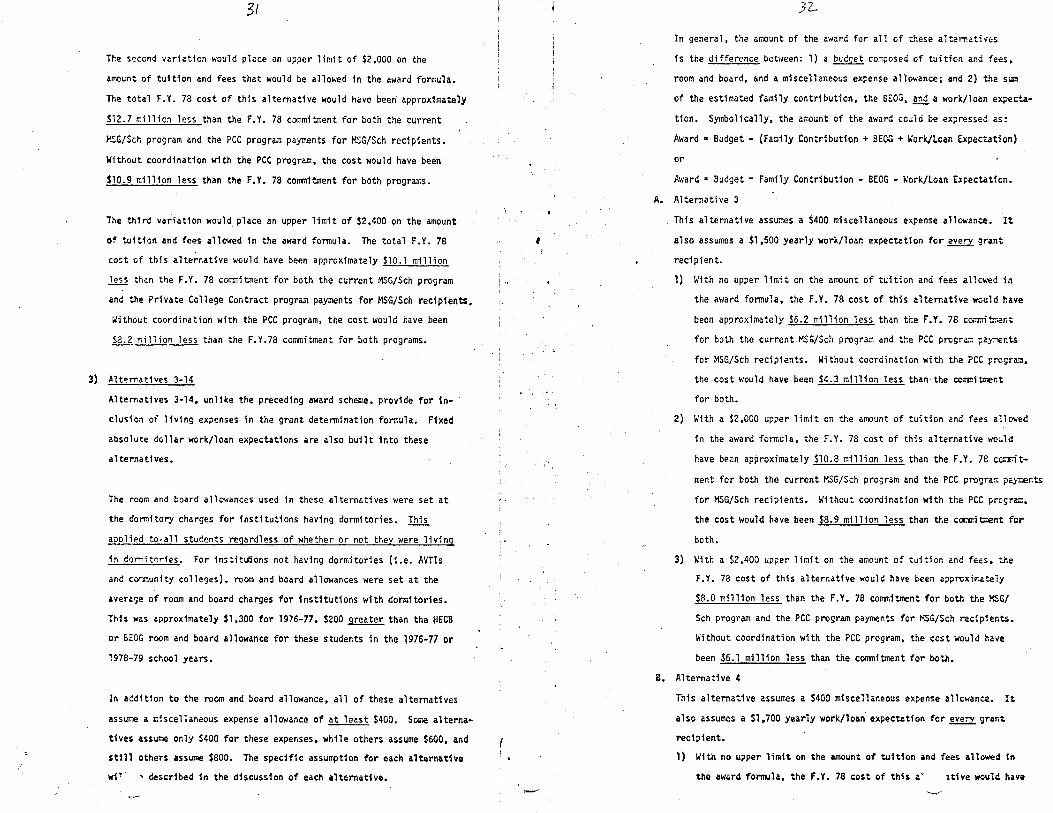
The second var1at1on would place an upper limit of $2,000 on the
arrw:li;nt of tu1t1on and fees that would be allowed 1n the award formula.
The total F.Y. 78 cost of th1s alternative would have been approximately
$12.7 million less than the F.Y. 78 commitment for both the current
~SG/Sch program and the PCC program payments for MSG/Sch recipients.
Without coord1nat1on with the PCC program, the cost would have been
$10.9 m1111on less than the F.Y. 78 co111Tiitment for both programs.
The third variation would_ place an upper limit of $2,400 on the amount
of tu1t1on and fees allowed in the award formula. The total F.Y. 78
co~t cf this alternative would have been approximately $10.l million
~ than the F.Y. 78 co1m1it~ent for both the current MSG/Sch program
and the Private College Contract program payments for MSG/Sch recipients.
Without coordination with the PCC program, the cost would have been
$3.2 mi11ion. less than the F.Y.78 commitment for both programs.
3) .41ti?rnat1ves 3-14
Alternatives 3-14, unlike the preceding award scheme, provide for 1n
c1us1cn of 11v1ng expenses in the grant determination formula. Fixed
absolute dollar work/loan expectations are also built into these
a1ternat1ves.
ihe room and board allowances used 1n these alternatives were set at
the donnitory charges for institutions having dormitories. This
apolied to-all students regardless of whether or not they were living
in domitories. For 1nstitlilons not having dormitories (i.e. AVTis
and cor.T.1unity colleges), room and board allowances were set at the
average of room and board charges for fnst1tutions with dormitories.
Thfs was approximately $1,300 for 1976-77, $200 greater than the ~ECB
or B~OG room and board allowance for these students in the 1976-77 or
1978-79 school years.
In addition to the room and board allowance. all of these alternatives
assur.e a miscelianeous expense allowance of at least $400. Some alterna
tives assume only $400 for these expenses. wh11e others assume $600, and
st111 others assume $800. The specific assumption for each alternative
wf'- ~ described 1n the dfscuss1on of each alternative.
f
!.··
-
32-
In general, the amount of the award for all of these alternatives
'fs the difference bet1'leen: 1) a bud5et composed of tuition and fees,
room and board, and a miscellaneous expense allowance; and 2) the Sim!
of the estimated family contribution, the BEOG, and a work/loan expecta
tion. Symbolica11y, the amount cf the award couid be expressed as:
Award• Budget - (Family Contribution+ BEOG + work/Lean Expectation)
or
Award= Budget - Family Contribution - BEOG - Work/loan Expectation.
A. Alternative 3
This alternative assumes a $400 miscellaneous expense allowance. It
aiso assumes a $1,500 yearly work/loan expectation for~ grant
recipient.
_ 1) With no upper limit on the amount of tuition and fees allowed in
the award fonnu1a, the F.Y. 78 cost of this a1temative would have
been approximately $6.2 million less than the F.Y. 78 c~-rmit:T~nt
for both the current MSG/Sch program and tr.e PCC progr~u pay:-,er.ts
for MSG/Sch recipients. Without coordination with the PCC prograo.
the cost would have been $4.3 million less thanithe corrr.:itmer.t
for both.
2) With a $2,000 upper limit on the amount of tuition and fees a11o-..ed
in the award fonnula, the f.Y. 78 cost of this alternative would
have be~n approximately $10.8 million less than the F.Y. 78 cc.m.it
ment for both the current MSG/Sch program and the PCC progra~ paya::nts
for MSG/Sch recipients. Without coordination with the PCC prc~rac.
the cost would have been $8.9 million 1ess than the COli1llitI:lent fer
both.
3) With a $2,400 upper limit on the amount of tuition and fets, the
F.Y. 78 cost of this alternative would have been apprcxi~~te1y
$8.0 million less than the F.Y. 78 COIT1ll1tment for both the MSG/
Sch program and the PCC program payments for MSG/Sch recip1er.ts.
Without coordination with the PCC program, the cost would have
been $6.1 million less than the conrnitment for both.
B. Alternative 4
This altemat1ve assurr~s a $400 mfsce11aneous expense allowan~. It
also assumes a $1,700 yearly work/loan expectation for~ grant
recipient.
1) With no upper limit on the amount of tuition and fees allowed in
the award fonnula. the F.Y. 78 cost of this a• 1tive would have
---·
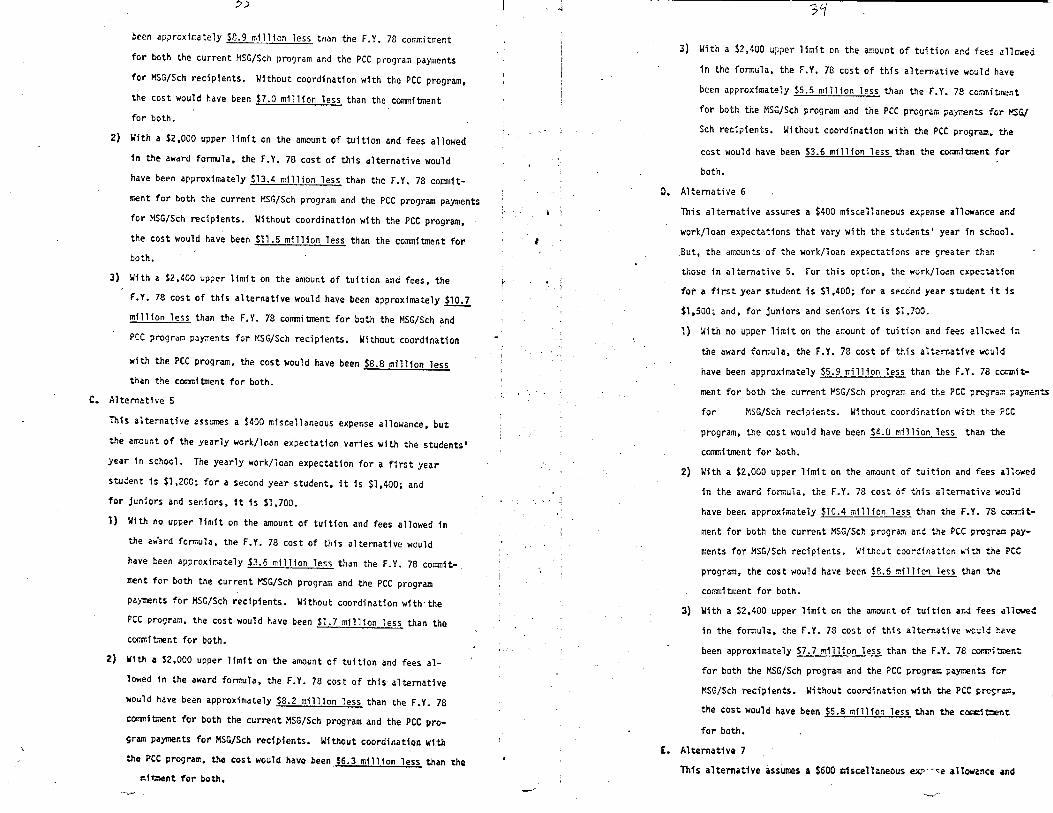
:J)
been approximately SPi.9 million less than the F.Y. 78 commitment
for both the current MSG/Sch pro~ram and the PCC program payments
for MSG/Sch recipients. Without coordination w1th the PCC program,
the cost would have been $7.0 m1111on less than the commitment
for both.
2) With a $2,000 upper limit on the amount of tuition and fees allowed
1n the award fonrula, the F.Y. 78 cost of th1s alternative would
have been approximately $13.4 million less than the F.Y. 78 comit
r.ent for both the current MSG/Sch program and the PCC program payments
for MSG/Sch recipients. Without coordination with the PCC program,
the cost would have been $11.5 million less than the commitment for
both.
3) With a S2 ,400 upper limit on the amount or" tuf tion and fees. the
F.Y. 78 cost of this alternative would have been approximately~
m1111on less than the F.Y. 78 corm,itment for both the MSG/Sch and
PCC progra~ pay;r.ents for MSG/Sch recipients. Without coordination
with the PCC program. the cost wou1d have been $8.8 million less
than the COlll'llitment for both.
C. Alternative 5
This alternative assumes a $400 miscellaneous expense allowance, but
the a~ount of the yearly work/loan expectation varies with the students'
year 1n school. The yearly work/loan expectation for a first year
student 1s $1,200; for a second year student, it is $1,400; and
for juniors and sen1ors. 1t is ·sl .700.
1) W1th no upper lfmft on the amount of tuition and fees allowed in
the award formula, the F.Y. 78 cost of this alternative would
have teen approxir.~tely $3.6 million less than the F.Y. 78 cormiit
ment for both the current MSG/Sch program and the PCC program
payments for MSG/Sch recipients. Without coordination with·the
PCC pro9ram, the cost would have been $1.7 million less than the
COIM',i tment for both.
2) With a $2.000 upper lfm1t on the amount of tuition and fees al
lowed 1n the award formula, the F.Y. 78 cost of this alternative
"-'Ould have been approximately $8.2 million less than the F.Y. 78
corrrnitment for both the current MSG/Sch program and the PCC pro
gram payments for MSG/Sch recipients. Without coordination w1.th
the PCC program. the cost would have been $6.3 million less than the
mf~nt for both.
• f
1··
\ .J
i
• I
_,,.,
'31
3) With a $2,400 Upper limit on the amount of tuition and fees al1cr«ed
1n the fonnula. the F.Y. 78 cost of this alternative woul~ have
been approximately S5.5 million less than the F.Y. 78 cor.rnitment
for both the MSG/Sch program and the PCC program pay;r.ents for 't'SG/
Sch rec1pients. Without coordination with the PCC program, the
cost would have been $3.6 million less than t.~e coi;initment for
both.
D. Alternative 6
This alternative assumes a $400 miscellaneous expense allowance and
work/loan expectations that vary with the students' year in school.
.But. the amounts of the work/loan expectations are greater than
those in alternative 5. For this option. the work/loan expectation
for a first year student is $1.400; for a second year student it 1s
$1,500, and, for juniors and seniors 1t is $1,700.
1) With no upper limit on the amount of tuition and fees al 1c-..-ed in
the award fonnula. the F.Y. 78 cost of t~is alternative would
have been approximately $5.9 million less than the F.Y. 78 ccar.it
ment for both the current MSG/Sch program and the PCC prcgra::: payr..cnts
for MSG/Sch recipients. Without coordination ~ith the ?CC
program, the cost would have been $4.0 million less than the
commitment for both.
2) With a $2.000 upper limit on the amount of tuition and fees a11o~ed
1n the award formula. the F.Y. 78 cost of this alternative wou1d
have been approximately $10.4 million less than the F.Y. 78 c.."11:r.it
ment for both the current MSG/Sch progra~ and the PCC progra::i pay
ments for MSG/Sch recipients. Without coordination with the ?CC
program. the cost would have been $8.6 million less than the
contnitment for both.
3) With a $2.400 upper limit en the amount of tuition and fees a11owed
in the fonnula, the F.Y. 78 cost of this alternative wculd have
been approximately $7.7 million less than the F.Y. 78 cor:r.,i~r.t
for both the MSG/Sch program and the PCC progran: payr.ients for
MSG/Sch recipients. Without coordination with tr.e PCC prcgra:..
the cost would have been $5.8 million less than the coom:it:nent
for both.
E. Alternative 7
This alternative assumes a $600 miscellaneous e~--·,:;e al1ow~nce ilnd
_....
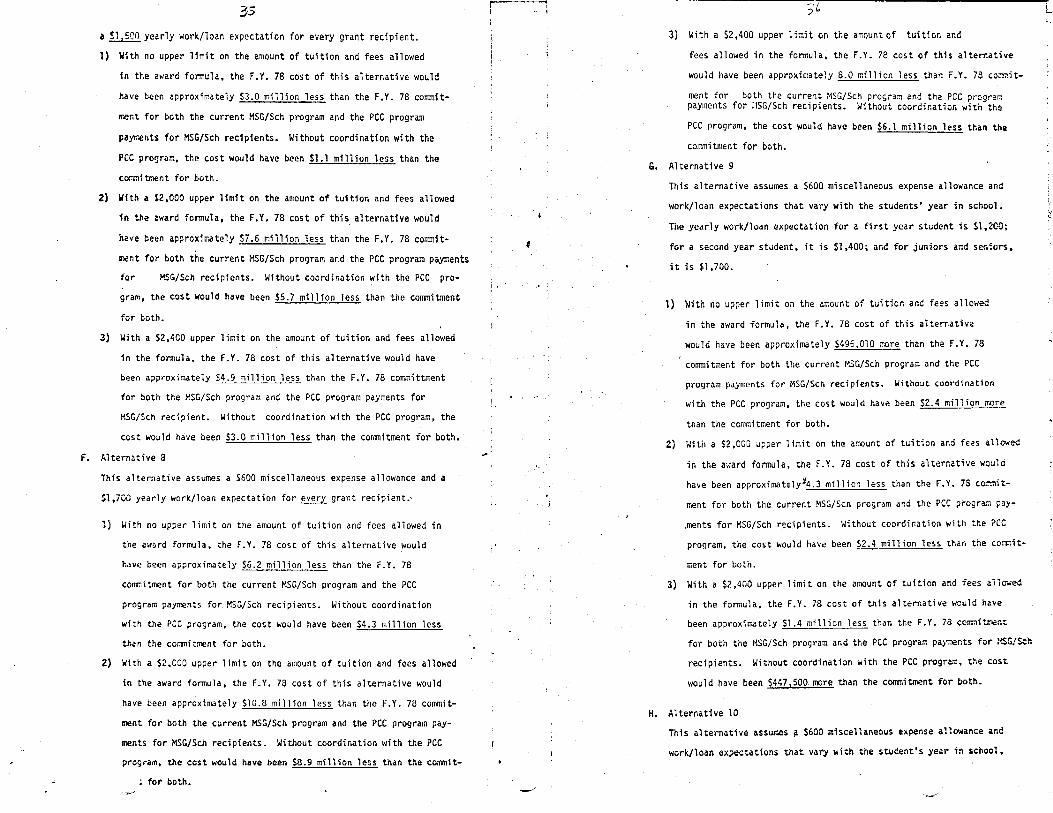
35
a S1 1500 yearly work/loan expectation for every grant recipient.
1) With no upper limit on the amount of tuition and fees allowed
fn the award formula. the F.Y. 78 cost of this alternative would
have been approximately S3.0 million less than the F.Y. 78 corranit
~~nt for both the current MSG/Sch program and the PCC program
payr.~nts for MSG/Sch recipients. Without coordination with the
PCC program, the cost would have been $1.1 million less than the
cor.rnftment for both.
2) With a $2,000 upper limit on the amount of tuition and fees allowed
1n the award formula, the F.Y. 78 cost of this alternative would
have been approxiw~tely S7.6 million less than the F.Y. 78 corranit
ment for both the current MSG/Sch program and the PCC program payments
for MSG/Sch recipients. Without coordination with the PCC pro
gram, the cost would have been SS.7 million less than the commitment
for both.
3) With a $2,400 upper limit on the amount of tuition and fees allowed
in the formula, the F.Y. 78 cost of this alternative would have
been approximately $4.9 million less than the F.Y. 78 committment
for both the MSG/Sch program and the PCC program payments for
HSG/Sch recipient. W"lthout coordination with the PCC program, the
cost would have been $3.0 million less than the conmitment for both.·
f. Alternative 8
This alternative assumes a $600 miscellaneous expense allowance and a
Sl ,700 yearly work/loan expectation for every grar.t recipient.-
1) ~ith no upper limit on the amount of tuition and fees allowed in
the award formula. the F.Y. 78 cost of this alternative would
have been approximately S6.2 million less t~an the F.Y. 78
cormitrrEnt for both the current MSG/Sch program and the PCC
program payments for MSG/Sch recipients. Without coordination
with the PCC program. the cost would have been $4.3 million less
than the cor.tnitment for both.
2) With a S2.000 upper limit on the amount of tuition and fees allowed
in the award formula, the F.Y. 78 cost of this alternative would
have been approximately $10.8 million less than the F.Y. 78 commit
ment for both the current MSG/Sch program and the PCC program pay
ments for MSG/Sch recipients. Without coordination with the PCC
program, the cost would have been $8.9 million less than the commit-
for both. ·.__,
.:·
__,,,
;
3) With a $2,400 upper 1imit on the amount of tuition and
fees a11owed in the fonnula. the F.Y. 78 cost of this alternative
would have been approximately 8.0 million less thar. F.Y. 78 co::-r::it
ment for both the current MSG/Sch program and the PCC prcgra.:: payments for ilSG/Sch recipients. Without coordination with the
PCC program. the cost would have been $6.1 million less than the
commitment for both.
G. Alternative 9
This alternative assumes a $600 miscellaneous expense allowance and
work/loan expectations that vary with the students' year in school.
The yearly work/loan expectation for a first year student is Sl,200;
for a second year student, it is $1,400, and for juniors and seniors.
it is $1,700.
1) With no upper limit on the amount of tuition and fees a11owed
in the award formula. the F.Y. 78 cost of this alternative
would have been approximately $496,010 rr~re than the F.Y. 78
commitment for both the current MSG/Sch program and the PCC
progr.:im payments for MSG/Sch recipients. Without coordination
with the PCC program, the cost would have been $2.4 mi11ion rr~re
than the commitment for both.
2) With a $2,000 upper limit on the amount of tuition and fees a11owed
in the a,,·ard formula. the f. Y. 78 cost of this a1ternative would
have been approximately:14.3 million less than the F.Y. 78 co::c.iit
ment for both the current MSG/Sch program and the PCC prograJ:1 pay
,ments for MSG/Sch recipients. Without coordination with ~he ?CC
program. the cost would have been $2.4 million less than the corrrnit
ment for both.
3) With a $2,400 upper limit on the amount of tuition and fees a11cwed
in the formula, the F.Y. 78 cost of this alternative would have
been approximately $1.4 million less than the F.Y. 78 coliI!lit~nt
for both the MSG/Sch program and the PCC program payments for :,,SGJSch
recipients. Without coordination with the PCC progr~~. the cost
would have been $447,500 more than the conmitment for both.
H. Alternative 10
This alternative assumes~ $600 miscellaneous expense allowance and
work/loan expectations that vary with the student's year in school.
--
L
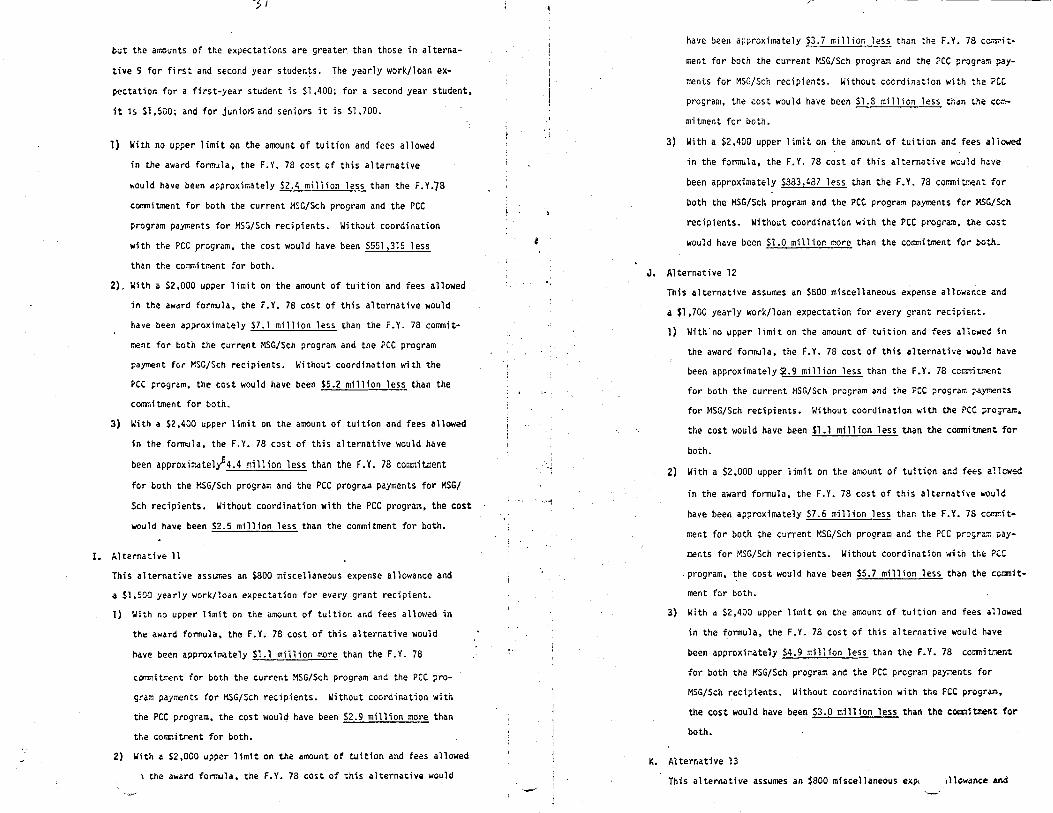
'i, I
but the arr.aunts of the expectations are greater than those in alterna
tive 9 for first and second year studen~s. The year1y work/1oan ex
pectation for a first-year student is $1,400~ for a second year student.
it is Sl ,500; and for juniorS and seniors it is $1,700.
1) With no upper limit on the amount of tuition and fees allowed
in the award formula, the F.Y. 78 cost of this alternative
would have been approximately S2.4 million less than the F.Y.78
corrmi tment for both the current MSG/Sch program and the PCC
program payments for MSG/Sch recipients. Without coordination
with the PCC program. the cost would have been $551,315 less
than the corrrnitw~nt for both.
2). With a $2,000 upper limit on the amount of tuition and fees allowed
in the award formula. the F.Y. 78 cost of this alternative would
have been approximately S7.1 million less than the F.Y. 78 collVllit
ment for both the current MSG/Sch program and the PCC program
payment for MSG/Sch recipients. Without coordination with the
PCC program, the cost would have been $5.2 million less than the
corrr:;itment for both.
3) With a $2,400 upper limit on the amount of tuition and fees allowed
in the formula, the F.Y. 78 cost of this alternative would have
been approximatel/'4.4 million less than the F.Y. 78 commitment
for both the MSG/Sch program and the PCC program payments for MSG/
Sch recipients. Without coordination with the PCC program, the cost
would have been S2.5 million less than the commitment for both.
I. Alternative 11
This alternative assumes an $800 miscellaneous expense allowance and
a Sl.500 yearly work/loan expectation for every grant recipient.
1) With no upper limit on the amount of tuition and fees allowed in
the award fonnula. the F.Y. 78 cost of this alternative would
have been approximately $1.1 million more than the F.Y. 78
corimitment for both the current MSG/Sch program and the PCC pro
gram paJrr~nts for MSG/Sch recipients. Without coordination with
the PCC program. the cost would have been $2.9 million more than
the colT'ITlitment for both.
2) With a S2.000 upper limit on the amount of tuition and fees al1owed
, the award formula, the F.Y. 78 cost of this alternative would
~ ---·
'~
,'i
..
., ;
-.·1
have been approximately $3.7 million less than the F.Y. 78 c~mit
ment for both the current MSG/Sch program and the ?CC program pay
ments for MSG/Sch recipients. Without coordination with the PCC
program, the cost would have been Sl.8 million less than the CC.7.-
mitment for both.
3) With a $2,400 upper limit on the amount of tuition and fees allowed
in the formula, the F. Y. 78 cost of this alternative wou1d ha•✓-e
been approximately $883,487 less than the F.Y. 78 corrrnit7~nt for
both the MSG/Sch program and the PCC program payments for MSG/Sch
recipients. Without coordination with the PCC progra.~. the cos:
would have been $1.0 million more than the cor.mitment for both.
J. Alternative 12
This alternative assumes an $800 miscellaneous expense allowance and
a $1,700 yearly work/loan expectation for every grant recipient.
1) With'no upper limit on the amount of tuition and fees allowed in
the award fonnula, the F.Y. 78 cost of this alternative would have
been approximately~.9 million less than the F.Y. 78 ccr.rnitment
for both the current MSG/Sch program and the PCC program payments
for MSG/Sch recipients. Without coordination with the PCC progra.r.::.
the cost would have been $1.1 million less than the coarnitrnent for
both.
2) With a $2,000 upper limit on the amount of tuition and fees a11cwed
in the award formula. the F.Y. 78 cost of this alternati,e would
have been approximately $7.6 million less than the F.Y. 78 c~it
ment for both the current MSG/Sch program and the PCC progra~ pay
ments for MSG/Sch recipients. Without coordination with the ?CC
. program. ~he cost would have been $5.7 million less than the corrrnit
ment for both.
3) With a $2,400 upper limit on the amount of tuition and fees a1lowed
in the formula. the F.Y. 78 cost of this alternative would have
been approximately $4.9 million less than the F.Y. 78 cor.mit-:-,ent
for both the MSG/Sch program and the PCC program payr.ients for
MSG/Sch recipients. Without coordination with the PCC program.
the cost would have been $3.0 million less than the cor.r.iit:nent for
both.
K. Alternative 13
This altern.itive assumes an $800 miscellaneous exp1 1llowance ar.d --..,.,
work/loan expectations that vary with the student's year in school,
The yearly work/loan expectation for a first year student is $1,200;
for a s~cond year student, it is $1,400; and for junior and seniors,
it is $1,700.
1) With no upper limit on the amount of tuition and fees allowed in
the award formula, the F.Y. 78 cost of this alternative would
have been approximately $5.0 million more than the F.Y. 78 commit
ment for both the current MSG/Sch program and the PCC program pay
ments for MSG/Sch recipients. Without coordination with the PCC
program, the cost would have been $6.9 million more than the commit
ment for both.
2) With a $2,000 upper limit on the amount of tuition and fees allowed
in the award formula, the F.Y. 78 cost of this alternative would
have been approximately $290,000 more than the F.Y. 78 commitment
for both the current MSG/Sch program and the PCC program payments
fer MSG/Sch recipients. Without coordination with the PCC Program,
the cost would have been $2.2 million more than the conmitment for
both.
3) With a $2,400 upper limit on the amount of tuition and fees allowed
in the formula, the F. Y. 78 cost of this alternative would have
been approxirr~tely $3.l million more than F.Y. 78 commitment for
both the MSG/Sch program and the PCC program payments for MSG/Sch
recipients. Without coordination with the PCC program, the cost
would have been $5.0 million more than the commitment for both.
L Alternative,14
This alternative assumes an $800 miscellaneous expense allowance and
work/loan expectations that vary with the student's year in school,
but the amounts of the expectations are greater than those in alterna
tive 13 for first and second year students. The work/loan expectation
for a first year student is $1,400; for a second year student, it is
Sl,500 and for juniors and seniors, it is $1,700.
1) With no upper limit on the amount of tuition and fees allowed in
the award fonnula, the F.Y. 78 cost of this alternative would have
been approxi~~tely $1.8 million more than the F.Y. 78 commitment for
both the current MSG/Sch program and the PCC program payments for
MSG/Sch recipients. Without coordination with the PCC program, the
~ would have been $3.7 million more than the commitment for both. -- _ _____,,,,
!··
1,
;·
,_,
2) With a $2,000 upper limit on the amount of tuition and fees allowed
in the award for,nula, the F.Y. 78 cost of this alternative wo~ld
have been approximately $3.0 million less than the F.Y. 78 cor:rnit
ment for both the current MSG/Sch program and the PCC program pay
ments for MSG/Sch recipients. Without coordination with the PCC
program, the cost would have been $1.1 million less than the co.'l'Cit-
ment for both.
3) With a $2,400 upper limit on the amount of tuition and fees allcwed
in the fonnula, the F.Y. 78 cost of this alternative would have
been approximately $143,000 less than the F.Y. 78 C()(miit11ent for
both the MSG/Sch program and the PCC program payments for KSG/Sch
recipients. Without coordination with the PCC program. the cost
would have been $1.7 million more than the collJllitrnent fer both.
8. Anticipated Criticism
In general, a11 of the a1ternatives described above are desigr.ed sc that
grant recipients in the same year of school face the same reasonab1e er
tolerable absolute do11ar work/loan expectation regardless of the ievel of
their families' estimated contribution. Critics of this apprcach wi11 11ke1y
focus their arguments on at least two issues: 1) the effects of the ~olicy
on access and choice; and 2) adverse incentives on families to not save.
l. Effects on Access and Choice
Since any discussion of the role of work or loans versus grant aid in
meeting the financial needs of students inevitab1y hinges on the
beliefs held by po1icy makers about student access or choice, it
seems appropriate to focus on these concepts in greater depth 9~
p,fcJ~fi,~!f;ti/",lf.§N.¥£\\M@!k$.lt%•;f#¥.t,1;1@?#~!~;@u:::twtG ~;n-c- ...
·-~~~~L;~~.~~'",,;·b"~~~g_,_~
The goal of access is said to be achieved if an education policy pro
vides any qualified student the option of attending at least cne in
stitution of post-secondary education. The goal of providing stucents
with choice is a little more complicated in that the atte~pt is to
give students the option of attending one of at least two (usually
differentially priced) institutions or systems. Discussion of both
-~
goals usually emphasizes that societal realization of both goals
requires that "financial constraints .•• within the limits of available
resources (should be) minimized"*.
The rec;uirement that "financial constraints .•. be minimized ..• with
in the limits of available resources" seems laudatory. But; such
vaguely stated requirements do not provide much help in deciding
what amounts of work/loan expectations could be built into an
award formula without creating intollerable burdens for the student
~ sacrificing other traditional values_(like the self-help ethic
which recognizes the importance to both the student and society of a
student's making, some reasonable personal sacrifices to attain his goals)
Some economists have tried to w~ve away from this vagueness by building·
econor.ietric models that purportedly can help policy makers decide what
a.-:-,ount of subsidy is needed for various income-ability groups in order
to increase their post-secondary participation rates. Such approaches
have two general weaknesses:
A} Nearly all of them may be severely faulted on both conceptual and
~~thodological grounds: 1} They too often focus only on economic
variables. 1gnor1ng certain attitudinal or value factors that
can be highly significant in explaining a student's matriculation
dec1sion. Failure to take account of these other factors is likely
to result in estimates of the effect of subs1dies on student at
tendance that are biased; 2} Their results are too often interpreted
to 1r.~ly that a $100 change in the subsidy amount will have the
sar.,e" 1rnpact on entrance rates 1 n a sys tern where a student faces
a high budget as in a system where the student faces a low budget;
and;3) They have generally not looked at the relation between
net charges (with financial aids) and attendance;
B) Even 1f the r:iethodological problems cited above could be overcome,
such econorr.etric approaches would be incapable of dealing with
such issues as:
- the i~portance policy makers may attach to maintenance of a
traditional value, like self-help; or
- the question of what amount of subsidies, which are paid for
1n part by taxes on those in society who have low incomes, should be
• nyde, w, 11,a, . 'Jr., "The Effect of Tuition and Financial Aid on Access and Choice tn Post-Sc-<:ona""Sr-y Education", Educ41tion Conm1s1.1on of tha States, 0onvcr, lll77, mimeo, ',_...-·
....
• J
'I
,,·i
provided to finance the education of students whos~ incomes after
completion of their education will be higher than~ of the
taxpayers who he1ped finance their education.
In point of fact, though some may claim ~ome alternatives sug~ested
above may lower the participation rates of some groups of students.
we know of no soundly designed studies that provide evidence su~gesting
with any reasonable degree of accuracy that this ~ill hap~en. But,
even if participatton rates could be known in advance to be red~ced
even though work/loan expectations were set at tolerable amounts, policy
makers would have to, in their own m1nds: 1) weigh the consequences of
this reduction against the consequences of sacrificing certain
traditional values; or 2) consider whether the change in participation
rates is a reflection of the worth attached by the student to the
education. Most of the alternatives above implicitly sug;est r..c-.eir,ent
toward more operationally defined notions of access and choice. These
definitions would embody the ideas that: any capable student wn1 be
able to enroll in any post-secondary institution that wi1l a~it r.i=
if he is willing to assume a tolerable or reasonable wor~/lcan burden.
2. Adverse Incentives for Family Savings Behavior
Some might argue that an award fonnula of the general type proposed
would "provide an incentive for the family to be profligate since t.1'1e
total amount of the estim~ted family contribution is counted as an
offset to the grant" or that such a policy "penalizes, or at least
does not reward, families who earn more or save their earnings.•
Suctfstatements indicate poor understanding of the financial r.eeds analysis
systems used to derive estimates of a family's expected contribution.
These statements would only have meaning if the grant award system
were such that the amount of the grant decreased by one do11ar fer an
additional dollar of family income or an add1tional do11ar of savi~cs/
assets. But, this is not what is being suggested in any of the a1~
ternat1ves, for the concept of estimated family cor.tribution is not
synonymous \llith either the concepts fam11y income or assets/savincs.
separately or 1n some comb1nat1on.
-·
Y3
Estimates of family contribution are derived by applying marginal
prcgressive "tax ratesM to a family's income and assets. Fer the
adverse 1ncent1ve arguments to have much merit, these tax rates would
have to be so high as to allow little or no marginal income or wealth
gain per additional dollar of incor.~ or assets. Examination of these
tax rates, however, reveals that they are far from such an into11erable
extreme; the ~~xi~um ~~rginal taxation rate on an additional dollar of
after tax inc~~e approaches, but is always less than 45%; s1milarily, the
~aximu:n ~~rginal taxation rate on assets approaches, but is always
less than (12%} x (47%} • 5.64%.* This means that for families with
only the hiahest incomes, a one dollar increase in after tax income
w111 ir:-t>ly an increase in the estf~~te of family contribution that
co~~s· close to, but will always be less than 47¢. Similarily, for families
well endowed with assets, a one dollar increase in the amount of assets
will result 1n an increase 1n the estimated family contribution that
C()r.';eS close to. but will always be less than 5.64¢. The individual
family will thus always be able to increase its net financial strengtt)
by earning an additional dollar or saving an additional dollar.
-The source of these estimates 1s the ACT Handbook for Financial Aid Ad:linfstrators. 1976-77 Processing Year, Chapter 2, pp. 9·20.
,.__,_,
,,
', __ ___,
.j y·
VII. How Will Individual Students Fare Under the Proposed Alternatives?
The preceding section presented information on the costs of various grant
award policies. This section will use several hypothetical students fro::i
families of different characteristics to show how the students will be
affected by those alternatives. The reader must keep in mind that the
students discussed in this section are only hypothetical cases- they are
not intended to be accepted as typical representatives in a strictly
proportionate sense of the students actually receiving Minnesota State
grants or Scholarships. If a more elaborate analysis is desired showing
the distribution of relevant characteristics among those students who
actually received MSG/Sch's. this analysis will have to be perfcrr.-~d by
the HECB. But. in the judgement of the author of this report. the infor
mation coming out of analysis of these hypothetical cases can be just as
valuable as a more detailed statistical profile of actual receipients for
the types of decisions that policy-makers will have to rr~ke.
Table 11 provides basic information used in deriving estimates of expected
· family contributions for each of 21 hypothetical first year students. A11
of the students in these examples are unmarried and financiaily depen~ent
on their parents. Both parents are living, ~~rried to one another, and
age 52. Other basic descriptive information on each student's family
provided in the table includes:
1) the number of children in the family;
2} the number of those children in collegei
3) the amount of the student's assets;
4) the amount of the parent's income;
5) the amount of the parent's home equity;
6) the net worth of the parent's farm or business; and
7) the amount of the parent's cash, checking. and savings acco~nts.
All of these items enter into detennination of the estimated fa~ily con
tributions. These estimates are shown in the middle section of tr.e table.
They were all derived by hand using the guidelines set up by the A::ierican
College Testing Service and the College Entrance Examination Board.
For each of the hypothetical first year students, the total grant a~~rd
from both the BEOG and MSG/Sch programs is shown for five different MSG/Sch
award fonnulas and for four different budget 1evels. The five alternative
award formulas are:
1) the current award formula; -/
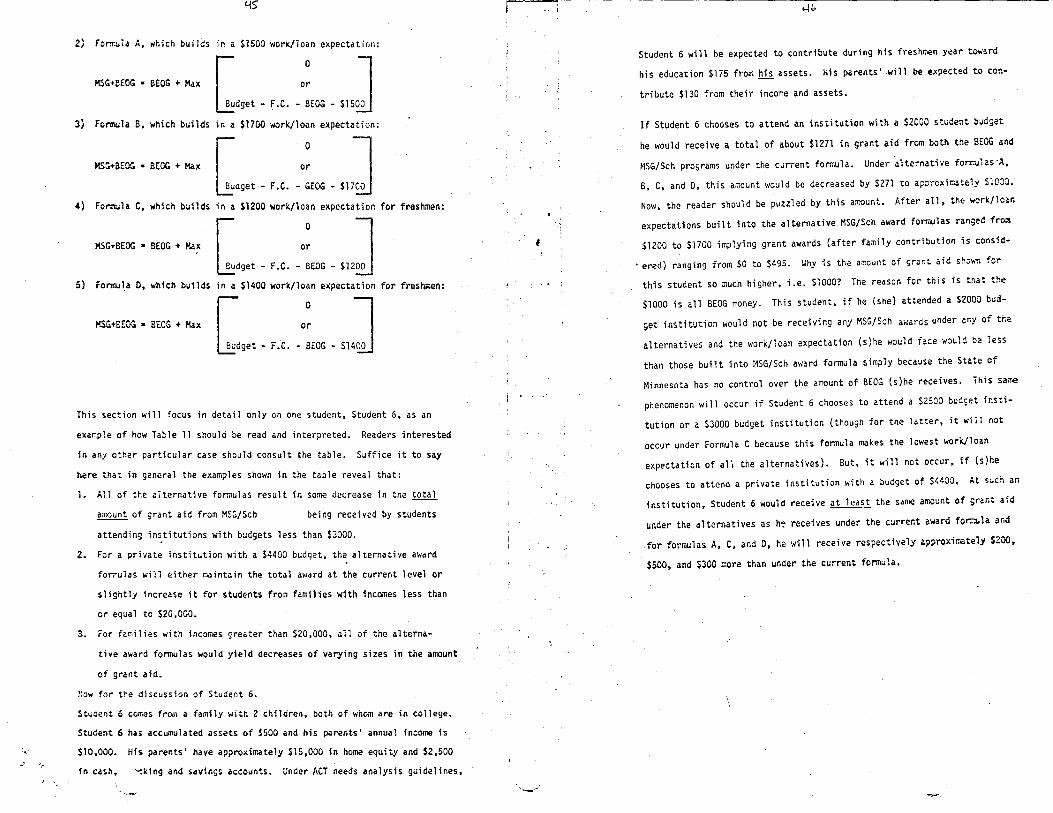
.,.-
'c
'-lS'
2) For.r:ula A, which builds in a $1500 work/loan expectation:
HSG+BEOG • BEOG + Max or [:
0 J dget - F.C. - BEOG - $1500
3} Formula B. which builds in a $1700 work/loan expectation:
MSG+BEOG • BEOG + Max or [:
0 J dget - F.C. - GEOG - $1700
4) For:nu1a c. which builds in a $1200 work/loan expectation for freshmen:
HSG+BEOG a BEOG + Max or [
0 J dget - F.C. - BEOG - $1200
5) Fonnu1a o. which builds in a $1400 work/loan expectation for freshmen:
[ 0 J HSG+BEOG a BEOG + Max or
dget - F.C. - BEOG - Sl400
This section will focus in detail only on one student, Student 6, as an
exar.~1e of how Table 11 should be read and interpreted. Readers interested
in any other particular case should consult the table. Suffice it to say
t.ere that in general the examples shown in the table reveal that:
l. All of the alternative fonnulas result in some decrease in the total
amount of grant aid from MSG/Sch being received by students
attending in~titutions with budgets less than $3000.
2. For a private institution with a $4400 budget, the alternative award
for"'IT'.ulas will either maintain the total award at the current level or
slightly increase it for students from families with incomes less than
er equal to S20,000.
3. For fa~ilies with incomes greater than $20,000, a11 of the alterna-
tive award formulas would yield decreases of varying sizes in the amount
of grant aid.
now for the discussion of Student 6.
St~dent 6 co~~s from a family with 2 children, both of whom are in college.
Student 6 has accumulated assets of $500 and his parents' annual income is
s10.ooo. His parents' have approximately $15,000 in home equity and $2,500
in cash, · 'd:1ng and savings accounts. Under ACT needs analysis guidelines.
-~ '.._r'
.... u.,
Student 6 will be expected to contribute during his freshmen year to..-~rd
his education $175 from his assets. His parents' will be expected to con
tribute $130 from their income and assets.
If Student 6 chooses to attend an institution with a $2000 student budget
he would receive a total of about $1271 in grant aid from both the BEOG and
MSG/Sch programs under the current formula. Under a1ternative fon:iu1as·A.
8, C, and D, this amount would be decreased by $271 to approxir.iate1y S10J0.
Now, the reader shou1d be puzzled by this amount. After all, the work/loan
expectations built into the alternative MSG/Sch award fonnulas ranged fro~
$1200 to $1700 implying grant awards (after family contribution is consid-
• ered) ranging from $0 to $495. Why is the amount of grant aid shown for
this student so much higher, i.e. $1000? The reason for this is that the
$1000 is all BEOG money. This student, if he (she) attended a S2000 bud
get institution would not be receiving any MSG/Sch awards under ar.y of the
alternatives and the work/loan expectation (s}he would face wou1d be 1ess
than those built into MSG/Sch award formula simply because the State of
Minnesota has no control over the amount of BEOG (s}he receives. ihis sa~,e
phenomenon will occur if Student 6 chooses to attend a $2500 buctset insti
tution or a $3000 budget institution (though for the latter, it ~111 not
occur under Formula C because this formula makes the lowest work/loan
expectation of a1i the alternatives). But, it will not occur, if (s}he
chooses to attend a private institution with a budget of $~400, At such an
institution, Student 6 would receive at least the same amount of grar.t aid
under the alternatives ash~ receives under the current award fol'"i.JUla and
.for formulas A, c. and D, he will receive respectively approximately $200,
$5000
and $300 more than under the current formula.
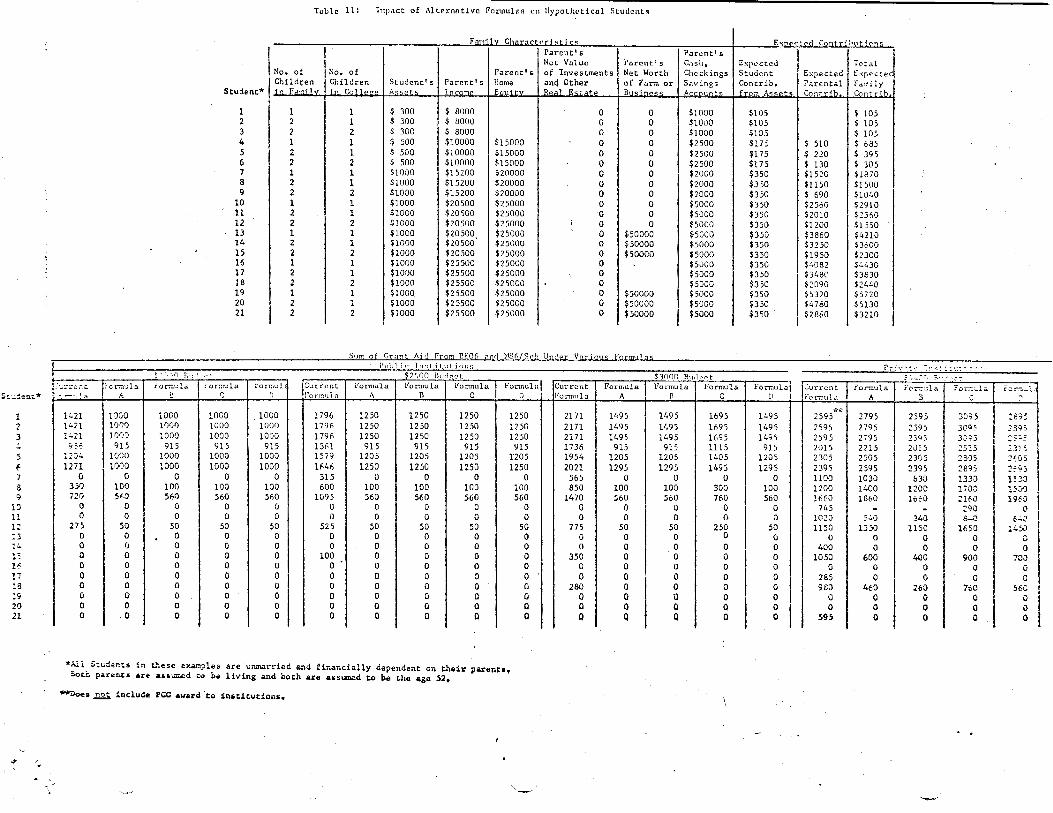
S:.:..:.tent.2
1 2 3 .:. 5 f. 7 8 9
10 11 12 13 14 13 p: 17 18 lS 20 21
., r..,
Tnblc 11: Impact of Altrrnntlvo Formulas on llypothctical Students
Parent's Pc.rent's I Casl1,
No. of I Parent's I of Investments I Net Worth Chcckings Children Children Student's Parent's Horne anq Other of Farm or Savings
Student* ,., F A I
l l l $ 300 $ 8000 0 0 $1000 2 2 1 $ 300 $ 8000 0 0 $1000 3 2 2 $ 300 $ 8000 0 0 $1000 4 l l $ 500 $10000 $15000 0 0 $2500 5 2 l $ 500 $10000 $15000 0 0 $2500 6 2 2 $ 500 $10000 $15000 0 0 $2500 7 1 1 $1000 $15200 $20000 0 0 $2000 8 2 1 $1000 $15200 $20000 0 0 $2000 9 2 2 $1000 $15200 $20000 0 0 $2000
10 l l $1000 $20500 $25000 0 0 $5000 11 2 l $1000 $20500 $25000 ·o 0 $5000 12 2 2 $1000 $20500 $25000 0 0 $5000 13 l l $1000 $20500_ $25000 0 $50000 $5000 14 2 l $1000 $20500 $25000 0 $50000 $5000 15 2 2 $1000 $20500 $25000 0 $50000 $5000 16 l 1 $1000 $25500 $25000 0 $5000 17 2 1 $1000 $25500 $25000 0 $5000 18 2 2 $1000 $25500 $25000 0 $5000 19 1 l $1000 $25500 $25000 0 $50000 $5000 20 2 l · $1000 $25500 $25000 0 $50000 $5000 21 2 2 $1000 $25500 $25000 0 $50000 $5000
Sum of Grant_ Ai<l From Ilr:Q_6___ililc\_~lS6_/_Sch Under V Fa P11l,]; c 111:;1:i t_11tio11s
' t~·.:-,{) ?.•: '-,,r-_ $;:>',00 ihrdr><'t s1r1nn R,1.i,,,,t 1-· .. --.-.- C :- cr.:11.;la c·o r.::u la :-or.:iula i'orn,1,:l. Curr,~nt i''ormula Formula Formula Fonnula Current Formula Formula Fonm.;la ~- ... _ ..---~, ;-, A t! r: n !"orm11l.1 A R C [)
1!.21 1000 1000 1000 1000 1796 1250 1250 1250 1250 1421 l'J')O 1001) 1000 100() 1796 1250 1250 1250 1250 1.::.21 1 O'):') 1000 1000 1000 1796 1250 1250 1250 1250
95-5 915 915 915 915 13€>1 915 915 915 915 12oi:. 1000 1000 1000 1000 1579 1205 1205 1205 1'205 1271 1000 1000 1000 1000 lf,41) 1250 1250 1250 1250
0 0 0 0 0 315 0 0 0 0 350 100 100 100 100 600 100 100 100 100 720 51,0 560 560 560 1095 560 560 560 560
0 0 0 0 0 0 0 0 0 0 0 0 0 0 0 0 0 0 0 0
275 50 50 50 50 525 50 50 50 50 0 0 0 0 0 0 0 0 0 0 0 0 0 0 0 0 0 0 0 0 0 0 0 0 0 100 0 0 0 0 0 0 0 0 0 0 • 0 0 0 0 0 0 0 0 0 0 0 0 0 0 0 0 0 0 0 0 0 0 a 0 0 0 0 0 0 a 0 0 a a 0 0 0 0 0 0 a a a a 0 0 0 0 0 0 0 0 0 0
*All Stud~nts in ~~ese exa.-:r;,les are·unmarried and financialty dependent o~ their puenta, :SOt.h p.r~r.ts ue assuz:-.ed to be living and both are assumed to be the age 52•
-OOea ~ include PCC award 'to institutions •
~ -/
FonTiula A IJ C
2171 1495 1495 1695 2171 1495 1495 1695 2171 1495 1495 1695 1736 915 915 1115 1954 1205 1205 1405 2021 1295 1295 1495
565 0 0 0 850 100 100 300
1470 560 560 760 0 0 0 0 0 0 0 0
775 50 50 250 0 0 0 0 0 0 0 0
350 0 0 0 0 0 0 0 0 0 0 0
280 0 a 0 a 0 Q 0 a 0 0 0 0 Q Q 0
F.~ll!:(°~~~1 Cs:1• t1:ib11t !£Il~
Expected I I Total Student Contrib
$105 $ 105 $105 $ 105 $105 $ 105 $175 S 510 $ 685 $175 S 220 $ 395 $175 $ 130 $ 305 $350 $1520 $1870 $350 $1150 $1500 $350, $ 690 $1040 $350 $2560 $2910 $350 $2010 $2360 $350 $1200 $1550 $350 $3860 $4210 $350 $3250 $3600 $350 $1950 $2300 $350 $.'.,082 $.'..430 $350 $3480 $3830 $350 $~090 $2440 $350 $5370 $5i20 $350 $4780 $5130 $350 $2860 $3210
r r i \ .. 1 ':. ... '! ~~ •':. ~ : : '.:: ~ :' - .-
:, -- -.- :- • _J ~ t' t
Formula Current Formula Fc:-::.·c:la Fo:--:-=.i-lo Fo:-:::·-1. [l Fo1-r.ml ,1 A '5 C :'
io"; 1495 2595 2795 2595 3095 :e9s 1'•95 2595 2795 2595 3005 2S95 1495 259 5 2795 2595 3::.:;5 :E:.:'
915 2015 2215 2015 2515 23':5 I 1205 2305 2505 2305 28.JS 2':05 1295 2395 2595 2395 2895 :::~-,5
0 1100 1030 630 133.> 1138 100 1200 1400 1200 liOO 1500 560 1660 1660 l6t:-0 :H,O l9EG
0 745 - - 290 i}
0 1020 s.:.o 340 s.;.o f,:.;}
50 1150 1350 1150 1650 g50 0 0 0 0 0 C 0 400 0 0 0 0 0 1050 600 400 900 70-0 0 0 0 0 0 0 0 285 0 0 0 0 0 980 460 260 760 56C l
0 0 0 0 0 0 I 0 0 0 0 0 0 a 595 0 0 a 0 l
--
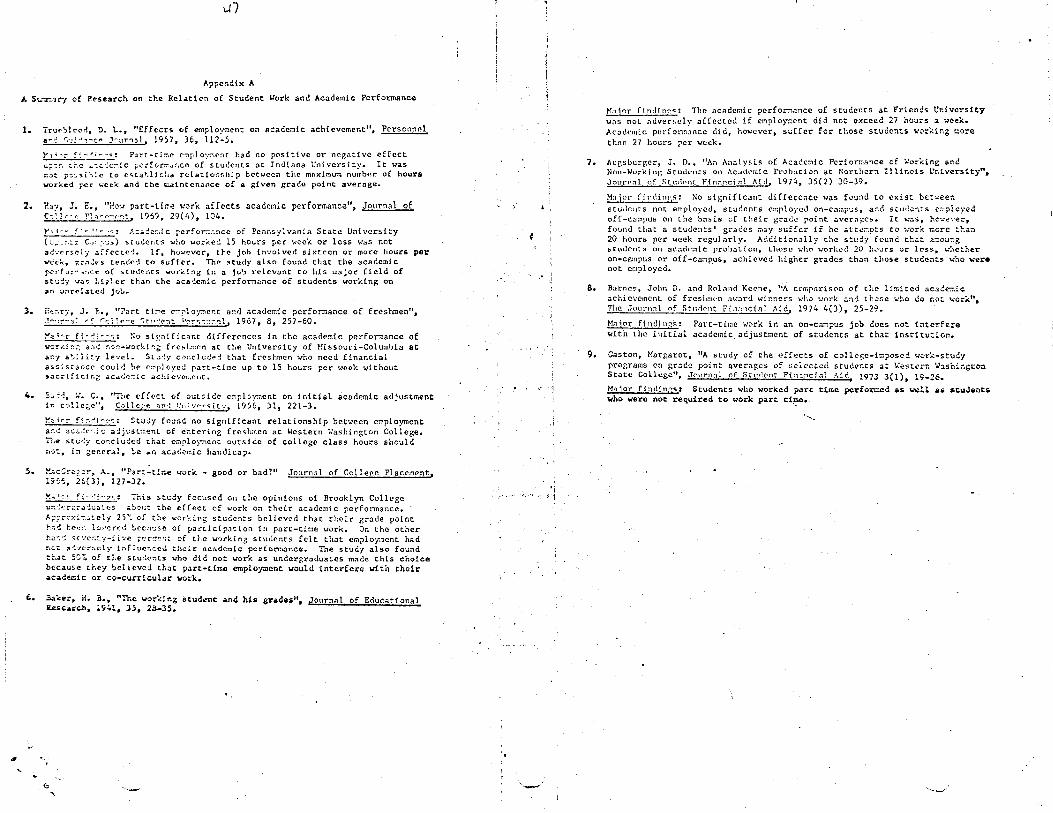
q
u7
Appendix A
A Si.:-.:.:-1r-1 c! P.escarch on the Rclat1c-n of Student 'Work and Academic Performance
'-
1. Tn;r!:>locd, !>. L., ''Effects of_employmcnt on academic achievement", Pcrsonnnl ~.-,:-: r.•J!·',~c,. J-\lr'.1~1 1957, 36, 112-5.
Y1;~r f:7••;-,-~: P.:irt-t:i'.':',C c:nr,loy:-,<'nt had no positive or negative effect u;::::-: tr.c w-:;;-~c:-.~c fCd'.c,r.:- •• ~,cc of students at Indiana University. It was not: pc'!.Si:-,!c to csta;.,li!::l,a rclat!.onr,hip bet·..,ccn the mnximum nutrhcr. of hour& wor~ed r~r ~eek and the r=intcnance of a given grade point average.
2. P.~:,, J. E., "i!o·.t part-Ur.~ work affects academic performance", Journal of C:~Jrcr, !'~;,-:-r--,r·c,~ 196'), 29(4), 104 •
y,;-- f'- ~'.- .. ,: Ac.;clc~,lc rerfc,r;;;;,nce of Pennsylvania State University ( •..:. ~ :.~.; C-,: ,.-.. s) st udc:nts wl.o wo::-~ec! 15 hours per week or less was not acl~crscly aff<'cted. If, howcv~r, the job involved sixteen or more hours per ,..eek. ;::-:1~<'s tenr.!e1 to suffer. The study also found that the academic p<:rfo:-;,r,ce of stuclc:-,ts working in a jv~.J relevant to his major [ield of sti..:!y wa~ l,i;l,er than the aca,.!cmic perform.-,ncc of students working on an unrelated Jo~.
3. r.€::-.r:,·, J. F:., "?art t!r,,e c-,:iplo:,7.ier.t and academic performance of freshmen", . !"c'l!"-,,l r: r-::),,,,c ';r .. -•,,:,~,: V,:,rr,'l'.1'."~l 1967, 8, 257-60.
l".:i 1 ·-r fi~-';---;: ::o si~:nific3nt differences in the academic performance of vo:-1:in;: an:! r.-:,:"J-workir.;; frcsh,;-;r.n at t!.e Un1ver51ty of HissouL·i-Columbia at ar.y a':,; l ity level. 5::u·l;• c,,r,ch.:dPd that ft·eshmen who nee<l financial asslscance could be ~~ployed ra::-t-time up to 15 hours per week without s~cri!1cfn~ aca~~~ic ach[ev~r~cnt.
4. E~=~, ~. C., ''TI,c effect of outside cmplop.ent on initial academic adjustment in c-:.llc,;e", Col1c;·e an,l !Jrii•:r•rsit·:, 1956, 31 1 221-3.
?-'.:; ir:- !'! ~.-'f-z~: Study found no significant relationship between employment a:-.tl ~cz..'.c:-:ic a:ljust:::ent of entcrine freo:;h:r.en at Western Washington College. 71.e stu,!y coc:cluclcd that cr:iploy:nent outside of college class hours should not, in general, ~e an aca~cmic handicap.
5. l"..;cC::-ez::-::-, A., "Par::~tir..e wori<. - good or bad?" Journal of College Placement, 1;~~. 26(3), !27-32.
~" •er ~i ~ ·!: :·;,,: This scudy focused on the opinions of Brooklyn College u::·~~=-s:-a:!'"a:.<;s ab-:lut the effect of work on their acaclcmfc performance. A~;rcxt~~cely 25t of the wcrk[ng students believed that their grade point h.;-:! b:•,,:: l~·,,~rc-! !:.N::i~-;e of participation in part-ti1:1c work. On the other r:.;·.-:! :-c·.·c:-::.y-fivt? ~cn~r.·,t cf tbe w-:,rking stuclents felt that employment had nc.;: a-:!·.rcr~cl:r ir,!lucr.ccd their ac:.dcralc perforr:i.:mcc. The study also found that :,Qi;. of tl.e students who did not \ol'Ork as undergra<luatc~ macle this choice because they believed that part•tirr.o employment would interfere with their acade::.ic or co-curricular work.
t.. ?...ker, H. B., "TI-,c wor~ing student and his grades1', Journal of Educational ite~~arc.~, .9~1, 35, 28-35.
' ~ '..___-..,
,. j
;i•
•: ·>-j.
., '--_.
7-
M;i jor fl ndl nr,o;: The academic performance of students at Friencs Ur:ivcrsity was not adversely affected if emplo~nent did not exceed 27 hou::-s a wee~. Aca<lemlc perfotinancc <lid, however, suffer for those student.s 'l.'O:-~ing t::ore than 27 hours per week.
7. Aur,sburger, J, D., "An Analysis of ·Academic Performance of ....,or':<ing and Non-Working Students on ,\cackrnic I'r-:>hatio:i at Northern Illinois t'niversity"., Journ."11 of Stu,ll'nt Financial !dd, 197.'.i, 35(2) 30-39.
M;i jor findinr;s: No signi.[icant difference was found to exist bct-..-ee:1 stu,le11ts not employed, students e1r.ployc<l on-c.:impus, a:.d s.:u<lc:.ts e;:-?loyed off-campus on the basis ~f their grade point avera~cs. It ~as, hc-..-ever, found that a students' grades r.,ay surfer if he attc::.pts to ·...-or~ rr.crc :.::an 20 hours per week regularly. Additionally the study found that a=cu~g stuclc-nt's on ac.:1dc-mic probation, those who worked 20 hc-urs or less, -..·!,ether on,-campus or off-campus, achieved higher grades than those students who were not employed. ·
8. Jk1rncs, John D. and Rol,rnd KcC'ne, "A Ct'mparisc,n eof the li:n:.tcd acade::-.ic; achievement of freslmit·n ai-·:ird winners who -..ork .;nd these ·..-ho co r.ot ,.or:...". The ,lourn:11 of Stndrnt Fi,1:incinl ,'Ii d, 1974 4(J), 25-29.
Major. fi ncli 11r,s: Part-time work in an on-ca:n;?us job does not i.1tc-::-fe:-e with the initial academic adjustment of students at that institution.
9. Gaston, Margaret, 11A study of the effects of coller,c-im?(>sec work-study proerams c-n gr:idc point nvera~cs of :;cl<.·ctcci studc:-,t:s at '..'estcrn \.'ash!.:-,ston St.ate College", Jo11rn:il of Student Fin.Jncinl Aid 1973 3(1)• 19-26.
Major f{ndin"SI Students who worked part time perfomed as wll a&_stu.!ent. who were not required to work part ti~•
·,
~


