Air Force Institute of TechnologyAFIT Scholar
Theses and Dissertations Student Graduate Works
3-14-2014
A Survey and Analysis of Aircraft MaintenanceMetrics: A Balanced Scorecard ApproachAdrienne L. Stahl
Follow this and additional works at: https://scholar.afit.edu/etd
This Thesis is brought to you for free and open access by the Student Graduate Works at AFIT Scholar. It has been accepted for inclusion in Theses andDissertations by an authorized administrator of AFIT Scholar. For more information, please contact [email protected].
Recommended CitationStahl, Adrienne L., "A Survey and Analysis of Aircraft Maintenance Metrics: A Balanced Scorecard Approach" (2014). Theses andDissertations. 690.https://scholar.afit.edu/etd/690

A Survey and Analysis of Aircraft Maintenance
Metrics: A Balanced Scorecard Approach
THESIS
Adrienne L. Stahl, Major, USAF
AFIT-ENS-14-M-29
DEPARTMENT OF THE AIR FORCE
AIR UNIVERSITY AIR FORCE INSTITUTE OF TECHNOLOGY
Wright-Patterson Air Force Base, Ohio
DISTRIBUTION STATEMENT A. APPROVED FOR PUBLIC RELEASE; DISTRIBUTION UNLIMITED.

The views expressed in this thesis are those of the author and do not reflect the official policy or position of the United States Air Force, Department of Defense, or the United States Government.
AFIT-ENS-14-M-29
A Survey and Analysis of Aircraft Maintenance Metrics: A Balanced Scorecard Approach
THESIS
Presented to the Faculty
Department of Operational Sciences
Graduate School of Engineering and Management
Air Force Institute of Technology
Air University
Air Education and Training Command
In Partial Fulfillment of the Requirements for the
Degree of Master of Science in Logistics Management
Adrienne L. Stahl, BS
Major, USAF
March 2014
DISTRIBUTION STATEMENT A. APPROVED FOR PUBLIC RELEASE; DISTRIBUTION UNLIMITED.
AFIT-ENS-14-M-29
A Survey and Analysis of Aircraft Maintenance Metrics: A Balanced Scorecard Approach
Adrienne L. Stahl, BS Major, USAF
Approved: //Signed// 13 March 2014 Joseph R. Huscroft, LtCol, USAF (Co-Chairman) date //Signed// 13 March 2014 Dr. Jeffrey A. Ogden (Co-Chairman) date //Signed// 13 March 2014 Benjamin T. Hazen, Capt, USAF (Member) date

iv
AFIT-ENS-14-M-29
Abstract
Performance metrics have helped to sustain the Air Force, improve processes, and
guided decisions makers through decades of challenges and change. The Air Force
continues to change as it faces the challenges of an aging fleet coupled with the tightest
budget constraints of modern times. The current metrics employed by the United States
Air Force Aircraft Maintenance community have gone largely unchanged over decades
despite a host of force altering events. The focus of this research is to evaluate current
maintenance metrics and assess the utility of the Balanced Scorecard framework for use
in a Maintenance Group. The researcher utilizes a mixed methodology to accomplish this
evaluation, including survey research, statistical analysis, content analysis, and
correlation analysis. The paper proposes a Maintenance Group Balanced Scorecard
based on the analysis of survey responses from Maintenance Officers with Combat Air
Forces (CAF) experience. The proposed Balanced Scorecard is comprised of existing,
refined, and proposed metrics to measure each perspective category of the Balanced
Scorecard, and is intended to help align maintenance metrics with organizational
goals/objectives and the strategic goals of Maintenance Groups in CAF units.
v
AFIT-ENS-14-M-29
To the DJOA: Not just my classmates, but dear friends or worst enemies depending on the day,
sounding boards, cheerleaders, cynics, aerobics/marathon/mudding partners, penguin killers, slackers, strivers, band members, etc…and of course, an extraordinary group of people who I’ll miss dearly. Thank you for your friendship and making this educational
experience bearable.
To my family: The bonus to this academic endeavor was the proximity to my family…thank you for your
love, support and encouragement through the past year and half.

vi
Acknowledgments
There are many people that I leaned on throughout the research process--their
insight, guidance and mentorship have been invaluable to me. First, I would like to thank
my advisors, LtCol Huscroft and Dr. Ogden for their patience as I searched for a topic,
and for their flexibility as I navigated my way to the finished product. Thanks to my
reader, Capt Hazen, for quick-turns on edits and helping me to get across the finish line.
I would like to recognize Col Matt Venzke who always took the time to give me
thoughtful feedback throughout this journey.
I truly appreciate Col Pete Fesler and the interest he took in my topic and the
perspective he provided to me.
I’d be remiss if I didn’t thank LtCol Matt Hummel, who was the catalyst for this
paper--it was his thoughts that I always referred back to if I felt myself getting off track.
Without LtCol Libbie Boehm, the crux of this research would have fallen flat--
thank you for taking on my cause to get the advocates I needed.
A thank you doesn’t fully express my gratitude to my most dedicated editor,
SMSgt (ret) Brian Hersey. I could not have done this without you.
To the Maintenance Officers who took the time out of impossible schedules to
provide insights into this research, thanks for your passion for the Maintenance business.
Adrienne L. Stahl
vii
Table of Contents
Abstract .............................................................................................................................. iv
Acknowledgments.............................................................................................................. vi List of Figures .................................................................................................................... xi List of Tables .................................................................................................................... xv
I. Introduction .................................................................................................................... 1
General Issue ................................................................................................................... 1
Background ..................................................................................................................... 3
Problem ........................................................................................................................... 7
Research Objectives ........................................................................................................ 8
Research Question .......................................................................................................... 8
II. Literature Review ........................................................................................................... 9
Officially Sanctioned Metrics ....................................................................................... 12
Current Frequency and Levels of Metrics Study .......................................................... 12
Evaluation Criteria for Individual Metrics .................................................................... 13
Metrics Set Theory/Framework .................................................................................... 16
Balanced Scorecard overview ............................................................................... 17
Customer Perspective................................................................................ 20
Internal Process Perspective ..................................................................... 23
Aircrew Mission/Training Scheduling and Execution Process .... 24
Flying Scheduling and Execution Process .................................... 24
Aircraft Maintenance Scheduling and Execution Process ............ 28
Equipment Maintenance Scheduling and Execution Process ....... 30
Maintenance Training Scheduling and Execution Process ........... 32
Financial Perspective ................................................................................ 36
Learning and Growth Perspective ............................................................. 37
Maintenance Group's Balanced Scorecard ................................................................... 37
III. Methodology ............................................................................................................... 40
Overview ....................................................................................................................... 40
Method .......................................................................................................................... 40
Survey Formulation Methodology ........................................................................ 41
viii
Demographics ........................................................................................... 41
Strategic Objective .................................................................................... 41
Maintenance Group Balanced Scorecard Perspectives ............................. 42
Customer Perspective.................................................................... 42
Processes Perspective.................................................................... 42
Readiness Perspective ................................................................... 43
Workforce Quality Perspective ..................................................... 43
Balanced Scorecard utility and frequency ................................................ 43
Efficacy of individual metrics ................................................................... 44
Institutional and Air Force Approval ........................................................ 44
Population and Sample ............................................................................. 44
Testing and Administration....................................................................... 45
Pre-Test ......................................................................................... 45
Pilot Test ....................................................................................... 46
Survey Administration .................................................................. 46
Survey Reliability and Error ..................................................................... 46
Reliability ...................................................................................... 46
Sampling Error .............................................................................. 48
Non Sampling Error ...................................................................... 49
Non-Response Bias ....................................................................... 49
Response Bias ............................................................................... 50
Response rate ............................................................................................ 50
Demographics ........................................................................................... 51
Data Preparation........................................................................................ 54
Data Inspection ............................................................................. 54
Closed-ended survey responses .................................................... 54
Open-ended Survey Responses ..................................................... 55
Survey Analysis Methodology .............................................................................. 55
Statistical Analysis ........................................................................................ 55
Content Analysis and Qualitative Validity ................................................... 57
Correlation Analysis ..................................................................................... 58
ix
IV. Results and Analysis ................................................................................................... 63
Overview ....................................................................................................................... 63
Statistical Analysis ........................................................................................................ 63
Strategic Objective ................................................................................................ 63
Maintenance Group Balanced Scorecard perspectives ......................................... 64
Customer Perspective............................................................................................ 64
Process Perspective ............................................................................................... 65
Aircrew Mission/Training Scheduling and Execution .............................. 68
Flying Scheduling and Execution ............................................................. 72
Maintenance Training Scheduling and Execution .................................... 74
Aircraft Maintenance Scheduling and Execution ..................................... 76
Equipment Maintenance Scheduling and Execution ................................ 78
Readiness Perspective ........................................................................................... 82
Aircraft, Maintainer and Equipment Readiness ........................................ 82
Workforce Quality Perspective ............................................................................. 85
Maintenance Quality and Safety ............................................................... 85
Maintainer Skill Level and Maintainer Experience Level ........................ 87
Maintainer Discipline and Maintainer Retention ...................................... 89
Balanced Scorecard utility and frequency ............................................................ 92
Efficacy of Individual Metrics .............................................................................. 94
Aircraft Inventory ..................................................................................... 95
Fix Rate ..................................................................................................... 96
Workcenter Utilization Rate ..................................................................... 97
Aircraft Possessed ..................................................................................... 98
Cannibalization Rate ................................................................................. 98
Mission Impaired Capability (MICAP) .................................................... 99
Supply Effectiveness Rate ...................................................................... 100
Maintenance Group Balanced Scorecard Initial Rollup ..................................... 101
Correlation Analysis ................................................................................................... 102
Perspective Category Correlation ....................................................................... 102
Maintainer Experience ........................................................................................ 103

x
Maintainer Readiness .......................................................................................... 106
Maintenance Training and Execution Process .................................................... 108
Aircrew Mission/Training Scheduling and Execution Process and Flying Scheduling and Execution................................................................................... 109
Equipment Maintenance Scheduling and Execution and Equipment Readiness 109
Aircraft Scheduling and Execution and Equipment Maintenance Scheduling and Execution ............................................................................................................ 111
Scheduling and Execution................................................................................... 112
V. Discussion, Recommendations and Conclusions ....................................................... 114
Discussion ................................................................................................................... 114
Assumptions and Limitations ..................................................................................... 114
Recommendations ....................................................................................................... 115
Metrics to Create ................................................................................................. 115
Metrics to Reassess ............................................................................................. 118
Recommendation Summary/Research Question................................................. 118
Other Recommendations ............................................................................................. 121
Recommendations for Future Research ...................................................................... 121
Conclusions ................................................................................................................. 122
Appendix A: Literature Review Classification ............................................................... 124
Appendix B: Exhaustive List of Metrics ........................................................................ 127
Appendix C: Consolidated List of Metrics ..................................................................... 128
Appendix D: Mandated Meeting Frequency and Content .............................................. 129
Appendix E: Maintenance Metrics Survey ..................................................................... 132
Appendix F: Internal Review Board exemption letter .................................................... 166
Appendix G. Survey Control Number ............................................................................ 167
Appendix H: Process and Assigned Metrics Cross Tabulation ...................................... 170
Appendix I: Perspective Category Correlation Coefficients .......................................... 171
Appendix J: Thesis Sponsorship Letter .......................................................................... 176
Appendix K: Metrics Proposal Comparison ................................................................... 177
Bibliography ................................................................................................................... 178
Vita .................................................................................................................................. 183

xi
List of Figures
Figure Page
Figure 1: Metric Evaluation Criteria (Caplice & Sheffi, 1994, p. 14) ............................. 16
Figure 2: Graphical Representation of Balanced Scorecard (Kaplan and Norton, 1996) . 19
Figure 3. Aircrew Mission/Training Scheduling and Execution Processes ...................... 27
Figure 4: Aircraft Maintenance Scheduling and Execution Process ............................... 30
Figure 5: Equipment Maintenance Scheduling and Execution ........................................ 31
Figure 6: Maintenance Training Scheduling and Execution Process .............................. 35
Figure 7: Proposed Maintenance Group Balanced Scorecard Perspectives and Perspective Categories ......................................................................................................................... 39
Figure 8: Example Perspective Category Regression Plot ............................................... 60
Figure 9: MXG’s Customer(s) Responses ........................................................................ 65
Figure 10: Critical Processes for Aircrew as Customer .................................................... 66
Figure 11: Important Processes for Aircrew as Customer ................................................ 67
Figure 12: Metric Assignment to Aircrew Mission/Training Scheduling Process ........... 68
Figure 13: Metric Assignment to Aircrew Mission/Training Execution Process ............. 69
Figure 14: Adequacy of Available Metrics for Aircrew Mission/Training Scheduling Process .............................................................................................................................. 69
Figure 15: Aircrew Mission/Training Scheduling and Execution Process Metrics Issues 71
Figure 16: Aircrew Mission/Training Scheduling Process Suggested Metrics ................ 72
xii
Figure 17: Metric Assignment to Flying Scheduling Process .......................................... 73
Figure 18: Metric Assignment to Flying Execution Process ............................................ 73
Figure 19: Adequacy of Available Metrics for Flying Scheduling Process ..................... 74
Figure 20: Metric Assignment to Maintenance Training Scheduling Process ................. 75
Figure 21: Metric Assignment to Maintenance Training Execution Process ................... 75
Figure 22: Adequacy of Available Metrics for Maintenance Training Scheduling Process........................................................................................................................................... 76
Figure 23: Metric Assignment to Aircraft Maintenance Scheduling Process................... 77
Figure 24: Metric Assignment to Aircraft Maintenance Execution Process .................... 77
Figure 25: Adequacy of Available Metrics for Aircraft Maintenance Scheduling Process........................................................................................................................................... 78
Figure 26: Metric Assignment to Equipment Maintenance Scheduling Process .............. 79
Figure 27: Metric Assignment to Equipment Maintenance Execution Process ............... 79
Figure 28: Adequacy of Available Metrics for Equipment Maintenance Scheduling Process .............................................................................................................................. 80
Figure 29: Equipment Maintenance Scheduling and Execution Process Metrics Issues.. 81
Figure 30: Equipment Maintenance Scheduling and Execution Process Suggested Metrics........................................................................................................................................... 82
Figure 31: Metric Assignment to Aircraft Readiness ....................................................... 83
Figure 32: Metric Assignment to Maintainer Readiness .................................................. 83
Figure 33: Metric Assignment to Equipment Readiness .................................................. 84
Figure 34: Adequacy of Available Metrics for Equipment Readiness ............................ 84
Figure 35: Metric Assignment to Maintenance Quality ................................................... 85
xiii
Figure 36: Metric Assignment to Maintenance Safety ..................................................... 86
Figure 37: Adequacy of Available Metrics for Maintenance Quality and Safety ............ 86
Figure 38: Metric Assignment to Maintainer Skill Level ................................................. 87
Figure 39: Metric Assignment to Maintainer Experience Level ...................................... 88
Figure 40: Adequacy of Available Metrics for Maintainer Skill and Experience Level .. 88
Figure 41: Metric Assignment to Maintainer Discipline ................................................. 89
Figure 42: Metric Assignment to Maintainer Retention ................................................... 89
Figure 43: Adequacy of Available Metrics for Maintainer Discipline and Retention ...... 90
Figure 44: Maintainer Retention Metrics Issues ............................................................... 91
Figure 45: Maintainer Retention Suggested Metrics ........................................................ 92
Figure 46: Balanced Scorecard Utility Perception ............................................................ 93
Figure 47: Balanced Scorecard Frequency Recommendations ....................................... 94
Figure 48: Individual Metrics Efficacy Response ............................................................ 95
Figure 49: Aircraft Inventory Efficacy Evaluation ........................................................... 96
Figure 50: Fix Rate Efficacy Evaluation .......................................................................... 97
Figure 51: Workcenter Utilization Rate Efficacy Evaluation ........................................... 97
Figure 52: Aircraft Possessed Efficacy Evaluation .......................................................... 98
Figure 53: Cannibalization Rate Efficacy Evaluation ...................................................... 99
Figure 54: Mission-Impaired Capability Rate Efficacy Evaluation ............................... 100
Figure 55: Supply Effectiveness Rate Efficacy Evaluation ............................................ 101
Figure 56: Initial Maintenance Group Balanced Scorecard ............................................ 102
xiv
Figure 57: Experience Level Metrics Issues ................................................................... 105
Figure 58: Experience Level Suggested Metrics ............................................................ 106
Figure 59: Maintainer Readiness Metrics Issues ............................................................ 107
Figure 60: Maintainer Readiness Proposed Metrics ....................................................... 108
Figure 61: Equipment Readiness Issues with Available Metrics.................................... 110
Figure 62: Equipment Readiness Proposed Metrics ....................................................... 111
Figure 63: Maintenance Group Balanced Scorecard Metrics Recommendations .......... 119
Figure 64: Final Maintenance Group Balanced Scorecard ............................................. 120
xv
List of Tables
Table Page
Table 1: Survey Response Rates ....................................................................................... 51
Table 2: Demographics ..................................................................................................... 52

1
A Survey and Analysis of Aircraft Maintenance Metrics: A Balanced Scorecard Approach
I. Introduction
General Issue
Successful organizations have long recognized performance metrics as a vital
method of establishing easily understood and tangible goals for employees,
understanding where processes are succeeding, or identifying areas in need of
improvement. Performance metrics provide leaders and management personnel a means
to manage by fact rather than by feel or anecdotal information. Well-developed metrics
lend themselves to objective decision making and provide decision makers statistical
proof to validate decisions already made or to guide them into the future. Additionally,
the study of objective performance metrics solidifies constancy of purpose for every
person vested in the success of the organization and propels the organization on the
desired course. Since the goal of any manager is to extract the maximum potential of
every resource in every process, effective measurement tools are necessary to increase
efficiency and value, and minimize waste and error. In this manner, comprehensive
performance measurement serves to focus attention and resources toward successful
organizational behavior and minimizes the time and effort spent on identifying those
behaviors that require modification to contribute more effectively to achieve
2
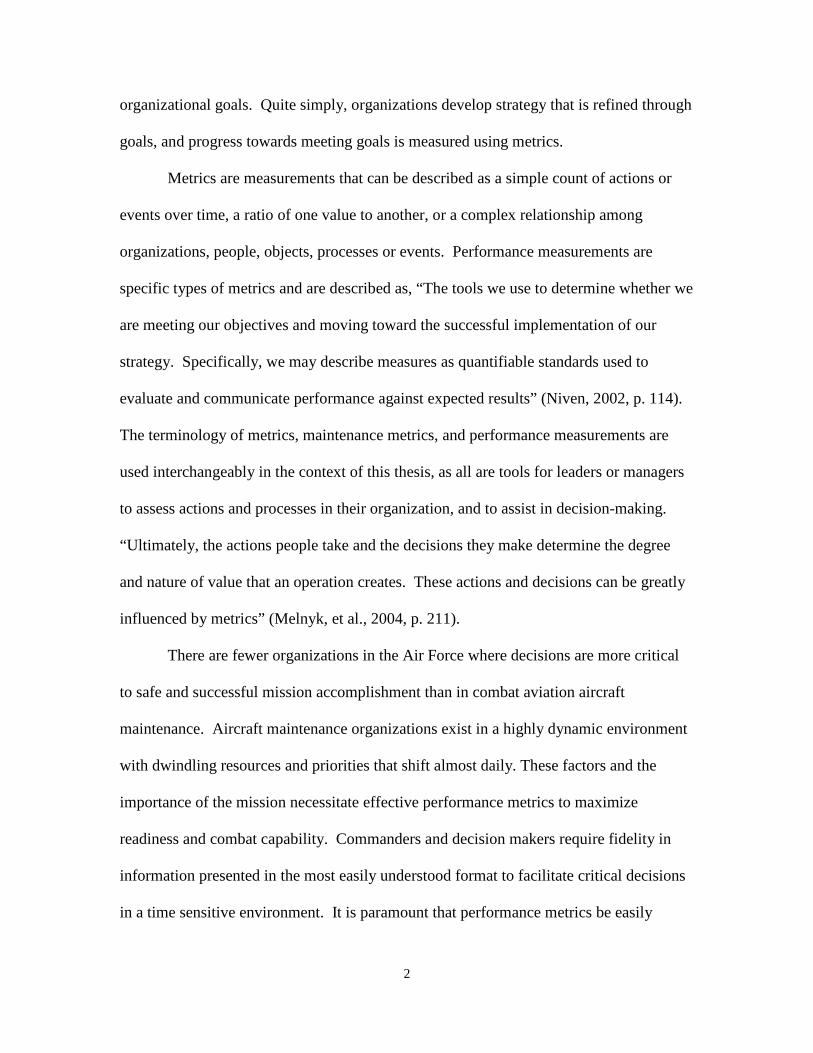
organizational goals. Quite simply, organizations develop strategy that is refined through
goals, and progress towards meeting goals is measured using metrics.
Metrics are measurements that can be described as a simple count of actions or
events over time, a ratio of one value to another, or a complex relationship among
organizations, people, objects, processes or events. Performance measurements are
specific types of metrics and are described as, “The tools we use to determine whether we
are meeting our objectives and moving toward the successful implementation of our
strategy. Specifically, we may describe measures as quantifiable standards used to
evaluate and communicate performance against expected results” (Niven, 2002, p. 114).
The terminology of metrics, maintenance metrics, and performance measurements are
used interchangeably in the context of this thesis, as all are tools for leaders or managers
to assess actions and processes in their organization, and to assist in decision-making.
“Ultimately, the actions people take and the decisions they make determine the degree
and nature of value that an operation creates. These actions and decisions can be greatly
influenced by metrics” (Melnyk, et al., 2004, p. 211).
There are fewer organizations in the Air Force where decisions are more critical
to safe and successful mission accomplishment than in combat aviation aircraft
maintenance. Aircraft maintenance organizations exist in a highly dynamic environment
with dwindling resources and priorities that shift almost daily. These factors and the
importance of the mission necessitate effective performance metrics to maximize
readiness and combat capability. Commanders and decision makers require fidelity in
information presented in the most easily understood format to facilitate critical decisions
in a time sensitive environment. It is paramount that performance metrics be easily
3
understood, timely, accurate, fact-based and immune to manipulation, and relevant to
challenges of the changing environment.
Background
From the beginning of aviation--the establishment of the Aeronautical Division of
the Army Signal Corps in August 1907 and the first flight of Wright Brother’s flyer in
September 1907--came the inception of the aircraft mechanic who was separate from the
pilot who flew the aircraft. The specialized field of aircraft maintenance was formally
established in 1911, with the publication of Provisional Airplane Regulations for the
Signal Corps, United States Army, 1911. Even during the infancy of the Air Force,
leaders and decision-makers recognized the necessity for reporting information for
decision making and understanding of performance of aircraft--the primary formal
metrics reported by flying units to higher command levels were in-commission or out-of-
commission rates and accident rates (Townsend, 1978).
In September of 1956, the Air Force codified the need for formal performance
measurement, reporting, and analysis when it published AFM 66-1, Maintenance
Management, establishing the first set of standards, goals, and objectives for aircraft
maintenance. “The established standards included aircraft in-commission rates,
component repair standards, and aircraft scheduling objectives, among many others. This
information told the maintenance man what he was expected to accomplish, and gave him
the capability to measure his effectiveness in meeting these standards or goals”
(Townsend, 1978).
From 1956 to current day, the Air Force has continued to use metrics in the
Aircraft Maintenance community for “The measurement of the many logistics processes

4
that provide combat capability to the unit… [and] quick and accurate identification of
areas for improvement, as well as identification of support problems beyond the scope of
the unit” (Air Combat Command Instruction 21-118, 2012, p. 4). The list of specific
sanctioned and reportable metrics evolved and expanded over time through multiple
iterations of aircraft maintenance management policies and regulations such as Air Force
Manual 66-1 (1972) and TAC Regulation 66-3; however, since the 2003 release of Air
Force Policy Directive 21-1, Maintenance, Air and Space Maintenance, the list of
sanctioned metrics has remained largely unchanged.
The mission of the United States Air Force is among the most complex in the
world. With installations, aircraft of various mission design and purpose, equipment and
people in every corner of the world engaged in a seemingly endless number of on-going
missions, it is vitally important that leaders understand the state of their organization’s
operations to the furthest extent possible. This is of particular importance in the aircraft
maintenance arena.
The overarching objective of AF maintenance is to maintain aircraft and equipment in a safe, serviceable and ready condition to meet mission needs. Maintenance management metrics serve this overarching objective and are established and maintained by Headquarters Air Force (HAF), Major Commands (MAJCOMs), Wings and/or Squadrons to evaluate/improve equipment condition, personnel skills and long-term fleet health (Air Combat Command Instruction 21-118, 2012, p. 28) Aircraft maintenance metrics are maintained and used to monitor and drive
improved performance from HAF through MAJCOMs all the way down to the squadron
level. Furthermore, unit performance metrics reach beyond the internal workings of the
Air Force but also convey information about the Air Force to agencies, committees and
people in positions of power outside of the Air Force that have significant influence.
5
Communication with policy makers at the Department of Defense and
Congressional level undoubtedly has far-reaching and lasting impact. It is imperative the
communication is fact-based and clearly articulates the successes, challenges, direction
and needs of the Air Force. The Air Force uses metrics to produce statistical analysis for
congressional committees, the Office of Management and Budget, and the Department of
Defense. Lead MAJCOMs establish capability goals in coordination with the Air Staff.
These goals enable HAF to assess resource allocation funding on a quarterly basis, and
go into the yearly Readiness Reports to Congress. The Air Force uses metrics reports to
develop and defend the US Air Force input to the Planning, Programming, Budgeting,
and Execution (Department of the Air Force Instruction 21-103, 2012) for decisions on
issues such as airframe retirements, airframe acquisition, manpower increases and
reductions, budget increases or decreases, or suitability of units for participation in
conflicts (Durand, 2008).
The Air Force has also used metrics to aid in major organizational restructuring
decisions for aircraft maintenance and operations. The decision to transition from
Production Oriented Maintenance Organization to the Combat Oriented Maintenance
Organization in 1978 and the transition of the Objective Wing Organization to the
Combat Wing Organization in 2002 were both made as an attempt to reverse declining
maintenance performance metrics (Durand, 2008).
Useful and accurate performance measurement metrics have helped to sustain the
Air Force, improve processes, and guided decisions makers through decades of
challenges and change. An aging fleet, sequestration and subsequent budget constraints
are the newest of the challenges the Air Forces faces. Maj. Gen. Edward L. Bolton Jr, the
6
Deputy Assistant Secretary for Budget, Office of the Assistant Secretary of the Air Force
for Financial Management and Comptroller described these challenges:
In terms of average aircraft age, Air Force “iron” is older than it has ever been. Additionally, high operations tempo has shortened service lives, increasing the cost to sustain and maintain our weapon systems. Faced with compounding fiscal challenges, we must make prudent choices to ensure the Air Force continues to preserve our Nation’s airpower advantage. To this end, the Air Force is committed to avoiding a hollow force; one that looks good on paper, but has more units and equipment than it can support, lacks the resources to adequately man, train and maintain them, or keep up with advancing technologies. With these changes, the active duty Air Force will reduce to approximately 329,500 personnel in FY 2013, approaching the same size as when we were established as a separate service in 1947. At the same time, the FY 2013 NDAA permits the Air Force to proceed with selected aircraft retirements and transfers necessary to meet budget targets while protecting readiness and modernization. With the onset of Sequestration, we have begun implementing immediate actions to mitigate an approximate $10B reduction to Air Force Total Obligation Authority. We’ve taken steps to minimize impacts to readiness and our people; however, the results of these cuts will be felt across all Air Force Core Missions and challenge the goals of our FY 2014 Budget Submission which does not reflect Sequestration reductions. Given today’s fiscally constrained environment, the Air Force must pursue the best combination of choices available to balance force reductions and manage war-fighting risks, resources and the bow-wave of impacts from FY 2013. Taking these actions allows us to keep faith with our 687,634 total force Airmen and continue to excel in our role to fly, fight, and win in air, space and cyberspace (Bolton, 2013, p. 4).
Clearly, Air Force resources will require more attention and more critical
decisions than ever before. Couple the challenge of the aging fleet, the effort to
recapitalize, with the a reduced force structure during the tightest budget constraints of
modern times and one can easily see how maintenance management metrics will play an
increasingly important role. The importance of a sound aircraft maintenance metrics set
is more critical than ever before, and the evaluation of the current metrics set is
7
imperative to ensure aircraft maintenance metrics are meeting the needs of Air Force
decision makers at every level.
Problem
Air Policy Directive 21-1, Maintenance, Air and Space Maintenance provides
direction from the departmental level down to the wings for reporting performance
measurements but hasn’t been reviewed or changed since February 2003; however, the
Air Force’s, and the Maintenance Group’s situation has changed vastly since that time. A
review of the maintenance metrics is needed to ensure it is relevant, and that it is meeting
the needs of the maintainers that use it. “There is a pressing need for companies to
reevaluate their performance measurement systems. This reevaluation should be
conducted for both the individual metrics and the performance measurement system as a
whole” (Caplice & Sheffi, 1994, p. 11). No MAJCOM-wide study has been accomplished
to determine whether the current set of sanctioned metrics is useful for the leaders and
decision-makers that use them, or if metrics are in need of revision, addition or deletion.
Additionally, metrics traditionally tracked in a Maintenance Group are not
mandated to be studied in an integrated fashion. Some metrics are mandated to be
studied and discussed in a group setting, while others are only required to be reported to
Higher Headquarters (Air Combat Command Instruction 21-118, 2012). Many separate
meetings take place where a limited number and type of metrics are discussed, such as
Maintenance Status of Training and Maintenance Standardization and Evaluation
Program, but no meeting is mandated which integrates all metrics for a consolidated view
of the performance of all facets of successful performance. The limited scope of these
individual meetings provides a relatively myopic view of the entire wing and limits the
8
ability of leaders and managers to see the interrelation between the various processes that
contribute to the end goal of the organization. Studying different types of metrics at
different times makes it difficult to, “see whether improvement in one area may have
been achieved at the expense of another” (Kaplan & Norton, 1992, p. 73). Lack of
standardization further limits the effectiveness of these compartmentalized meetings.
The frequency and interval of meetings to study and analyze metrics is not standardized,
and neither are the required attendees at these established meetings.
Research Objectives
The objective of this research was to evaluate individual maintenance metrics and
the sanctioned maintenance metrics set currently employed by the Aircraft Maintenance
community. The researcher sought to assess the relevance of current metrics to the
leaders and decision makers that use them, as well as the optimal frequency for their
review. In an effort to evaluate the efficacy of individual metrics for inclusion into
selected framework, the researcher sought to evaluate the metrics against an objective
evaluation criteria summarized from previous research. Lastly, to better align
maintenance metrics with organizational goals/objectives and the strategic goals of the
Air Force, the researcher sought to adapt, propose and evaluate a balanced scorecard
metrics framework for use by Maintenance Group leaders and decision makers.
Research Question
1. What metrics should be used in the Maintenance Group Balanced Scorecard
framework to meet the needs of the CAF Maintenance Community?

9
II. Literature Review
The general intent of this literature review was to study a broad spectrum of
publications across different contexts in order to understand the importance of metrics as
a critical managerial challenge, and to gain insights into various approaches to, and
perspectives of, metrics and their requirements to support the decision making process.
Specifically, the researcher’s objectives during this literature review were to determine
effective criteria for evaluating individual metrics, and gain a thorough understanding of
the balanced scorecard framework to apply to USAF Combat Air Force (CAF)
maintenance operations. In order to achieve these objectives, the researcher classified
and analyzed the literature in several different ways (Appendix A).
The first way the researcher classified publications was by the origin of
publication, from either the DoD or USAF sector or the private industry or academic
sector. The purpose of researching literature from both origins was first, to establish an
understanding of metrics-related research accomplished supporting functions unique to
the DoD or USAF; second, to collect the current metrics used to measure performance in
the field; and third, to understand themes and perspectives of both sectors related to
performance measurement identification, design, and characteristics.
The researcher further classified the literature by identifying general focus areas
of each publication, which examined or addressed metrics concepts from broad
conceptual models or frameworks, to more refined metrics systems or sets, to a very
focused few or individual metrics.
10
The third classification the researcher explored was the focus of the topic
categories each article addressed. The researcher sought to include literature across six
topic categories to facilitate a well-developed knowledge base to support this research.
The topic categories included literature that addressed:
1. The purpose, importance, or characteristics of its respective focus area
2. Proposals of specific metrics, metrics sets/systems, or frameworks
3. The design, development, or selection of one of more of the focus areas
4. The implementation of individual metrics, systems or frameworks
5. The management of metrics, metrics sets, or conceptual frameworks
6. The evaluation of one of more of the focus areas
Lastly, the researcher sought to classify the publications by the methodology used
to conduct the research. The publications were assembled into:
1. Literature Review/Content Analysis
2. Case Study-based
3. Survey/interview-based
4. Conceptual Model/Framework-based
5. Expert opinion
6. Mathematical/statistical analysis

11
Of particular interest to the researcher were three Air Force publications related to
metrics in the Maintenance Group, which served as foundations for the researcher’s
methodology. The first was Capt Brian Waller’s thesis Evaluation of Air Force Aircraft
Maintenance Metrics for Integration into the Expeditionary Combat Support System. In
his thesis, Capt Waller recommended expanding his case study of suitable and useful
metrics to be incorporated into the Expeditionary Combat Support System into a
statistical survey by a larger population of maintenance experts. He states, “Further
revelations may be developed by expanding the expert pool to include maintenance
managers from other organizations, such as fighter or special operations units as well as
evaluations from managers at higher-level headquarters” (Waller, 2009, p. 115).
Additionally, he determined, “The results of this study have found a number of metrics
that need re-evaluation, if not re-engineering. Further exploration should be undertaken
in order to determine how to best change these metrics to align better with the strategic
goals of the Air Force as well as the goals for effective metrics” (Waller, 2009, p. 115).
The second study was a report written by Capt Emily Harris titled Development of
Aerospace Ground Equipment (AGE) Metrics, which addressed the lack of standardized
metrics to measure the performance of AGE maintenance, and proposed a set of metrics
to be used at the Maintenance Group level (Harris, 2011).
Lastly, the Air Force Research Laboratory and the University of Arkansas
published a report called The Use of Decision Models in the Development of a
Collaborative Integrated Solutions System which identified a need to have a strategically
aligned performance measurement system for flightline maintenance activities, and used
12
the Kaplan and Norton’s Balanced Scorecard approach to develop a proposed metrics set
for use by an Aircraft Maintenance Unit (Nachtmann, et al., 2003).
Appendix A shows the researcher’s breakdown of all reviewed literature and the
determined categorizations.
Officially Sanctioned Metrics
The next objective of the literature review was to determine the officially
sanctioned metrics in aircraft maintenance through a literature review of regulations and
Air Force Instructions (AFI). The researcher found that metrics were scattered across
many different aircraft maintenance and training regulations, supplements, and Tactics,
Techniques and Procedures, and identified over a hundred metrics currently in use. The
researcher called this list of unfiltered and unconsolidated metrics “Exhaustive List of
Metrics” which is listed in Appendix B. For the ease of surveying the maintenance
officer population, the researcher consolidated metrics that she deemed similar in intent
to make a “Consolidated List of Metrics”, which can be found in Appendix C.
Current Frequency and Levels of Metrics Study
After researching and determining the officially sanctioned metrics, the researcher
sought to determine the mandated frequency and management level of study of the
officially sanctioned metrics through a literature review of regulations and AFIs. The
researcher noted that the set of “traditional” aircraft maintenance metrics actually had no
AFI mandated meeting at the Wing or Maintenance Group level, while other metrics had
AFI mandated meetings for their study by leaders and managers. The researcher outlined
the frequency and level of management in which the officially sanctioned metrics are
reviewed in Appendix D.
13
Evaluation Criteria for Individual Metrics
To aid in determining the efficacy of the individual metrics, the literature review
included research to establish a viable set of objective criteria for evaluating individual
metrics. After carefully considering various methods of evaluating individual metrics
discovered in her exploration, the researcher determined the Caplice and Sheffi criteria
was the most comprehensive and complete set of criteria to use in her study. In the
literature review performed by Caplice and Sheffi, they evaluated past publications on
metrics evaluation, and found several common general characteristics in good
performance metrics (Caplice & Sheffi, 1994). They produced a set of eight evaluation
criteria based on this review, which are described below and outlined in Figure 1.
Validity
“A metric is valid if it reflects the actual activity being performed and controls for
any exogenous factors that are out of the process manager's control” (Caplice & Sheffi,
1994, p. 15). For example, Deviation Rate may be considered valid because it accurately
measures departures from the printed flying schedule, takes into account external factors
such as weather.
Robustness
“A metric is robust if it is widely accepted, is interpreted similarly by different
users, and can be used for comparisons across time, locations, and organizations”
(Caplice & Sheffi, 1994, p. 15). For example, Fully Mission Capable rate may be
considered robust because it is interpreted the same by all that use it, is measured the
same way at any time or at any location by all organizations and is easily repeatable.
14
Usefulness
“A metric is useful if it is readily understood by the decision maker and suggests a
course of action or direction to be taken” (Caplice & Sheffi, 1994, p. 15). For example,
Aircraft Availability may be considered useful because the decision maker can
immediately understand the limitation imposed by a low number of available aircraft. He
may take action to reduce the number of aircraft employed for non-mission priority
purposes such as trainers.
Integration
“A metric is integrative if it incorporates all of the major components and aspects
of the process being measured and promotes coordination across functions, divisions, or
firms in the supply chain. The primary thrust of this criterion is to promote coordination
between the players involved in the process” (Caplice & Sheffi, 1994, p. 15). For
example, Total Not Mission Capable rate may be considered integrated because it
includes both maintenance and supply functions and encourages coordination between
maintenance and supply agencies to reduce the number of Not Mission Capable aircraft
(Caplice & Sheffi, 1994).
Economy
“A metric is economical if the benefit of tracking it outweighs the cost to collect,
process, and report it. This is more of a judgment call than a strict cost-benefit
comparison so that the economy criterion should be used to select between potential
metrics rather than for the decision of whether to use any metric at all” (Caplice & Sheffi,
1994, p. 15). For example, Mission Impaired Capability Awaiting Parts may be
15
considered economical because it is relatively easy to collect the data and the benefit of
putting higher priority on parts returns aircraft to service faster.
Compatibility
“A metric is compatible with the existing data collection, information systems,
and information flows of the firm if no significant additional work is required to install
and use it. While compatibility has some overlap with the economy criterion, in that any
system can be made to be compatible to a proposed metric given the needed time and
money, they are not the same. A metric which is economical in terms of collecting and
reporting data might not always be compatible with the existing flow of information”
(Caplice & Sheffi, 1994, pp. 15-16). For example, Average Sortie Duration may be
considered compatible because the information is collected during an existing process
(Pilot debrief) and captured in an already existing database.
Level of Detail
“A metric has the correct level of detail if it captures and reports the data in a
level of aggregation or granularity to be useful to the decision maker” (Caplice & Sheffi,
1994, p. 16) . For example, UTE rate may be considered to have the proper level of
detail because it is measured monthly (daily or weekly is too often) and gives the
decision maker an idea of how often aircraft are being flown during a 30 day period.
Behavioral Soundness
“A metric that is behaviorally sound discourages any counter-productive actions
or game-playing by those process owners or organizations being measured. While it is
always hoped that a measure will align peoples' actions with the organization's overall
objectives, in many cases it can provide incentives for doing the opposite” (Caplice &

16
Sheffi, 1994, p. 16). For example, Abort rate may be considered behaviorally sound
because it is simply a report of an event and there are no counterproductive actions or
means to “game the system” to improve the metric, but it is a top indicator of how well
maintenance executes the flying mission.
Criterion Description Validity
The metric accurately captures the events and activities being measured and controls for any exogenous factors
Robustness
The metric is interpreted similarly by the users, is comparable across time, location, and organizations. Metric is repeatable.
Usefulness
The metric is readily understandable by the decision maker and provides a guide for action to be taken
Integration
The metric includes all relevant aspects of the process and promotes coordination across function and divisions.
Economy
The benefits of using the metric outweigh the cost of data collection, analysis, and reporting
Compatibility
The metric is compatible with the existing information, material, and cash flows and systems in the organization
Level of Detail
The metric provides a sufficient degree of granularity or aggregation for the user
Behavioral Soundness
The metrics minimized incentive for counterproductive acts or game playing and is presented in a useful form
Figure 1: Metric Evaluation Criteria (Caplice & Sheffi, 1994, p. 14) Metrics Set Theory/Framework
The researcher included an examination of established theory and frameworks on
how metrics sets are constructed in the literature review. The purpose of this
examination was to solidify understanding of the various theories and approaches to
metrics set construction and to select a theory to build the Maintenance Group’s metric
set against. The researcher chose to scope this research around the balanced scorecard
17
framework from the many available because of the credibility of the source and because
of its enduring success in corporate applications.
Balanced Scorecard overview
The balanced scorecard approach to constructing effective metrics sets was
introduced in an attempt to reconcile performance measurement problems in traditional
management strategies. The creators of the balanced scorecard framework, Kaplan and
Norton, realized the vital importance of having an easily understood, yet comprehensive
method of providing top managers sufficient details on operational measures regarding
financial measures, results of decisions, customer satisfaction, internal processes and
innovation and improvement activities. According to authors Kaplan and Norton, the
balanced scorecard was developed as a set of measures used to give managers an all-
inclusive view of their organization’s performance:
The balanced scorecard includes financial measures that tell the results of actions already taken, and compliments the financial measures with operational measures on customer satisfaction, internal process, and the organization’s innovation and improvement activities—operational measures that are the drivers of future financial performance (Kaplan & Norton, 1992, p. 71). During the development of the balanced scorecard theory, Kaplan and Norton
recognized that for an organization to successfully achieve its objectives, a clear strategy
is necessary to ensure there is a balanced approach to avoid compromising one goal for
another and thus jeopardizing the entire endeavor. One of the most prevalent failures in
management strategy is failing to identify the interrelation of the various processes and
aspects in the organization. As stated in the Balanced Scorecard Institute’s website:
Traditional management strategies overemphasized financial measures at the expense of progress and growth. This overemphasis brought about short-term gains to the detriment of long-term success. The balanced scorecard is a
18
performance management system that allows organizations to clarify their strategy and assure that every aspect of operations is directed toward the success of these goals” (Balanced Scorecard Institute, 1998-2013).
Successful strategists also understand that less traditional, non-financial performance
measures add value to a successful organizational strategy. In addition to the traditional
financial performance measures, the balanced scorecard incorporates non-financial
measures that create value for an organization such as customer relationships, skills and
knowledge of the workforce, and technology.
In order for an organization to achieve its goals, its performance measurement
system must align with the overall mission of the organization. The four perspectives of
the balanced scorecard focus on the mission or strategic objectives of an organization and
include the Customer Perspective, the Internal Process Perspective, the Financial
Perspective and the Learning and Growth Perspective. Kaplan and Norton explain the
purpose of the four different perspectives: “[Perspectives] allow managers to…answer
four basic questions: How do customers see us? What must we excel at? Can we
continue to improve and create value? How do we look to shareholders?” (Kaplan &
Norton, 1992, p. 72) Purposeful and valid answers to these questions provide focus for
the time, effort and money invested into every activity in every process. To enhance
understanding of the four perspectives, refer to Figure 2.

19
Figure 2: Graphical Representation of Balanced Scorecard (Kaplan and Norton, 1996)
The balanced scorecard provides a multi-faceted view of the organization from
multiple angles from the inside out and from the outside in. The report is a composite
view of customer focus, internal process focus, financial focus and improvement/growth
focus. It reaches beyond being a snapshot of top-level information and brings a critical
evaluation of essential components of an organization’s strategy.
The scorecard brings together, in a single management report, many of the seemingly disparate elements of a company’s competitive agenda: becoming customer oriented, shortening response time, improving quality, emphasizing teamwork, reducing new product launch times, and managing for the long term. The scorecard also guards against sub-optimization. By forcing senior managers to consider all the important operational measures together, the balanced scorecard lets them see whether improvement in one area may have been achieved at the expense of another (Kaplan & Norton, 1992, p. 73). The balanced scorecard can serve as an effective organizational tool providing
executives and top-level managers a comprehensive view of the business and a means to
map out a successful strategy, but the balanced scorecard approach will be ineffective if
the performance measures are not aligned with the organizational strategy. Therefore,
aligning performance measures with organizational strategy is of utmost importance to
executives and top-level managers. According to Nachtman, et al.,
FINANCIAL
How do/should we appear to our shareholders?
CUSTOMER
How do we appear to our customers?
INTERNAL PROCESSES
What are our most critical process?Mission/Strategy
GROWTH
To achieve our goals, what must we improve?
20
Organizational Strategy is the guiding factor behind the balanced scorecard. Organizational strategy is defined as a set of long-term goals that, if successfully achieved, will revolutionize the way a unit operates. Without strategic alignment or the integration of this organizational strategy into the balanced scorecard, a balanced scorecard is merely collection of performance measures. Strategic planning and alignment to a given strategy should be the top priority in any balanced scorecard venture (Nachtmann, et al., 2003, pp. 16-17). The balanced scorecard was introduced as a valuable method for private
businesses to develop successful strategy and measure performance. The researcher
studied the balanced scorecard and sought to apply the principles to the benefit of the
mission of the Air Force, and more specifically, the Maintenance Groups in Combat Air
Forces (CAF). To explore its potential for use, the researcher reviewed the perspectives
proposed by Kaplan and Norton, and then considered how these perspectives could
translate and apply to a Maintenance Group.
Customer Perspective
The customer perspective, the first proposed by Kaplan and Norton, helps to
establish the fundamental purpose and existence of an organization. “When choosing
measures for the Customer perspective of the Scorecard, organizations must answer two
critical questions: Who are our target customers? What is our value proposition in
serving them? Sounds simple enough, but both of these questions offer many challenges
to organizations” (Niven, 2002, p. 15).
In the corporate world where gaining market share to garner a profit is the
ultimate goal, the customer is normally well defined and the concept seems obvious; if
the needs of customer are being met and are satisfied, the end goal of gaining market
share and collecting a profit is achieved. If their needs are not met and the customer is
not satisfied, market share shifts to another company and revenue is lost. When applying
21
these concepts to a military organization such as the Maintenance Group within a flying
wing, the concept of who the customer is not driven by market share and garnering a
profit, but by an essential and required combat support capability.
Oxford Dictionary defines customer as “a person or thing of a specified kind that
one has to deal with” (Oxford University Press, 2014). Considering this definition, the
customer of the Maintenance Group could be one, or all, of the entities in a flying wing
that the members of the Maintenance Group deal with--the Aircrew from the Operations
Group, the maintainers within the Maintenance Group, assigned aircraft, or assigned
equipment. From the perspective of the Maintenance Group, the most readily identifiable
customers are the aircrews. However, the Maintenance Group is typically the largest,
most complex organization in any flying wing and is comprised of multiple squadrons
and flights, many of which endeavor to benefit others within the Maintenance Group
itself. For instance, an avionics backshop is focused primarily on repairing parts to
benefit the Aircraft Maintenance Squadron that strives to generate airplanes. A
backshop’s direct measure of success is repair cycle time in support of the Aircraft
Maintenance Squadron. Another example would be the Military Training Flight (MTF),
whose mission it is to train maintainers from other squadrons. An MTF instructor does
not directly benefit aircrews; he or she provides training and education to other
maintainers and squadrons within the group and measures success by the quality and
quantity of training accomplished. These are just a very few examples of how
organizations within the Maintenance Group benefit each other and can measure success
without considering aircrews at all. The intertwining of the various squadrons and flights

22
is complex and meeting the demands of “internal customers” consumes time and effort,
but is an absolute necessity.
One might not normally think of aircraft and equipment as a “customer” as they
are objects in a process, but aircraft and equipment have service requirements of their
own, whether or not they are flown by aircrew or used by maintainers. Additionally, the
needs of aircraft and equipment are often diametrically opposed with the needs of
aircrews and consume an enormous amount of Maintenance Group resources. Aircrews
need to fly to train and be proficient, but aircraft and equipment require out of
commission time for maintenance and health. The pilot requires an airplane to serve his
purpose and an airplane is of no use without a pilot. The Maintenance Group’s success
comes from finding the critical balance to ensure the best interest of both is served.
Ultimately, mission success is dependent on this balance and the needs of one should not
consistently be given preference over the other.
Aircrews need continuous training to maintain proficiency and to prepare for
combat. Providing the aircraft for Aircrews often comes at the expense to aircraft
combat-readiness when systems degrade or fail in flight or on the ground. Equally
important is the need to train and educate the maintenance force, who must maintain a
perfect balance of qualifications and certifications to safely, efficiently, and effectively
provide aircraft to pilots in combat scenarios. Equipment must be available and
functional to allow any of this to happen, but is subject to wear and tear just like aircraft.
In the context of a Maintenance Group, it could be argued that success comes from
effectively serving not one, but four customers. Each of these entities competes against
the other for the use of resources, but cannot succeed if any one of the others is failing.
23
Internal Process Perspective
From the Internal Process Perspective, the organization must answer the question,
“What must we excel at?” Focusing on the answers to that question helps to identify
critical processes to assist in prioritization, and add focus, direction and thrust for that
organization. Kaplan and Norton state:
Customer-based measures are important, but they must be translated into measures of what the company must do internally to meet its customer’s expectations. After all, excellent customer performance derives from processes, decisions, and actions occurring throughout an organization. Managers need to focus on those critical internal operations that enable them to satisfy customer needs. The internal measures for the balanced scorecard should stem from processes that have the greatest impact on customer satisfaction--factors that affect cycle time, quality, employee skills, and productivity, for example. (Kaplan & Norton, 1992, p. 74). In the context of a flying wing and Maintenance Group’s potential customers--be
it aircrew of the Operations Group, maintainers, aircraft or equipment--the needs of each
of these customers is to be combat-ready to meet the expectations of the stakeholder, the
combatant commander. The internal processes of a flying wing, specifically the
maintenance complex, are diverse and many. Each one of these processes must relate to
the strategic objective of the Maintenance Group, and ultimately serve the needs of the
customers and the primary stakeholder. Air Force Policy Directive 21-1, Maintenance,
outlines general processes the AF must excel at by stating, “The AF shall support
readiness objectives by maintaining equipment in optimum condition, assign skilled
personnel necessary to support expeditionary air forces, and manage fleet health to ensure
long-term capability of air and space equipment” (Department of the Air Force Policy
Directive 21-1, 2003, pp. 1-2). To specify and narrow the scope, this paper discusses ten
24
vital internal processes in the flying wing that are cornerstone to the general processes
outlined in AFPD 21-1:
1. Aircrew Mission/Training Scheduling
2. Aircrew Mission/Training Execution
3. Aircraft Flying Scheduling
4. Aircraft Flying Execution
5. Maintenance Training Scheduling
6. Maintenance Training Execution
7. Aircraft Maintenance Scheduling
8. Aircraft Maintenance Execution
9. Equipment Maintenance Scheduling
10. Equipment Maintenance Execution
Aircrew Mission/Training Scheduling and Execution Process and
Flying Scheduling and Execution Process
Air Force Aircrew training is not only paramount to the success of the mission, it
is crucial to his or her survival and the survival of his or her aircraft in a combat scenario.
Aircrews in the CAF are among the most comprehensively trained in the world as is
necessary to operate effectively in nearly any environment, in any theater, against any
adversary on earth. Aircrews develop skills through several years of intense training
before ever entering the cockpit of a combat-coded aircraft. According to AFI 11-202
volume 1, Aircrew Training,
The USAF Aircrew Training Program (ATP) ensures all aircrew members obtain and maintain the certification/qualification and proficiency needed to effectively perform their unit’s mission. The objective of the ATP is to develop and maintain
25
a high state of mission readiness for immediate and effective employment across the range of military operations” (Department of the Air Force Instruction 11-202, Volume 1, 2010, p. 3). Accumulated skill necessary to operate tactical aircraft is developed from the
fundamentals of taking off and maintaining straight and level flight and culminates in
combat mission ready status where he or she is proficient in basic combat maneuvers.
After fundamentals for basic aircrew duties in the assigned aircraft are mastered during
Initial Qualification Training, the aircrew continues to hone skills in advanced aerial
combat tactics during Continuation Training (CT) and Upgrade Training (UGT). The CT
program provides aircrew members with the volume, frequency, and mix of training
necessary to maintain proficiency in the assigned certification/qualification level.
Aircrews in a combat-coded unit may be trained to the proficiency levels of Combat
Mission Ready (CMR) or the Basic Mission Capable (BMC). Aircrew who maintain
qualification and proficiency in the command or unit combat mission are considered
CMR, while aircrews who are qualified in some aspect of the unit mission, but do not
maintain CMR status are considered BMC.
The Ready Aircrew Program (RAP) is a training program developed by local
commanders to align their units’ CT with the skills and qualifications required to meet
their units’ Designed Operations Capability (DOC) statement primary and secondary
mission sets. The RAP Tasking Message, sent to flying wings annually by their
MAJCOM, “defines the minimum required mix of annual sorties, simulator missions and
training events aircrew must accomplish to sustain combat mission readiness” (HQ
ACC/A3T, 2013). RAP lists training and proficiency requirements for each level
according to the crew's position in the unit and qualifications and experience with the

26
weapons system. For example, a typical inexperienced Air Force pilot requires nine
sorties in a single month just to stay proficient in take-off and landing. Beyond the
fundamental take-off and landing is a myriad of other proficiencies that must be
maintained such as night flying, aerial refueling, air-to-ground, air-to-air, or firing guns
for close air support. Flying squadrons first develop long-term annual and quarterly RAP
training plans, and continually refresh and refine these plans into more short term
monthly and weekly training schedules. This process will be referred to as the Aircrew
Mission/Training Scheduling process. Maintenance and Operations leaders then begin
the Flying Scheduling Process by collaborating to develop each of these plans into a
Flying Schedule by communicating requirements, understanding and considering
limitations, and establishing a final, signed agreement between both agencies. The
Aircrew Mission/Training Execution Process begins with the development of the mission
plan. A pilot or Aircrew can spend days planning for an upcoming mission culminating
in the mission pre-brief which occurs immediately before entering the daily flying cycle
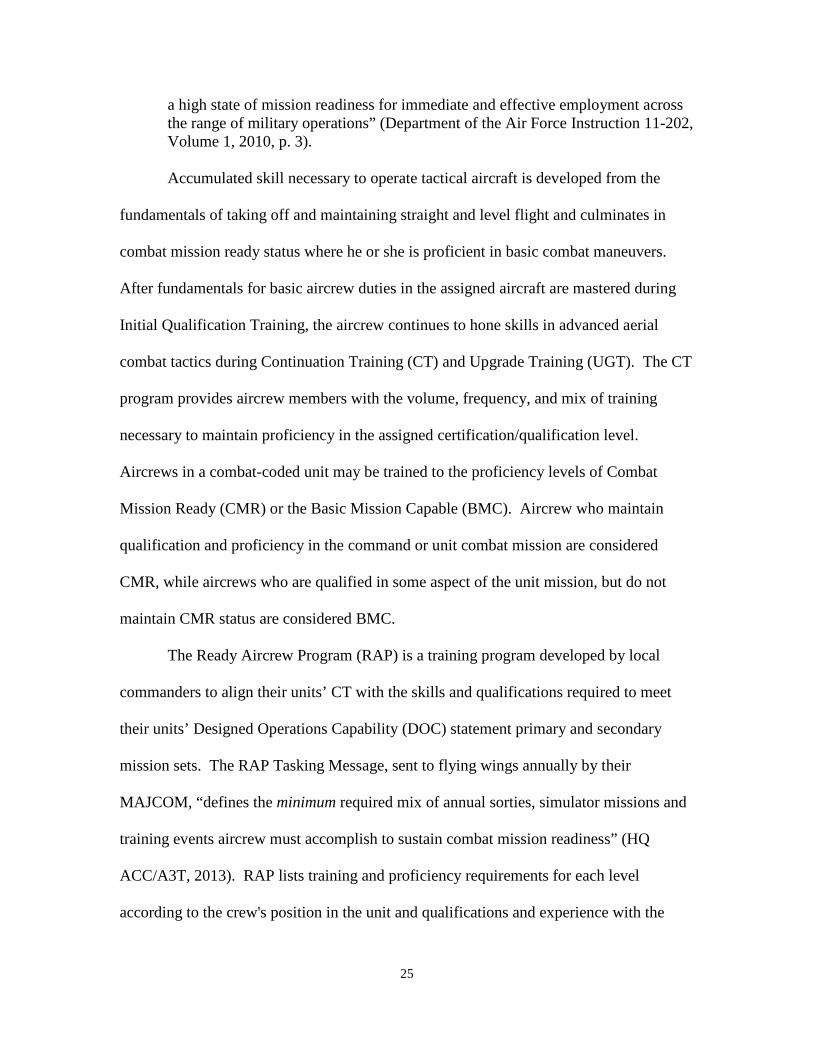
as outlined in Figure 3.
27
Figure 3. Aircrew Mission/Training Scheduling and Execution Processes
Scheduling aircrew training and mission planning are arduous processes for
operators. A single deviation during the short term planning process can disrupt multiple
aircrew training events and cause significant scrap and schedule rework for both
operators and maintenance. Maintenance processes, specifically the delivery of mission-
capable airplanes on-time for scheduled events, are clearly the most critical component to
the execution of the schedule. The short term scheduling process is very closely tied to
success of the Maintenance Scheduling and Execution Processes, which will be described
in detail. Maintenance failure to meet the schedule for execution of planned missions can
turn a well thought out plan into a toppling house of cards.
The Flying Execution Process begins with the aircrew’s arrival at the aircraft, and
is another process where aircraft maintenance processes intersect with the flying process.
These intersections of processes continues to the aircrew’s walk-around inspection,
Operations DebriefMaintenance Debrief
Upgrade Training Professional Military Education
Pre-Mission BriefingMission Planning
Develop Quarterly Flying Schedule
Develop Flying Hour Program
Develop Monthly Flying Schedule
Develop Weekly Flying Schedule
Develop Daily Flying Schedule
Aircraft Walk-around Aircraft Launch Mission Execution Aircraft
Recovery/Parking
Develop Annual Training Program via RAP Tasking
Message
Continuation Training Ancillary TrainingRequirements
Long-term Scheduling
Process
Short-term Scheduling
process
Execution
Execution Analysis

28
through engine start-up and launch procedures and finally ends when the aircraft is
marshaled out of the end-of-runway (EOR) inspection area.
Once an aircraft takes-off and a sortie begins, the Aircrew Mission/Training
Execution Process continues--the Aircrew is required to accomplish a certain number of
flight events for the sortie to be considered effective. A non-effective sortie is one in
which no RAP mission/sortie can be logged, and can be caused by factors such as aircraft
system failures, air aborts, range weather, or in the case of an UGT sortie the pilot’s
failure to progress. Any one of these factors causing a sortie to be non-effective is costly
as it drives the need for an additional sortie to be scheduled to complete the desired
training.
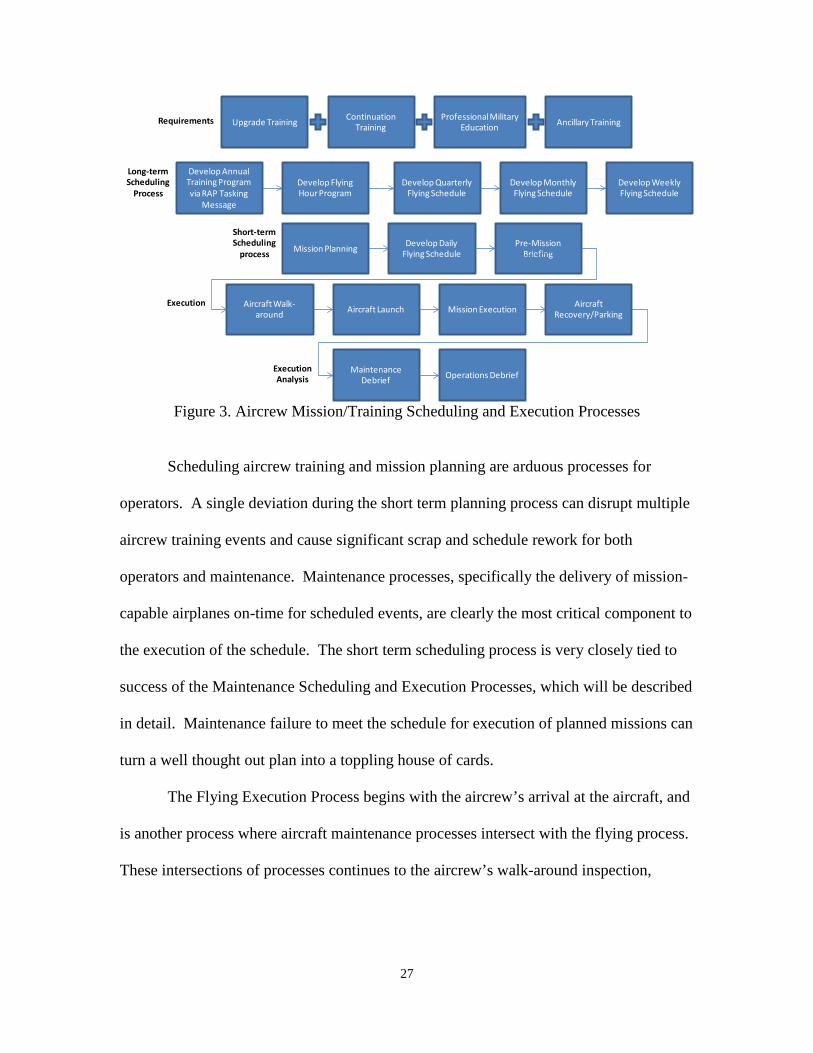
Aircraft Maintenance Scheduling and Execution Process
The return on the investment of training professional maintainers is realized when
the skills gained are applied in the Aircraft Maintenance Scheduling and Execution
processes. Most combat-coded squadrons have a fleet of between 18 and 25 aircraft
assigned and ensuring the long-term health of the fleet demands the continuous attention
of maintenance personnel.
Aircraft and equipment readiness is the maintenance mission. The maintenance function ensures assigned aircraft and equipment are safe, serviceable, and properly configured to meet mission needs. Maintenance actions include, but are not limited to, inspection, repair, overhaul, modification, preservation, refurbishment, troubleshooting, testing, and analyzing condition and performance (Department of the Air Force Instruction 21-101, 2010, p. 14) .
Each fleet of aircraft requires preventative and unscheduled maintenance actions in order
to be safe for flight and capable of performing any mission for which the aircraft is
designed. Scheduled maintenance actions are performed based on prescribed intervals

29
(hourly-based, sortie-based, or calendar-based) must be accomplished without interfering
with the primary flying mission. The scheduling of preventative maintenance events
requires a detailed plan for proper execution and to ensure an adequate number of aircraft
are available for execution of the flying schedule. Unscheduled maintenance occurs
either as a result of pilot-reported discrepancies after flight, or as ground-found
discrepancies discovered during inspections or scheduled maintenance. Both
preventative and unscheduled maintenance can be grounding write-ups, or flyable write-
ups (Department of the Air Force TO 00-20-1, 2010). The severity of the write-ups not
only effects airworthiness, but also determines the status of the aircraft as compared to
the Mission Essential Subsystem List published by lead commands. The focus of
professional maintenance leaders and managers is one of knowing exactly what the status
of each aircraft is, assessing and setting priority, and allocating the proper resources
(manpower and equipment) to restoring each aircraft to fully mission capable status in the
shortest amount of time possible. Figure 4 depicts the Aircraft Maintenance and
Scheduling Process.
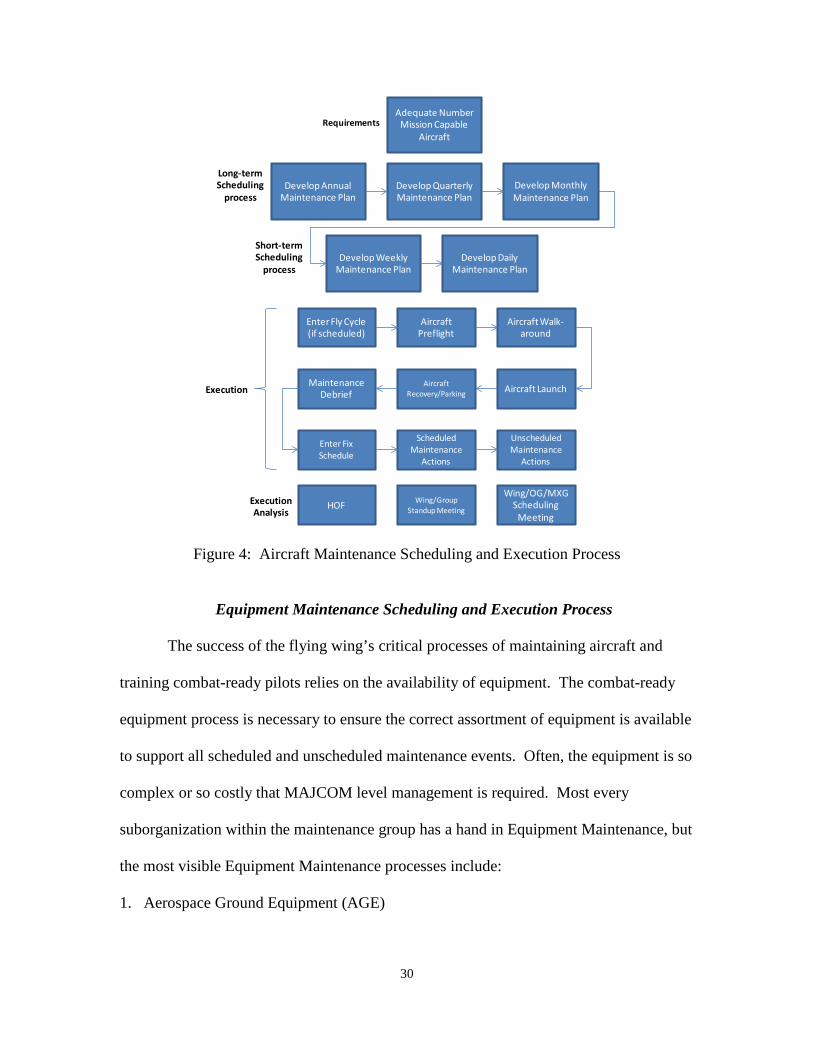
30
Figure 4: Aircraft Maintenance Scheduling and Execution Process
Equipment Maintenance Scheduling and Execution Process
The success of the flying wing’s critical processes of maintaining aircraft and
training combat-ready pilots relies on the availability of equipment. The combat-ready
equipment process is necessary to ensure the correct assortment of equipment is available
to support all scheduled and unscheduled maintenance events. Often, the equipment is so
complex or so costly that MAJCOM level management is required. Most every
suborganization within the maintenance group has a hand in Equipment Maintenance, but
the most visible Equipment Maintenance processes include:
1. Aerospace Ground Equipment (AGE)
Maintenance Debrief
Develop Monthly Maintenance Plan
Develop Quarterly Maintenance Plan
Develop Weekly Maintenance Plan
Aircraft Walk-around
Aircraft LaunchAircraft Recovery/Parking
Develop Annual Maintenance Plan
Enter Fly Cycle (if scheduled)
Aircraft Preflight
Enter Fix Schedule
Unscheduled Maintenance
Actions
Scheduled Maintenance
Actions
Requirements
Long-term Scheduling
process
Develop Daily Maintenance Plan
Short-term Scheduling
process
Execution
HOFWing/OG/MXG
SchedulingMeeting
Wing/Group Standup Meeting
Execution Analysis
Adequate Number Mission Capable
Aircraft
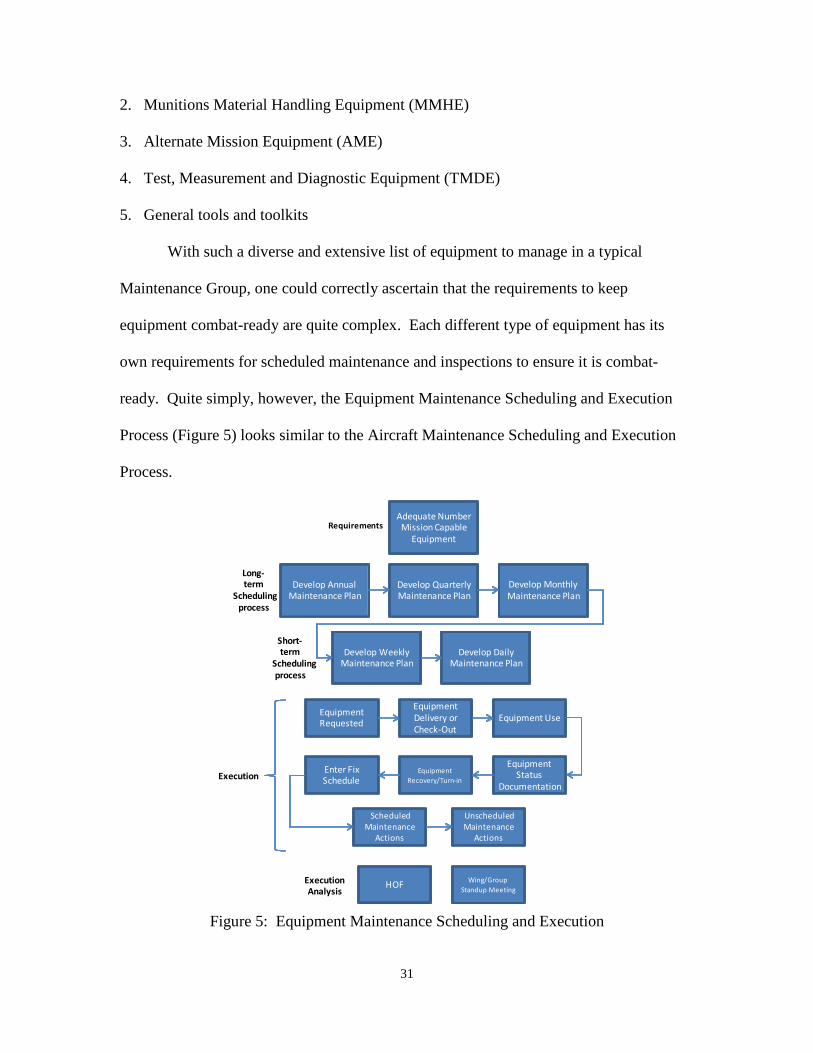
31
2. Munitions Material Handling Equipment (MMHE)
3. Alternate Mission Equipment (AME)
4. Test, Measurement and Diagnostic Equipment (TMDE)
5. General tools and toolkits
With such a diverse and extensive list of equipment to manage in a typical
Maintenance Group, one could correctly ascertain that the requirements to keep
equipment combat-ready are quite complex. Each different type of equipment has its
own requirements for scheduled maintenance and inspections to ensure it is combat-
ready. Quite simply, however, the Equipment Maintenance Scheduling and Execution
Process (Figure 5) looks similar to the Aircraft Maintenance Scheduling and Execution
Process.
Figure 5: Equipment Maintenance Scheduling and Execution
Enter Fix Schedule
Develop Monthly Maintenance Plan
Develop Quarterly Maintenance Plan
Develop Weekly Maintenance Plan
Equipment Use
Equipment Status
Documentation
Equipment Recovery/Turn-in
Develop Annual Maintenance Plan
EquipmentRequested
Equipment Delivery or Check-Out
Unscheduled Maintenance
Actions
Scheduled Maintenance
Actions
Requirements
Long-term
Schedulingprocess
Develop Daily Maintenance Plan
Short-term
Schedulingprocess
Execution
HOF Wing/Group Standup Meeting
Execution Analysis
Adequate Number Mission Capable
Equipment
32
Maintenance Training Scheduling and Execution Process
The success of any flying unit depends on the availability of the right number of
maintainers with the right skill sets and experience to meet mission requirements. Skills
and experience are a result of training, and just as in pilot training, the cumulative
knowledge that our most valuable and technically advanced maintainers require comes at
significant expense over time. Without trained and skillful maintainers to generate
aircraft, airpower is unsustainable, pilot training is impossible, and mission objectives are
unachievable. AFI 21-101 states:
Maintenance training is an essential element of improving and sustaining unit capability; it must receive priority treatment by SQ/CC and MOO/MX SUPT. When balancing resources (e.g., aircraft, support equipment, facilities, tools, funding, personnel), maintenance training carries an equal priority with the operational training mission. Accomplish maintenance training away from the production/test environment (whenever possible) to eliminate/minimize distractions (Department of the Air Force Instruction 21-101, 2010, p. 128)
Undoubtedly, the investment the Maintenance Group makes to develop combat-
ready maintainers is worthy and comes with another set of processes that ultimately add
value and affect customer satisfaction. According to AFP 36-2241, Professional
Development Guide, the strategy of the Air Force’s Education and Training (E&T)
program is, “Develop, manage, and execute realistic and flexible training programs to
produce a highly skilled, motivated force capable of carrying out all tasks and functions
in support of the Air Force mission. These programs should provide the foundation for
Air Force readiness” (Department of the Air Force Pamphlet 36-2241, 2013, p. 275)
The components of the Maintenance Group's Maintenance Training Scheduling
and Execution include on-the-job training (OJT), Upgrade Training (UGT), and
33
Certification Training. The OJT program includes job knowledge, job proficiency and
job experience. For maintainers, the job knowledge component is satisfied by
successfully completing a career development course (CDC) that provides career
knowledge, general task, and deployment/unit type code (UTC) task knowledge. The Job
Proficiency component is the initial training an Airman receives at his first work center
and is achieved through hands-on training on tasks in the work center (work center
requirements). The job experience component is gained during and after UGT. UGT is
how an Airman progresses through the skill levels (3-, 7-, and 9-skill level) and is
considered the most vital piece to an Airman’s total training program (Department of the
Air Force Instruction 36-2201, 2010).
To achieve his 3-skill level and become an Apprentice, an Airman must complete
an initial skills course (technical school). To be a 5-skill level, or Journeyman, an
Airman must complete the CDC for his Air Force Specialty Code (AFSC) and the
mandatory core tasks outlined in the Career Field Education and Training Program
(CFETP). Additionally, the 5-skill level requires a minimum of 12 months of UGT and
meet the mandatory requirements listed in the Air Force Enlisted Classification Directory
(AFECD), be recommended by his supervisor and approved by his commander
(Department of the Air Force Instruction 36-2101, 2013).
An Airman becomes a Craftsman when he is awarded his 7-skill level. To
achieve his 7-skill level the Airman must complete a second CDC (7-level craftsman
course), meet the mandatory requirements listed in the AFECD, complete an additional
12 months of UGT, be recommended by his supervisor and approved by the commander
(Department of the Air Force Instruction 36-2101, 2013).

34
The top three percent of the enlisted force achieve the 9-skill level, or
Superintendent. To be awarded the 9-skill level the member must be a Senior Master
Sergeant or Chief Master Sergeant, be recommended by his supervisor and approved by
the commander (Department of the Air Force Instruction 36-2101, 2013).
Developing a skillful maintainer takes a comprehensive plan and requires a
tremendous amount of time and effort. In addition to the skill level progression outlined
above, a maintainer attends courses at Field Training Detachments (FTD) throughout the
Air Force to gain formal training on specific systems such as hydraulics, engines, or
advanced avionics. Furthering the training regimen is recurring training, computer based
training and Professional Military Education.
The maintainer’s bottom-line mission is to deliver safe and reliable airplanes to
keep the war-fighter in the cockpit as safe as possible in an inherently dangerous
environment, and the Maintenance Training Scheduling and Execution Processes (Figure
6) are vital in ensuring that mission succeeds.

35
Figure 6: Maintenance Training Scheduling and Execution Process
Monitoring and improving critical processes ultimately leads to achieving
objectives and customer satisfaction. Responding to the necessity of improving processes
takes careful consideration if resources are to be used effectively and process operations
are to be optimized to the benefit of the customer. Meaningful thought and action to
improve not only add to customer satisfaction, but also ensure that processes stay ahead
of increasing challenges and the declining curve of resources.
Upgrade Training (skill level
progression)
Qualification Training (On-the-
job training)
Master Tasking Listing Established
Master Training Plan Established
Develop Training Program
Certification Training Ancillary Training
Individual Training Plan Established
Attend MTF classes Attend FTD classes Accomplish CBTsAccomplish OJT Attend PME classes
Requirements
Long-term Scheduling
process
Develop Weekly Class Schedule
Develop Monthly Class Schedule
Develop Class Requirements/
Quotas
Trainers/Students Attend Class
Short-term Scheduling
process
Wing SOT Meeting Group SOT Meeting Flight SOT MeetingSquadron SOT
MeetingExecutionAnalysis
36
Financial Perspective
The Financial Perspective of the balanced scorecard contains the big-picture
metrics that gives the manager a holistic view of whether the execution of stated strategy
is leading to acceptable end results. The “how” of how an organization arrived at these
big picture metrics is detailed through measures chosen in the other perspectives.
We could focus all of our energy and capabilities on improving customer satisfaction, quality, on-time delivery, or any number of things, but without an indication of their effect on the organization’s financial returns they are of limited value. Classic lagging indicators are normally encountered in the financial perspective (Niven, 2002, p. 17). In the corporate world, the shareholders’ perspective is of paramount importance
to business leaders. Shareholders are driven by and demand a return on their investment
dollars. For the Air Force, the shareholders are the Combatant Commanders who are
responsible for the prosecution of contingency operations in their area of responsibility.
It is vitally important for Maintenance Group leaders to consider, “How do the
shareholders view us?” The Aircraft Maintenance community must develop and
maintain performance measures that accurately convey to the Combatant Commander the
bottom-line readiness of the units that are preparing to support them. Air Force
Personnel Directive 21-1, Maintenance, defines readiness as “The ability of US military
forces to fight and meet the demands of the national military strategy. Unit readiness is
the ability to provide capabilities required by the combatant commanders to execute their
assigned missions” (Department of the Air Force Policy Directive 21-1, 2003, p. 6).
From the Maintenance Group standpoint, one must consider the critical assets under the
group’s control--aircraft, maintenance personnel, and equipment--and how the
culmination of the previously described processes affects their bottom-line readiness.

37
Learning and Growth Perspective
Once you identify measures and related initiatives in your Customer and Internal Process perspectives, you can be certain of discovering some gaps between your current organizational infrastructure of employee skills and information systems, and the level necessary to achieve your results. The measures you design in this perspective will help you close that gap and ensure sustainable performance for the future. (Niven, 2002, p. 16). The Learning and Growth Perspective applies to the less tangible internal
elements that sustain value added processes. Elements typically found in the Learning
and Growth Perspective are “enablers” of all the other perspectives. One might consider
technology, training or communications in the Learning and Growth Perspective, but for
the purpose of clarity, the researcher chose the maintenance workforce because the
maintainers are the foremost and most important enablers of all other processes and
perspectives. For the Maintenance Group, the number one internal element that sustains
the primary value added processes is trained and skilled personnel. From the perspective
of the Maintenance Group's employees, the maintainers, a more fitting description of the
"gaps" between infrastructure of skills and the level necessary to achieve results would be
the workforce quality. Workforce quality could take into account skill level and
experience level, quality of maintenance, safety of maintenance, maintenance discipline,
and retention rates.
Maintenance Group's Balanced Scorecard
While Kaplan and Norton formulated the four perspectives outlined in Figure 2,
they also, “recognize these four perspectives should be considered a template, not a
straight jacket. These perspectives are intended to portray the essential elements that can
lead to success in a typical organization” (Kaplan & Norton, 1996). In other words, the
38
creator of the balanced scorecard for any organization must use some latitude to tailor the
framework to best fit organizational requirements/structure and the needs of leaders and
managers that will use the balanced scorecard to develop strategy.
To meet the unique requirements of a typical CAF Maintenance Group, the
researcher made adjustments to Kaplan and Norton's balanced scorecard to develop the
Proposed Maintenance Group Balanced Scorecard (Figure 7). The first perspective
remains as the Customer perspective. Since a Maintenance Group’s value is not
measured in financial terms, the second perspective was renamed “Readiness” which
better reflects what is expected by the customer and stakeholders (the combatant
commander). The measures that fall under “Readiness”--aircraft, maintenance personnel,
and equipment--tell us whether our strategy execution, which is detailed through
measures chosen in the other perspectives, is leading to improved bottom-line results.
The third perspective remains as the Processes Perspective as suggested by Kaplan and
Norton, while the last perspective has been retitled “Workforce Quality” Perspective.
Figure 7 depicts the Proposed Maintenance Group Balanced Scorecard Perspectives and
the Perspective Categories that fall under them. This proposed Balanced Scorecard
framework was used as the model to be evaluated as described in Chapter III,
Methodology.
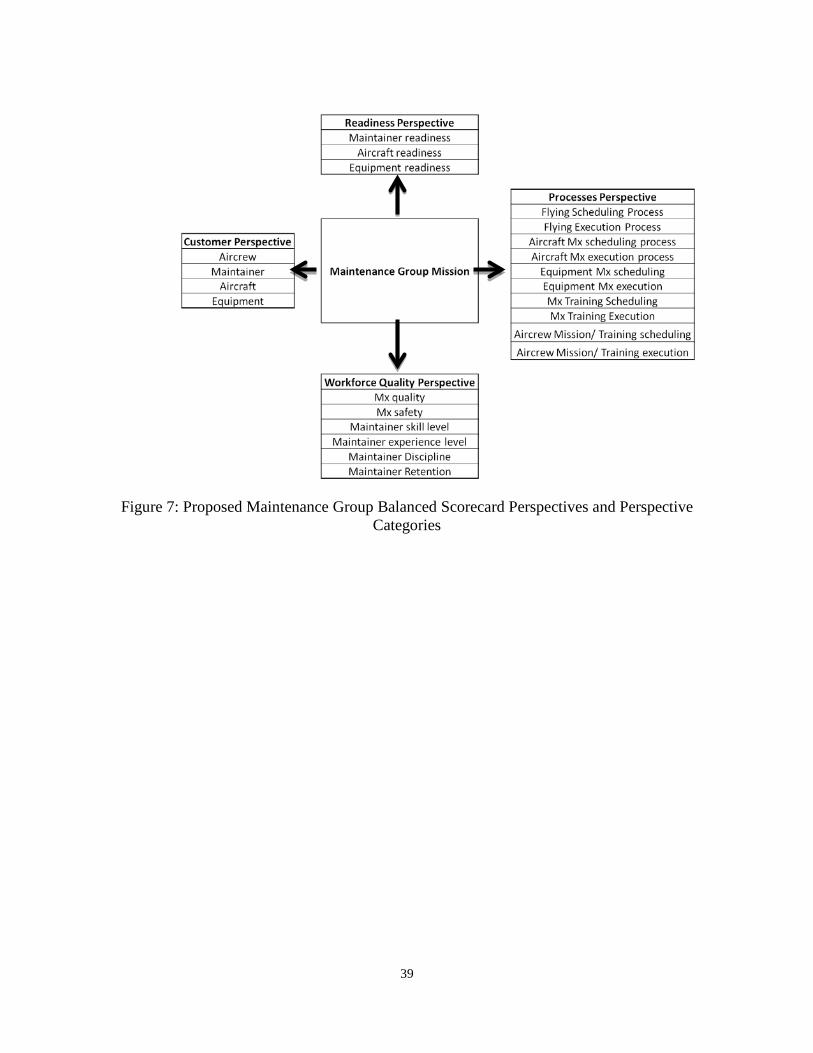
39
Figure 7: Proposed Maintenance Group Balanced Scorecard Perspectives and Perspective Categories
40
III. Methodology
Overview
The purpose of this chapter is to outline the methods used in this study. First, a
background for survey method of research and why they were chosen will be given,
followed by a detailed description of the survey tool that was administered. The
researcher will discuss measures of reliability and error addressed in the study, then
address data preparation and the data analysis methodology, including statistical analysis,
content analysis, and correlation analysis.
Method
The researcher chose to utilize a survey as the method of data collection.
“Surveys are systems for collecting information from people to describe, compare, and
predict attitudes, opinions, values and behavior based on what people say or see and what
is contained in records about them and their activities” (Fink, 2003). The researcher
chose to apply this research method for two reasons:
1) “Provides standardized measurement that is consistent across all respondents
and ensures that comparable information is obtained about everyone who is
described.” (Fowler, 2014)
2) Probability sampling enables one to have confidence that the sample is not a
biased one and to estimate how precise the data are likely to be. Data from a
properly chosen sample are a great improvement over data from a sample who
attend meetings, speak loudest, write letters, or happen to be convenient to
poll. (Fowler, 2014)

41
Survey Formulation Methodology
The researcher used the results of the literature review to formulate a survey to be
sent to aircraft maintenance officers with CAF maintenance experience. The purpose of
this survey was to query the maintenance experts who actually use the sanctioned metrics
in the management of their organizations to:
1. Explore the utility of the balanced scorecard framework for use in a Maintenance
Group
2. Explore the optimal frequency of metrics analysis at each maintenance management
level
3. Evaluate the "goodness" of individual maintenance metrics
The survey was a cross-sectional design that gathered descriptive data at one fixed
point in time, and asked 38 questions. These questions included demographic questions,
closed-ended questions, multiple and single-response questions, Likert-scale questions,
and Multiple-rating matrices, dynamic probing as well as open-ended questions.
Demographics
The first section of the survey asked for the survey respondent’s rank, type of
experience and level of experience to establish demographics of the respondents. This
demographic data was used as background information and to differentiate, analyze,
trend and map data survey responses in different ways.
Strategic Objective
The purpose of the second section of the survey was to determine the over-
arching strategic objective of a typical Maintenance Group.

42
Maintenance Group Balanced Scorecard Perspectives
The survey then began to explore the structure of the Maintenance Group
Balanced Scorecard.
Customer Perspective
To establish the structure for the Customer Perspective, the survey asked
respondents whom the customers are the Maintenance Groups serve to achieve their
strategic objective, in terms of providing support, training or services. The potential
customers of the Maintenance Group outlined in Chapter II--Aircrew, maintainers,
aircraft and equipment--were all offered as options, and the respondent could choose as
many as they thought were appropriate.
Processes Perspective
Next, the survey explored the Processes Perspective of the Maintenance Group
Balanced Scorecard. The researcher listed the 10 processes outlined previously, and
asked the respondents to rate the relative importance of each process in providing for the
customer that the respondent had previously identified. The survey continued on to ask
the respondent which of those same processes they believe the Maintenance Group has an
impact on. At this point, the researcher asked respondents to assign metrics from the
cumulative sanctioned metrics list in Appendix C to each of the 10 processes. The
researcher also asked respondents if they felt the set of metrics they assigned to each
process were adequate, and if not, to list and suggest metrics that may be more adequate
to communicate the desired information.

43
Readiness Perspective
The next section examined the Readiness Perspective of the Maintenance Group
Balanced Scorecard. The purpose of this section was to identify the metrics that best
depict the readiness of Maintenance Group entities. The survey outlined the three entities
of the Maintenance Group--aircraft, maintenance personnel, and equipment--and asked
the respondents to choose from the existing set of metrics which best depict the readiness
of each entity. The researcher also asked respondents if they felt the set of metrics
offered and chosen were adequate, and if not, to suggest more adequate metrics to portray
readiness.
Workforce Quality Perspective
The last portion of the Maintenance Group Balanced Scorecard part of the survey
addressed the Workforce Quality Perspective. The purpose of this section of the survey
was to identify the metrics that best depict the quality and skills of maintainers. The
researcher outlined six indicators of Workforce Quality for the respondents, and asked
the respondents to identify appropriate metrics to portray each of those indicators from
the existing set of metrics.
Balanced Scorecard utility and frequency
The purpose of the next section was to determine the utility of the Maintenance
Group Balanced Scorecard, and the optimal frequency of analysis of the metrics in each
perspective. The survey asked respondents to assess the benefit of examining metrics
representing each perspective in the same setting, in order for the researcher to determine
field support or opposition of the concept. The researcher also asked respondents what
44
they felt the optimal frequency of analysis would be for the Maintenance Group Balanced
Scorecard approach.
Efficacy of individual metrics
The last section of the survey asked respondents to evaluate 28 individual
maintenance metrics based on their experience utilizing and analyzing metrics. The
survey asked respondents to select every metric they believe is not "good" for any reason,
and then asked them to explain their reason for each metric selected.
Institutional and Air Force Approval
The researcher applied for Institutional Review Board exemption from human
experimentation requirements, since the survey did not collect sensitive data, which could
reasonably damage the subjects’ financial standing, employability, or reputation. The
demographic data collected also could not map a given response to a specific subject.
This exemption was received through Air Force Institute of Technology review board on
18 December 2014.
The researcher applied for a survey control number, which is required by Air
Force Instruction 38-501, Air Force Survey Program, and received control number
AF14-123AFIT on 5 February 2014.
Population and Sample
As this research was focused on Maintenance Metrics for use in a CAF
Maintenance Group, the population for this research are all members of a CAF
Maintenance Group who use maintenance metrics to aid in decision making and assess
the performance of their organization, equipment, aircraft or personnel. This population
includes officers, enlisted, contract or government civilians who are involved in
45
Maintenance Group operations, including members of the Maintenance Group,
Operations Group, and support agencies.
The researcher elected to use Maintenance Officers in the grade of O-1 through
O-6 as the sample frame of the population. These ranks typically serve at the
Maintenance Group level, and most directly apply the knowledge gleaned from
maintenance metrics analysis. Maintenance Officers in a Maintenance Group serve in
leadership roles that regularly interact with other decision-makers that comprise the
population described above, therefore, have a solid understanding of how metrics are
used by and affect the entire population. Maintenance Officers are charged with
understanding the big picture of Maintenance Group operations, and typically study,
analyze and brief maintenance metrics in detail on a regular basis.
In order to collect data from this sample, manpower data was collected from
Headquarters Air Force Force Development Branch that listed 1,406 Air Force Aircraft
Maintenance Officers in the grade of O-1 through O-6; however, the target population
was actually a sub-category of maintenance officers who had experience in CAF flying
wings.
Testing and Administration
Pre-Test
The survey was pre-tested by nine participants over six rounds of pre-testing. A
pre-test process was conducted to ensure item specificity, readability, representativeness
and face validity. In each round, nine individuals participated to complete the survey and
provide feedback about any procedural or production problems (Dillman, 2007). All nine

46
participants were Maintenance Officers with CAF experience, which made them potential
respondents as well, and included two PhDs, two graduate students, and five
Maintenance Officers currently assigned to CAF flying wings. All nine that were asked to
take the survey participated, for a response rate of 100%. Throughout the pre-test process,
the survey was edited for grammar, content, and structure and resubmitted to participants
until the survey was deemed satisfactory.
Pilot Test
The survey was sent to 51 individuals during the pilot test, who were all part of
the sample frame described above. Out of the 51 asked to complete the survey 27
responded, for a response rate of 53%. All pilot test responses were complete and
therefore added to the data gathered from live survey implementation.
Survey Administration
The Maintenance Metrics survey, administered online from 10-20 February 2014,
targeted Aircraft Maintenance Officers with experience in the CAF at the flying wing and
Maintenance Group level. The purpose of and directions for the survey, authority for the
survey, as well as a guarantee of confidentiality and voluntary participation statement
accompanied the invitation for survey completion sent by E-mail to each potential
participant.
Survey Reliability and Error
Reliability
To test the reliability of the survey, the researcher used the test-retest method,
which asks respondents to complete the survey at two different points in order to measure
how stable the responses are. The researcher sent a pared-down version of the final

47
survey, which consisted of 16 questions, to eight survey respondents who had taken the
original survey one week prior. The researcher then calculated the correlation coefficient
between the responses on the two tests using the Gamma statistic. The researcher chose
the Gamma statistic to measure reliability because of the ranked ordinal nature of the
survey response data, with a small number of response categories. An obtained value of
+1 for gamma indicates the presence of a perfect correlation between two variables, and
an obtained value of -1 for gamma indicates the presence of a perfect negative correlation
(Harding University, 2014). The following equation depicts the calculation for the
Gamma statistic:
Equation 1: Gamma Statistic formula
Number of AgreementsNumber of Inversions
a i
a i
a
i
N NGN N
NN
−=
+==
To determine the significance of the Gamma statistic, a z-score is calculated
based upon formula in Equation 2. The obtained value for the z-score will then be
compared to the critical values of z to determine if the correlation is statistically
significant. The critical value for z at the .05 significance level is +1.96.
Equation 2: Gamma Statistic z-score formula
2(1 )Number of AgreementsNumber of Inversions Number of Cases
a i
a
i
N Nz GN G
NNN
−=
−
===
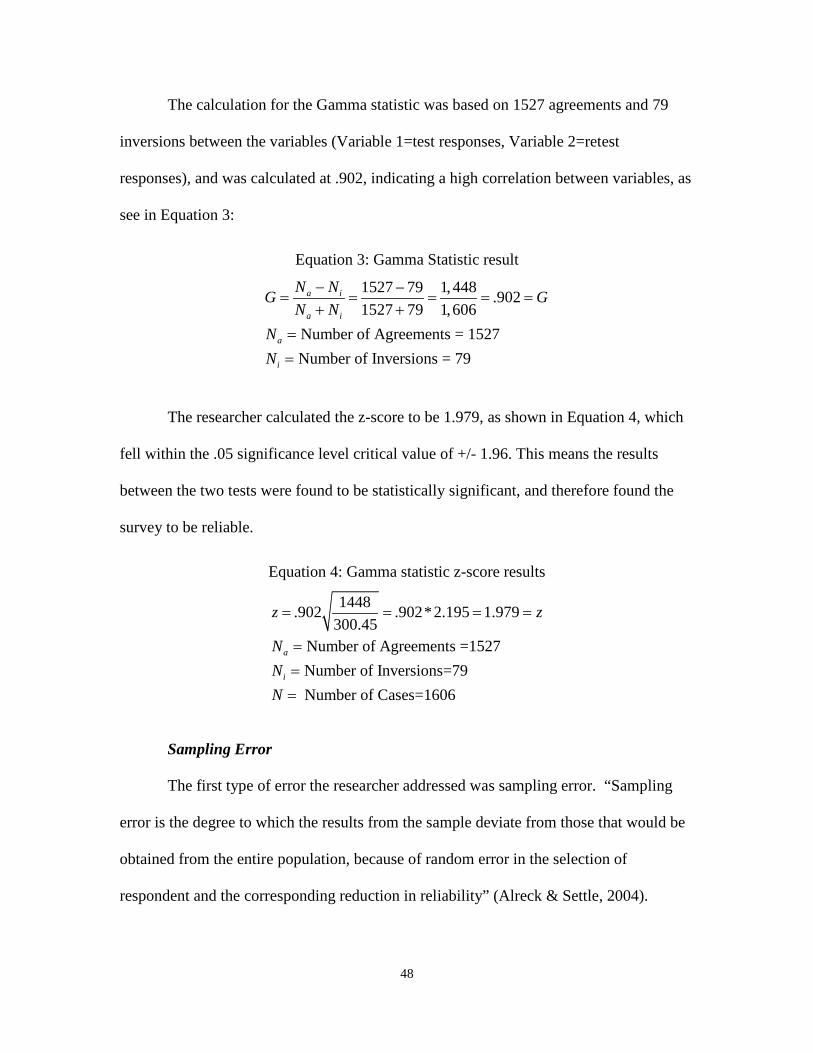
48
The calculation for the Gamma statistic was based on 1527 agreements and 79
inversions between the variables (Variable 1=test responses, Variable 2=retest
responses), and was calculated at .902, indicating a high correlation between variables, as
see in Equation 3:
Equation 3: Gamma Statistic result
1527 79 1,448 .9021527 79 1,606
Number of Agreements = 1527Number of Inversions = 79
a i
a i
a
i
N NG GN N
NN
− −= = = = =
+ +==
The researcher calculated the z-score to be 1.979, as shown in Equation 4, which
fell within the .05 significance level critical value of +/- 1.96. This means the results
between the two tests were found to be statistically significant, and therefore found the
survey to be reliable.
Equation 4: Gamma statistic z-score results
1448.902 .902*2.195 1.979300.45
Number of Agreements =1527Number of Inversions=79 Number of Cases=1606
a
i
z z
NNN
= = = =
===
Sampling Error
The first type of error the researcher addressed was sampling error. “Sampling
error is the degree to which the results from the sample deviate from those that would be
obtained from the entire population, because of random error in the selection of
respondent and the corresponding reduction in reliability” (Alreck & Settle, 2004).
49
Given the population size of Maintenance Officers, the researcher determined that to
minimize sampling error and maximize reliability in the respondent results, she would
strive to achieve a 95% confidence level, with a confidence interval of plus or minus 5%.
Based on these sampling error goals, the desired sample size, or the number of
maintenance officer responses needed, was 302. Since it was impossible to discern from
the manpower data collected which of the 1,406 maintenance officers met the eligibility
criteria of CAF experience, the survey was sent to a sample frame of the population (O-1
to O-6), and used demographic data from the respondents to determine who met the
criteria for the subpopulation. The researcher considered only the responses of officers
with CAF experience during data analysis.
Non Sampling Error
Non-Response Bias
“Non-response bias refers to the mistake one expects to make in estimating a
population characteristic based on a sample of survey data in which, due to non-response,
certain types of survey respondents are under-represented” (Berg, 2005). Since the
sample frame of the survey was limited to Maintenance Officers in the grades of O-1
through O-6, it is possible that results were affected by non-response bias, or bias
incurred because other members of the population were not surveyed. Members of the
population who were not surveyed include enlisted, contract or government personnel,
and members of the Operations Group and support agencies who may utilize maintenance
metrics. Maintenance Officers in grades higher than O-6 also have experience in
Maintenance Groups, but were not surveyed.
50
Response Bias
Another threat to validity of the survey responses was respondent fatigue.
Respondent fatigue occurs when people taking the survey are affected by boredom or
lack of motivation to accurately answer the questions (Lavrakas, 2008). The researcher
observed that only half of respondents who began the survey actually completed it, which
could have been the result of respondent fatigue. Incomplete surveys were not
considered valid for data analysis and those responses discarded, but there is a possibility
that the remaining valid survey responses were not a representative sample o the
population. There is also a possibility that answers that were considered valid were
actually affected by respondent fatigue; however, these cases were not as easy to identify.
When constructing the survey, the researcher made length of the survey as short as
possible without losing the integrity of data being gathered; however, the survey was 38
questions long and could have still introduced respondent fatigue despite the researchers
attempt to avoid it.
Response rate
The researcher calculated the response rate by dividing the number of people who
submitted a completed survey (80% or more of questions answered) by the number of
people she contacted or attempted to contact to complete the survey. As previously
addressed in Chapter III, the researcher used the manpower data collected from
Headquarters Air Force Development Branch to determine a sample frame size of 1,406
Air Force Aircraft Maintenance Officers in the grade of O-1 through O-6; however, the
target population was actually a sub-category of Maintenance Officers who had
experience in CAF flying wings. The researcher first sent the survey to the population

51
sample frame of 1,406 officers on 11 February 2014 and followed up with a subsequent
invitation on 18 February 2014. The survey invitation failed to reach nine members, so
the population sample frame was adjusted to a 1,397 “solicited population” as depicted in
the “solicited population” column shown below. Of the 1,397 Maintenance Officers in
the solicited population, 675 initiated the survey, with 361 completing it for a 54%
completion rate, and a 26% total response rate. Of the 352 completed surveys, 309 of the
officers indicated they had CAF experience for a subcategory response rate of 22%.
These 309 responses from the target sub-category were used in the researcher’s data
analysis. The completion rate, response rate and CAF experience rate by respondents is
depicted in Table 1.
Table 1: Survey Response Rates
Demographics
The first section of the survey asked for the survey respondent’s rank, type of
experience and level of experience to establish demographics of the respondents. This
demographic data, as shown in Table 2, is used as background information and to
differentiate, analyze, trend and map data survey responses in different ways. The
demographic data reveals that the majority of the survey respondents were in the ranks of
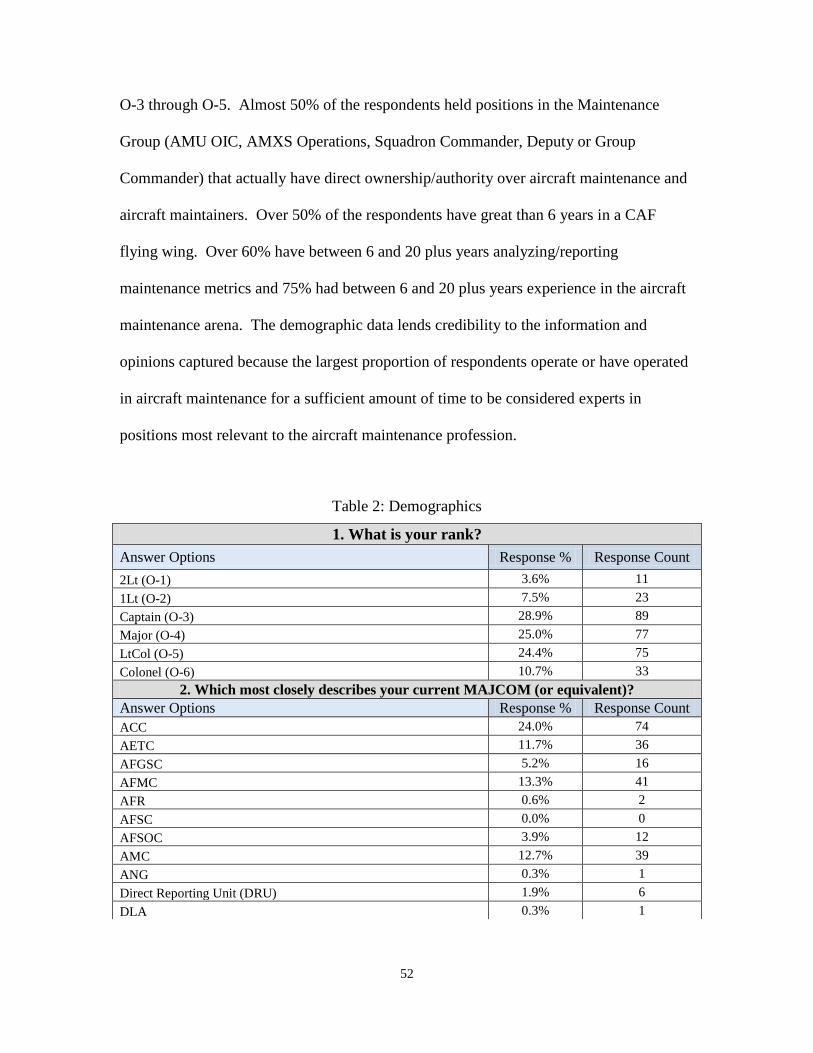
52
O-3 through O-5. Almost 50% of the respondents held positions in the Maintenance
Group (AMU OIC, AMXS Operations, Squadron Commander, Deputy or Group
Commander) that actually have direct ownership/authority over aircraft maintenance and
aircraft maintainers. Over 50% of the respondents have great than 6 years in a CAF
flying wing. Over 60% have between 6 and 20 plus years analyzing/reporting
maintenance metrics and 75% had between 6 and 20 plus years experience in the aircraft
maintenance arena. The demographic data lends credibility to the information and
opinions captured because the largest proportion of respondents operate or have operated
in aircraft maintenance for a sufficient amount of time to be considered experts in
positions most relevant to the aircraft maintenance profession.
Table 2: Demographics
1. What is your rank? Answer Options Response % Response Count 2Lt (O-1) 3.6% 11 1Lt (O-2) 7.5% 23 Captain (O-3) 28.9% 89 Major (O-4) 25.0% 77 LtCol (O-5) 24.4% 75 Colonel (O-6) 10.7% 33
2. Which most closely describes your current MAJCOM (or equivalent)? Answer Options Response % Response Count ACC 24.0% 74 AETC 11.7% 36 AFGSC 5.2% 16 AFMC 13.3% 41 AFR 0.6% 2 AFSC 0.0% 0 AFSOC 3.9% 12 AMC 12.7% 39 ANG 0.3% 1 Direct Reporting Unit (DRU) 1.9% 6 DLA 0.3% 1

53
Table 3: Demographics
Forward Operating Agency (FOA) 0.0% 0
HAF 3.9% 12 PACAF 9.4% 29 USAFCENT 3.2% 10 USAFE 4.9% 15 Other (please specify) 4.5% 14
3. What is the management level of your current position? Answer Options Response % Response Count Flight Commander 3.9% 12 AMU OIC 12.8% 39 EMS/CMS/MXS/Muns/MOS Operations Officer 5.3% 16 AMXS Operations Officer 8.9% 27 Squadron Commander 14.5% 44 Deputy or Group Commander 14.8% 45 MAJCOM 7.9% 24 Depot 2.3% 7 Other (please specify) 29.6% 90
4. How many years of experience do you have in Aircraft Maintenance? Answer Options Response % Response Count Less than 1 year 1.0% 3 1-3 years 8.8% 27 4-6 years 11.4% 35 6-10 years 15.9% 49 10-15 years 15.6% 48 15-20 years 19.8% 61 20+ years 27.6% 85 5. How many years of experience do you have in a Combat Air Forces (CAF) flying wing?
Answer Options Response % Response Count None 0.0% 0 Less than 1 year 4.2% 13 1-3 years 25.3% 78 4-6 years 19.5% 60 6-10 years 22.7% 70 10-15 years 15.9% 49 15-20 years 6.8% 21 20+ years 5.5% 17
6. What levels of maintenance have you managed? Please select all that apply. Answer Options Response % Response Count Flight Commander 96.1% 296 AMU OIC 89.9% 277

54
Table 4: Demographics
EMS/CMS/MXS/Muns/MOS Operations Officer 62.0% 191 AMXS Operations Officer/Squadron Maintenance Officer (SMO) 59.4% 183 Squadron Commander 48.7% 150 Deputy or Group Commander 23.1% 71 MAJCOM 26.0% 80 Depot 24.0% 74 Other (please specify) 14.3% 44
7. How much experience do you have analyzing or reporting maintenance metrics? Answer Options Response % Response Count Less than 1 year 3.6% 11 1-3 years 12.4% 38 4-6 years 19.5% 60 6-10 years 20.8% 64 10-15 years 21.5% 66 15-20 years 13.7% 42 20+ years 8.5% 26 Data Preparation
Data Inspection
The researcher inspected the data for errors that could have occurred during data
entry or errors resulting from respondents’ inconsistent answers. The most conspicuous
errors the researcher searched for were incomplete survey responses, which were not
considered in the analysis.
Closed-ended survey responses
The researcher imported closed-ended survey responses into Excel to perform
descriptive statistical analyses, response rates, and frequencies. Close-ended survey
responses were coded using pre-weighted Likert scales (1=Strongly Disagree to
5=Strongly Agree), or used binary yes/no responses.

55
Open-ended Survey Responses
The researcher used a coding mechanism to organize content and reveal trends or
patterns in open-ended survey responses. The coding mechanism entailed categorizing
responses and assigning a numerical code to each category, then entering into excel for
further statistical analysis such as frequency distribution, central tendency, and
variability.
Survey Analysis Methodology
Statistical Analysis
The researcher used a three-part process to analyze the metrics that respondents
assigned to perspective categories,
First, the researcher applied an initial filter of metrics to consider under each
Balanced Scorecard. The mean and standard deviation of metric selections under each
perspective category were calculated to perform this filter. Chebyshev’s Rule in statistics
states that no useful information is provided on the fraction of measurements that fall
within one standard deviation of the mean (McClave, et al., 2011). Therefore, any
metrics that garnered enough selections to fall above one standard deviation from the
mean number of responses were considered for inclusion in the Maintenance Group
Balanced Scorecard, while any metrics that fell below the one standard deviation
standard were excluded.
Next, the researcher determined that a 50% selection rate for a metric assignment
to a perspective category was the minimum threshold for consideration--if a metric had
less than 50% of respondents who assigned it to the process under review, it was
56
eliminated from consideration for inclusion to the scorecard (Warr, 2014). This filter
eliminated most illogical and unrelated metric and perspective category combinations,
such as Abort Rate assignment to the Equipment Maintenance Scheduling Process. This
filter also prevented metrics from being selected that met the one standard deviation from
the mean criteria described above, but were part of a data set with too low an average and
standard deviation to be meaningful for this study.
Finally, the researcher analyzed the data that indicated the respondents’ feelings
on whether the available metrics adequately measured the efficiency and effectiveness of
the perspective categories under consideration. Four data permutations were possible
when comparing respondents’ feelings regarding metric adequacy data, and the actual
metrics assignment data:
1. Respondents felt the metrics presented were adequate, and at least one metric fell
above one standard deviation from the mean
2. Respondents felt measures were adequate, but no measures fell above one standard
deviation from the mean
3. Respondents felt measures were inadequate, but at least one measure fell above one
standard deviation from the mean
4. Respondents felt measures were inadequate, and no measures fell above one standard
deviation from the mean.
If the results fell into any of these categories with the exception of first, the
researcher would perform additional Content Analysis using respondents’ comments
relating to these metrics and processes.
57
Content Analysis and Qualitative Validity
The researcher opted to use an open-ended question to let respondents state, in
their own words, what problems they had with individual metrics, providing them
“freedom in framing the answers” (Weisberg & Bowen, 1977, p. 49). Providing this type
of freedom required coding to organize content and properly analyze and trend the
responses. The researcher used manifest coding to evaluate the substance of the
respondent’s answer to a question when responses did not meet one of both criteria listed
above. To develop the manifest codes for the open-ended questions, the researcher used
a mix of the theoretical approach and the contextual approach.
The theoretical method develops codes based on expected answers, which the
researcher used in the analysis of efficacy of individual metrics (Weisberg & Bowen,
1977). The researcher used the Caplice and Sheffi metrics evaluation criteria discussed
in Chapter II as the theoretical method to code these open-ended responses into one of the
eight criterion categories.
For perspective category coding, the researcher used the contextual method. This
approach codes answers based on responses received, which was of utility to the
researcher since there were no preconceptions about the answers she would receive to
open-ended questions through the majority of the survey. (Weisberg & Bowen, 1977).
The researcher first sought to classify and trend respondents’ issues with available
metrics; based on respondents’ answers, the researcher developed the following
categories:
1. Not classifiable
2. Don't need to track
58
3. No metrics available but should be
4. Metrics available and looked at MXG level but not listed as choices
5. Metrics Available from external sources but not visible to MXG
6. Metrics available from internal sources but not looked at MXG level
7. Metrics available but are inadequate
The researcher then sought to classify and trend proposed metrics by respondents. The
classifications for proposed metrics were unique to the perspective category in question.
To ensure validity of the coding process, the researcher first independently
analyzed comments for the perspective categories that required additional analysis, and
then utilized an external auditor to review the qualitative study and provide an objective
assessment of the coding (Lincoln & Guba, 1985). The researcher and external auditor
reviewed and discussed respective individual coding results. A comparison of the
individually coded items by the researcher and the external auditor resulted in a
confirmation rate of 92%.
Correlation Analysis
The researcher performed a correlation analysis to examine the relationship
between perspective categories and the selection of metrics used to represent each
category. Correlation analysis is to measure the linear relationship or association
between defined variables; the resulting correlation coefficient (r or rho) indicates how
closely the data fit a linear pattern. A positive correlation coefficient indicates that an
increase in one variable corresponds to an increase in the other variable, implying a
relationship between the two. A negative correlation indicates the opposite; when one
variable increases, the other decreases (Taylor, 1990). Correlation coefficient values fall

59
between -1 and 1. Values falling under 0.35 are generally considered to represent low or
weak correlations, and values falling from 0.36 to 0.67 are considered modest or
moderate correlations. Values falling between 0.68 and 1.0 can be considered strong or
high correlations and values greater than 0.90 can be considered very high correlations
(Taylor, 1990).
A correlation coefficient (r) was used to examine the relationship between
perspective categories with regard to selection of metrics used to represent each category.
A high correlation coefficient when comparing two perspective categories indicates
strong agreement of same metrics selected to measure those categories, while a low
correlation coefficient indicates weak agreement among the choice of metrics selected.
This information can assist in determining if perspective categories selected are
redundant in nature and should be eliminated from the Maintenance Group Balanced
Scorecard, or if available metrics should be tailored to better measure the unique
purposes of each perspective category in question.
JMP 10.0 provided the correlation analysis. The data was normalized by
converting raw number of responses into percentages of total respondents per perspective
category, since the total number of respondents differed from category to category. Each
pair of perspective category entries were placed in a scatterplot, and a best fit regression
line used to indicate the degree of correlation between the two perspective categories
under consideration. For example, the regression line of the plot of perspective
categories A and B in Figure 8 (y = -.1397, x + .4302) shows two perspective categories
with a relatively low slope angle (m = -.13), or correlation.

60
Figure 8: Example Perspective Category Regression Plot
A high correlation coefficient between two perspective categories indicates a high
agreement of votes for the metrics selected to measure those categories. A low correlation
coefficient indicates a low agreement of votes for the metrics selected to measure them.
As outlined in Figure 7, the 19 perspective categories were:
1. Flying Scheduling Process
2. Flying Execution Process
3. Aircraft Maintenance scheduling process
4. Aircraft Maintenance execution process
5. Equipment Maintenance scheduling
6. Equipment Maintenance execution
7. Maintenance Training Scheduling
8. Maintenance Training Execution
9. Aircrew Mission/ Training scheduling
10. Aircrew Mission/ Training execution
y = -0.1397x + 0.4302
0.0%
10.0%
20.0%
30.0%
40.0%
50.0%
60.0%
70.0%
80.0%
90.0%
100.0%
0.0% 10.0% 20.0% 30.0% 40.0% 50.0% 60.0%
Pers
pect
ive
Cate
gory
B, %
of r
espo
nses
Perspective Category A, % responses
Maintainer readinessMetrics 1-28
61
11. Maintainer readiness
12. Aircraft readiness
13. Equipment readiness
14. Maintenance quality
15. Maintenance safety
16. Maintainer skill level
17. Maintainer experience level
18. Maintainer Discipline
19. Maintainer Retention
For the 171 combination pairs of 19 perspective categories, the researcher
determined that any r-value that fell above .68 would be further analyzed, as values in
that range are generally considered high correlations.
While it is true that metrics are designed to intertwine and can be used to
corroborate concerns rising from other metrics and therefore should be correlated, the
researcher sought to identify high correlations where they shouldn’t logically exist. For
example, an extremely high correlation--or nearly exact selections of metrics and
magnitude of those selections--indicates either the right mix of metrics is not available to
portray the desired information, or the suggested perspective categories under
consideration are redundant. This information can substantiate the previously performed
statistical and Content Analysis, and assist in determining if a perspective category
should be eliminated from the Maintenance Group Balanced Scorecard, or if available

62
metrics should be tailored or added to better measure the unique purposes of each
perspective category in question.

63
IV. Results and Analysis
Overview
In this chapter, the researcher will first present the findings from the survey
research relating to the Maintenance Group Balanced Scorecard, and the Perspectives and
metrics contained therein. The researcher will present the results of the statistical
analysis, content analysis and correlation Analysis, as well findings on the efficacy of
individual metrics to refine the proposed Maintenance Group Balanced Scorecard
presented in Chapter III.
Statistical Analysis
Strategic Objective
The first survey question sought to answer the researcher’s first research question,
what is the general strategic objective of a Maintenance Group? When asked what their
assessment of the statement, “The primary strategic objective of a CAF Maintenance
Group is to maintain air and space equipment in a safe, serviceable and ready condition to
facilitate mission-readiness of the flying wing”, 97% of the respondents indicated that
they agreed or strongly agreed with this statement. The comments following this
question established the foundation for the Balanced Scorecard, and helped to clearly
define which customers must be served to achieve the strategic objective, and the critical
processes required to serve those customers. Over 25% of respondents added that while
the definition was mostly correct, CAF units do not work with space assets, and noted the
lack of mention of personnel. For this reason, the researcher refined the general strategic
objective of the Maintenance Group to read, “Maintain aircraft, equipment and personnel
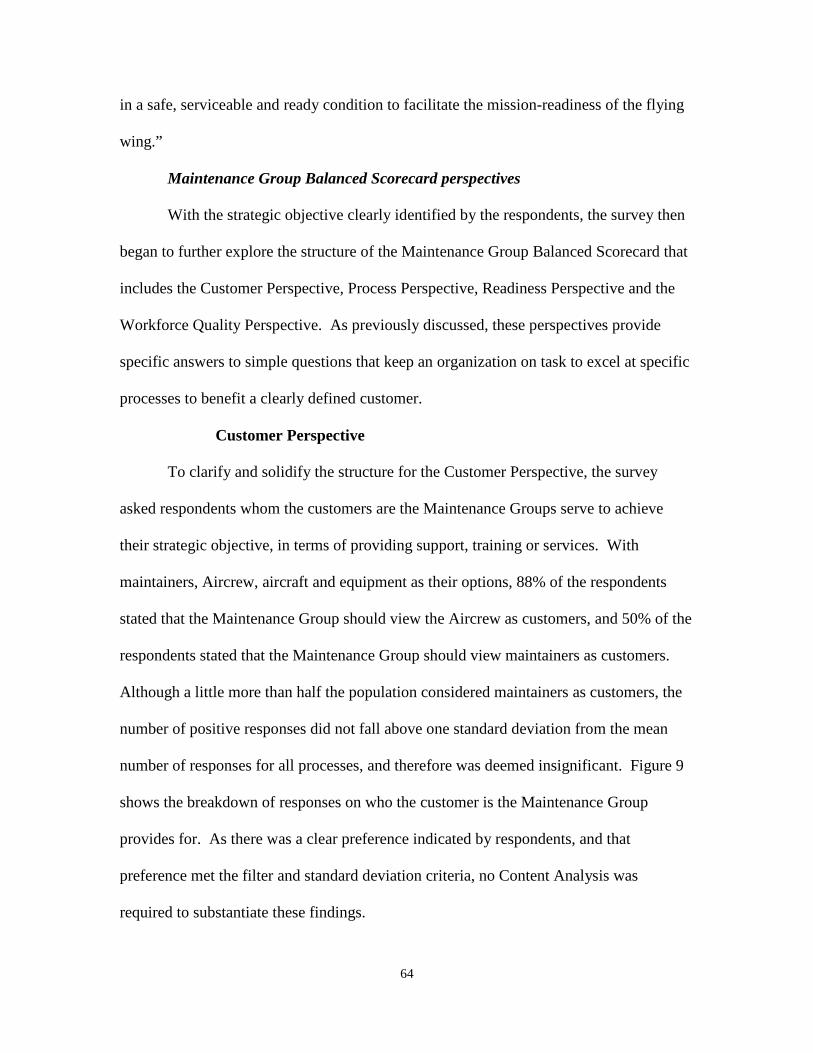
64
in a safe, serviceable and ready condition to facilitate the mission-readiness of the flying
wing.”
Maintenance Group Balanced Scorecard perspectives
With the strategic objective clearly identified by the respondents, the survey then
began to further explore the structure of the Maintenance Group Balanced Scorecard that
includes the Customer Perspective, Process Perspective, Readiness Perspective and the
Workforce Quality Perspective. As previously discussed, these perspectives provide
specific answers to simple questions that keep an organization on task to excel at specific
processes to benefit a clearly defined customer.
Customer Perspective
To clarify and solidify the structure for the Customer Perspective, the survey
asked respondents whom the customers are the Maintenance Groups serve to achieve
their strategic objective, in terms of providing support, training or services. With
maintainers, Aircrew, aircraft and equipment as their options, 88% of the respondents
stated that the Maintenance Group should view the Aircrew as customers, and 50% of the
respondents stated that the Maintenance Group should view maintainers as customers.
Although a little more than half the population considered maintainers as customers, the
number of positive responses did not fall above one standard deviation from the mean
number of responses for all processes, and therefore was deemed insignificant. Figure 9
shows the breakdown of responses on who the customer is the Maintenance Group
provides for. As there was a clear preference indicated by respondents, and that
preference met the filter and standard deviation criteria, no Content Analysis was
required to substantiate these findings.
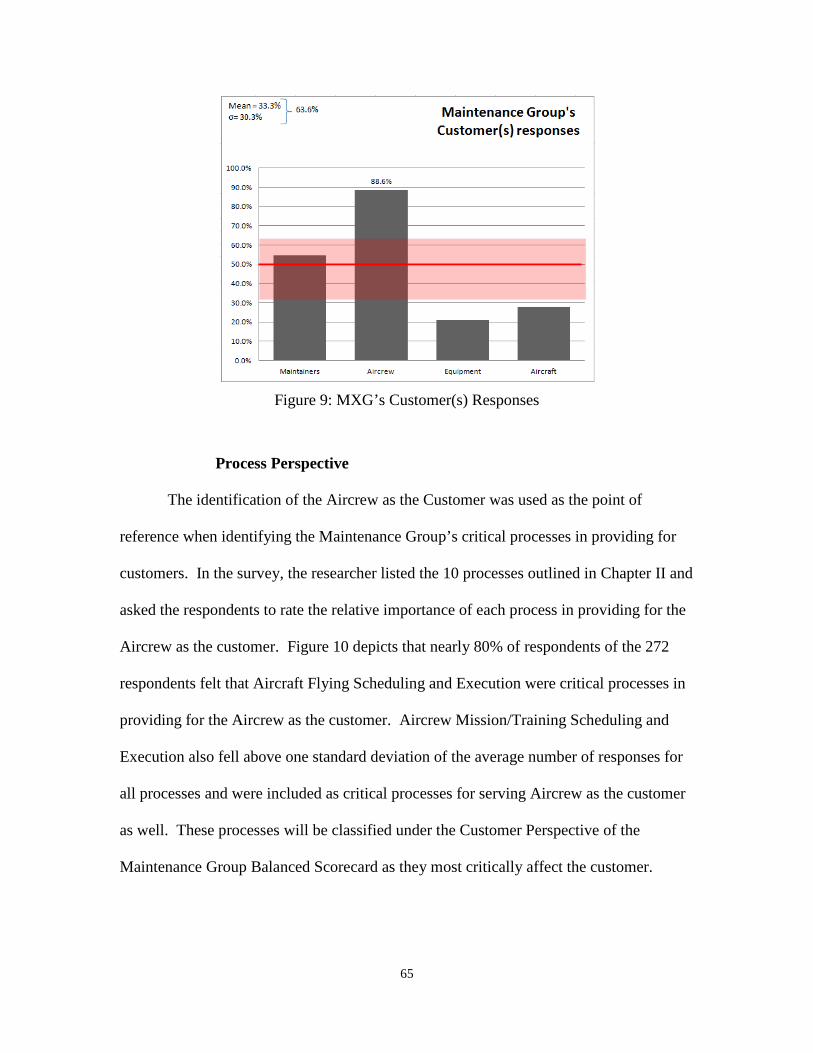
65
Figure 9: MXG’s Customer(s) Responses
Process Perspective
The identification of the Aircrew as the Customer was used as the point of
reference when identifying the Maintenance Group’s critical processes in providing for
customers. In the survey, the researcher listed the 10 processes outlined in Chapter II and
asked the respondents to rate the relative importance of each process in providing for the
Aircrew as the customer. Figure 10 depicts that nearly 80% of respondents of the 272
respondents felt that Aircraft Flying Scheduling and Execution were critical processes in
providing for the Aircrew as the customer. Aircrew Mission/Training Scheduling and
Execution also fell above one standard deviation of the average number of responses for
all processes and were included as critical processes for serving Aircrew as the customer
as well. These processes will be classified under the Customer Perspective of the
Maintenance Group Balanced Scorecard as they most critically affect the customer.
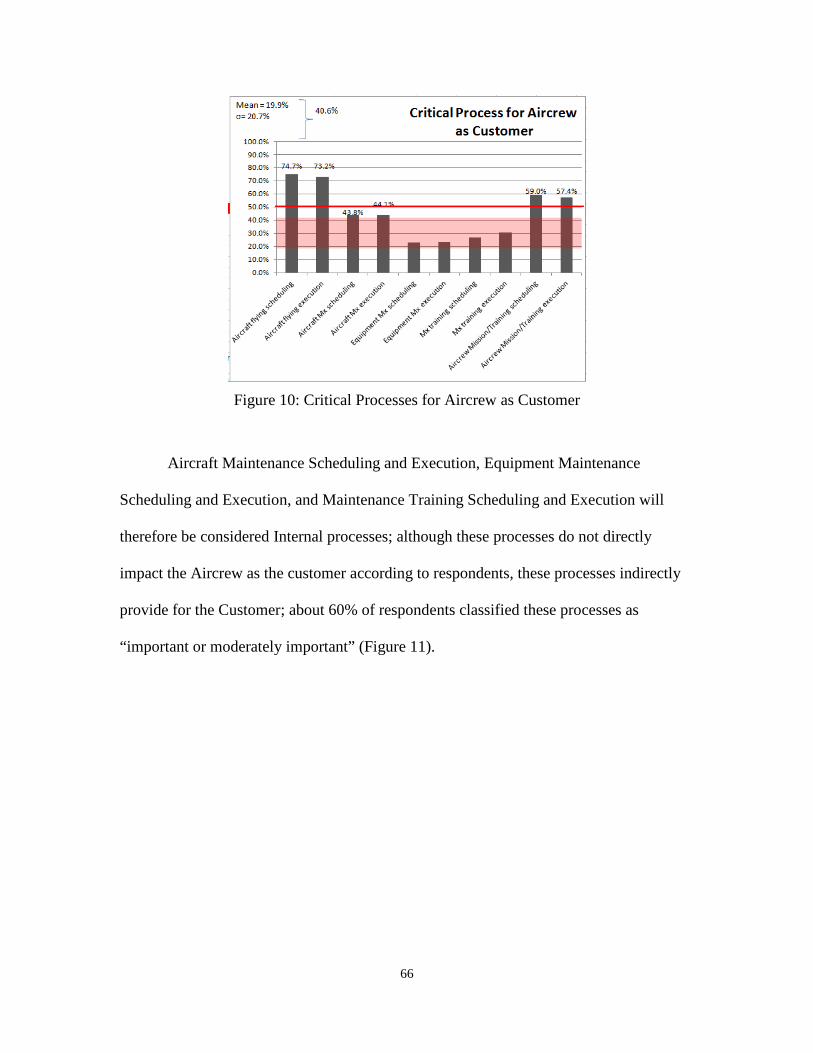
66
Figure 10: Critical Processes for Aircrew as Customer
Aircraft Maintenance Scheduling and Execution, Equipment Maintenance
Scheduling and Execution, and Maintenance Training Scheduling and Execution will
therefore be considered Internal processes; although these processes do not directly
impact the Aircrew as the customer according to respondents, these processes indirectly
provide for the Customer; about 60% of respondents classified these processes as
“important or moderately important” (Figure 11).
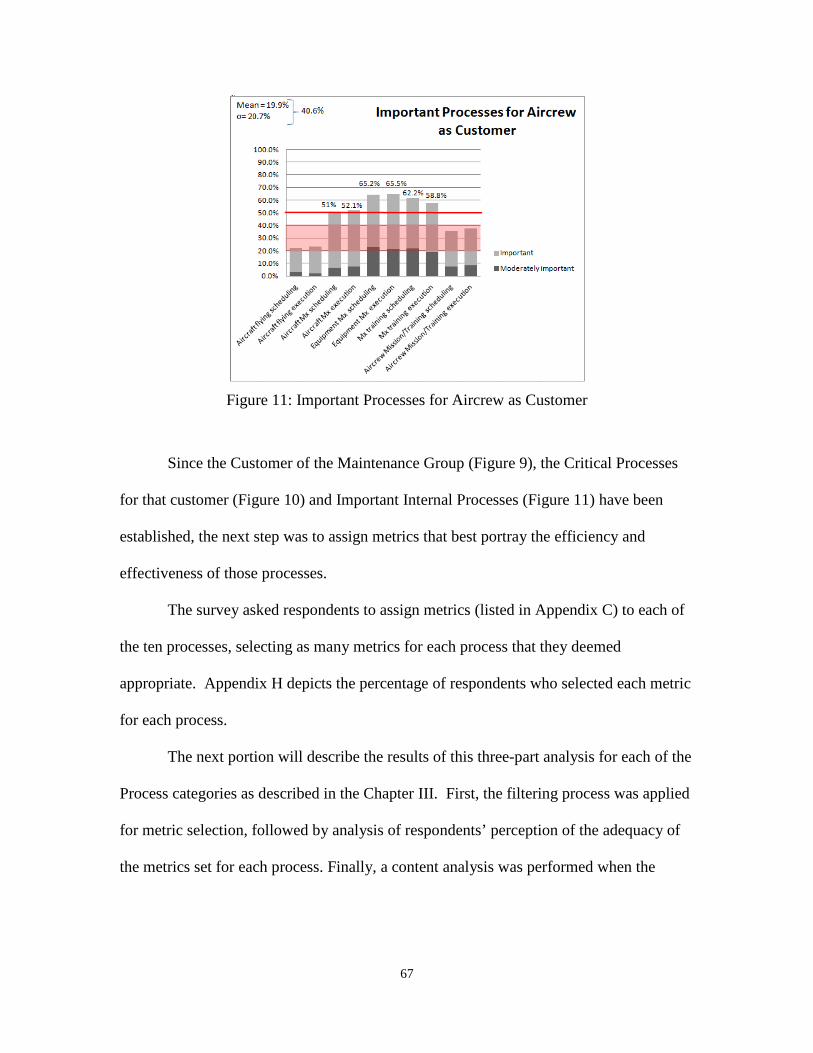
67
Figure 11: Important Processes for Aircrew as Customer
Since the Customer of the Maintenance Group (Figure 9), the Critical Processes
for that customer (Figure 10) and Important Internal Processes (Figure 11) have been
established, the next step was to assign metrics that best portray the efficiency and
effectiveness of those processes.
The survey asked respondents to assign metrics (listed in Appendix C) to each of
the ten processes, selecting as many metrics for each process that they deemed
appropriate. Appendix H depicts the percentage of respondents who selected each metric
for each process.
The next portion will describe the results of this three-part analysis for each of the
Process categories as described in the Chapter III. First, the filtering process was applied
for metric selection, followed by analysis of respondents’ perception of the adequacy of
the metrics set for each process. Finally, a content analysis was performed when the
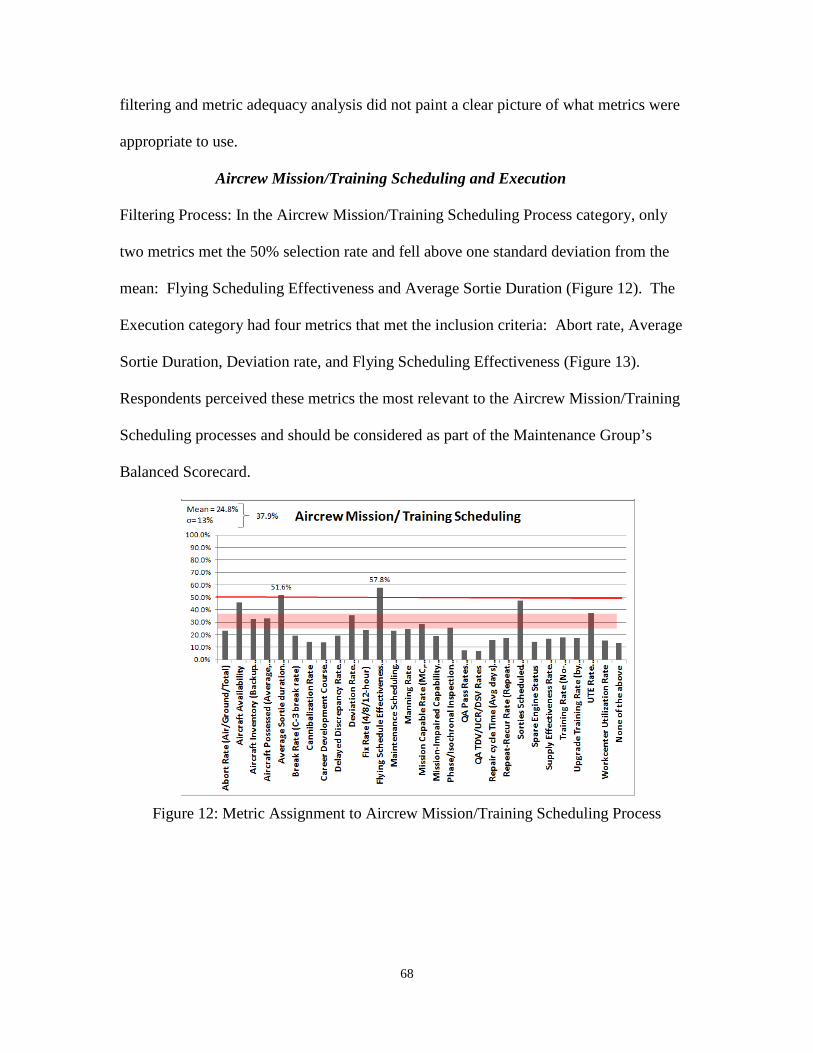
68
filtering and metric adequacy analysis did not paint a clear picture of what metrics were
appropriate to use.
Aircrew Mission/Training Scheduling and Execution
Filtering Process: In the Aircrew Mission/Training Scheduling Process category, only
two metrics met the 50% selection rate and fell above one standard deviation from the
mean: Flying Scheduling Effectiveness and Average Sortie Duration (Figure 12). The
Execution category had four metrics that met the inclusion criteria: Abort rate, Average
Sortie Duration, Deviation rate, and Flying Scheduling Effectiveness (Figure 13).
Respondents perceived these metrics the most relevant to the Aircrew Mission/Training
Scheduling processes and should be considered as part of the Maintenance Group’s
Balanced Scorecard.
Figure 12: Metric Assignment to Aircrew Mission/Training Scheduling Process

69
Figure 13: Metric Assignment to Aircrew Mission/Training Execution Process
Respondent analysis of adequacy: Less than 50% of the respondents felt there
was adequate measure of the Aircrew Mission/Training Scheduling and Execution
processes. (Figure 14).
Figure 14: Adequacy of Available Metrics for Aircrew Mission/Training Scheduling
Process

70
Although at least one measure fell above one standard deviation from the mean
inclusion requirement, respondents felt measures were inadequate; therefore, content
analysis was required to reveal reasons for the perceived inadequacy.
Trend issues with available metrics: Content analysis of comments offered by
respondents regarding issues they had with metrics representing the Aircrew
Mission/Training Scheduling and Execution Processes overwhelmingly pointed to a lack
of visibility of metrics that are studied by the Operations Group that could be of
significant value to the Maintenance Group. Comments indicate the need for plainly
visible measures for progress toward specific goals for Operations that are discussed in
an open forum with Maintenance, so Maintenance is able to see how their processes truly
impact Operations schedules. Current metrics do not clearly articulate if there were
deviations to scheduled missions, only if there were deviations to the scheduled launch of
the sortie. Comments also suggest there is a lack of metrics to understand if Operations
is being judicious with the aircraft provided to them, as well as a lack of metrics to be
able to substantiate the need for such things as adding sorties or making last minute
changes to the schedule. Decisions appear to be assertions based on anecdote and often
put Maintenance in a reactive posture. Bottom line, the comments indicate a lack of
transparency and understanding in Operation’s requirements and exactly how
Maintenance impacts them (Figure 15).
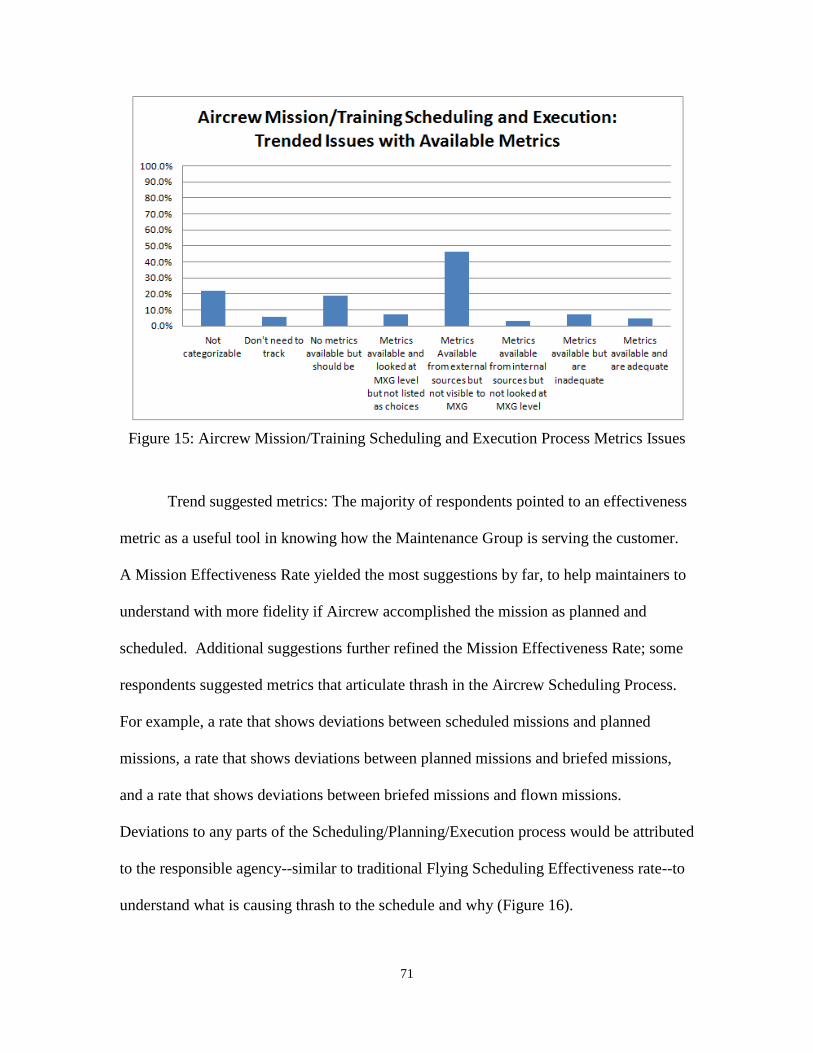
71
Figure 15: Aircrew Mission/Training Scheduling and Execution Process Metrics Issues
Trend suggested metrics: The majority of respondents pointed to an effectiveness
metric as a useful tool in knowing how the Maintenance Group is serving the customer.
A Mission Effectiveness Rate yielded the most suggestions by far, to help maintainers to
understand with more fidelity if Aircrew accomplished the mission as planned and
scheduled. Additional suggestions further refined the Mission Effectiveness Rate; some
respondents suggested metrics that articulate thrash in the Aircrew Scheduling Process.
For example, a rate that shows deviations between scheduled missions and planned
missions, a rate that shows deviations between planned missions and briefed missions,
and a rate that shows deviations between briefed missions and flown missions.
Deviations to any parts of the Scheduling/Planning/Execution process would be attributed
to the responsible agency--similar to traditional Flying Scheduling Effectiveness rate--to
understand what is causing thrash to the schedule and why (Figure 16).
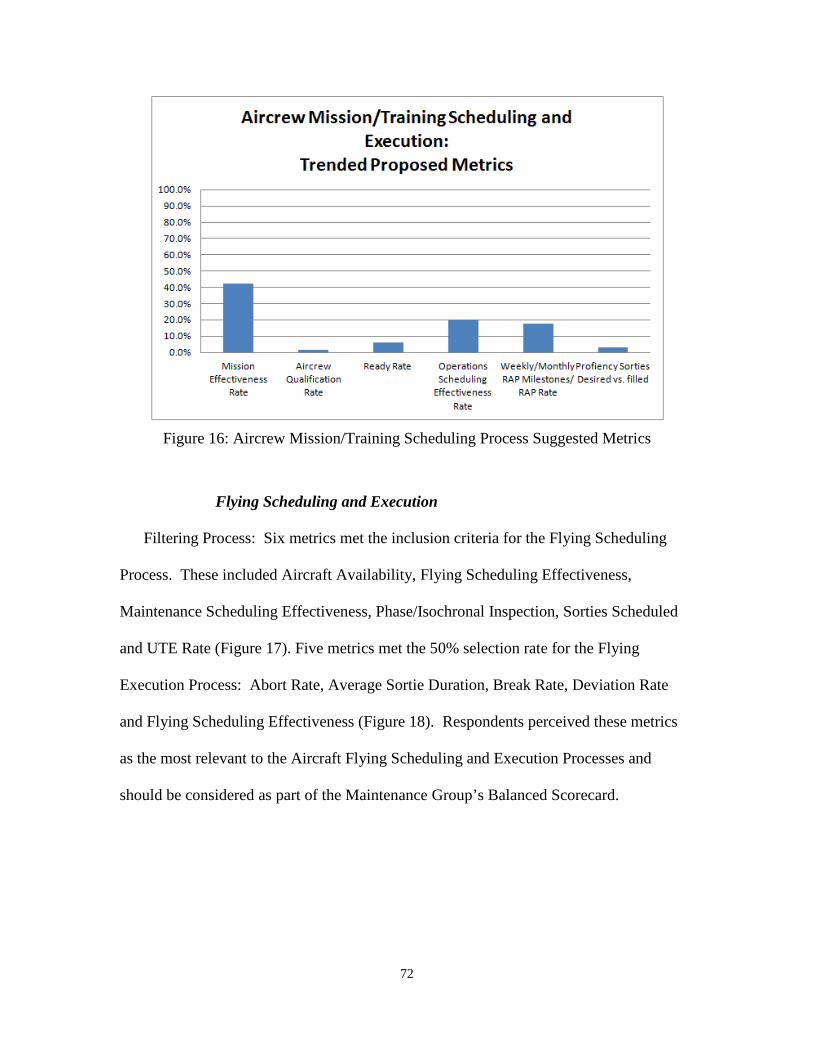
72
Figure 16: Aircrew Mission/Training Scheduling Process Suggested Metrics
Flying Scheduling and Execution
Filtering Process: Six metrics met the inclusion criteria for the Flying Scheduling
Process. These included Aircraft Availability, Flying Scheduling Effectiveness,
Maintenance Scheduling Effectiveness, Phase/Isochronal Inspection, Sorties Scheduled
and UTE Rate (Figure 17). Five metrics met the 50% selection rate for the Flying
Execution Process: Abort Rate, Average Sortie Duration, Break Rate, Deviation Rate
and Flying Scheduling Effectiveness (Figure 18). Respondents perceived these metrics
as the most relevant to the Aircraft Flying Scheduling and Execution Processes and
should be considered as part of the Maintenance Group’s Balanced Scorecard.
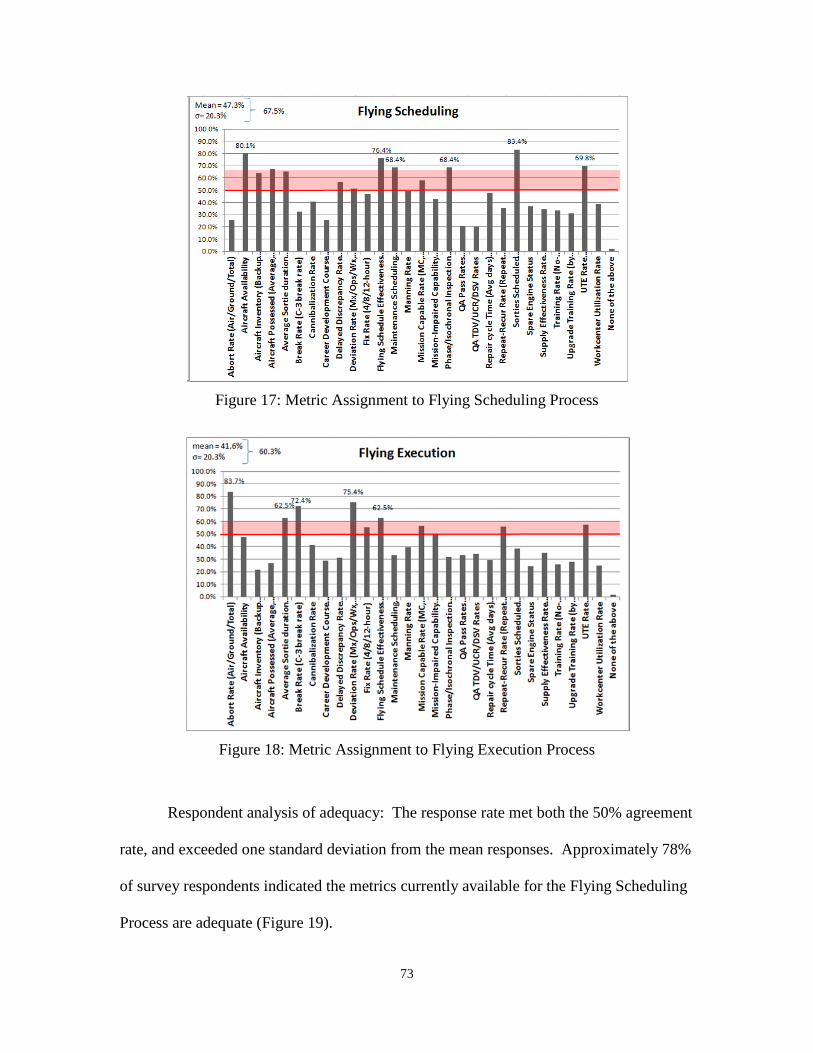
73
Figure 17: Metric Assignment to Flying Scheduling Process
Figure 18: Metric Assignment to Flying Execution Process
Respondent analysis of adequacy: The response rate met both the 50% agreement
rate, and exceeded one standard deviation from the mean responses. Approximately 78%
of survey respondents indicated the metrics currently available for the Flying Scheduling
Process are adequate (Figure 19).

74
Figure 19: Adequacy of Available Metrics for Flying Scheduling Process
Respondents felt measures were adequate, and at least one measure fell above one
standard deviation from the mean--content analysis was not required.
Maintenance Training Scheduling and Execution
Filtering Process: Three metrics for the Maintenance Training Scheduling
Process met the inclusion criteria: CDC Pass Rate, Training Rate and the Upgrade
Training Rate (Figure 20). Three metrics for the Maintenance Training Execution
Process met the inclusion criteria: CDC pass rate, Training Rate and the Upgrade
Training Rate (Figure 21). Respondents perceived these metrics the most relevant to the
Maintenance Training Scheduling and Execution Processes and should be considered as
part of the Maintenance Group’s Balanced Scorecard.
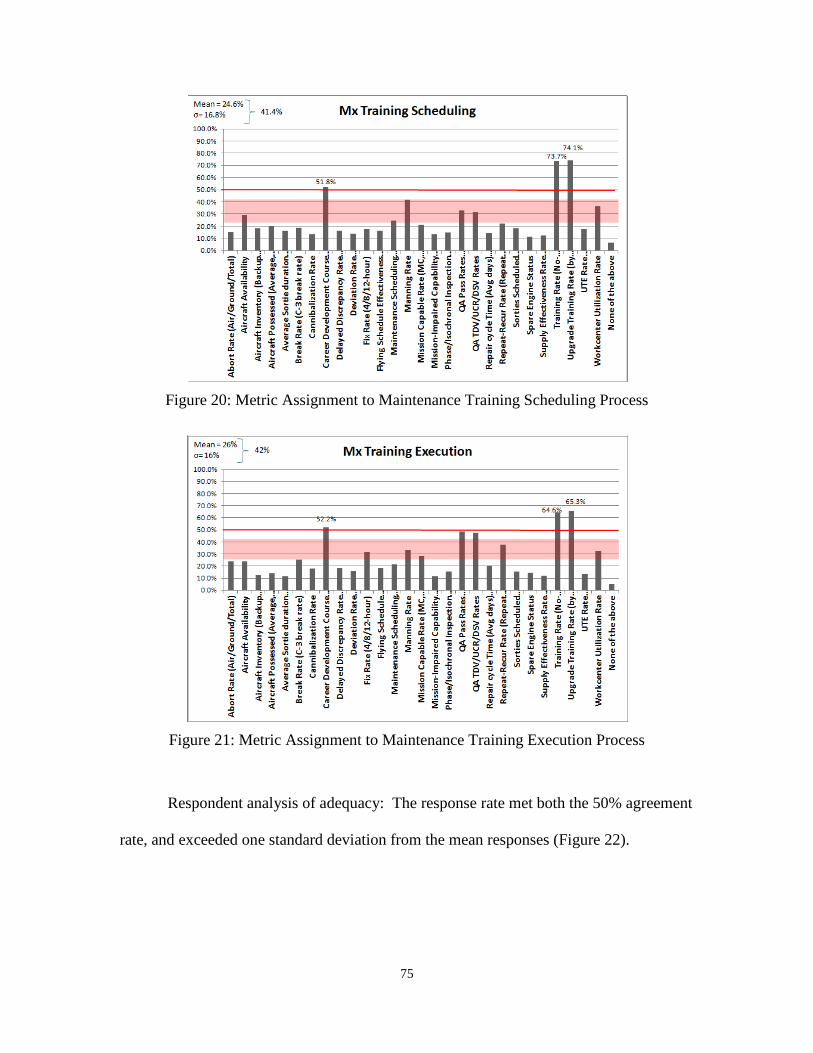
75
Figure 20: Metric Assignment to Maintenance Training Scheduling Process
Figure 21: Metric Assignment to Maintenance Training Execution Process
Respondent analysis of adequacy: The response rate met both the 50% agreement
rate, and exceeded one standard deviation from the mean responses (Figure 22).

76
Figure 22: Adequacy of Available Metrics for Maintenance Training Scheduling Process
Respondents felt measures were adequate, and at least one measure fell above one
standard deviation from the mean—content analysis not required.
Aircraft Maintenance Scheduling and Execution
Filtering Process: Four metrics met the inclusion criteria for the Aircraft
Maintenance Scheduling Process: Aircraft Availability, Delayed Discrepancy Rate,
Maintenance Scheduling Effectiveness, and Phase/Isochronal Inspection (Figure 23). Six
metrics met the inclusion criteria for the Aircraft Maintenance Execution Process: Abort
Rate, Break Rate, Fix Rate, Maintenance Scheduling Effectiveness, Mission Capable
Rate, and Repeat/Recur Rate (Figure 24). Respondents perceived these metrics the most
relevant to the Aircraft Maintenance Scheduling and Execution Processes and should be
considered as part of the Maintenance Group’s Balanced Scorecard.
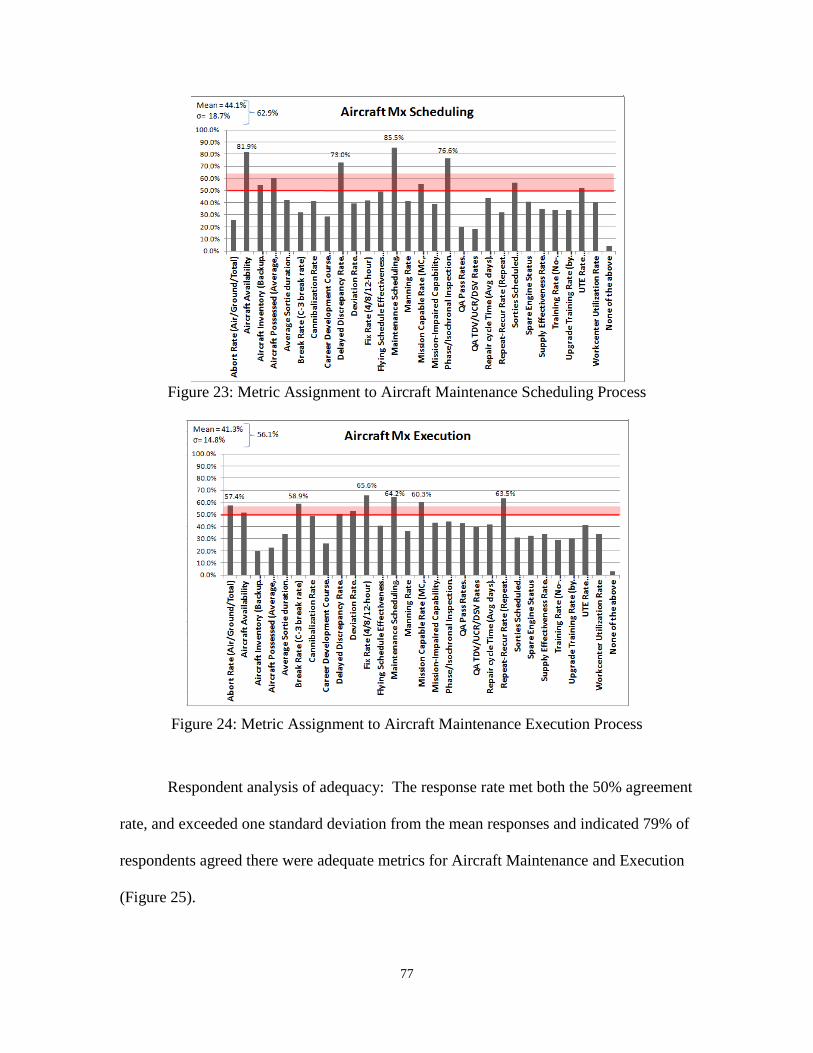
77
Figure 23: Metric Assignment to Aircraft Maintenance Scheduling Process
Figure 24: Metric Assignment to Aircraft Maintenance Execution Process
Respondent analysis of adequacy: The response rate met both the 50% agreement
rate, and exceeded one standard deviation from the mean responses and indicated 79% of
respondents agreed there were adequate metrics for Aircraft Maintenance and Execution
(Figure 25).
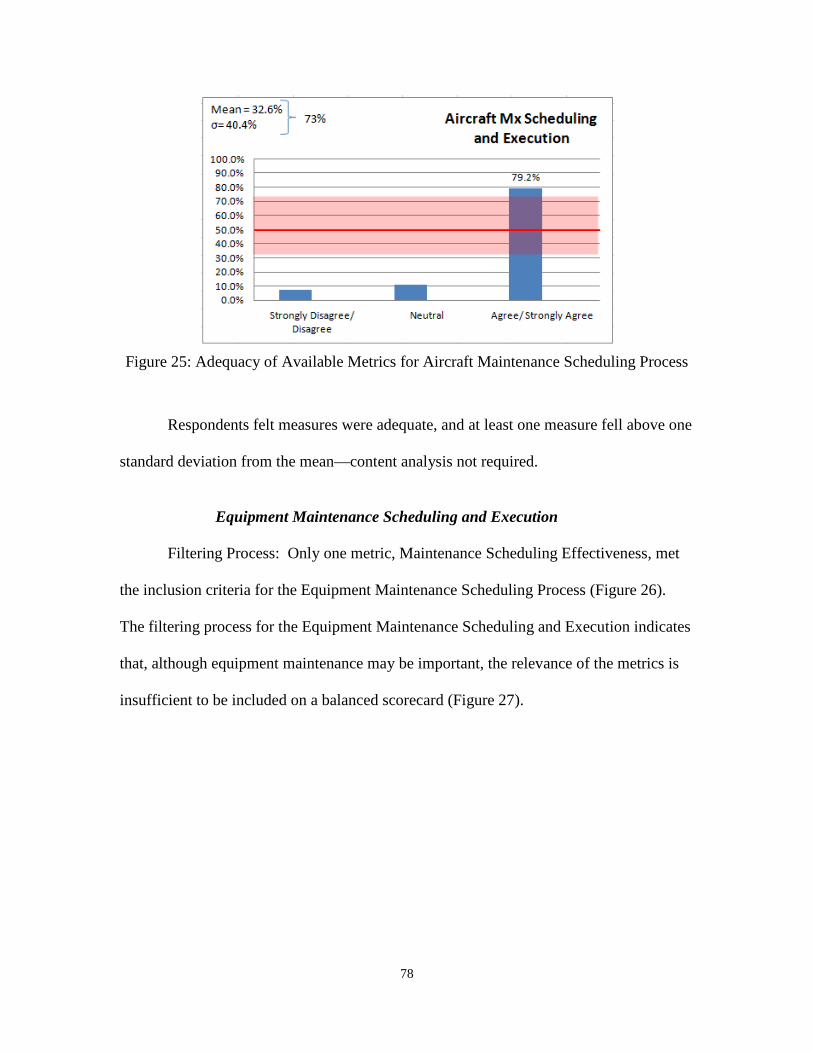
78
Figure 25: Adequacy of Available Metrics for Aircraft Maintenance Scheduling Process
Respondents felt measures were adequate, and at least one measure fell above one
standard deviation from the mean—content analysis not required.
Equipment Maintenance Scheduling and Execution
Filtering Process: Only one metric, Maintenance Scheduling Effectiveness, met
the inclusion criteria for the Equipment Maintenance Scheduling Process (Figure 26).
The filtering process for the Equipment Maintenance Scheduling and Execution indicates
that, although equipment maintenance may be important, the relevance of the metrics is
insufficient to be included on a balanced scorecard (Figure 27).
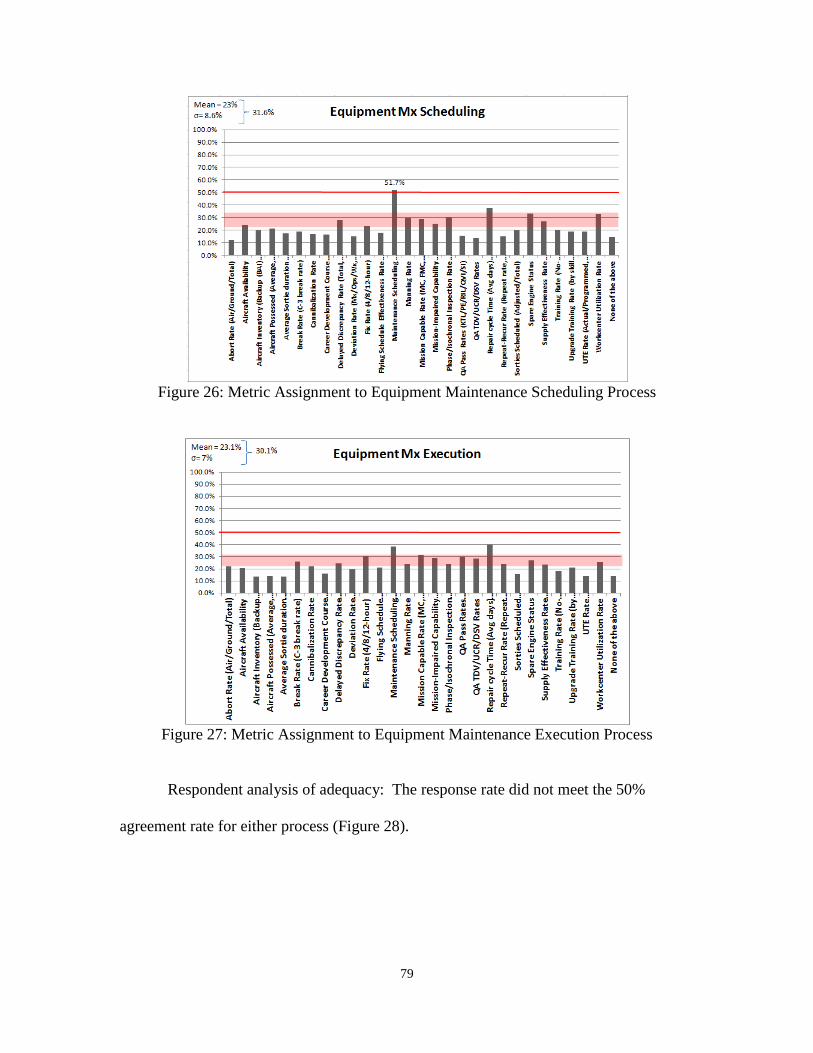
79
Figure 26: Metric Assignment to Equipment Maintenance Scheduling Process
Figure 27: Metric Assignment to Equipment Maintenance Execution Process
Respondent analysis of adequacy: The response rate did not meet the 50%
agreement rate for either process (Figure 28).
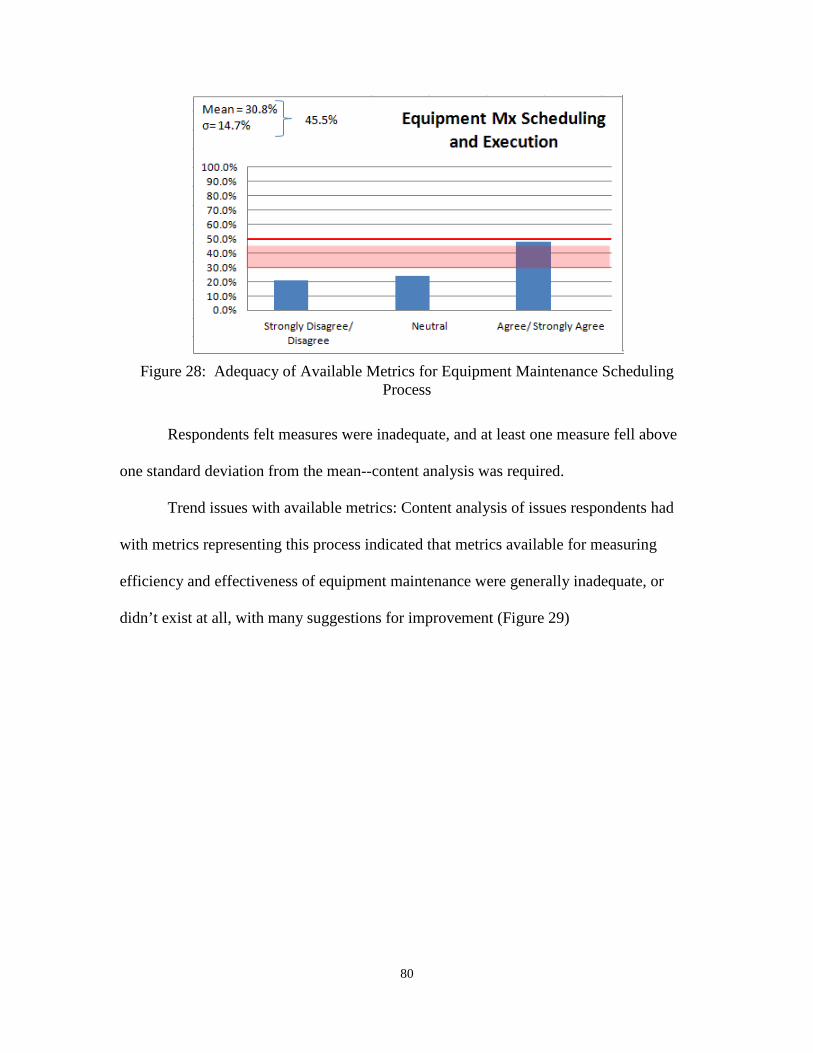
80
Figure 28: Adequacy of Available Metrics for Equipment Maintenance Scheduling
Process
Respondents felt measures were inadequate, and at least one measure fell above
one standard deviation from the mean--content analysis was required.
Trend issues with available metrics: Content analysis of issues respondents had
with metrics representing this process indicated that metrics available for measuring
efficiency and effectiveness of equipment maintenance were generally inadequate, or
didn’t exist at all, with many suggestions for improvement (Figure 29)
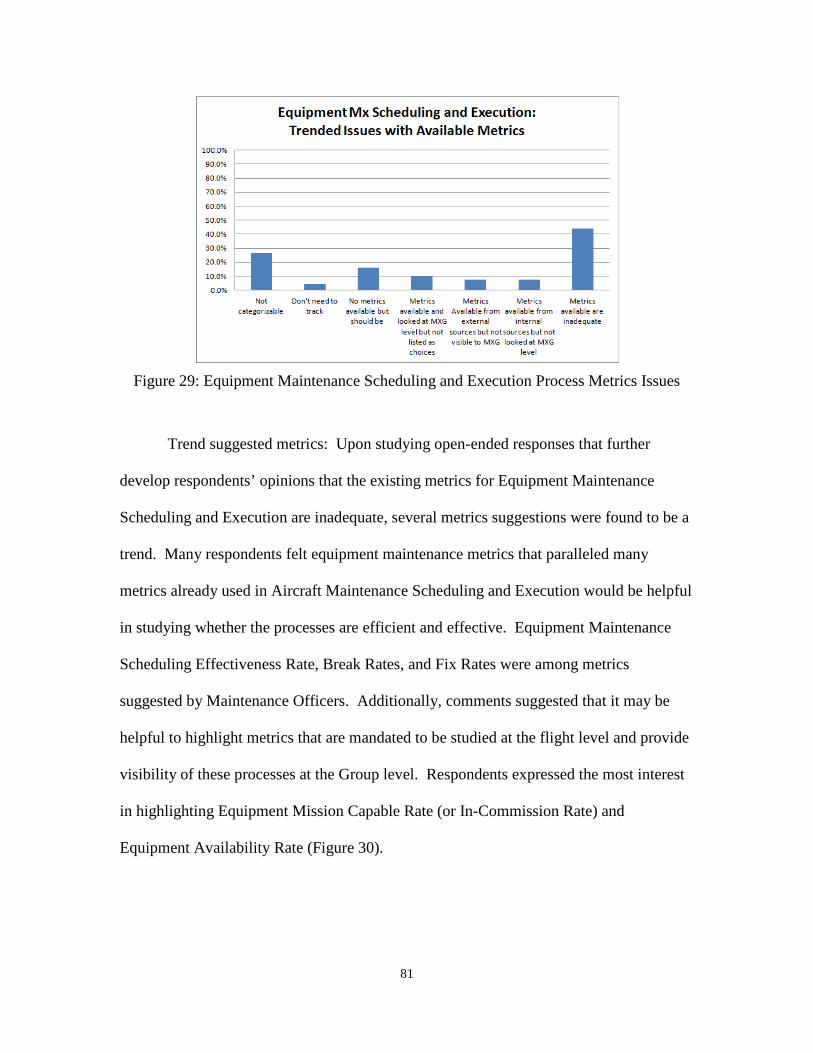
81
Figure 29: Equipment Maintenance Scheduling and Execution Process Metrics Issues
Trend suggested metrics: Upon studying open-ended responses that further
develop respondents’ opinions that the existing metrics for Equipment Maintenance
Scheduling and Execution are inadequate, several metrics suggestions were found to be a
trend. Many respondents felt equipment maintenance metrics that paralleled many
metrics already used in Aircraft Maintenance Scheduling and Execution would be helpful
in studying whether the processes are efficient and effective. Equipment Maintenance
Scheduling Effectiveness Rate, Break Rates, and Fix Rates were among metrics
suggested by Maintenance Officers. Additionally, comments suggested that it may be
helpful to highlight metrics that are mandated to be studied at the flight level and provide
visibility of these processes at the Group level. Respondents expressed the most interest
in highlighting Equipment Mission Capable Rate (or In-Commission Rate) and
Equipment Availability Rate (Figure 30).
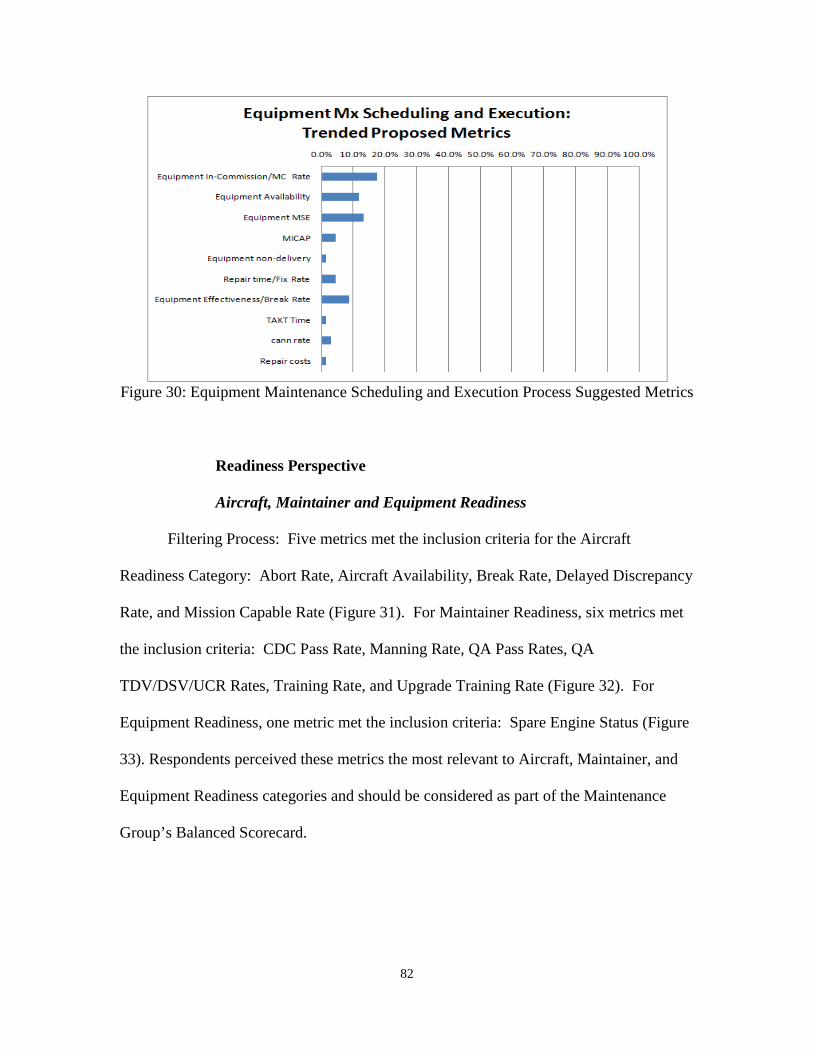
82
Figure 30: Equipment Maintenance Scheduling and Execution Process Suggested Metrics
Readiness Perspective
Aircraft, Maintainer and Equipment Readiness
Filtering Process: Five metrics met the inclusion criteria for the Aircraft
Readiness Category: Abort Rate, Aircraft Availability, Break Rate, Delayed Discrepancy
Rate, and Mission Capable Rate (Figure 31). For Maintainer Readiness, six metrics met
the inclusion criteria: CDC Pass Rate, Manning Rate, QA Pass Rates, QA
TDV/DSV/UCR Rates, Training Rate, and Upgrade Training Rate (Figure 32). For
Equipment Readiness, one metric met the inclusion criteria: Spare Engine Status (Figure
33). Respondents perceived these metrics the most relevant to Aircraft, Maintainer, and
Equipment Readiness categories and should be considered as part of the Maintenance
Group’s Balanced Scorecard.

83
Figure 31: Metric Assignment to Aircraft Readiness
Figure 32: Metric Assignment to Maintainer Readiness
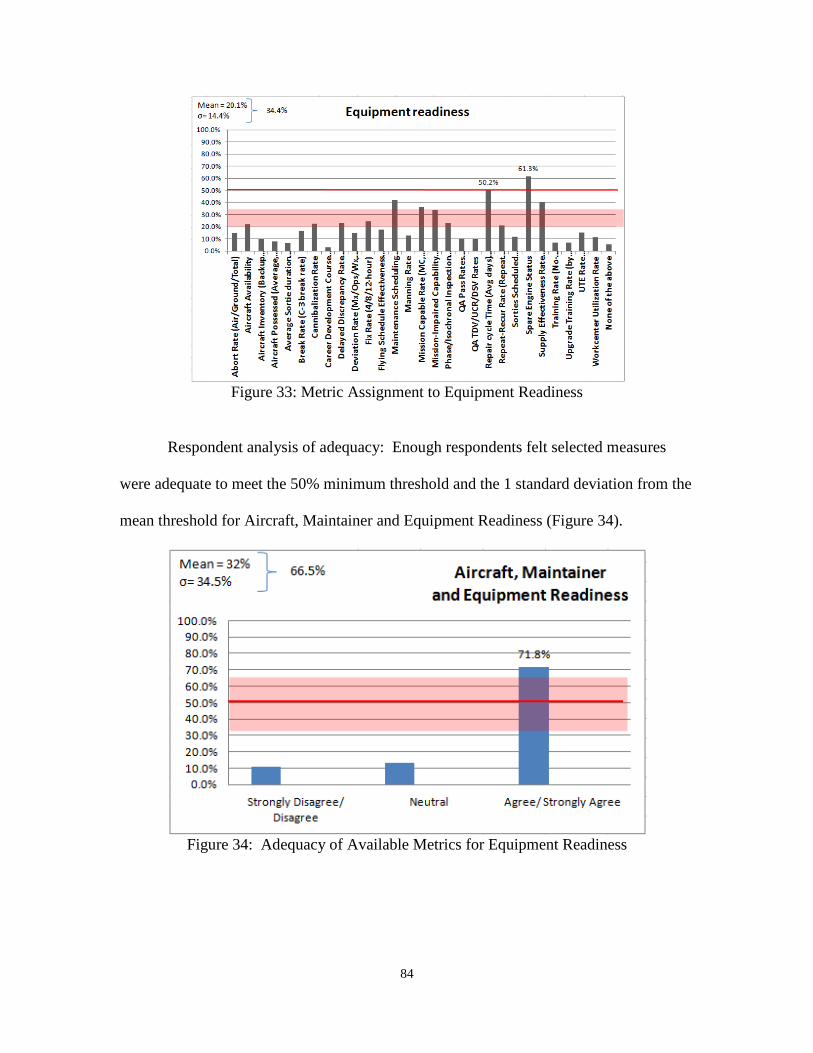
84
Figure 33: Metric Assignment to Equipment Readiness
Respondent analysis of adequacy: Enough respondents felt selected measures
were adequate to meet the 50% minimum threshold and the 1 standard deviation from the
mean threshold for Aircraft, Maintainer and Equipment Readiness (Figure 34).
Figure 34: Adequacy of Available Metrics for Equipment Readiness
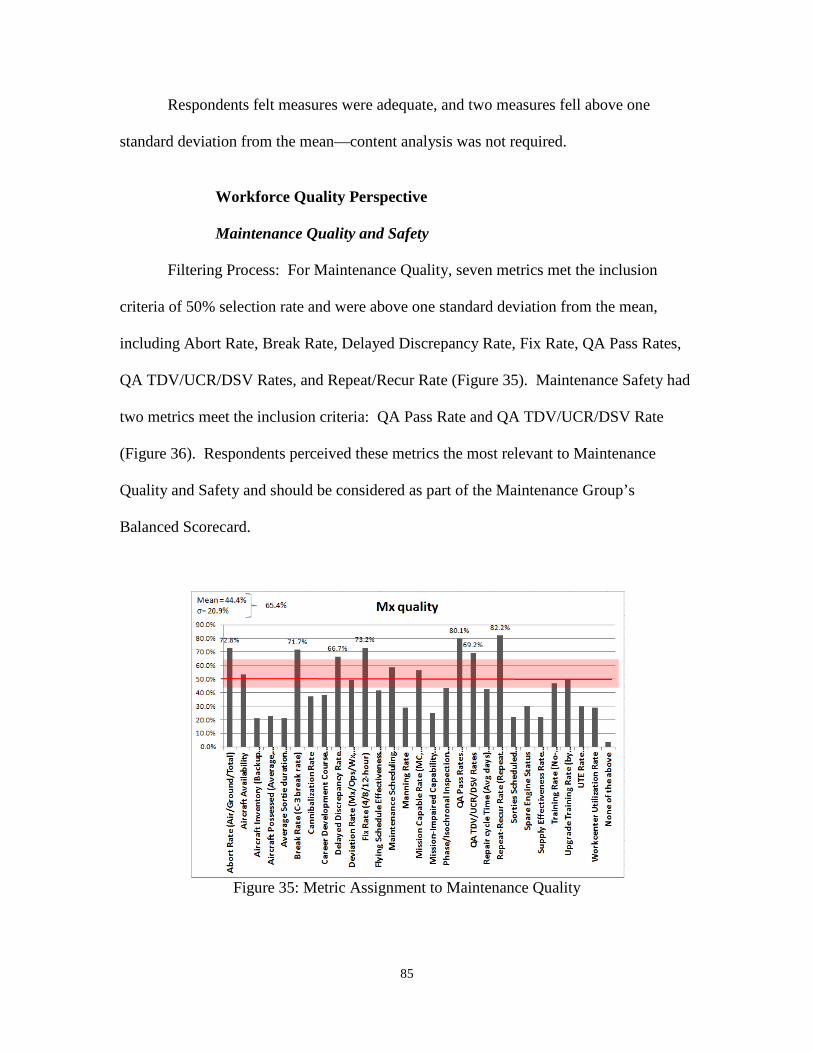
85
Respondents felt measures were adequate, and two measures fell above one
standard deviation from the mean—content analysis was not required.
Workforce Quality Perspective
Maintenance Quality and Safety
Filtering Process: For Maintenance Quality, seven metrics met the inclusion
criteria of 50% selection rate and were above one standard deviation from the mean,
including Abort Rate, Break Rate, Delayed Discrepancy Rate, Fix Rate, QA Pass Rates,
QA TDV/UCR/DSV Rates, and Repeat/Recur Rate (Figure 35). Maintenance Safety had
two metrics meet the inclusion criteria: QA Pass Rate and QA TDV/UCR/DSV Rate
(Figure 36). Respondents perceived these metrics the most relevant to Maintenance
Quality and Safety and should be considered as part of the Maintenance Group’s
Balanced Scorecard.
Figure 35: Metric Assignment to Maintenance Quality

86
Figure 36: Metric Assignment to Maintenance Safety
Respondent analysis of adequacy: Enough respondents felt selected measures
were adequate to meet the inclusion criteria (50% minimum threshold and the 1 standard
deviation from the mean threshold) (Figure 37).
Figure 37: Adequacy of Available Metrics for Maintenance Quality and Safety

87
Respondents felt measures were inadequate, and no measures fell above one
standard deviation from the mean—content analysis was not required.
Maintainer Skill Level and Maintainer Experience Level
Filtering Process: Four metrics met the inclusion criteria for Maintainer Skill
Level: CDC Pass Rates, QA Pass Rates, QA TDV/UCR/DSV Pass Rates, and Upgrade
Training Rate (Figure 38). Maintainer Experience Level had four metrics meet the
inclusion criteria: Fix Rate, QA Pass Rate, QA TDV/UCR/DSV Rates, and Repeat/Recur
Rate (Figure 39). Respondents indicated these metrics are the most relevant to
Maintainer Skill Level and Maintainer Experience Level and should be included in the
Maintenance Group’s Balanced Scorecard.
Figure 38: Metric Assignment to Maintainer Skill Level

88
Figure 39: Metric Assignment to Maintainer Experience Level
Respondent analysis of adequacy: Enough respondents felt selected measures
were adequate to meet the 50% minimum threshold and the 1 standard deviation from the
mean threshold (Figure 40).
Figure 40: Adequacy of Available Metrics for Maintainer Skill and Experience Level
Respondents felt measures were adequate, and four measures fell above one
standard deviation from the mean—content analysis was not required.
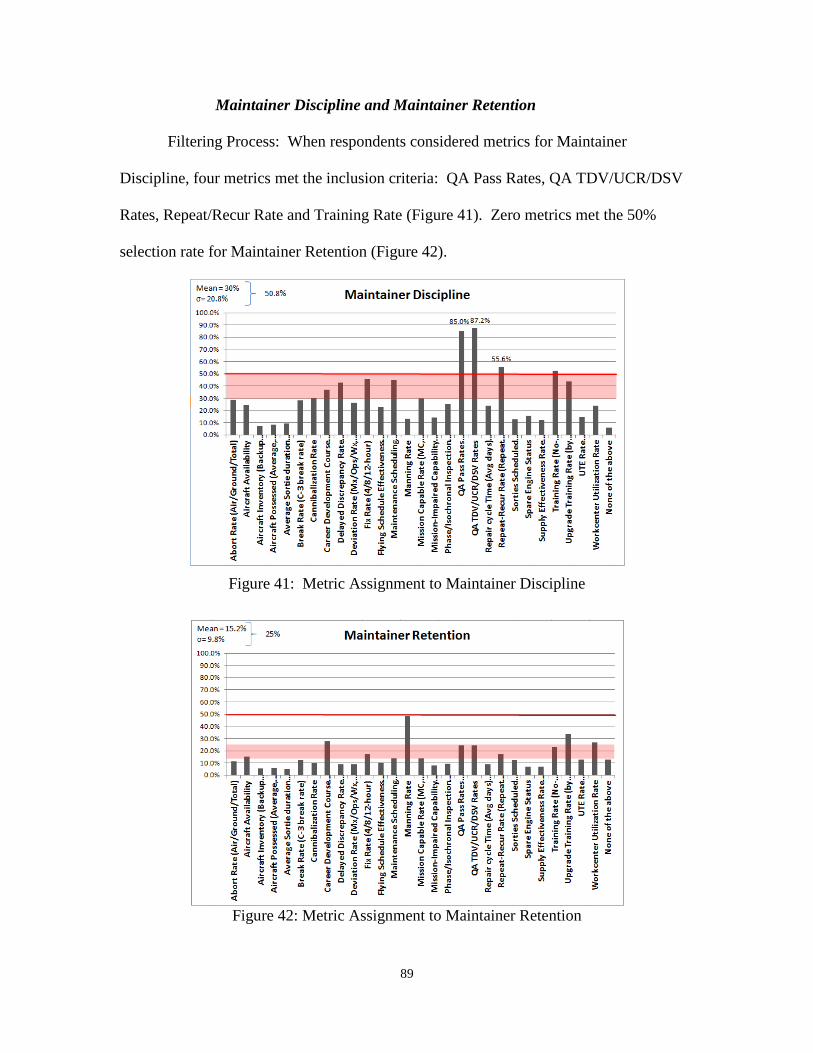
89
Maintainer Discipline and Maintainer Retention
Filtering Process: When respondents considered metrics for Maintainer
Discipline, four metrics met the inclusion criteria: QA Pass Rates, QA TDV/UCR/DSV
Rates, Repeat/Recur Rate and Training Rate (Figure 41). Zero metrics met the 50%
selection rate for Maintainer Retention (Figure 42).
Figure 41: Metric Assignment to Maintainer Discipline
Figure 42: Metric Assignment to Maintainer Retention
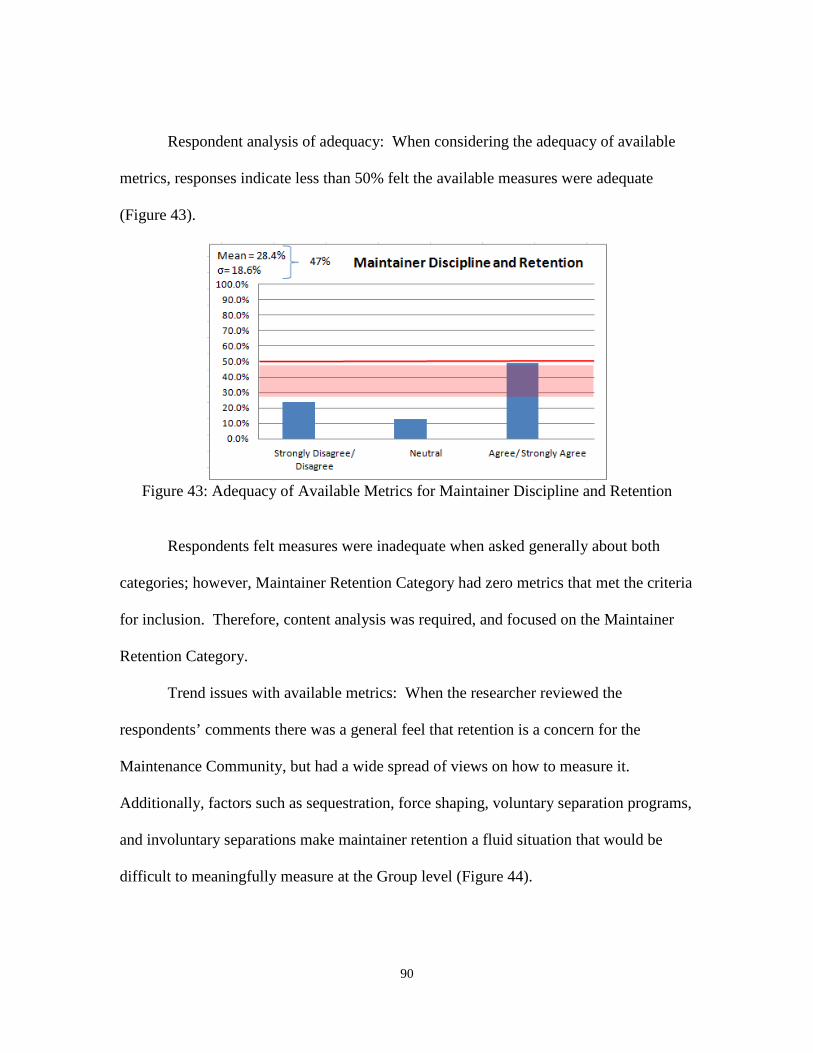
90
Respondent analysis of adequacy: When considering the adequacy of available
metrics, responses indicate less than 50% felt the available measures were adequate
(Figure 43).
Figure 43: Adequacy of Available Metrics for Maintainer Discipline and Retention
Respondents felt measures were inadequate when asked generally about both
categories; however, Maintainer Retention Category had zero metrics that met the criteria
for inclusion. Therefore, content analysis was required, and focused on the Maintainer
Retention Category.
Trend issues with available metrics: When the researcher reviewed the
respondents’ comments there was a general feel that retention is a concern for the
Maintenance Community, but had a wide spread of views on how to measure it.
Additionally, factors such as sequestration, force shaping, voluntary separation programs,
and involuntary separations make maintainer retention a fluid situation that would be
difficult to meaningfully measure at the Group level (Figure 44).

91
Figure 44: Maintainer Retention Metrics Issues
Trend suggested metrics: When asked to suggest metrics that could better
articulate Maintainer Retention, most respondents believed a re-enlistment rate would be
beneficial to the Maintenance Group as a lagging indicator. The other trend amongst
comments were to track items that that they believed contributed to job dissatisfaction,
which could be correlated to retention rate--Weekend Duty Rate, Overtime Rate were the
most commonly suggested metrics as more “leading indicators” to the re-enlistment rate
“lagging indicator” (Figure 45).

92
Figure 45: Maintainer Retention Suggested Metrics
Balanced Scorecard utility and frequency
The purpose of the next section of the survey was to determine the utility of the
balanced scorecard framework in Maintenance Group. If deemed beneficial by
Maintenance experts surveyed, the next step would be to determine the optimal frequency
of analysis of the metrics in each perspective. The survey asked respondents to assess the
benefit of examining metrics representing each perspective in the same meeting, in order
for the researcher to determine field support or opposition of the concept. The responses
indicated that 60% of the surveyed population Agreed or Strongly Agreed that the
balanced scorecard concept would be beneficial to study metrics from each perspective in
the same meeting (Figure 46).
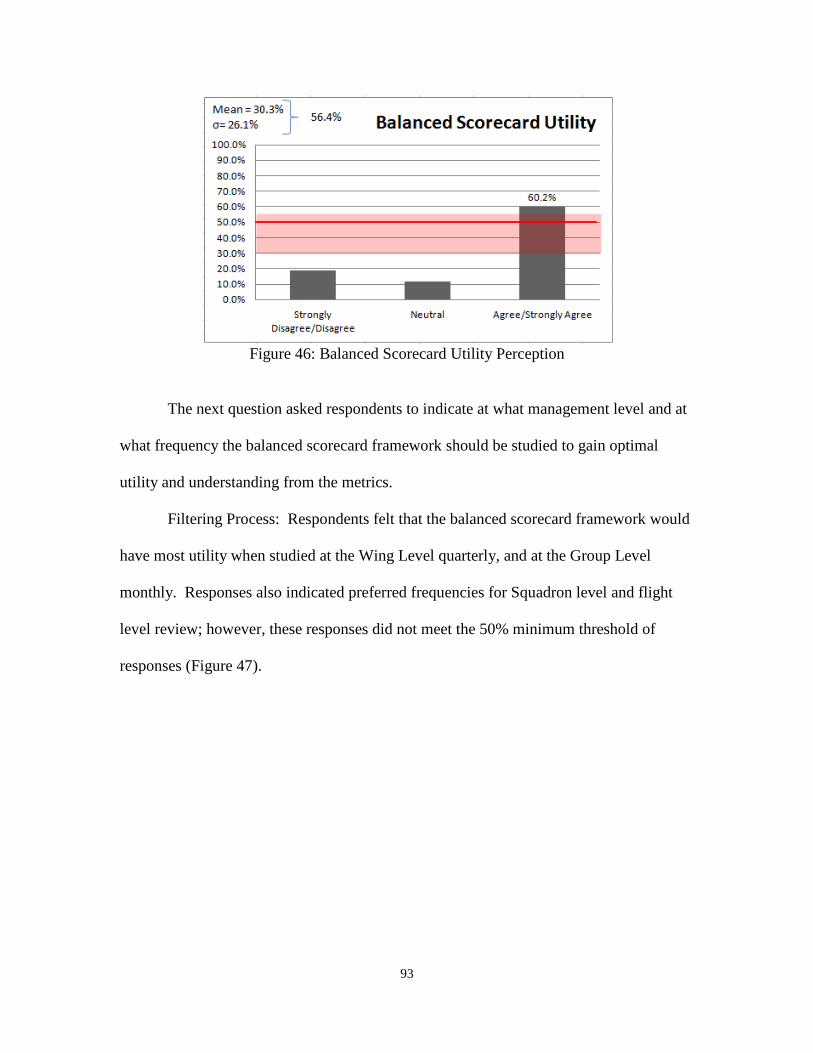
93
Figure 46: Balanced Scorecard Utility Perception
The next question asked respondents to indicate at what management level and at
what frequency the balanced scorecard framework should be studied to gain optimal
utility and understanding from the metrics.
Filtering Process: Respondents felt that the balanced scorecard framework would
have most utility when studied at the Wing Level quarterly, and at the Group Level
monthly. Responses also indicated preferred frequencies for Squadron level and flight
level review; however, these responses did not meet the 50% minimum threshold of
responses (Figure 47).
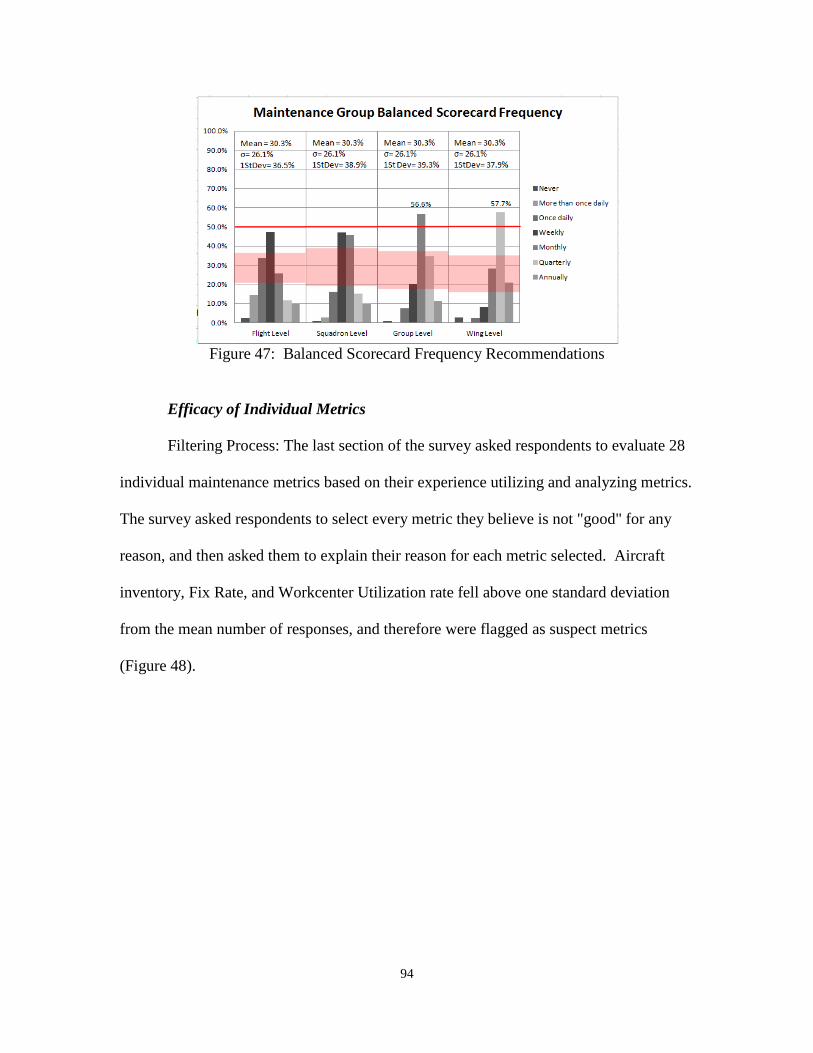
94
Figure 47: Balanced Scorecard Frequency Recommendations
Efficacy of Individual Metrics
Filtering Process: The last section of the survey asked respondents to evaluate 28
individual maintenance metrics based on their experience utilizing and analyzing metrics.
The survey asked respondents to select every metric they believe is not "good" for any
reason, and then asked them to explain their reason for each metric selected. Aircraft
inventory, Fix Rate, and Workcenter Utilization rate fell above one standard deviation
from the mean number of responses, and therefore were flagged as suspect metrics
(Figure 48).
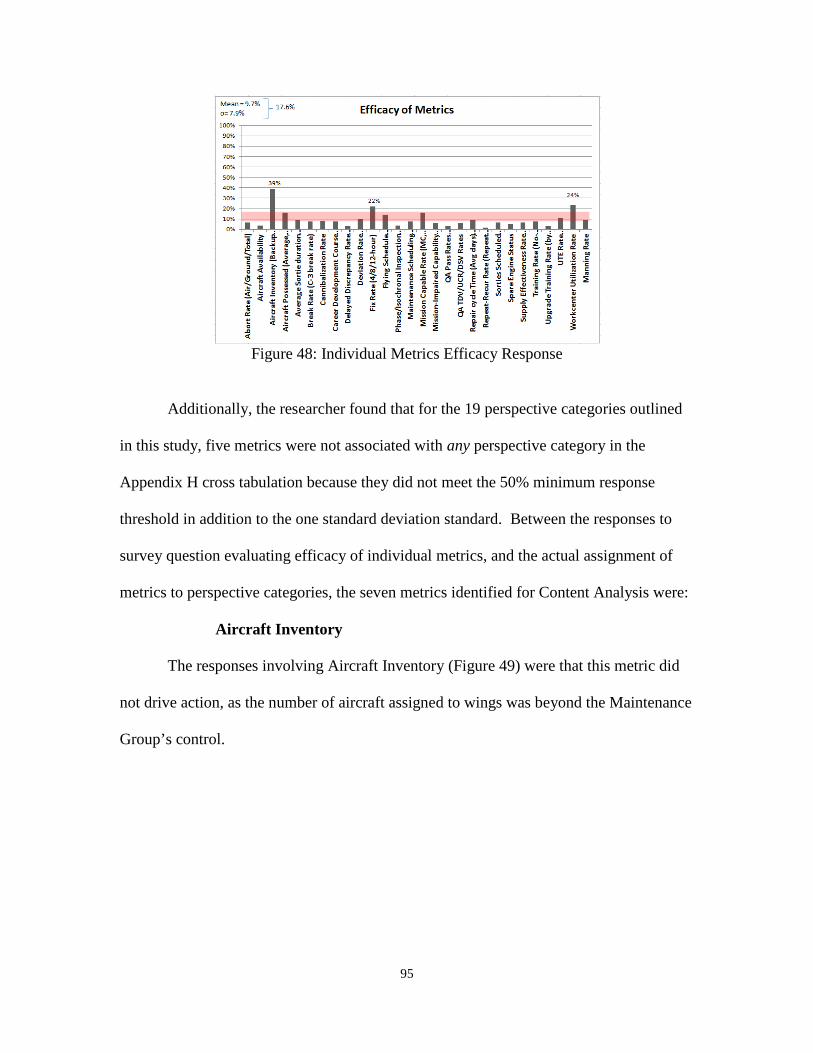
95
Figure 48: Individual Metrics Efficacy Response
Additionally, the researcher found that for the 19 perspective categories outlined
in this study, five metrics were not associated with any perspective category in the
Appendix H cross tabulation because they did not meet the 50% minimum response
threshold in addition to the one standard deviation standard. Between the responses to
survey question evaluating efficacy of individual metrics, and the actual assignment of
metrics to perspective categories, the seven metrics identified for Content Analysis were:
Aircraft Inventory
The responses involving Aircraft Inventory (Figure 49) were that this metric did
not drive action, as the number of aircraft assigned to wings was beyond the Maintenance
Group’s control.
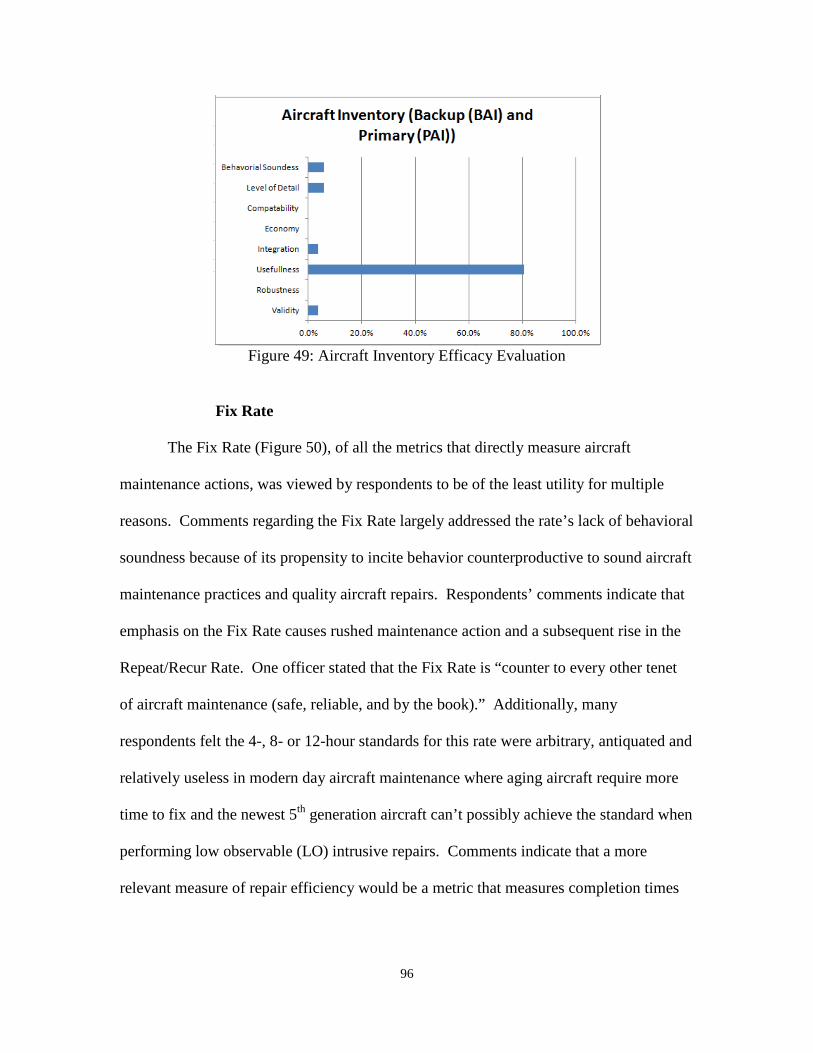
96
Figure 49: Aircraft Inventory Efficacy Evaluation
Fix Rate
The Fix Rate (Figure 50), of all the metrics that directly measure aircraft
maintenance actions, was viewed by respondents to be of the least utility for multiple
reasons. Comments regarding the Fix Rate largely addressed the rate’s lack of behavioral
soundness because of its propensity to incite behavior counterproductive to sound aircraft
maintenance practices and quality aircraft repairs. Respondents’ comments indicate that
emphasis on the Fix Rate causes rushed maintenance action and a subsequent rise in the
Repeat/Recur Rate. One officer stated that the Fix Rate is “counter to every other tenet
of aircraft maintenance (safe, reliable, and by the book).” Additionally, many
respondents felt the 4-, 8- or 12-hour standards for this rate were arbitrary, antiquated and
relatively useless in modern day aircraft maintenance where aging aircraft require more
time to fix and the newest 5th generation aircraft can’t possibly achieve the standard when
performing low observable (LO) intrusive repairs. Comments indicate that a more
relevant measure of repair efficiency would be a metric that measures completion times
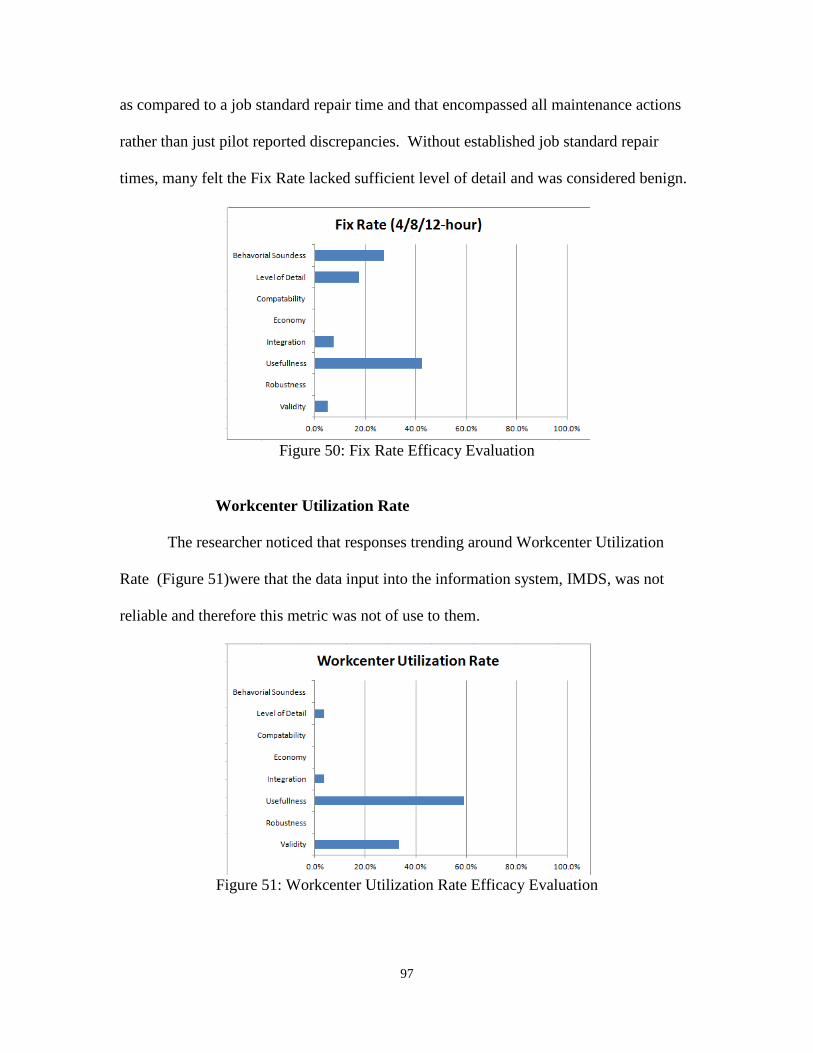
97
as compared to a job standard repair time and that encompassed all maintenance actions
rather than just pilot reported discrepancies. Without established job standard repair
times, many felt the Fix Rate lacked sufficient level of detail and was considered benign.
Figure 50: Fix Rate Efficacy Evaluation
Workcenter Utilization Rate
The researcher noticed that responses trending around Workcenter Utilization
Rate (Figure 51)were that the data input into the information system, IMDS, was not
reliable and therefore this metric was not of use to them.
Figure 51: Workcenter Utilization Rate Efficacy Evaluation
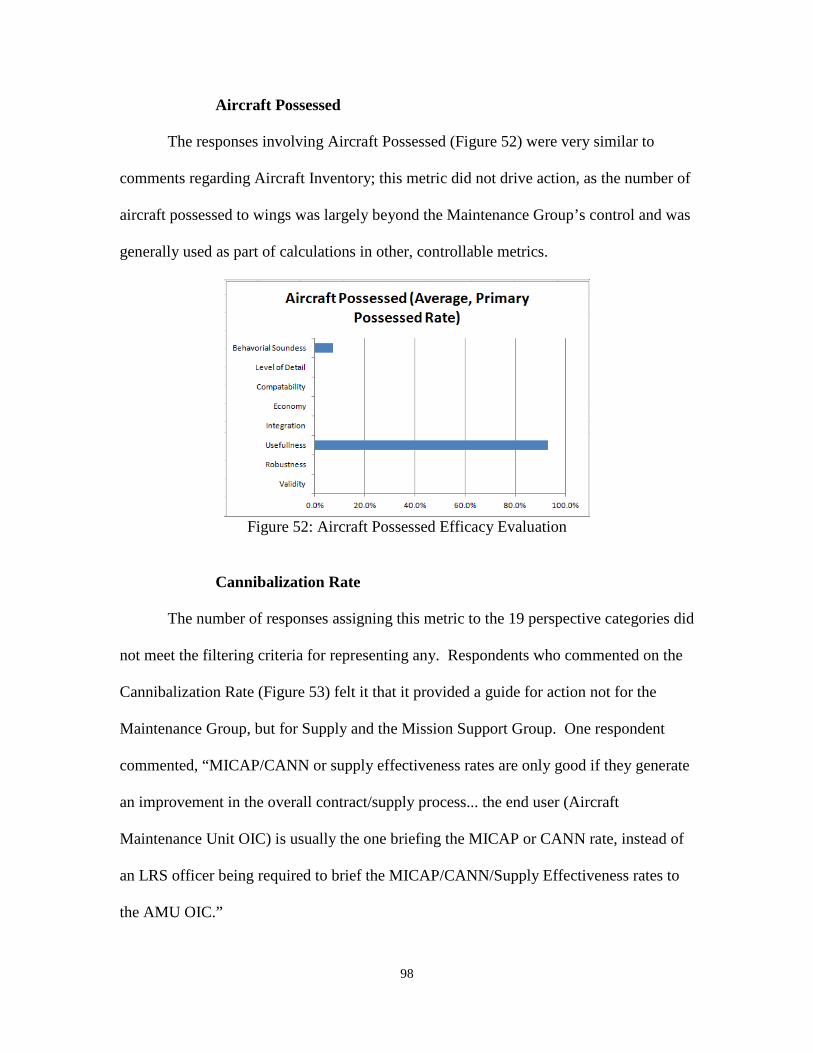
98
Aircraft Possessed
The responses involving Aircraft Possessed (Figure 52) were very similar to
comments regarding Aircraft Inventory; this metric did not drive action, as the number of
aircraft possessed to wings was largely beyond the Maintenance Group’s control and was
generally used as part of calculations in other, controllable metrics.
Figure 52: Aircraft Possessed Efficacy Evaluation
Cannibalization Rate
The number of responses assigning this metric to the 19 perspective categories did
not meet the filtering criteria for representing any. Respondents who commented on the
Cannibalization Rate (Figure 53) felt it that it provided a guide for action not for the
Maintenance Group, but for Supply and the Mission Support Group. One respondent
commented, “MICAP/CANN or supply effectiveness rates are only good if they generate
an improvement in the overall contract/supply process... the end user (Aircraft
Maintenance Unit OIC) is usually the one briefing the MICAP or CANN rate, instead of
an LRS officer being required to brief the MICAP/CANN/Supply Effectiveness rates to
the AMU OIC.”

99
Figure 53: Cannibalization Rate Efficacy Evaluation
Mission Impaired Capability (MICAP)
Similar to the Cannibalization rate, the MICAP Rate (Figure 54) did not meet the
filtering criteria to be considered in any of the 19 perspective categories. All respondent
comments indicated the MICAP rate was a supply metric and maintenance had no
influence over the supply chain and subsequently could not influence the MICAP Rate.
When considering metrics regarding supply issues, maintainers find much more utility in
the Non-Mission Capable for Supply (NMCS) Rate because it shows most clearly the
effect of supply on combat capability. As for the MICAP rate, respondents rated its
usefulness minimal at best.
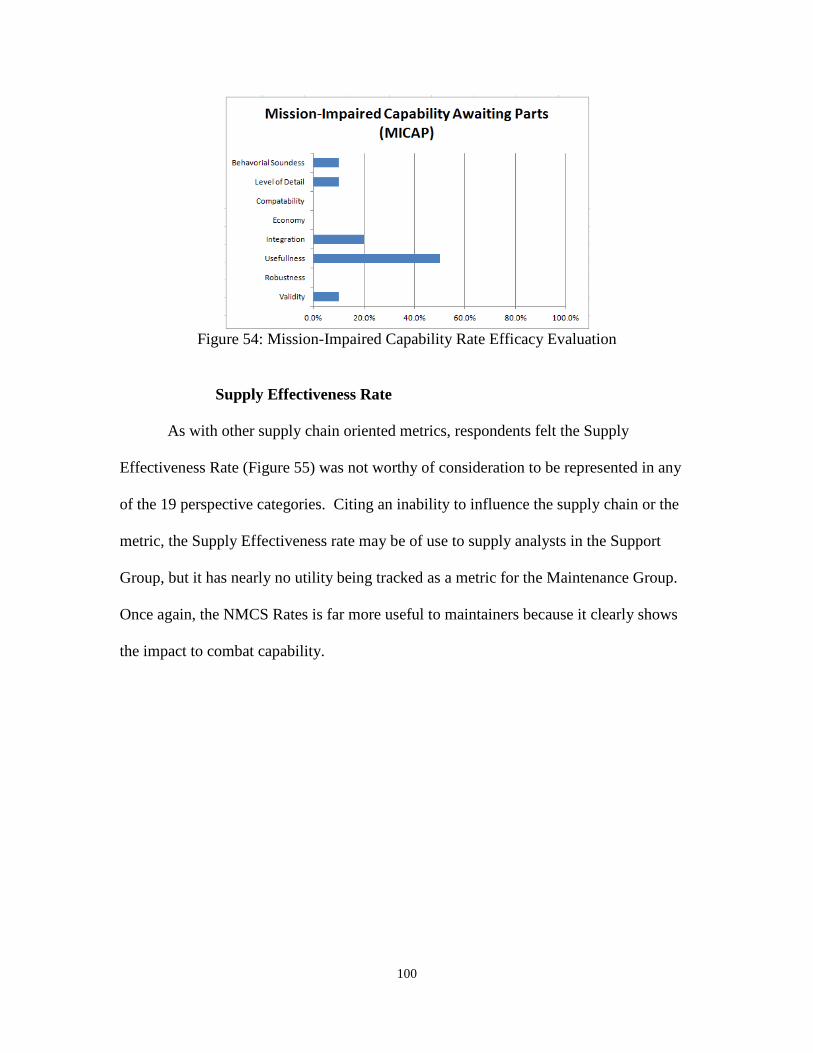
100
Figure 54: Mission-Impaired Capability Rate Efficacy Evaluation
Supply Effectiveness Rate
As with other supply chain oriented metrics, respondents felt the Supply
Effectiveness Rate (Figure 55) was not worthy of consideration to be represented in any
of the 19 perspective categories. Citing an inability to influence the supply chain or the
metric, the Supply Effectiveness rate may be of use to supply analysts in the Support
Group, but it has nearly no utility being tracked as a metric for the Maintenance Group.
Once again, the NMCS Rates is far more useful to maintainers because it clearly shows
the impact to combat capability.

101
Figure 55: Supply Effectiveness Rate Efficacy Evaluation
Maintenance Group Balanced Scorecard Initial Rollup
Using the list of metrics that met the criteria for inclusion under each category,
combined with the evaluation of individual metrics to ensure metrics included are sound,
the researcher developed the initial Maintenance Group Balanced Scorecard shown in
Figure 56. The researcher will use contents of this initial version to perform a
Correlation Analysis to further adjust, refine, and produce the final proposal for the
Maintenance Group Balanced Scorecard.

102
Figure 56: Initial Maintenance Group Balanced Scorecard
Correlation Analysis
Perspective Category Correlation
The perspective category combinations and their correlation coefficients are
outlined in Appendix I. The researcher found that many of the high correlations occurred
103
were due to corresponding low selection rates for metrics assignments to perspective
categories. Even though high correlation coefficients were observed in many cases, the
metrics that were assigned to process categories weren’t always the metrics that caused
high correlations. However, in several cases, metrics that were in the top three or four
selections of perspective categories were highly correlated between perspective
categories and worthy of analysis and discussion. During correlation analysis, the
researcher identified several areas of concern, where metrics assigned to different
perspective categories overlapped excessively.
The first area of concern highlighted by high correlations was between Maintainer
Training Scheduling and Execution, Maintainer Readiness, and all Workforce Quality
Perspective categories. QA Pass rates, QA STV/TDV/UCR rates, Training rates,
Upgrade Training Rates, Repeat/Recur Rates and CDC Pass Rates were highly correlated
between all of these categories. Since Maintenance Quality, Maintenance Safety, and
Maintenance Discipline are all measured during QA inspections and represented in
specific QA rates, the researcher elected to combine these three Workforce Quality
Perspective categories into one category called Maintenance Quality, Safety and
Discipline, and eliminate those metrics from being represented among the other
categories.
Maintainer Experience
Metrics selected for Skill Level and Experience Level under the Workforce
Quality Perspective were very closely correlated, concerning the researcher and forcing
closer examination through Content Analysis. As described in Chapter II, skill level is
awarded after completion of a set of tasks in the CFETP; however, a technician’s skill

104
level does not necessarily equate to experience level or expertise. The problem with skill
level is, once achieved, it remains with an Airman regardless of assignment or type of
airframe. For example, a Staff Sergeant that earns his 7-level while working and training
on the F-15 may be considered a craftsman of substantial skill because of his experience,
until he is assigned to an A-10 unit in Korea and finds himself at a disadvantage because
of his lack of experience on the dissimilar airframe. The simple fact of the matter is,
experience level on an airframe matters and it cannot be equated with skill level. An
Airman with 4 years experience on an airframe, although only a 5-level, is most often
more capable than a 7-level with only 3 months on that same airframe. MDS experience
level has become increasingly relevant in recent years as corporate knowledge on the
flightline dwindles with the manning cuts. The researcher elected to perform additional
content analysis on comments between these two perspectives to investigate whether the
high correlation was due to redundant categories, or if metrics were lacking.
Trend issues with available metrics: During content analysis, the evidence was
overwhelming that a lack of metrics was the culprit for the high correlation. Over 60% of
the respondents assessed that there were adequate metrics to measure skill level, but
inadequate metrics to measure experience level of the workforce (Figure 57).
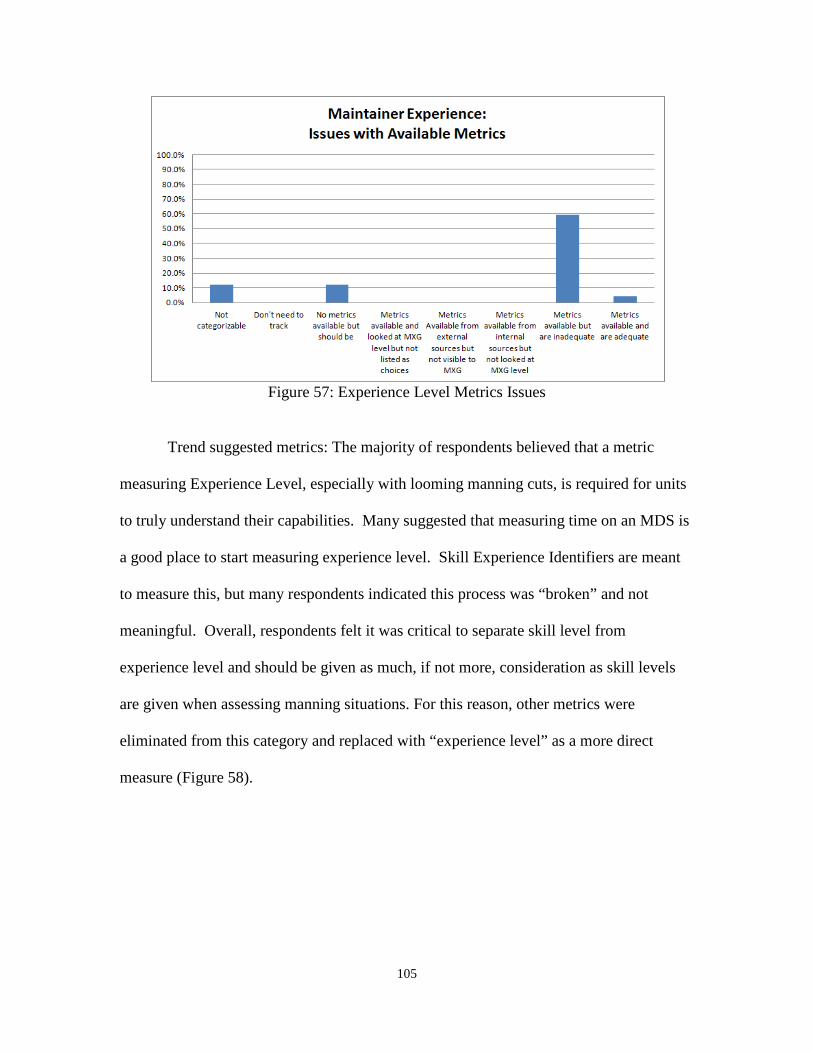
105
Figure 57: Experience Level Metrics Issues
Trend suggested metrics: The majority of respondents believed that a metric
measuring Experience Level, especially with looming manning cuts, is required for units
to truly understand their capabilities. Many suggested that measuring time on an MDS is
a good place to start measuring experience level. Skill Experience Identifiers are meant
to measure this, but many respondents indicated this process was “broken” and not
meaningful. Overall, respondents felt it was critical to separate skill level from
experience level and should be given as much, if not more, consideration as skill levels
are given when assessing manning situations. For this reason, other metrics were
eliminated from this category and replaced with “experience level” as a more direct
measure (Figure 58).
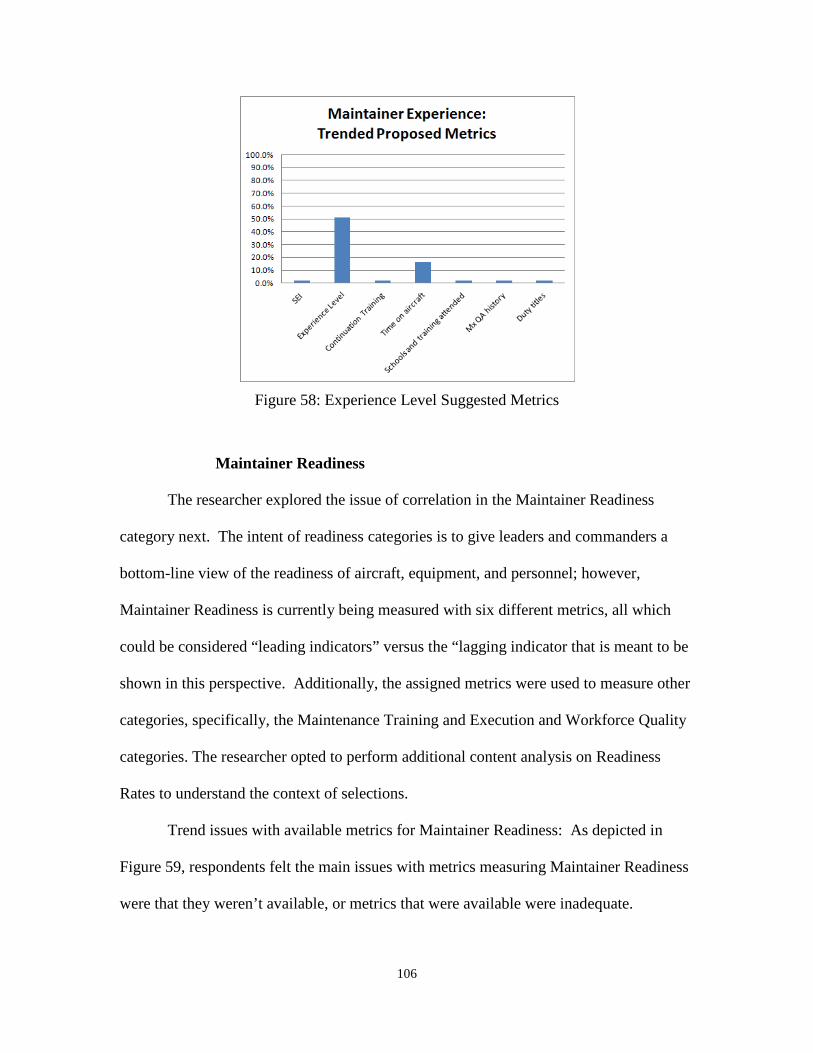
106
Figure 58: Experience Level Suggested Metrics
Maintainer Readiness
The researcher explored the issue of correlation in the Maintainer Readiness
category next. The intent of readiness categories is to give leaders and commanders a
bottom-line view of the readiness of aircraft, equipment, and personnel; however,
Maintainer Readiness is currently being measured with six different metrics, all which
could be considered “leading indicators” versus the “lagging indicator that is meant to be
shown in this perspective. Additionally, the assigned metrics were used to measure other
categories, specifically, the Maintenance Training and Execution and Workforce Quality
categories. The researcher opted to perform additional content analysis on Readiness
Rates to understand the context of selections.
Trend issues with available metrics for Maintainer Readiness: As depicted in
Figure 59, respondents felt the main issues with metrics measuring Maintainer Readiness
were that they weren’t available, or metrics that were available were inadequate.

107
Generally, the responses indicated the inadequacy meant the available metrics only
indirectly painted the picture of Maintainer Readiness--Maintainer Readiness had to be
inferred based on maintenance performance metrics or training metrics.
Figure 59: Maintainer Readiness Metrics Issues
Trend suggested Maintainer Readiness metrics: Suggestions for better metrics
were numerous and diverse, but similar to metrics assigned to Aircraft Readiness
category, Capability and Availability were among the suggestions (Figure 60). Some
respondents suggested that a Capability Metric be rolled up from Skill levels and
Experience levels, and availability be represented by the number of Airmen, who fill the
proper manning slot of unit manning documents, and are available for duty. For this
reason, the researcher suggested Maintainer Capability and Maintainer Availability for
the Maintainer Readiness category, and moved other “leading indicators” to either
Training Scheduling or Execution Category, or to the Maintenance Quality, Safety and
Discipline Category. Additionally, several respondents mentioned duty hours as factors
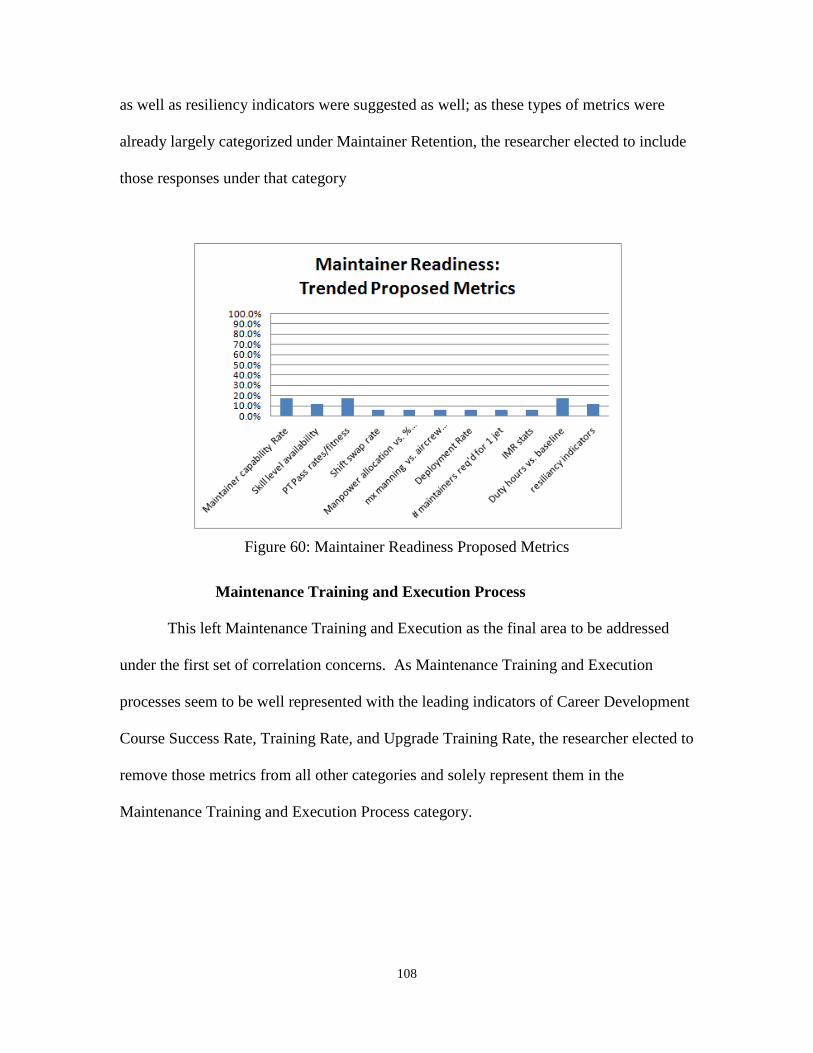
108
as well as resiliency indicators were suggested as well; as these types of metrics were
already largely categorized under Maintainer Retention, the researcher elected to include
those responses under that category
Figure 60: Maintainer Readiness Proposed Metrics
Maintenance Training and Execution Process
This left Maintenance Training and Execution as the final area to be addressed
under the first set of correlation concerns. As Maintenance Training and Execution
processes seem to be well represented with the leading indicators of Career Development
Course Success Rate, Training Rate, and Upgrade Training Rate, the researcher elected to
remove those metrics from all other categories and solely represent them in the
Maintenance Training and Execution Process category.

109
Aircrew Mission/Training Scheduling and Execution Process and
Flying Scheduling and Execution
The next area of concern fell between the Aircrew Mission/Training Scheduling
and Execution Processes and the Flying Scheduling and Execution Processes. The
researcher determined that the high correlation between those two categories was a result
of lack of better metrics to measure the former. Aircrew Mission/Training Scheduling
and Execution Processes refer specifically to the efficiency and effectiveness of Aircrew
Training requirements. Flying Scheduling Effectiveness refers to take off and land times,
and deviations from the flying schedule, with little consideration for deviations from
planned, briefed and flown Missions that Aircrew are required to accomplish. Abort rate
would logically, albeit loosely, tie these processes together, but an abort doesn’t
necessarily mean a spare wasn’t provided and the mission was accomplished as planned.
As determined in the Content Analysis of Aircrew Mission/Training Scheduling and
Execution, this correlation corroborated the need for different and unique metrics to
properly measure efficiency and effectiveness of this process, which are the RAP/Mission
Effectiveness Rate and Mission Planning Deviation rates.
Equipment Maintenance Scheduling and Execution and Equipment
Readiness
Another area of concern was the high correlation between Equipment
Maintenance Scheduling and Execution, and Equipment Readiness. As pointed out in the
Content Analysis of Maintainer Readiness, the intent of readiness categories is to give
leaders and commanders a bottom-line view of the readiness of aircraft, equipment, and
personnel; however, two of the metrics in the Equipment Maintenance Scheduling and
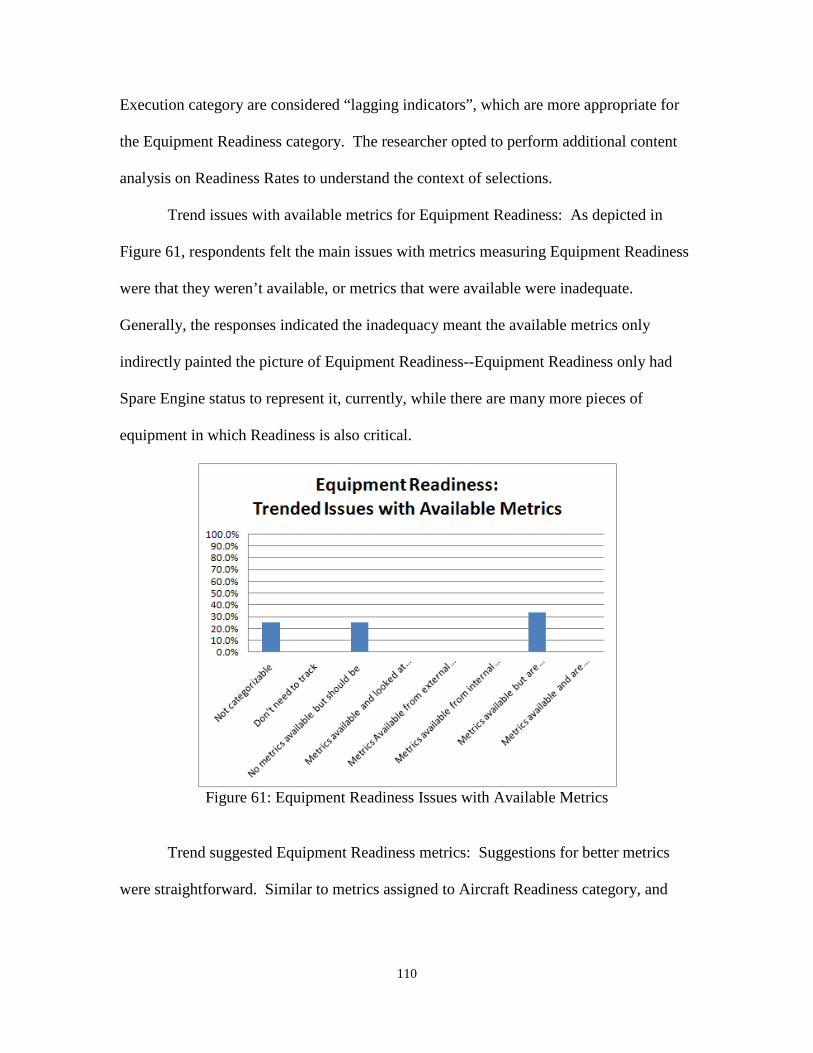
110
Execution category are considered “lagging indicators”, which are more appropriate for
the Equipment Readiness category. The researcher opted to perform additional content
analysis on Readiness Rates to understand the context of selections.
Trend issues with available metrics for Equipment Readiness: As depicted in
Figure 61, respondents felt the main issues with metrics measuring Equipment Readiness
were that they weren’t available, or metrics that were available were inadequate.
Generally, the responses indicated the inadequacy meant the available metrics only
indirectly painted the picture of Equipment Readiness--Equipment Readiness only had
Spare Engine status to represent it, currently, while there are many more pieces of
equipment in which Readiness is also critical.
Figure 61: Equipment Readiness Issues with Available Metrics
Trend suggested Equipment Readiness metrics: Suggestions for better metrics
were straightforward. Similar to metrics assigned to Aircraft Readiness category, and
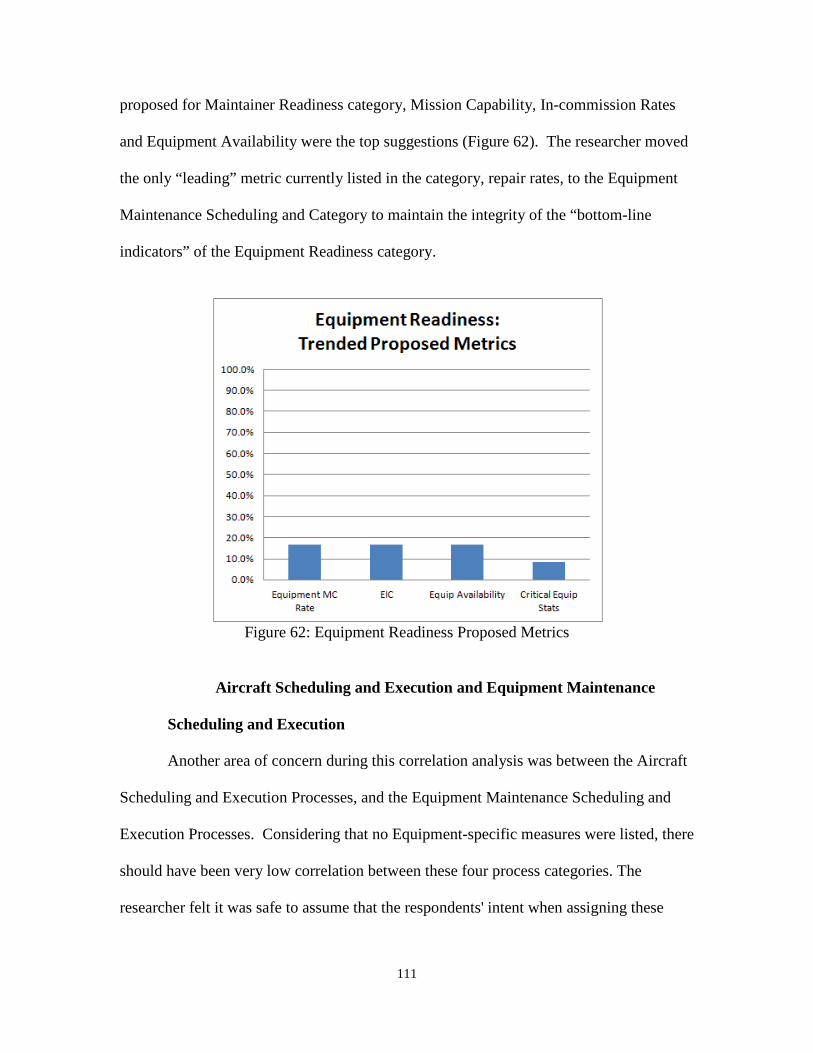
111
proposed for Maintainer Readiness category, Mission Capability, In-commission Rates
and Equipment Availability were the top suggestions (Figure 62). The researcher moved
the only “leading” metric currently listed in the category, repair rates, to the Equipment
Maintenance Scheduling and Category to maintain the integrity of the “bottom-line
indicators” of the Equipment Readiness category.
Figure 62: Equipment Readiness Proposed Metrics
Aircraft Scheduling and Execution and Equipment Maintenance
Scheduling and Execution
Another area of concern during this correlation analysis was between the Aircraft
Scheduling and Execution Processes, and the Equipment Maintenance Scheduling and
Execution Processes. Considering that no Equipment-specific measures were listed, there
should have been very low correlation between these four process categories. The
researcher felt it was safe to assume that the respondents' intent when assigning these
112
aircraft-specific metrics such as MSE, Fix Rate, Break Rate, and Mission Capable Rate
were meant to be equipment-related metrics. Equipment MSE, Equipment Break Rate,
and Equipment Repeat/Recur Rate should be considered different metrics from their
aircraft counterparts and included in the Equipment Maintenance Execution category.
Scheduling and Execution
The last area of concern was between Scheduling and Execution Processes in
general. While efficiency and effectiveness in a Scheduling process could theoretically
be measured differently than efficiency and effectiveness in an Execution Process, the
reality of measuring them in a unique manner from each other makes a case for
combining those measures together. How else can one measure efficiency in scheduling,
except to see the fruits of the execution of the schedule? An effective schedule means
fewer changes to the schedule during execution. An efficient scheduling process could
measure the man-hours it takes to route a schedule through the chain of command for
approval, but economy of effort to capture that data could be focused elsewhere. For this
reason, the researcher elected to combine scheduling and execution for all of the process
perspective categories.
After combining the Scheduling and Execution Process categories, the researcher
noticed the top metrics for Aircraft Maintenance Scheduling and Execution reflected two
different actions--scheduled and unscheduled maintenance. As such, the efficiency and
effectiveness of execution of scheduled and unscheduled maintenance actions should be
measured with different yardsticks. Unscheduled maintenance actions are just that--
unscheduled, so the MSE rate, while highly telling of the efficiency of scheduled

113
maintenance, is not applicable. The researcher elected to break this perspective category
into Unscheduled and Scheduled Maintenance activities.
Correlation analysis proved to be extremely useful, even after rigorous filtering
and content analysis performed earlier in the methodology. First, the researcher was able
to identify redundancies among category intent. Additionally, the researcher was able to
identify where respondents assigned metrics to categories not because they were ideal,
but because they were the merely the best they had to choose from. Following additional
content analysis from these revelations, the researcher felt confident that the revised
Balanced Scorecard could meet the needs of maintenance leaders and decision makers in
understanding the performance in processes towards meeting customer requirements,
readiness, and workforce quality issues.

114
V. Discussion, Recommendations and Conclusions
Discussion
This chapter first addresses the assumptions and limitations identified throughout
the research process. After these assumptions are addressed, the researcher will answer
the three Research Questions outlined in Chapter I of this paper. Implications of this
research will then be covered, followed by several recommendations for future research.
Finally, other recommendations will be presented
Assumptions and Limitations
To support this study of the utility of the balanced scorecard framework and
utility of metrics already in use in aircraft maintenance, the researcher conducted a survey
to capture the opinions of maintenance officers serving in the CAF. The survey
canvassed as many officers as possible to ensure a well-rounded, unbiased perspective
and for a credible reference throughout the research process. The researcher must assume
that the responses and opinions of the survey respondents are an accurate representation
of the opinions of the entire Aircraft Maintenance community.
The researcher used personal judgment to interpret the meaning of the
respondents’ comments during the coding process of Content Analysis. Although an
external auditor was used to validate the results of the coding process, it must be
acknowledged that interpretation of comments is subject to error when clarification or
amplification of responses is not possible. The researcher assumed, for the purpose of the
research, that the respondents’ comments were interpreted correctly.
The researcher investigated multiple criteria to assess the current aircraft
maintenance metrics set, but limited the discussion to the criteria presented by Caplice

115
and Sheffi based on her personal assessment of the criteria as compared to others. This
study assumes the author was objective in her choice of criteria and did indeed choose the
most comprehensive and complete criteria to develop the survey.
The researcher did not include formulas for the metrics evaluated in the survey,
and assumed that the maintenance officers who participated in the survey had knowledge
of these formulas or had access to the metrics formulas if they required them.
Implementation of the Maintenance Group Balanced Scorecard framework could
be limited by Department of Defense classification standards for readiness-related
information. In addition, current information systems may not be equipped to capture
required data to implement the proposed metrics outlined in this study.
Recommendations
The researcher’s investigation revealed information gaps provided by the current
aircraft maintenance metrics set and the method and frequency of their study, and
recommends several metrics be refined, created, or eliminated to populate the
Maintenance Group Balanced Scorecard, as indicated by respondents.
Metrics to Create
First, the researcher recommends the current Fix Rate be refined to eliminate the
negative behavior described by respondents before incorporating into the balanced
scorecard. The researcher recommends the length of time it takes to fix a particular
discrepancy be measured against an established job standard time versus against an
arbitrary 4-, 8-, or 12-hour standard. The proposed “Job Standard Fix Rate” would
provide maintainers clear expectations of performance for individual task
accomplishment and enable more accurate measurement of efficiency of repairs than an
116
arbitrary standard. The clarity and objectivity provided by the Job Standard Fix Rate
would reduce safety and quality concerns as maintainers would be less likely to be
pressured by an unrealistic expectation of their work tempo. An additional benefit of the
Job Standard Fix Rate would be a clear depiction of training deficiencies or process
inefficiencies on specific tasks. For example, if engine changes consistently exceeded an
established job standard time, managers would have statistical evidence that increased
training is required or be able to examine the process to eliminate non-value added
elements hindering optimization. The Job Standard Fix rate would be useful in both the
internal process perspective and the learning and growth perspective of the Maintenance
Group’s Balanced Scorecard.
Examination of survey responses regarding Equipment Maintenance processes
exposed information gaps and opportunities for improvement as well. The researcher
recommends the creation of metrics to measure efficiency and effectiveness of
Equipment Maintenance Scheduling and Execution, including Equipment In-commission
Rate, Equipment Availability Rate, an Equipment Maintenance Scheduling Effectiveness
Rate, and an Equipment Break Rate.
Another valuable discovery of this research was the need for increased visibility
of Aircrew Mission/Training Scheduling and Execution processes. Although Operations’
processes do not fall into the Maintenance Group’s sphere of control, the Maintenance
Group has significant impact on the efficiency and effectiveness of those processes.
Survey responses indicate that increased transparency of metrics articulating customer
perspective, and specifically the Maintenance Group’s impact on them, could lead to
improved efficiency in Maintenance Group processes. Respondents indicated a need to

117
know exactly how maintenance operations affect Aircrew, and to know the results of
what they were providing for from a RAP perspective. These metrics include Operations
Scheduling Effectiveness Rate (Missions briefed vs. Missions planned), a Mission
Effectiveness Rate (Missions flown vs. Mission Planned), and a RAP Rate (RAP plan
met for month/quarter). The researcher received several personal emails from
Maintenance Officers whose organizations were already pursuing these types of metrics
and have established programs that could lay the groundwork for implementation of these
metrics CAF-wide.
Furthermore, the researcher recommends metrics to close gaps in the bottom-line
measures of maintenance personnel and equipment readiness. Respondents indicated that
measures similar to those studied for Aircraft, such as Capability and Availability, would
be helpful in decision making and optimizing the impact of these important enablers of
airpower. Respondents suggested that the Maintainer Capability measure would best
serve the needs of managers if it were a roll-up of skill level and experience level.
The development/study of Workforce Quality measures is imperative to
maximizing the contribution and effectiveness of the increasingly limited workforce. The
researcher recommends Workforce Quality indicators be created to understand the
condition of the enablers of the mission-execution--the maintainers. Recommended
measures under this perspective include measures that could affect retention such as
Overtime Rate, and Weekend Duty Rate. Also, a separate evaluation of skill level and
experience level is recommended under this perspective as one of the unintended
consequences of force reduction and restructuring is that skill level and airframe
experience level have become disparate.
118
Metrics to Reassess
The researcher recommends a reassessment of Supply-related metrics.
Respondents largely felt that rates such as MICAP rate, Cannibalization Rate, and Supply
Effectiveness Rate could not be controlled at the Maintenance Group level, and these
metrics would be more useful in the hands of members of the Logistics Squadrons. As
the Proposed Maintenance Group Balanced Scorecard did not include this, an area to be
explored for incorporation into the balanced scorecard is a Supplier Performance Section,
to include external agencies performance in providing to the Maintenance Group.
Scrutiny of Supplier Performance is necessary to ensure supply enablers remain vested in
the success of the Maintenance Group.
The researcher recommends reassessment of Workcenter Utilization rate, how
data is gathered to feed this metric, and what this metric is used for. In an environment as
dynamic as maintenance, many expressed the difficulty in obtaining accurate time that
maintainers spent on a job, and expressed concern that inaccurate data is being used to
make decisions about manning and force structure. It is important to note, that a
reevaluated and improved Workcenter Utilization Rate considered with the Job Standard
Fix Rate could reveal useful information regarding Workforce Quality and how
efficiently the workforce is employed.
Recommendation Summary/Research Question
The summary of the preceding recommendations for action for each of the 28
metrics evaluated, as well as recommendations for metrics proposed by respondents, are
detailed in Figure 63, and illustrated in the Figure 64, the Final Maintenance Group
Balanced Scorecard, and serve to answer the research question:

119
What metrics should be used in the Maintenance Group Balanced Scorecard
framework to meet the needs of the CAF Maintenance Community?
Figure 63: Maintenance Group Balanced Scorecard Metrics Recommendations

120
Figure 64: Final Maintenance Group Balanced Scorecard
These recommendations for refinement, addition, or reassessment of metrics were
compared to the results of related metrics research by Capt Brian Waller and Capt Emily
Harris, and Nachtman, et al, whose work was mentioned in the Literature Review.
Although the methodologies used in each of these pieces of research differed, and the
scopes of each piece of literature varied, there were several similarities in metrics
proposed for use or recommended for incorporation, reevaluation or elimination. The
results of this comparison are listed in Appendix K.

121
Other Recommendations
Recommend the standardization of maintenance metrics vocabulary between
publications where they are addressed, and expand the metrics study publication, ACCI
21-118 to specifically list recommended metrics to be studied at the Group Level from
the Maintenance Group Balanced Scorecard framework presented, including
recommended new metrics, and recommended refined metrics.
Recommend the centralization of Maintenance Group Analysis shops at the wing
level to perform analysis functions for both the Operations Group and the Maintenance
Group as the Wing Analysis function to facilitate a holistic view of the performance of
the entire flying wing, instead of purely the performance of the Maintenance Groups.
Recommendations for Future Research
First, a Delphi Study could be performed using the results of this study to obtain
follow-up inputs on the final proposed Maintenance Group Balanced Scorecard,
including formulas for the metrics, and incorporating a Supplier Perspective, as
mentioned in recommendations.
A follow-on study could also address issues of data integration with current
maintenance data system capabilities, as maintenance information systems such as
Integrated Maintenance Data System or GO-81 may not currently have the capability to
capture required data to implement proposed metrics.
The need for a Supplier Performance Perspective was a revelation revealed late in
the research process and warrants further consideration and research beyond the scope of
this thesis. The researcher strongly recommends further research to validate including a
122
Supplier Performance Perspective on the Maintenance Group’s Balanced Scorecard as
Supplier Performance measures would be especially relevant to 5th generation aircraft
under the influence of the corporate contributors, vendors and manufacturers. Supplier
Performance measures are an absolute necessity to limit sustainment vulnerabilities as
programs such as the F-22, F-35 and KC-46 mature.
To clearly understand the Maintenance Group’s value proposition in dealing the
Aircrew as the customer, a follow-on study could expand survey to include pilots in the
Operations Groups up to the MAJCOM and HAF-level A3.
Finally, since this research was focused on CAF metrics, future research could
expand this study to Mobility Air Forces (MAF) and their unique set of aircraft
maintenance and operations metrics.
Conclusions
Since the beginning of Aircraft Maintenance, leaders have relied upon
performance metrics as tools to help guide decisions, improve processes and maximize
performance. Maintainers and their stakeholders continue to need to plainly see and
understand the link between the processes of a Maintenance Group, the customers they
provide for, the maintainers that enable it, and the bottom-line readiness of all entities
involved. The Balanced Scorecard approach to looking at maintenance metrics first helps
to focus the Maintenance Group’s analysis around their strategic objective and helps
leaders to understand who their customer is, what processes are critical to achieving their
strategic objectives and customer’s needs, and gives a bottom-line view of readiness of
the entities of the Maintenance Group. Finally, the Maintenance Group Balanced
Scorecard framework helps leaders and decision-makers to view the health of the
123
enablers of the entire operation--the maintainers--and understand factors that contribute
to their job satisfaction, the quality of their work, and their skills and experience in their
work.
An organization as complex and dynamic as the Maintenance Group demands a
metrics framework that is comprehensive enough to understand all aspects of the
performance of the organization, but structured enough to directly see how positive or
negative dynamics of one process may be affecting another. Metrics have helped to
guide Aircraft Maintenance through decades of challenge and change; with an aging
fleet, budget constraints, and slashed manning levels as the backdrop for current and
future operations, there has never been a more critical time to implement a clear, holistic
metrics framework that meets the needs of the leaders and decision makers who are
navigating through the turbulent times ahead..
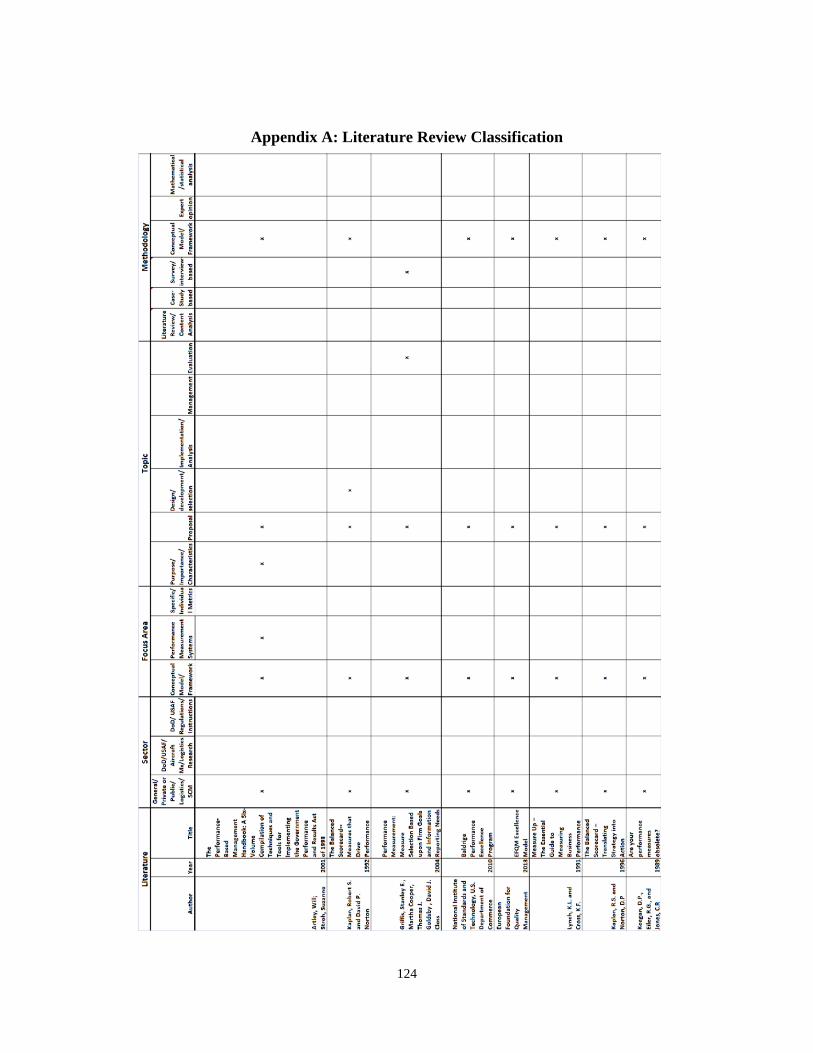
124
Appendix A: Literature Review Classification
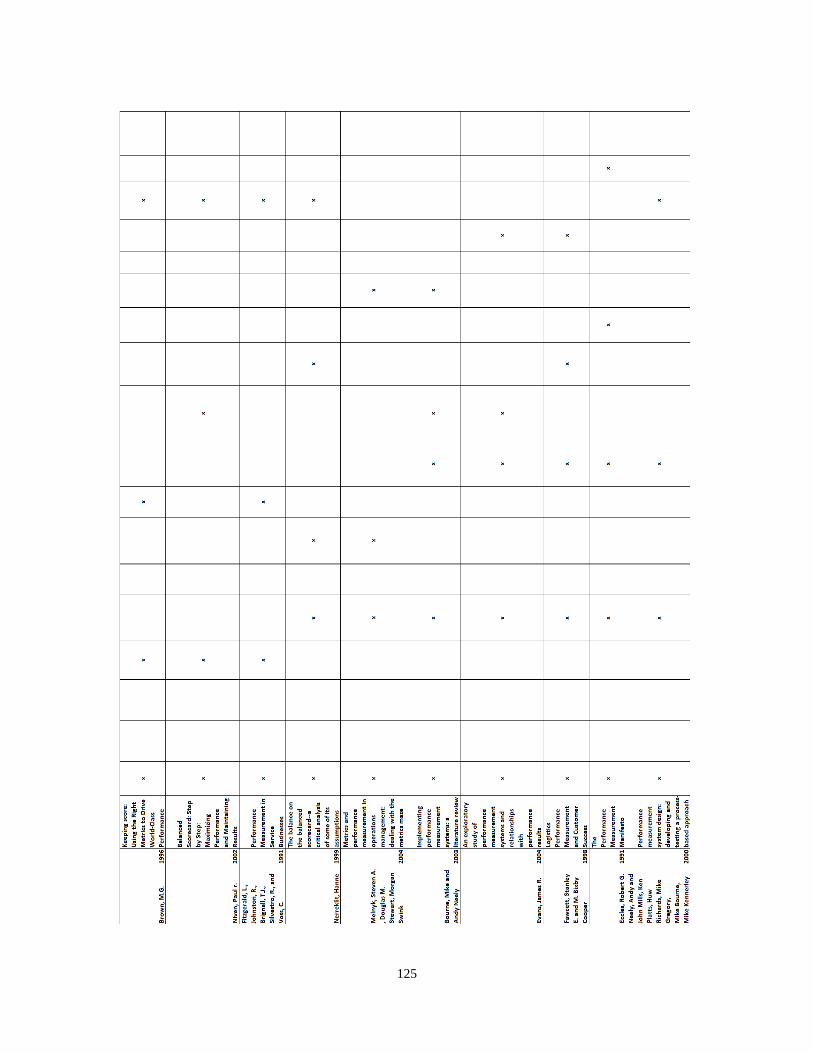
125
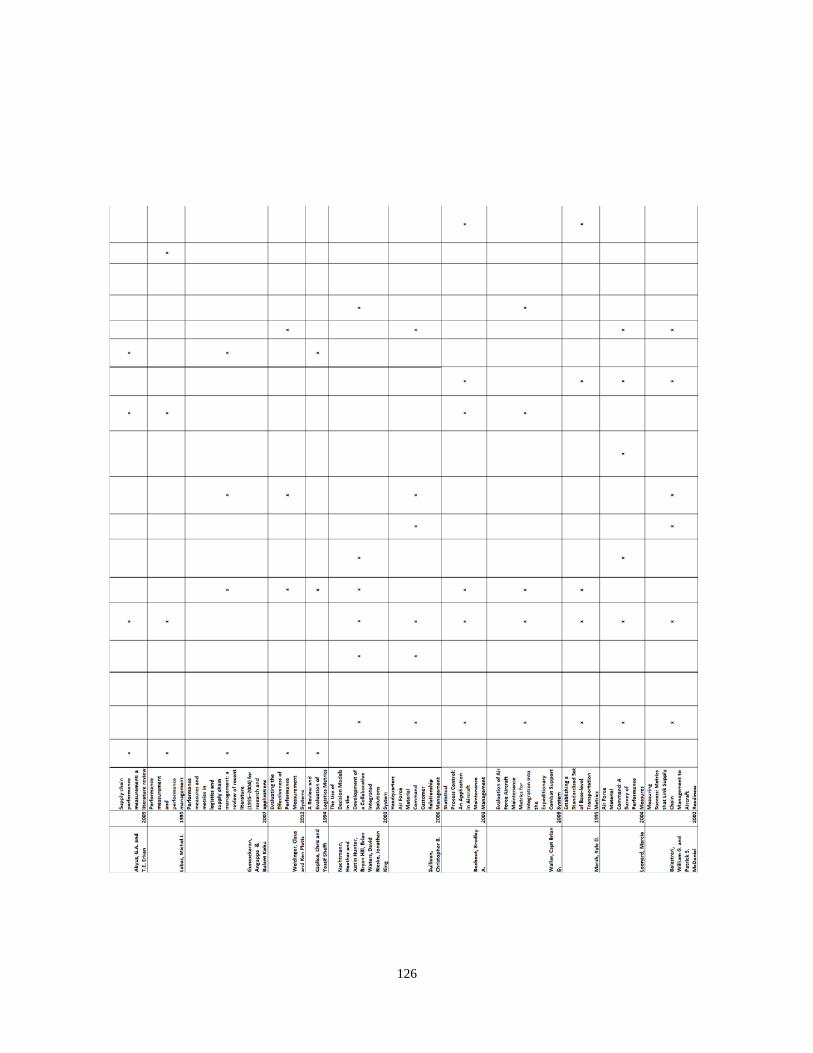
126

127
Appendix B: Exhaustive List of Metrics
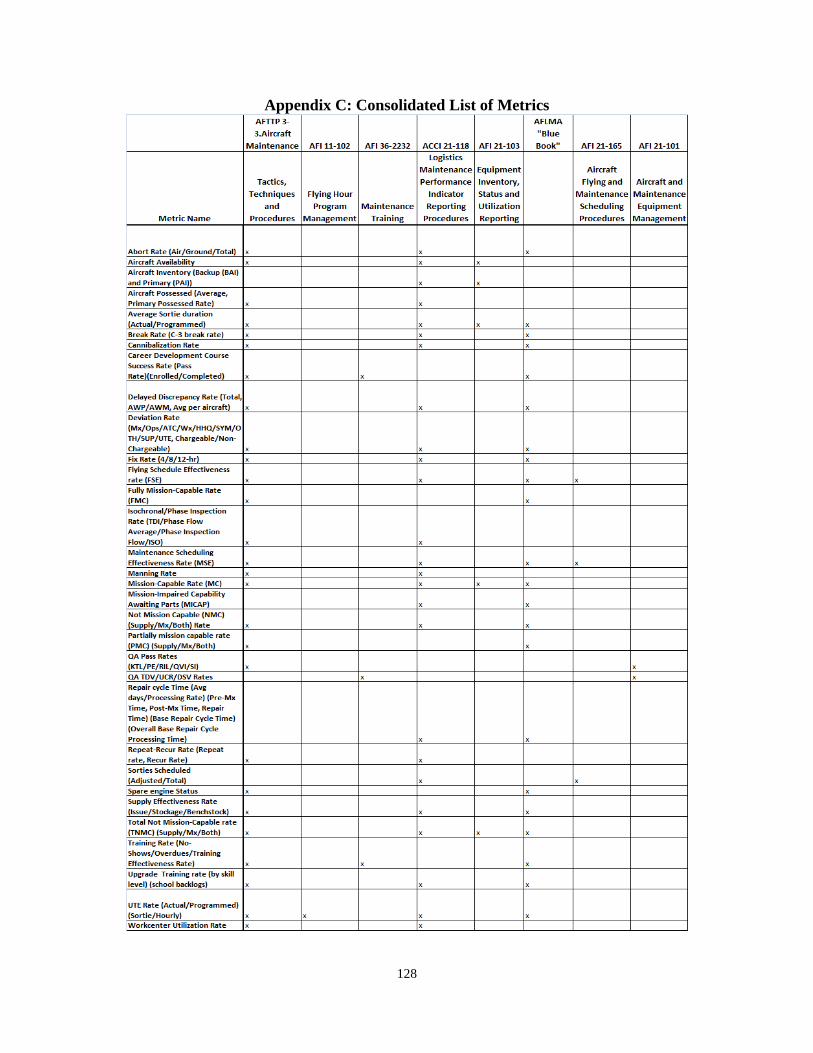
128
Appendix C: Consolidated List of Metrics
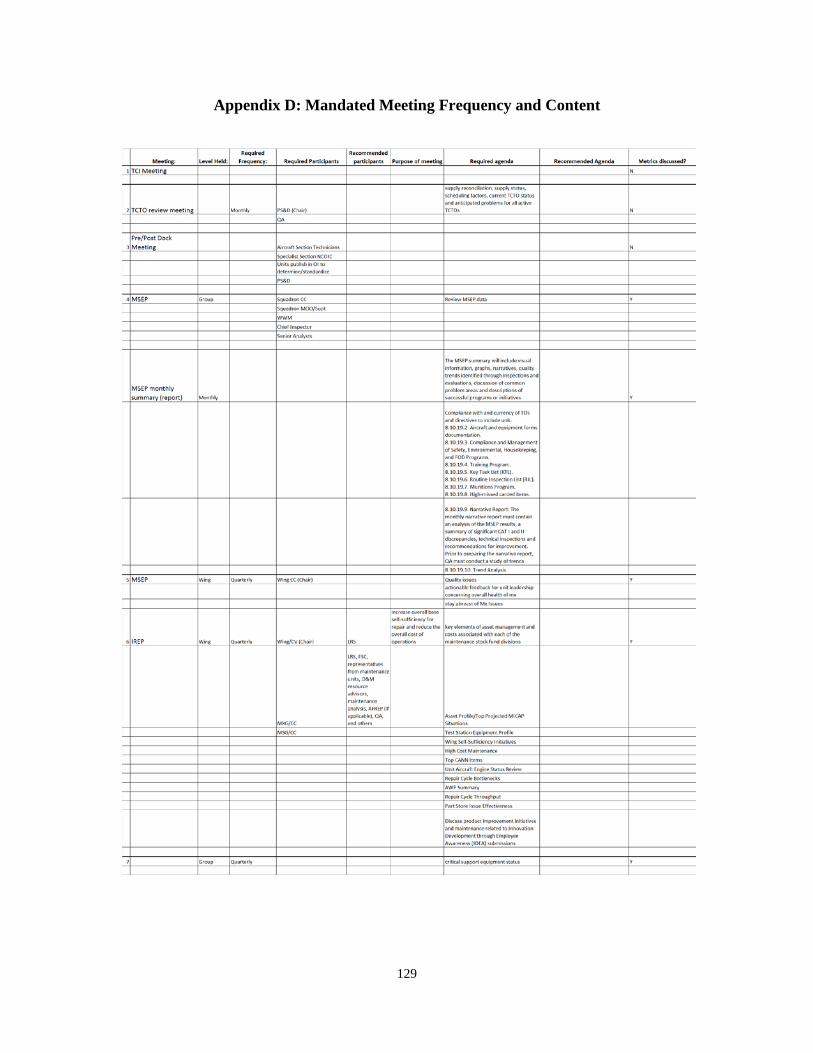
129
Appendix D: Mandated Meeting Frequency and Content

130
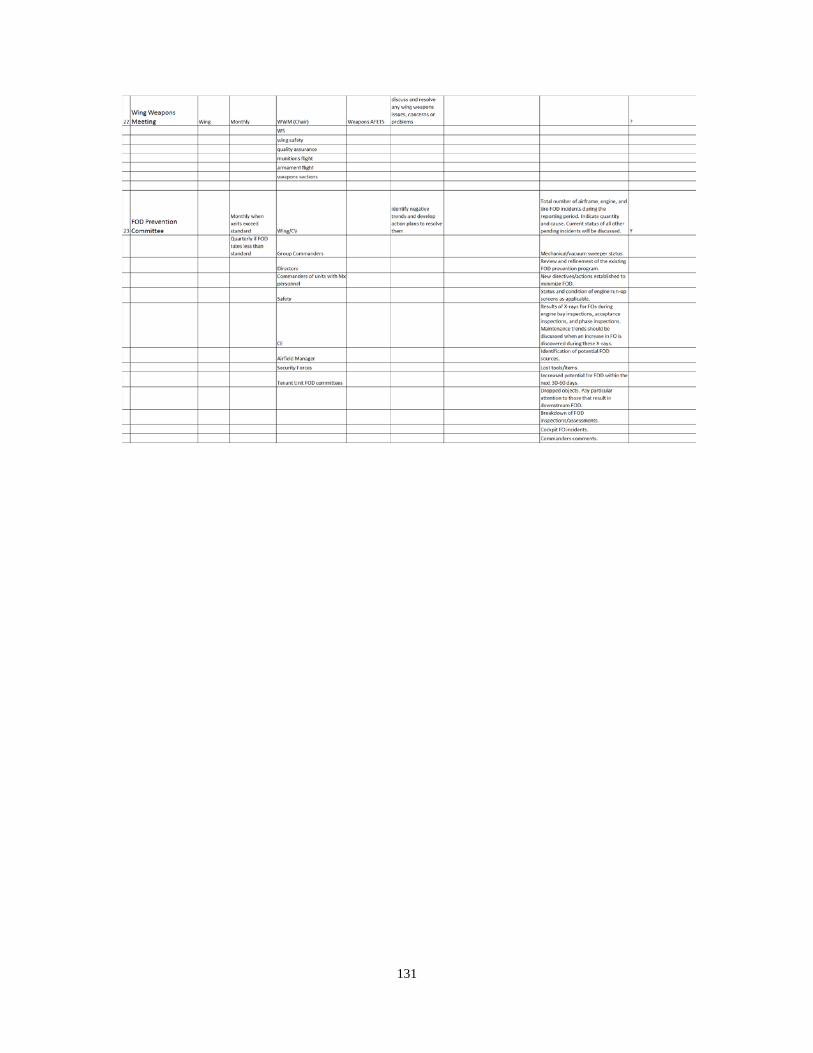
131
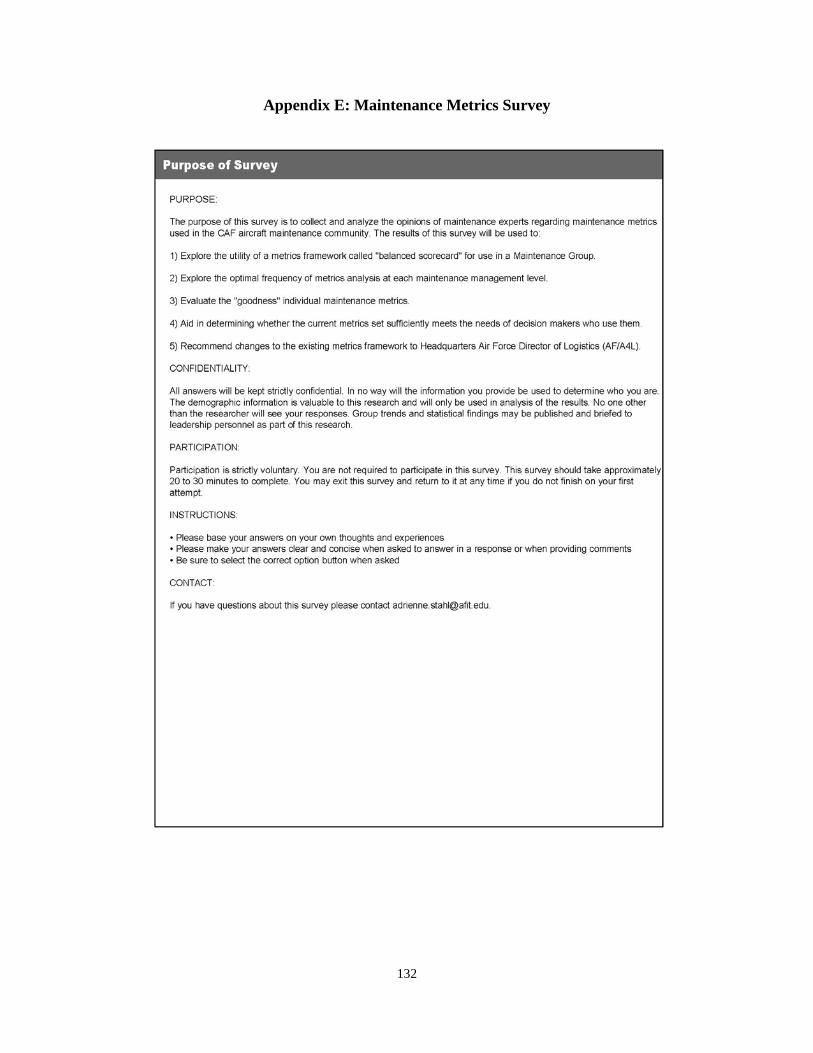
132
Appendix E: Maintenance Metrics Survey
133

134

135
136

137
138

139

140

141

142
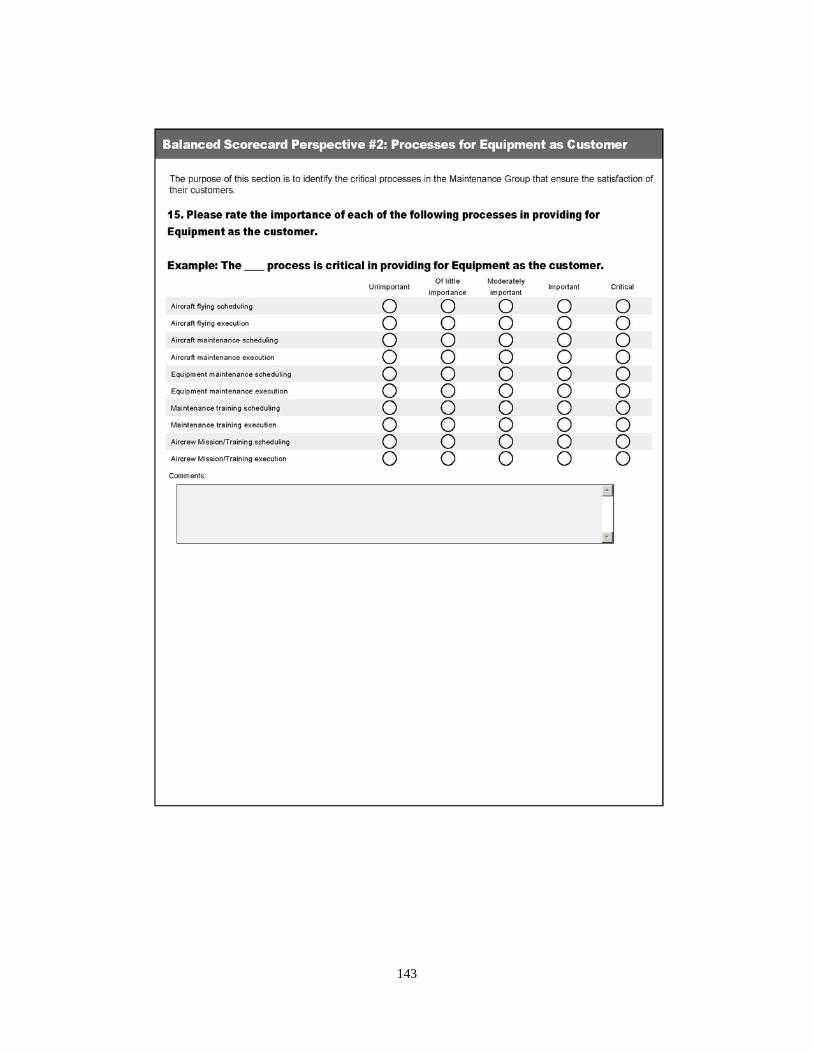
143
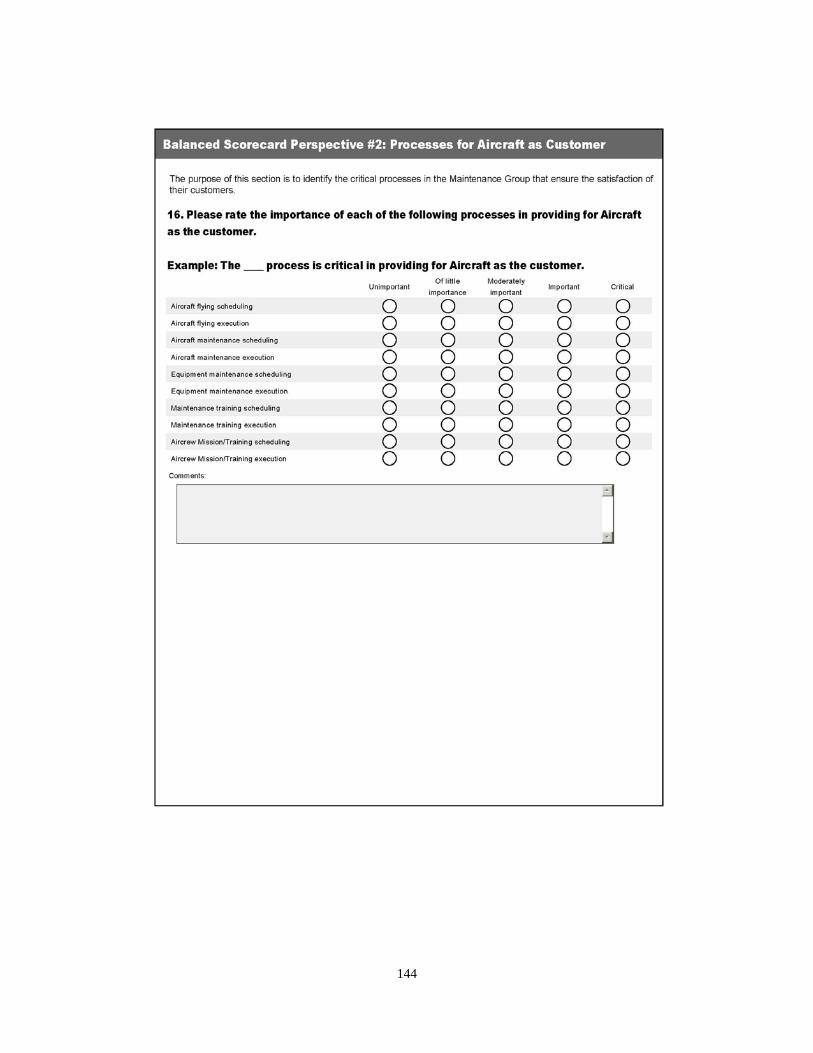
144

145
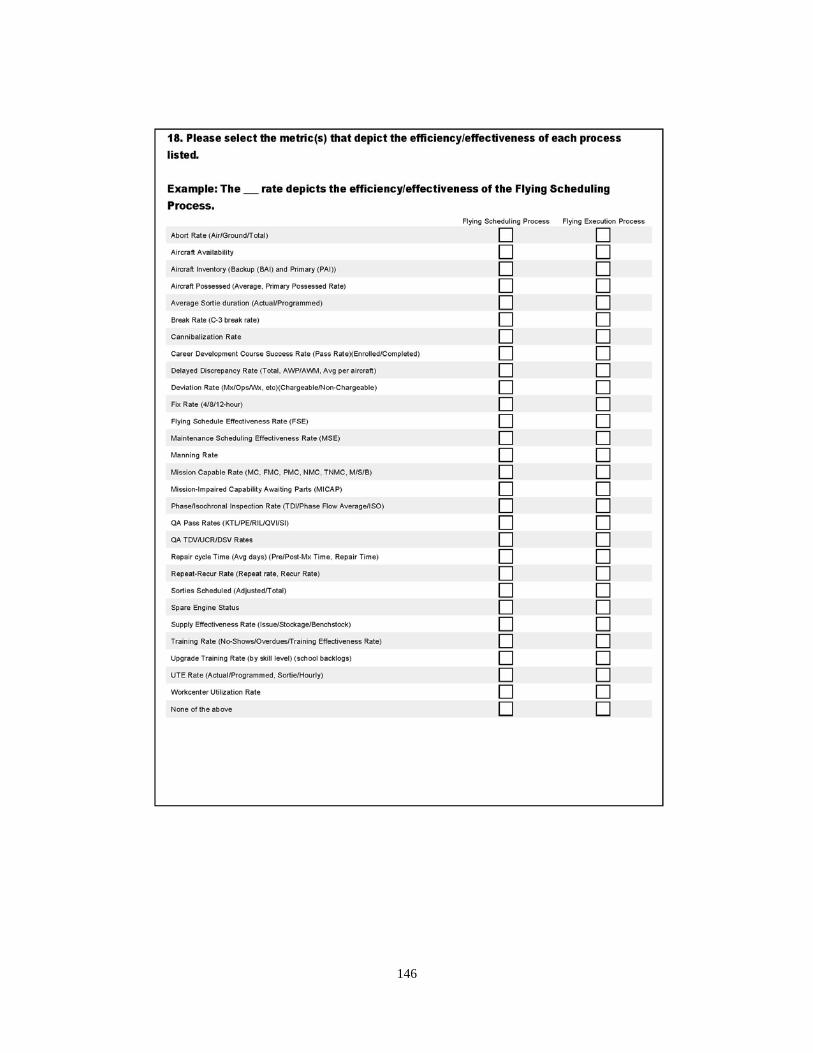
146

147

148
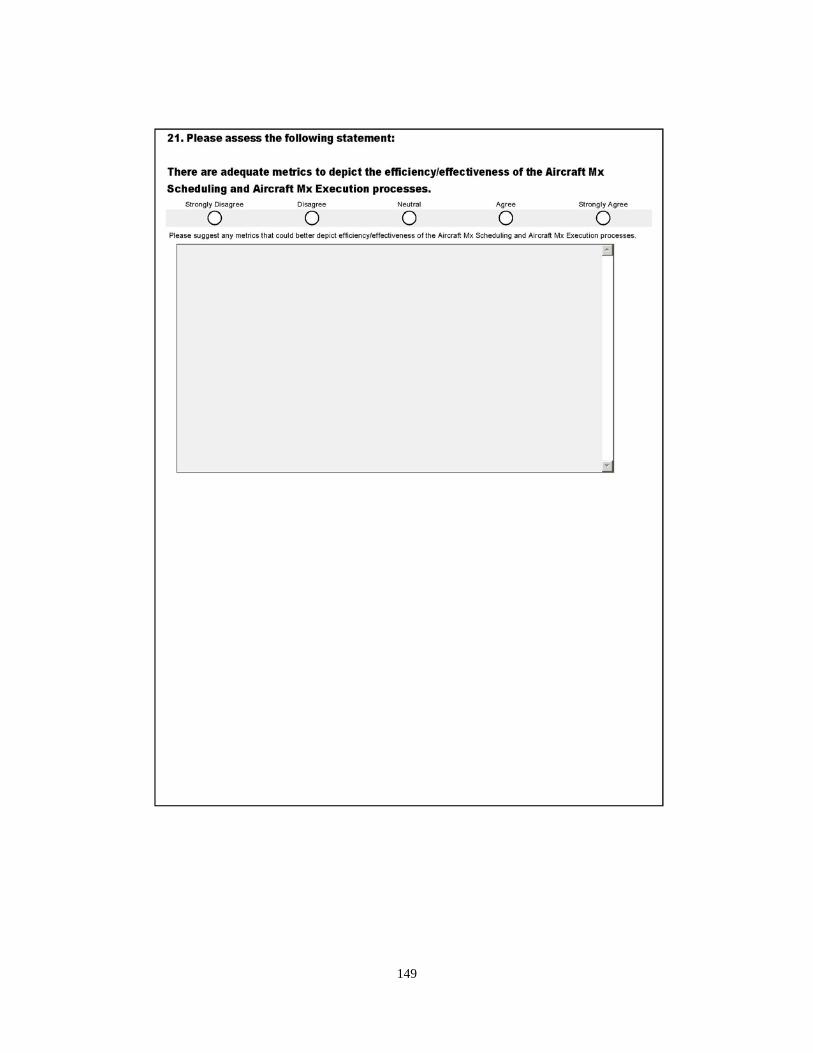
149
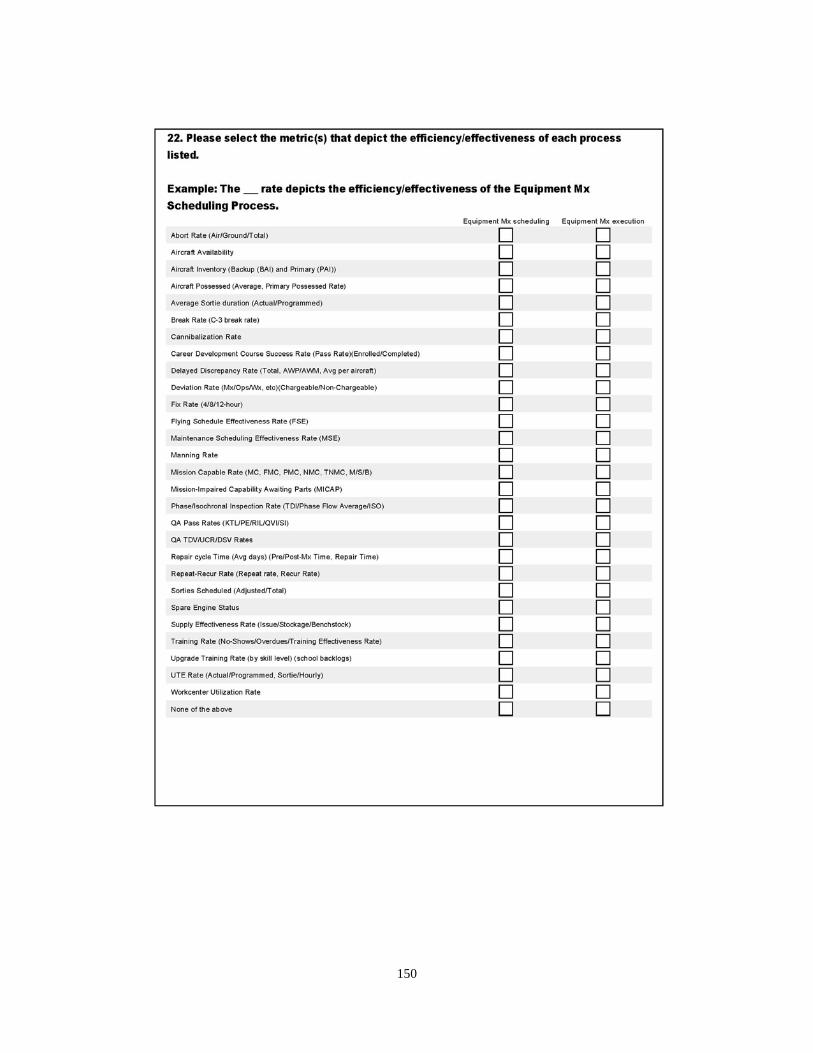
150

151

152

153
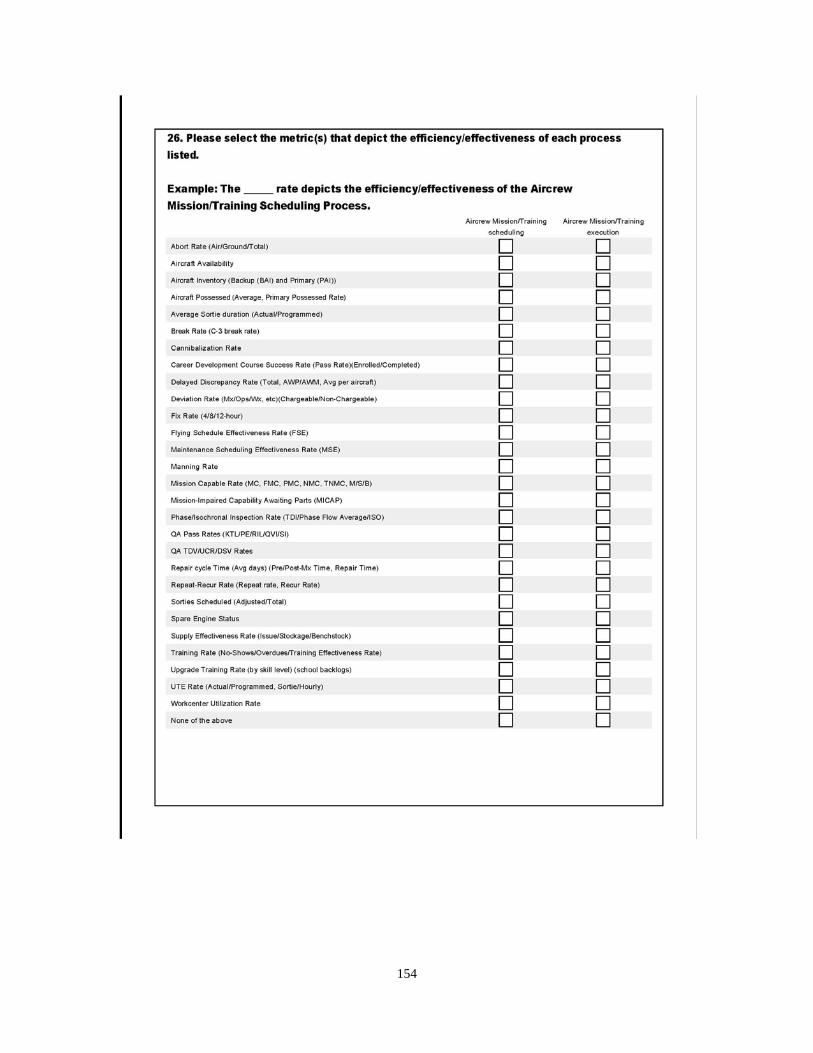
154
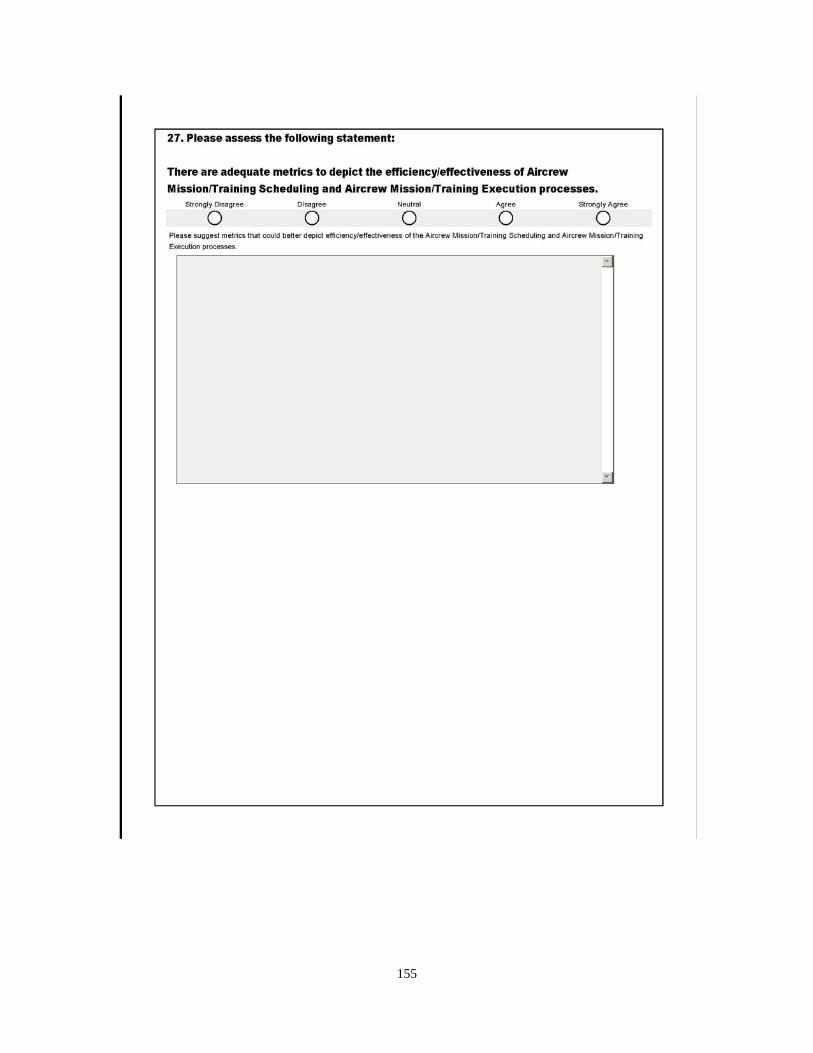
155
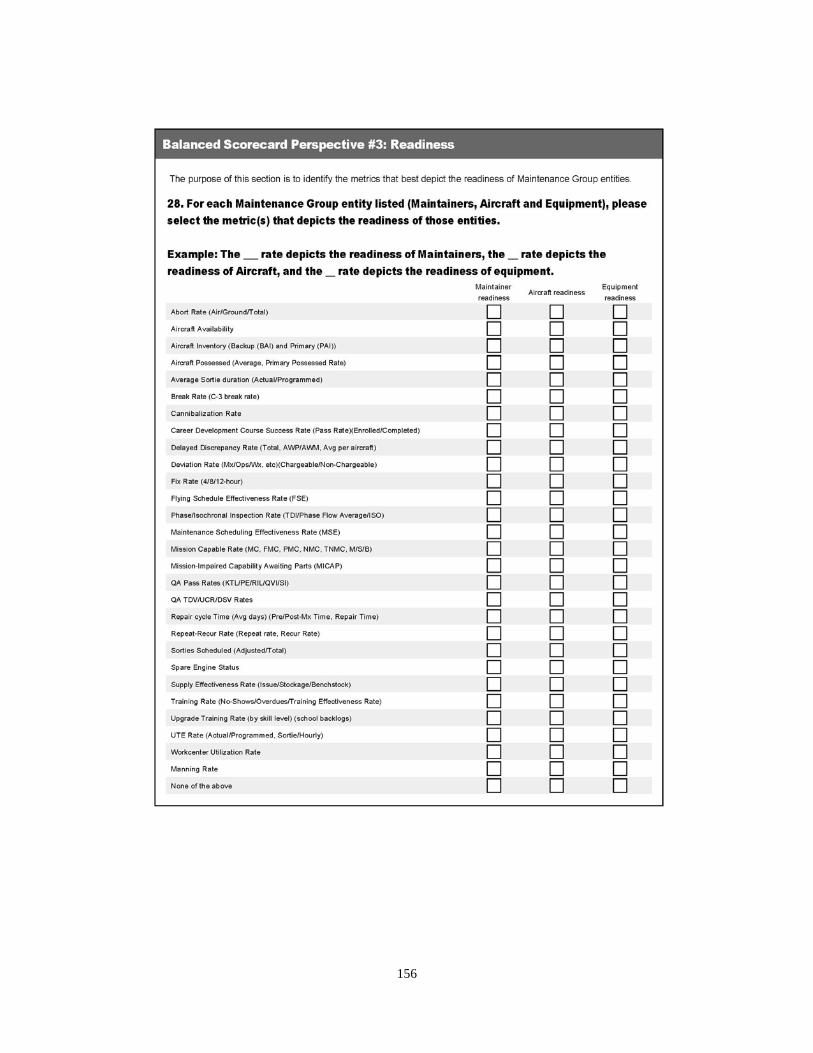
156

157

158
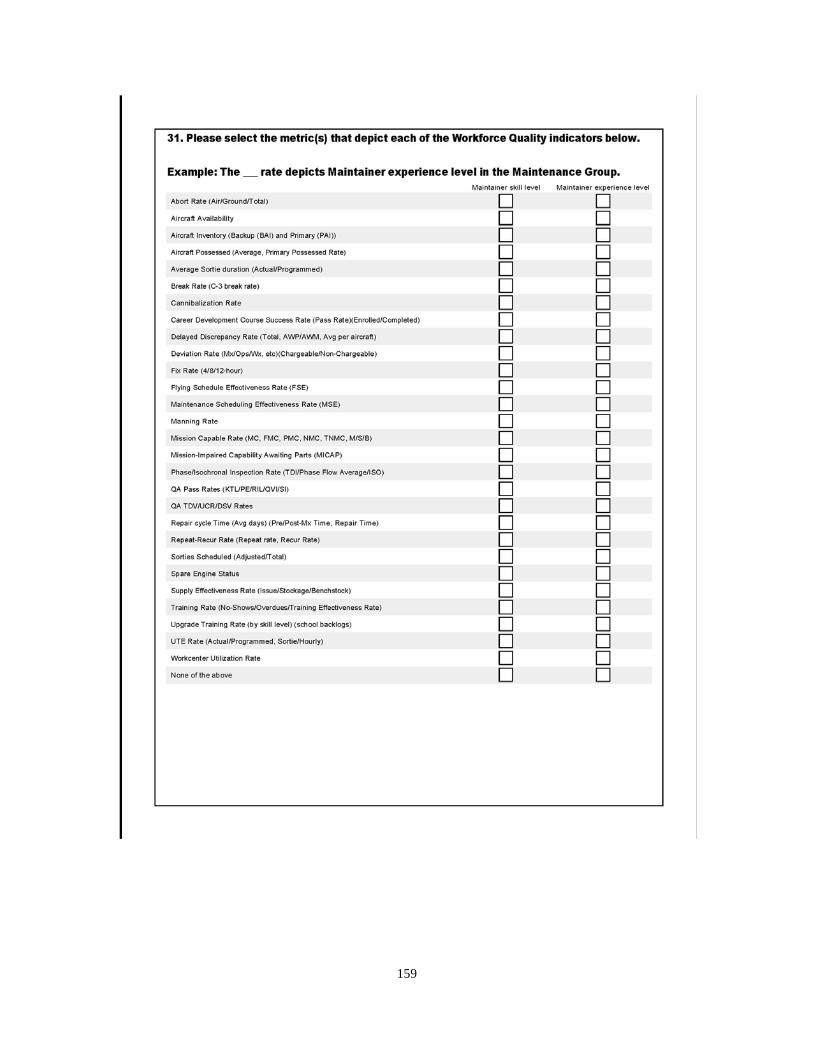
159
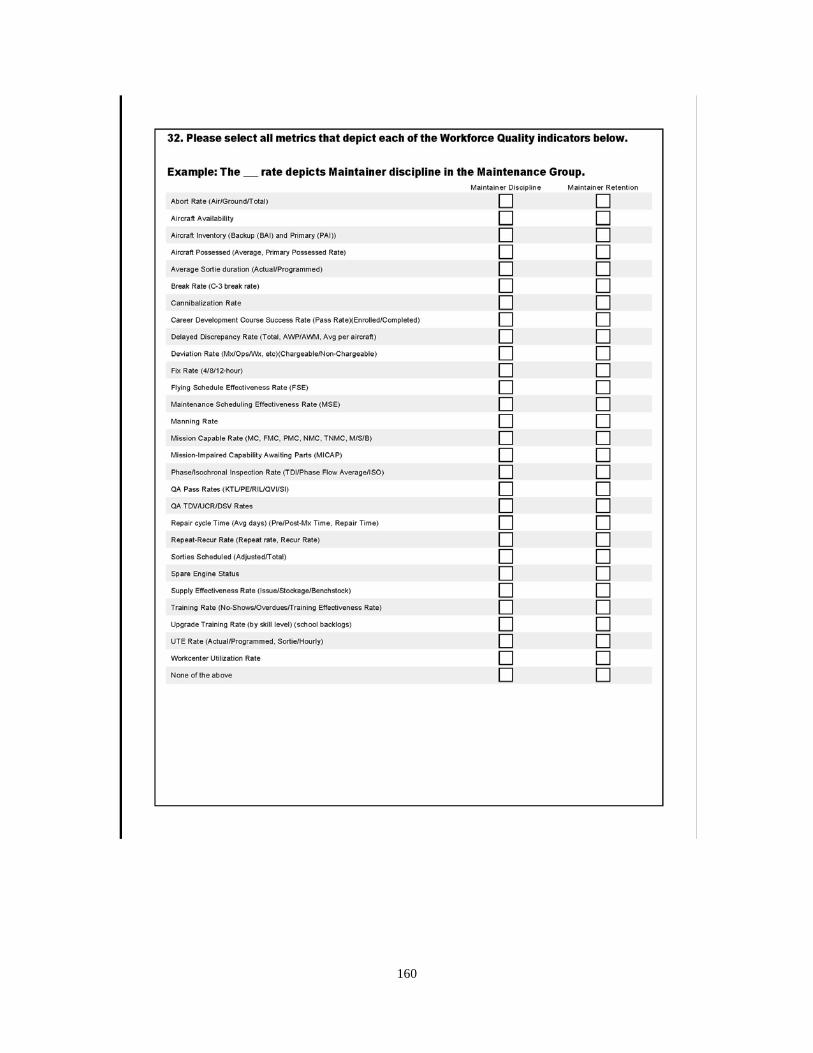
160

161
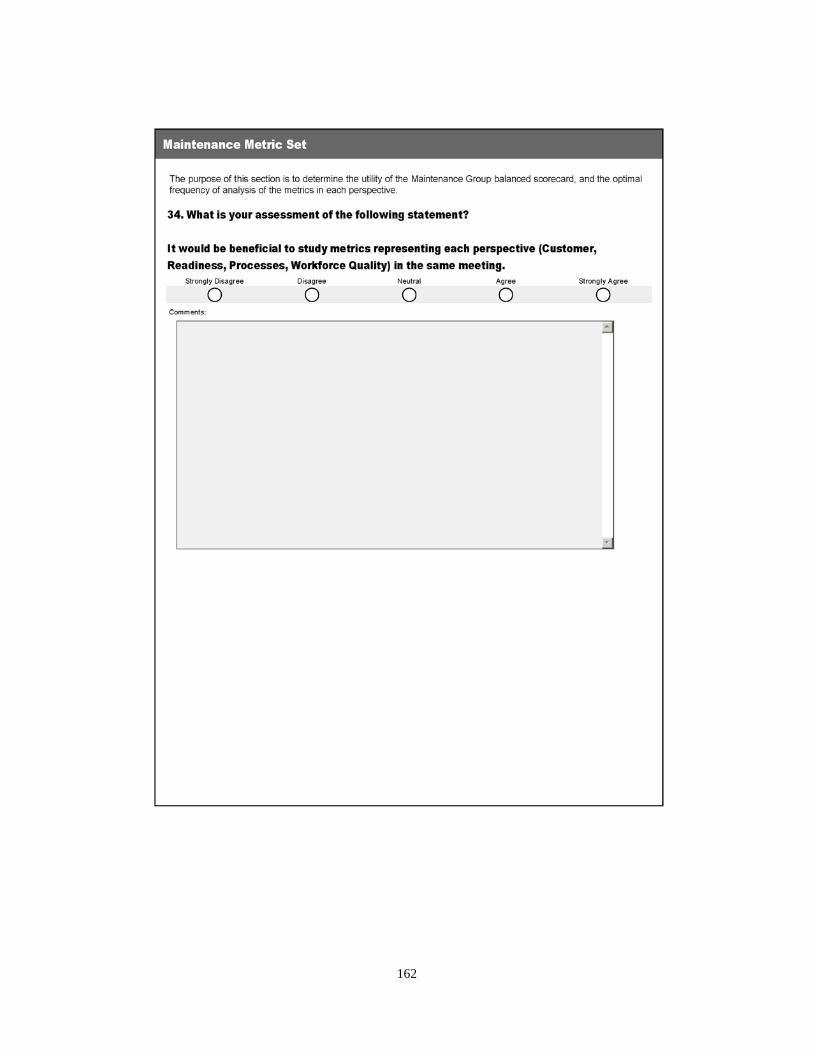
162
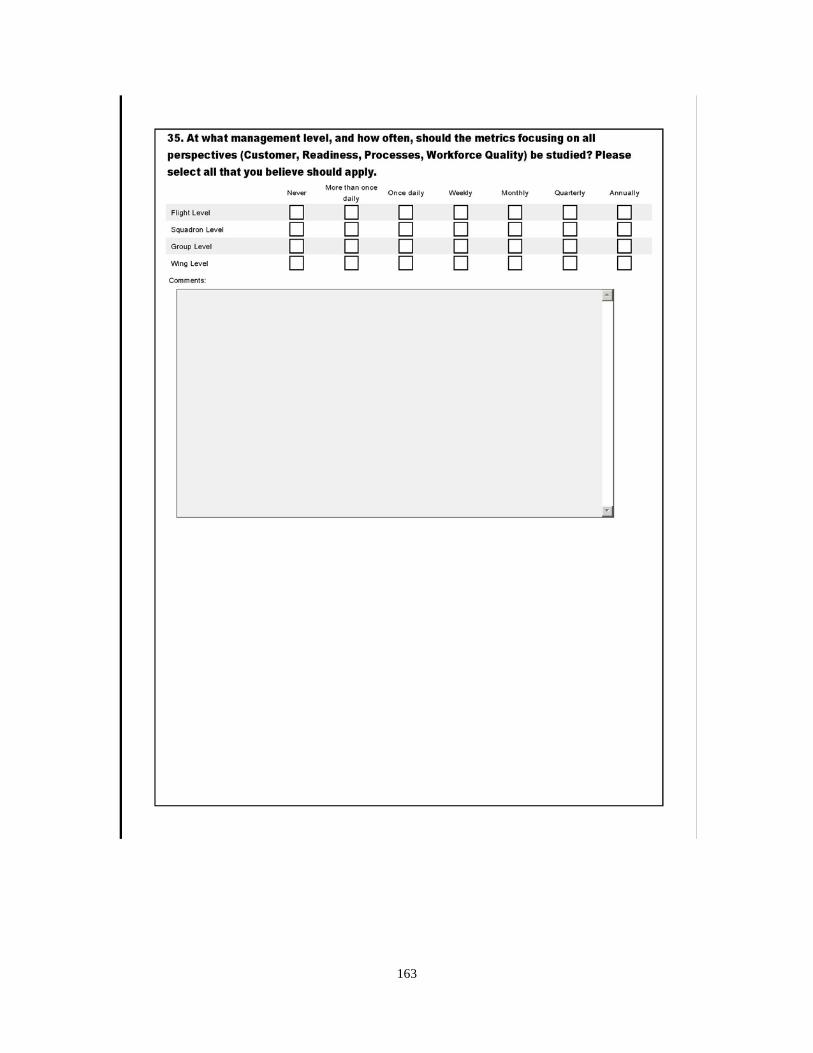
163

164

165

166
Appendix F: Internal Review Board exemption letter

167
Appendix G. Survey Control Number

168

169

170
Appendix H: Process and Assigned Metrics Cross Tabulation
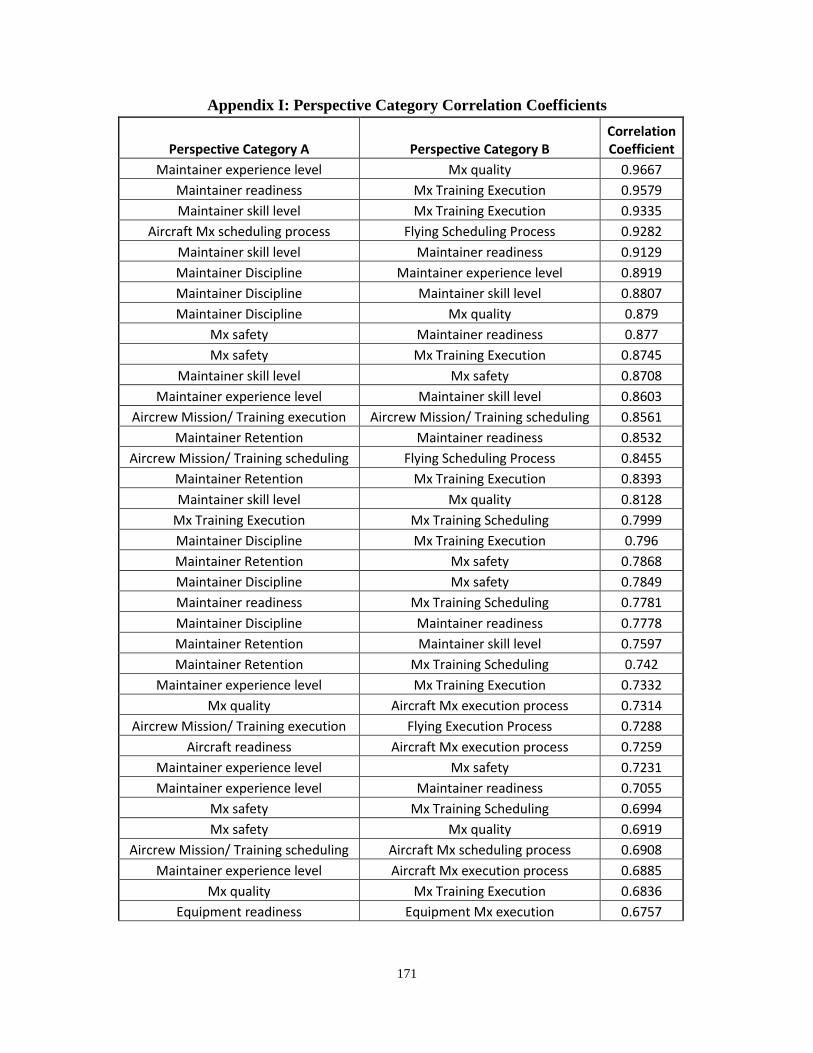
171
Appendix I: Perspective Category Correlation Coefficients
Perspective Category A Perspective Category B Correlation Coefficient
Maintainer experience level Mx quality 0.9667 Maintainer readiness Mx Training Execution 0.9579 Maintainer skill level Mx Training Execution 0.9335
Aircraft Mx scheduling process Flying Scheduling Process 0.9282 Maintainer skill level Maintainer readiness 0.9129 Maintainer Discipline Maintainer experience level 0.8919 Maintainer Discipline Maintainer skill level 0.8807 Maintainer Discipline Mx quality 0.879
Mx safety Maintainer readiness 0.877 Mx safety Mx Training Execution 0.8745
Maintainer skill level Mx safety 0.8708 Maintainer experience level Maintainer skill level 0.8603
Aircrew Mission/ Training execution Aircrew Mission/ Training scheduling 0.8561 Maintainer Retention Maintainer readiness 0.8532
Aircrew Mission/ Training scheduling Flying Scheduling Process 0.8455 Maintainer Retention Mx Training Execution 0.8393 Maintainer skill level Mx quality 0.8128
Mx Training Execution Mx Training Scheduling 0.7999 Maintainer Discipline Mx Training Execution 0.796 Maintainer Retention Mx safety 0.7868 Maintainer Discipline Mx safety 0.7849 Maintainer readiness Mx Training Scheduling 0.7781 Maintainer Discipline Maintainer readiness 0.7778 Maintainer Retention Maintainer skill level 0.7597 Maintainer Retention Mx Training Scheduling 0.742
Maintainer experience level Mx Training Execution 0.7332 Mx quality Aircraft Mx execution process 0.7314
Aircrew Mission/ Training execution Flying Execution Process 0.7288 Aircraft readiness Aircraft Mx execution process 0.7259
Maintainer experience level Mx safety 0.7231 Maintainer experience level Maintainer readiness 0.7055
Mx safety Mx Training Scheduling 0.6994 Mx safety Mx quality 0.6919
Aircrew Mission/ Training scheduling Aircraft Mx scheduling process 0.6908 Maintainer experience level Aircraft Mx execution process 0.6885
Mx quality Mx Training Execution 0.6836 Equipment readiness Equipment Mx execution 0.6757

172
Aircraft Mx execution process Flying Execution Process 0.659 Maintainer experience level Equipment Mx execution 0.6542
Mx quality Maintainer readiness 0.6518 Maintainer skill level Mx Training Scheduling 0.6497
Equipment Mx scheduling Aircraft Mx scheduling process 0.6348 Equipment readiness Aircraft Mx execution process 0.6279
Equipment Mx execution Aircraft Mx execution process 0.612 Equipment readiness Equipment Mx scheduling 0.5972 Maintainer Retention Maintainer Discipline 0.5909
Aircraft readiness Aircrew Mission/ Training execution 0.5868 Equipment readiness Aircraft readiness 0.5764
Mx quality Equipment Mx execution 0.5642 Aircraft readiness Flying Execution Process 0.5605
Aircrew Mission/ Training execution Flying Scheduling Process 0.5521 Maintainer Discipline Aircraft Mx execution process 0.5163 Maintainer Discipline Equipment Mx execution 0.5089 Maintainer Retention Maintainer experience level 0.5057
Aircraft readiness Aircraft Mx scheduling process 0.5045 Aircraft readiness Aircrew Mission/ Training scheduling 0.4999
Maintainer skill level Equipment Mx execution 0.49 Aircrew Mission/ Training scheduling Flying Execution Process 0.4832
Aircraft readiness Flying Scheduling Process 0.4726 Maintainer Discipline Mx Training Scheduling 0.4672 Maintainer Retention Mx quality 0.452
Equipment Mx scheduling Flying Scheduling Process 0.4435 Equipment Mx execution Equipment Mx scheduling 0.4396
Maintainer readiness Equipment Mx execution 0.4249 Equipment readiness Aircraft Mx scheduling process 0.408
Aircrew Mission/ Training execution Aircraft Mx execution process 0.3908 Maintainer skill level Aircraft Mx execution process 0.3779
Mx quality Aircraft readiness 0.368 Aircrew Mission/ Training execution Aircraft Mx scheduling process 0.3599
Maintainer experience level Mx Training Scheduling 0.3577 Mx Training Execution Equipment Mx execution 0.3516
Mx quality Flying Execution Process 0.3486 Mx quality Mx Training Scheduling 0.3301 Mx safety Equipment Mx execution 0.2987
Equipment readiness Flying Scheduling Process 0.2966 Mx safety Aircraft Mx execution process 0.2946
Maintainer experience level Aircraft readiness 0.2912
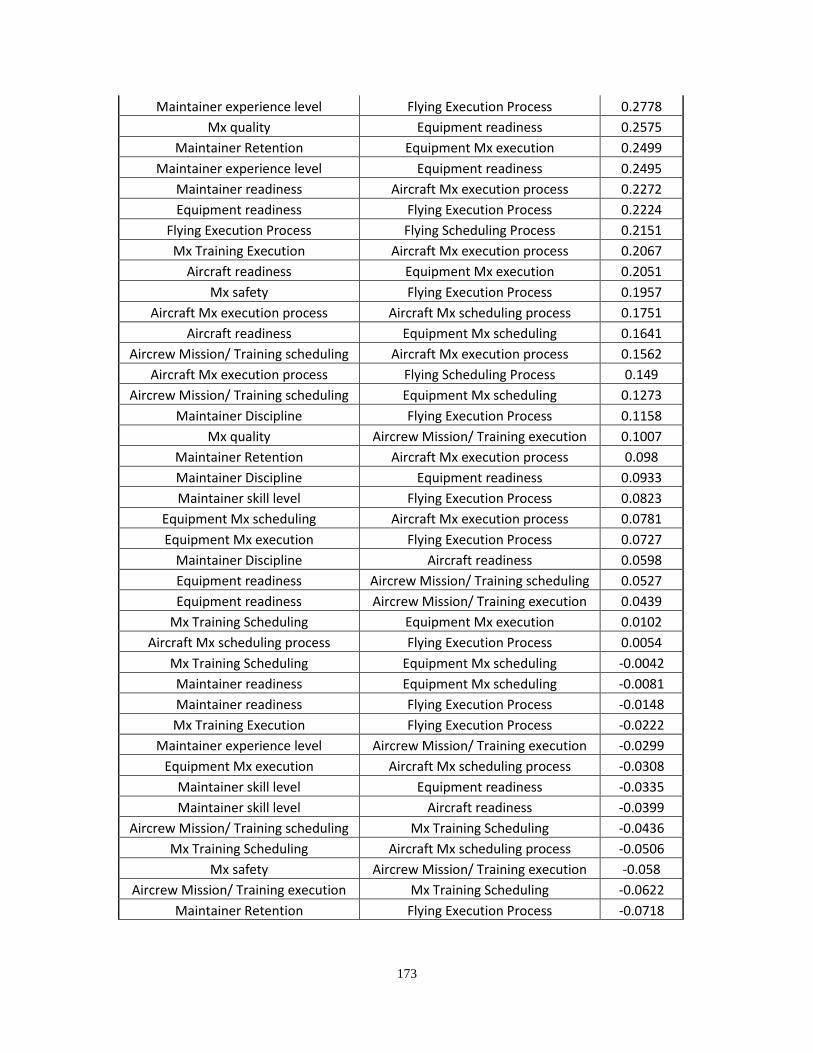
173
Maintainer experience level Flying Execution Process 0.2778 Mx quality Equipment readiness 0.2575
Maintainer Retention Equipment Mx execution 0.2499 Maintainer experience level Equipment readiness 0.2495
Maintainer readiness Aircraft Mx execution process 0.2272 Equipment readiness Flying Execution Process 0.2224
Flying Execution Process Flying Scheduling Process 0.2151 Mx Training Execution Aircraft Mx execution process 0.2067
Aircraft readiness Equipment Mx execution 0.2051 Mx safety Flying Execution Process 0.1957
Aircraft Mx execution process Aircraft Mx scheduling process 0.1751 Aircraft readiness Equipment Mx scheduling 0.1641
Aircrew Mission/ Training scheduling Aircraft Mx execution process 0.1562 Aircraft Mx execution process Flying Scheduling Process 0.149
Aircrew Mission/ Training scheduling Equipment Mx scheduling 0.1273 Maintainer Discipline Flying Execution Process 0.1158
Mx quality Aircrew Mission/ Training execution 0.1007 Maintainer Retention Aircraft Mx execution process 0.098 Maintainer Discipline Equipment readiness 0.0933 Maintainer skill level Flying Execution Process 0.0823
Equipment Mx scheduling Aircraft Mx execution process 0.0781 Equipment Mx execution Flying Execution Process 0.0727
Maintainer Discipline Aircraft readiness 0.0598 Equipment readiness Aircrew Mission/ Training scheduling 0.0527 Equipment readiness Aircrew Mission/ Training execution 0.0439
Mx Training Scheduling Equipment Mx execution 0.0102 Aircraft Mx scheduling process Flying Execution Process 0.0054
Mx Training Scheduling Equipment Mx scheduling -0.0042 Maintainer readiness Equipment Mx scheduling -0.0081 Maintainer readiness Flying Execution Process -0.0148 Mx Training Execution Flying Execution Process -0.0222
Maintainer experience level Aircrew Mission/ Training execution -0.0299 Equipment Mx execution Aircraft Mx scheduling process -0.0308
Maintainer skill level Equipment readiness -0.0335 Maintainer skill level Aircraft readiness -0.0399
Aircrew Mission/ Training scheduling Mx Training Scheduling -0.0436 Mx Training Scheduling Aircraft Mx scheduling process -0.0506
Mx safety Aircrew Mission/ Training execution -0.058 Aircrew Mission/ Training execution Mx Training Scheduling -0.0622
Maintainer Retention Flying Execution Process -0.0718

174
Mx Training Scheduling Aircraft Mx execution process -0.0856 Mx Training Scheduling Flying Scheduling Process -0.0924 Mx Training Execution Equipment Mx scheduling -0.0959 Maintainer skill level Equipment Mx scheduling -0.1084
Maintainer experience level Equipment Mx scheduling -0.1137 Maintainer Retention Equipment Mx scheduling -0.1265
Mx safety Aircraft readiness -0.1283 Aircrew Mission/ Training execution Equipment Mx scheduling -0.1382
Equipment readiness Maintainer readiness -0.1416 Mx quality Equipment Mx scheduling -0.1588
Mx Training Scheduling Flying Execution Process -0.1619 Mx quality Aircraft Mx scheduling process -0.1628 Mx quality Aircrew Mission/ Training scheduling -0.1674
Aircraft readiness Mx Training Execution -0.1783 Maintainer Discipline Equipment Mx scheduling -0.1784
Aircrew Mission/ Training execution Mx Training Execution -0.1796 Equipment Mx execution Flying Scheduling Process -0.1899
Equipment readiness Mx Training Execution -0.1922 Maintainer readiness Aircrew Mission/ Training execution -0.194 Maintainer skill level Aircrew Mission/ Training execution -0.2037 Maintainer Discipline Aircrew Mission/ Training execution -0.2103
Maintainer experience level Aircraft Mx scheduling process -0.2178 Aircraft readiness Maintainer readiness -0.2307
Maintainer Retention Aircrew Mission/ Training execution -0.235 Aircraft readiness Mx Training Scheduling -0.2426
Mx quality Flying Scheduling Process -0.2494 Mx safety Aircrew Mission/ Training scheduling -0.2506 Mx safety Equipment readiness -0.2515
Maintainer readiness Aircraft Mx scheduling process -0.2548 Aircrew Mission/ Training execution Equipment Mx execution -0.2582
Maintainer Discipline Aircraft Mx scheduling process -0.2644 Mx safety Equipment Mx scheduling -0.2777
Maintainer Retention Equipment readiness -0.2916 Maintainer experience level Aircrew Mission/ Training scheduling -0.2975
Maintainer readiness Aircrew Mission/ Training scheduling -0.3012 Maintainer readiness Flying Scheduling Process -0.3069 Maintainer Retention Aircraft readiness -0.3118 Mx Training Execution Aircraft Mx scheduling process -0.3152 Maintainer skill level Aircraft Mx scheduling process -0.3269
Equipment Mx scheduling Flying Execution Process -0.3343
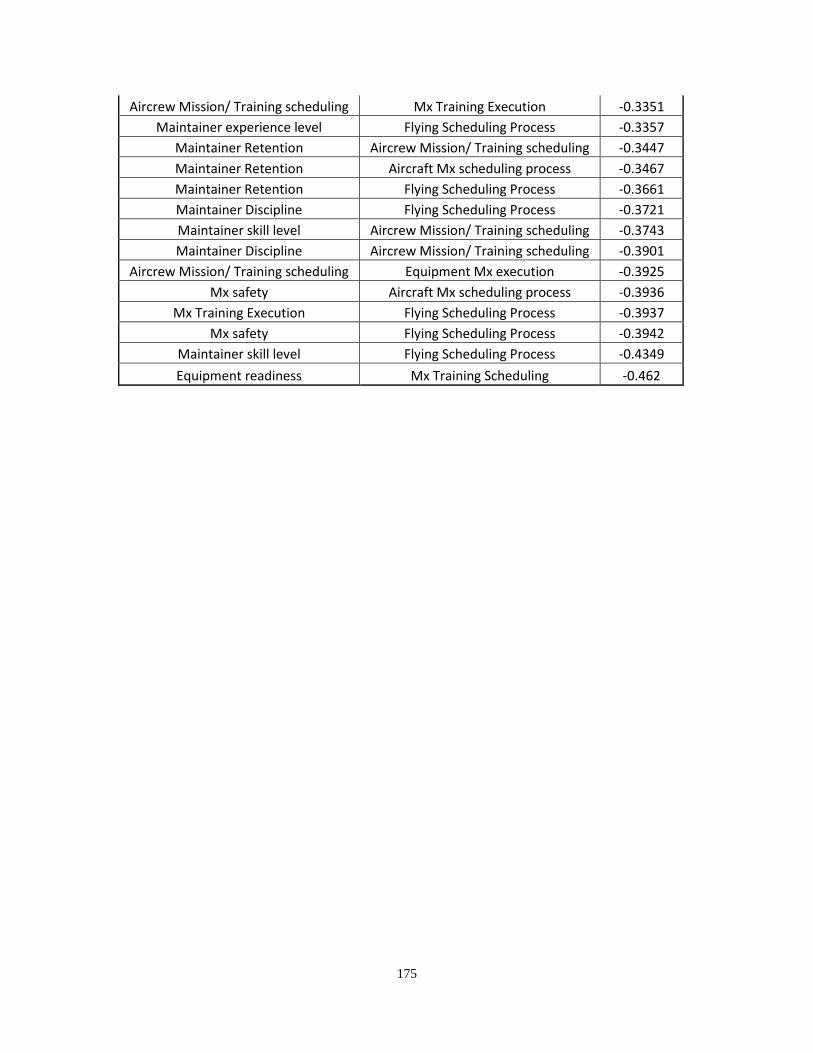
175
Aircrew Mission/ Training scheduling Mx Training Execution -0.3351 Maintainer experience level Flying Scheduling Process -0.3357
Maintainer Retention Aircrew Mission/ Training scheduling -0.3447 Maintainer Retention Aircraft Mx scheduling process -0.3467 Maintainer Retention Flying Scheduling Process -0.3661 Maintainer Discipline Flying Scheduling Process -0.3721 Maintainer skill level Aircrew Mission/ Training scheduling -0.3743 Maintainer Discipline Aircrew Mission/ Training scheduling -0.3901
Aircrew Mission/ Training scheduling Equipment Mx execution -0.3925 Mx safety Aircraft Mx scheduling process -0.3936
Mx Training Execution Flying Scheduling Process -0.3937 Mx safety Flying Scheduling Process -0.3942
Maintainer skill level Flying Scheduling Process -0.4349 Equipment readiness Mx Training Scheduling -0.462

176
Appendix J: Thesis Sponsorship Letter

177
Appendix K: Metrics Proposal Comparison
178
Bibliography
Air Combat Command Instruction 21-118. (2012, August 2). Maintenance: Logistics Maintenance Performance Indictor Reporting Procedures. Langley AFB: HQ ACC/A4.
Air Force Manual 66-1. (1972, Aug 1). Maintenance Management.
Akyuz, G., & Erkan, T. (2009). Supply Chain Performance Measurement: A Literature Review. International Journal of Production Research, 5137–5155.
Alreck, P. L., & Settle, R. B. (2004). The Survey Research Handbook, 3d edition. New York: McGraw-Hill/Irwin.
Artley, W., & Stroh, S. (2001). The Performance-Based Management Handbook: A Six-Volume Compilation of Techniques and Tools for Implementing the Government Performance and Results Act of 1993 (Vol. 2). The Oak Ridge Institute for Science and Education.
Balanced Scorecard Institute. (1998-2013). Balanced Scorecard Basics. Retrieved January 14, 2013, from Balanced Scorecard Institute Strategy Management Group: https://balancedscorecard.org/Resources/AbouttheBalancedScorecard/tabid/55/Default.aspx
Balestreri, W. G., & McDoniel, P. S. (2002). Measuring Success: Metrics that Link Supply Chain Management to Aircraft Readiness. Monteray: Naval Postgraduate School.
Barthol, D. R. (2005). An Analysis Into The Effectiveness Of Aircraft Maintenance. Wright Patterson Air Force Base: Air Force Institute of Technology.
Beabout, B. A. (2003). Statistical Process Control: An Application in Aircraft Maintenance Management. Wright Patterson Air Force Base: Air Force Institute of Technology.
Berg, N. (2005). Non-response bias. Retrieved from Munich Personal RePEc Archive: http://mpra.ub.uni-muenchen.de/26373/1/MPRA_paper_26373.pdf
Bolton, J. E. (2013, March 27). FY 2014 Budget Overview. Retrieved January 14, 2014, from http://www.saffm.hq.af.mil/shared/media/document/AFD-130410-051.pdf: http://www.saffm.hq.af.mil/shared/media/document/AFD-130410-051.pdf
179
Bourne, M., Neely, A., Platts, K., & Mills, J. (2003). Implementing performance measurement systems: a literature review. International Journal of Business Performance Management, 1-24.
Brown, M. (1996). Keeping score: Using the Right Metrics to Drive World-Class Performance. New York: Quality Resources.
Caplice, C., & Sheffi, Y. (1994). A Review and Evaluation of Logistics Metrics. The International Journal of Logistics Management, 5(2), 11-27.
Chapa, M. A. (2013). Predicting Aircraft Availability. Wright Patterson AFB: Air Force Institute of Technology.
Department of the Air Force Policy Directive 21-1. (2003, February 25). Maintenance. Washington: HQ USAF.
Department of the Air Force Instruction 11-202, Volume 1. (2010). Aircrew Training. Washington: HQ USAF.
Department of the Air Force Instruction 21-101. (2010). Aircraft and Equipment Maintenance Management. Washington: HQ USAF.
Department of the Air Force Instruction 21-103. (2012, January 26). Maintenance: Equipment Inventory, Status, and Utilization Reporting. Washington: HQ USAF.
Department of the Air Force Instruction 36-2101. (2013). Classifying Military Personnel (Officer and Enlisted). Washington: HQ USAF.
Department of the Air Force Instruction 36-2201. (2010). Air Force Training Program. Washington: HQ USAF.
Department of the Air Force Pamphlet 36-2241. (2013). Professional Development Guide. Washington: HQ USAF.
Department of the Air Force TO 00-20-1. (2010). Technical Manual: Aerospace Equipment Maintenance Inspection, Documentation, Policies and Procedures. Washington: HQ Air Force.
Durand, J. M. (2008). Aircraft Maintenance Organizational Structure Changes: An Antecedent Model. Wright Patterson Air Force Base: Air Force Institute of Technology.
Eccles, R. G. (1991). The Performance Measurement Manifesto. Harvard Business Review, 1-8.

180
Evans, J. R. (2004). An exploratory study of performance measurement systems and relationships with performance results. Journal of Operations Management, 219-232.
Evans, J. R. (2004). An exploratory study of performance measurement systems and relationships with performance results. Journal of Operations Management, 219-232.
Fawcett, S. E., & Cooper, M. B. (1998). Logistics Performance Measurement and Customer Success. New York: Elsevier Science Inc.
Fink, A. (2003). How to Design Survey Studies. Thousand Oaks: Sage Publications.
Fitzgerald, L. J. (1991). Performance Measurement in Service Businesses. London: The Chartered Institute of Management Accountants.
Fowler, F. J. (2014). Survey Research Methods. Los Angeles: SAGE Publications.
Griffis, S. E., Cooper, M., Goldsby, T. J., & Closs, D. J. (2004). Performance Measurement: Measure Selection based upon Firm goals and Information Reporting Needs. Journal of Business Logistics, 95-118.
Gunasekaran, A., & Kobu, B. (2007). Performance measures and metrics in logistics and supply chain management: A Review of Recent Literature. International Journal of Production Research, 2819–2840.
Harding University. (2014, 25 February). Ordinal Measures of Correlation: Spearman's Rho and Gamma. Retrieved from Harding University: http://www.harding.edu/sbreezeel/460%20files/statbook/chapter14.pdf
Harris, E. (2011). Development of Aerospace Ground Equipment (AGE) Metrics. Maxwell AFB-Gunter Annex: Air Force Logistics Management Agency.
HQ ACC/A3T, P. A. (2013, October 1). F-22A Ready Aircrew Program (RAP) Tasking Memorandum, Aviation Schedule 2014, (AS-14), (Effective 01 Oct 13).
http://www.defenseindustrydaily.com/aging-array-of-american-aircraft-attracting-attention-0901/. (n.d.).
Johnson, M. K. (2002). An Assessment of Logistics Readiness Squadron's Performance Indicators. Fort Leavenworth: U.S. Army Command and General Staff College.
Kaplan, R. S., & Norton, D. P. (1992, Jan-Feb). The Balanced Scorecard-Measures that Drive Performance. Harvard Business Review, pp. 70-80.
181
Kaplan, R. S., & Norton, D. P. (1996). The Balanced Scorecard – Translating Strategy into Action. Boston: Harvard Business School Press.
Keegan, D. E. (1989, June 12). Are your performance measures obsolete? Management Accounting, pp. 45–50.
Lavrakas, P. J. (2008). Respondent Fatigue. Retrieved from Sage Research Methods: http://srmo.sagepub.com/view/encyclopedia-of-survey-research-methods/n480.xml
Lebas, M. J. (1995). Performance measurement and performance management. International Journal of Production Economics, 23-35.
Leonard, M. (2004). Air Force Material Command: A Survey of Performance Measures. Wright Patterson Air Force Base: Air Force Institute of Technology.
Lincoln, Y., & Guba, E. (1985). Naturalistic inquiry. Beverly Hills: Sage.
Lynch, K. F., Drew, J. G., George, D., Tripp, R. S., Roll, C. R., & Leftwich, J. (2005). The Air Force Chief of Staff Logistics Review. Santa Monica, CA: RAND Corporation.
Lynch, R. L., & Cross, K. F. (1991). Measure Up – The Essential Guide to Measuring Business Performance. London: Mandarin.
Marsh, K. D. (1995). Establishing a Standardized Set of Base-Level Transportation Metrics. Wright Patterson Air Force Base: Air Force Institute of Technology.
McClave, J. T., Benson, P. G., & Sincich, T. (2011). Statistics for Business and Economics (11th ed.). Boston: Prentice Hall.
Melnyk, S. A., Stewart, D. M., & Swink, M. (2004). Metrics and performance measurement in operations management: dealing with the metrics maze. Journal of Operations Management, 209-217.
Nachtmann, H., Hunter, J., Hill, B., Waters, B., Reiske, D., & King, J. (2003). The Use of Decision Models in the Development of a Collaborative Integrated Solutions System. Wright Patterson AFB: Human Effectiveness Directorate, Logistics Readiness Branch.
National Institute of Standards and Technology. (n.d.).
Neely, A. (2002). Business performance measurement: Theory and practice. Cambridge: Cambridge University Press.

182
Neely, A., Mills, J., Platts, K., Richards, H., Gregory, M., Bourne, M., & Kennerly, M. (2000). Performance measurement system design: developing and testing a process-based approach. International Journal of Operations & Production Management, 1119-1145.
Nerreklit, H. (2000). The balance on the balanced scorecard--A critical analysis of some of its assumptions. Management Accounting Research, 65-88.
Niven, P. R. (2002). Balanced Scorecard Step-by-Step; Maximizing Performance and Maintaining Results. New York: John Wiley & Sons, Inc.
Oxford University Press. (2014). Oxford Dictionaries. Retrieved from Definition of customer in english: http://www.oxforddictionaries.com/us/definition/american_english/customer?q=customer
Rainey, J. C., McGonagle, R., Scott, B. F., & Waller, G. (2001). Metrics Handbook for Maintenance Leaders. Maxwell AFB, Gunter Annex: Air Force Logistics Management Agency.
Sullivan, C. B. (2006). Headquarters Air Force Material Command Customer Relationship Management. Wright Patterson Air Force Base: Air Force Institute of Technology.
Taylor, R. (1990). Interpretation of the Correlation Coefficient: A Basic Review. JDMS, 35-39.
Townsend, J. N. (1978). A History of Aircraft Maintenance in the Army Air Force and the United States Air Force. Maxwell Air Force Base: Air University.
Waller, B. D. (2009). Evaluation of Air Force Aircraft Maintenance Metrics for Integration into the Expeditionary Combat Support System. Wright-Patterson Air Force Base, Ohio: Air Force Institute of Technology.
Warr, R. (2014, February 28). LtCol. (A. L. Stahl, Interviewer)
Weidinger, C., & Platts, K. (2012). Evaluating the Effectiveness of Performance Measurement Systems. Cambridge: Centre for Strategy and Performance, Institute for Manufacturing, University of Cambridge.
Weisberg, H. F., & Bowen, B. D. (1977). An Introduction to Survey Research and Data Analysis. San Francisco: W.H. Freeman and Company.
183
Vita Major Adrienne Stahl graduated from Fort Zumwalt South High School in Saint
Peters, Missouri. She entered undergraduate studies at the United States Air Force
Academy where she graduated with a Bachelor of Science degree in Management in May
2003. She began her career in the Air Force Academy Department of Admissions, where
she served as an Admissions Advisor for the Southeastern United States. In September
2004, she was assigned to the 388th Fighter Wing at Hill Air Force Base, Utah as the
Propulsion Flight Commander. She graduated the Aircraft Munitions and Maintenance
Officer Course in January 2005, and was then assigned as the 421st Aircraft Maintenance
Unit Assistant Officer in Charge. She deployed with the unit in May 2006 to Balad Air
Base, Iraq, in support of Operation IRAQI FREEDOM. In October 2006, she was
assigned as the 388th Component Maintenance Squadron Operations Officer, and was
then assigned as the 388th Maintenance Operations Squadron Operations Flight
Commander from January 2007-June 2008. From June 2008-April 2009, Major Stahl
was the 25th Aircraft Maintenance Unit (PilSung) Officer in Charge at 51st Fighter Wing
in Osan Air Base, Korea. She was then assigned to the 1st Fighter Wing at Langley AFB,
VA, first as the 27th Aircraft Maintenance Unit (Who You With?) Officer in Charge
where she deployed to Anderson AFB, Guam in support of the F-22 Theater Security
Package. Prior to her current assignment, she served as the 1st Maintenance Squadron
Operations Officer. She is currently a graduate student at the Air Force Institute of
Technology pursuing a Master’s of Science in Logistics and Supply Chain Management.
She has a follow-on assignment to the Pentagon in HAF A4/7.