
1
A Theoretical Study of Graphene Oxide Chemical Structure
Haining Luo
Bachelor of Materials Engineering
A thesis submitted for the degree of Master of Philosophy at
The University of Queensland in 2017
The School of Mechanical and Mining Engineering
2
Abstract
Graphene is a 2D material that has many unique and excellent physical and electrical properties.
Since its discovery, people have spent much time and money on the research of graphene. A film of
graphene is transparent, conductive, flexible, light in weight but very strong. Unfortunately,
research in the last decade has proved that it is nearly impossible to fabricate stable, defect-free,
large scale graphene sheets which have extensive application, yet without any commercial success.
However, compared with the high cost of graphene film, graphene oxide (GO) is an easy-to-make
material which has a similar structure. The obstacle for GO’s application is its low reproducibility
sincea number of oxidized side chains are difficult to remove. Even today, the GO structure model
is still controversial.
This study introduces a new structural model of graphene oxide and its theoretical electronic
properties. A number of different models for graphene oxide have been proposed and tested using
ab initio calculations. The main simulation and computation theories to establish these structure
models in this study are molecular mechanics (MM) and density functional theory (DFT). In the
proposed GO structure, the para-substituted epoxide groups stay in close proximity to, but on the
opposite sides of the carbon plane, to the hydroxyl molecule. On the edge of GO sheet, the carboxyl
prefers attachment in the armchair orientation, while the carbonyl prefers the zigzag orientation.
The carbon backbone has a moderate wrinkling located around hydroxyl and epoxide molecules but
still maintains a hexagonal graphene-like structure. This configuration repeats along the carbon
network with subtle variations so that the chemical composition of GO is variable from 𝐶1.5𝑂
to 𝐶2.5𝑂. And the electronic model also suggests that the band gap of GO can be theoretically tuned
both by chemical reduction and controlled oxidation process.

3
Declaration by author
This thesis is composed of my original work, and contains no material previously published or
written by another person except where due reference has been made in the text. I have clearly
stated the contribution by others to jointly-authored works that I have included in my thesis.
I have clearly stated the contribution of others to my thesis as a whole, including statistical
assistance, survey design, data analysis, significant technical procedures, professional editorial
advice, and any other original research work used or reported in my thesis. The content of my thesis
is the result of work I have carried out since the commencement of my research higher degree
candidature and does not include a substantial part of work that has been submitted to qualify for
the award of any other degree or diploma in any university or other tertiary institution. I have
clearly stated which parts of my thesis, if any, have been submitted to qualify for another award.
I acknowledge that an electronic copy of my thesis must be lodged with the University Library and,
subject to the policy and procedures of The University of Queensland, the thesis be made available
for research and study in accordance with the Copyright Act 1968 unless a period of embargo has
been approved by the Dean of the Graduate School.
I acknowledge that copyright of all material contained in my thesis resides with the copyright
holder(s) of that material. Where appropriate I have obtained copyright permission from the
copyright holder to reproduce material in this thesis.

4
Publications during candidature
Poster: The Theoretical Study of Graphene Oxide on the 24th Australian Conference on Microscopy and
Microanalysis 2016.
Publications included in this thesis
No publications included.

5
Contributions by others to the thesis
Dr Graeme Auchterlonie and Prof Jin Zou have contributed to propose of the research concept and
also critically revising the thesis.
Statement of parts of the thesis submitted to qualify for the award of another degree
None

6
Acknowledgements
I would like to thank my supervisors, Professor Jin Zou and Doctor Graeme Auchterlonie, for
offering me an opportunity to do research in graphene oxide modelling. They have shown great
patience throughout the last 2 years guiding me on the right path of research. I truly appreciate their
support and advice on my project.
Also, I would like to thank my fellows in Prof Jin’s research group: Yichao Zou, Lei Yang, Min
Hong, Chen Zhou, Liqing Huang, Van Nguyen, Han Gao, Raza Moshwan, Xiaolei Shi, Weidi Liu,
Shijian Liu, Qiang SUN, Shijian Liu, Qizhen Li, Yuan Wang. The all encourage and help me a lot
when I met difficulties in my study.
This work was supported by Australian Research Council. The Research Computing Centre at the
University of Queensland and the National eResearch Collaboration Tools and Resources (Nectar)
project were also acknowledged.

7
Keywords
KEYWORDS: graphene oxide, structural model, thermodynamics, molecular mechanics, density
functional theory, band gap
Australian and New Zealand Standard Research Classifications (ANZSRC)
ANZSRC code: 091299 Materials Engineering not elsewhere classified, 100%
Fields of Research (FoR) Classification
FoR code: 0912 Materials Engineering, 100%

8
Contents
Chapter 1. Introduction .................................................................................................................. 12
1.1 Introduction ......................................................................................................................... 12
1.2 Outline ................................................................................................................................. 12
Chapter 2. Literature Review ......................................................................................................... 14
2.1 Graphene ............................................................................................................................. 14
2.1.1 Structure ....................................................................................................................... 14
2.1.2 Electrical Properties ..................................................................................................... 14
2.1.3 Synthesis method ......................................................................................................... 15
2.2 Graphene Oxide ................................................................................................................... 17
2.2.1 Characterizations .......................................................................................................... 18
2.2.2 Chemical structure ....................................................................................................... 21
Chapter 3. Computational Methods ............................................................................................... 24
Chapter 4. Results and discussion ................................................................................................. 26
4.1 Determination of Thermodynamically Stable Structures .................................................... 26
4.2 Interaction of Functional Groups ........................................................................................ 29
4.3 Electronic Properties ........................................................................................................... 31
Chapter 5. Summary and Future Work .......................................................................................... 34
5.1 Summary ............................................................................................................................. 34
5.2 Future Work ........................................................................................................................ 35
References .......................................................................................................................................... 37
Appendix 1 ......................................................................................................................................... 43
Appendix 2 ......................................................................................................................................... 44

9
Table of Figures
Figure 2.1 (a) Unit cell of graphene including two non-equivalent atom positions A and B; (b) two
types of edges in graphene flake: Zigzag and armchair. ................................................. 14
Figure 2.2 Schematic First Brillouin zone and band structure of graphene. The Dirac points K and K’
are the transition between the conduction band and the valence band.[16] .................... 15
Figure 2.3 Comparison of the graphene production methods. The methods were evaluated in five
terms: graphene quality (G), yield (Y), purity (P), scalability (S) and cost efficiency (C)
of the whole production process. The figure was adapted from ref [17]. ....................... 16
Figure 2.4 The diagram illustrates the CVD steps of graphene growth on copper: (a) Surface oxide
on copper foil; (b) the nucleation of graphene in CH4/H2 atmosphere at 1000 C; (c)
oriented growth of the graphene flakes. The figure was adapted from [27] ................... 17
Figure 2.5 Schematic of the roll to roll method. The production process includes: adhesion of
polymer supports, copper etching and dry transfer-printing on a target substrate. The
figure was adapted from ref [28]. .................................................................................... 17
Figure 2.6 (A) 1D 𝐶13 MAS and (B) 2D 𝐶13 /𝐶13 chemical-shift correlation solid-state NMR
spectra of 𝐶13 -labeled graphite oxide with (C) slices selected from the 2D spectrum at
the indicated positions (70, 101, 130, 169, and 193 ppm) in the w1 dimension. This
figure was adapted from ref [32]. .................................................................................... 18
Figure 2.7 (a) FTIR spectrum of GO; (b) UV-vis spectrum (c) Raman spectrum [1] ....................... 19
Figure 2.8 (a) XRD spectrum of graphene oxide (GO) and graphene (GR); (b) XPS spectrum of GO
and GR. [37] .................................................................................................................... 20
Figure 2.9 (a) TEM image of a single GO sheet on a carbon support. (b) Labelled SAED of the GO
sheet in a. (c) Intensity profile through the diffraction spots labelled in panel b. (d)
Contact-mode AFM scan of reduced graphene oxide etched on a graphene oxide paper
substrate (e) Height profile through the dashed line shown in (d) The figure was adapted
from ref [2] ...................................................................................................................... 20
Figure 2.10 (a) Hofmann model; (b) Ruess model ; (c) Scholz-Boehm model ; (d) Nakajima-Matsuo
model ; (e) Lerf-Klinowski model; (f) Dekany model [42] ............................................ 21
Figure 4.2 𝐶6𝑂4 models and MM steric energies. .......................................................................... 27
Figure 4.3 𝐶24𝑂16 and 𝐶54𝑂36 models steric energies................................................................ 27
Figure 4.4 Tension caused by 𝑠𝑝3 hybridization between α-C and β-C (red arrows); two carbon
positions: α-C, directly bonded to oxygen; β-C, three atoms bonded to α-C. ................. 28
Table 1 GO edge model and MM steric energies ......................................................................... 28

10
Figure 4.5 Supercells of: a) 1, 4-trans-epoxy structure; b) chainlike structure. The grey, red and
white spheres represent carbon, oxygen and hydrogen atoms respectively. The
determined Eb is shown at the top. .................................................................................. 30
Figure 4.6 a) H-bonds (blue dashed lines) sketch in GO; b) Charge density map of the b-type GO
model. .............................................................................................................................. 30
Figure 4.7 Supercells of a), b) Cis-configuration GO model with two epoxy groups; c), d) Trans-
configuration GO model with two epoxy groups. The total energy is shown above the
side-view model. ............................................................................................................. 31
Figure 4.8 Band structures of pristine graphene a) and GO with b) a single hydroxyl, and c) a
single epoxy. All using a 2×2 supercell. ......................................................................... 32
Figure 4.9 Density of states of a) hydroxyl chainlike structure; b) 1, 4-trans-epoxy structure c) 1, 4-
trans-epoxy structure with pure graphene stripe area. .................................................... 33
Figure 4.10 New Proposed thermodynamic GO structure model of GO. The grey, red and white
spheres represent carbon, oxygen and hydrogen atoms respectively. The yellow areas
represent pure graphene regions and the blue dashed lines represent the hydrogen bond
networks. ......................................................................................................................... 34

11
List of Abbreviations used in the thesis
2-D: Two Dimensional
CVD: Chemical Vapour Deposition
GO: Graphene Oxide
DFT: Density Functional Theory
FPLAPW + lo: Full Potential Linear Augmented Plane Wave plus Local Orbitals
PECVD: Plasma Enhanced Chemical Vapour Deposition
SSNMR: Solid State Nuclear Magnetic Resonance
FTIR: Fourier Transform Infrared Spectroscopy
DRIFT: Diffuse Reflectance Mode Fourier Transform Infrared Spectroscopy
UV-vis: Ultraviolet–visible Spectroscopy
XRD: X-ray Diffraction Spectroscopy
XPS: X-ray photoelectron spectroscopy
TEM: Transmission Electron Microscopy
AFM: Atomic Force Microscopy
TGA: Thermal Gravimetric Analysis
LK Model: Lerf-Klinowski Model
MD: Molecular Dynamics
MM: Molecular Mechanics
GEDIIS: Energy-represented Direct Inversion in the Iterative Subspace for Geometry Optimization
PBE: Perdew–Burke–Ernzerhof
SCF: Self-Consistent Field
FP-LAPW: Full Potential Linear Augmented Plane Wave
GGA: Generalized Gradient Approximation
H-bond: Hydrogen Bond
ITO: Indium Tin Oxide
12
Chapter 1. INTRODUCTION
1.1 INTRODUCTION
In 2004, the first graphene film was isolated from graphite in the laboratory by Andre Geim and
Kostya Novoselov [3]. Graphene is a 2-D material with a hexagonal structure [3]. The single layer
graphene has many peculiar electrical, mechanical and optical properties [4]. High electrical
conductivity and high optical transmittance are two major advantages for graphene to be used as
transparent conductor [4, 5]. But till today, the extraordinary performance only exits in laboratory.
One of the most critical obstacles is that there is still no method to prepare large-scale and low-
defect graphene films [6-8].
Graphene oxide (GO), as one of the source materials for synthesis of graphene, has been studied in
recent years. Not only the large scale graphene production can be achieved by reduction of GO with
a relatively low cost, but also the GO itself has many potential applications in batteries and
transparent conductors. A precise GO structural model can help us understand the electronic,
mechanical and optoelectronic properties of GO. As a result, we can design new GO composites or
intentionally tune the properties of GO based on the model.
Although there are many experimental and theoretical models, the real structure of GO still remains
controversial. One reason is that these models arrange the oxygen groups manually in a fixed cell
within a limited scale, but the real GO may be non-stoichiometric and non-periodic in the long
range. As a consequence, in this study, a new thermodynamic GO structure is proposed both in a
large scale molecular mechanics (MM) models and a precise DFT model. The MM2 method [9] is
one of the most reliable MM methods developed to calculate the properties of organic molecular
models in recent modelling studies [10-12]. While DFT is a computational quantum mechanical
modelling method used to investigate the chemical and electronic structures (principally the ground
state) of many-body systems. Depending upon the synthesis process, highly oxidized GO has
different compositions varying from 𝐶1.5𝑂 to 𝐶2.5𝑂[13, 14] while the fully oxidized area of GO
model in this study has a C/O ratio of 1.5:1.
1.2 OUTLINE
The thesis is organized as follow. Chapter 1 is an overview of the research background, the
significance of studying GO structural model and the scope of the thesis. The literature review
about the current graphene and graphene oxide research will be covered in Chapter 2. The first
section of Chapter 2 introduces basic structure, electronic properties and synthesis methods of

13
graphene. The second section describes both the experimental and theoretical approaches to
establish the GO structural model. Chapter 3 is devoted to explain the theory and computational
methods used in this study. Chapter 4 discusses the results of molecular mechanics and density
functional theory calculations including determination of thermodynamically stable structure,
interactions between functional groups and the electronic properties. Chapter 5 summaries the
conclusion of this theoretical study and presents the future work.

14
Chapter 2. LITERATURE REVIEW AND RESEARCH GAPS
2.1 GRAPHENE
2.1.1 Structure
Graphene is a single layer crystal of carbon atoms, usually exfoliated from graphite. It has a
honeycomb hexagonal lattice fabricated by sp2 hybridized bonds. The rhombic unit cell of single
layer graphene contains two carbon atoms A and B (Figure 2.1). The C-C distance is 0.142 nm. The
graphene crystal is not a perfect 2D plane, but contains ripples around 1 nm in size.
Figure 2.1 (a) Unit cell of graphene including two non-equivalent atom positions A and B; (b) two types of edges in
graphene flake: Zigzag and armchair.
The idea graphene is an infinite 2D structure, but what we really studied in laboratory are the
graphene flakes with edges. In Figure 2.1 (b), there are two types of edges, notably, armchair and
zigzag. These two kinds of edges lead to different electronic properties of graphene flakes.
2.1.2 Electrical Properties
Graphene has been discovered as a zero-gap semiconductor [15]. As shown in Figure 2.2, the
valence bands meet the conduction bands at Dirac points and Dirac points locate on the six corners
of the Brillouin zone in momentum space[15]. There are two non-equivalent sets of Dirac points
labelled K and K’. Due to the linear dispersion near the Dirac points, the charge carriers (holes and
electrons) can transform to each other without energy consumption [15]. These charge carriers with
low energy can be described as massless Dirac fermions [15]. By changing the applied electric field,
the specific carrier density can be changed as well. Another advantage from the presence of Dirac
points is the electronic ballistic transport of charge carriers in graphene [15]. Charge carriers in
graphene behave like relativistic particles with an effective speed of light given by the Fermi
velocity[15]. The ballistic mean free path of graphene charge carriers can be 0.3µm [16]. This
behavior attracts much research attention and becomes one of the most intriguing properties of
graphene.
a b

15
Figure 2.2 Schematic First Brillouin zone and band structure of graphene. The Dirac points K and K’ are the
transition between the conduction band and the valence band.[16]
2.1.3 Synthesis method
The first single layer graphene was extracted from highly oriented pyrolytic graphite by Andre
Geim and Kostya Novoselov using the scotch tape. Until now, there is no process developed that
can make graphene sample with such high carrier mobility and low density of defects [17].
However, mechanical exfoliation is limited in production scale and time consuming. This
disadvantage limits the application to fundamental research of graphene.
After more than 10 years’ development, for today’s industrial production of graphene, there are two
major synthesis routes: bottom-up epitaxial growth and top-down exfoliation [4]. The bottom-up
epitaxial growth approach involves the direct synthesis of graphene materials from the carbon
sources [4]. A typical method, for example, is the chemical vapor deposition (CVD). CVD is
usually used to grow large-scale, single or multi-layer graphene sheets on metal substrates with low
defects density [4, 8]. Differently, the top-down approaches such as reduction of graphene oxide
(GO) take advantages of high yield, ease of implementation, and solution-based process ability [4,
18]. In particular, the low-cost and mass production of reduced graphene oxide sheets has been
realized [4, 19]. The Figure 2.3 summarizes the pros and cons of common production methods of
graphene.

16
Figure 2.3 Comparison of the graphene production methods. The methods were evaluated in five terms: graphene
quality (G), yield (Y), purity (P), scalability (S) and cost efficiency (C) of the whole production process.
The figure was adapted from ref [17].
Among these methods, reduction of graphene oxide (GO) was thought to be one of the most
prominent methods to achieve the large scale and low-cost production of graphene [19]. GO as a
highly oxidized sheet is synthesized from strong oxidation of pristine graphite followed by
mechanical exfoliation such as ultra-sonication in liquid media or just stirring [18, 20]. The π
network of the graphene contributes to the conductive characteristic of graphene, so the GO must be
reduced to recover its π bond [19]. The GO are usually reduced by electrochemical, thermal and
chemical processes [19]. The products do not have a very high quality because of the presence of
extrinsic defects (oxygen groups) and intrinsic defects (edges and deformations), but this method
allows the production with high yield and relatively low costs. Thus, oxidation of graphite,
mechanical exfoliation and reduction of GO are the popular methods to produce commercial
graphene.
The most popular methods reported recently [21-27] are chemical vapor deposition (CVD) or
plasma enhanced chemical vapor deposition (PECVD) which can produce large scale and moderate
quality graphene films. The major process of CVD is shown in Figure 2.4.

17
Figure 2.4 The diagram illustrates the CVD steps of graphene growth on copper: (a) Surface oxide on copper foil; (b)
the nucleation of graphene in CH4/H2 atmosphere at 1000 C; (c) oriented growth of the graphene flakes.
The figure was adapted from [27]
S. Bae et al. [28] have developed a process (Figure 2.5) to build 30 inch graphene film on copper by
using roll to roll method in 2010. After that, SONY has synthesized 100 meter long graphene film
using the similar method in 2013 [29]. But the graphene coverage is not uniform and decreases
when near the film edge. Also, there are defects caused by plastically deformation of copper foil.
These non-negligible defects break the periodic structure and lower the conductivity of graphene
[29]. Although in 2015 a new method called Concentric Tube CVD developed by Polsen, E. S. et
al. [30] has improved the production speed and quality, the cost of CVD methods are still too high
considering the low yield.
Figure 2.5 Schematic of the roll to roll method. The production process includes: adhesion of polymer supports,
copper etching and dry transfer-printing on a target substrate. The figure was adapted from ref [28].
2.2 GRAPHENE OXIDE
Graphene oxide (GO) has a similar structure to graphene. Both of these compounds have a
hexagonal carbon lattice, but the GO sheet is usually distorted where it is bonded to the oxygen
groups. GO as one of the source materials for large-scale production of graphene has been studied
for years. There are many applications for GO such as potential materials for electrode in Li-ion
batteries [17], transparent conductor in organic photovoltaic cells [31]. Despite these advanced
application, the fundamental determination of the structure of GO has been slow. Researchers have
proposed many theoretical models for GO but the precise chemical structure is still controversial.
Major reasons include sample-to-sample variability due to different synthesis methods the degree of
oxidation, the amount of amorphization, the nonstoichiometric nature of GO, and the limited

18
resolution in the major characterization techniques such as SSNMR and FTIR. However, the
determination of the precise structure of GO is still worthy of study because it will certainly
improve the understanding of the functionalization and reduction process of GO.
2.2.1 Characterizations
2.2.1.1 Solid State 𝑪𝟏𝟑 Nuclear Magnetic Resonance (SSNMR) Spectroscopy
In 2008, Ruoff’s group prepared a 𝐶13 -enriched GO sample and three broad resonances at 60, 70
and 130 ppm were discovered in the C13 SSNMR spectrum [32]. After that, SSNMR proved to be
one of the most precise and reliable techniques to characterize GO structure. Figure 2.6 is reprinted
from reference [32] which shows the 1D and 2D chemical-shift spectrum of 𝐶13 -labelled GO
sample. The peaks clearly demonstrate the presence of sp2carbon, epoxy and hydroxyl bonded
carbon atoms. In later reports, the 101 ppm peak was identified and this peak represents the five or
six-membered ring lactol structure[32].
Figure 2.6 (A) 1D 𝐶13 MAS and (B) 2D 𝐶13 /𝐶13 chemical-shift correlation solid-state NMR spectra of 𝐶13 -labeled
graphite oxide with (C) slices selected from the 2D spectrum at the indicated positions (70, 101, 130, 169,
and 193 ppm) in the w1 dimension. This figure was adapted from ref [32].
2.2.1.2 Other common methods
FTIR (Fourier transform infrared spectroscopy)
Besides SSNMR, FTIR is also a powerful tool to detect the functionalities on GO. But the large
quantities of water molecules in GO structure make the hydroxyl groups undistinguishable. In 2005,
Décány’s group developed the DRIFT analysis [33] and clarified major peaks of a GO sample made

19
by Brodie method [34]. They distinguished the hydroxyl signals from water and thus end the
previous debate on GO FTIR results. The FTIR spectrum (Figure 1.7 a ) gives the possible
functionalities: carboxyl, lactone, phenol, lactol, chromene, ketone, etheric rings, organic carbonate,
but definitely no pyrones [33].
UV-vis (Ultraviolet–visible spectroscopy)
UV-vis spectrum (Figure 1.7 b ) shows two assigned bands at 234 nm and 299 nm, resulting from
the π to 𝜋∗ transition of aromatic carbon bonds C=C and n to 𝜋∗ transition of C=O bonds [35].
Raman spectroscopy
Raman spectroscopy is a non-destructive method that can detect the structural defects of GO. There
are two major peaks (Figure 1.7 c), D peak at 1350 𝑐𝑚−1 and G peak at 1594 𝑐𝑚−1 corresponding
to structural defects and graphene-like vibration respectively. However, the D/G ratio usually
increases rather than decreases after the chemical reduction GO. There is an examination that this
phenomenon is caused by the size diminishment of the re-established G network [36].
XRD (X-ray diffraction spectroscopy)
In the X-ray diffraction spectroscopy (Figure 2.8a ) , GO usually exhibits a broad peak at 10.2
degrees distinguished from graphene at 16.7 degrees [37].
XPS (X-ray photoelectron spectroscopy)
X-ray photoelectron spectroscopy (Figure 2.8b ) shows binding energy peaks at 284.4 eV (C=C
bonds), 286.8 eV (C-O bonds) and 288.7 eV (C=O bonds) [38].
a b c
Figure 2.7 (a) FTIR spectrum of GO; (b) UV-vis spectrum (c) Raman spectrum [1]
20
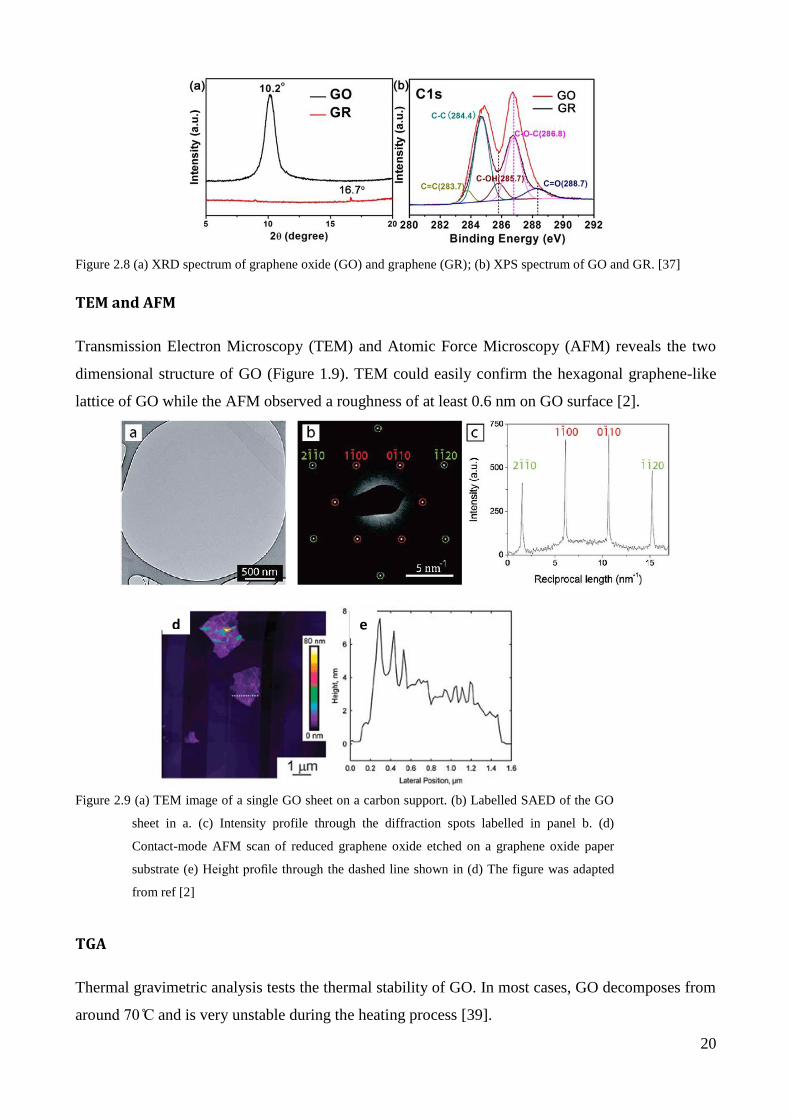
Figure 2.8 (a) XRD spectrum of graphene oxide (GO) and graphene (GR); (b) XPS spectrum of GO and GR. [37]
TEM and AFM
Transmission Electron Microscopy (TEM) and Atomic Force Microscopy (AFM) reveals the two
dimensional structure of GO (Figure 1.9). TEM could easily confirm the hexagonal graphene-like
lattice of GO while the AFM observed a roughness of at least 0.6 nm on GO surface [2].
TGA
Thermal gravimetric analysis tests the thermal stability of GO. In most cases, GO decomposes from
around 70 C and is very unstable during the heating process [39].
d e
Figure 2.9 (a) TEM image of a single GO sheet on a carbon support. (b) Labelled SAED of the GO
sheet in a. (c) Intensity profile through the diffraction spots labelled in panel b. (d)
Contact-mode AFM scan of reduced graphene oxide etched on a graphene oxide paper
substrate (e) Height profile through the dashed line shown in (d) The figure was adapted
from ref [2]

21
2.2.2 Chemical structure
According to the characterization above, previous researchers have proposed at least 6 classic
structure models (Figure 2.10) [25, 33, 40-43].
Figure 2.10 (a) Hofmann model; (b) Ruess model ; (c) Scholz-Boehm model ; (d) Nakajima-Matsuo model ; (e) Lerf-
Klinowski model; (f) Dekany model [42]
The first model by Hofmann and Holst in 1939 describes a flat carbon sheet randomly bonded with
epoxy groups with a C/O ratio of 2. Then in 1946, Ruess’s group introduced the hydroxyl groups
and 1, 3-ether to the lattice [44]. The lattice is composed by cyclohexane rings which are different
from Hofmann’s benzene-like carbon plane. Scholz-Boehm model [43] completely replaces the
epoxide groups with hydroxyl groups. The basal plane is regular corrugated cyclohexane rings
linked with a quinoidal structure. Nakajima and Matsuo 1994, built a lattice framework akin to poly
(C2F)n which forms a stage 2 graphite intercalation compound[45]. However, the latest two models
proposed by Lerf-Klinowski [40] and Décány [33] have become most popular because the SSNMR
analysis was introduced into GO structure characterization. This new technique has improved the
accuracy in detecting the functional groups on GO. In the Lerf-Klinowski (LK) model, tertiary
alcohols and 1, 2-ethers are dominant groups on the GO surface[40]. The LK model discards the
periodic crystal structure and substituted by the randomly distributed oxygen groups. They also
suggested that the alkenes (C=C) in GO are probably either aromatic or conjugated and ketones are
more preferable at the edge of GO. Later, Décány proposed a model following the basic logic of
Scholz-Boehm model, but adding 1, 3-ethers into the cyclohexane rings [42].
As mentioned before, Rouff’s group used the C13 -labelled SSNMR to analyse the GO structure and
compared the experiment data with the ab initio chemical shift calculations. Their conclusion
indicates that only the LK model fits best with the experiment results while all other models were
excluded due to their inconformity [44]. But due to the computation complexity, the size of the LK
model used in calculation was simplified and limited in size. Therefore, the precise distribution of
functional groups and the edge structure are still controversial.
f
a b
d
c
e

22
Apart from the experimental results, the theoretical characterization of the GO structure can give us
a new perspective into the detail structure of GO. Lahaye et al. calculated the hydroxyl and epoxy
system in 2×2 GO cell using density functional theory (DFT) [46] where they found that the 1,3-
ether are not likely to exist because of the joint binding energy and the single epoxy and hydroxyl
prefer staying in close proximity. Boukhvalov and Katsnelson proposed a chainlike structure and
found the band gap increased with the increasing oxygen coverage[47]. They also discovered that
graphene has a high flexibility as the chemisorption results in 5 Å (radius) distortions of the
graphene sheet for the presence of a single hydrogen atom [48]. As for the chemisorption of two
hydrogen atoms, the most energetic favourable configuration is that two hydrogen are bonded to
neighbouring carbons from the opposite sheet sides [4]. And the complete coverage of hydrogen
atoms can minimize the total energy of graphene sheet [4]. This result was also theoretically
confirmed by Yan and Chou [49] using MD (Molecular Dynamics) simulations and the
transformation of hydroxyl and epoxy groups into carbonyl group during thermal annealing was
revealed. The importance of hydrogen bonding was also proposed by Paci et al. in their Monte
Carlo simulations [50]. Also, epoxide groups were observed to migrate on the basal plane in
processes often stabilized by hydrogen bonding or catalyzed by hydrogen transfer reactions between
the mobile epoxide oxygen and neighbouring functional groups[50]. Li et al. found that epoxy pairs
aligning in line in graphene oxide plane are likely to form carbonyl pairs and then lead to the “unzip”
of the GO sheet [51]. This result suggests a way to get a smooth GO edge by controlled oxidation
process.
2.3 RESEARCH GAPS
In spite of such many theoretical models, the real structure of GO still remains controversial. One
reason may be that these models arrange the oxygen groups manually in a fixed cell within a limited
scale. But the real GO is non-stoichiometric and non-periodic in the long range. As a consequence,
in this study, a new defect-free GO structure will be discussed both in a large scale molecular
mechanics (MM) model and a precise density functional theory (DFT) model, so that both the long
range pattern and the local interaction can be simulated and studied.
Both MM and DFT are complementary methods. The MM models are limited non-periodic models,
but the MM method is fast and reliable which is good for massive screening computation to locate
the most energetic favorable structure, while the DFT models are periodic models with unlimited
scale, it provides a deeper insight for the chemical and electronic structures. The disadvantage of
the DFT approach is the specific requirement of computational resource, and it will be extremely
time-consuming to perform DFT calculations using a supercell containing hundreds of atoms.
Based on these considerations, in this study, we use MM2 to search for structure and use DFT to

23
understand the structure. The scale limit is still there, but we can acquire more information from this
combined method. Depending on the synthesis process, highly oxidized GO has different
compositions varying from 𝐶1.5𝑂 to 𝐶2.5𝑂 [13, 14]. The fully oxidized area of GO model in this
study has a C/O ratio of 1.5:1 which is close to the composition of commercial GO such as products
from ACS Material®.

24
Chapter 3. COMPUTATIONAL METHODS
The thermodynamic GO model proposed in this study refines the LK model [40]. In our proposed
model, the epoxide groups and hydroxyl groups distribute randomly over a long range while having
a local energy-favorable pattern. The new thermodynamic model depicts the interactions between
the functional groups in both MM and DFT methods, leading to a more accurate description of the
local GO structure.
In this study, the hexagonal GO supercells with a size varying from 6 to 54 carbon atoms are built
to estimate the steric energy (𝐸𝑠𝑡𝑒𝑟𝑖𝑐) [9]. The equilibrium covalent geometry of molecules can be
precisely reproduced by MM2 force field, and 𝐸𝑠𝑡𝑒𝑟𝑖𝑐 can be calculated using the following
equation [9]:
𝐸𝑠𝑡𝑒𝑟𝑖𝑐 = ∑ 𝐾𝑟(𝑟 − 𝑟𝑒𝑞)2 + ∑ 𝐾𝜃(𝜃 − 𝜃𝑒𝑞)2 + ∑𝑉𝑛
2[1 + 𝑐𝑜𝑠 (𝑛𝜑 − 𝛾)] +𝑑𝑖ℎ𝑒𝑑𝑟𝑎𝑙𝑠𝑎𝑛𝑔𝑙𝑒𝑠𝑏𝑜𝑛𝑑𝑠
∑ [𝐴𝑖𝑗
𝑅𝑖𝑗12 −
𝐵𝑖𝑗
𝑅𝑖𝑗6 +
𝑞𝑖𝑞𝑗
𝜖𝑅𝑖𝑗] + ∑ [
𝐶𝑖𝑗
𝑅𝑖𝑗12 −
𝐷𝑖𝑗
𝑅𝑖𝑗10]𝐻−𝑏𝑜𝑛𝑑𝑒𝑑𝑛𝑜𝑛−𝑏𝑜𝑛𝑑𝑒𝑑 , ( 1 )
where the equilibrium length r and angle are determined by atom/bonds types and location. K is a
force constant controlling the bond stretching (first term) and bending stiffness (second term). The
third dihedral term using Fourier series represents the torsional interaction considering the single
and double bonds, where 𝑉 is the torsional rotation force constant and 𝜑 is the torsional angle. The
fourth term describes the non-bonded interactions, where 𝜖 is the permitivitty of free space, 𝑞𝑖/𝑗 are
atomic charges, and 𝑅𝑖𝑗 is the distance between atom i and j, respectively. The fifth term describes
π-conjugation, hydrogen bonding or anomeric effects, where the A, B, C, D are all suitable
constants [9]. The initial GO models were graphene-like sheets and built with C-O bond length of
1.42 Å and C-C bond length of 1.42 Å which are the values in CO and pure graphene. From which,
the initial GO structure can be relaxed by MM2 force field, and 𝐸𝑠𝑡𝑒𝑟𝑖𝑐 was used to comparing the
structural stability of different models with same chemical stoichiometry.
To clarify the interaction between functional groups and in turn the influence on electronic structure,
the DFT calculations were performed using both Gaussian [52] and WIEN2k program suites.
Gaussian 09 [52] is an electronic structure modelling software using ab initio, density functional
theory, semi-empirical, molecular mechanics, and various hybrid methods. It can perform geometry
optimisation using internal co-ordinates. The basic approach of the calculation is for the charge
carriers in the supercell to be moved around stepwise until the step energy or the forces applied on
the atoms fall below a specified tolerance value. The Berny algorithm using GEDIIS [53] in
redundant internal coordinates [54-59] is used in optimization of atomic positions.

25
Constructs of 4×4 graphene-like supercells containing 16 carbon atoms were used as a basis for the
GO models. The initial lattice parameters of a=4.92 Å, b=8.52 Å, c=10.00 Å were derived from the
normal 1.42 Å C-C bond. The 10.00 Å vacuum-separation along the c-axis was built to minimize
the coulombic interaction between layers. A number of algorithms were used in the 6-31g (d) basis
set for modelling carbon and oxygen atoms and Perdew–Burke–Ernzerhof (PBE) [60] functional in
the geometry optimization process. In each self-consistent field cycle, the total energy generated by
the Kohn-Sham equations [61] is compared with previous configurations and checked if forces are
within tolerance limits. The self-consistent field cycle ends until the forces fall below a predefined
tolerance and reach the minimum energy.
WIEN2k is an all-electron computational code including relativistic effects [62, 63]. The electronic
structure of GO models can be calculated by full-potential (linearized) augmented plane-wave ((L)
APW) + local orbitals (LO) method, which is known as one of the most precise method for
calculating band structures[62]. During the calculation, generalized gradient approximation of
Perdew-Burke-Ernzerhof 96 (GGA-PBE) and Monkhorst–Pack (mesh) approximation [64] were
used to collect exchange–correlation potential [62, 65]. To investigate the influence of hydroxyl-
chain and epoxy-chain on the GO band structure, a 2×2 supercell containing 4 carbon atoms and 1
oxygen atom was built. The number of k-points was 1000 and the separation energy was set as -6.0
Rydbergs [66].
26
Chapter 4. RESULTS AND DISCUSSION
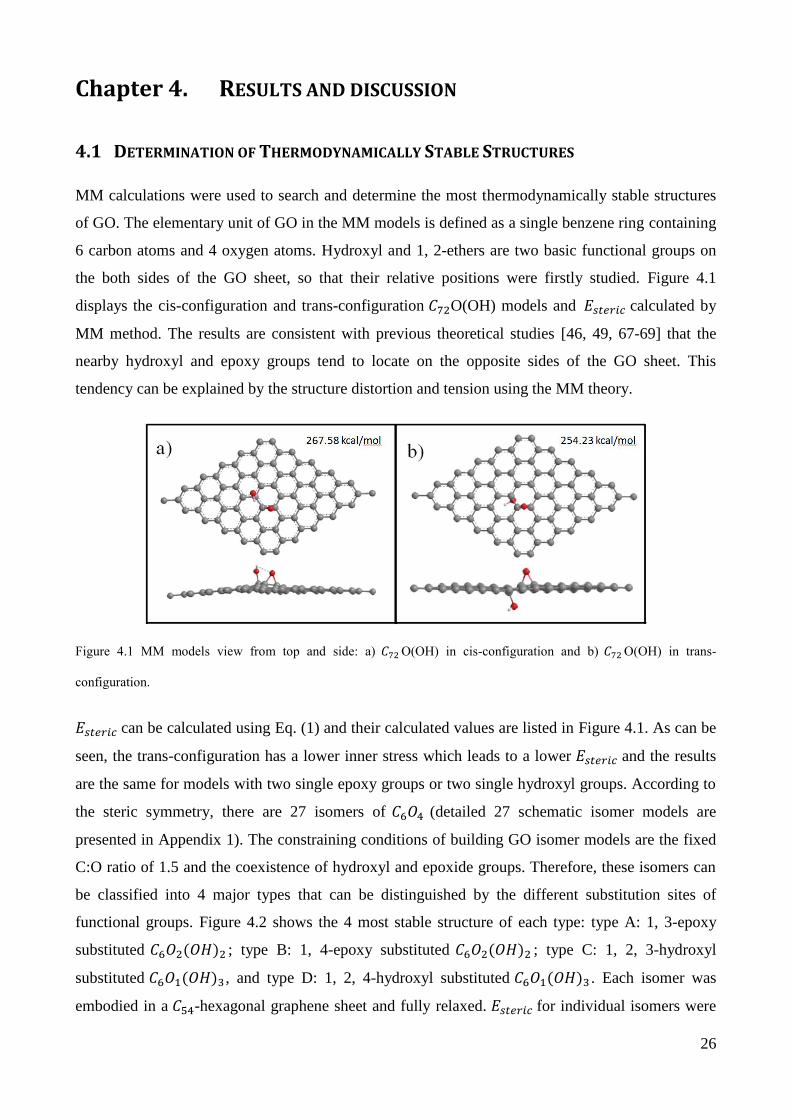
4.1 DETERMINATION OF THERMODYNAMICALLY STABLE STRUCTURES
MM calculations were used to search and determine the most thermodynamically stable structures
of GO. The elementary unit of GO in the MM models is defined as a single benzene ring containing
6 carbon atoms and 4 oxygen atoms. Hydroxyl and 1, 2-ethers are two basic functional groups on
the both sides of the GO sheet, so that their relative positions were firstly studied. Figure 4.1
displays the cis-configuration and trans-configuration 𝐶72O(OH) models and 𝐸𝑠𝑡𝑒𝑟𝑖𝑐 calculated by
MM method. The results are consistent with previous theoretical studies [46, 49, 67-69] that the
nearby hydroxyl and epoxy groups tend to locate on the opposite sides of the GO sheet. This
tendency can be explained by the structure distortion and tension using the MM theory.
Figure 4.1 MM models view from top and side: a) 𝐶72 O(OH) in cis-configuration and b) 𝐶72 O(OH) in trans-
configuration.
𝐸𝑠𝑡𝑒𝑟𝑖𝑐 can be calculated using Eq. (1) and their calculated values are listed in Figure 4.1. As can be
seen, the trans-configuration has a lower inner stress which leads to a lower 𝐸𝑠𝑡𝑒𝑟𝑖𝑐 and the results
are the same for models with two single epoxy groups or two single hydroxyl groups. According to
the steric symmetry, there are 27 isomers of 𝐶6𝑂4 (detailed 27 schematic isomer models are
presented in Appendix 1). The constraining conditions of building GO isomer models are the fixed
C:O ratio of 1.5 and the coexistence of hydroxyl and epoxide groups. Therefore, these isomers can
be classified into 4 major types that can be distinguished by the different substitution sites of
functional groups. Figure 4.2 shows the 4 most stable structure of each type: type A: 1, 3-epoxy
substituted 𝐶6𝑂2(𝑂𝐻)2 ; type B: 1, 4-epoxy substituted 𝐶6𝑂2(𝑂𝐻)2 ; type C: 1, 2, 3-hydroxyl
substituted 𝐶6𝑂1(𝑂𝐻)3 , and type D: 1, 2, 4-hydroxyl substituted 𝐶6𝑂1(𝑂𝐻)3 . Each isomer was
embodied in a 𝐶54-hexagonal graphene sheet and fully relaxed. 𝐸𝑠𝑡𝑒𝑟𝑖𝑐 for individual isomers were

27
calculated and listed in Figure 4.2. The comparison of 𝐸𝑠𝑡𝑒𝑟𝑖𝑐 for individual isomers indicates that
the type B model with two para-substituted epoxides and two para-substituted hydroxyls is the most
energetically favorable structure with 𝐸𝑠𝑡𝑒𝑟𝑖𝑐 = 20.89 𝑘𝑐𝑎𝑙/𝑚𝑜𝑙.
Figure 4.2 𝐶6𝑂4 models and MM steric energies.
To determine the stable structure type with the high O/C ratios, we increase the oxygen atoms to 16
and 36 on the 𝐶54 graphene frame. Consequently, both 𝐶54𝑂16 and 𝐶54𝑂36 supercells were derived
from the basic 𝐶6𝑂4 cell and also can be classified into the same 4 types. The 𝐶54𝑂16 and
𝐶54𝑂36 models with their calculated 𝐸𝑠𝑡𝑒𝑟𝑖𝑐 values are listed in Figure 4.3, which shows the
distribution of the functional groups in larger models still follows the most stable configuration
discovered in the 𝐶6𝑂4 models shown in Figure 4.2.
Figure 4.3 𝐶24𝑂16 and 𝐶54𝑂36 models steric energies.
The comparison of different 𝐸𝑠𝑡𝑒𝑟𝑖𝑐 values calculated based on different C24O16 models verified the
type B (1, 4-trans-epoxy) as the most stable case. With increasing the number of atoms in the super
cell, there are some equivalent positions for the hydroxyl groups. These varieties were ignored
during the calculation because the hydroxyls on equivalent positions contribute the same to the total
energy. In the most stable type B model, the hydroxyl bond (red atom in Figure 4.4, H atom hidden)
still remains approximately perpendicular to the plane formed by the three β-C atoms. This stable
orientation results from the equal tension caused by 𝑠𝑝3 hybridization between α-C and β-C [70]

28
(refer to Figure 4.4). Based on the MM2 dynamics calculation, the free-standing hydroxyls are not
likely to interact with the neighboring carbon atoms.
The comparison of 𝐸𝑠𝑡𝑒𝑟𝑖𝑐 values obtained from different 𝐶54𝑂36 models also confirm the previous
inference that the type B structure (1, 4-trans-epoxy) with two para-substituted epoxides and two
para-substituted hydroxyls is the most energetic favorable structure. However, the 𝐶54𝑂36 supercell
illustrates a more complicated local environment for the epoxides and hydroxyls. The distribution of
trans-configuration of the epoxides and hydroxyls is limited because the increased system
complexity induces metastable states. These metastable states allow the co-occurrence of the
neighboring epoxide and hydroxyl on the same side of GO sheet. Kim et al.[71] also discovered the
metastable characteristics of graphene oxide produced by the Hummers method and the structural
relaxation time at room temperature was about one month. The simulation of metastable GO
structural relaxation suggested the diffusion of neighboring oxygen atoms [71].
We now consider the GO edge structure which were often ignored in theoretical calculation [72].
The edge structure is modelled in a 4×4 graphene flake with only one side decorated by carbonyl,
carboxyl and hydroxyl groups. The calculated 𝐸𝑠𝑡𝑒𝑟𝑖𝑐 are listed in Table 1 that shows the preferred
orientation of the edge functional groups. Each functional group is bonded to GO models in two
characteristic orientations and calculated 𝐸𝑠𝑡𝑒𝑟𝑖𝑐 values for different GO edge models are listed in
Table 1 as well.
Table 1 GO edge model and MM steric energies
Figure 4.4 Tension caused by 𝑠𝑝3 hybridization between α-C and β-C (red arrows); two carbon
positions: α-C, directly bonded to oxygen; β-C, three atoms bonded to α-C.

29
The comparison of obtained 𝐸𝑠𝑡𝑒𝑟𝑖𝑐 values, it can be found that the armchair-carboxyl has the
lowest 𝐸𝑠𝑡𝑒𝑟𝑖𝑐, while the armchair-carbonyl has the highest 𝐸𝑠𝑡𝑒𝑟𝑖𝑐. For this reason, at the edge of
the GO sheet, the carboxyl prefers attachment along the armchair orientation, while the carbonyls
prefer attachment in the zigzag orientation.
4.2 INTERACTION OF FUNCTIONAL GROUPS
Since the type B (1, 4-trans-epoxy) structure is the most energetically favorable structure, our DFT
calculations are only performed based on this structure to study the interaction of the bonded
functional groups. In the new 2×2 periodic supercell, the type B structure consists of 4 para-
substituted epoxides and 8 para-substituted hydroxyls in trans-configuration as shown in Figure
4.5a.
For comparison, we also consider a promising model containing only hydroxyls and epoxide
functional groups in a hydroxyl-chain configuration as shown in Figure 4.5b [47, 49]. In this model,
a long chainlike structure formed by 1, 2-hydroxyl pairs on both sides of the GO sheet. The
hydrogen bonds between the hydroxyls play an important role to stabilize the structure. However, as
a consequence, the concentration of hydroxyl groups stays at a high level that is not consistent with
recent nuclear magnetic resonance signatures of GO [69, 73, 74]. The experimental nuclear
magnetic resonance spectrum does not show a broadened hydroxyl peak [69, 74], so that the
chainlike structure might exist but not be a dominant configuration.
The type B model in this study also has a controversial structure, that is, the para-substituted
epoxide functional groups. Li et al. [75] found that if the epoxy groups are aligned, they are likely
to break apart the graphene sheet by splitting into carbonyl pairs. This mechanism is also believed
to be one of the main causes for linear defects in GO [67, 75]. For this reason, to clarify the stability
of epoxy chainlike structure, the DFT calculations were performed to compare the two models both
energetically and electronically.
The binding energy (𝐸𝑏) of GO was calculated using a function of oxygen and hydrogen chemical
potentials (µ) [76]:
𝐸𝑏 = 𝐸𝑡𝑜𝑡(𝐶𝑙𝑂𝑚𝐻𝑛) − 𝐸𝑡𝑜𝑡(𝐶𝑙) − 𝑚µ𝑂 − 𝑛µ𝐻 , (2)
where 𝐸𝑡𝑜𝑡(𝐶𝑙𝑂𝑚𝐻𝑛) and 𝐸𝑡𝑜𝑡(𝐶𝑙) are the total energy of GO and pristine graphene supercells with
l C atoms, m O atoms and n H atoms. Using Eq. (2), 𝐸𝑏 = −3.28 𝑒𝑉 can be obtained from the
configuration shown in Figure 4.5a, which is 1.31 eV lower than 𝐸𝑏 = −1.97 𝑒𝑉 for the
configuration shown in Figure 4.5b. In Figure 4.5a, the epoxy group enlarges the C-C bond from
the original 1.42 Å to 1.44 Å, and the C-C bonds near the hydroxyls vary from 1.48 Å to 1.52 Å
which is very close to C-C bond length of 1.50 Å[77] for mixed 𝑠𝑝3−𝑠𝑝2 hybridized bonding. In

30
Figure 4.5b, the C-C bond under epoxy group is similar to Figure 4.5a, but the C-C bond between
two hydroxyls is 1.54 Å which is the length of the C-C bond in the diamond structure [70]. Based
on this, these two models are both in agreement with previously predicted lattice distortions in GO.
Figure 4.5 Supercells of: a) 1, 4-trans-epoxy structure; b) chainlike structure. The grey, red and white spheres
represent carbon, oxygen and hydrogen atoms respectively. The determined Eb is shown at the top.
It is of interest to note the chainlike hydrogen bonding in Figure 4.5b does not show the energetic
advantage in our calculations. The reasons can be explained in Figure 4.6, in which the electron
density map displays the complicated H-bond network in the 1, 4-trans-epoxy model. There exist
two types of H-bonds: (1) H-bond forms between two hydroxyl groups and the second type of H-
bond can be found between hydroxyl and epoxy groups. In addition, the second type H-bonds show
a higher electron density in some locations than its first type counterpart. The average length of the
first type H-bond (H---O) is 1.75 Å, which is shorter than the average length of 1.90 Å for the
second type H-bond. Also, both are shorter than the H-bond length of 1.97 Å between water
molecules [78]. According to the Jeffrey’s definition [78], the H-bond between 1.5 Å to 2.0 Å is
considered as the moderate H-bond with the bonding energy of 0.17eV to 0.65eV. The interaction
of the H-bonds thus plays an important role in building the GO structure. Since the H-bond
networks are complicated, the H-bonds in the chainlike structure are not likely to make a significant
difference to the total energy. However, for the type B structure shown in Figure 4.6a, the H-bond
networks can decrease Eb and stabilize the structure.
Figure 4.6 a) H-bonds (blue dashed lines) sketch in GO; b) Charge density map of the b-type GO model.

31
Li et al.[51] found that the epoxy pairs that align with single side of GO sheet are likely to form
carbonyl pairs, causing the GO sheet to disassemble [51], However, in our proposed type B model,
the epoxy chain does not lead to the sheet separation. For this reason, the trans- and cis-
configuration of GO models containing only the aligned epoxy groups were calculated. Figure 4.6
shows the results and indicates that the para-substituted epoxide functional groups are likely to
cause GO sheet to disassemble. In the case of cis-configuration (Figure 4.6a and Figure 4.6b), all
the epoxide functional groups locate on the same sides of the graphene sheet, the GO sheet is
separated by a linear chain of epoxide functional groups and a wrinkle appears with an angle of
101.5. The distance between the two carbon atoms under the epoxy group is 2.15 Å, which is much
larger than a normal C-C bond of 1.54 Å. In the case of trans-configuration (refer to Figure 4.7c and
d), the epoxide functional groups exist on both sides of the graphene sheet; the GO sheet is just
slightly distorted rather than disassembled. We also calculated Eb for different epoxy pair structure
and their values are listed in Figure 4.7b and 7d. As can be seen, Eb = -4.31 eV in the Figure 4.7d
model is 1.12 eV higher than Eb = -5.43 eV of the fractured Figure 4.7b model, so that the cis-
configuration of epoxy pairs is more energetically favorable. This result indicates that there is a
high chance for GO lattice with epoxy chains to form defects or break into small flakes during the
synthesis process [79-81]. As a consequence, the trans-configuration of epoxide groups remains in
unbroken and defect-free GO structure.
Figure 4.7 Supercells of a), b) Cis-configuration GO model with two epoxy groups; c), d) Trans-configuration GO
model with two epoxy groups. The total energy is shown above the side-view model.
4.3 ELECTRONIC PROPERTIES
GO is regarded as a promising transparent conductor in photovoltaic cells [17, 31]. For their
potential applications, it is important to understand the electronic properties of different GO models
caused by the changing oxygen functional groups. For this reason, we calculate the band structure
of the 1×1 graphene and GO models using the WIEN2k program suite. Figure 4.8a presents the

32
band structure of pristine graphene (for comparison) which shows the typical Dirac point in the k
space, and Figure 4.8b displays the band structure of GO with hydroxyl groups only. In our case of
hydroxyl, the existence of the hydroxyl groups breaks the symmetry of graphene and opens a small
band gap of 0.22 eV. Figure 4.8c shows the band structure of GO with epoxide groups, in which a
larger band gap of 1.0 eV is seen. Different from the strong delocalization band in graphene, both
the hydroxyl groups and epoxide groups induce the flat localized band near the Fermi level in GO.
The electron transportation is believed to be hindered by the induced localized states [82]. This
band structure results from the strong covalent C-O bonding which change the carbon bond from
𝑠𝑝2 to 𝑠𝑝3. A similar calculated band gap of 0.9 eV of GO with epoxide was reported by Mattson
et al.[83] and a 1 eV band gap was observed experimentally in the reduced GO [84]. It was also
reported that GO acceptors with band gap ranging from 1 to 3 eV is highly desirable to accomplish
high power conversion efficiencies in polymer solar cells [85]. To estimate the effect of functional
groups on energy gap, the density of states corresponding to models shown in Figure 4.5a and b
were calculated and the results are shown in Figure 4.9.
Figure 4.8 Band structures of pristine graphene a) and GO with b) a single hydroxyl, and c) a single epoxy. All using
a 2×2 supercell.
The density of states of the 1, 4-trans-epoxy GO model shown in Figure 4.9a can be identified by
the 2s orbital peaks at ~ -23 eV, and -21 eV, corresponding to the epoxide group and hydroxyl
group, respectively. In Figure 4.9b, hydroxyl chain structure leads to two strong peaks at -21 eV and
-22 eV. Both models show strong peaks near the Fermi level, leading to a strong electron
localization. In contrast, a relatively flat peak was observed at the position of epoxide 2s orbital in
Figure 4.9c and the delocalization states of pristine graphene were partially restored. The energy
gap of the full oxidized GO model increases from 3 eV to 4 eV when the hydroxyl chain structure is
replaced by 1, 4-trans-epoxy structure. This result is consistent with Figure 4.8, in which the
periodic hydroxyl chain can narrow the energy gap when compared to the epoxy chain structure.
Also, as the oxidation of GO is a highly non-equilibrium process, the pristine graphene area with

33
𝑠𝑝2 carbon bond was often observed in experiments [32, 35, 36, 38]. These un-oxidized graphene
areas lead to a significant decrease of the GO band gap to 2 eV as shown in Figure 4.9c. As a
consequence, the band gap of GO can be theoretically tuned by two approaches: (1) chemical
reduction of GO to increase the 𝑠𝑝2-carbon area, and (2) controlled oxidation process of GO to
adjust the distribution of functional groups. Both methods have been reported effective in recent
experiments [85, 86].
Figure 4.9 Density of states of a) hydroxyl chainlike structure; b) 1, 4-trans-epoxy structure c) 1, 4-trans-epoxy
structure with pure graphene stripe area.
Based on our detailed analyses shown above, Figure 4.10 schematically illustrates our proposed
thermodynamic GO structure containing two regions. (1) Graphene-like area with benzene rings
and oxidized region with surface bounded oxygen groups. Two functional groups exist in each GO
cell, that is, para-substituted epoxide groups with interspersed hydroxyl groups on two sides of the

34
GO sheet. (2) Pure graphene areas without any functional groups bonded. The ratio of these two
regions depends mainly upon the GO oxidization level. At the edge of the GO sheet, the carboxyl
prefers attachment along the armchair orientation, while the carbonyls prefer attachment in the
zigzag orientation. The vacant edge carbon atoms are occupied by OH bonds.
The carbon grid has a moderate wrinkling due to the oxygen debris [87]. This deformation is
located around hydroxyl and epoxide molecules where the 𝑠𝑝3 hybridization is induced in C-C
bonds. Despite the deformation, GO still maintains a hexagonal graphene-like structure. This
structural stability results from the trans-configuration arrangement of the hydroxyl and epoxide
oxygen, and the hydrogen networks also make an important contribution.
Figure 4.10 New Proposed thermodynamic GO structure model of GO. The grey, red and white spheres
represent carbon, oxygen and hydrogen atoms respectively. The yellow areas represent pure graphene
regions and the blue dashed lines represent the hydrogen bond networks.
Chapter 5. CONCLUSION, LIMITATION AND FUTURE STUDIES
5.1 CONSLUSION
In this study, MM and DFT calculations were performed to determine the equilibrium structure of
oxygen functional groups on GO and its electronic properties. A equilibrium GO structure is
proposed that has the chemical formula C1.5 O:H which closely fits many experimental and

35
commercial products [14, 88]. The trans-configuration of hydroxyl and epoxide groups on GO is
found to be energetically favorable and the local epoxide and hydroxyl chains also form the H-bond
networks. GO with periodic epoxide chain structure has the semiconductor’s electronic
characteristic. It was also found that, by replacing epoxide with hydroxyl the band gap will decrease.
The existence of pure graphene region also indicates that a well-controlled oxidation process can
tune the band gap of the GO sheet. Furthermore, on the GO edge, the carboxyl prefers to attach the
armchair orientation, while the carbonyl prefers the zigzag orientation.
5.2 LIMITATION
In this study, we did not simulate the reactions occurred during the oxidation process of GO but
focused on the final stable structure. The structural model describes the preferable alignment of
oxygen functional groups and also the related electronic properties. However, the limitation of this
model is that it cannot provide information of the oxidation process which also plays an important
role in forming stable GO structure. A further molecular dynamics simulation of GO can be
conducted as a supplement of our model.
5.3 FUTURE WORK
With high conductivity and high transmittance, graphene is regarded as the potential transparent
conductor to replace the conventional ITO (Indium Tin Oxide). However, under present techniques
and equipment, the number of defects, the low yields, the limited size and the high cost prevent
graphene from industrialized application. An alternative solution is depositing graphene or graphene
oxide flakes onto the ITO surface to improve its electrical conductivity. Thus, a low cost, highly
transparent and low resistance ITO-Graphene composite film can be expected.
ITO-Graphene or ITO-GO composites are a prominent transition material with relatively low cost
and good performance between the traditional ITO and graphene. In 2011, Choi et al. [89]
developed a solution process to synthesis reduced graphite oxide-ITO composites for use in
transparent electrode. Adding the reduced graphite oxide has increased the conductivity of ITO
electrodes. The sheet resistance of sol-gel ITO decreased from 2× 10³ Ω/sq to at least 1× 10³ Ω/sq
while the optical transmittance remained as high as 87% [89]. And in 2013, H.Yang et al. [90]
successfully prepared graphene nanosheet-ITO composites as an anode material for Li-ion batteries.
This composite showed an improvement in reversible capacity, cycling stability, and rate capability
of battery anode. The latest progress on ITO-graphene was made by Liu et al.[91]. They have
synthesised a highly stretchable and flexible graphene-ITO hybrid transparent electrode with

36
transmittance of 88.9% and sheet resistance of 78.34 Ω/sq. Moreover, this material was developed
using a two-step process to deposit the graphene on the ITO surface.
Although there is progress in ITO-Graphene or ITO-GO composites, the performance of the
composites has not reached the ideal level for the real application. To explore the limit of the
electrical and optical enhancement, theoretical modelling will be used to design new composites
structure. And the major task of the modelling work is to achieve a balance between the electrical
conductivity and optical transparency.

37
REFERENCES
[1] S. Chaiyakun, N. Witit-Anun, N. Nuntawong, P. Chindaudom, S. Oaew, C. Kedkeaw, et al.,
"Preparation and characterization of graphene oxide nanosheets," Procedia Engineering, vol. 32, pp.
759-764, 2012.
[2] N. R. Wilson, P. A. Pandey, R. Beanland, R. J. Young, I. A. Kinloch, L. Gong, et al., "Graphene
Oxide: Structural Analysis and Application as a Highly Transparent Support for Electron
Microscopy," Acs Nano, vol. 3, pp. 2547-2556, Sep 2009.
[3] K. S. Novoselov, A. K. Geim, S. V. Morozov, D. Jiang, Y. Zhang, S. V. Dubonos, et al., "Electric
field effect in atomically thin carbon films," Science, vol. 306, pp. 666-669, Oct 22 2004.
[4] X. Huang, X. Qi, F. Boey, and H. Zhang, "Graphene-based composites," Chemical Society Reviews,
vol. 41, pp. 666-686, 2012 2012.
[5] R. G. Gordon, "Criteria for choosing transparent conductors," Mrs Bulletin, vol. 25, pp. 52-57, Aug
2000.
[6] M. J. Allen, V. C. Tung, and R. B. Kaner, "Honeycomb Carbon: A Review of Graphene," Chemical
Reviews, vol. 110, pp. 132-145, Jan 2010.
[7] W. Choi, I. Lahiri, R. Seelaboyina, and Y. S. Kang, "Synthesis of Graphene and Its Applications: A
Review," Critical Reviews in Solid State and Materials Sciences, vol. 35, pp. 52-71, 2010 2010.
[8] Y. Zhang, L. Zhang, and C. Zhou, "Review of Chemical Vapor Deposition of Graphene and Related
Applications," Accounts of Chemical Research, vol. 46, pp. 2329-2339, Oct 15 2013.
[9] N. L. Allinger, "Conformational analysis. 130. MM2. A hydrocarbon force field utilizing V1 and V2
torsional terms," Journal of the American Chemical Society, vol. 99, pp. 8127-8134, 1977.
[10] J. H. Son and T. R. Rybolt, "Force Field Based MM2 Molecule-Surface Binding Energies for
Graphite and Graphene," Graphene, vol. 2, p. 18, 2013.
[11] H. Elmsellem, M. Youssouf, A. Aouniti, T. B. Hadda, A. Chetouani, and B. Hammouti, "Adsorption
and inhibition effect of curcumin on mild steel corrosion in hydrochloric acid," Russian Journal of
Applied Chemistry, vol. 87, pp. 744-753, 2014.
[12] N. L. Traulsen, C. H.-H. Traulsen, P. M. Deutinger, S. Müller, D. Schmidt, I. Linder, et al., "Chelate
cooperativity effects on the formation of di-and trivalent pseudo [2] rotaxanes with diketopiperazine
threads and tetralactam wheels," Organic & Biomolecular Chemistry, vol. 13, pp. 10881-10887,
2015.
[13] C. Valles, F. Beckert, L. Burk, R. Mulhaupt, R. J. Young, and I. A. Kinloch, "Effect of the C/O
Ratio in Graphene Oxide Materials on the Reinforcement of Epoxy-Based Nanocomposites,"
Journal of Polymer Science Part B-Polymer Physics, vol. 54, pp. 281-291, Jan 2016.
[14] C. K. Chua and M. Pumera, "Chemical reduction of graphene oxide: a synthetic chemistry
viewpoint," Chemical Society Reviews, vol. 43, pp. 291-312, 2014.

38
[15] D. R. Cooper, B. D’Anjou, N. Ghattamaneni, B. Harack, M. Hilke, A. Horth, et al., "Experimental
review of graphene," ISRN Condensed Matter Physics, vol. 2012, 2012.
[16] A. K. Geim and K. S. Novoselov, "The rise of graphene," Nature Materials, vol. 6, pp. 183-191, Mar
2007.
[17] R. Raccichini, A. Varzi, S. Passerini, and B. Scrosati, "The role of graphene for electrochemical
energy storage," Nature Materials, vol. 14, pp. 271-279, Mar 2015.
[18] O. C. Compton and S. T. Nguyen, "Graphene Oxide, Highly Reduced Graphene Oxide, and
Graphene: Versatile Building Blocks for Carbon-Based Materials," Small, vol. 6, pp. 711-723, Mar
22 2010.
[19] S. Pei and H.-M. Cheng, "The reduction of graphene oxide," Carbon, vol. 50, pp. 3210-3228, Aug
2012.
[20] W. S. Hummers and R. E. Offeman, "Preperation of Graphitic Oxide," Journal of the American
Chemical Society, vol. 80, pp. 1339-1339, 1958 1958.
[21] M. Batzill, "The surface science of graphene: Metal interfaces, CVD synthesis, nanoribbons,
chemical modifications, and defects," Surface Science Reports, vol. 67, pp. 83-115, Mar 1 2012.
[22] B. Hu, H. Ago, Y. Ito, K. Kawahara, M. Tsuji, E. Magome, et al., "Epitaxial growth of large-area
single-layer graphene over Cu(111)/sapphire by atmospheric pressure CVD," Carbon, vol. 50, pp.
57-65, Jan 2012.
[23] Z. Sun, Z. Liu, J. Li, G.-a. Tai, S.-P. Lau, and F. Yan, "Infrared Photodetectors Based on CVD-
Grown Graphene and PbS Quantum Dots with Ultrahigh Responsivity," Advanced Materials, vol. 24,
pp. 5878-5883, Nov 14 2012.
[24] B. N. Chandrashekar, B. Deng, A. S. Smitha, Y. Chen, C. Tan, H. Zhang, et al., "Roll-to-Roll Green
Transfer of CVD Graphene onto Plastic for a Transparent and Flexible Triboelectric Nanogenerator,"
Advanced Materials, vol. 27, pp. 5210-5216, Sep 16 2015.
[25] S. Hofmann, P. Braeuninger-Weimer, and R. S. Weatherup, "CVD-Enabled Graphene Manufacture
and Technology," Journal of Physical Chemistry Letters, vol. 6, pp. 2714-2721, Jul 16 2015.
[26] V. Miseikis, D. Convertino, N. Mishra, M. Gemmi, T. Mashoff, S. Heun, et al., "Rapid CVD growth
of millimetre-sized single crystal graphene using a cold-wall reactor," 2d Materials, vol. 2, Mar 2015.
[27] C. Mattevi, H. Kim, and M. Chhowalla, "A review of chemical vapour deposition of graphene on
copper," Journal of Materials Chemistry, vol. 21, pp. 3324-3334, 2011 2011.
[28] S. Bae, H. Kim, Y. Lee, X. Xu, J.-S. Park, Y. Zheng, et al., "Roll-to-roll production of 30-inch
graphene films for transparent electrodes," Nature Nanotechnology, vol. 5, pp. 574-578, Aug 2010.
[29] T. Kobayashi, M. Bando, N. Kimura, K. Shimizu, K. Kadono, N. Umezu, et al., "Production of a
100-m-long high-quality graphene transparent conductive film by roll-to-roll chemical vapor
deposition and transfer process," Applied Physics Letters, vol. 102, Jan 14 2013.
[30] E. S. Polsen, D. Q. McNerny, B. Viswanath, S. W. Pattinson, and A. J. Hart, "High-speed roll-to-roll
manufacturing of graphene using a concentric tube CVD reactor," Scientific Reports, vol. 5, May 21
2015.

39
[31] W. S. Koh, C. H. Gan, W. K. Phua, Y. A. Akimov, and P. Bai, "The Potential of Graphene as an ITO
Replacement in Organic Solar Cells: An Optical Perspective," Ieee Journal of Selected Topics in
Quantum Electronics, vol. 20, Jan-Feb 2014.
[32] W. Cai, R. D. Piner, F. J. Stadermann, S. Park, M. A. Shaibat, Y. Ishii, et al., "Synthesis and solid-
state NMR structural characterization of (13)C-labeled graphite oxide," Science, vol. 321, pp. 1815-
1817, Sep 26 2008.
[33] T. Szabo, O. Berkesi, and I. Dekany, "DRIFT study of deuterium-exchanged graphite oxide,"
Carbon, vol. 43, pp. 3186-3189, Dec 2005.
[34] B. C. Brodie, "On the atomic weight of graphite," Philosophical Transactions of the Royal Society of
London, vol. 149, pp. 249-259, 1859.
[35] Z. Luo, Y. Lu, L. A. Somers, and A. T. C. Johnson, "High Yield Preparation of Macroscopic
Graphene Oxide Membranes," Journal of the American Chemical Society, vol. 131, pp. 898-+, Jan
28 2009.
[36] R. Beams, L. G. Cancado, and L. Novotny, "Raman characterization of defects and dopants in
graphene," Journal of Physics-Condensed Matter, vol. 27, Mar 4 2015.
[37] B. Qiu, Y. Zhou, Y. Ma, X. Yang, W. Sheng, M. Xing, et al., "Facile synthesis of the Ti3+ self-
doped TiO2-graphene nanosheet composites with enhanced photocatalysis," Scientific reports, vol. 5,
2015.
[38] D. Yang, A. Velamakanni, G. Bozoklu, S. Park, M. Stoller, R. D. Piner, et al., "Chemical analysis of
graphene oxide films after heat and chemical treatments by X-ray photoelectron and Micro-Raman
spectroscopy," Carbon, vol. 47, pp. 145-152, Jan 2009.
[39] S. Park, J. An, J. R. Potts, A. Velamakanni, S. Murali, and R. S. Ruoff, "Hydrazine-reduction of
graphite- and graphene oxide," Carbon, vol. 49, pp. 3019-3023, Aug 2011.
[40] A. Lerf, H. Y. He, M. Forster, and J. Klinowski, "Structure of graphite oxide revisited," Journal of
Physical Chemistry B, vol. 102, pp. 4477-4482, Jun 4 1998.
[41] K. S. Novoselov, D. Jiang, F. Schedin, T. J. Booth, V. V. Khotkevich, S. V. Morozov, et al., "Two-
dimensional atomic crystals," Proceedings of the National Academy of Sciences of the United States
of America, vol. 102, pp. 10451-10453, Jul 26 2005.
[42] T. Szabo, O. Berkesi, P. Forgo, K. Josepovits, Y. Sanakis, D. Petridis, et al., "Evolution of surface
functional groups in a series of progressively oxidized graphite oxides," Chemistry of Materials, vol.
18, pp. 2740-2749, May 30 2006.
[43] W. Scholz and H. P. Boehm, "Graphite Oxide .6. Structure of Graphtite Oxide," Zeitschrift Fur
Anorganische Und Allgemeine Chemie, vol. 369, pp. 327-&, 1969 1969.
[44] D. R. Dreyer, A. D. Todd, and C. W. Bielawski, "Harnessing the chemistry of graphene oxide,"
Chemical Society Reviews, vol. 43, pp. 5288-5301, Aug 7 2014.
[45] T. Nakajima and Y. Matsuo, "FORMATION PROCESS AND STRUCTURE OF GRAPHITE
OXIDE," Carbon, vol. 32, pp. 469-475, 1994 1994.

40
[46] R. J. W. E. Lahaye, H. K. Jeong, C. Y. Park, and Y. H. Lee, "Density functional theory study of
graphite oxide for different oxidation levels," Physical Review B, vol. 79, p. 125435, 03/27/ 2009.
[47] D. W. Boukhvalov and M. I. Katsnelson, "Modeling of graphite oxide," Journal of the American
Chemical Society, vol. 130, pp. 10697-10701, Aug 2008.
[48] D. W. Boukhvalov and M. I. Katsnelson, "Enhancement of chemical activity in corrugated
graphene," The Journal of Physical Chemistry C, vol. 113, pp. 14176-14178, 2009.
[49] J.-A. Yan and M. Y. Chou, "Oxidation functional groups on graphene: Structural and electronic
properties," Physical Review B, vol. 82, p. 125403, 09/02/ 2010.
[50] J. T. Paci, T. Belytschko, and G. C. Schatz, "Computational studies of the structure, behavior upon
heating, and mechanical properties of graphite oxide," Journal of Physical Chemistry C, vol. 111, pp.
18099-18111, Dec 2007.
[51] Z. Y. Li, W. H. Zhang, Y. Luo, J. L. Yang, and J. G. Hou, "How Graphene Is Cut upon Oxidation?,"
Journal of the American Chemical Society, vol. 131, pp. 6320-+, May 2009.
[52] R. A. Gaussian 09, G. W. T. M. J. Frisch, H. B. Schlegel, G. E. Scuseria, , J. R. C. M. A. Robb, G.
Scalmani, V. Barone, B. Mennucci, , H. N. G. A. Petersson, M. Caricato, X. Li, H. P. Hratchian, , J.
B. A. F. Izmaylov, G. Zheng, J. L. Sonnenberg, M. Hada, , K. T. M. Ehara, R. Fukuda, J. Hasegawa,
M. Ishida, T. Nakajima, , et al., 2009.
[53] X. Li and M. J. Frisch, "Energy-represented direct inversion in the iterative subspace within a hybrid
geometry optimization method," Journal of chemical theory and computation, vol. 2, pp. 835-839,
2006.
[54] P. Pulay, G. Fogarasi, F. Pang, and J. E. Boggs, "Systematic ab initio gradient calculation of
molecular geometries, force constants, and dipole moment derivatives," Journal of the American
Chemical Society, vol. 101, pp. 2550-2560, 1979.
[55] G. Fogarasi, X. Zhou, P. W. Taylor, and P. Pulay, "The calculation of ab initio molecular geometries:
efficient optimization by natural internal coordinates and empirical correction by offset forces,"
Journal of the American Chemical Society, vol. 114, pp. 8191-8201, 1992.
[56] P. Pulay and G. Fogarasi, "Geometry optimization in redundant internal coordinates," The Journal of
chemical physics, vol. 96, pp. 2856-2860, 1992.
[57] J. Baker, "Techniques for geometry optimization: A comparison of Cartesian and natural internal
coordinates," Journal of computational chemistry, vol. 14, pp. 1085-1100, 1993.
[58] C. Peng and H. Bernhard Schlegel, "Combining Synchronous Transit and Quasi‐ Newton Methods
to Find Transition States," Israel Journal of Chemistry, vol. 33, pp. 449-454, 1993.
[59] C. Peng, P. Y. Ayala, H. B. Schlegel, and M. J. Frisch, "Using redundant internal coordinates to
optimize equilibrium geometries and transition states," Journal of Computational Chemistry, vol. 17,
pp. 49-56, 1996.
[60] J. Paier, R. Hirschl, M. Marsman, and G. Kresse, "The Perdew–Burke–Ernzerhof exchange-
correlation functional applied to the G2-1 test set using a plane-wave basis set," The Journal of
chemical physics, vol. 122, p. 234102, 2005.

41
[61] W. Kohn and L. J. Sham, "Self-Consistent Equations Including Exchange and Correlation Effects,"
Physical Review, vol. 140, pp. A1133-A1138, 11/15/ 1965.
[62] K. Schwarz and P. Blaha, "Solid state calculations using WIEN2k," Computational Materials
Science, vol. 28, pp. 259-273, Oct 2003.
[63] K. Schwarz, P. Blaha, and S. B. Trickey, "Electronic structure of solids with WIEN2k," Molecular
Physics, vol. 108, pp. 3147-3166, 2010 2010.
[64] H. J. Monkhorst and J. D. Pack, "Special points for Brillouin-zone integrations," Physical Review B,
vol. 13, pp. 5188-5192, 06/15/ 1976.
[65] A. Hunt, D. A. Dikin, E. Z. Kurmaev, Y. H. Lee, N. V. Luan, G. S. Chang, et al., "Modulation of the
band gap of graphene oxide: The role of AA-stacking," Carbon, vol. 66, pp. 539-546, 1// 2014.
[66] D. D’Angelo, C. Bongiorno, M. Amato, I. Deretzis, A. La Magna, G. Compagnini, et al., "Electron
energy-loss spectra of graphene oxide for the determination of oxygen functionalities," Carbon, vol.
93, pp. 1034-1041, 11// 2015.
[67] D. W. Boukhvalov, "DFT modeling of the covalent functionalization of graphene: from ideal to
realistic models," Rsc Advances, vol. 3, pp. 7150-7159, 2013.
[68] R. Mortezaee, "Computational Modeling of Graphene Oxide Exfoliation and Lithium Storage
Characteristics," 2013.
[69] N. Lu, Y. Huang, H.-b. Li, Z. Li, and J. Yang, "First principles nuclear magnetic resonance
signatures of graphene oxide," The Journal of Chemical Physics, vol. 133, p. 034502, 2010.
[70] J. O. Sofo, A. S. Chaudhari, and G. D. Barber, "Graphane: A two-dimensional hydrocarbon,"
Physical Review B, vol. 75, p. 153401, 04/10/ 2007.
[71] S. Kim, S. Zhou, Y. Hu, M. Acik, Y. J. Chabal, C. Berger, et al., "Room-temperature metastability
of multilayer graphene oxide films," Nat Mater, vol. 11, pp. 544-549, 06//print 2012.
[72] G. Lee and K. Cho, "Electronic structures of zigzag graphene nanoribbons with edge hydrogenation
and oxidation," Physical Review B, vol. 79, p. 165440, 04/29/ 2009.
[73] W. Gao, L. B. Alemany, L. Ci, and P. M. Ajayan, "New insights into the structure and reduction of
graphite oxide," Nat Chem, vol. 1, pp. 403-408, 08//print 2009.
[74] W. W. Cai, R. D. Piner, F. J. Stadermann, S. Park, M. A. Shaibat, Y. Ishii, et al., "Synthesis and
solid-state NMR structural characterization of (13)C-labeled graphite oxide," Science, vol. 321, pp.
1815-1817, Sep 2008.
[75] Z. Li, W. Zhang, Y. Luo, J. Yang, and J. G. Hou, "How graphene is cut upon oxidation?," Journal of
the American Chemical Society, vol. 131, pp. 6320-6321, 2009.
[76] L. Wang, Y. Sun, K. Lee, D. West, Z. Chen, J. Zhao, et al., "Stability of graphene oxide phases from
first-principles calculations," Physical Review B, vol. 82, p. 161406, 2010.
[77] F. A. Carey and R. J. Sundberg, Advanced Organic Chemistry: Part A: Structure and Mechanisms:
Springer Science & Business Media, 2007.
[78] G. A. Jeffrey and G. A. Jeffrey, An introduction to hydrogen bonding vol. 12: Oxford university
press New York, 1997.

42
[79] D. C. Marcano, D. V. Kosynkin, J. M. Berlin, A. Sinitskii, Z. Sun, A. Slesarev, et al., "Improved
synthesis of graphene oxide," ACS nano, vol. 4, pp. 4806-4814, 2010.
[80] X. Gao, J. Jang, and S. Nagase, "Hydrazine and thermal reduction of graphene oxide: reaction
mechanisms, product structures, and reaction design," The Journal of Physical Chemistry C, vol. 114,
pp. 832-842, 2009.
[81] C. Gómez-Navarro, R. T. Weitz, A. M. Bittner, M. Scolari, A. Mews, M. Burghard, et al.,
"Electronic transport properties of individual chemically reduced graphene oxide sheets," Nano
Letters, vol. 9, pp. 2206-2206, 2009.
[82] G. Eda, C. Mattevi, H. Yamaguchi, H. Kim, and M. Chhowalla, "Insulator to semimetal transition in
graphene oxide," The Journal of Physical Chemistry C, vol. 113, pp. 15768-15771, 2009.
[83] E. C. Mattson, H. Pu, S. Cui, M. A. Schofield, S. Rhim, G. Lu, et al., "Evidence of nanocrystalline
semiconducting graphene monoxide during thermal reduction of graphene oxide in vacuum," ACS
nano, vol. 5, pp. 9710-9717, 2011.
[84] A. Mathkar, D. Tozier, P. Cox, P. Ong, C. Galande, K. Balakrishnan, et al., "Controlled, stepwise
reduction and band gap manipulation of graphene oxide," The journal of physical chemistry letters,
vol. 3, pp. 986-991, 2012.
[85] M. A. Velasco-Soto, S. A. Pérez-García, J. Alvarez-Quintana, Y. Cao, L. Nyborg, and L. Licea-
Jiménez, "Selective band gap manipulation of graphene oxide by its reduction with mild reagents,"
Carbon, vol. 93, pp. 967-973, 11// 2015.
[86] J. Chen, Y. Zhang, M. Zhang, B. Yao, Y. Li, L. Huang, et al., "Water-enhanced oxidation of
graphite to graphene oxide with controlled species of oxygenated groups," Chemical Science, vol. 7,
pp. 1874-1881, 2016.
[87] J. P. Rourke, P. A. Pandey, J. J. Moore, M. Bates, I. A. Kinloch, R. J. Young, et al., "The Real
Graphene Oxide Revealed: Stripping the Oxidative Debris from the Graphene-like Sheets,"
Angewandte Chemie-International Edition, vol. 50, pp. 3173-3177, 2011 2011.
[88] Y. Zhu, S. Murali, W. Cai, X. Li, J. W. Suk, J. R. Potts, et al., "Graphene and Graphene Oxide:
Synthesis, Properties, and Applications," Advanced Materials, vol. 22, pp. 3906-3924, Sep 15 2010.
[89] K. S. Choi, Y. Park, K.-C. Kwon, J. Kim, C. K. Kim, S. Y. Kim, et al., "Reduced graphite oxide-
indium tin oxide hybrid materials for use as a transparent electrode," Journal of The Electrochemical
Society, vol. 158, pp. J231-J235, 2011.
[90] H. Yang, T. Song, S. Lee, H. Han, F. Xia, A. Devadoss, et al., "Tin indium oxide/graphene
nanosheet nanocomposite as an anode material for lithium ion batteries with enhanced lithium
storage capacity and rate capability," Electrochimica Acta, vol. 91, pp. 275-281, 2013.
[91] J. Liu, Y. Yi, Y. Zhou, and H. Cai, "Highly stretchable and flexible graphene/ITO hybrid transparent
electrode," Nanoscale research letters, vol. 11, p. 108, 2016.

43
APPENDIX 1
Figure A1 Schematic 𝐶6𝑂4 isomer models: Type A: 1, 3-epoxy substituted 𝐶6𝑂2(𝑂𝐻)2; Type B: 1,
4-epoxy substituted 𝐶6𝑂2(𝑂𝐻)2; Type C: 1, 2, 3-hydroxyl substituted 𝐶6𝑂1(𝑂𝐻)3; Type D: 1, 2, 4-
hydroxyl substituted 𝐶6𝑂1(𝑂𝐻)3.

44
APPENDIX 2
This poster is published on the 24th Australian Conference on Microscopy and Microanalysis 2016.


