1
A WORLDWIDE SEISMIC CODE INDEX, COUNTRY-BY-COUNTRY
GLOBAL BUILDING PRACTICE FACTOR AND SOCIOECONOMIC
VULNERABILITY INDICES FOR USE IN EARTHQUAKE LOSS
ESTIMATION
James Edward DANIELL1, Friedemann WENZEL
2, Bijan KHAZAI
3, Jonathan Gonzalez
SANTIAGO4 and Andreas SCHAEFER
5
ABSTRACT
The production of socio-economic vulnerability and engineering indices for use in earthquake loss
estimation is an integral component for holistic and rapid global earthquake and other natural disaster
loss estimation. Six key indices are introduced in this paper, which have been used in earthquake loss
analysis. A worldwide seismic code index, country-by country building practice factor and building
inventory from 1900-2013 has been produced over the last few years for use in the rapid loss
estimation methodology of Daniell et al. (2011). In addition, they provide a detailed view of the code
changes for each country and their applicability. Building age is also an important factor for use in
earthquake loss estimation and has been established for use in damage functions as well as capital
stock measurements. Socioeconomic indices such as HDI (human development index) and the formed
Earthquake HDI, and Time of Day functions, have also been created through time for use in loss
estimation. These indices have been combined for use in the socioeconomic fragility functions of
Daniell (2014).
INTRODUCTION
The socioeconomic climate of a country as well as the governance and policy factors define the
engineering practices and typologies produced within that country. Seismic resistant codes have been
implemented in many countries over the past 100 years. However, many countries do not adequately
enforce these measures, or have many exclusion clauses in their codes or do not take into account
existing buildings. The infrastructure age in each country is key to capital stock as well as damage. In
many cases this is part of the census data (UNDP, 2010). Corruption has been identified as a key
factor in earthquake losses (Bilham and Hough, 2006; Ambraseys and Bilham, 2011).
The HDI is a key tool in assessing the socioeconomic status of a country (UNDP, 1995-2009). Across
a country, there can be marked differences of development, with the GDP (gross domestic product),
Life Expectancy and Education status being a good proxy for the vulnerability to earthquakes. Often
more developed regions are those more likely to have money to build better, or consider all natural
1 Dr., Researcher, Karlsruhe Institute of Technology, Karlsruhe, Germany, [email protected]
2 Professor, Karlsruhe Institute of Technology, Karlsruhe, Germany, [email protected]
3 Dr., Researcher, Karlsruhe Institute of Technology, Karlsruhe, Germany, [email protected] 4 MSc., Researcher, Karlsruhe Institute of Technology, Karlsruhe, Germany, [email protected]
5 Dipl-Ing., Researcher, Karlsruhe Institute of Technology, Karlsruhe, Germany, [email protected]
J.E. Daniell, F. Wenzel,B. Khazai, J.G. Santiago, A. Schaefer
2
hazards, including earthquakes. By relating key earthquake socioeconomic proxies and development
through time to the physical hazard, vulnerability and exposure, a holistic view of earthquake risk can
be calculated, as in Carreno et al. (2005) or Daniell et al. (2010).
SEISMIC CODE INDEX
Studies into seismic code indices have been undertaken by various authors, including IISEE with the
World List from 1992-2012, the Practice for Seismic Hazard Assessment and various studies
undertaken by individual authors. As yet, no integrated method for rating these seismic codes, and
when codes and zoning maps changed, has been established. Thus, a detailed database from 1900-
2013 was created to document and use the influence of these seismic codes for rapid loss estimation.
Over the past century, building practice towards earthquakes has changed significantly. Certain
countries have attempted to change building practice formally by adopting seismic resistant codes in
construction laws, whereas some countries still have no formal code. The age of these codes as well as
the various engineering parameters covered by the codes gives an insight into the quality of the code.
Table 1: Engineering Parameters used in the analysis of the worldwide seismic code index
Element Sub-element Value
Structural Design Method Material Loads/ Strengths, Dead & Live Load 30
Seismic Actions Horizontal Components 5
Seismic Actions Vertical Components 3
Seismic Actions Ground Seismic Acceleration % of value over 30
Seismic Actions Near Fault 2
Seismic Actions Soil Classification 5
Seismic Actions Importance factor 5
Seismic Actions Behaviour factor (Ductility factor) 5
Seismic Actions Foundation Factor 5
Existing Buildings % of buildings
1 to 2 storey building factor % of buildings
Design Method Simplified Spectrum Method 5
Design Method Drift 2
Design Method Dynamic Response Method 5
Design Criteria Non-Structural 2
Design Criteria Avoidance of Collapse 5
Design Criteria Damage Limitation 5
Foundation Design Foundations, Retaining Structures, Slopes 5
Code Quality Assessment Displacement Based Design/ Overall 15
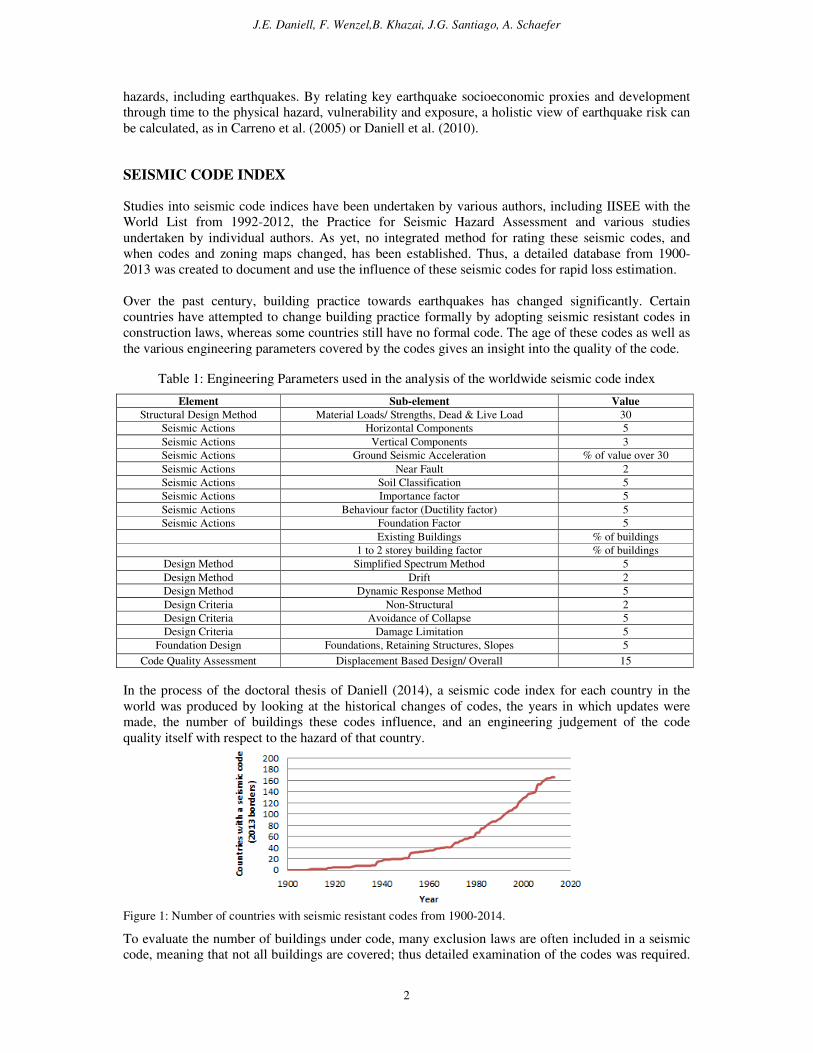
In the process of the doctoral thesis of Daniell (2014), a seismic code index for each country in the
world was produced by looking at the historical changes of codes, the years in which updates were
made, the number of buildings these codes influence, and an engineering judgement of the code
quality itself with respect to the hazard of that country.
Figure 1: Number of countries with seismic resistant codes from 1900-2014.
To evaluate the number of buildings under code, many exclusion laws are often included in a seismic
code, meaning that not all buildings are covered; thus detailed examination of the codes was required.
J.E. Daniell, F. Wenzel,B. Khazai, J.G. Santiago, A. Schaefer 3
In Germany, for instance, buildings with less than 3 storeys for residential purposes are not required to
be built to the DIN4149 seismic code. In addition, an age profile was required for each country to
calculate the number of buildings built under various versions of each code. Census data, energy data
and other sources were used in order to create the age profile for each country worldwide. In total, 166
countries/nations have some form of seismic code, and over 510 versions of codes and updates have
occurred formally worldwide since 1900.
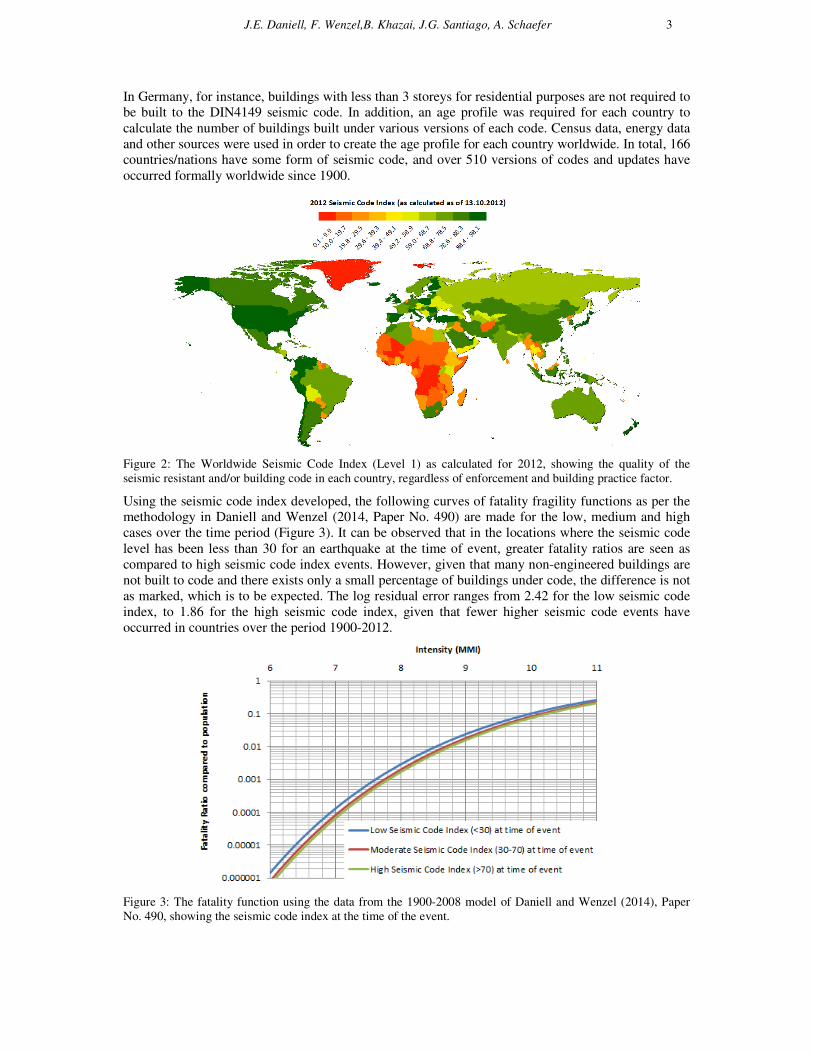
Figure 2: The Worldwide Seismic Code Index (Level 1) as calculated for 2012, showing the quality of the
seismic resistant and/or building code in each country, regardless of enforcement and building practice factor.
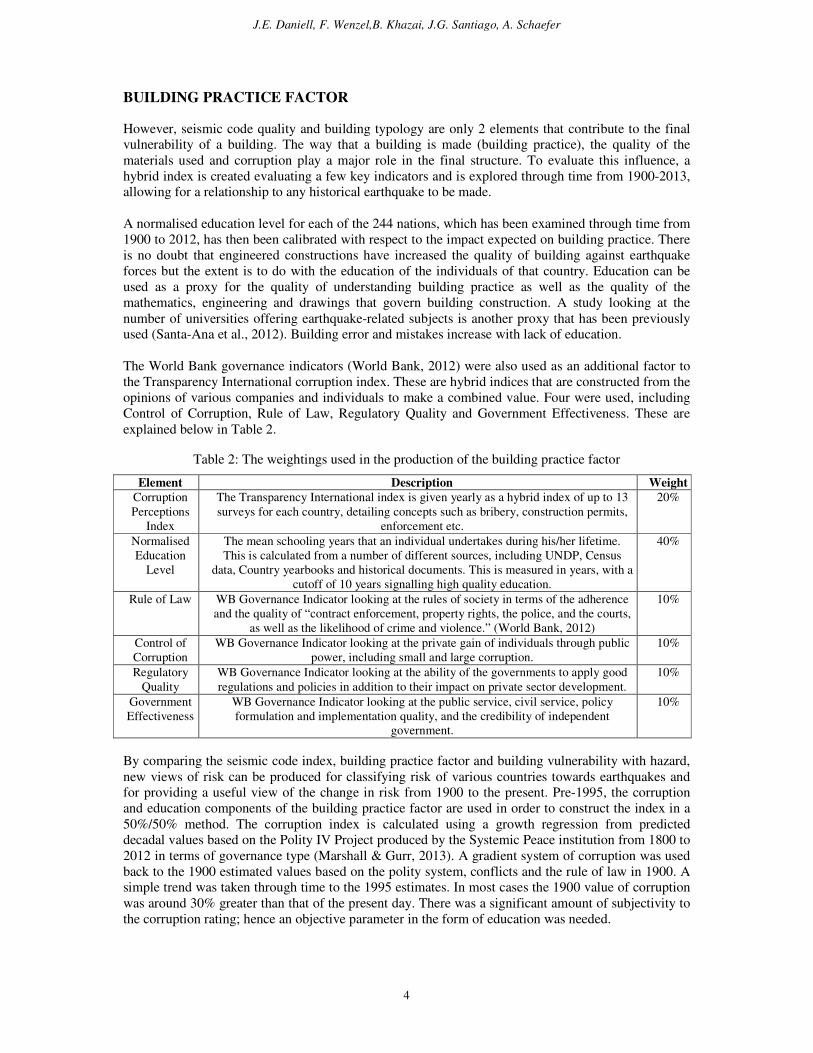
Using the seismic code index developed, the following curves of fatality fragility functions as per the
methodology in Daniell and Wenzel (2014, Paper No. 490) are made for the low, medium and high
cases over the time period (Figure 3). It can be observed that in the locations where the seismic code
level has been less than 30 for an earthquake at the time of event, greater fatality ratios are seen as
compared to high seismic code index events. However, given that many non-engineered buildings are
not built to code and there exists only a small percentage of buildings under code, the difference is not
as marked, which is to be expected. The log residual error ranges from 2.42 for the low seismic code
index, to 1.86 for the high seismic code index, given that fewer higher seismic code events have
occurred in countries over the period 1900-2012.
Figure 3: The fatality function using the data from the 1900-2008 model of Daniell and Wenzel (2014), Paper
No. 490, showing the seismic code index at the time of the event.
J.E. Daniell, F. Wenzel,B. Khazai, J.G. Santiago, A. Schaefer
4
BUILDING PRACTICE FACTOR
However, seismic code quality and building typology are only 2 elements that contribute to the final
vulnerability of a building. The way that a building is made (building practice), the quality of the
materials used and corruption play a major role in the final structure. To evaluate this influence, a
hybrid index is created evaluating a few key indicators and is explored through time from 1900-2013,
allowing for a relationship to any historical earthquake to be made.
A normalised education level for each of the 244 nations, which has been examined through time from
1900 to 2012, has then been calibrated with respect to the impact expected on building practice. There
is no doubt that engineered constructions have increased the quality of building against earthquake
forces but the extent is to do with the education of the individuals of that country. Education can be
used as a proxy for the quality of understanding building practice as well as the quality of the
mathematics, engineering and drawings that govern building construction. A study looking at the
number of universities offering earthquake-related subjects is another proxy that has been previously
used (Santa-Ana et al., 2012). Building error and mistakes increase with lack of education.
The World Bank governance indicators (World Bank, 2012) were also used as an additional factor to
the Transparency International corruption index. These are hybrid indices that are constructed from the
opinions of various companies and individuals to make a combined value. Four were used, including
Control of Corruption, Rule of Law, Regulatory Quality and Government Effectiveness. These are
explained below in Table 2.
Table 2: The weightings used in the production of the building practice factor
Element Description Weight
Corruption
Perceptions
Index
The Transparency International index is given yearly as a hybrid index of up to 13
surveys for each country, detailing concepts such as bribery, construction permits,
enforcement etc.
20%
Normalised
Education
Level
The mean schooling years that an individual undertakes during his/her lifetime.
This is calculated from a number of different sources, including UNDP, Census
data, Country yearbooks and historical documents. This is measured in years, with a
cutoff of 10 years signalling high quality education.
40%
Rule of Law WB Governance Indicator looking at the rules of society in terms of the adherence
and the quality of “contract enforcement, property rights, the police, and the courts,
as well as the likelihood of crime and violence.” (World Bank, 2012)
10%
Control of
Corruption
WB Governance Indicator looking at the private gain of individuals through public
power, including small and large corruption.
10%
Regulatory
Quality
WB Governance Indicator looking at the ability of the governments to apply good
regulations and policies in addition to their impact on private sector development.
10%
Government
Effectiveness
WB Governance Indicator looking at the public service, civil service, policy
formulation and implementation quality, and the credibility of independent
government.
10%
By comparing the seismic code index, building practice factor and building vulnerability with hazard,
new views of risk can be produced for classifying risk of various countries towards earthquakes and
for providing a useful view of the change in risk from 1900 to the present. Pre-1995, the corruption
and education components of the building practice factor are used in order to construct the index in a
50%/50% method. The corruption index is calculated using a growth regression from predicted
decadal values based on the Polity IV Project produced by the Systemic Peace institution from 1800 to
2012 in terms of governance type (Marshall & Gurr, 2013). A gradient system of corruption was used
back to the 1900 estimated values based on the polity system, conflicts and the rule of law in 1900. A
simple trend was taken through time to the 1995 estimates. In most cases the 1900 value of corruption
was around 30% greater than that of the present day. There was a significant amount of subjectivity to
the corruption rating; hence an objective parameter in the form of education was needed.
J.E. Daniell, F. Wenzel,B. Khazai, J.G. Santiago, A. Schaefer 5
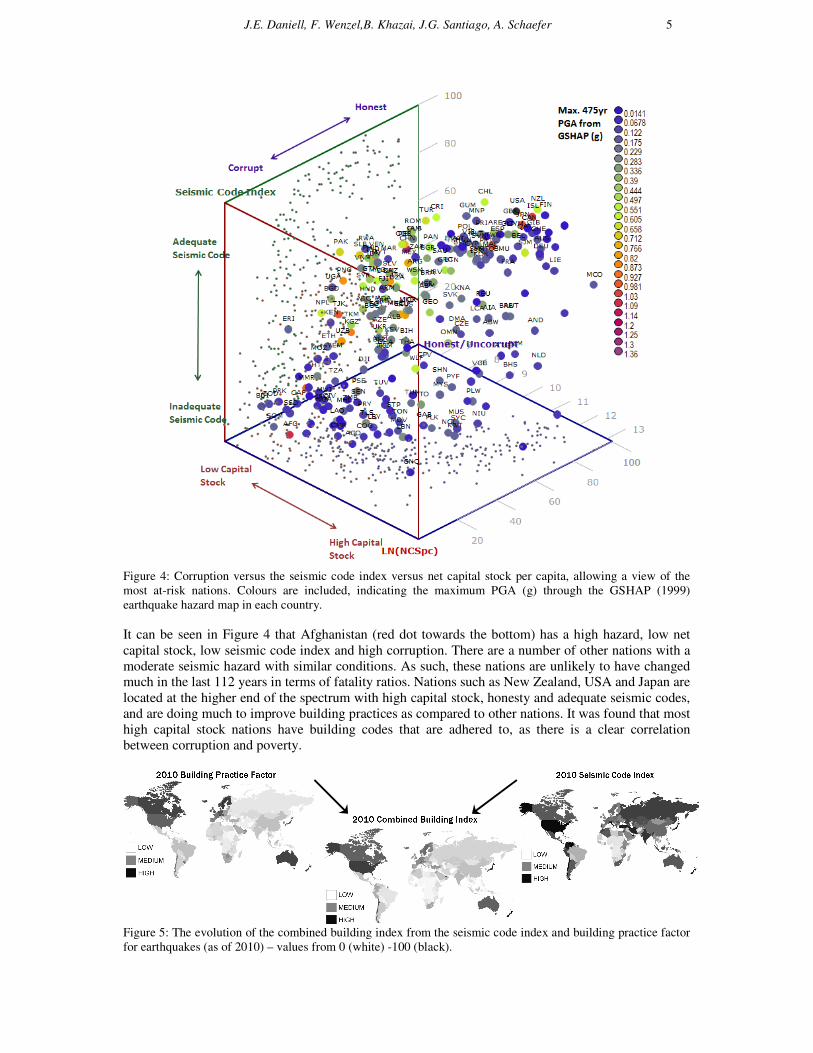
Figure 4: Corruption versus the seismic code index versus net capital stock per capita, allowing a view of the
most at-risk nations. Colours are included, indicating the maximum PGA (g) through the GSHAP (1999)
earthquake hazard map in each country.
It can be seen in Figure 4 that Afghanistan (red dot towards the bottom) has a high hazard, low net
capital stock, low seismic code index and high corruption. There are a number of other nations with a
moderate seismic hazard with similar conditions. As such, these nations are unlikely to have changed
much in the last 112 years in terms of fatality ratios. Nations such as New Zealand, USA and Japan are
located at the higher end of the spectrum with high capital stock, honesty and adequate seismic codes,
and are doing much to improve building practices as compared to other nations. It was found that most
high capital stock nations have building codes that are adhered to, as there is a clear correlation
between corruption and poverty.
Figure 5: The evolution of the combined building index from the seismic code index and building practice factor
for earthquakes (as of 2010) – values from 0 (white) -100 (black).
J.E. Daniell, F. Wenzel,B. Khazai, J.G. Santiago, A. Schaefer
6
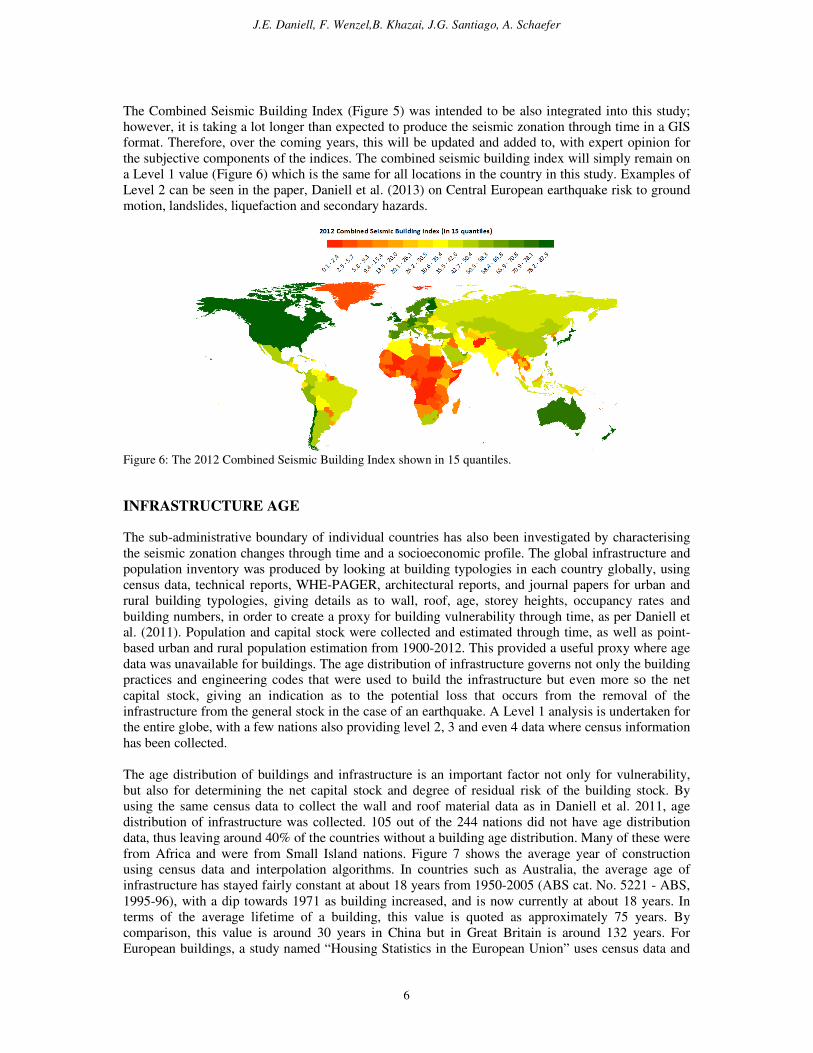
The Combined Seismic Building Index (Figure 5) was intended to be also integrated into this study;
however, it is taking a lot longer than expected to produce the seismic zonation through time in a GIS
format. Therefore, over the coming years, this will be updated and added to, with expert opinion for
the subjective components of the indices. The combined seismic building index will simply remain on
a Level 1 value (Figure 6) which is the same for all locations in the country in this study. Examples of
Level 2 can be seen in the paper, Daniell et al. (2013) on Central European earthquake risk to ground
motion, landslides, liquefaction and secondary hazards.
Figure 6: The 2012 Combined Seismic Building Index shown in 15 quantiles.
INFRASTRUCTURE AGE
The sub-administrative boundary of individual countries has also been investigated by characterising
the seismic zonation changes through time and a socioeconomic profile. The global infrastructure and
population inventory was produced by looking at building typologies in each country globally, using
census data, technical reports, WHE-PAGER, architectural reports, and journal papers for urban and
rural building typologies, giving details as to wall, roof, age, storey heights, occupancy rates and
building numbers, in order to create a proxy for building vulnerability through time, as per Daniell et
al. (2011). Population and capital stock were collected and estimated through time, as well as point-
based urban and rural population estimation from 1900-2012. This provided a useful proxy where age
data was unavailable for buildings. The age distribution of infrastructure governs not only the building
practices and engineering codes that were used to build the infrastructure but even more so the net
capital stock, giving an indication as to the potential loss that occurs from the removal of the
infrastructure from the general stock in the case of an earthquake. A Level 1 analysis is undertaken for
the entire globe, with a few nations also providing level 2, 3 and even 4 data where census information
has been collected.
The age distribution of buildings and infrastructure is an important factor not only for vulnerability,
but also for determining the net capital stock and degree of residual risk of the building stock. By
using the same census data to collect the wall and roof material data as in Daniell et al. 2011, age
distribution of infrastructure was collected. 105 out of the 244 nations did not have age distribution
data, thus leaving around 40% of the countries without a building age distribution. Many of these were
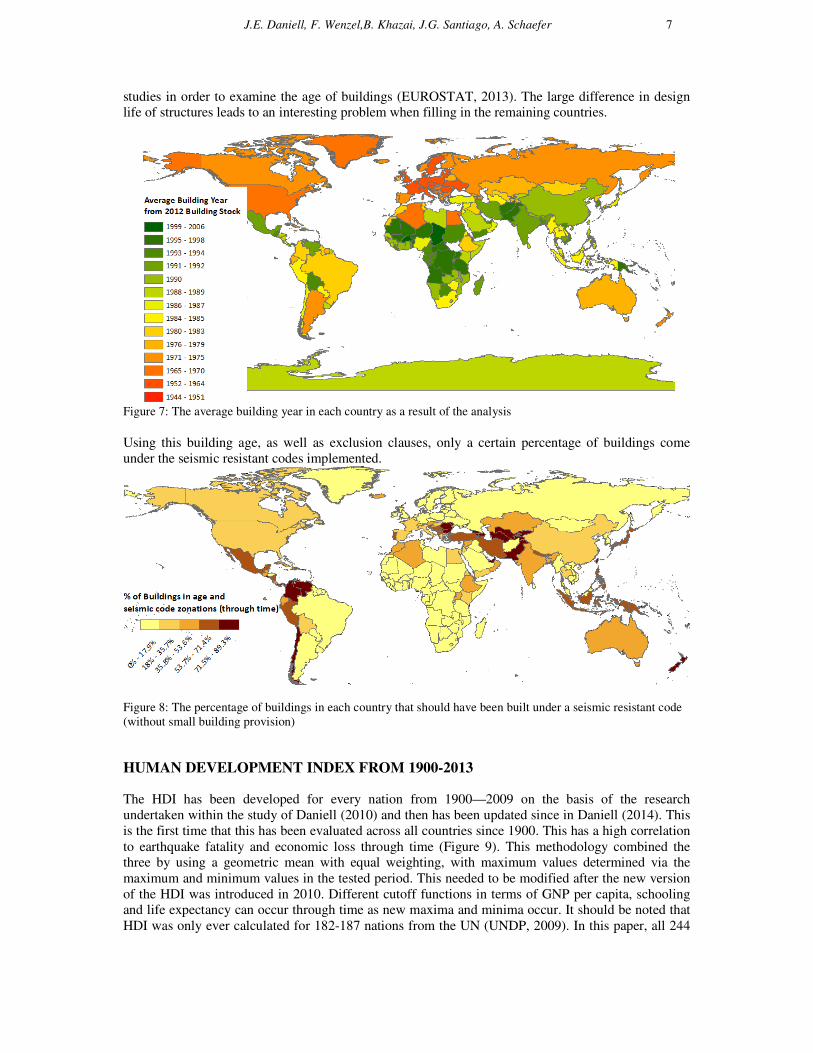
from Africa and were from Small Island nations. Figure 7 shows the average year of construction
using census data and interpolation algorithms. In countries such as Australia, the average age of
infrastructure has stayed fairly constant at about 18 years from 1950-2005 (ABS cat. No. 5221 - ABS,
1995-96), with a dip towards 1971 as building increased, and is now currently at about 18 years. In
terms of the average lifetime of a building, this value is quoted as approximately 75 years. By
comparison, this value is around 30 years in China but in Great Britain is around 132 years. For
European buildings, a study named “Housing Statistics in the European Union” uses census data and
J.E. Daniell, F. Wenzel,B. Khazai, J.G. Santiago, A. Schaefer 7
studies in order to examine the age of buildings (EUROSTAT, 2013). The large difference in design
life of structures leads to an interesting problem when filling in the remaining countries.
Figure 7: The average building year in each country as a result of the analysis
Using this building age, as well as exclusion clauses, only a certain percentage of buildings come
under the seismic resistant codes implemented.
Figure 8: The percentage of buildings in each country that should have been built under a seismic resistant code
(without small building provision)
HUMAN DEVELOPMENT INDEX FROM 1900-2013
The HDI has been developed for every nation from 1900—2009 on the basis of the research
undertaken within the study of Daniell (2010) and then has been updated since in Daniell (2014). This
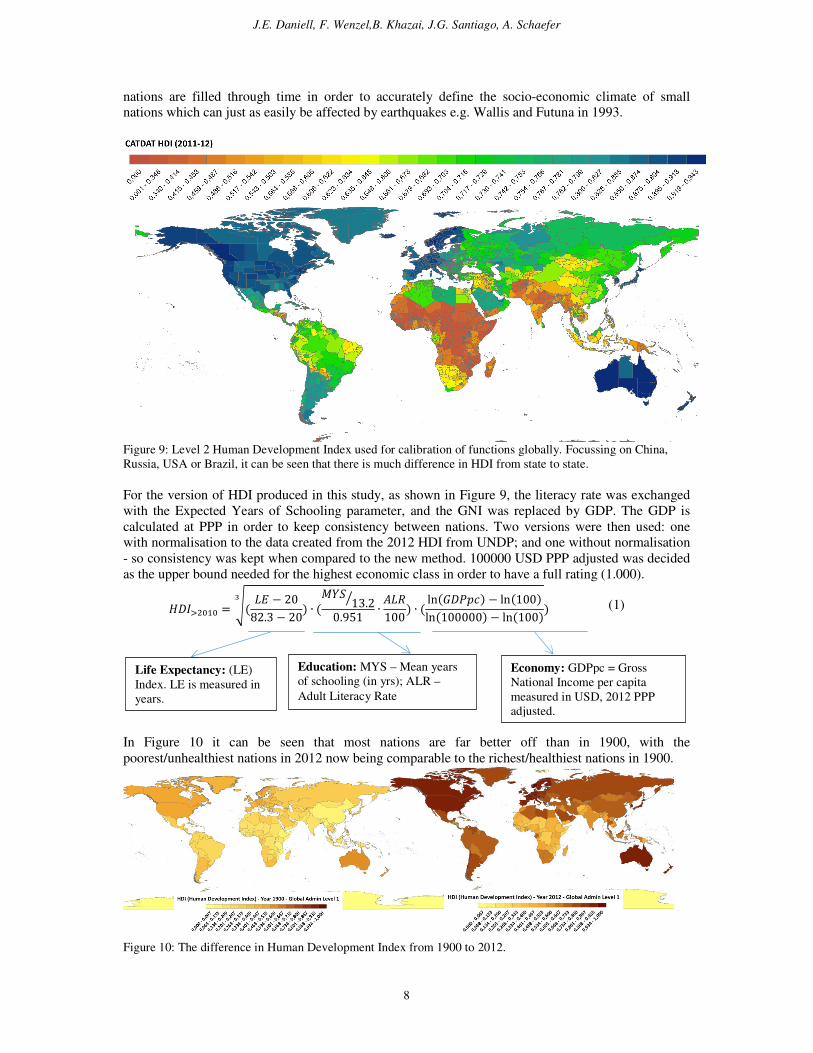
is the first time that this has been evaluated across all countries since 1900. This has a high correlation
to earthquake fatality and economic loss through time (Figure 9). This methodology combined the
three by using a geometric mean with equal weighting, with maximum values determined via the
maximum and minimum values in the tested period. This needed to be modified after the new version
of the HDI was introduced in 2010. Different cutoff functions in terms of GNP per capita, schooling
and life expectancy can occur through time as new maxima and minima occur. It should be noted that
HDI was only ever calculated for 182-187 nations from the UN (UNDP, 2009). In this paper, all 244
J.E. Daniell, F. Wenzel,B. Khazai, J.G. Santiago, A. Schaefer
8
nations are filled through time in order to accurately define the socio-economic climate of small
nations which can just as easily be affected by earthquakes e.g. Wallis and Futuna in 1993.
Figure 9: Level 2 Human Development Index used for calibration of functions globally. Focussing on China,
Russia, USA or Brazil, it can be seen that there is much difference in HDI from state to state.
For the version of HDI produced in this study, as shown in Figure 9, the literacy rate was exchanged
with the Expected Years of Schooling parameter, and the GNI was replaced by GDP. The GDP is
calculated at PPP in order to keep consistency between nations. Two versions were then used: one
with normalisation to the data created from the 2012 HDI from UNDP; and one without normalisation
- so consistency was kept when compared to the new method. 100000 USD PPP adjusted was decided
as the upper bound needed for the highest economic class in order to have a full rating (1.000).
�������� = ( �� − 2082.3 − 20) ∙ (��� 13.2�0.951 ∙ ���100) ∙ ( ln( �!"#) − ln(100)ln(100000) − ln(100)
$ ) (1)
In Figure 10 it can be seen that most nations are far better off than in 1900, with the
poorest/unhealthiest nations in 2012 now being comparable to the richest/healthiest nations in 1900.
Figure 10: The difference in Human Development Index from 1900 to 2012.
Life Expectancy: (LE)
Index. LE is measured in
years.
Education: MYS – Mean years
of schooling (in yrs); ALR –
Adult Literacy Rate
Economy: GDPpc = Gross
National Income per capita
measured in USD, 2012 PPP
adjusted.
J.E. Daniell, F. Wenzel,B. Khazai, J.G. Santiago, A. Schaefer 9
The HDI has been developed for every nation from 1900—2013 on the basis of the research
undertaken within this study. Not only is this very useful for comparison of nations related to
earthquakes, as HDI encompasses the socioeconomic climate of a country very well, but this presents
a parameter that can be used across many disciplines as a normalisation technique for all types of
natural disasters and social-based views. It can be seen that the parameter shows a large randomisation
before 1960. Figure 13 shows the trend across time with World Wars I and II showing prominently
from 1914-18 and 1939-45. In the ensuing period it can also be seen that the nations recover. This is
due to better and safer living standards and rebuilding of capital through a higher gross formation than
would usually occur. From 1960 onwards, most nations steadily increase or rapidly increase, with a
few exceptions such as genocides (Cambodia, Rwanda) or economic crises (hyperinflation – USSR,
Turkey, Zimbabwe) that occurred. The addition of a standard metric of a standard year for analysis of
HDI gives a much more consistent view of the income parameter, as otherwise the HDI increase is too
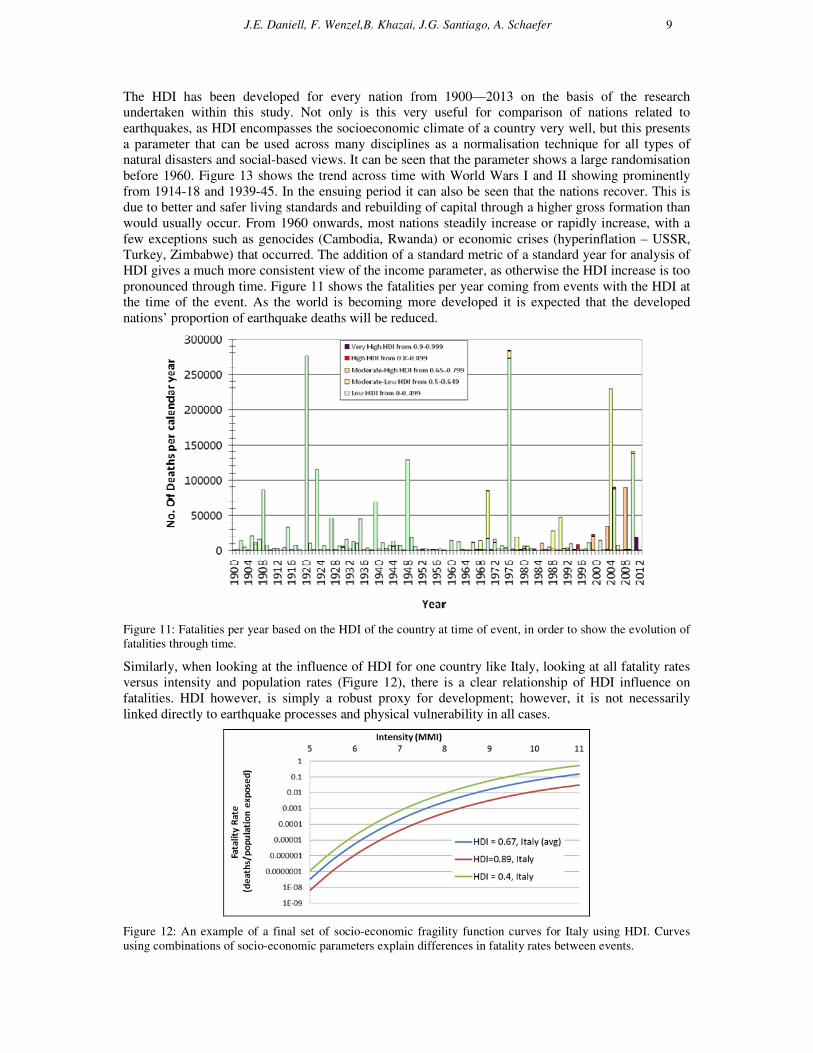
pronounced through time. Figure 11 shows the fatalities per year coming from events with the HDI at
the time of the event. As the world is becoming more developed it is expected that the developed
nations’ proportion of earthquake deaths will be reduced.
Figure 11: Fatalities per year based on the HDI of the country at time of event, in order to show the evolution of
fatalities through time.
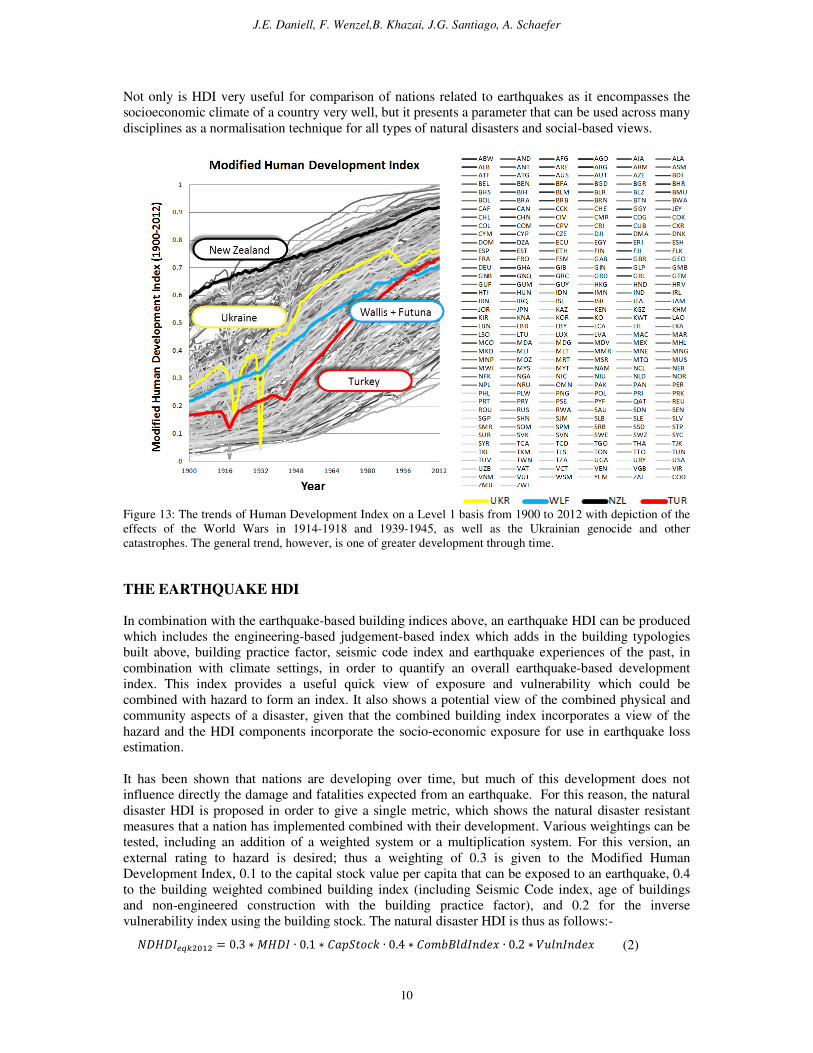
Similarly, when looking at the influence of HDI for one country like Italy, looking at all fatality rates
versus intensity and population rates (Figure 12), there is a clear relationship of HDI influence on
fatalities. HDI however, is simply a robust proxy for development; however, it is not necessarily
linked directly to earthquake processes and physical vulnerability in all cases.
Figure 12: An example of a final set of socio-economic fragility function curves for Italy using HDI. Curves
using combinations of socio-economic parameters explain differences in fatality rates between events.
J.E. Daniell, F. Wenzel,B. Khazai, J.G. Santiago, A. Schaefer
10
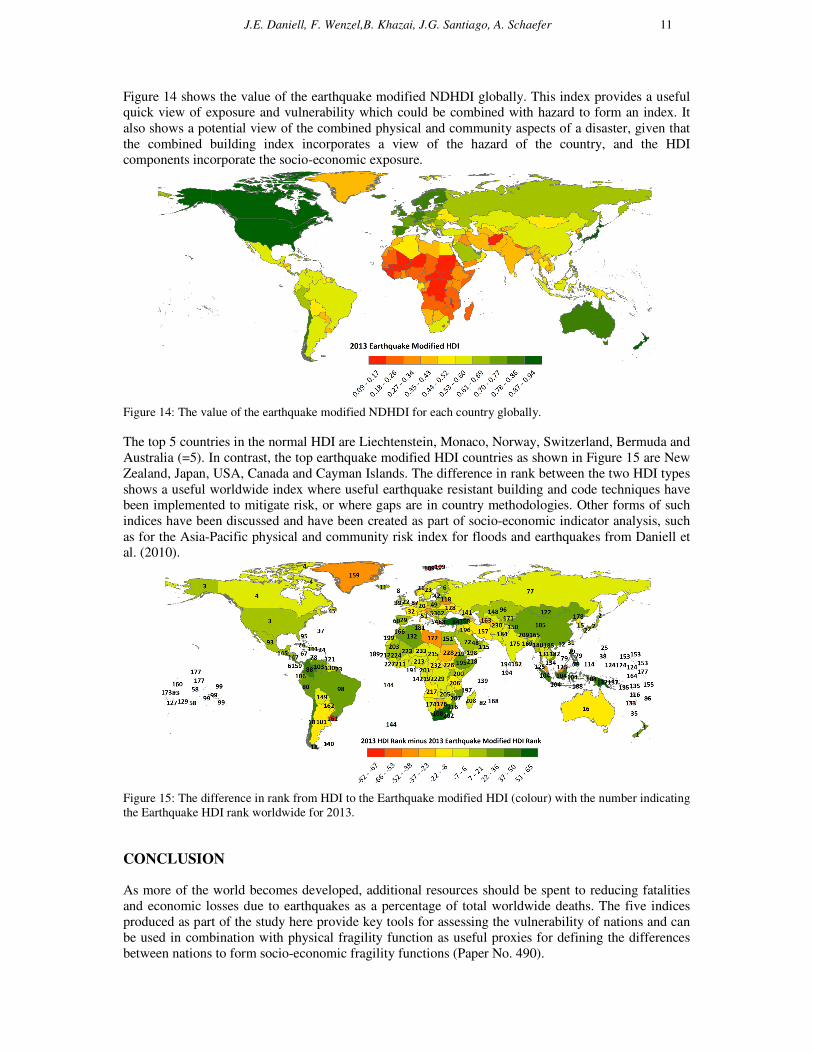
Not only is HDI very useful for comparison of nations related to earthquakes as it encompasses the
socioeconomic climate of a country very well, but it presents a parameter that can be used across many
disciplines as a normalisation technique for all types of natural disasters and social-based views.
Figure 13: The trends of Human Development Index on a Level 1 basis from 1900 to 2012 with depiction of the
effects of the World Wars in 1914-1918 and 1939-1945, as well as the Ukrainian genocide and other
catastrophes. The general trend, however, is one of greater development through time.
THE EARTHQUAKE HDI
In combination with the earthquake-based building indices above, an earthquake HDI can be produced
which includes the engineering-based judgement-based index which adds in the building typologies
built above, building practice factor, seismic code index and earthquake experiences of the past, in
combination with climate settings, in order to quantify an overall earthquake-based development
index. This index provides a useful quick view of exposure and vulnerability which could be
combined with hazard to form an index. It also shows a potential view of the combined physical and
community aspects of a disaster, given that the combined building index incorporates a view of the
hazard and the HDI components incorporate the socio-economic exposure for use in earthquake loss
estimation.
It has been shown that nations are developing over time, but much of this development does not
influence directly the damage and fatalities expected from an earthquake. For this reason, the natural
disaster HDI is proposed in order to give a single metric, which shows the natural disaster resistant
measures that a nation has implemented combined with their development. Various weightings can be
tested, including an addition of a weighted system or a multiplication system. For this version, an
external rating to hazard is desired; thus a weighting of 0.3 is given to the Modified Human
Development Index, 0.1 to the capital stock value per capita that can be exposed to an earthquake, 0.4
to the building weighted combined building index (including Seismic Code index, age of buildings
and non-engineered construction with the building practice factor), and 0.2 for the inverse
vulnerability index using the building stock. The natural disaster HDI is thus as follows:-
%����&'(���� = 0.3 ∗ ���� ∙ 0.1 ∗ *+"�,-#. ∙ 0.4 ∗ *-01234�5467 ∙ 0.2 ∗ 8935�5467 (2)
J.E. Daniell, F. Wenzel,B. Khazai, J.G. Santiago, A. Schaefer 11
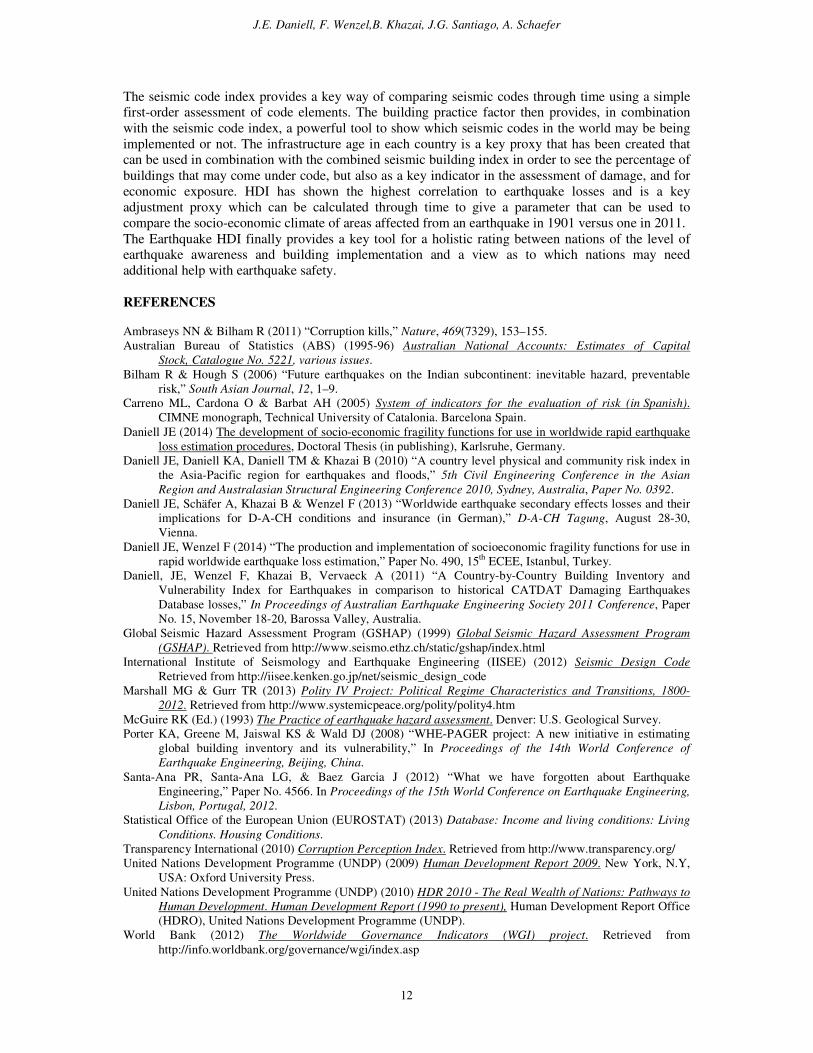
Figure 14 shows the value of the earthquake modified NDHDI globally. This index provides a useful
quick view of exposure and vulnerability which could be combined with hazard to form an index. It
also shows a potential view of the combined physical and community aspects of a disaster, given that
the combined building index incorporates a view of the hazard of the country, and the HDI
components incorporate the socio-economic exposure.
Figure 14: The value of the earthquake modified NDHDI for each country globally.
The top 5 countries in the normal HDI are Liechtenstein, Monaco, Norway, Switzerland, Bermuda and
Australia (=5). In contrast, the top earthquake modified HDI countries as shown in Figure 15 are New
Zealand, Japan, USA, Canada and Cayman Islands. The difference in rank between the two HDI types
shows a useful worldwide index where useful earthquake resistant building and code techniques have
been implemented to mitigate risk, or where gaps are in country methodologies. Other forms of such
indices have been discussed and have been created as part of socio-economic indicator analysis, such
as for the Asia-Pacific physical and community risk index for floods and earthquakes from Daniell et
al. (2010).
Figure 15: The difference in rank from HDI to the Earthquake modified HDI (colour) with the number indicating
the Earthquake HDI rank worldwide for 2013.
CONCLUSION
As more of the world becomes developed, additional resources should be spent to reducing fatalities
and economic losses due to earthquakes as a percentage of total worldwide deaths. The five indices
produced as part of the study here provide key tools for assessing the vulnerability of nations and can
be used in combination with physical fragility function as useful proxies for defining the differences
between nations to form socio-economic fragility functions (Paper No. 490).
J.E. Daniell, F. Wenzel,B. Khazai, J.G. Santiago, A. Schaefer
12
The seismic code index provides a key way of comparing seismic codes through time using a simple
first-order assessment of code elements. The building practice factor then provides, in combination
with the seismic code index, a powerful tool to show which seismic codes in the world may be being
implemented or not. The infrastructure age in each country is a key proxy that has been created that
can be used in combination with the combined seismic building index in order to see the percentage of
buildings that may come under code, but also as a key indicator in the assessment of damage, and for
economic exposure. HDI has shown the highest correlation to earthquake losses and is a key
adjustment proxy which can be calculated through time to give a parameter that can be used to
compare the socio-economic climate of areas affected from an earthquake in 1901 versus one in 2011.
The Earthquake HDI finally provides a key tool for a holistic rating between nations of the level of
earthquake awareness and building implementation and a view as to which nations may need
additional help with earthquake safety.
REFERENCES
Ambraseys NN & Bilham R (2011) “Corruption kills,” Nature, 469(7329), 153–155.
Australian Bureau of Statistics (ABS) (1995-96) Australian National Accounts: Estimates of Capital
Stock, Catalogue No. 5221, various issues.
Bilham R & Hough S (2006) “Future earthquakes on the Indian subcontinent: inevitable hazard, preventable
risk,” South Asian Journal, 12, 1–9.
Carreno ML, Cardona O & Barbat AH (2005) System of indicators for the evaluation of risk (in Spanish).
CIMNE monograph, Technical University of Catalonia. Barcelona Spain.
Daniell JE (2014) The development of socio-economic fragility functions for use in worldwide rapid earthquake
loss estimation procedures, Doctoral Thesis (in publishing), Karlsruhe, Germany.
Daniell JE, Daniell KA, Daniell TM & Khazai B (2010) “A country level physical and community risk index in
the Asia-Pacific region for earthquakes and floods,” 5th Civil Engineering Conference in the Asian
Region and Australasian Structural Engineering Conference 2010, Sydney, Australia, Paper No. 0392.
Daniell JE, Schäfer A, Khazai B & Wenzel F (2013) “Worldwide earthquake secondary effects losses and their
implications for D-A-CH conditions and insurance (in German),” D-A-CH Tagung, August 28-30,
Vienna.
Daniell JE, Wenzel F (2014) “The production and implementation of socioeconomic fragility functions for use in
rapid worldwide earthquake loss estimation,” Paper No. 490, 15th
ECEE, Istanbul, Turkey.
Daniell, JE, Wenzel F, Khazai B, Vervaeck A (2011) “A Country-by-Country Building Inventory and
Vulnerability Index for Earthquakes in comparison to historical CATDAT Damaging Earthquakes
Database losses,” In Proceedings of Australian Earthquake Engineering Society 2011 Conference, Paper
No. 15, November 18-20, Barossa Valley, Australia.
Global Seismic Hazard Assessment Program (GSHAP) (1999) Global Seismic Hazard Assessment Program
(GSHAP). Retrieved from http://www.seismo.ethz.ch/static/gshap/index.html
International Institute of Seismology and Earthquake Engineering (IISEE) (2012) Seismic Design Code
Retrieved from http://iisee.kenken.go.jp/net/seismic_design_code
Marshall MG & Gurr TR (2013) Polity IV Project: Political Regime Characteristics and Transitions, 1800-
2012. Retrieved from http://www.systemicpeace.org/polity/polity4.htm
McGuire RK (Ed.) (1993) The Practice of earthquake hazard assessment. Denver: U.S. Geological Survey.
Porter KA, Greene M, Jaiswal KS & Wald DJ (2008) “WHE-PAGER project: A new initiative in estimating
global building inventory and its vulnerability,” In Proceedings of the 14th World Conference of
Earthquake Engineering, Beijing, China.
Santa-Ana PR, Santa-Ana LG, & Baez Garcia J (2012) “What we have forgotten about Earthquake
Engineering,” Paper No. 4566. In Proceedings of the 15th World Conference on Earthquake Engineering,
Lisbon, Portugal, 2012.
Statistical Office of the European Union (EUROSTAT) (2013) Database: Income and living conditions: Living
Conditions. Housing Conditions.
Transparency International (2010) Corruption Perception Index. Retrieved from http://www.transparency.org/
United Nations Development Programme (UNDP) (2009) Human Development Report 2009. New York, N.Y,
USA: Oxford University Press.
United Nations Development Programme (UNDP) (2010) HDR 2010 - The Real Wealth of Nations: Pathways to
Human Development. Human Development Report (1990 to present), Human Development Report Office
(HDRO), United Nations Development Programme (UNDP).
World Bank (2012) The Worldwide Governance Indicators (WGI) project. Retrieved from
http://info.worldbank.org/governance/wgi/index.asp


