
A b a c u s G u a r d i a n Q u i c k R e f e r e n c e G u i d e ( V e r s i o n 2 . 0 )
Page 1
Abacus Guardian
Quick Reference Guide
Abacus Guardian Systems

A b a c u s G u a r d i a n Q u i c k R e f e r e n c e G u i d e ( V e r s i o n 2 . 0 )
Page 2
Abacus Guardian Icon Key
Home Page Button
Inputs Button – View your inputs data
Group Button – View your groups
Location Button – (Advanced users only)
User Button – View and create users (Advanced users only)
Client Settings Button - (Advanced users only)
System Setting Button - (Advanced users only)
Contact Us Button – Email and phone Abacus Guardian
A b a c u s G u a r d i a n Q u i c k R e f e r e n c e G u i d e ( V e r s i o n 2 . 0 )
Page 3
Abacus Guardian Quick Reference Guide
Index
1. Login to access your data and alarms Page 4
2. Viewing your data Page 5
3. Naming your Sensors Page 8
4. Create a Group of Inputs Page 10
5. Create a Group of Users Page 15
6. Viewing Groups of inputs Page 20
7. Viewing your historical data Page 21
8. View / Download Chart Data Page 25
9. View / Download Raw Data Page 27
10. View all Charts Page 29
11. Printing of Data Page 31
12. Setting alarms Page 32
Entering email addresses
Entering SMS (text) numbers
13. Create a new user (Client Admin Only) Page 36
14. Starting the Alarm Console Page 40

A b a c u s G u a r d i a n Q u i c k R e f e r e n c e G u i d e ( V e r s i o n 2 . 0 )
Page 4
1, Login to access your data and alarms
To login in to the Abacus Guardian System you have to go to the
Abacus Guardian Website:
www.guardianlogon.com
1. Type your user name in the
Box marked User ID
2. Enter your password in the
Box marked Password
The home page is now displayed

A b a c u s G u a r d i a n Q u i c k R e f e r e n c e G u i d e ( V e r s i o n 2 . 0 )
Page 5
2, Viewing your data
1. Click on the Inputs icon
2. Click on the chart icon of the channel that you want to view the data.
The data of the channel (Sensor) selected is now displayed

A b a c u s G u a r d i a n Q u i c k R e f e r e n c e G u i d e ( V e r s i o n 2 . 0 )
Page 6
The chart start and finish time of the chart is displayed.
Chart data is displayed
Min & Max temperature for the chart period are displayed
To view different time frames, select from the chart date range icons at the top of the page.

A b a c u s G u a r d i a n Q u i c k R e f e r e n c e G u i d e ( V e r s i o n 2 . 0 )
Page 7
Chart Icon Key
Today’s Data
Yesterday’s Data
This Weeks Data
Last Weeks Data
Last 7 Days Data
Last 30 Days Data
Last 90 Days Data
Last 12 Hours Data
Last 6 Hours Data
Last 3 Hours Data

A b a c u s G u a r d i a n Q u i c k R e f e r e n c e G u i d e ( V e r s i o n 2 . 0 )
Page 8
3, Name a Input (sensor) location (Manager level or above only)
1. Click on the inputs icon
2. Click on the channel You want to rename
A b a c u s G u a r d i a n Q u i c k R e f e r e n c e G u i d e ( V e r s i o n 2 . 0 )
Page 9
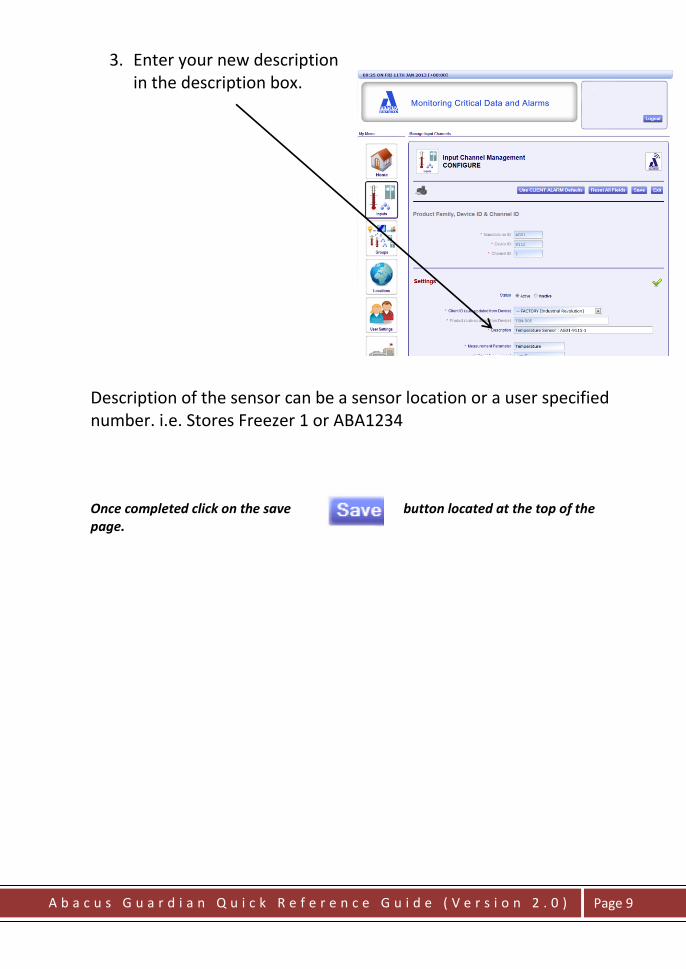
3. Enter your new description in the description box.
Description of the sensor can be a sensor location or a user specified number. i.e. Stores Freezer 1 or ABA1234 Once completed click on the save button located at the top of the page.

A b a c u s G u a r d i a n Q u i c k R e f e r e n c e G u i d e ( V e r s i o n 2 . 0 )
Page 10
4, Create Groups of Inputs i.e all sensors in a walk in cold room.
1. Tick the Group icon
2. Tick the create new icon

A b a c u s G u a r d i a n Q u i c k R e f e r e n c e G u i d e ( V e r s i o n 2 . 0 )
Page 11
3. Select your client group
4. Name your Group
i.e. Cold Store 1
Scroll down the page
5. Click on the “Input Items
in Group” dropdown box.

A b a c u s G u a r d i a n Q u i c k R e f e r e n c e G u i d e ( V e r s i o n 2 . 0 )
Page 12
6. Select the input that you want to add to the new group.
7. Click on the “INPUT Items in Group” add icon

A b a c u s G u a r d i a n Q u i c k R e f e r e n c e G u i d e ( V e r s i o n 2 . 0 )
Page 13
The system now reports that the input has been created in the group.
Scroll down the page The input is now listed

A b a c u s G u a r d i a n Q u i c k R e f e r e n c e G u i d e ( V e r s i o n 2 . 0 )
Page 14
8. Repeat steps 6 & 7 until you have added all the required inputs for the group.
9. Once completed click on the save icon.

A b a c u s G u a r d i a n Q u i c k R e f e r e n c e G u i d e ( V e r s i o n 2 . 0 )
Page 15
5, Create Groups of Users i.e Alarm Group 1 to receive sms alerts
1. Tick the Group icon
2. Tick the create new icon

A b a c u s G u a r d i a n Q u i c k R e f e r e n c e G u i d e ( V e r s i o n 2 . 0 )
Page 16
3. Select your client group
4. Name your Group
i.e. Weekend Callout
Scroll down the page
5. Click on the “USER Items
in Group” dropdown box.

A b a c u s G u a r d i a n Q u i c k R e f e r e n c e G u i d e ( V e r s i o n 2 . 0 )
Page 17
6. Select the users that you want to add to the new group.
7. Click on the “USER Items in Group” add icon

A b a c u s G u a r d i a n Q u i c k R e f e r e n c e G u i d e ( V e r s i o n 2 . 0 )
Page 18
The system now reports that the input has been created in the group.
Scroll down the page The user is now listed

A b a c u s G u a r d i a n Q u i c k R e f e r e n c e G u i d e ( V e r s i o n 2 . 0 )
Page 19
8. Repeat steps 6 & 7 until you have added all the required inputs for the group.
9. Once completed click on the save icon.

A b a c u s G u a r d i a n Q u i c k R e f e r e n c e G u i d e ( V e r s i o n 2 . 0 )
Page 20
6, Viewing Groups of Inputs
1. Click on the Groups icon
2. Click on the inputs icon

A b a c u s G u a r d i a n Q u i c k R e f e r e n c e G u i d e ( V e r s i o n 2 . 0 )
Page 21
7, To View Historical Data 1. Click on the Inputs icon
2. Click on the chart icon of the channel that you want to view the data.

A b a c u s G u a r d i a n Q u i c k R e f e r e n c e G u i d e ( V e r s i o n 2 . 0 )
Page 22
3. Tick the historical icon
4. Click on the calendar icon
5. Select the date range required
A b a c u s G u a r d i a n Q u i c k R e f e r e n c e G u i d e ( V e r s i o n 2 . 0 )
Page 23
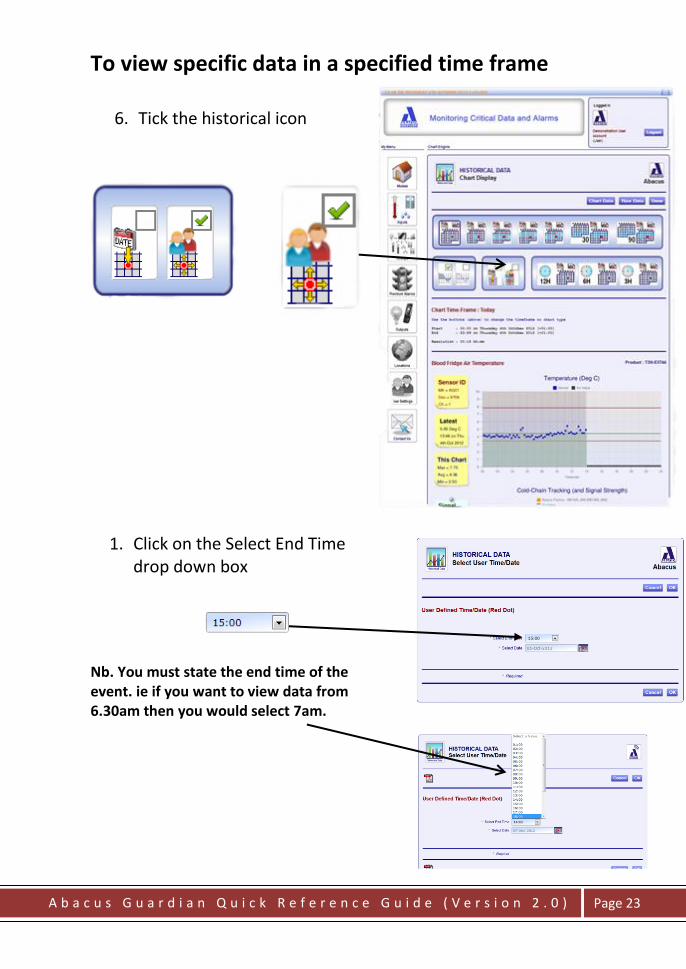
To view specific data in a specified time frame
6. Tick the historical icon
1. Click on the Select End Time drop down box
Nb. You must state the end time of the event. ie if you want to view data from 6.30am then you would select 7am.

A b a c u s G u a r d i a n Q u i c k R e f e r e n c e G u i d e ( V e r s i o n 2 . 0 )
Page 24
2. The system now displays the chart image for the time period selected. i.e. 24 hours, 12 hours, 6 hours or 3 hours.
Thick blue line outline gives visual indication.
Start and finish time of the chart is is indicated here.
Select the 3H icon
The graph is now displayed. The chart Time Frame & start and stop time is displayed.

A b a c u s G u a r d i a n Q u i c k R e f e r e n c e G u i d e ( V e r s i o n 2 . 0 )
Page 25
8, Viewing/Downloading the Chart Data
1. Click on the Chart Data Icon
2. A new page is
displayed with the chart data
Time frame and data Resolution is displayed
Average, Minimum & Maximum Temperature For the chart period is displayed

A b a c u s G u a r d i a n Q u i c k R e f e r e n c e G u i d e ( V e r s i o n 2 . 0 )
Page 26
3. Click the Download
Date Icon
4. Choose a program to open or save the data.

A b a c u s G u a r d i a n Q u i c k R e f e r e n c e G u i d e ( V e r s i o n 2 . 0 )
Page 27
9, Viewing/Downloading the Raw Data
1. Click on the Raw Data Icon
2. A new page is displayed with the chart data
Time frame and data Resolution is displayed
Average, Minimum & Maximum Temperature For the chart period is displayed All data received from the sensors is displayed with a time stamp and temperature reading

A b a c u s G u a r d i a n Q u i c k R e f e r e n c e G u i d e ( V e r s i o n 2 . 0 )
Page 28
3. Click the Download
Data Icon
4. Choose a program to open or save the data.

A b a c u s G u a r d i a n Q u i c k R e f e r e n c e G u i d e ( V e r s i o n 2 . 0 )
Page 29
10, View all Charts - The system allows you to view all
charts created by your inputs on one screen.
1. Click on the Inputs Icon (Groups icon if viewing a group of sensors)
2. Click on the All chart Icon

A b a c u s G u a r d i a n Q u i c k R e f e r e n c e G u i d e ( V e r s i o n 2 . 0 )
Page 30
All chart data is now displayed - Scroll the page down to view all of the inputs.

A b a c u s G u a r d i a n Q u i c k R e f e r e n c e G u i d e ( V e r s i o n 2 . 0 )
Page 31
11, Printing of Data
1. Once you are on the screen that you want to print click on the PRINT icon
2. Check that your current printer is listed in the printer box. Click the print button

A b a c u s G u a r d i a n Q u i c k R e f e r e n c e G u i d e ( V e r s i o n 2 . 0 )
Page 32
12, Setting an Alarm Parameter (Manager level or above only)
1. Click on the inputs icon
2. Click on the channel you want to set an alarm parameter
Scroll down the page until you see the Missing Sensor settings

A b a c u s G u a r d i a n Q u i c k R e f e r e n c e G u i d e ( V e r s i o n 2 . 0 )
Page 33
Missing sensor alarm – this sends an alarm if the sensor doesn’t report in to the system for the specified time. This alerts you to flat batteries or power failures of the HUB or GPRS (mobile phone) networks.
Warning Delay indicates the length of time before the system will flag an alarm.
Alert Delay indicates the length of time before the alarm is sent.
If you want to send missing sensor alert then tick the enable button
3. Add a user’s (Or group of users) phone number(s) to send a sms (text) in the event of a missing sensor
4. Click the enable button.
5. Add a user’s (Or group of users) email addresses to send a email in the event of a missing sensor
6. Click the enable button
Once completed click on the save button located at the top of the page.
Scroll down the page until you see the Standard Alarm settings

A b a c u s G u a r d i a n Q u i c k R e f e r e n c e G u i d e ( V e r s i o n 2 . 0 )
Page 34
Standard Alarm – this sends an alarm when the channel goes outside of its
alarm parameters
1. Hi Alarm Threshold indicates when the alarm will be activated.
2. Hi Reset Threshold indicates when the alarm will reset once it drops below this figure
3. Lo Reset Threshold indicates when the alarm will reset once it goes above this figure
4. Lo Alarm Threshold indicates when the alarm will be activated.
5. Detection Rate indicates the time delay.
6. Add a user’s (Or group of users) phone number(s) to send a sms (text) in the event of a missing sensor
7. Click the enable button.
8. Add a user’s (Or group of users) email addresses to send a email in the event of a missing sensor
9. Click the enable button
Once completed click on the save button located at the top of the page.

A b a c u s G u a r d i a n Q u i c k R e f e r e n c e G u i d e ( V e r s i o n 2 . 0 )
Page 35
Tim
e
3 Minutes MAX
Le
ss T
han
Ala
rm D
ela
y
In A
larm
Text
& E
ma
il
3 Minutes MAX
3 Minutes MAX
Mo
re T
ha
nA
larm
De
lay
Ala
rm T
hre
sho
ld
Ala
rm R
ese
t
3 Minutes MAX
3 Minutes MAX
3 Minutes MAX
~~
~~
Au
to R
ese
tto
No
rma
lN
orm
al
Au
to A
cce
pt
No
rma
l
Au
to R
ese
tto
No
rma
l
Temperature
> A
larm
Thr
esh
old
< A
larm
De
lay
> A
larm
Thr
esh
old
< A
larm
De
lay
12
34
Ev
en
t 1
Ev
en
t 2
Ev
en
t 3
Ev
en
t 4
Ev
en
t 5
Ev
en
t 6
Tem
pe
ratu
re a
bove
Ala
rm T
hre
sh
old
Tem
pe
ratu
re f
alls b
elo
w A
larm
Re
se
t w
ith
in A
larm
De
lay
Ala
rm D
ela
y E
xce
ed
ed
Ala
rm A
uto
Accep
ted
Tem
pe
ratu
re f
alls b
elo
w A
larm
Re
se
t
Tem
pe
ratu
re a
bove
Ala
rm T
hre
sh
old
56
Gua
rdia
n S
tand
ard
Ala
rms
Me
asu
red
Te
mp
era
ture

A b a c u s G u a r d i a n Q u i c k R e f e r e n c e G u i d e ( V e r s i o n 2 . 0 )
Page 36
13. Creating a New User (Client Admin Privilege only)
Click on the User Settings Icon
Click on Create New Icon

A b a c u s G u a r d i a n Q u i c k R e f e r e n c e G u i d e ( V e r s i o n 2 . 0 )
Page 37
Click on the Client ID dropdown box
Select your company Click on the Role dropdown box
Select the role (access level) User – Can only view data. Manager - Access and change all
data including channel set points and sms & email addresses.
Client Admin As above but can also create new users and reset users that have
been locked out. Create a new user ID (name) Must be less than 12 characters Repeat the new user name
Once completed click on the save button located at the top of the page.

A b a c u s G u a r d i a n Q u i c k R e f e r e n c e G u i d e ( V e r s i o n 2 . 0 )
Page 38
1. Now enter a description of the new
user. i.e. Job Title
2. Enter the new user’s email address. The system will send alerts to this email address (if selected in the input section) 3. Enter the new user’s mobile phone number. i.e. +447510665810 (leave out the 0 of the user number) The system will send alerts to this phone number (if selected in the input section)
4. Enter a password – The user will need to enter this to log on to the system. 5. Confirm the password.
6. Enter a password hint – This will be emailed to the user on request at the
log on page. SCROL DOWN THE PAGE
Select time zone to Automatic Select the manual region as required Set Manual Daylight Saving to ‘Off’

A b a c u s G u a r d i a n Q u i c k R e f e r e n c e G u i d e ( V e r s i o n 2 . 0 )
Page 39
SCROL DOWN THE PAGE
Scopes for MENU Buttons This section give you the ability to set what the user can see on the system. i.e. individual inputs (sensors) or all inputs.
Scope for CLIENT Menu Using the dropdown box set this to your company. Scope for USER Menu Using the dropdown box set this to SELF (Default). Scope for LOCATION Menu Use the dropdown box. Set this to your company. Scope for INPUT Menu Use the dropdown box. Set the inputs that you want the new user to view. You have three options;
1. An individual input 2. All inputs within your company 3. A group of inputs i.e a freezer or fridge with several inputs. (See create
groups section for instructions) Scope for OUTPUT Menu Use the dropdown box. Set this to your company. Scope for PREMIUM ALARM Menu Using the dropdown box enables you to set this to a template that you have
previously configured. (See create premium alarms section for instructions)
Scope for GROUP Menu - This gives the user the ability to view and edit group of
inputs that have been created (permission should only be given to authorised
personnel)
Once completed click on the save button located at the top of the page.

A b a c u s G u a r d i a n Q u i c k R e f e r e n c e G u i d e ( V e r s i o n 2 . 0 )
Page 40
14, Starting an Alarm Console
1. Click on the Inputs or Groups Icon
NB Click on the Inputs Icon if you want all inputs displayed. Click on the Group icon if you want your individual Groups displayed.
2. Click on the Alarm Con Icon

A b a c u s G u a r d i a n Q u i c k R e f e r e n c e G u i d e ( V e r s i o n 2 . 0 )
Page 41
3. Click on the Last Update Column – The inputs will now automatically go to the top position every time the data is updated.

A b a c u s G u a r d i a n Q u i c k R e f e r e n c e G u i d e ( V e r s i o n 2 . 0 )
Page 42
USERNAMES PASSWORD

A b a c u s G u a r d i a n Q u i c k R e f e r e n c e G u i d e ( V e r s i o n 2 . 0 )
Page 43
NOTES

A b a c u s G u a r d i a n Q u i c k R e f e r e n c e G u i d e ( V e r s i o n 2 . 0 )
Page 44
Abacus Guardian Limited
13a Old Bridge Way
Shefford
Bedfordshire
SG17 5HQ
Telephone: 01462 638200
Faxs: 01462 638201
email: [email protected]
website: abacusguardian.com
Data Logging and Alarm
Specialists


