
Access Bank Plc
Consolidated and separate financial statementsFor the year ended 31 December 2017
Access Bank Plc
Consolidated and separate financial statements for the yearended
31 December 2017

Access Bank Plc
Consolidated and separate financial statements
For the year ended 31 December 2017
ACCESS BANK PLCIndex to the consolidated financial statementsFor the year ended 31 December 2017
Note Page Note Page
i Corporate information 3 13 Other operating income 175
ii Directors' report 4 14 Personnel expenses 175
iii Customer complaints 8 15 Other operating expenses 177
iv Corporate Governance report 9 16 Income tax expense recognized in the profit or loss 178
v Statement of Directors' responsibilities 33 17 Basic earnings per share 179
vi Report of the Statutory Audit Committee 34 18 Cash and balances with banks 179
vii Risk management framework 35 19 Investment under management 179
viii Independent auditors report 57 20 Non pledged trading assets 179
ix Consolidated statement of comprehensive income 64 21 Derivative financial instruments 180
x Consolidated statement of financial position 65 22 Loans and advances to banks 180
xi Consolidated statement of changes in equity 66 23 Loans and advances to customers 181
xii Consolidated statement of cashflows 68 24 Pledged assets 183
xiii Notes to the financial statements 25 Investment securities 183
1 General information 69 26 Other assets 184
2
Statement of compliance with international financial
reporting standards. 69 27 Investment in subsidiary 186
3 Summary of significant accounting policies 69 28 Property and equipment 190
3.1 Basis of preparation 69 29 Intangible assets 192
3.2 Changes in accounting policy and disclosures 70 30 Deferred tax assets and liabilities 194
3.3 Basis of consolidation 76 31 Assets classified as held for sale 195
3.4 Segment reporting 78 32 Deposits from financial institutions 195
3.5 Foreign currency translation 78 33 Deposits from customers 195
3.6 Operating income 79 34 Other liabilities 195
3.7 Lease payments 80 35 Debt securities issued 196
3.8 Income tax 80 36 Interest bearing borrowings 197
3.9 Financial assets and liabilities 81 37 Retirement benefit obligations 199
3.10 Property and equipment 88 38 Capital and reserves 201
3.11 Intangible assets 89 39 Contingencies 2043.12 Leases 89 40 Cash and cash equivalents for cashflow purposes 2043.13 Impairment of non-financial assets 90 41 Contraventions of the Banks and Other
Financial Institutions Act of Nigeria and
CBN circulars
205
3.14 Discontinued operation 90 42 Events after the reporting date 205
3.15 Non-current asset (or disposal groups) held for sale 91 43 Related parties 205
3.16 Provisions 91 44 Director-related exposures 208
3.17 Financial guarantee 91 45 Non-audit services 209
3.18 Employee benefit 91 Other national disclosures:
3.19 Share capital and reserves 93 Value added statement 210
3.20 Levies 94 Five-year financial summary 211
4 Use of estimates and jugdements 95
5 Financial risk management 110
6 Capital management 169
7 Operating segment 170
8 Net interest income 174
9 Charge on financial and non-financial assets 174
10 Fee and commission income 174
11 Net gains on financial instruments classified as held for
trading
175
12 Net foreign exchange income or loss 175

Access Bank Plc
Consolidated and separate financial statementsFor the year ended 31 December 2017
Directors, officers and professional advisors
Directors
Mosun Belo-Olusoga Chairman/Non-Executive Director
Herbert Onyewumbu Wigwe Group Managing Director/Executive Director
Obinna David Nwosu* Group Deputy Managing Director/Executive Director
Roosevelt Michael Ogbonna** Group Deputy Managing Director/Executive Director
Anthonia Olufeyikemi Ogunmefun Non-Executive Director
Paul Usoro, SAN Non-Executive Director
Emmanuel Chiejina****** Non-Executive Director
Abba Mamman Tor Habib Non-Executive Director
Ernest Chukwuka Ndukwe Independent Non-Executive Director
Ajoritsedere Josephine Awosika Independent Non-Executive Director
Mr. Adeniyi Adekoya**** Independent Non-Executive Director
Iboroma Akpana***** Independent Non-Executive Director
Victor Okenyenbunor Etuokwu Executive Director
Ojinika Nkechinyelu Olaghere Executive Director
Titi Osuntoki Executive Director
Gregory Jobome*** Executive Director
Hadiza Ambursa******* Executive Director
* Resigned effective April 30, 2017
** Appointed GDMD effective April 18, 2017
*** Appointed effective January 17, 2017
**** Appointed effective March 7, 2017
***** Appointed effective March 8, 2017
****** Retired effective June 23, 2017
******* Appointed effective December 28, 2017
Company Secretary
Mr Sunday Ekwochi
Corporate Head Office
Access Bank Plc
Plot 999c, Danmole Street,
Victoria Island, Lagos.
Telephone: +234 (01) 4619264 - 9
+234 (01) 2773399-99
Email: [email protected]
Website: www.accessbankplc.com
Company Registration Number: RC125 384
FRC Number: FRC/2012/0000000000271
Independent Auditors
PricewaterhouseCoopers
Landmark Towers, 5b Water Corporation way, Oniru
Victoria Island, Lagos
Telephone: (01) 271 1700
Website: www.pwc.com/ng
Actuaries
Alexander Forbes Consulting Actuaries Nig. Ltd
Rio Plaza, 2nd Floor , Plot 235, Muri Okunola Street
Victoria Island, Lagos
Telephone: (01) 271 1081
FRC Number: FRC/2012/0000000000504
Registrars
United Securities Limited
10 Amodu Ojikutu Street
Victoria Island, Lagos
Telephone: +234 01 730898
+234 01 730891
This is the list of Directors who served in the entity during the year and up to the date of this report
3

Access Bank Plc
Consolidated and separate financial statements
For the year ended 31 December 2017
Group Group Bank BankDec-17 Dec-16 Dec-17 Dec-16
In thousands of Naira
Gross earnings 459,075,779 381,320,783 398,161,575 331,000,972
Profit before income tax 80,072,482 90,339,456 67,043,501 80,579,576Income tax expense (18,081,628) (18,900,109) (13,804,679) (16,553,441)Profit for the year 61,990,853 71,439,347 53,238,822 64,026,135Other comprehensive income 28,999,933 32,060,673 12,352,975 12,653,178Total comprehensive income for the year 90,990,786 103,500,020 65,591,796 76,679,312
Non-controlling interest 880,879 2,258,752 - -90,109,907 101,241,268 65,591,796 76,679,312
Group Group Bank BankDec-17 Dec-16 Dec-17 Dec-16
In thousands of NairaEarnings per share - Basic (k) 218 250 184 221Dividend (paid):Interim dividend paid 7,231,993 7,231,993 7,231,993 7,231,993
Final dividend for 2015 paid in 2016 and for 2016 paid 2017 respectively 11,571,189 8,678,391 11,571,189 8,678,391Proposed final dividend declared in 2017 to be paid in 2018 11,571,189 11,571,189 11,571,189 11,571,189
Group Group Bank BankIn thousands of Naira Dec-17 Dec-16 Dec-17 Dec-16
515,447,409 454,494,580 469,491,097 421,678,620
Total impaired loans and advances 101,349,866 36,613,540 82,496,444 28,260,557
Total impaired loans and advances to gross risk assets (%) 4.76% 1.97% 4.28% 1.66%
Interim dividend
Proposed dividend
The Board of Directors proposed and paid interim dividend of 25Kobo per ordinary shares (HY2016: 25K) each payable to shareholders on the register of shareholding at the closure date.Withholding Tax was be deducted at the time of payment.
The Board of Directors proposed a final dividend of 40 kobo per ordinary share for the year ended December 31, 2017 (December 2016: 40K per ordinary share ). Withholding tax will bededucted at the time of payment.
Highlights of the Group’s operating results for the year are as follows:
Profit attributable to equity holders of the Bank
Total equity
The Bank's principal activities incude the provision of money market products and services, retail banking, granting of loans and advances, equipment leasing, corporate finance and foreignexchange operations.
The Bank has the following international banking subsidiaries: Access Bank (Gambia) Limited, Access Bank (Sierra Leone) Limited, Access Bank (Zambia) Limited, The Access Bank (UK)Limited, Access Bank (Ghana) Plc, Access Bank Rwanda and Access Bank (D.R. Congo). The Bank also has Access Finance BV, an offshore Special Purpose Vehicle for the issuance of theU.S.$350,000,000, 7.25 Per Cent Guaranteed Notes Due 2017 guaranteed by the Bank. During the year, the Bank redeemed the outstanding USD237,003,000 of the Note (see note 35). TheBank also operates a Representative office in China, UAE and Lebanon. The Access Bank (UK) Limited operates a branch in United Arab Emirates (UAE).
The financial results of all operating subsidiaries have been consolidated in these financial statements.
Operating results
Directors’ Report
For the year ended 31 December, 2017
The Directors have pleasure in presenting their report on the affairs of Access Bank Plc (the “Bank”) together with its subsidiaries (the “Group”), the Group and the Bank Audited FinancialStatements with Auditor’s Report for the year ended 31 December 2017.
Legal form and principal activityThe Bank was incorporated as a private limited liability company on 8 February 1989 and commenced business on 11 May 1989. The Bank was converted to a public limited liability companyon 24 March 1998 and its shares were listed on the Nigerian Stock Exchange on 18 November 1998. The Bank was issued a universal banking license by the Central Bank of Nigeria on 5February 2001.
4

Access Bank Plc
Consolidated and separate financial statements
For the year ended 31 December 2017
Directors and their interests
Number of Ordinary Shares of 50k each held as at
Direct Indirect Direct IndirectM. Belo-Olusoga- Chairman 3,604,838 - 3,604,838 -H. O. Wigwe - GMD/CEO 206,231,713 2,480,582,395 206,231,713 2,480,582,395O. D Nwosu - GDMD* 30,004,585 - 30,004,585 -R. C. Ogbonna - GDMD** 28,000,558 - 28,000,558 -E. Chiejina****** 9,441,005 - 9,441,005 -K. Ogunmefun - 1,457,263 - 1,309,763V.O. Etuokwu 13,579,889 - 13,579,889 -O.N. Olaghere - ED 19,451,332 - 19,451,332 -T. Osuntoki - ED 28,728,854 - 28,728,854 -P. Usoro 1,209,634 - 1,209,634 -A. Awosika - - - -E. Ndukwe 700,000 - 700,000 -A. Mamman Tor Habib - - - -
G. Jobome - ED*** 5,264,346 - - -
I. T Akpana**** 314,996 - - -
A. A. Adekoya***** 58,790 - - -
H. Ambursa *******
* Resigned effective April 30, 2017** Appointed GDMD effective April 18, 2017*** Appointed effective January 17, 2017**** Appointed effective March 8, 2017***** Appointed effective March 7, 2017****** Retired effective June 23, 2017******* Appointed effective November 28, 2017
The indirect holdings relate to the holdings of the underlisted companiesDec-17 Dec-16
H.O. Wigwe United Alliance Company of Nig. Ltd 1,075,468,437 1,075,468,437Trust and Capital Limited 1,405,113,958 1,405,113,958
A.O. Ogunmefun L.O.C Nominees, Limited 1,457,263 1,457,263
Directors’ interest in contracts
Related director Interest in entity Name of company Services to the BankMrs. Mosun Belo- Olusoga Director/Shareholder The KRC Ltd. Training servicesMr. Paul Usoro Director Airtel Nigeria Ltd Mobile telephoneMr. Paul Usoro Shareholder Paul Usoro & Co Legal Advisory ServiceMr. Herbert Wigwe Shareholder Coronation Securities Ltd. Brokerage servicesMr. Herbert Wigwe Shareholder Wapic Insurance Plc Insurance ServicesMrs. Ojinika Olaghere Shareholder Wapic Insurance Plc Insurance ServicesMr. Victor Etuokwu Director Unified Payment Service Limited Payment ServicesMr. Victor Etuokwu Director E-Tranzact Plc Electronic BankingDr. Gregory Jobome Director CRC Credit Bureau Limited Credit Reference ServicesMs. Hadiza Ambursa Shareholder Merlion Limited Supply of Corporate Gifts
Analysis of shareholding:The shareholding pattern of the Bank as at 31 December 2017 was as stated below:
31 December 2017Range Number of
Shareholders% of Shareholders Number of shares held % of Shareholders
Domestic Shareholders1 - 1,000 409,137 50.42 65,414,590 0.231,001 - 5,000 248,511 30.63 549,191,711 1.905001 - 10,000 64,519 7.95 442,048,836 1.5310,001 - 50,000 68,729 8.47 1,381,041,857 4.7750,001- 100,000 10,251 1.26 743,235,420 2.57100,001 - 500,000 7,460 0.92 1,492,453,851 5.16500,001 - 1,000,000 839 0.10 603,331,724 2.091,000,001 - 5,000,000 725 0.09 1,433,699,206 4.965,000,001 - 10,000,000 100 0.01 709,612,638 2.4510,000,001 and above 152 0.02 19,137,906,166 66.16
810,423 99.88 26,557,935,999 91.81
Foreign Shareholders1 - 1,000 237 0.03 74,058 0.001,001 - 5,000 231 0.03 601,857 0.005001 - 10,000 116 0.01 859,059.00 0.0010,001 - 50,000 275 0.03 6,423,779 0.0250,001- 100,000 57 0.01 4,013,961.00 0.01100,001 - 500,000 25 0.00 4,276,094 0.01500,001 - 1,000,000 4 0.00 2,314,669.00 0.011,000,001 - 5,000,000 3 0.00 8,473,930 0.035,000,001 - 10,000,000 1 0.00 9,485,549.00 0.0310,000,001 and above 10 0.00 2,333,512,676 8.07
959 0.12 2,370,035,632 8.19
Total 811,382 100.00 28,927,971,631 100.00
The Directors who served during the year, together with their direct and indirect interests in the issued share capital of the Bank as recorded in the Register of Directors' Shareholding and asnotified by the Directors for the purposes of Sections 275 and 276 of the Companies and Allied Matters Act and listing requirements of the Nigerian Stock Exchange is noted below:
31-Dec-17 31-Dec-16
In accordance with the provisions of Section 277 (1) and (3) of the Companies and Allied Matters Act of Nigeria, the Board has received a declaration of Interest from the under-listedDirectors in respect of the companies (vendors to the Bank) set against their respective names.
5

Access Bank Plc
Consolidated and separate financial statements
For the year ended 31 December 2017
The shareholding pattern of the Bank as at 31 December 2016 is as stated below:31 December 2016
Range Number ofShareholders
% of Shareholders Number of shares held % of Shareholders
Domestic Shareholders1 - 1,000 311,899 38.11% 291,947,697 1.01%1,001 - 5,000 348,102 42.54% 325,834,483 1.13%5001 - 10,000 65,876 8.05% 450,728,829 1.56%10,001 - 50,000 70,694 8.64% 1,419,116,782 4.91%50,001- 100,000 10,665 1.30% 770,033,755 2.66%100,001 - 500,000 4,960 0.61% 1,270,715,195 4.39%500,001 - 1,000,000 4,016 0.49% 1,028,674,206 3.56%1,000,001 - 5,000,000 701 0.09% 1,793,551,064 6.20%5,000,001 - 10,000,000 234 0.03% 597,850,355 2.07%10,000,001 and above 176 0.02% 17,539,853,849 60.63%
817,323 99.88% 25,488,306,214 88.11%
Foreign Shareholders1 - 1,000 224 0.03% 322,241 0.00%1,001 - 5,000 250 0.03% 359,645 0.00%5001 - 10,000 114 0.01% 842,655.00 0.00%10,001 - 50,000 292 0.04% 7,013,024 0.02%50,001- 100,000 60 0.01% 4,209,366.00 0.01%100,001 - 500,000 21 0.00% 4,802,620 0.02%500,001 - 1,000,000 17 0.00% 3,887,835.13 0.01%1,000,001 - 5,000,000 3 0.00% 7,235,786 0.03%5,000,001 - 10,000,000 1 0.00% 2,411,928.75 0.01%10,000,001 and above 13 0.00% 3,408,580,316 11.78%
995 0.12% 3,439,665,417 11.89%
Total 818,318 100% 28,927,971,631 100%
Shareholding Analysis as at 31 December 2017
Type of Shareholding Holdings Holding %Retail investors 11,492,681,982 39.73%
Domestic institutional investors 17,146,566,231 59.27%
Foreign institutional investors 267,380,817 0.92%
Government related entities 21,342,601 0.07%28,927,971,631 100%
Substantial interest in shares
Number of shares held % of shareholding Number of shares held % of shareholding
Stanbic Nominees Nigeria Limited* 5,265,792,806 18.20% 4,622,161,946 16.00%
Donations and charitable gifts
S/N Beneficiary Purpose Amount
1 The Africa Center Donation to Africa Centre 150,000,0002 Access Conference and Youth Initiative Access Conference and Youth Initiative 125,000,0003 Fire Diasaster Victims Donations to Fire Diasaster Victims 100,000,0004 National Youth Service Corps Donation to National Youth Service Corps 77,798,7925 Green Impact Donation in favour Of Green Impact Initiative 27,063,3666 Brains Initiative Donation for 2017 Brains Initiative 14,525,0007 United Nations Global Compact Sponsorship of 15th anniversary of United Nations Global Compact 12,250,0008 United Nations Environment Programme Sponsorship of United Nations Environment Programme 10,890,0009 Nigerian Football Federation Donation to Nigerian Football Federation 10,000,000
10 Association of Senior Staff of Banks Insurance & Financial Instituitions (ASSBIFI)Sponsorship of Capacity Building Programme 10,000,00011 Nigerian Economic Summit Sponsorship of 23rd Nigerian Economic Summit 5,000,00012 Hacey Health Initiative Contribution towards World Health day 2017 5,000,00013 Hacey Health Initiative Contribution towards Launch of Sexual Violence Response Platform 4,000,00014 Nirvana Initiative Contribution towards World Tuberculosis Day 4,000,00015 COPE Initiative Contribution towards Breast Cancer Screening 3,000,00016 CSR-in-Action Sponsorship Of 6th Sitei Conference 2,000,00017 Dreamland Foundation Donation to Dreamland Foundation for Economic Enpowerment 1,000,00018 Center for Sustainable Development Donation to Centre of Ethics Colloquim 1,000,00019 Africa Clean Up Initiative Donation to Africa Clean Up Initiative 1,000,00020 Risk Managers Association of Nigeria (RIMAN) Sponsorship Of RIMAN Annual Conference 1,000,00021 Women in Management and Business (WIMBIZ) Sponsorship Of WIMBIZ 16th Annual Conference 1,000,00022 United Nations Urban Development Sponsorship Of UN's Urban Development on World Habitat Day 1,000,00023 CVL Widow Support Scheme Donation to CVL Widow Support Centre 500,000
567,027,158
Property and equipmentInformation relating to changes in property and equipment is given in Note 28 to the financial statements. In the Directors’ opinion, the fair value of the Group’s property and equipment is notless than the carrying value in the financial statements.
According to the register of members at 31 December 2017, the following shareholders held more than 5% of the issued share capital of the Bank as follows:
31 December 2017 31 December 2016
*Stanbic Nominees held the shares as custodian for various investors. Stanbic Nominees does not exercise any right over the underlying shares. All the rights resides with the various investorson behalf of whom Stanbic Nominees carries out the custodian services.
The Bank identifies with the aspirations of the community and the environment in which it operates. The Bank made contributions to charitable and non-charitable organisations amounting toN567,027,158 (December 2016: N285,339,153) during the year, as listed below:
6

Access Bank Plc
Consolidated and separate financial statements
For the year ended 31 December 2017
Human resources
(i) Report on Diversity in employment
(a) Composition of employees by gender
1,4341,756
(b) Board Composition By Gender
610
( c) Top Management (Executive Director To CEO) Compositon By Gender
38
(d) Top Management (AGM To GM) Compositon By Gender
1552
(ii) Employment of disabled persons
(iii) Health, safety and welfare of employees
(iv) Employee involvement and training
(v) Statement of commitment to maintain positive work environment
Credit Ratings
Long Term Local Credit RatingsLong Term Date
Standard & Poor's BBB Jun-17
FitchRatings A Jul-17
Agusto & Co AA- Jun-17
Moody's Aa2 May-17
Long Term Counterparty Credit RatingsLong Term
Standard & Poor's B Jun-17
FitchRatings B Jul-17
Moody's B1 May-17
* FitchRating was upgraded to A+ on the 31 January 2018
More information on the rating reports can be obtained at https://www.accessbankplc.com/credit-rating
Audit committee
1 Mr. Henry Omatshola AraghoOmatsola Aragho - Shareholder Chairman2 Mr Emmanuel Olutoyin Eleoramo - Shareholder Member3 Mr Idaere Gogo Ogan - Shareholder Member4 Mr. Abba Mamman Tor Habib - Director Member5 Dr. Ernest Ndukwe - Director Member6 Dr. (Mrs.) Ajoritsedere Awosika - Director Member
BY ORDER OF THE BOARD
Plot 999c, Danmole Street,Victoria Island, Lagos.Lagos Sunday Ekwochi
Company SecretaryFRC/2013/NBA/00000005528
The Bank operates a Group Personal Accident and the Workmen’s Compensation Insurance covers for the benefit of its employees. It also operates a contributory pension plan in line with thePension Reform Act 2004 as Amended and other benefit schemes for its employees.
The Bank maintains business premises designed with a view to guaranteeing the safety and healthy living conditions of its employees and customers alike. Employees are adequately insuredagainst occupational and other hazards. In addition, the Bank retains top-class hospitals where medical facilities are provided for its employees and their immediate families at its expense.
Fire prevention and fire-fighting equipment are installed in strategic locations within the Bank’s premises.
The auditors, PricewaterhouseCoopers have indicated their interest to continue in office and will do so pursuant to section 357(2) of the Companies and Allied Matters Act
The Bank encourages participation of employees in arriving at decisions in respect of matters affecting their wellbeing. Towards this end, the Bank provides opportunities where employeesdeliberate on issues affecting the Bank and its employees' interests, with a view to making inputs to decisions thereon. The Bank places a high premium on the development of its manpower.Consequently, the Bank sponsors its employees for various training courses, both locally and overseas.
The Bank shall strive to maintain a positive work environment that is consistent with best practice to ensure that business is conducted in a positive and professional manner and to ensure thatequal opportunity is given to all qualified members of the Group's operating environment.
The revised prudential guidelines, as released by the CBN, requires that banks should have themselves credit rated by a credit rating agency on a regular basis. It is also required that the creditrating be updated on a continuous basis from year to year.
Below are the credit ratings that Access Bank has been assigned by the various credit rating agencies that have rated the Bank, in no particular order:
Pursuant to Section 359(3) of the Companies and Allied Matters Act of Nigeria, the Bank has an Audit Committee comprising three directors and three shareholders as follows:
The functions of the Audit Committee are as provided in Section 359(6) of the Companies and Allied Matters Act of Nigeria.
The Bank operates a non-discriminatory policy in the consideration of applications for employment. The Bank’s policy is that the most qualified and experienced persons are recruited forappropriate job levels, irrespective of an applicant’s state of origin, ethnicity, religion, gender or physical condition.
We believe diversity and inclusiveness are powerful drivers of competitive advantage in developing and understanding of our customers' needs and creatively adressing them.
Total number of female in Executive Management positionTotal number of persons in Executive Management position
In the event of any employee becoming disabled in the course of employment, the Bank will endeavour to arrange appropriate training to ensure the continuous employment of such a personwithout subjecting the employee to any disadvantage in career development.
Total number of female employeesTotal number of male employees
Total number of female on the BoardTotal number of men on the Board
Total number of female in Top Management positionTotal number of men in Top Management position 16
52
female male
6 10
female male
3 8
female male
1434 1756
female male
7

Access Bank Plc
Consolidated and separate financial statements
For the year ended 31 December 2017
NAIRA
S/N DESCRIPTION2017 2016 2017 2016 2017 2016
1 Pending compliants B/F 8,658 132,396 1,233,437,410 623,867,921 - -2 Received Complaints 285,737 204,773 26,168,583,765 31,382,190,881 - -3 Resolved complaints 285,842 328,511 27,229,511,381 30,772,621,392 104,994,124 3,058,341,677
4 Unresolved Complaints escalated to CBN for intervention - - - - - -5 Unresolved complaints pending with the bank C/F 8,553 8,658 172,509,794 1,233,437,410 - -
USD
S/N DESCRIPTION2017 2016 2017 2016 2017 2016
1 Pending compliants B/F 78 116 1,694,114 - - -2 Received Complaints 1609 1,618 91,096,663 69,878,941 - -3 Resolved complaints 1637 1,656 90,365,863 68,184,828 - -4 Unresolved Complaints escalated to CBN for intervention - - - - - -
5 Unresolved complaints pending with the bank C/F 50 78 2,424,914 1,694,114 - -
GBP
S/N DESCRIPTION2017 2016 2017 2016 2017 2016
1 Pending compliants B/F 3 6 - 7,000 - -2 Received Complaints 78 93 3,851,731 786,508 - -3 Resolved complaints 79 96 3,840,531 793,508 - 5,024
4 Unresolved Complaints escalated to CBN for intervention - - - - - -5 Unresolved complaints pending with the bank C/F 2 3 11,200 - - -
EUR
S/N DESCRIPTION2017 2016 2017 2016 2017 2016
1 Pending compliants B/F 3 2 - - - -2 Received Complaints 60 61 16,009,241 1,528,345 - -3 Resolved complaints 59 60 16,004,241 1,528,345 - 1,7204 Unresolved Complaints escalated to CBN for intervention - - - - - -
5 Unresolved complaints pending with the bank C/F 4 3 5,000 - - -
Solicited Customer FeedbackDeliberate efforts are made to solicit feedback from customers and staff on the services and productsof the bank through the following:- Questionnaires- Customer interviews- Customers forum- Quest for Excellence Sessions (for staff)- Voice of Customer SurveysThe various feedback efforts are coordinated by our Service and innovation GroupThe feedback obtained from customers are reviewed and lessons learnt are used for staff training andservice improvement across the bank.
NUMBER AMOUNT CLAIMED (GBP) AMOUNT REFUNDED (GBP)
NUMBER AMOUNT CLAIMED (EUR) AMOUNT REFUNDED (EUR)
NUMBER AMOUNT CLAIMED (USD) AMOUNT REFUNDED (USD)
CUSTOMER COMPLAINTS AND FEEDBACKAccess Bank is fully committed to its core value of ‘passion for customers. The Bank prides itself on providing exceptional services to customers at all times. At the same time, given thenumber and complexity of financial transactions that take place every day, the Bank recognizes that there will inevitably be occasions when mistakes and misunderstandings occur. In thesesituations, Access bank encourages customers to bring their concerns to the attention of the bank for prompt resolution. In addition, deliberate efforts are made to solicit customers’feedback on its products and services.
Complaints ChannelsIn order to facilitate seamless complaint and feedback process, the bank has provided various channels for customers. These include:
- 24 hour contact centre with feedback through emails, telephone, SMS, Livechat, Social Media etc.- Feedback portal on the Bank's website- Customer service desks in over 300 branches and toll-free telephone lines to the office of the Group Managing Director in the banking halls of key branches.- Correspondence from customers- The Voice of Customer Solution- The Ombudsman desk
Complaints HandlingWe handle customer complaints with sensitivity and in due regard for the needs and understanding of each complainant. Efforts are made to resolve customer’s complaints at first level.Where this cannot be done, they are immediately referred to the appropriate persons for resolution. All complaints are logged and tracked for resolution and feedback is provided to thecustomer.
Resolve or Refer command CentreThe ‘Resolve or Refer’ command centre serves to encourage timely service delivery and First Time Resolution (FTR) of customer issues. The ‘Resolve or Refer Command Centre’ which isbeing run by a senior management staff has the mandate to ensure that most customer issues are resolved same day. The command centre provides support to all our departments andbranches on issue resolution.
Complaints Tracking and ReportingWe diligently track complaint information for continuous improvement of our processes and services. An independent review of the root cause of complaints made is carried out and lessonslearnt are fed back to the relevant business units to avoid future repetition. Customer complaint metrics are analysed and reports presented to Executive Management and the OperationalRisk Management committee. Reports on customer complaints are also sent to the Central bank as required.
ACCESS BANK PLC CUSTOMER'S COMPLAINTS FOR THE YEAR ENDED DECEMBER 31, 2017
NUMBER AMOUNT CLAIMED (NAIRA) AMOUNT REFUNDED (NAIRA)
8

Access Bank Plc Consolidated financial statements For the year ended December 31, 2017
9
CORPORATE GOVERNANCE REPORT FOR YEAR ENDED DECEMBER 31, 2017
Access Bank has an outstanding track record of excellence when it comes to corporate governance. We are committed to best practice in this, as in all areas. From strict performance monitoring to the careful appointment and supervision of experienced and capable Directors, not to mention the complementary role of Board committees, Access Bank will always be in the leading rank.
We are also transparent in all that we do, maintaining high ethical standards. We have implemented a robust whistle-blowing procedure to ensure we stay on the right course.
In all of this, we adhere to and strive to exceed the regulatory requirements. That way you can be sure that a better tomorrow awaits, not just because of our vision, resources and capabilities, but because of the way we believe in getting there.
The Bank and its subsidiaries (‘the Group’) are governed under a framework that enables the Board discharge its oversight functions while providing strategic direction to the Bank in balance with its responsibility to ensure regulatory compliance. The subsidiaries comply with the statutory and regulatory requirements of their host countries and also align their governance framework to the Bank’s governance framework.
The Board is responsible for embedding high standards of corporate governance across the Group. The Board recognises that effective corporate governance is a key imperative to achieving the sustainable growth of the enterprise. Accordingly, the Group’s governance framework is designed to ensure on-going compliance with the Central Bank of Nigeria’s Code of Corporate Governance for Banks and Discount Houses in Nigeria (‘the CBN Code’); the Securities and Exchange Commission’s Code of Corporate Governance for Public Companies (‘the SEC Code’) and the Post Listing Rules of the Nigerian Stock Exchange. These, in addition to the Board charter and the Bank’s Memorandum and Articles of Association, collectively provide the foundation for sound corporate governance. Our core value of excellence, innovation, leadership, passion for customers, professionalism and empowered employees continue to define our corporate behaviour.
Developments on the Board
There is no doubt that effective boards are made possible by directors with appropriate skills, qualification and experience and who are guided by integrity in their private and public behaviour. In recognition of this imperative, the Board has established a formal process for the selection of new directors to ensure the transparency of the nomination process. Director’s appointment process is documented in the Group’s Fit and Proper Person Policy and is led by the Board Governance and Nomination Committee. The Committee identifies candidates for appointment as director in consultation with the Chairman, the Group Managing Director and/or any other director, or through the use of search firms or such other methods as the Committee deems necessary. Once candidates have been identified, the Committee will confirm that they meet the criteria contained in the policy and relevant statutes and regulations. The Committee may gather information about the candidates through interviews, questionnaires, enhanced due diligence checks or any other means that the Committee deems necessary. The Committee meets to discuss and evaluate the qualities and skills of each candidate, taking into account the overall composition and needs of the Board. Based on the outcome of the evaluation, the Committee recommends candidates to the Board for appointment as director subject to the approval of shareholders and the Central Bank Nigeria.
In accordance with the Bank’s Articles of Association, Mrs. Mosun Belo-Olusoga and Mr. Paul Usoro retired
at the Bank’s 29th Annual General Meeting held on March 29, 2017 and being eligible for re-election were
duly re-elected by shareholders. The shareholders also elected Mr. Adeniyi Adekoya and Mr. Iboroma
Akpana as Independent Non-Executive Directors. The appointment of Dr. Gregory Jobome as an Executive
Director was also ratified by shareholders at the said meeting.
In the course of the year, Mr. Obinna Nwosu resigned his position as the Group Deputy Managing Director
with effect from April 30, 2017, to pursue other personal endeavours. Mr. Emmanuel Chiejina also retired
from the Board effective June 23, 2017, following his successful completion of the maximum 12 years’ term
limit prescribed by the CBN’s Code. Mrs Ojinika Olaghere, Executive Director in charge of Operations and
Information Technology also on October 31, 2017 served the Board a notice of her resignation.

Access Bank Plc Consolidated financial statements For the year ended December 31, 2017
10
The Board commends the directors that exited the Board for their outstanding contributions to the progress
of the Bank and wishes them success in their future endeavours.
Following the resignation of Mr. Obinna Nwosu, the Board upon the recommendation of the Governance
and Nomination Committee appointed Mr. Roosevelt Ogbonna as Group Deputy Managing Director. Prior
to his appointment, Mr Ogbonna was the Executive Director in charge of Commercial Banking Division.
His appointment has been approved by the Central Bank of Nigeria. The Board in a bid to reinvigorate the
Executive suite on October 25, 2017 appointed Messrs Adeolu Bajomo and Hadiza Ambursa as Executive
Director Operations and Information Technology and Commercial Banking, North respectively. The three
appointments have been approved by the Central Bank of Nigeria. The appointments of Messrs Adeolu
Bajomo and Hadiza Ambursa will be presented to shareholders for ratification at this meeting.
Retirement and Re-election of Directors
In accordance with the Bank’s Articles of Association, one third of all Non-Executive Directors (rounded down) are offered for re-election every year (depending on their tenure on the Board) together with directors appointed by the Board since the last Annual General Meeting. In keeping with this requirement, Dr. Ernest Ndukwe and Mrs. Anthonia Ogunmefun, will retire during this Annual General Meeting and being eligible for re-election will submit themselves for re-election. The Board is convinced that the directors standing for ratification or re-election will continue to add value to the Bank. The Board believes that they are required to maintain the balance of skill, knowledge and experience on the Board. The biographical details of the directors standing for election or re-election are set out on page 3 of this Annual Report.
Towards Board Effectiveness
Today’s boards are required to be more engaged, more knowledgeable and more effective than in the past as they contend with a host of new pressures, challenges and risks. As stakeholders’ expectations from the Board continue to enlarge, the Board must set its strategic priorities often across diverse business segments and markets and monitor the firm’s risk profile. The Board must demonstrate that good corporate governance is not a box-ticking exercise by setting the right ethical tone from the top. The Board’s approach towards ensuring its effectiveness is achieved through composition, training and a rigorous board evaluation process.
Board Composition–Guiding Principles
The Group’s Fit and Proper Person Policy is designed to ensure that the Bank and its subsidiary entities are managed and overseen by competent, capable and trustworthy individuals. The Governance and Nomination Committee is responsible for both Executive and Non-Executive Directors succession planning and recommends new appointments to the Board. The Committee takes cognisance the existing range of skills, experience, background and diversity on the Board in the context of the strategic direction of the Bank before articulating the specifications for the candidate sought. The Committee also considers the need for appropriate demographic and gender balance in recommending candidates for Board appointment. Candidates who meet the criteria set by the Committee are subjected to enhance due diligence enquiries.
We are comfortable that the Board is sufficiently diversified to optimize its performance and deliver sustainable value to stakeholders. The Board’s composition is aligned with global best practice on Non-Executive Directors to Executive Directors parity. In 2017, the Board had Non-Executive Directors than Executive Directors with four Non-Executive Directors being Independent as against two required by the CBN and SEC Codes. Non-Executive Directors are appointed to the Board to bring on board independence, specialist knowledge and impartiality in strategy development and execution monitoring. Additional information on the composition of the Board in the 2017 financial year is provided at Page 3.
Training and Induction
The Board ensures the regular domestic and international training and education of Board members to improve their decision making capacity, thereby contributing to the overall effectiveness of the Board. New

Access Bank Plc Consolidated financial statements For the year ended December 31, 2017
11
directors are exposed to personalized induction programme which includes one-on-one meetings with Executive Directors and Senior Executives responsible for the Bank’s key business areas. Such sessions focus on the challenges, opportunities and risks facing the business areas. The induction programme covers an overview of the strategic business units as well as Board processes and policies. A new director is provided with an induction pack containing charters of the various Board Committees, significant reports, important statutes and policies, minutes of previous Board meetings and a calendar of Board activities. Based on the recommendation of the Governance and Nominations Committee the Board approves the annual training plan and budget for directors while the Company Secretary ensures the implementation of the plan with regular report to the Board. During the period under review, the Directors attended the training programmes shown below.
S/N Name of Director
Description of Training Training Provider/Location
Date
1 Emmanuel Chiejina
International Programme for Directors of Banks and other Financial Institutions
Financial Institutions Training Centre /Dubai, UAE
May 8-12, 2017
2 Paul Usoro Finance for Executives Insead/France April 25-May 5, 2017
3 Ojinika Olaghere
Competing on Business Analytics and Big Data
Harvard Business School/ USA
June 18-23, 2017
4 Victor Etuokwu
AVIRA (awareness, vision, imagination, role and action)
Insead/France 6th - 11th September
5 Titi Osuntoki AVIRA (awareness, vision, imagination, role and action)
Insead/France 6th - 11th September
6 Gregory Jobome
The Next Level in Corporate Governance
Central Bank of Nigeria in conjunction with -Financial Institutions Training Centre/ Lagos
19-20th September, 2017
7 Abba Habib The Next Level in Corporate Governance
Central Bank of
Nigeria in conjunction
with -Financial
Institutions Training
Centre/ Lagos
19-20th September, 2017
8 Adeniyi Adekoya
The Next Level in Corporate Governance
Central Bank of
Nigeria in conjunction
with -Financial
Institutions Training
Centre/ Lagos
19-20th September, 2017
9 Mosun Belo-Olusoga
Value Creation for Owners and Directors
Insead/ France October 30- November 2, 2017

Access Bank Plc Consolidated financial statements For the year ended December 31, 2017
12
S/N Name of Director
Description of Training Training Provider/Location
Date
10 Ajoritsedere Awosika.
Value Creation for Owners and Directors
Insead/ France October 30- November 2, 2017
10 Ajoritsedere Awosika.
Value Creation for Owners and Directors
Insead/ France October 30- November 2, 2017
11 Anthonia Ogunmefun
Value Creation for Owners and Directors
Insead/ France October 30- November 2, 2017
12 Herbert Wigwe
Digital Marketing and Social Media Analytics
Massachusetts Institute of Technology
October 16-17, 2017
13 Adeniyi Adekoya
Making Corporate Boards More Effective
Harvard Business School, USA
November 15-18, 2017
14 Abba Habib Making Corporate Boards More Effective
Harvard Business School, USA
November 15-18, 2017
Performance Monitoring and Evaluation
The Board in discharge of its oversight function continuously engages with management and contributes ideas to the planning and execution of the Group’s strategy. In line with the Bank’s strategic planning cycle, the Board held a one-day strategy session on October 25, 2017 to deliberate on and approve the Bank’s 2018-2022 strategic plan. The Board usually holds an annual Board retreat, where the strategy for the coming year is rigorously debated and agreed between management and the Board. Management provides the Board with quarterly update on implementation of the strategy affording the Board the opportunity to critique the Management and assess significant issues, risks or challenges encountered in the course of strategy implementation and the steps taken to mitigate the risks. Management’s report on the Group’s actual financial performance is presented relative to the planned budget to enable the Board assess the level of achievement. Peer comparison is also a crucial component of Management reporting to the Board to benchmark performance against that of our competitors.
The Bank’s performance on Corporate Governance is continuously being monitored and reported. We carry out quarterly and annual reviews of our compliance with the CBN and the SEC Codes respectively and render reports to the regulators.
The Board has also established a system of independent annual evaluation of its performance, that of its committees and individual directors. The evaluation is done by an independent consultant approved by the Board. In this regard, Accenture Limited was engaged to conduct the Board performance evaluation for the Financial Year Ended December 31, 2017. The independent consultant does not have any connection with the Group or any of its directors. The Board believes that the use of an independent consultant not only encourages Directors to be more candid in their evaluation of the Board performance, but also enhances the objectivity and transparency of the evaluation process.
The result of the Board performance evaluation was presented by the independent consultant during the Board Meeting held on January 30, 2018. The evaluation was a 360-degree on-line survey covering Directors’ self-assessment, peer assessment and evaluation of the Board and the Committees. The effectiveness of the Independent Directors vis-à-vis the CBN Guidelines on Independent Directors of Banks was also evaluated. The board appraisal covered the Board’s structure and composition, processes, relationships, competencies, roles and responsibilities. The result confirmed that the individual directors and the Board continue to operate at a very high level of effectiveness and efficiency. The result showed that the Bank’s corporate governance practices were largely in compliance with the provisions of the CBN and SEC Codes.
The summary result of the independent evaluation will be presented by Accenture at this meeting.

Access Bank Plc Consolidated financial statements For the year ended December 31, 2017
13
Shareholders and Regulatory Engagement
The Board recognizes the importance of ensuring the flow of complete, adequate and timely information to existing and potential shareholders and regulators to enable them make informed decisions about the Bank. The Board is therefore committed to maintaining high standards of corporate disclosure. The implementation of our robust investors and regulatory engagement strategies enable us to understand stakeholders’ views about the Bank and respond effectively.
Shareholders meetings are convened and held in an open manner in line with the Bank’s Articles of Association and existing statutory and regulatory regimes, for the purpose of deliberating on issues affecting the Bank’s strategic direction. The Annual General Meeting is a medium for promoting interaction between the Board, management and shareholders. Attendance at the Annual General Meeting is open to shareholders or their proxies, while proceedings at such meetings are usually monitored by members of the press, representatives of the Nigerian Stock Exchange, the Central Bank of Nigeria and the Securities and Exchange Commission. The Board ensures that shareholders are provided with adequate notice of meetings. An Extraordinary General Meeting may also be convened at the request of the Board or shareholders holding not less than 10% of the Bank’s Paid-Up Capital.
The Bank has a comprehensive Investors Communication and Disclosure Policy. As provided in the policy, the Board and management ensure that communication with the investing public about the Bank and its subsidiaries is timely, factual, broadly disseminated and accurate in accordance with all applicable legal and regulatory requirements. The Bank’s reports and communication to shareholders and other stakeholders are in plain, readable and understandable format. The Bank’s website www.accessbankplc.com is regularly updated with both financial and non-financial information. A copy of the Investors Communication and Disclosure Policy are available in the Investor Portal on the Bank’s website.
The Bank has a dedicated Investors Relations Unit that facilitates communication with shareholders and analysts on a regular basis. Investors and stakeholders are frequently provided with information about the Bank through various channels, including Quarterly Investors Conference Calls, the General Meeting, the Bank’s website, the Annual Report and Accounts, Non-Deal Road Shows and Investors Forum at the Stock Exchange. The Bank on December 4, 2017 held an engagement session at the Nigerian Stock Exchange during which the Board briefed the investing public on the Bank’s 2018-2022 strategic plan and also received input from investors. The Board ensures that shareholders’ statutory and general rights are protected at all times, particularly their right to vote at general meetings. The Board also ensures that all shareholders are treated equally regardless of the size of their shareholding and social conditions. Our shareholders are encouraged to share in the responsibility of sustaining the Bank’s corporate values by exercising their rights as protected by law.
Access to Information and Resources
Management recognises the importance of free flow of complete, adequate and timely information to the Directors to enable them make informed decisions in discharge of their responsibilities. There is ongoing engagement between Executive Management and the Board. The Heads of Strategic Business Units attend Board meetings to make presentations. The Bank’s External Auditors attend the Group Board Audit Committee and the Statutory Audit Committee meetings to make presentations on the audit of the Group’s Financial Statements.
Directors have unrestricted access to Group management and company information in addition to the necessary resources to carry out their responsibilities. This includes access to external professional advice at the Bank’s expense as provided by the Board and Committees’ charters.
Board Responsibilities
The primary responsibility of the Board is to provide effective leadership and direction to enhance the long-term value of the Group to its shareholders and other stakeholders. It has the overall responsibility for reviewing the strategic plan and performance objectives, financial plans and annual budget, key operational initiatives, major funding and investment proposals, financial performance review and corporate governance practices. The Board is the Group’s highest decision-making body responsible for governance.

Access Bank Plc Consolidated financial statements For the year ended December 31, 2017
14
It operates on the understanding that sound governance practices are fundamental to earning the trust of stakeholders which is critical to sustainable growth.
Tenure of Board Members
The Bank’s Non-Executive Directors are appointed for an initial term of four years. Subject to the provisions of the Articles of Association on the retirement of Non-Executive Directors by rotation they can be re-elected for a maximum of two subsequent terms of four years each, subject to satisfactory performance and shareholders’ approval. The Independent Non-Executive Directors are subject to a maximum tenure of 8 years as stipulated by the Central Bank of Nigeria’s Guidelines for the Appointment of Independent Directors. Our Executive Directors are appointed for an initial term of four years and their tenure can be renewed for further terms subject to a satisfactory annual performance evaluation. Executive Directors are prohibited from holding other directorships outside the Access Bank Group or investee companies. Composition and Role As at December 31, 2017 the Board comprised 15 members, made up of 7 Executive Directors and 8 Non-Executive Directors four of whom are Independent Non-Executives.
Below are the profiles of the Board members.
Mrs. Mosun Belo-Olusoga, FCA Group Chairman Mrs. Belo-Olusoga is the Principal Consultant/Programme Director of The KRC Ltd. She served on the boards of Guaranty Trust Bank Plc, Asset and Resource Management Company Ltd and Equipment and Leasing Association of Nigeria. She currently sits on the boards of ActionAid, MTN Foundation and Premium Pension Limited. She had an illustrious banking career spanning nearly three decades and retired from Guaranty Trust Bank Plc in 2006 as an Executive Director. Mrs. Belo-Olusoga is a graduate of Economics from University of Ibadan. She qualified as a Chartered Accountant in 1983 and is a fellow of the Institute of Chartered Accountants of Nigeria and the Chartered Institute of Bankers of Nigeria. She joined the Board of the Bank in November 2007. She was the Chairperson of the Board Credit and Finance Committee until her appointment as Chairman of the Board in July 2015. She is 60 years old as at the date of this meeting. Anthonia Ogunmefun Non-Executive Director Mrs. Ogunmefun is the Managing Partner of Kemi Ogunmefun Law Office, a Canadian based private legal practice specialising in Immigration Law, Family Law, Real Estate and Corporate Law. She served as the Chairperson of Governance Committee of Kinark Child and Family Services, a major Canadian Childcare Trust and is a Non-Executive Director of LOC Nominees Limited. Mrs. Ogunmefun obtained her Bachelor of Laws degree from University of Lagos in 1974. She was called to the Nigerian Bar in 1975 and the Law Society of Upper Canada in 2004. She was appointed to the Board in April 2011. Mrs. Ogunmefun is the Chairman of the Board Risk Management Committee and Vice Chairman of the Governance and Nominations Committee.
She is 66 years old as at the date of this meeting.

Access Bank Plc Consolidated financial statements For the year ended December 31, 2017
15
Ernest Ndukwe, OFR Independent Non-Executive Director Dr. Ndukwe is an Electrical/Electronics Engineer, with over three decades experience in the telecommunications industry. He was the Managing Director of General Telecoms between 1989 and 2000 and Executive Vice Chairman of Nigerian Communications Commission between 2000 and 2010. He is a graduate of University of Ife and an alumnus of Lagos Business School. He is a fellow of the Nigerian Society of Engineers, Nigerian Institute of Management and Nigerian Academy of Engineering. Dr. Ndukwe sits on the boards of SystemSpecs Limited, Open Media Group and Salt & Einsten MTS Limited. He joined the Board of Access Bank in December 2012 and chairs the Board Audit Committee and Board Digital and Information Technology Committee.
Dr. Ndukwe is 69 years old as at the date of this meeting.
Ajoritsedere Awosika, MFR Independent Non-Executive Director Dr. Awosika is an accomplished administrator with over three decades experience in public sector governance. She was at various times the Permanent Secretary in the Federal Ministries of Internal Affairs, Science & Technology and Power. She is a fellow of the Pharmaceutical Society of Nigeria and the West African Postgraduate College of Pharmacy. Dr. Awosika holds a doctorate degree in pharmaceutical technology from University of Bradford, United Kingdom. She was appointed to the Board in April 2013 and serves as the Vice-Chairman of the Board Audit Committee and Chairman of the Board Credit and Finance Committee. Dr. Awosika sits on the boards of Capital Express Assurance Ltd, Chams Plc and Josephine Consulting Limited. She is 65 years old as at the date of this meeting. Paul Usoro, SAN Non-Executive Director Mr. Usoro is a Senior Advocate of Nigeria, a Fellow of the Chartered Institute of Arbitrators and the Founder and Senior Partner of the Law firm of Paul Usoro & Co. He has over 30 years law practice experience and is acknowledged as a highly experienced litigator and communication law expert. He is currently a director of Airtel Network Limited and PZ Cussons Nigeria Plc. He had represented Access Bank as a Non-Executive Director on the board of defunct Intercontinental Bank Plc. He holds a Bachelor of Laws degree from University of Ife (1981) and was called to the Nigerian Bar in 1982. Mr. Usoro joined the Board in January 2014 and currently chairs the Board Governance and Nomination and Board Remuneration Committees. He is aged 59 at the date of this meeting. Abba Habib Non-Executive Director Mr. Habib is a thoroughbred banking professional with over 20 years’ experience, 15 of which were spent with Guaranty Trust Bank Plc where he voluntarily resigned in 2008 as an Executive Director. His experience in Guaranty Trust Bank spanned Corporate Banking and Risk Management. Mr. Habib is the Managing Director of Gremcoh Services Limited his family owned agricultural and real estate enterprise. He holds a First Class Bachelor of Science degree in Agricultural Economics from University of Maiduguri and Master of Science in Banking and Finance from Bayero University, Kano.

Access Bank Plc Consolidated financial statements For the year ended December 31, 2017
16
He has attended several Executive Development Programmes in leading institutions including African Development Bank, Harvard, IMD, D.C Gardner London and INSEAD.
He joined the Board in January 2016 and currently serves as the Vice-Chairman of the Board Credit and Finance Committee. Mr. Habib is 56 years old as at the date of this meeting. Adeniyi Adekoya Independent Non- Executive Director Mr. Adekoya is a highly experienced maritime and oil and gas industry expert with significant investment banking experience. He is currently an Executive Director with Synerpet Nigeria Limited (formerly Akeprime Limited). Prior to this, he had been a General Manager of Peacegate Holdings Ltd where he was responsible for setting up and developing the company’s marine operations. He was also consultant to Maine Nigeria Ltd where he developed the framework for the private placement to raise USD 500 million start-up capital and led the company’s participation in bid rounds for oil blocks in the Republic of Equatorial Guinea. He was appointed to the Board in October 2016 and approved by the Central Bank of Nigeria in January 2017, He worked with Mobil Producing Company as a Budget Officer, Exploration Department and also obtained financial service industry experience from AIM Fund and Trimark Investment Service both in Ontario, Canada. Mr. Adekoya holds a Bachelor’s degree in Business Administration from University of Lagos. He joined the Board in March 2017. He is the Vice-Chairman of the Board Digital and Information Technology Committee. Mr. Adekoya is aged 51 years old at the date of this meeting. Iboroma Akpana Independent Non- Executive Director Mr. Akpana is the Managing Partner of Solola & Akpana one of the leading commercial and oil and gas law firms in Nigeria. He is a consummate corporate and commercial lawyer with a career spanning over two decades. Mr. Akpana has a proven track record of academic excellence. He graduated as a top student in Law from University of Jos and obtained a Masters Degree from Harvard Law School. Mr. Akpana is a Notary of the Federal Republic of Nigeria. Based on his work, he was recognized in the Chambers Global 2006, 2007, 2008 and 2009 editions as a ‘Leading Individual’ in Nigeria in its Corporate/Commercial section. The International Financial Law Review 1000 similarly ranked him as a ‘Leading Lawyer’ in Nigeria in its 2006, 2007, 2008 and 2009 editions while the Legal 500 Europe, Middle East and Africa profiled him as a ‘Recommended Individual’. He is a member of the International Bar Association, American Bar Association, New York State Bar Association, Nigerian Bar Association and the Law Society of England and Wales. He joined the Board in March 2017. Mr. Akpana is the Vice-Chairman of the Board Remuneration Committee He is aged 53 at the date of this meeting.

Access Bank Plc Consolidated financial statements For the year ended December 31, 2017
17
Herbert Wigwe, FCA Group Managing Director /Chief Executive Officer Mr. Wigwe started his professional career with Coopers & Lybrand Associates, an international firm of Chartered Accountants. He spent over 10 years at Guaranty Trust Bank where he managed several portfolios including Financial Institutions, Large Corporates and Multinationals. He left Guaranty Trust Bank as an Executive Director to co-lead the transformation of Access Bank Plc in March 2002 as Deputy Managing Director. He was appointed Group Managing Director/CEO effective January 1, 2014. Mr. Wigwe is an alumnus of Harvard Business School Executive Management Programme. He holds a Masters degree in Banking and International Finance from the University College of North Wales; a Masters degree in Financial Economics from the University of London and a B.Sc. degree in Accounting from the University of Nigeria, Nsukka. He is also a Fellow of the Institute of Chartered Accountants of Nigeria (ICAN). Mr Wigwe is the Chairman of The Access Bank (UK) Ltd and Non-Executive Director of Nigerian Mortgage Refinance Company Plc. He is 51 years old at the date of this meeting. Roosevelt Ogbonna, FCA Group Deputy Managing Director Mr. Ogbonna was appointed Executive Director, Commercial Banking Division in October 2013. He has over 19 years’ experience in banking cutting across Treasury, Commercial and Corporate Banking. He joined Access Bank in 2002 from Guaranty Trust Bank. He is a Fellow of the Institute of Chartered Accountants of Nigeria and holds a Second Class Upper degree in Banking and Finance from University of Nigeria, Nsukka. He has attended Executive Management Development Programmes on Leadership, Credit and Risk-Management in leading institutions. Mr. Ogbonna represents the Bank on the boards of Access Bank (Zambia) Ltd, Central Securities Clearing System Plc, Africa Finance Corporation and The Access Bank (UK) Limited. He is 43 years old at the date of this meeting. Victor Etuokwu Executive Director Personal Banking Mr. Etuokwu’s appointment as Executive Director was renewed in October 2013 following the expiration of his initial term. He was first appointed Executive Director of Access Bank in January 2012, He oversees the Personal Banking Division and has over two decades of banking experience cutting across operations, Information Technology, and Business Development. He joined the Bank in July 2003 from Citibank Nigeria. He holds a Bachelor of Science degree and a Masters of Business Administration from University of Ibadan and University of Benin respectively. Mr. Etuokwu is a Senior Honorary member of the Chartered Institute of Bankers of Nigeria and represents the Bank on the boards of E-Tranzact Plc and Unified Payments Systems Plc. Mr Etuokwu is 50 years old at the date of the meeting. Ojinika Olaghere, FCA Executive Director Operations and Information Technology Mrs. Olaghere was appointed Executive Director, Operations and IT in October 2013. She has over 23 years banking experience, 16 of which were with Ecobank Group. She joined Access Bank in August 2007 as a

Access Bank Plc Consolidated financial statements For the year ended December 31, 2017
18
General Manager in charge of Enterprise Business Support. She was appointed Executive Director of the defunct Intercontinental Bank in October 2011 upon its acquisition by Access Bank. Her banking experience covers Operations, Business Development, General Administration and Information Technology. Mrs Olaghere holds a Second Class Upper degree in French language from University of Nigeria, Nsukka. She is a Fellow of the Institute of Chartered Accountant of Nigeria. She has attended Executive Management Development Programmes in leading institutions. She represents the Bank on the Governing Council of Bank Directors Association of Nigeria. The Board received Mrs Olaghere’s notice of resignation from the Bank on October 31, 2017. Titi Osuntoki Executive Director Business Banking Mrs. Osuntoki was appointed Executive Director, Business Banking in October 2013. She is an accomplished banker with over 2 decades’ experience cutting across several facets of banking. She joined Guaranty Trust Bank in 1991 and was appointed Executive Director in 2008. She resigned from Guaranty Trust Bank in October 2011. Until her appointment at Access Bank, she was an Independent Non-Executive Director of Wapic Insurance Plc. She holds a Second Class Upper degree in Civil Engineering and a Masters of Business Administration from University of Lagos. She has attended Executive Management Programmes in leading business schools. She represents the Bank on the Board of Financial Institutions Training Centre. Mrs. Osuntoki is aged 51 at the date of this meeting. Gregory Ovie Jobome Executive Director/Chief Risk Officer Dr. Jobome is a thorough bred banking professional with excellent academic pedigree. He obtained a First Class Degree in Economics from the University of Maiduguri in 1986 and a Distinction in Master of Business Administration from Obafemi Awolowo University in 1990. Dr. Jobome also obtained a Master of Science Degree (1994) and a Doctorate Degree (2002) both in Economics and Finance from Loughborough University, UK. He has over 25 years working experience obtained from Guaranty Trust Bank Plc, University of Liverpool Management School, Manchester Business School and Access Bank Plc. He joined Access Bank Plc in July 2010 as a General Manager and Chief Risk Officer. Prior to joining the Bank, he was a Risk Management Consultant to Guaranty Trust Bank Plc. Dr Jobome has been instrumental to the many giant strides attained by the Bank in the risk management space. Dr. Jobome is a highly sought after resource person and has held several key industry leadership position including; Director, CRC Credit Bureau Ltd; President, Risk Management Association of Nigeria; Member, Working Group on Regulatory Reforms of the Institute of International Finance and Member, Capacity Building Committee, Chartered Institute of Bankers of Nigeria Member He was appointed to the Board in October 2016. He is the Chairman of CRC Credit Bureau Limited an investee company of the Bank. Dr. Jobome is 52 years old at the date of this meeting. Hadiza Ambursa Executive Director Commercial Banking (North)
Ms. Ambursa was appointed Executive Director, Commercial Banking- North in October 2017. She has over two decades banking experience from Guaranty Trust Bank and Access Bank. Her experience covers Transaction Services, Public Sector, Commercial Bank and Corporate Finance. Prior to joining Access Bank in 2003, she was a Relationship Manager Public Sector in Guaranty Trust Bank Plc.
Access Bank Plc Consolidated financial statements For the year ended December 31, 2017
19
She graduated with a B.Sc in Political Science from University of Jos in 1991 and also obtained an M.A in Law and Diplomacy in 1996 from the same University. She subsequently attended Massachusetts Institute of Technology (‘MIT’) where she bagged an MBA in 2009. She has attended several Executive Management Programmes in leading institutions including Harvard Business School and MIT.
Ms. Ambursa represents Access Bank on the Board of Access Bank (Gambia) Ltd.
She is 47 years old at the date of this meeting.
Sunday Ekwochi Company Secretary Mr. Ekwochi was appointed as the Company Secretary of the Bank in March 2010. He graduated a top
student in Law from University of Jos with a Second Class Upper Degree in 1996 and Nigerian Law School
in February 1998 with Second Class Upper Degree. He has over 18 years banking experience from the then
African Express Bank, Fidelity Bank and Access Bank Plc.
Mr. Ekwochi qualified as a Chartered Secretary with the Institute of Chartered Secretaries and
Administrators, London in 2003. He has attended several management development programmes at
London Business School, Wharton Business School and IMD.
In line with best practice, the Chairman and Chief Executive Officer’s roles are assumed by different individuals; this ensures the balance of power and authority. The Board is able to reach impartial decisions as its Non-Executive Directors are a blend of Independent and Non-Independent Directors with no shadow or Alternate Directors, which ensures that independent thought is brought to bear on decisions of the Board.
The principal responsibility of the Board is to promote the long term success of the Group by creating and delivering sustainable shareholder value. The Board leads and provides direction for the management by setting policy directions and strategy, and overseeing its implementation. The Board seeks to ensure that management delivers on both its long-term growth, and short-term objectives, striking the right balance between both goals. In setting and monitoring the execution of our strategy, consideration is given to the impact that those decisions will have on the Group’s obligations to various stakeholders, such as shareholders, employees, suppliers and the community in which the Group operates as a whole. The Board is also responsible for ensuring robust systems of internal controls are maintained and that management maintains an effective risk management and oversight process across the Group so that growth is delivered in a controlled and sustainable way. In addition, the Board is responsible for determining and promoting the collective vision of the Group’s purpose, values, culture and behaviours. In carrying out its oversight functions, matters reserved for the Board include but are not limited to:
Defining the Bank’s business strategy and objectives.
Formulating risk policies.
Approval of quarterly, half yearly and full year financial statements.
Approval of significant changes in accounting policies and practices.
Appointment or removal of Directors and the Company Secretary.
Approval of major acquisitions, divestments of operating companies, disposal of capital assets or capital expenditure.
Approval of charter and membership of Board Committees.
Setting of annual Board objectives and goals.
Approval of allotment of shares.
Appointment and removal of Chief Audit Executive.
Approval of the framework for determining the policy and specific remuneration of Executive Directors.
Monitoring delivery of the strategy and performance against plan.
Reviewing and monitoring the performance of the Group Managing Director and the executive team.
Ensuring the maintenance of ethical standard and compliance with relevant laws.
Performance appraisal and compensation of Board members and Senior Executives.

Access Bank Plc Consolidated financial statements For the year ended December 31, 2017
20
Ensuring effective communication with shareholders.
Ensuring the integrity of financial reports by promoting disclosure and transparency.
Succession planning for key positions. The Role of Group Chairman Her principal role is to provide leadership and direction to the Board of Directors. She is accountable to the Board and shareholders, and liaises directly between the Board and the management of the Company, through the Group Managing Director/Chief Executive Officer (‘GMD/CEO’). The positions of the Group Chairman and the GMD/CEO are held by separate individual.
More specifically, the duties and responsibilities of the Group Chairman are as follows:
primarily responsible for the effective operation of the Board and ensures that
the Board works towards achieving the Bank’s strategic objectives.
setting the agenda for board meetings in conjunction with the
GMD/CEO and the Company Secretary;
approval of the Annual Board Activities Calendar;
playing a leading role in ensuring that the Board and its committees have the
relevant skills, competencies and desired experience;
ensuring that Board meetings are properly conducted and that the
Board is effective and functions in a cohesive manner;
ensuring that the Directors receive accurate and clear information about the
affairs of the Bank in a timely manner to enable them take sound decisions;
acting as the main link between the Board and the GMD/CEO as well as advising
the GMD/CEO on the effective discharge of his duties;
ensuring that all Directors focus on their key responsibilities and play
constructive roles in the affairs of the Bank;
ensuring that induction programmes are conducted for new directors and
continuing education programs are in place for all directors;
ensuring effective communication with the Bank’s institutional shareholders
and strategic stakeholders;
taking a leading role in the assessment, improvement and development of the
Board; and
presiding over General Meetings of shareholders.
The role of our GMD/CEO
The Group Managing Director (GMD) has overall responsibility for leading the development and execution of the Bank’s long-term strategy, with a view to creating sustainable shareholder value. He manages the day-to-day operations of the Bank and ensures that operations are consistent with the policies approved by the Board.
Specifically, the duties and responsibilities of the GMD include the following:
acts as head of the Management team and is answerable to the Board.
Access Bank Plc Consolidated financial statements For the year ended December 31, 2017
21
responsible for ensuring that a culture of integrity and legal compliance is imbibed by personnel at all levels of the Bank.
responsible f o r t h e Bank’s consistent achievement of its financial objectives and goals.
ensures that the Bank’s philosophy, vision, mission and values are disseminated and practised throughout the Bank.
ensures that the allocation of capital reflects the Bank’s risk Management philosophy.
ensures that the Bank’s risks are controlled and managed effectively, optimally and in line with the Bank’s strategies and objectives.
supervision to the Group Deputy Managing Director, Executive Directors and all subsidiaries and affiliate companies;
serves as the B a n k ’ s Chief Spokesman and ensures that it is properly presented to its various publics;
ensures that the Directors are provided with sufficient information to support their decision making;
The role of the Group Deputy Managing Director (‘GDMD’)
The GDMD provides support to the GMD/CEO towards the achievement of the corporate philosophy, business strategy, financial and other objectives of the Bank. He reports to the GMD/CEO and is responsible for the supervision of such aspects of the Bank as may be approved by the Board of Directors and exercise such powers and carry out such functions as may be delegated by the GMD/CEO.
The role of the Company Secretary Directors have separate and independent access to the Company Secretary. The Company Secretary is responsible for, among other things, ensuring that Board procedures are observed and that the Company’s Memorandum and Articles of Association, plus relevant rules and regulations are complied with. He also assists the Chairman and the Board in implementing and strengthening corporate governance practices and processes, with a view to enhancing long-term shareholder value. The Company Secretary assists the Chairman in ensuring good information flow within the Board and its committees and between management and Non-Executive Directors. The Company Secretary also facilitates the orientation of new Directors and coordinates their professional development.
As primary compliance officer for Group’s compliance with the listing rules of the Nigerian Stock Exchange, the Company Secretary is responsible for designing and implementing a framework for the Bank’s compliance with the listing rules, including advising management on prompt disclosure of material information. The Company Secretary attends and prepares the minutes for all Board meetings. As secretary for all Board Committees, he assists in ensuring coordination and liaison between the Board, the Board Committees and management. The Company Secretary also assists in the development of the agenda for the various Board and Board Committee meetings. The appointment and the removal of the Company Secretary are subject to the Board’s approval.
Delegation of Authority
The ultimate responsibility for the Bank’s operations rests with the Board. The Board retains effective control through a well-developed Committee structure that provides in-depth focus on the Board’s responsibilities. Each Board Committee has a written terms of reference and presents regular reports to the Board on its activities. The Board delegates authority to the Group Managing Director to manage the affairs of the Group within the parameters established by the Board from time to time.
Board Meetings
The Board meets quarterly and emergency meetings are convened as may be required. The Annual Calendar of Board and Committee meetings is approved in advance during the last quarter of the

Access Bank Plc Consolidated financial statements For the year ended December 31, 2017
22
preceding year. Material decisions may be taken between meetings through written resolutions in accordance with the Bank’s Articles of Association. The Board holds an annual retreat at an offsite location to consider strategic matters and review the opportunities and challenges facing the institution.
All Directors are provided with notices, agenda and meeting papers in advance of each meeting to enable them adequately prepare for the meeting. Where a Director is unable to attend a meeting he/she is still provided with the relevant papers for the meeting. Such a Director also reserves the right to discuss with the Chairman any matter he/she may wish to raise at the meeting. Directors are also provided with regular updates on developments in the regulatory and business environment.
The Board met 6 times during the period under review. The Board also held its 9th Annual Board Retreat on March 3-4, 2017 in Cape Town, South Africa to discuss strategic issues affecting the Bank. The Board operates a secure electronic portal- Diligent Boardbook for the circulation of board papers to members. This underscores the Board’s commitment to embrace environmental sustainability by reducing paper usage.
The Board channelled considerable time and efforts in discussing the following issues in 2017
Review of Board Committee charters/policies
Reconstitution of Board Committees
Consideration and approval of 2017 budget
Approval of appointments to subsidiary boards
Development of 2018-2022 Strategic Plan
Approval of credit facilities
Consideration of top management and board appointments
Consideration of updates on the implementation of Board Retreat outcomes.
Board Meeting Attendance
The membership of the Board and attendance at meetings in 2017 are set out below;
Type of Meeting
Annual
General Meeting
Annual
Retreat
Board Meetings
Date Mar 29th March 3rd & 4th
Jan 26th Apr 26th
Jun 23rd
Jul 26th
Oct 25th
Dec 15th
1 Mosun Belo-Olusoga
2 Emmanuel Chiejina
Retired
3 Anthonia Ogunmefun
4 Paul Usoro
5 Ernest Ndukwe

Access Bank Plc Consolidated financial statements For the year ended December 31, 2017
23
6 Ajoritsedere Awosika
7 Abba Habib Apology
8 Iboroma Akpana
Not yet appointed
9 Adeniyi Adekoya
Not yet appointed
10 Herbert Wigwe
11 Obinna Nwosu Resigned
12 Roosevelt Ogbonna
13 Victor Etuokwu
14 Ojinika Olaghere
15 Titi Osuntoki
16 Gregory Jobome
17 Hadiza Ambursa
Not Yet Appointed
Board Committees
The Board carries out its oversight function through its standing committees, each of which has a charter that clearly defines its purpose, composition, structure, frequency of meetings, duties, tenure and reporting lines to the Board. In line with best practice, the Chairman of the Board does not sit on any committee. The Board has six standing committees, namely: the Risk Management Committee, the Audit Committee, the Governance and Nomination Committee, the Remuneration Committee; the Credit and Finance Committee and the Digital and Information Technology Committee. The Digital and Information Technology Committee was constituted by the Board on October 25, 2017 to provide focused oversight over the Bank’s information technology investments and the end-to-end digital delivery of its products and services.
While the various Board committees have the authority to examine issues within their remit and report back to the Board with their decisions and/or recommendations, the ultimate responsibilities on all matters lies with the Board.
Reports of Board Committees
The report of the activities of the Board Committees in 2017 are as documented below.

Access Bank Plc Consolidated financial statements For the year ended December 31, 2017
24
Board Governance & Nomination Committee
The membership of the Committee and attendance at meetings in 2017 are set out below
Name Jan 10th Apr 11th Jul 11th Oct 9th
Emmanuel Chiejina Retired
Paul Usoro
Anthonia Ogunmefun
Ajoritsedere Awosika
Ernest Ndukwe
Iboroma Akpana Not yet a member
Adeniyi Adekoya Not yet a member
Herbert Wigwe
The Committee advises the Board on its oversight responsibilities in relation to all matters on corporate governance, sustainability and nominations affecting the Bank, the Directors and employees. It is responsible for determining and executing the processes for Board appointments, nominations and removal of non-performing Directors.
The key decisions of the Committee in the reporting period included recommendation of board appointment; review and recommendation of human resources policies to the Board for approval and consideration of quarterly reports on human resources and sustainability.
The Committee met 4 times in 2017 financial year.
Mr. Paul Usoro succeeded Mr. Emmanuel Chiejina as the Chairman of the Committee following the latter’s completion of his term limit on June 23, 2017.
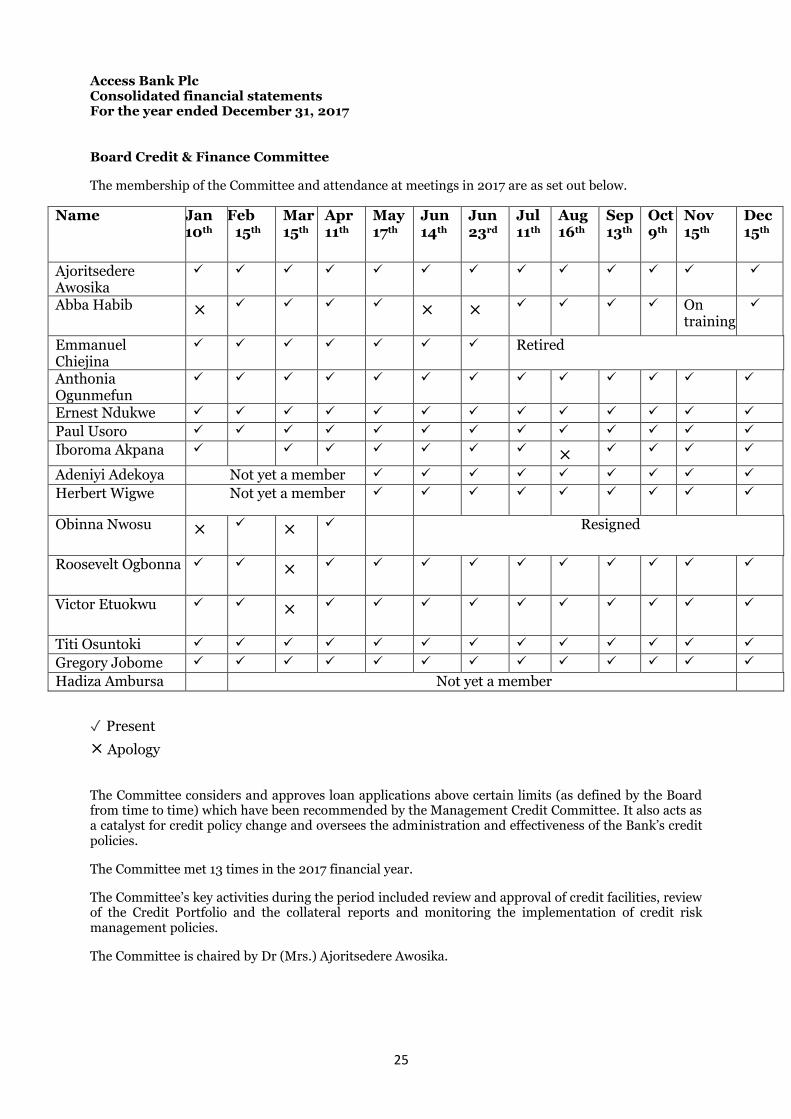
Access Bank Plc Consolidated financial statements For the year ended December 31, 2017
25
Board Credit & Finance Committee
The membership of the Committee and attendance at meetings in 2017 are as set out below.
Name Jan
10th Feb
15th Mar
15th Apr
11th May
17th Jun
14th Jun
23rd Jul 11th
Aug
16th Sep
13th
Oct
9th Nov
15th Dec
15th
Ajoritsedere Awosika
Abba Habib ×
×
×
On training
Emmanuel Chiejina
Retired
Anthonia Ogunmefun
Ernest Ndukwe
Paul Usoro
Iboroma Akpana ×
Adeniyi Adekoya Not yet a member
Herbert Wigwe Not yet a member
Obinna Nwosu ×
×
Resigned
Roosevelt Ogbonna ×
Victor Etuokwu ×
Titi Osuntoki
Gregory Jobome
Hadiza Ambursa Not yet a member
✓ Present × Apology
The Committee considers and approves loan applications above certain limits (as defined by the Board from time to time) which have been recommended by the Management Credit Committee. It also acts as a catalyst for credit policy change and oversees the administration and effectiveness of the Bank’s credit policies.
The Committee met 13 times in the 2017 financial year.
The Committee’s key activities during the period included review and approval of credit facilities, review of the Credit Portfolio and the collateral reports and monitoring the implementation of credit risk management policies.
The Committee is chaired by Dr (Mrs.) Ajoritsedere Awosika.

Access Bank Plc Consolidated financial statements For the year ended December 31, 2017
26
Board Risk Management Committee
The membership of the Committee and attendance at meetings in 2017 are as set out below.
Name Jan
11th Apr
12th Jul 10th
Oct
10th
Emmanuel Chiejina Retired from the Board
Anthonia Ogunmefun
Ernest Ndukwe
Paul Usoro
Abba Habib
Adeniyi Adekoya Not yet a member
Iboroma Akpana Not yet a member
Herbert Wigwe
Obinna Nwosu On official Assignment Resigned from the Board
Roosevelt Ogbonna Not yet a Member
Ojinika Olaghere
Gregory Jobome Not yet a member
The Committee assists the Board in fulfilling its oversight responsibility relating to establishment of policies, standards and guidelines for non-credit risk management, and compliance with legal and regulatory requirements. In addition, it oversees the establishment of a formal written policy on the overall risk management system. The Committee also ensures compliance with established policies through periodic review of management’s reports and ensures the appointment of qualified officers to manage the risk function. It evaluates the Bank’s risk policies on a periodic basis to accommodate major changes in the internal or external environment.
During the period under review the Committee considered and recommended some policies to the Board
for approval and received risk report from all the risk areas except credit. The Committee met 4 times in
2017 financial year.
Mrs. Anthonia Ogunmefun succeeded Mr. Emmanuel Chiejina as the Chairman of the Committee following the latter’s completion of his term limit on June 23, 2017.
Board Audit Committee
The membership of the Committee and attendance at meetings in 2017 are as set out below.
Name Jan 12th
Jan
25th Apr
13th Jul 13th
Jul 25th
Oct
11th Ernest Ndukwe
Ajoritsedere Awosika
Abba Habib
Paul Usoro
Adeniyi Adekoya Not yet a member
The Committee supports the Board in meeting its oversight responsibility relating to the integrity of the Bank’s Financial Statements and the financial reporting process; the independence and performance of the Bank’s Internal and External Auditors. It oversees the Bank’s system of internal control and the mechanism for receiving complaints regarding the Bank’s accounting and operating procedures. The Bank’s Chief Audit Executive and Chief Compliance Officer have access to the Committee and make quarterly presentations to the Committee.
The key issues considered by the Committee during the period included the review and recommendation of 2017 Full Year Audited Financial Statements and 2017 Interim Audited Financial Statements and reports

Access Bank Plc Consolidated financial statements For the year ended December 31, 2017
27
of the Group Internal Auditor and Internal Audit Consultants. The Committee approved the Group Internal Audit Work Plan for 2017 and also reviewed the whistle-blowing reports.
The Committee met 4 times during the reporting period.
Board Remuneration Committee
The membership of the Committee and attendance at meetings in 2017 are as set out below.
Name Apr
12th Apr
25th Emmanuel Chiejina
Paul Usoro
Anthonia Ogunmefun
Ajoritsedere Awosika
Ernest Ndukwe
Adeniyi Adekoya
The Committee advises the Board on its oversight responsibilities in relation to remuneration of the Bank’s Directors and employees. It is responsible for determining and executing the processes for recommending appropriate remuneration for Directors and employees. In carrying out its function, the Committee will benchmark the salary and benefit structure to similar-sized banks. It also advises the Board on employee benefit plans such as pension, share ownership and other retirement plans and material amendments thereto.
The key issues considered by the Committee during the period included consideration of Remuneration Survey reports for the Group Office and the subsidiary entities. The Committee met 2 times during the review period.
The Committee is chaired by Mr. Paul Usoro
Board Digital & Information Technology Committee
The Committee was set up by the Board on October 25, 2017 and held its Inaugural Meeting on January 18, 2018.
The composition of the Committee is as set out below.
Name Role
Ernest Ndukwe Chairman
Adeniyi Adekoya Member
Anthonia Ogunmefun Member
Abba Habib Member
Ajoritsedere Awosika Member
Iboroma Akpana Member
Herbert Wigwe Member
Roosevelt Ogbonna Member
Gregory Jobome Member
Adeolu Bajomo Member
Executive Committee
The Executive Committee (EXCO) is made up of the Group Managing Director as Chairman, the Group Deputy Managing Director and all Executive Directors. The Committee is primarily responsible for the implementation of strategies approved by the Board and ensuring the efficient deployment of the Bank’s resources.

Access Bank Plc Consolidated financial statements For the year ended December 31, 2017
28
Management Committees
These are standing committees comprising executive and senior management staff of the Bank. The committees are set up to identify, analyse and make recommendations on risks pertaining to the Bank’s day to day activities. They ensure that risk limits set by the Board and the regulatory bodies are complied with and also provide input to the various Board Committees in addition to ensuring the effective implementation of risk polices. These Committees meet as frequently as risk issues occur and take actions and decisions within the ambit of their powers.
The Management Committees include Management Credit Committee, Assets and Liabilities Committee, Enterprise Risk Management Committee, the Operational Risk Management Committee, the Criticised Assets Committee; Digital Steering Committee, Digital Design Council and Information Technology Steering Committee.
Statutory Audit Committee
The Companies and Allied Matters Act (‘CAMA’) 1990 in Section 359 (3) requires every public company to constitute a Statutory Audit Committee made up of equal number of directors and shareholders representatives subject to a maximum of six members in the committee. The Bank has constituted a Statutory Audit Committee made up of three Non-Executive Directors and three shareholders.
The Committee is constituted to ensure its independence, which is fundamental to upholding stakeholders’ confidence in the reliability of the Committee’s report and the Group’s Financial Statements. There is no Executive Director sitting on the Committee. The Chairman of the Committee is an ordinary shareholder, while the shareholders representatives are independent and answerable to the shareholders. There are two Independent Non-Executive Directors on the Committee and the third Director is independent of the management of the Bank.
The duties of the Committee are as enshrined in Section 359(3) and (4) of CAMA. The Committee is responsible for ensuring that the company’s financial statements comply with applicable financial reporting standards.
The profiles of the shareholders’ representatives in the Committee are as follows:
Henry Aragho, FCA Chairman, Statutory Audit Committee
Mr. Aragho received his Higher National Diploma (Accounting) from Federal Polytechnic Auchi in 1981 and a Master’s Degree in Business Administration (MBA) from Ogun State University (1999). He qualified as a Chartered Accountant with the Institute of Chartered Accountants of Nigeria (ICAN) in 1985. He was admitted as an Associate Member of Institute of Chartered Accountants of Nigeria in March 1986 and subsequently qualified as a fellow of the Institute.
He joined the Nigerian Ports Authority in 1982 and retired as General Manager Audit in 2005. He is presently the Managing Consultant of Henrose Consulting Limited and Managing Director Henrose Global Resources Limited.
He was appointed the Chairman of the Committee on July 27, 2016.
Emmanuel Eleoramo Member, Statutory Audit Committee Mr. Eleoramo holds a First Class Degree in Insurance and a Master’s Degree in Business Administration (MBA), both from the University of Lagos. He is also an Associate of the Chartered Insurance Institute of London and a Fellow of the Chartered Insurance Institute of Nigeria. He has had over 36 years of varied experience in General Insurance Marketing, Underwriting and Employee Benefits Consultancy. He is a key player in the Nigerian Insurance industry and a past President of the Chartered Insurance

Access Bank Plc Consolidated financial statements For the year ended December 31, 2017
29
Institute of Nigeria. He was the Managing Director/Chief Executive Officer of Nigerian French Insurance Company Ltd and later Whispering Hope Insurance Company Ltd (now Sterling Assurance Nigeria Ltd) before his appointment as the Managing Director/Chief Executive Officer of Nigerian Life and Pensions Consultants Limited (now Nigerian Life and Provident Company Limited).
Idaere Gogo-Ogan Member, Statutory Audit Committee
Mr. Ogan is a 1987 graduate of Economics from the University of Port Harcourt and holds a Master’s Degree in International Finance from Middlesex University, London. He joined the Corporate Bank Department of Guaranty Trust Bank Plc in 1996. He left Guaranty Trust Bank to found D’ Group, incorporating Becca Petroleum Limited and Valuestream and Cordero Engineering Ltd. He sits on the Audit Committee of Standard Insurance Company Plc.
Record of Attendance at Statutory Audit Committee Meeting in 2017
Name Status Role Jan 25th Jul 25
Henry Aragho Shareholder
representative
Chairman
Idaere Gogo-
Ogan
Shareholder
representative
Member
Emmanuel
Eleoramo
Shareholder
representative
Member
Ernest Ndukwe Independent Non-
Executive Director
Member
Ajoritsedere
Awosika
Independent Non-
Executive Director
Member
Abba Habib Non-Executive Director Member
Independence and Tenure of the Statutory Audit Committee We recognize that the independence of the Statutory Audit Committee is fundamental to maintaining stakeholders’ confidence in its report and the Bank’s financial statements. We have therefore ensured that the composition of the committee complies with the statutory requirement. Two of the Board representatives on the Committee are Independent Non-Executive Directors. In addition, the shareholder representatives are independent and answerable to the shareholders. The tenure of each Committee member lasts from the date of election at an Annual General Meeting till the next. The membership may, however, be renewed through re-election at the next Annual General Meeting. Role and focus The duties of the Statutory Audit Committee as enshrined in Section 359 (3) and (4) of CAMA. The statutory provisions are supplemented by the provision for the Codes of Corporate Governance issued by the CBN and SEC and are highlighted as follows: ascertain whether the accounting and reporting policies of the Company are in accordance with legal
requirements and agreed ethical practices; review the scope and planning of audit requirements;

Access Bank Plc Consolidated financial statements For the year ended December 31, 2017
30
review the findings on management matters in conjunction with the external auditor and departmental responses thereon (management letter);
keep under review the effectiveness of the Company’s system of accounting and internal control;
make recommendations to the Board with regard to the appointment, removal and remuneration of
the external auditors of the Company, ensuring the independence and objectivity of the external auditors and that there is no conflict of interest which could impair their independent judgement.
authorise the internal auditor to carry out investigations into any activity of the Company which may
be of interest or concern to the Committee; and
assist in the oversight of the integrity of the company’s financial statements and establish and develop the internal audit function.
Going Concern
The Directors confirm that after making appropriate enquiries, they have reasonable expectation that the Group has adequate resources to continue in operational existence for the foreseeable future. Accordingly, they continue to adopt going concern basis in preparing the financial statements.
External auditors Messrs PricewaterhouseCoopers (PwC) acted as our external auditors for the 2017 financial year. The Board confirms that the Bank has complied with the regulatory requirement as enshrined in the CBN and SEC Codes of Corporate Governance on the rotation of audit firm and audit partners. PwC was appointed the Bank’s sole external auditors from the 2013 financial year and has held office for 5 years. Succession planning
The Board has a robust policy which is aligned to the Bank’s performance management process. The policy identifies key positions, including Country Managing Director positions for all the Group’s operating entities in respect of which there is a proper succession planning. The policy provides that potential candidates for positions shall be identified at the beginning of each financial year.
Code of Ethics
The Bank’s Code of Conduct specifies expected behaviours for its employees and Directors. The code is designed to empower employees and Directors and enable effective decision making at all levels of the business according to defined ethical principles. New employees are required to read and sign an attestation that they understood the content. In addition, there is an annual re-affirmation exercise for all employees. There is a Compliance Manual that provides guidelines for addressing violations/breaches and ensuring enforcement of discipline amongst staff. The Bank also has a Disciplinary Guide which provides sample offences/violations and prescribes disciplinary measures to be adopted in various cases. The Head Group Human Resources is responsible for the design and implementation of the “Code of Conduct”, while the Chief Conduct and Compliance Officer is responsible for monitoring compliance.
The Chief Conduct and Compliance Officer issues at the beginning of the year an Ethics and Compliance message to all employees. The message reiterates the Bank’s policy of total compliance with all applicable laws, regulations, corporate ethical standards and policies in the conduct of the Bank’s business. It enjoins staff to promote the franchise and advance its growth in a sustainable manner while ensuring compliance with relevant policies, laws and regulations.
Dealing in Company Securities
In accordance with the provisions of the Rule 17.2 of the Amendment to the Listing Rules of the Nigerian Exchange, the Bank implements a Securities Trading Policy that prohibits Directors, members of the Audit Committee, employees and all other insiders from abusing, or placing themselves under the suspicion of abusing price sensitive information in relation to the Bank’s securities. In line with the policy, affected persons are prohibited from trading on the company’s security during a closed period which is usually

Access Bank Plc Consolidated financial statements For the year ended December 31, 2017
31
announced by the Company Secretary. The Bank has put in place a mechanism for monitoring compliance with the policy.
Remuneration Policy
The Group has established a remuneration policy that seeks to attract and retain the best talent in countries that it operates. To achieve this, the Group seeks to position itself among the best performing and best employee rewarding companies in its industry in every market that it operates. This principle will act as a general guide for the determination of compensation in each country. The objective of the policy is to ensure that salary structures, including short and long term incentives, motivate sustained high performance and are linked to corporate performance. It is also designed to ensure that stakeholders are able to make reasonable assessment of the Bank’s reward practices. The Group complies with all local tax policies in the countries of operation.
Operating within the guidelines set by the principles above, compensation for country staff is based on the conditions in the local economic environment as well as the requirements of local labour laws. The Group Office usually commissions independent annual compensation surveys in the subsidiaries to obtain independent statistics the local pay markets to arrive at specific compensation structures for each country. Compensation will be determined annually at the end of the financial year. All structural changes to compensation must be approved by the Group Office.
Total compensation provided to employees will typically include guaranteed and variable portions. The specific proportion of each will be defined at the country level. Guaranteed pay will include base pay and other guaranteed portions while variable pay may be both performance-based and discretionary.
The Bank has put in place a performance bonus scheme which seeks to attract and retain high-performing employees. Awards to individuals are based on the job level, business unit performance and individual performance. Other determinants of the size of individual award amounts include pay levels for each skill set which may be influenced by the relative dearth of skills in a particular area.
The Bank complies with the Pension Reform Act on the provision of retirement benefit to employees at all levels. The Bank also operates an Employee Performance Share Plan for the award of units of the Bank’s shares to its employees, subject to terms and conditions determined by the Board of Directors.
The Bank’s long term incentive programme rewards top management staff for their loyal and productive service to the Bank. This is to ensure that they share in the Bank’s success and focus on its long term sustainability. The justification for a long term incentive plan for top management employees is very compelling. The stability, loyalty and commitment of top management employees need to be strengthened by a long term incentive programme.
Whistle-Blowing Procedure
The Bank expects all its employees and Directors to observe the highest level of probity in their dealings with the Bank and its stakeholders. Our Whistle-Blowing Policy covers internal and external whistle-blowers and extends to the conduct of the stakeholders including employees, vendors, and customers. It provides the framework for reporting suspected breaches of the Bank’s internal policies and laws and regulations. The Bank has retained KPMG Professional Services to provide consulting assistance in the implementation of the policy. The policy provides that suspected wrongdoing by an employee, vendor, supplier or consultant may be reported through the Bank’s or KPMG’s Ethics lines or emails, details of which are provided below.
Telephone
Internal: +234-1-2712065
External: The whistle-blower is not billed for calls made within the same network. The KPMG Toll Free Lines include:

Access Bank Plc Consolidated financial statements For the year ended December 31, 2017
32
MTN: 0703-000-0026 & 0703-000-0027
AIRTEL:
0708-060-1222& 0808-822-8888
9MOBILE:
0809-993-6366 GLO: 0705-889-0140
Internal: [email protected]
External: [email protected]
The Bank’s website also provides an avenue for lodging whistle-blower’s reports. Individuals interested in whistle-blowing may click on the Customer Service link on the Bank’s website, scroll down to the whistle-blower column, and then register, anonymously or otherwise, any allegations they want the Bank to investigate.
The Bank’s Chief Audit Executive is responsible for monitoring and reporting on whistle-blowing. Quarterly reports are rendered to the Board Audit Committee.
In addition to the foregoing, stakeholders may also report unethical practices to the Central Bank of Nigeria via [email protected].
Customer Complaints and Resolution
The Bank complied with the provision of CBN Circular FPR/DIR/C IR/GEN/01/020 dated 16 August 2011 on handling consumer complaints. The Bank in line with the rules of the Securities and Exchange Commissions has implemented Investors Enquiries and Complaints Management Policy. The Policy is available in the Investor portal on the Bank’s website.
Statement of Compliance
The Bank complies with the relevant provisions of the SEC and the CBN Codes of Corporate Governance. In the event of any conflict between the provisions of the two codes regarding any matter, the Bank will defer to the provisions of the CBN Code as its primary regulator.

Access Bank Plc
Consolidated and separate financial statementsFor the year ended 31 December 2017
I.
II.
III.
-
-
-
-
-
-
Herbert Wigwe Roosevelt Ogbonna
Group Managing Director Group Deputy Managing Director
FRC/2013/ICAN/00000001998 FRC/2017/ICAN/00000016638
Statement of Directors’ Responsibilities in relation to the Consolidated Financial Statements for theyear ended 31 December 2017
The Companies and Allied Matters Act and the Banks and Other Financial Institutions Act, require the directors toprepare financial statements for each financial year that gives a true and fair view of the state of financial affairs of theCompany and Group at the end of the year and of its profit or loss. The responsibilities include ensuring that theCompany and Group;
Keep proper accounting records that disclose, with reasonable accuracy, the financial position of theCompany and Group and comply with the requirements of the Companies and Allied Matters Act and theBanks and Other Financial Institutions Act;
Establish adequate internal controls to safeguard its assets and to prevent and detect fraud and otherirregularities; and
Prepare financial statements using suitable accounting policies supported by reasonable and prudentjudgments and estimates that are consistently applied.
International Financial Reporting Standards
Prudential Guidelines for Licensed Banks in Nigeria;
Relevant circulars issued by the Central Bank of Nigeria;
The requirements of the Banks and Other Financial Institutions Act and
The requirements of the Companies and Allied Matters Act; and
The directors accept responsibility for the annual financial statements, which have been prepared using appropriateaccounting policies supported by reasonable and prudent judgements and estimates, in conformity with;
The Financial Reporting Council of Nigeria Act
The directors are of the opinion that the consolidated financial statements give a true and fair view of the state of thefinancial affairs of the Company and Group and of the financial performance and cash-flows for the year. The directorsfurther accept responsibility for the maintenance of accounting records that may be relied upon in the preparation offinancial statements, as well as adequate systems of internal financial control.
Nothing has come to the directors to indicate that the Company and Group will not remain a going concern for at leasttwelve months from the date of this statement.
SIGNED ON BEHALF OF THE BOARD OF DIRECTORS BY:
33

Access Bank Plc
Consolidated and separate financial statementsFor the year ended 31 December 2017
To the members of Access Bank Plc:
FRC/2017/ICAN/0000001627
Mr. Henry Omatsola Aragho
Chairman, Audit Committee
29 January 2018
Members of the Audit Committee are:
1 Mr. Henry Omatsola Aragho Shareholder Chairman
2 Mr Emmanuel Olutoyin Eleoramo Shareholder Member
3 Mr Idaere Gogo Ogan Shareholder Member
4 Mr. Abba Mamman Tor Habib Director Member
5 Dr. Ernest Ndukwe Director Member
6 Dr. (Mrs.) Ajoritsedere Awosika Director Member
In attendance:
Sunday Ekwochi – Company Secretary
We have deliberated on the findings of the external auditors who have confirmed that necessary cooperation was receivedfrom management in the course of their audit and we are satisfied with management’s responses thereon and with theeffectiveness of the Bank’s system of accounting and internal control.
Report of the statutory audit committee
In accordance with the provisions of Section 359(6) of the Companies and Allied Matters Act of Nigeria, the members of the AuditCommittee of Access Bank Plc hereby report on the financial statements for the year ended 31 December 2017 as follows:
We have exercised our statutory functions under section 359(6) of the Companies and Allied Matters Act of Nigeria andacknowledge the co-operation of management and staff in the conduct of these responsibilities.
We are of the opinion that the accounting and reporting policies of the Bank and Group are in agreement with legalrequirements and agreed ethical practices and that the scope and planning of both the external and internal audits for theyear ended 31 December 2017 were satisfactory and reinforce the Group’s internal control systems.
We are satisfied that the Bank has complied with the provisions of Central Bank of Nigeria Circular BSD/1/2004 dated 18February 2004 on “Disclosure of insider related credits in the financial statements of banks”. We hereby confirm that anaggregate amount of N1,650,860,935 (December 2016: N2,693,131,022) was outstanding as at 31 December 2017 whichwas performing as at 31 December 2017 (see note 44)
34

Access Bank Plc Consolidated and separate financial statements For the year ended 31 December 2017 Risk Management Framework
35
RISK MANAGEMENT – INNOVATING FOR A SUSTAINABLE FUTURE
Introduction
The year 2017 was a combination of opportunities and a series of uncertainties on the global business
space. Macroeconomic headwinds continued to create multiple emerging risks, forcing risk managers to
delicately navigate the risk minefields across varying business spheres. Access Bank has maintained a
conservative and consistent approach to risk through application of embedded enterprise-wide risk
management. Our risk management practices are hinged on carefully designed innovative approaches for
a sustainable future. We have integrated sustainability management practices into every aspect of our
business. Our comprehensive risk management framework is helping to ensure we protect depositors’
funds, lend responsibly, support economies and protect our planet. Our well defined risk appetite has
been carefully aligned to our strategy and our risk management culture has helped to deliver long-term
shareholder returns in a sustainable manner.
The country experienced foreign currency shortages for the most part of the first half of the year,
stemming from relatively lower oil production and commodity prices. The persistence of foreign exchange
liquidity challenges resulted in major complications for the Nigerian economy as a whole, impacting
productive capacity as businesses struggled to source necessary raw materials and other components. The
combination of multiple threats from the operating environment in the year affected the banking sector in
the form of sluggish credit growth, asset quality pressures, and weakening capitalization. All of these
prompted greater regulatory monitoring.
At Access Bank, our analytical and reporting processes had anticipated many of the above-mentioned
issues and we had proactively put in place requisite mitigants necessary to cushion the impact of these
shocks. Beyond taking pre-emptive mitigating steps, the outlook was viewed as an opportunity to further
optimise our risk and governance processes and position the Bank to benefit from market and regulatory
developments. The Bank also placed great importance on making a difference in the environment in
which people live and work, fostering and maintaining relationships with communities and developing
several climate change management initiatives both within the Bank and in our lending activities. Our
sustainable banking model has afforded us the opportunity to facilitate the development of innovative
banking products designed to enhance our digital loan offerings thereby prompting financial
inclusiveness. It has also helped in the formulation of a robust management framework to support these
initiatives.
In summary, the year 2017 was a very engaging year for risk management. Various risk management
initiatives came to fruition during the period which added to the range of risk management
tools/processes that assisted the bank in managing risk over the period. Some of these included the
following:
Upgraded our interest rate risk measurement and the basis of interest rate risk capital
measurement to Economic Value of Equity
Deployed a digital risk management framework to ensure digital risks are proactively identified
and properly managed as the bank expands its retail frontiers through digital channels

Access Bank Plc Consolidated and separate financial statements For the year ended 31 December 2017 Risk Management Framework
36
Developed an Enterprise-wide Risk Management Dashboard that shows the Bank’s position in all
the risk areas in line with strategic business units, products, channels and geographies against
defined limits, key risk indicators and policies
Implemented International Financial Reporting Standards (IFRS) 9-compliant models for the
measurement and reporting of loans and receivables
Designed and implemented an automated Asset Liability Management (ALM) reporting tool
which is an end-to-end solution which automates the entire ALM Reports generation operation.
The tool helps to ensure the accuracy and authenticity of reports, cut down processing time, allow
on-demand report generation and provide flexibility in report definition while generating the
report
Developed in-house macroeconomic and financial models for Probability of Default, Loss Given Default, stress testing and loan grading
Developed models for scenario analysis to better capture/anticipate evolving macroeconomic dynamics and impacts at industry/sectoral and obligor levels.
Increased Regulatory Intelligence
o The bank reduced its exposure on accounts without Bank Verification Number (BVN) through proactive intelligence gathering
o Consolidated on the Cluster Compliance structure which led to increased efficiency in compliance monitoring
o Full compliance with Stamp duty remittance Continuously improved processes for Enhanced Service Delivery by:
o Developing data enhancement portal which improved data quality and report rendition to the Nigerian Financial Intelligence Unit (NFIU)
o Developing Politically Exposed Person (PEP) attestation portal for report rendition to CBN and ongoing due diligence on PEPs
o Track implementation of digital banking products and ensure 100% regulatory compliance
o Automation of the policy initiation and review process Further empowered the First Line of defence by:
o Development of tools to assist the first line of defence with Suspicious Transaction Reports (STR)
o Strengthened advisory support for Business/Reputational decision making and innovative training methods e.g. Financial Action Task Force (FATF) game
The above remained pivotal in supporting the Bank’s risk optimisation in the course of the year, as well as
being critical strategic investments in the Bank’s medium and long-term sustainability. It is not surprising
therefore that with all these investments and passionate drive, Access Bank won 2017 Sustainability
Awards managed by the Central Bank of Nigeria (CBN) in all categories including driving Environmental
and Social Risk practices in our Oil & Gas and Agriculture lending activities. Further details on some of
the above, and other key developments are provided below.
ENTERPRISE-WIDE RISK MANAGEMENT
Our Enterprise-Wide Risk Management Remains Custom-made
Helping our stakeholders achieve their ambitions lies at the heart of our processes as we apply a bespoke
risk management framework in identifying, assessing, monitoring, controlling and reporting the inherent
and residual risks associated with the pursuit of these ambitions and ensuring they are achieved the right

Access Bank Plc Consolidated and separate financial statements For the year ended 31 December 2017 Risk Management Framework
37
way. We help in connecting our customers to opportunities through our promise of speed, service and
security.
Recovery and Resolution Planning
The 2008/2010 global financial crisis exposed Nigerian banks and the economy in general to
unprecedented stress. Poor risk management in Nigerian banks led to the concentration of assets in
certain risky areas. The concerns stemmed from the huge deterioration in the quality of banks’ assets,
liquidity concerns and low capital adequacy ratios. Consequently, the Central Bank of Nigeria had to
intervene to prevent a total collapse of the industry and create stability in the Nigerian financial sector.
The Asset Management Corporation (AMCON) was set up in 2010 to relieve banking sector balance sheets
of Non-Performing Loans thereby stimulating lending to the real sector. AMCON has over the period
intervened by acquiring Eligible Bank Assets (“EBAs”), issuing financial accommodation securities and
employing the bridging option to establish bridge banks as a form of resolution. The various regulatory
interventions have been at the expense of taxpayers and infrastructural and human capital development
being the opportunity cost.
The various banking crisis revealed that many banks were insufficiently prepared for a fast-evolving
systemic crisis and thus were unable to act and respond in a way that would avoid potential failure and
prevent material adverse impacts on the financial system and ultimately the economy and society.
The Financial Stability Board described Systematically Important Financial Institutions (SIFIs) as
"financial institutions whose distress or disorderly failure, because of their size, complexity and systemic
interconnectedness, would cause significant disruption to the wider financial system and economic
activity".
The Central Bank of Nigeria designated eight banks as Domestic Systemically Important Banks (D-SIBs)
in November 2013 and issued requirements for Recovery and Resolution Plans to be submitted by 1st
January of every year. Access Bank was designated as a D-SIB, as such, we have updated the Bank’s 2017
recovery plan (‘Recovery Plan’) and submitted this to the relevant regulators. The Recovery Plan is
updated once a year at least to reflect changes in the business and the regulatory environment.
The Recovery Plan equips the Bank to re-establish its financial strength and viability during an extreme
stress situation. The Recovery Plan’s raison d'être is to document how we can respond to a financial stress
situation that would impact our capital or liquidity position. The plan outlines a set of defined actions,
aimed to protect us, our customers and the markets and prevent a potentially more costly resolution
event.
In preparing the Recovery plan, we leveraged the following guidelines:
Central Bank of Nigeria (CBN) Minimum Contents for Recovery Plans and Requirements for
Resolution Planning. November 2016
European Banking Authority (EBA):
o Regulatory Technical Standards (EBA/RTS/2014/11)
o Guidelines (GL/2015/02)

Access Bank Plc Consolidated and separate financial statements For the year ended 31 December 2017 Risk Management Framework
38
o Prudential Regulations Authority (PRA) Policy and Supervisory Statements (PS1/15 and
SS18/13)
Financial Stability Board (FSB) Guidance on Recovery Triggers and Stress Scenarios dated 16
July 2013
Recovery Indicators are metrics that can be used by the Bank to define the points at which to take action
under the recovery plan. Indicators are qualitative and quantitative in nature, and draw on our risk
appetite and existing risk management frameworks. The Bank currently has several risk related
frameworks in place for both financial and non-financial risk, such as the Enterprise Risk Management
(ERM) Framework, Contingency Funding Plan (CFP) and Business Continuity Plan (BCP), amongst
others. The Bank’s qualitative and quantitative indicators are drawn from our existing risk management
frameworks.
Quantitative indicators include Capital, Liquidity, Asset Quality and Earnings indicators. In addition to
these, macroeconomic and market-based indicators are used by us to proactively signal negative trends
which may harm the Bank. These triggers provide input and support for the continuous monitoring of
possible adverse situations and may indicate potential changes in the four key indicators. The trigger
levels and thresholds for the indicators were determined based on regulatory requirements (CBN), the
Bank’s Risk Appetite, as well as global best practices. These indicators have different monitoring
frequencies and a threshold breach will trigger a series of actions as specified in the plan.
In line with best practice, we have identified a wide range of recovery options that will mitigate different
types of stress scenarios and steer the Bank back to a business as usual condition. The Bank’s Internal
Capital Adequacy Assessment Process (ICAAP) and Internal Liquidity Adequacy Assessment Process
(ILAAP) form the bedrock on which the Scenario Planning and Stress testing are formed. These scenarios
cover both idiosyncratic and market-wide events, which could lead to severe capital and liquidity impacts
as well as impacts on our performance and balance sheet. For each recovery option, the impact on capital
and liquidity is quantified. The timing to realization of benefits, franchise impact as well as likely
effectiveness is evaluated. The implementation plan and timeline are delineated, risks and regulatory
considerations are also assessed.
The Board of Directors (“Board”) owns and is responsible for the Recovery Plan. The Chief Risk Officer is
charged with the responsibility of maintaining the RRP and making submission to the regulatory
authorities.
Resolution Planning
Globally, regulators of financial institutions are seeking to mitigate the risk of market-wide disruption
from a bank failure as occurred in the previous financial crisis. To facilitate this, regulators require
information from banks to enable a resolution strategy to be put in place. No definitive description of
resolvability exists, but regulators wish to ensure that impact of failure is minimised, access to deposits
are maintained, payment services continue and the risk of a fire sale of assets, which may cause financial
instability, is minimised.
The Central Bank of Nigeria (CBN) Minimum Contents for Recovery Plans and Requirements for
Resolution Planning outlines minimum information which should be included in a resolution pack which

Access Bank Plc Consolidated and separate financial statements For the year ended 31 December 2017 Risk Management Framework
39
would assist the resolution authorities in carrying out their statutory responsibilities. These information
have been provided in line with the regulatory guidance.
Risk Management Governance Structure
Access Bank’s Risk Management Governance Structure is depicted below.
Roles of the Board of Directors
The Board of Directors’ role as it relates to risk management is divided into seven areas; general, credit,
market, compliance, operational, reputational and strategic risk.
Specific roles in these areas are further defined below:
Board of Directors
Board Risk Management
Committee
Operational Risk Management
Committee (ORMC)
Asset and Liability
Committee (ALCO)
Board Committee on
Human Resources
Enterprise RIsk Management COmmittee
(ERMC)
Chief RIsk Officer
Risk Management
Division
Business Unit RIsk CHampions
Board Credit & Finance
Committee
Managment Credit
Committee (MCC)
Board Audit Committee
Internal Audit Division
Board Renumeration
committee
Layer 1
Layer 2
Layer 3
Layer 4

Access Bank Plc Consolidated and separate financial statements For the year ended 31 December 2017 Risk Management Framework
40
General
a) Develop a formal enterprise-risk management framework;
b) Review and approve the establishment of a risk management function that would
independently identify, measure, monitor and control risks inherent in all risk-taking units of
the Bank;
c) Ratify the appointment of qualified officers to manage the risk management function;
d) Approve and periodically review the Bank’s risk strategy and policies;
e) Approve the Bank’s risk appetite and monitor the Bank’s risk profile against this appetite;
f) Ensure that the management of the Bank has an effective ongoing process to identify risk,
measure its potential impact and proactively manage these risks;
g) Ensure that the Bank maintains a sound system of risk management and internal control with
respect to:
• Efficiency and effectiveness of operations
• Safeguarding of the Bank’s assets (including information)
• Compliance with applicable laws, regulations and supervisory requirements
• Reliability of reporting
• Behaving responsibly towards all stakeholders
h) Ensure that a systematic, documented assessment of the processes and outcomes surrounding
key risks is undertaken at least annually;
i) Ensure that management maintains an appropriate system of internal control and review its
effectiveness;
j) Ensure risk strategy reflects the Bank’s tolerance for risk;
k) Review and approve changes/amendments to the risk management framework;
l) Review and approve risk management procedures and control for new products and activities;
and
m) Periodically receive risk reports from management highlighting key risk areas, control failures and
remedial action steps taken by management.
Credit Risk
a) Approve the Bank’s overall risk tolerance in relation to credit risk based on the recommendation
of the Chief Risk Officer;
b) Ensure that the Bank’s overall credit risk exposure is maintained at prudent levels and consistent
with the available capital through quarterly review of various types of credit exposure;
c) Ensure that top management as well as individuals responsible for credit risk management
possess the requisite expertise and knowledge to accomplish the risk management function;
d) Ensure that the Bank implements a sound methodology that facilitates the identification,
measurement, monitoring and control of credit risk;
e) To put in place effective internal policies, systems and controls to identify, measure monitor, and
control credit risk concentrations.

Access Bank Plc Consolidated and separate financial statements For the year ended 31 December 2017 Risk Management Framework
41
f) Ensure that detailed policies and procedures for credit risk exposure creation, management and
recovery are in place; and
g) Appoint credit officers and delegate approval authorities to individuals and committees.
Market Risk
a) Define the Bank’s overall risk appetite in relation to market risk;
b) Ensure that the Bank’s overall market risk exposure is maintained at levels consistent with the
available capital;
c) Ensure that top management as well as individuals responsible for market risk management
possess sound expertise and knowledge to accomplish the risk management function;
d) Approve the Bank’s strategic direction and tolerance level for liquidity risk;
e) Ensure that the Bank’s senior management has the ability and required authority to manage
liquidity risk;
f) Approve the Bank’s liquidity risk management framework; and
g) Ensure that liquidity risk is identified, measured, monitored and controlled.
Compliance Risk
a) Approve the Bank’s code of conduct and ethics;
b) Monitor the Bank’s compliance with laws and regulations, its code of conduct and ethics and
corporate governance practices;
c) Ensure new and changed legal and regulatory requirements are identified, monitored and reflected
in Bank processes;
d) Approve the compliance structure, mechanisms and processes established by management to
ensure compliance with current laws, regulations and supervisory requirements; and
e) Ensure the Bank has a compliance culture that contributes to the overall objective of risk
management
Operational Risk
a) Oversee the overall governance of the Bank’s operational risk management process;
b) Set the Bank’s operational risk strategy and direction in line with the Bank’s corporate strategy;
c) Approve the Bank’s operational risk management framework;
d) Periodically review the framework to ensure its relevance and effectiveness;
e) Ensure that senior management is performing their risk management responsibilities; and
f) Ensure that the Bank’s operational risk management framework is subject to effective and
comprehensive internal audit by operationally independent, appropriately trained and competent
staff.

Access Bank Plc Consolidated and separate financial statements For the year ended 31 December 2017 Risk Management Framework
42
Reputational Risk
a) Set an appropriate tone and guidelines regarding the development and implementation of
effective reputation risk management practices, including an explicit statement of a zero tolerance
policy for all unethical behaviour;
b) Approve the Bank’s framework for the identification, measurement, control and management of
reputational risk;
c) Monitor the Bank’s compliance with its reputational risk management policies and recommend
sanctions for material breaches of internal policies;
d) Review all exception reports by external parties such as regulators and auditors; ensure that
appropriate sanctions are applied to erring officers; demand from management appropriate
explanations for all exceptional items; ensure that management puts in place effective and
remedial actions and reports on progress to the Board on an on-going basis;
e) Ensure that Board members do not compromise their fit and proper status with regulators. They
shall ensure that only Board members who do not tarnish the Bank’s image and reputation
remain as members; and
f) Ensure that only fit and proper persons are appointed to senior management positions in the
Bank.
Strategic Risk
a) Oversee the strategic risk management process.
b) Ensure that the bank has in place an appropriate strategic risk management framework
which suits its own circumstances and needs;
c) Ensure that the strategic goals and objectives are set in line with its corporate mission
and values, culture, business direction and risk tolerance;
d) Approve the strategic plan (including strategies contained therein) and any subsequent
changes, and review the plan (at least annually) to ensure its appropriateness;
e) Ensure the organization’s structure, culture, infrastructure, financial means, managerial
resources and capabilities, as well as systems and controls are appropriate and adequate
to support the implementation of its strategies.
f) Review high-level reports periodically submitted to the Board on the overall strategic risk
profile, and ensure that any material risks and strategic implications identified from
those reports are properly addressed; and
g) Ensure that senior management is competent in implementing strategic decisions
approved by the Board, and supervising such performance on a continuing basis
The Board and Management Committees
The Board of Directors is the highest approval authority for credit risk policies and credit facilities in
Access Bank. It carries out its oversight function through its standing committees each of which has a
charter that clearly defines its purpose, composition, structure, frequency of meetings, duties, tenure, and
reporting lines to the Board.
In line with best practice, the Chairman of the Board does not seat on any of the Committees. The Board
has six standing committees namely: the Board Risk Management Committee, the Board Audit
Access Bank Plc Consolidated and separate financial statements For the year ended 31 December 2017 Risk Management Framework
43
Committee, the Board Remuneration Committee, the Board Governance and Nomination Committee, the
Board Credit & Finance Committee and the Board Digital and IT Committee.
The management committees which exists in the Bank includes: The Executive Committee (EXCO),
Enterprise Risk Management Committee (ERMC), Management Credit Committee (MCC), Group Asset &
Liability Committee (Group ALCO), and Operational Risk Management Committee (ORMC).
Without prejudice to the roles of these committees, the full Board retains ultimate responsibility for risk
management.
Specific roles of the Board and Management Committees
The Board’s risk management oversight roles and responsibilities are delegated to the following
committees:
COMPLIANCE RISK MANAGEMENT
The Bank organizes its compliance function and sets priorities for the management of its compliance risk
in a way that is consistent with its own risk management strategy and structures.
The implementation of our compliance function transformation which we commenced in 2015 reached an advanced stage in 2017. The integrated compliance function working closely with Internal Audit and Operational risk to achieve risk convergence provided backbone for integrated assurance and higher visibility of risk management and control consciousness across the Group. The compliance function has continued to redefine its approach from the traditional inspectorate function into an advisory role with intense focus on regulatory intelligence gathering and closer cooperation with business units within the Bank, and the group acting as a contact point within the Bank for compliance queries from staff members. We raised the monitoring to online real time to catch up with the current digital banking environment instead of the old process of waiting for next day to do transaction call over. Today we receive alerts of transactions on a risk based approach by focusing on the high-risk areas thereby spotting non-conformities on time. Measurement, Monitoring and Management of Compliance Risk
In Access Bank, compliance risk is: Measured by reference to identified metrics, incident assessments (whether affecting
Access Bank or the wider industry), regulatory feedback and the judgment of our external
assessors as it relates to AML/CFT and other compliance vulnerabilities; Monitored against our compliance risk assessments and metrics, the results of the continuous
monitoring and reporting activities of the compliance function and the results of internal and
external audits and regulatory inspections; and
Managed by establishing and communicating appropriate policies and procedures, training
employees on them, and monitoring activity to assure their observance.
The Bank continues to recognize its accountability to all its stakeholders under the legal and regulatory
requirements applicable to its business. The Conduct & Compliance function, including all staff of Access

Access Bank Plc Consolidated and separate financial statements For the year ended 31 December 2017 Risk Management Framework
44
Bank Plc and its subsidiaries are committed to high standards of integrity and fair dealing in the conduct
of business. The Bank’s compliance risk management philosophy is deepened by the effective convergence
of risk management through the ‘Three Lines of Defense’ model.
Effective Compliance Risk Management of Access Bank Plc and its subsidiaries will continuously be
coordinated in the following manner:
Where a business unit is subject to regulatory requirements, it will comply with those requirements. The business unit will furthermore establish and maintain systems of internal control to monitor and report the extent of compliance with those requirements with the support of Conduct & Compliance function.
In the absence of regulatory requirements for all or part of a business unit, certain minimum
standards of conduct is established and maintained by that business unit to the extent required as
determined by the management of that business unit.
Accountability for ensuring compliance with regulatory requirements and minimum standards rests with
the Group Managing Director and the Board of Access Bank Group, whilst the enforcement thereof is the
responsibility of the respective Group Heads (1st line of defense).
To assist in the discharge of this obligation, Access Bank Plc maintains an independent Conduct &
Compliance Function. Conduct & Compliance function develop systems of control that are required to
ensure there is adequate protection of the bank, empower the first line of defense and ensure timely
reporting of breaches and other regulatory non-compliances to the Board and Executive Management of
the Access Bank Group.
For independent assurance, Conduct & Compliance function together with other Risk Management
functions and Group Internal Audit work together to ensure that the necessary synergies are achieved in
the management of the Bank’s compliance risk.
Our Compliance Risk Appetite Access Bank Plc aims to be compliant with all applicable laws and regulations, internal company rules
and policies governing its operations and established good business practices. Access Bank Plc
ensures that this requirement is embedded in the culture of its business operations.
Enhanced global AML and sanctions policies, incorporating the bank’s risk appetite, are effectively in
use in the Bank. The policies adopt and seek to enforce the highest or most effective standards globally,
including a globally consistent approach to knowing our customers.
With respect to Compliance Risk, the Bank’s appetite for Compliance Risk continues to be defined as
follows; Zero tolerance for payment of fines and other penalties associated with regulatory infractions
and non-compliance with laws, standards and rules. The primary compliance objective is to be among
top three (3) most compliant banks in all the jurisdictions we have our business operations. The Bank
shall continuously aim to minimize the following compliance risk indicators:
Reported exceptions by auditors, regulators and external rating agencies; Frequent litigations;
Access Bank Plc Consolidated and separate financial statements For the year ended 31 December 2017 Risk Management Framework
45
Payment of fines and other regulatory penalties; and Unresolved customer complaints.
The Bank shall not compromise its reputation through unethical, illegal and unprofessional conduct in
the market place. The Bank shall also maintain a zero appetite for association with disreputable
persons and/or entities.
Our AML Programme Access Bank Plc has a Board approved AML/CFT programme. This is contained in the Bank’s
Compliance Manual which is reviewed and updated on an annual basis. Our Compliance Manual
contains the policies approved by the Board. Some of these are the Politically Exposed Persons (PEP)
Policy; Compliance Risk Management Policy, Compliance Charter etc.
Board members and all levels of staff are trained at least once every financial year on
AML/CFT/KYC/ABC as stated in the Bank’s policy. New employees also undergo KYC/AML/CFT/ABC
training as an induction course. The Bank organizes and ensures that staff attend webinars,
conferences, workshop, trainings etc as part of its bank wide AML/CFT/KYC awareness program. Tests
are conducted during such trainings to ensure employees understand the content and scope of the
trainings.
All Access Bank staff sign the Annual Compliance Attestation message to affirm that they have read
and understood the policies and procedures of the Bank relating to ethics, code of conduct,
AML/CFT, Anti-Bribery and Corruption etc.
The Bank has designated a Non-Executive Director who is responsible for the Access Bank Plc Anti
Money Laundering / Combating Financing of Terrorism (AML/CFT) program. With the Executive
Compliance Officer and escalation protocol for compliance risk in place, the Enterprise-wide Risk
Management Committee (ERMC) and the Board via the Board Risk Management Committee (BRMC)
serve as channels for reporting compliance risk.
Anti-Bribery & Corruption Implementation Access Bank continues to adopt a zero-tolerance approach to bribery and corruption. The Bank conducts
business affairs in a manner that shuns the use of corrupt practices or acts of bribery to obtain unfair
advantage in our dealings within the markets and the communities we operate.
The Bank and all its Subsidiaries have a Board approved policy which sets out the general rules and
principles we adhere to and continue to communicate to all employees, directors, business associates as
well as relevant partners, suppliers, vendors and other stakeholders the need to maintain high ethical
and professional conduct while doing the Bank’s business.
Conduct Risk Implementation Conduct Risk: Detriment caused to our customers, clients, counterparties, or the Bank and its employees
through inappropriate judgment in execution of business activities. We continue to review and improve
how conduct risk is assessed and reported throughout our business. The Bank is committed to putting

Access Bank Plc Consolidated and separate financial statements For the year ended 31 December 2017 Risk Management Framework
46
customers at the heart of the decisions, treating customers fairly and resolving customer complaints
within the shortest possible time.
Strategic Alliance & Partnership As part of our contribution towards the enhancement of the financial industry’s existing framework and
initiatives to combat financial crimes and terrorist financing, the Conduct and Compliance Group
continues to partner with DATAPRO Ltd, the Financial Institutions Training Centre (FITC) to organize
training sessions on compliance risk management where compliance issues such as emerging risk
regulations and standards, new international and regulatory landscape are discussed.
The Compliance Institute of Nigeria (CIN) which is a brain child of the Association of Chief Compliance
Officers of Banks in Nigeria (ACCOBIN) is a network of experienced and certified Anti-Money
Laundering (AML) and Anti-Terrorist Financing (ATF) professionals working on ground in Nigeria
recently admitted over 120 Compliance and Internal Audit staff of the bank as Compliance Designates,
Associates and Fellows of the Institute. Our own Chief Conduct and Compliance Officer, Mr. Pattison
Boleigha is presently the pioneer president of the Institute. Access Bank was also honored by the
Association of Chief Compliance Officers of Banks in Nigeria (ACCOBIN) for the Bank’s pivotal role
during the pioneer stage of the Association.
OPERATIONAL RISK MANAGEMENT
Operational risk is the risk of loss resulting from inadequate or failed internal processes, people, or
systems, or from external events. Our definition of operational risk excludes regulatory risks, strategic
risks and potential losses related solely to judgments with regard to taking credit, market, interest rate,
liquidity, or insurance risks.
It also includes the reputation and franchise risk associated with business practices or market conduct in
which the Bank is involved. Operational risk is inherent in Access Bank’s global business activities and, as
with other risk types, is managed through an overall framework designed to balance strong corporate
oversight with well-defined independent risk management.
This framework includes:
recognized ownership of the risk by the businesses;
oversight by independent risk management; and
independent review by Corporate Audit.
We seek to minimise exposure to operational risk, subject to cost trade-offs. Operational risk exposures
are managed through a consistent set of management processes that drive risk identification, assessment,
control and monitoring.
The goal is to keep operational risk at appropriate levels relative to the characteristics of our businesses
and the markets in which we operate, our capital and liquidity, and the competitive, economic and
regulatory environment. Notwithstanding these controls, Access Bank incurs operational losses.
Our operational risk strategy seeks to minimise the impact that operational risk can have on shareholders’
value. The Bank’s strategy is to:

Access Bank Plc Consolidated and separate financial statements For the year ended 31 December 2017 Risk Management Framework
47
Reduce the likelihood of occurrence of expected events and related cost by managing the
risk factors and implementing loss prevention or reduction techniques to reduce variation
to earnings;
Minimise the impact of unexpected and catastrophic events and related costs through risk
financing strategies that will support the Bank’s long term growth, cash flow management
and balance sheet protection;
Eliminate bureaucracy, improve productivity, reduce capital requirements and improve
overall performance through the institution of well designed and implemented internal
controls.
In order to create and promote a culture that emphasizes effective operational management and
adherence to operating controls, there are three distinct levels of operational risk governance structure in
Access Bank Plc.
Level 1 refers to the oversight function carried out by the Board of Directors, Board Risk Committee and
the Executive Management. Responsibilities at this level include ensuring effective management of
operational risk and adherence to the approved operational risk policies.
Level 2 refers to the management function carried out by operational risk management group. It has
direct responsibility for formulating and implementing the Bank’s operational risk management
framework including methodologies, policies and procedures approved by the Board.
Level 3 refers to the operational function carried out by all business units and support functions in the
Bank. These units/functions are fully responsible and accountable for the management of operational risk
in their units. They work in liaison with operational risk management to define and review controls to
mitigate identified risks. Internal audit provides independent assessment and evaluation of the Bank’s
operational risk management framework. This periodic confirmation of the existence and utilisation of
controls in compliance with approved policies and procedures, provide assurance as to the effectiveness of
the Bank’s operational risk management framework. Some of the tools being used to assess, measure and
monitor operational risks in the bank include; a loss database of operational risk events; an effective risk
and control self-assessment process that helps to analyse business activities and identify operational risks
that could affect the achievement of business objectives; and key risk indicators which are used to monitor
operational risks on an ongoing basis.
The Group’s Operational Risk Management Framework
The Group’s current operational risk framework was implemented in 2007 to meet internal and
regulatory requirements. There has been significant investment in the implementation of improved
measurement and management approaches for operational risk to strengthen control, improve customer
service, improve process efficiencies and minimise operating losses. The Group recognises the fact that it
is neither cost-effective nor possible to attempt to eliminate all operational risks. Events of small
significance are thus expected to occur and are accepted as inevitable with relevant budgeting for these
losses where appropriate. Events of material significance are limited and the Group seeks to reduce the
risk from these extreme events in a framework consistent with its agreed risk appetite. Processes are in
place to monitor the management and future mitigation of such events.

Access Bank Plc Consolidated and separate financial statements For the year ended 31 December 2017 Risk Management Framework
48
The role of the Operational Risk function is to establish, implement and maintain the operational risk
framework for the modelling and managing of the Group’s operational risk, while reinforcing and
enabling operational risk management culture throughout the Group. The aim is to integrate, based on
international norms and best practices, all operational risk activities and to compile a reliable operational
risk profile contributing to the Group’s risk- reward profile. The key advantage of this framework is the
financial quantification and modelling of operational risks. This functionality has significantly improved
the Group’s operational risk measurement and management capabilities.
Management and control responsibilities
The first line of governance for managing operational risk rests with business and operational risk
management forms part of the day-to-day responsibilities of all business unit management. Business unit
staff report any identified breakdowns in control and any risk events that may result in financial loss
and/or reputation damage. Amongst others, business management are responsible to ensure that
processes for identifying and addressing ineffective controls and the mitigating of risk events are
implemented and executed. Operational Risk teams form the secondary line of governance by ensuring
that processes to identify weaknesses are effective and identified weaknesses are acted upon. The Group
operational risk profile is presented to the Board quarterly. Control effectiveness is monitored at the
ERMC and at the Board; and the multi-layered system of defences ensures pro-active operational risk
management.
Measuring and managing operational risk
The Group recognizes the significance of operational risk and is committed to enhancing the
measurement and management thereof. Within the Group’s operational risk framework, qualitative and
quantitative methodologies and tools are applied (Group-wide) to identify and assess operational risks
and to provide management information for determining appropriate mitigating measures.
Risk event data collection and reporting
A standard process is used Group-wide for the recognition, capture, assessment, analysis and reporting of
risk events. This process is used to help identify where process and control requirements are needed to
reduce the recurrence of risk events. Risk events are loaded onto a central database and reported monthly
to the ERMC. The Group also uses a database of external public risk events and is part of a consortium of
international banks that share loss data information anonymously to assist in risk identification,
assessment, modelling and benchmarking.
Risk and control self-assessments (RCSA)
In order to pro-actively identify and actively mitigate risks, the operational risk framework utilises RCSAs.
RCSA is used at a granular level to identify relevant material risks and key controls mitigating these risks.
The risks and controls are assessed on a quarterly basis and relevant action plans are put in place to treat,
tolerate, terminate or transfer the risks, taking into account the relevant business risk appetites. The RCSA
programme is extensive and covers the entire Group. The Internal Audit further tests the effectiveness of
the RCSAs within the normal course of auditing and relevant metrics are monitored and actioned where
relevant.

Access Bank Plc Consolidated and separate financial statements For the year ended 31 December 2017 Risk Management Framework
49
Key risk indicators (KRIs)
A comprehensive set of KRIs are in place across the Group, with relevant and agreed thresholds set by the
business. KRIs are monitored on a Group as well as business unit level, based on significance. Threshold
breaches are managed in accordance with an agreed process across the Group.
Reporting
Business units are required to report on both a regular and an event-driven basis. The reports include a
profile of the key risks to their business objectives, RCSA and KRI results, and operational risk events. Risk
reports are presented to executive management and risk committees.
Allocating Capital to Business Units
An allocation methodology is applied for allocating capital to business units. For each business units, the
allocation takes into consideration not only the size of the business unit, but also measures the business
unit’s control environment, namely open audit findings, RCSA results, and loss experience. This translates
to a risk-sensitive allocation with the opportunity afforded to business to identify actions to positively
impact on their respective allocated operational risk capital.
Insurance mitigation
Insurance policies are used as a way to mitigate operational risks. These policies are current and remain
applicable in the Group operating environment. Insurance coverage is purchased at Group or cluster level
to discharge statutory and regulatory duties, or to meet counterparty commitments and stakeholder
expectations. The primary insurance policies managed by the Group are:
comprehensive crime and electronic crime;
directors’ and officers’ liability; and
professional indemnity.
In terms of the AMA, the Group may adjust its operational risk exposure result by no more than 20% to
reflect the impact of operational risk mitigants. Globally, the use of insurance and other risk transfer
mechanisms for operational risk is in a state of rapid development and pioneering work is being done across
the industry. While the Group has developed a methodology for the modelling of insurance, the Group will
not apply risk mitigation in the calculation of its operational risk exposure until such time as insurance
policies are compliant to regulatory minimum requirements.
Information Security, Digital Banking and Continuity of Business
In response to the increased cyber security threat to businesses globally, we have developed a Cyber Security
Framework and adopted a defense in-depth approach to cover Cybersecurity practices, information security
processes and infrastructure which includes: Cyber Security Governance, Operations and Infrastructure.

Access Bank Plc Consolidated and separate financial statements For the year ended 31 December 2017 Risk Management Framework
50
We have a holistic view of all the major risks facing the bank and we remain vigilant with regards to both
known and emerging global risks and ensure that we are strong enough to withstand any exogenous shocks
by putting in-place a 24/7 monitoring and analysis of security logs and external intelligence of the bank’s
information and technology assets.
The continuous advancement and innovations in technology and the endless need to improve services have
made digital banking a direction that the bank must tap into with adequate mitigating approach to handle
the inherent risks involved in the business. In response to the digitization needs, we have developed a
Digital Banking Framework that will enable the bank to adopt an overall risk appetite of “moderate risk‟
while adopting digitization processes in meeting the needs of our customers.
The Bank's BCM practices are governed by a robust BCM framework, that clearly identifies critical assets
and the vulnerabilities that those assets are subject to; It involves the analysis of the identified assets for
Business impact of disruption; It involves the development of mitigation, recovery and business continuity
plans; It involves the processes for plan implementation, including training and awareness; Finally, the
plan is continually reviewed for improvements.
The Incident Response Protocol consists of five key components: Incident Detection/ Preliminary
Assessment, Activation of the Incident Management Team, Evaluation and Containment of disaster impact,
Invocation of Recovery Plan/ Corrective Measures, Tracking recovery progress/ status of incident.
STRATEGIC RISK MANAGEMENT
In Access Bank, we define Strategic Risk as the process for identifying, assessing and managing risks and
uncertainties, affected by internal and external events or scenarios that could inhibit the bank’s ability to
achieve its strategy and strategic objectives with the ultimate goal of creating and protecting shareholder
and stakeholder value. It is a primary component and necessary foundation of our Enterprise Risk
Management.
Strategic risk management, therefore, is defined as current or prospective risk to earnings and capital
arising from adverse business decisions, improper implementation of decisions or lack of responsiveness
to changes in the business environment. It can also be defined as the risk associated with future business
plans and strategies, including plans for entering new business lines, expanding existing services through
mergers and acquisitions, and enhancing infrastructure.
A well-defined structure for managing strategic risk exists in Access Bank. It provides a process for the Bank
to identify and assess potential risks posed by its strategic plan, and consider whether they have adequate
capacity to withstand the risks. Strategic risk management involves various organizational functions within
the Bank. The following principles govern the Bank’s strategic risk management:
The Board and Senior Management are responsible for Strategic Risk Management and oversees the
effective functioning of the strategic risk management framework; The functional units (i.e. the units which
carry out business or operational functions) assists the Board and Senior management in formulating an
implementing strategies, and in providing input to the strategic planning and management processes; and
as well as implementing the strategic risk management framework.

Access Bank Plc Consolidated and separate financial statements For the year ended 31 December 2017 Risk Management Framework
51
The strategic risk management function supports the Board and senior management in managing strategic
risk and other related processes in the Bank.
Access Bank, in compliance with the Basel II principles, uses Internal Capital Adequacy Assessment Process
in assessing its Strategic Risk. To this end, it sees Strategic Risk as material risk that could result when the
bank fails to meet its performance targets, sufficient cashflow to maintain its operations that may result in
a negative impact on the bank’s operating result and financial condition.
This strategic risk could stem from adverse global economy, regulatory actions, improper analysis that can
impact the implementation of decisions, lack of responsiveness to industry changes, inability to respond
promptly to business opportunities, ineffective change management and communication process as well as
the nature and activities of competitors.
Based on the foregoing, the bank estimates a capital charge figure in relationship to its actual gross earnings
to cover its strategic risk exposure, in line with its tolerance level.
The measures and controls it has put in place include the following:
Strategic plans are approved and monitored by the board. Regular environmental scan, business strategy
sessions and workshops are set up to discuss business decisions, close monitoring to ensure that strategic
plans are properly aligned with the business model, regular performance review by EXCO, business plans
are approved by the board. The bank also maintains a well-defined succession plan, proper monitoring and
well defined structures to align its activities to international best practices.
REPUTATIONAL RISK MANAGEMENT
Reputational risk arises when the bank’s reputation is damaged by one or more reputational events from
negative publicity about the organization’s business practices, conduct or financial condition. The Bank’s
Strategic and Reputational Risk Management is mandated to protect the Bank from potential threats to its
reputation. The team continuously uses proactive means in minimizing the effects of reputational events,
thereby averting the likelihood of major reputational crises with the view of ultimately ensuring the survival
of the organization. The Bank has put in place a framework to properly articulate, analyze and manage
reputational risk factors.
Access Bank takes the management of reputational risks seriously because of their far-reaching implications
which are buttressed by the fact that the Bank operates under:
A highly regulated financial services industry with high visibility and vulnerability to regulatory
actions that may adversely impact its reputation. (e.g. corporate governance crises);
Keen competition and largely homogeneous products and services have led customers not to
perceive significant differences between financial service providers; and
Given the financing nature of products and services they provide, Banks are not only exposed to
their own reputation, but also to the reputation of their clients.
With banks operating and competing in a global environment, risks emerging from a host of different
sources and locations is difficult to keep up with and to know how best to respond if they occur. The effects
of the occurrence of a reputational risk event include but are not limited to the following:

Access Bank Plc Consolidated and separate financial statements For the year ended 31 December 2017 Risk Management Framework
52
Loss of current or future customers;
Loss of public confidence;
Loss of employees leading to an increase in hiring costs, or staff downtime;
Reduction in current or future business partners;
Increased costs of capitalization via credit or equity markets;
Regulatory sanctions;
Increased costs due to government regulations, fines, or other penalties; and
Loss of banking license.
It is Group policy that, at all times, the protection of the Group’s reputation should take priority over all
other activities, including revenue generation. Reputational risk will arise from the failure to effectively
mitigate one or more of country, credit, liquidity, market, regulatory and operational risk. It may also arise
from the failure to comply with social, environmental and ethical standards. All employees are responsible
for day-to-day identification and management of reputational risk.
The desired risk appetite for reputation is low risk (1). The bank will ensure that highest ethical standards
are followed at all times and the code of conduct policy will be strictly implemented.
During the year under review, the leadership of Strategic and Reputational Risk Management Unit was
strengthened with the recruitment of a senior management staff to fully drive the implementation of the
policies and strategies of the Bank with regards to its strategic and reputational risks.

Access Bank Plc Consolidated and separate financial statements For the year ended 31 December 2017 Risk Management Framework
53
Key Drivers of Reputational Risk
In identifying reputational risk factors, the Bank makes use of the output of a risk identification process. At
the end of the risk identification sessions, risk profiles are derived and analyzed and risk events identified
with possible negative reputational Impact on the Bank.
This analysis is performed against the background of the Bank’s corporate objectives, its corporate social
responsibility agenda and external factors. Access Bank seeks to leverage existing information from audit
findings, risk and control self-assessments, environmental scanning and scenario planning processes in
mitigating reputational risk issues
Backward-looking Analysis
analysis
Forward-looking
Analysis
Credit Market Operational Or Business Risk events
Financial Market Data e.g. Share Price
News Flows
Audit/Risk& Control Self Assessment (RCSA) findings
Corporate Social Responsibility (CSR) Agenda analysis
Corporate Objectives
Prioritization of key risks to reputation value
Portfolio view of reputation risks
Underlying risk drivers and
Historical information of effectiveness of response
Outputs
Identification of past events with high impact on stakeholder expectations and market premium;
Assessment of severity and duration of impact on market premiums and reputation value; and
Assessment of the effectiveness of the response.
Identification of events that could affect reputation value going forward;
• Assessment of the likelihood and impact of such potential events on reputation value; and
• Analysis of underlying reputation drivers.

Access Bank Plc Consolidated and separate financial statements For the year ended 31 December 2017 Risk Management Framework
54
Compilation of Trigger Events
In order to assist in the identification of key reputational risk events, triggers that would set off the risk
drivers should be compiled through workshops with participants from relevant business units. Following
table illustrates few trigger events for relevant risk drivers.
Risk Drivers Trigger Events
Corporate governance and
leadership
• Corporate frauds and scandals;
• Association with dishonest and disreputable
characters as directors, management
• Association with politically exposed persons
• Incidence of shareholders conflict and Board
Instability.
Regulatory Compliance • Non - Compliance with laws and regulation;
• Non submission of Regulatory returns
Delivering customer promise
• Security Failure
• Shortfall in quality of service/fair treatment;
• Bad behavior by employees
Workplace talent and culture
• Unfair employment practices
• Not addressing employee grievances
• Uncompetitive remuneration
Corporate social responsibility • Lack of community development initiatives
Corporate Culture
• Lack of appropriate culture to support the
achievement of business objective.
• Ineffective risk management practices.
• Unethical behaviors on the part of staff and
management.
• Lack of appropriate structure for employees
to voice their concerns
Risk Management and
Control Environment
• Inadequate Risk Management and Control
environment
• Continuous violations of existing policies and
Procedures
Financial Soundness and
Business viability
• Consistent poor financial performance
• Substantial losses from unsuccessful
Investment
Crisis Management
• Inadequate response to a crisis or even a
minor incident

Access Bank Plc Consolidated and separate financial statements For the year ended 31 December 2017 Risk Management Framework
55
Events data analysis
Events data analysis is conducted to assess the gap between performance of the bank and the expectation
of stakeholders. The nature of the gap and the reasons for the gap is analyzed for ensuing corrective action.
Example of events data analyzed is furnished below:
• Evaluating types of marketing efforts and implications for Reputational Risk;
• Analysis of number of accounts opened vs. closed;
• Calling effort analysis;
• Complaint log analysis; and
• Error resolution review.
Approach to managing reputation events
The Bank’s approach to managing reputation events, including any relevant strategy and policies, is
approved by the Board or its delegated committee and subject to periodic review and update by senior
management to ensure that it remains appropriate over time. In addition, the approach is well documented
and communicated to all relevant personnel.
Post reputation event reviews
After a reputation event, the post-event review will be conducted by Internal Audit and Risk Management
Division to identify any lessons learnt, or problems and weaknesses revealed, from the event. Such reviews
will be useful for providing feedback and recommendations for enhancing the Bank’s reputation risk
management process, and should at least be conducted on any major event affecting Access Bank. The
Board and senior management will be promptly informed of the results of any such review conducted so
that they can take appropriate actions to improve its approach to managing reputation risk.
CAPITAL RISK MANAGEMENT
Capital risk is the risk that the Bank’s total capital base is not properly managed in a prudent manner.
Capital management objectives:
The Group has a number of capital management objectives:
o to meet the capital ratios required by its regulators and the Group’s Board;
o to maintain an adequate level of available capital resources as cover for the economic
capital (EC) requirements calculated at a 99.95% confidence level;
o to generate sufficient capital to support asset growth;
o to maintain an investment grade credit rating; and
o to achieve a return above the cost of equity.
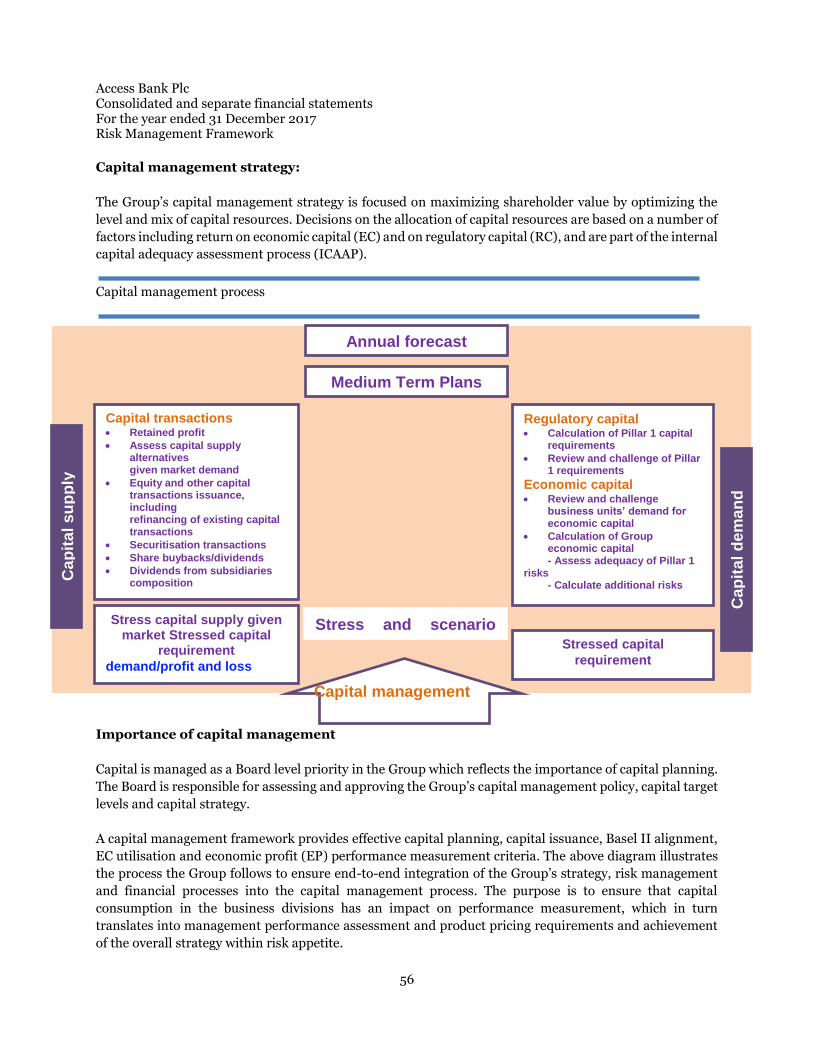
Access Bank Plc Consolidated and separate financial statements For the year ended 31 December 2017 Risk Management Framework
56
Capital management strategy:
The Group’s capital management strategy is focused on maximizing shareholder value by optimizing the
level and mix of capital resources. Decisions on the allocation of capital resources are based on a number of
factors including return on economic capital (EC) and on regulatory capital (RC), and are part of the internal
capital adequacy assessment process (ICAAP).
Capital management process
Importance of capital management
Capital is managed as a Board level priority in the Group which reflects the importance of capital planning.
The Board is responsible for assessing and approving the Group’s capital management policy, capital target
levels and capital strategy.
A capital management framework provides effective capital planning, capital issuance, Basel II alignment,
EC utilisation and economic profit (EP) performance measurement criteria. The above diagram illustrates
the process the Group follows to ensure end-to-end integration of the Group’s strategy, risk management
and financial processes into the capital management process. The purpose is to ensure that capital
consumption in the business divisions has an impact on performance measurement, which in turn
translates into management performance assessment and product pricing requirements and achievement
of the overall strategy within risk appetite.
Financial Forecast
Group Strategy
Performance Measurement
Risk Apetite
Capital transactions Retained profit
Assess capital supply alternatives given market demand
Equity and other capital transactions issuance, including refinancing of existing capital transactions
Securitisation transactions
Share buybacks/dividends
Dividends from subsidiaries composition
Medium Term Plans
Annual forecast
Regulatory capital Calculation of Pillar 1 capital
requirements
Review and challenge of Pillar 1 requirements
Economic capital Review and challenge
business units’ demand for economic capital
Calculation of Group economic capital - Assess adequacy of Pillar 1
risks - Calculate additional risks
Stressed capital
requirement
Stress capital supply given market Stressed capital
requirement
demand/profit and loss
Stress and scenario testing
Ca
pit
al
su
pp
ly
Cap
ital
de
ma
nd
Capital management


Access Bank Plc
Consolidated and separate financial statementsFor the year ended 31 December 2017
Consolidated statement of comprehensive income
In thousands of Naira Group Group Bank Bank
Notes December 2017 December 2016 December 2017 December 2016
Interest income 8 319,854,402 247,286,635 274,670,641 210,794,456
Interest expense 8 (156,402,857) (108,138,875) (143,133,607) (94,777,050)
Net interest income 163,451,545 139,147,760 131,537,034 116,017,406
Net impairment charge 9 (34,466,868) (21,952,819) (29,149,849) (17,641,127)
Net interest income after impairment charges 128,984,677 117,194,941 102,387,185 98,376,279
Fee and commission income 10 56,674,334 55,440,500 45,785,985 45,992,484
Fee and commission expense (77,017) (576,697) - -
Net fee and commission income 56,597,317 54,863,803 45,785,985 45,992,484
Net (loss)/gains on investment securities 11a,b (33,403,225) 55,051,078 (32,832,665) 54,968,917
Net foreign exchange income/(loss) 12 107,932,097 3,597,591 103,621,339 (94,434)
Other operating income 13 8,018,171 19,944,978 6,916,275 19,339,549
Personnel expenses 14 (54,806,795) (51,795,538) (41,773,512) (42,153,587)
Rent expenses (2,484,695) (2,810,090) (1,622,069) (1,632,377)
Depreciation 28 (11,237,951) (9,106,886) (9,499,180) (7,774,591)
Amortization 29 (2,407,886) (2,186,905) (1,946,601) (1,854,437)
Other operating expenses 15 (117,119,230) (94,413,516) (103,993,256) (84,588,227)
Profit before tax 80,072,482 90,339,456 67,043,501 80,579,576
Income tax 16 (18,081,628) (18,900,109) (13,804,679) (16,553,441)
Profit for the year 61,990,852 71,439,347 53,238,822 64,026,135
Other comprehensive income (OCI) net of income tax :
items that will not be subsequently reclassified to income statement:
Remeasurements of post-employment benefit obligations 439,597 2,590,139 439,597 2,590,139
Items that may be subsequently reclassified to the income statement:
Foreign currency translation differences for foreign subsidiaries
- Unrealised gains during the year 15,768,641 19,458,036 - -
Net changes in fair value of AFS financial instruments
-Fair value changes during the year 12,791,695 10,012,498 11,913,378 10,063,039
Other comprehensive gain, net of related tax effects 28,999,933 32,060,674 12,352,975 12,653,178
Total comprehensive income for the year 90,990,785 103,500,021 65,591,796 76,679,313
Profit attributable to:
Owners of the bank 61,977,762 71,117,025 53,238,822 64,026,135
Non-controlling interest 38 13,090 322,322 - -
Profit for the year 61,990,852 71,439,347 53,238,822 64,026,135
Total comprehensive income attributable to:
Owners of the bank 90,109,906 101,241,269 65,591,796 76,679,313
Non-controlling interest 880,879 2,258,752 - -
Total comprehensive income for the year 90,990,785 103,500,021 65,591,796 76,679,313
Earnings per share attributable to ordinary shareholders
Basic (kobo) 17 218 250 184 221
Diluted (kobo) 17 214 246 184 221
The notes are an integral part of these consolidated financial statements.
64

Access Bank Plc
Consolidated and separate financial statementsFor the year ended 31 December 2017
Consolidated statement of financial position
As at 31 December 2017
Group Group Bank Bank
In thousands of Naira Notes December 2017 December 2016 December 2017 December 2016
Assets
Cash and balances with banks 18 953,944,176 713,889,105 657,144,247 517,997,249
Investment under management 19 20,257,131 14,871,247 20,257,131 14,871,247
Non pledged trading assets 20 46,854,061 44,629,579 43,016,990 44,629,579
Derivative financial assets 21 93,419,293 156,042,984 92,390,219 155,772,662
Loans and advances to banks 22 68,114,076 45,203,002 101,429,001 104,006,574
Loans and advances to customers 23 1,995,987,627 1,809,459,172 1,771,282,739 1,594,562,345
Pledged assets 24 447,114,404 314,947,502 440,503,327 314,947,502
Investment securities 25 278,167,757 229,113,772 121,537,303 161,200,642
Other assets 26 82,753,431 63,255,054 65,189,797 50,594,480
Investment in subsidiaries 27b - - 87,794,631 59,239,252
Property and equipment 28 97,114,640 84,109,052 83,676,722 71,824,472
Intangible assets 29 8,295,855 6,939,555 5,981,905 5,173,784
Deferred tax assets 30 740,402 1,264,813 - -
4,092,762,853 3,483,724,837 3,490,204,012 3,094,819,788
Asset classified as held for sale 31 9,479,967 140,727 9,479,967 140,727
Total assets 4,102,242,820 3,483,865,564 3,499,683,979 3,094,960,515
Liabilities
Deposits from financial institutions 32 450,196,970 167,356,583 276,140,835 95,122,188
Deposits from customers 33 2,244,879,075 2,089,197,286 1,910,773,713 1,813,042,872
Derivative financial liabilities 21 5,332,177 30,444,501 5,306,450 30,275,181
Current tax liabilities 16 7,489,586 5,938,662 4,547,920 5,004,160
Other liabilities 34 253,914,174 113,571,240 238,695,686 107,538,941
Deferred tax liabilities 30 8,764,262 3,699,050 7,848,515 3,101,753
Debt securities issued 35 302,106,706 316,544,502 302,106,706 243,952,418
Interest-bearing borrowings 36 311,617,187 299,543,707 282,291,141 372,179,785
Retirement benefit obligation 37 2,495,274 3,075,453 2,481,916 3,064,597
3,586,795,411 3,029,370,984 3,030,192,882 2,673,281,895
Total liabilities
Equity
Share capital and share premium 38 212,438,802 212,438,802 212,438,802 212,438,802
Retained earnings 117,701,679 93,614,030 120,218,603 93,329,188
Other components of equity 38 178,399,413 142,194,720 136,833,692 115,910,630
#######
Total equity attributable to owners of theBank
508,539,894 448,247,552 469,491,097 421,678,620
Non controlling interest 38 6,907,515 6,247,028 - -
Total equity 515,447,409 454,494,580 469,491,097 421,678,620
Total liabilities and equity 4,102,242,820 3,483,865,564 3,499,683,979 3,094,960,515
Signed on behalf of the Board of Directors on 30 January, 2018 by:
GROUP MANAGING DIRECTOR
Herbert Wigwe
FRC/2013/ICAN/00000001998Roosevelt Ogbonna
FRC/2017/ICAN/00000016638
GROUP DEPUTY MANAGING DIRECTOR
CHIEF FINANCIAL OFFICER
Oluseyi Kumapayi
FRC/2013/ICAN/00000000911
65

Access Bank Plc
Consolidated and separate financial statementsFor the year ended 31 December 2017
Consolidated statement of changes in equity
In thousands of Naira ForeignGroup Regulatory Other Share currency Non
Share Share risk regulatory scheme Treasury Capital Fair value translation Retained Controlling Totalcapital premium reserve reserves reserve Shares reserve reserve reserve earnings Total interest Equity
Balance at 1 January 2017 14,463,986 197,974,816 42,932,550 62,615,212 1,211,978 (3,286,375) 3,489,080 23,240,250 11,992,025 93,614,030 448,247,552 6,247,028 454,494,580
Total comprehensive income for the year:Profit for the year - - - - - - - - - 61,977,762 61,977,762 13,090 61,990,852
Other comprehensive income, net of taxUnrealised foreign currency translation difference - - - - - - - - 14,821,475 - 14,821,475 947,166 15,768,641Actuarial gain on remeasurement of retirement benefit (net oftax) - - - - - - - - - 439,597 439,597 - 439,597Net changes in fair value of AFS financial instruments - - - - - - - 12,871,072 - - 12,871,072 (79,377) 12,791,695
Total other comprehensive income - - - - - - 12,871,072 14,821,475 439,597 28,132,144 867,789 28,999,933
Total comprehensive income - - - - - - - 12,871,072 14,821,475 62,417,359 90,109,906 880,879 90,990,785
Transactions with equity holders, recorded directly inequity:
Transfers during the year - - 487,737 7,946,944 - - - - - (8,434,681) - - -
Transactions with non-controlling interests2
- - - - - - - - - (11,091,849) (11,091,849) (220,392) (11,312,241)Scheme shares - - - - 1,170,693 (742,535) - - - - 428,158 - 428,158Vested shares - - - - (350,693) - - - - - (350,693) - (350,693)Dividend paid to equity holders - - - - - - - - - (18,803,180) (18,803,180) - (18,803,180)Total contributions by and distributions to equityholders - - 487,737 7,946,944 820,000 (742,535) - - - (38,329,710) (29,817,564) (220,392) (30,037,956)
Balance at 31 December 2017 14,463,986 197,974,816 43,420,287 70,562,156 2,031,978 (4,028,910) 3,489,080 36,111,322 26,813,500 117,701,679 508,539,894 6,907,515 515,447,410
Consolidated statement of changes in equity
In thousands of Naira ForeignGroup Regulatory Other Share currency Non
Share Share risk regulatory Scheme Treasury Capital Fair value translation Retained Controlling Total
capital premium reserve reserves1
reserve Shares reserve reserve reserve earnings Total interest Equity
Balance at 1 January 2016 14,463,986 197,974,816 39,625,042 50,097,911 554,898 (1,732,771) 3,489,080 13,268,889 (5,570,719) 51,730,369 363,901,501 3,899,966 367,801,467
Total comprehensive income for the year:Profit for the year 71,117,025 71,117,025 322,322 71,439,348
Other comprehensive income, net of taxUnrealised foreign currency translation difference - - - - - - - - 17,562,744 - 17,562,744 1,895,292 19,458,036Realised foreign currency translation difference - - - - -Actuarial gains on remeasurement of retirement benefit (net fotax) - - - - - - - - - 2,590,139 2,590,139 - 2,590,139Net changes in fair value of AFS financial instruments - - - - - - - 9,971,361 - - 9,971,361 41,138 10,012,498
Total other comprehensive income - - - - - - - 9,971,361 17,562,744 2,590,139 30,124,243 1,936,429 32,060,673
Total comprehensive income - - - - - - - 9,971,361 17,562,744 73,707,164 101,241,269 2,258,752 103,500,021
Transactions with equity holders, recorded directly inequity:
Transfers during the year - - 3,307,508 12,517,301 - - - - - (15,824,809) - - -Deemed disposal of subsidiaries - - - - - - - - - (88,310) (88,310) 88,310 0Scheme shares - - - - 1,061,070 (1,553,604) - - - - (492,534) - (492,534)Vested Shares - - - - (403,990) - - - - (403,990) - (403,990)Dividend paid to equity holders - - - - - - - - - (15,910,384) (15,910,384) - (15,910,384)Total contributions by and distributions to equityholders - - 3,307,508 12,517,301 657,080 (1,553,604) - - - (31,823,503) (16,895,218) 88,310 (16,806,908)
Balance at 31 December 2016 14,463,986 197,974,816 42,932,550 62,615,212 1,211,978 (3,286,375) 3,489,080 23,240,250 11,992,025 93,614,031 448,247,552 6,247,028 454,494,580
Attributable to owners of the Bank
Attributable to owners of the Bank
66

Access Bank Plc
Consolidated and separate financial statementsFor the year ended 31 December 2017
Statement of changes in equity
In thousands of Naira
Regulatory Other Share
Bank Share Share risk regulatory Scheme Capital Fair value Retained Total
capital premium reserve reserve reserve Reserve reserve earnings Equity
Balance at 1 January, 2017 14,463,986 197,974,816 35,058,266 53,001,072 1,008,118 3,489,081 23,354,093 93,329,188 421,678,620
Total comprehensive income for the year:
Profit for the year - - - - - - - 53,238,822 53,238,822
Other comprehensive income, net of tax
Actuarial gain on remeasurement of retirement benefit - - - - - - - 439,597 439,597
Net changes in fair value of AFS financial instruments - - - - - - 11,913,378 - 11,913,378
Total other comprehensive income - - - - - - 11,913,378 439,597 12,352,975
Total comprehensive income - - - - - - 11,913,378 53,678,419 65,591,796
Transactions with equity holders, recorded directly in equity:
Transfers for the year - - - 7,985,824 - - - (7,985,824) -
Dividend paid to equity holders - - - - - - - (18,803,180) (18,803,180)
Scheme shares - - - - 1,023,860 - - - 1,023,860Total contributions by and distributions to equity holders - - - 7,985,824 1,023,860 - - (26,789,004) (17,779,320)
Balance at 31 December 2017 14,463,986 197,974,816 35,058,266 60,986,896 2,031,978 3,489,081 35,267,471 120,218,603 469,491,098
Statement of changes in equity
In thousands of Naira
Bank Regulatory Other Share
Share Share risk regulatory Scheme Capital Fair value Retained Total
capital premium reserve reserves1reserve Reserve reserve earnings Equity
Balance at 1 January, 2016 14,463,986 197,974,816 37,826,382 43,397,152 527,331 3,489,081 13,291,054 49,459,102 360,428,904
Total comprehensive income for the year:
Profit for the year - - - - - - - 64,026,135 64,026,135
Other comprehensive income, net of tax
Actuarial gain on remeasurement of retirement benefit - - - - - - - 2,590,139 2,590,139
Net changes in fair value of AFS financial instruments - - - - - - 10,063,039 - 10,063,039
Total other comprehensive income - - - - - - 10,063,039 2,590,139 12,653,178
Total comprehensive income - - - - - - 10,063,039 66,616,274 76,679,313
Transactions with equity holders, recorded directly in equity:
Transfers for the year - - (2,768,116) 9,603,920 - - - (6,835,804) -
Dividend paid to equity holders - - - - - - - (15,910,384) (15,910,384)
Scheme shares - - - - 884,777 - - - 884,777
Vested Shares - - - - (403,990) - - - (403,990)
Total contributions by and distributions to equity holders - - (2,768,116) 9,603,920 480,787 - - (22,746,188) (15,429,597)
Balance at 31 December 2016 14,463,986 197,974,816 35,058,266 53,001,072 1,008,118 3,489,081 23,354,093 93,329,188 421,678,620
67

Access Bank Plc
Consolidated and separate financial statementsFor the year ended 31 December 2017
Consolidated statement of cash flows
Group Group Bank Bank
In thousands of Naira Note December 2017 December 2016 December 2017 December 2016
Cash flows from operating activities
Profit before income tax 80,072,482 90,339,456 67,043,501 80,579,576
Adjustments for:
Depreciation 28 11,237,951 9,106,886 9,499,180 7,774,591
Amortization 29 2,407,886 2,186,905 1,946,601 1,854,437
Gain on disposal of property and equipment 13 (10,090) (167,340) (902) (143,985)
Gain on disposal of available for sale securities 13 - (16,206,410) - (16,206,410)
Impairment on financial assets 9 34,466,868 21,952,819 29,149,849 17,641,128
Additional gratuity provision 14 753,058 1,207,851 753,058 1,196,995
Restricted share performance plan expense 14 1,170,693 1,061,070 1,023,860 884,777
Property and equipment written off 28 - 361,001 - 155,143
Net interest income 8 (163,451,545) (137,289,619) (131,537,034) (116,017,406)
Unrealised foreign exchange loss on revaluation 12 12,330,254 5,246,704 12,526,107 5,326,545
Dividends on available for sale equity securities 13 (2,357,175) (860,339) (2,357,175) (860,339)
(23,379,618) (23,061,015) (11,952,956) (17,814,948)
Changes in operating assets
Non-pledged trading assets (2,532,464) 7,622,062 1,612,589 7,622,062
Derivative financial instruments 39,272,532 (50,771,390) 38,413,712 (50,061,510)
Pledged assets (132,166,902) (111,232,105) (125,555,825) (114,482,878)
Restricted deposits (93,261,157) (130,490,427) (92,845,896) (129,978,902)
Loans and advances to banks and customers (157,481,610) (376,205,828) (146,875,704) (293,285,572)
Other assets (22,207,412) 17,588,435 (17,301,652) 24,813,416
Changes in operating liabilities
Deposits from financial institutions 282,378,081 94,853,538 180,413,510 32,098,779
Deposits from customers 128,556,097 368,213,235 73,170,265 279,424,380
Other liabilities 140,342,933 44,215,293 131,156,489 43,444,581
Payment to gratuity benefit holders (707,744) - (707,744) -
Interest paid on deposits to banks and customers (101,532,364) (77,202,482) (90,953,447) (62,659,950)
Interest received on loans and advances 204,920,752 228,932,846 173,647,956 162,170,378
262,201,124 (7,537,839) 112,221,297 (118,710,163)
Income tax paid (9,458,675) (8,007,140) (7,860,615) (5,222,302)
Net cash generated from/(used in) operating activities 252,742,450 (15,544,978) 104,360,682 (123,932,465)
Cash flows from investing activities
Acquisition of investment securities (933,672,018) (512,931,206) (600,884,620) (442,207,340)
Interest received on investment securities 58,941,173 38,148,395 44,099,567 23,716,900
Investment under management - (1,830,000) - (1,830,000)
Dividend received 13 2,357,175 860,339 2,357,175 860,339
Acquisition of property and equipment 28 (22,624,987) (18,042,759) (22,383,831) (14,703,152)
Proceeds from the sale of property and equipment 1,054,864 562,167 1,033,303 436,417
Acquisition of intangible assets 29 (3,454,724) (2,537,024) (2,754,724) (2,050,313)
Proceeds from disposal of asset held for sale 30,000 39,116 30,000 39,116
Proceeds from matured investment securities 346,747,158 121,997,751 247,256,905 110,725,856
Additional investment in subsidiaries - - (27,678,395) (12,350,316)
Proceeds from sale of investment securities 543,982,533 403,664,891 425,785,912 388,554,135
Proceeds from sale of equity investments - 16,347,587 - 16,347,587
Net cash generated from investing activities (6,638,826) 46,279,257 66,861,290 67,539,229
Cash flows from financing activities
Interest paid on interest bearing borrowings and debt securities issued
(52,522,041) (23,198,980) (57,955,972) (24,892,489)
Proceeds from interest bearing borrowings 36(m) 43,577,454 69,307,930 13,337,948 69,307,930
Repayment of interest bearing borrowings 36(m) (34,371,397) (28,626,050) (99,011,336) (63,090,135)
Purchase of own shares (742,535) (1,553,603) - -
Dividends paid to owners (18,803,180) (15,910,384) (18,803,180) (15,910,384)
Debt securities issued 35 121,486,981 86,904,970 121,486,981 86,904,970
Repayment of debt securities issued 35 (151,694,953) (10,430,980) (79,102,869) (11,686,080)
Net cash (used in)/generated from financing activities (93,069,671) 76,492,903 (120,048,427) 40,633,812
Net increase/(decrease) in cash and cash equivalents 153,033,953 107,227,182 51,173,545 (15,759,425)
Cash and cash equivalents at beginning of year 40 341,245,964 234,044,111 147,637,972 163,405,750
Net increase/ (decrease) in cash and cash equivalents 153,033,953 107,227,182 51,173,545 (15,759,425)
Effect of exchange rate fluctuations on cash held (855,618) (25,329) - (8,353)
Cash and cash equivalents at end of year 40 493,424,299 341,245,964 198,811,517 147,637,972
68

Access Bank Plc
Consolidated and separate financial statements
For the year ended 31 December 2017
1.0 General information
2.0 Statement of compliance with International Financial Reporting Standards
3.0 Basis of preparation
3.1 Summary of significant accounting policies
(a) Functional and presentation currency
(b) Basis of measurement
•
•
•
•
•
• share based payment at fair value or an approximation of fair value allowed by the relevant standard.
(c) Use of estimates and judgments
Access Bank Plc (“the Bank”) is a company domiciled in Nigeria. The address of the Bank’s registered office is Plot999c, Danmole Street, off Adeola Odeku/Idejo Street, Victoria Island, Lagos (formerly Plot 1665, Oyin Jolayemi,Victoria Island, Lagos). The consolidated financial statements of the Bank for the year ended 31 December 2017comprise the Bank and its subsidiaries (together referred to as “the Group” and seperately referred to as “Groupentities”). The Group is primarily involved in investment, corporate, commercial and retail banking and is listed onthe Nigerian Stock Exchange.
The consolidated and separate financial statements of the Group and Bank respectively, have been prepared inaccordance with International Financial Reporting Standards (IFRS) issued by the International AccountingStandards Board (IASB). Additional information required by national regulations is included where appropriate.
The principal accounting policies applied in the preparation of these consolidated financial statements are set outbelow. These policies have been consistently applied to all the years presented, unless otherwise stated.
This financial statements has been prepared in accordance with International Financial Reporting Standards(IFRSs) and interpretations issued by the IFRS Interpretations Committee (IFRS IC) applicable to companiesreporting under IFRS. This consolidated financial statement comprise the consolidated statement of comprehensiveincome, the consolidated statement of financial position, the consolidated statements of changes in equity, theconsolidated cash flow statement and the notes.
These consolidated financial statements are presented in Naira, which is the Group's presentation currency; exceptwhere indicated, financial information presented in Naira has been rounded to the nearest thousand.
These consolidated and separate financial statements have been prepared on the historical cost basis except for thefollowing:
derivative financial instruments are measured at fair value.
non-derivative financial instruments at fair value through profit or loss are measured at fair value.
available-for-sale financial assets are measured at fair value.
These financial statements were authorised for issue by the Board of Directors on 30 January 2018. The directorshave the power to amend and reissue the financial statements.
the liability for defined benefit obligations is recognised as the present value of the defined benefit obligationand related current service cost
non-current assets held for sale measured at fair value less costs to sell.
The preparation of the consolidated financial statements in conformity with IFRSs requires management to makejudgments, estimates and assumptions that affect the application of policies and reported amounts of assets andliabilities, income and expenses. Actual results may differ from these estimates.
The estimates and underlying assumptions are reviewed on an ongoing basis. Revisions to accounting estimates arerecognised in the year in which the estimate is revised, if the revision affects only that year, or in the year of therevision and future years, if the revision affects both current and future years.
69
Access Bank Plc
Consolidated and separate financial statements
For the year ended 31 December 2017
3.2 Changes in accounting policy and disclosures
(a) New and amended standards adopted by the group
There is no material impact on the accounting policies, financial position or performance of the Group.
(iii) Amendments to IAS 12 – Income Taxes. (with effective date of 1 January 2017)
(iv) Amendments IAS 7 – Statement of Cash Flows. (with effective date of 1 January 2017)
(ii) Amendments to IAS 19 - Defined Benefit Plans: Employee Contributions
Amends IAS 19 to clarify that high quality corporate bonds used in estimating the discount rate for post-employment benefits should be denominated in the same currency as the benefits to be paid (thus, the depth of themarket for high quality corporate bonds should be assessed at currency level).
Amends IAS 12 to clarify accounting treatment for deferred tax assets for unrealized losses on debt instrumentsmeasured at fair value. The amendments clarify that an entity needs to consider whether tax law restricts thesources of taxable profits against which it may make deductions on the reversal of that deductible temporarydifference. Furthermore, the amendments provide guidance on how an entity should determine future taxableprofits and explains in which circumstances taxable profit may include the recovery of some assets for more thantheir carrying amount.
Amends IAS 7 to include disclosures that enable users of financial statements to evaluate changes in liabilitiesarising from financing activities. The amendment specifies that the following changes arising from financingactivities are disclosed (to the extent necessary): (i) changes from financing cash flows; (ii) changes arising fromobtaining or losing control of subsidiaries or other businesses; (iii) the effect of changes in foreign exchange rates;(iv) changes in fair values; and (v) other changes.
Information about significant areas of estimation uncertainties and critical judgments in applying accountingpolicies that have the most significant effect on the amounts recognised in the consolidated and separate financialstatements are described in note 4.
Below are the IFRSs and International Financial Reporting Interpretations Committee (IFRIC) interpretations thatare effective for the first time for the financial year beginning on or after 1 January 2017 that are relevant to thegroup.
None of these standards were early adopted in the prior year by the Group as early adoption is not permitted by theFinancial Reporting Council of Nigeria (FRCN).
(i) Amendments to IFRS 7 - Financial Instruments: Disclosures
Amends IFRS 7 to remove the phrase ‘and interim years within the annual years’ from paragraph 44R, clarifyingthat offsetting disclosures is not required in the condensed interim financial report. However, if the IFRS 7disclosures provide a significant update to the information reported in the most recent annual report, an entity isrequired to include the disclosures in the condensed interim financial report.
On servicing contract, it clarifies that a servicing contract that includes a fee can constitute continuing involvementin a financial asset. An entity must assess the nature of the fee and arrangement against the guidance for continuinginvolvement in paragraphs IFRS 7.B30 and IFRS 7.42C in order to assess whether the disclosures are required. Thisstandard does not have any impact on this financial statement.
70

Access Bank Plc
Consolidated and separate financial statements
For the year ended 31 December 2017
(b) New and amended standards and interpretations not yet adopted by the Group
IFRS 9 Financial Instruments: Classification and Measurement (effective 1 January 2018)
S/N
1 Use external lifetime PD term structure
2 Assume external 12M is a reasonable proxy
3 Combine internal & external sources
4 Combined approach
5 Probability weighted provisions
6 Probability weighted provisions
7 Last re-price
9 Internal and external credit scores
10 Management overlays/Judgement
11 Combine internal and external credit scores and metrics
12 Prudential guidelines definition
13 Specific qualitative information
14 No. Other factors will be considered
15 Yes, for specific portfolios
16 Comparatives will not be restated
As at year end, a number of standards and interpretations, and amendments thereto, had been issued by the IASBwhich are not yet effective for these consolidated financial statements. Details are set out below.
The International Accounting Standards Board (IASB) issued the final version of IFRS 9 Financial Instruments inJuly 2014. The standard is effective for annual periods beginning on or after 1 January 2018, with early adoptionpermitted. It replaces IAS 39 Financial Instruments: Recognition and Measurement.As permitted by the transitional provisions of IFRS 9, the Group elected not to restate comparative figures.Any adjustments to the carrying amounts of financial assets and liabilities at the date of transition will berecognised in the opening retained earnings and other reserves of the current period.The adoption of IFRS 9 has resulted in changes in our accounting policies for recognition, classification andmeasurement of financial assets and financial liabilities and impairment of financial assets. IFRS 9 also significantlyamends other standards dealing with financial instruments such as IFRS 7 Financial Instruments: Disclosures.Set out below are disclosures relating to the impact of the adoption of IFRS 9 on the Group.
Classification and measurement of financial instruments
The measurement category and the carrying amount of financial assets and liabilities in accordance with IAS 39 andIFRS 9 at 1 January 2018 are compared as follows:
There were no changes to the classification and measurement of financial liabilities, other than to changesin the fairvalue of financial liabilities designated at fair value through profit or loss that are attributable to changes in theinstrument’s credit risk, which are now presented in other comprehensive income.
Decisions points
The implementation of IFRS 9 requires certain decisions to be taken by the management and approved in line therelevant governance framework. Management has assessed the complexity of each decision point and identified arange of policy options available for each. Management also considered conceptual suitability, implementationfeasibility and regulatory directives on each option. A summary of key decision points, policy options for eachdecision point and the policy chosen by management is shown below:
Area Decision
Determining lifetime PDs
Determining other lifetime inputs
Source of macroeconomic inputs
Quantification of impact
Incorporating multiple scenarios
Incorporating multiple non-macroeconomic scenarios
Origination date
Key origination inputs
Forward looking data
Metrics for credit risk
Definition of default
Use of qualitative information within transition test
Reliance on only 30 days past due for transition test
Rebuttal of 30 days past due assumption
Restating comparatives
71

Access Bank Plc
Consolidated and separate financial statements
For the year ended 31 December 2017
Stage 1 Stage 2 Stage 3
(InitialRecognition)
(Significant increase incredit risk since initialrecognition)
(Credit-impaired assets)
12-monthsexpected creditlosses
Lifetime expected creditlosses
Lifetime expected creditlosses
Impairment
The Group assesses on a forward-looking basis the expected credit losses (‘ECL’) associated with its debt instrumentassets carried at amortised cost and FVOCI and with the exposure arising from loan commitments and financialguarantee contracts. The Group recognises a loss allowance for such losses at each reporting date. Themeasurement of ECL reflects:
• An unbiased and probability-weighted amount that is determined by evaluating a range of possible outcomes;• The time value of money; and• Reasonable and supportable information that is available without undue cost or effort at the reporting date aboutpast events, current conditions and forecasts of future economic conditions.
Staging Assessment
IFRS 9 outlines a ‘three-stage’ model for impairment based on changes in credit quality since initial recognition assummarised below:
• A financial instrument that is not credit-impaired on initial recognition is classified in “Stage 1” and has its creditrisk continuously monitored by the Group.• If a significant increase in credit risk (“SICR”) since initial recognition is identified, the financial instrument ismoved to “Stage 2’ but is not yet deemed to be credit-impaired.• If the financial instrument is credit-impaired, the financial instrument is then moved to “Stage 3”.• Financial instruments in Stage 1 have their ECL measured at an amount equal to the portion of lifetime expectedcredit losses that result from default events possible within the next 12 months. Instruments in Stages 2 or 3 havetheir ECL measured based on expected credit losses on a lifetime basis.• A pervasive concept in measuring ECL in accordance with IFRS 9 is that it should consider forward lookinginformation.• Purchased or originated credit-impaired financial assets are those financial assets that are credit-impaired oninitial recognition. Their ECL is always measured on a lifetime basis (Stage 3).
Change in credit quality since initial recognition
Stage 1 and Stage 2 credit loss allowances effectively replace the collectively-assessed allowance for loans not yetidentified as impaired recorded under IAS 39, while Stage 3 credit loss allowances effectively replace theindividually assessed allowances for impaired loans. Under IFRS 9, the population of financial assets andcorresponding allowances disclosed as Stage 3 will not necessarily correspond to the amounts of financial assetscurrently disclosed as impaired in accordance with IAS 39. Consistent with IAS 39, loans are written off when thereis no realistic probability of recovery. Accordingly, our policy on when financial assets are written-off will notsignificantly change on adoption of IFRS 9.Because all financial assets within the scope of the IFRS 9 impairment model will be assessed for at least 12-monthsof expected credit losses, and the population of financial assets to which full lifetime expected credit losses applies islarger than the population of impaired loans for which there is objective evidence of impairment in accordance withIAS 39, loss allowances are generally expected to be higher under IFRS 9relative to IAS 39.Changes in the required credit loss allowance, including the impact of movements between Stage 1 (12 monthexpected credit losses) and Stage 2 (lifetime expected credit losses), will be recorded in profit or loss. Because of theimpact of moving between 12 month and lifetime expected credit losses and the application of forward lookinginformation, provisions are expected to be more volatile under IFRS 9 than IAS 39.
72

Access Bank Plc
Consolidated and separate financial statements
For the year ended 31 December 2017
Measurement
The measurement of expected credit losses will primarily be based on the product of the instrument’s probability ofdefault (PD), loss given default (LGD), and exposure at default (EAD), discounted to the reporting date. The maindifference between Stage 1 and Stage 2 expected credit losses is the respective PD horizon. Stage 1 estimates will usea maximum of a 12-month PD while Stage 2 estimates will use a lifetime PD.Stage 3 estimates will continue to leverage existing processes for estimating losses on impaired loans, however,these processes will be updated to reflect the requirements of IFRS 9, including the requirement to considermultiple forward-looking scenarios. The Group will combine the regulatory prudential guidelines with otherrelevant qualitative factors in the "definition of default".
An expected credit loss estimate will be produced for each individual exposure, including amounts which are subjectto a more simplified model for estimating expected credit losses; however the relevant parameters will be modeledon a collective basis using largely the same underlying data pool supporting our stress testing and regulatory capitalexpected loss processes. Models have been developed, primarily leveraging our existing models for enterprise-widestress testing.For the small percentage of our portfolios that lack detailed historical information and/or loss experience, we willapply simplified measurement approaches that may differ from what is described above. These approaches havebeen designed to maximize the available information that is reliable and supportable for each portfolio and may becollective in nature.Expected credit losses must be discounted to the reporting period using the effective interest rate.
Significant increase in credit risk (SICR)
The Group considers a financial instrument to have experienced a significant increase in credit risk when one ormore of the following quantitative, qualitative or backstop criteria have been met:
Quantitative criteria:The remaining Lifetime PD at the reporting date has increased, compared to the residual Lifetime PD expected atthe reporting date when the exposure was first recognised.
Deterioration in the credit rating of an obligor either based on the Bank’s internal rating system or an internationalcredit rating. However the downgrade considers movement from a grade band to another e.g. Investment grade toStandard.The Bank also considers accounts that meet the criteria to be put on the watchlist bucket to have significantlyincreased in credit risk.
Qualitative criteria:
For Retail loans, if the borrower meets one or more of the following criteria:• In short-term forbearance• Direct debit cancellation• Extension to the terms granted• Previous arrears within the last [12] months
For Corporate portfolio, if the borrower is on the Watchlist and/or the instrument meets one or more of thefollowing criteria:• Significant increase in credit spread• Significant adverse changes in business, financial and/or economic conditions in which the borrower operates• Actual or expected forbearance or restructuring• Actual or expected significant adverse change in operating results of the borrower• Significant change in collateral value (secured facilities only) which is expected to increase risk of default• Early signs of cashflow/liquidity problems such as delay in servicing of trade creditors/loans
The assessment of SICR incorporates forward-looking information and is performed on a quarterly basis at aportfolio level for all Retail financial instruments held by the Group. In relation to Wholesale and Treasury financialinstruments, where a Watchlist is used to monitor credit risk, this assessment is performed at the counterparty leveland on a periodic basis. The criteria used to identify SICR are monitored and reviewed periodically forappropriateness by the independent Credit Risk team.
73

Access Bank Plc
Consolidated and separate financial statements
For the year ended 31 December 2017
Backstop
A backstop indicator is applied and the financial instrument considered to have experienced a significant increase incredit risk if the borrower is more than 30 days past due and 90 days past due on its contractual payments for bothstage 2 and stage 3 respectively.
Definition of default and credit-impaired assetsThe Group defines a financial instrument as in default, which is fully aligned with the definition of credit-impaired,when it meets one or more of the following criteria:
Quantitative criteriaThe borrower is more than 90 days past due on its contractual payments.
Qualitative criteria
The borrower meets unlikeliness to pay criteria, which indicates the borrower is in significant financial difficulty.These are instances where:
The criteria above have been applied to all financial instruments held by the Group and are consistent with thedefinition of default used for internal credit risk management purposes. The default definition has been appliedconsistently to model the Probability of Default (PD), Exposure at Default (EAD) and Loss given Default (LGD)throughout the Group’s expected loss calculations.
Measuring ECL Explanation of inputs, assumptions and estimation techniques
The Expected Credit Loss (ECL) is measured on either a 12-month (12M) or Lifetime basis depending on whether asignificant increase in credit risk has occurred since initial recognition or whether an asset is considered to be credit-impaired. Expected credit losses are the discounted product of the Probability of Default (PD), Exposure at Default(EAD), and Loss Given Default (LGD), defined as follows:
• The PD represents the likelihood of a borrower defaulting on its financial obligation (as per Definition of defaultand credit-impaired above), either over the next 12 months (12M PD), or over the remaining lifetime (Lifetime PD)of the obligation.
• EAD is based on the amounts the Group expects to be owed at the time of default, over the next 12 months (12MEAD) or over the remaining lifetime (Lifetime EAD). For example, for a revolving commitment, the Group includesthe current drawn balance plus any further amount that is expected to be drawn up to the current contractual limitby the time of default, should it occur.
• Loss Given Default represents the Group’s expectation of the extent of loss on a defaulted exposure. LGD varies bytype of counterparty, type and seniority of claim and availability of collateral or other credit support. LGD isexpressed as a percentage loss per unit of exposure at the time of default (EAD). LGD is calculated on a 12-month orlifetime basis, where 12-month LGD is the percentage of loss expected to be made if the default occurs in the next 12months and Lifetime LGD is the percentage of loss expected to be made if the default occurs over the remainingexpected lifetime of the loan.
The Lifetime PD is developed by applying a maturity profile to the current 12M PD. The maturity profile looks athow defaults develop on a portfolio from the point of initial recognition throughout the lifetime of the loans. Thematurity profile is based on historical observed data and is assumed to be the same across all assets within aportfolio and credit grade band. This is supported by historical analysis.
• The borrower is in long-term forbearance• The borrower is deceased• The borrower is insolvent• The borrower is in breach of financial covenant(s)• An active market for that financial asset has disappeared because of financial difficulties• Concessions have been made by the lender relating to the borrower’s financial difficulty
• It is becoming probable that the borrower will enter bankruptcy• Financial assets are purchased or originated at a deep discount that reflects the incurred credit losses.
74

Access Bank Plc
Consolidated and separate financial statements
For the year ended 31 December 2017
Incorporation of forward looking information and multiple economic scenarios
The 12-month and lifetime EADs are determined based on the expected payment profile, which varies by producttype.
• For amortising products and bullet repayment loans, this is based on the contractual repayments owed by theborrower over a 12month or lifetime basis. This will also be adjusted for any expected overpayments made by aborrower. Early repayment/refinance assumptions are also incorporated into the calculation.
• For revolving products, the exposure at default is predicted by taking current drawn balance and adding a creditconversion factor which allows for the expected drawdown of the remaining limit by the time of default. Theseassumptions vary by product type and current limit utilisation band, based on analysis of the Group’s recent defaultdata.
The 12-month and lifetime LGDs are determined based on the factors which impact the recoveries made postdefault. These vary by product type.
• For secured products, this is primarily based on collateral type and projected collateral values, historical discountsto market/book values due to forced sales, time to repossession and recovery costs observed.
• For unsecured products, LGD’s are typically set at product level due to the limitation in recoveries achieved acrossdifferent across different borrower. These LGD’s are influenced by collection strategies, including contracted debtsales and price.
Impact assessments have done to estimate the adjustments required and impact on capital upon adoption. Based onthe assessments that been carried out, the following estimated adjustments on the opening balance of the Bank’sequity at 1 January 2018 is between N40b and N45b. However, the impact on equity will be compensated for byreduction in regulatory risk reserve.
The Bank is required to incorporate forward-looking macroeconomic information into its assessment of expectedcredit loss Paramaters. The macroeconomic indices were projected for three possible scenarios being; bestestimate, optimistic and downturn forecasts. The macroeconomic variables considered for the adjustment of theprobabilities of default are listed below:
- Crude oil prices,- Inflation,- Interest rates,- Exchange rates (USD/NGN), and- Monetary Policy rateIn line with the aforementioned IFRS 9 requirements, the Bank has adjusted its probabilities of default with the
above-listed macroeconomic variables. By stressing the macroeconomic indicators, the Bank was able to estimateECLs for the different economic scenarios. Probability weights were assigned to these scenarios to arrive at theweighted average expected credit losses.
This assessment is preliminary because not all transition work has been completed as at the time of this report. Theactual impact of adopting IFRS 9 on 1 January 2018 could change due to:• Parallel runs have been done. However, the new systems and controls are still subject to improvement;• testing and assessment of controls over its new IT systems and changes to its governance framework are still beingcarried out;• the accounting policies, assumptions, judgements and statistical models employed are subject to change until theGroup completes its first financial statements at the date of initial application.The ECL could change in within the range of +/-10% from the estimates provided in this initial assessment.
GovernanceAs part of the implementation of IFRS 9, we have designed and implemented new controls and governanceprocedures in several areas that contribute to the calculation of expected credit losses. These include controls overcredit risk data and systems, expected credit loss models and calculation model, forecasts of future macroeconomicvariables, design and probability-weighting of future macroeconomic scenarios, and the determination ofsignificant increases in credit risk. Internal Audit Unit is responsible for the ongoing monitoring of the models. TheBoard through 2 of its standing committees (Board Audit Committee and Board Credit Committee) have overalloversight over the IFRS 9 project for the Group.
75

Access Bank Plc
Consolidated and separate financial statements
For the year ended 31 December 2017
IFRS 16 Leases (effective 1 January 2019)
IFRS 15 – Revenue from contracts with customers. (with effective date of 1 January 2018)
Amendments to IFRS 2 – Share-based Payment (with effective date of 1 January 2018)
3.3 Basis of consolidation
(a) Subsidiaries
[i] power over the investee;
[ii] exposure, or rights, to variable returns from its involvement with the investee; and
[iii] the ability to use its power over the investee to affect the amount of the investor’s returns
[i]
[ii]
[iii]
[iv] potential voting rights
Subsidiaries are all entities (including structured entities) over which the group exercise control.Control is achieved when the Group is exposed to, or has rights to, variable returns from its involvement with theentity and has the ability to affect those returns through its power to direct the activities of the entity:
the group’s voting rights (including voting patterns at previous shareholders' meetings)
The Group reassess periodically whether it controls an investee if facts and circumstances indicate that there arechanges to one or more of the three elements of control listed. The existence and effect of potential voting rights areconsidered when assessing whether the group controls another entity.
The Group assesses existence of control where it does not have more than 50% of the voting power i.e when it holdsless than a majority of the voting rights of an investee. A group considers all relevant facts and circumstances inassessing whether or not it's voting rights are sufficient to give it power, including:
The International Accounting Standards Board (IASB) has published final amendments to IFRS 2 'Share-basedPayment' on 20 December 2017 that clarify the classification and measurement of share-based paymenttransactions which contains the following: (a) accounting for cash-settled share-based payment transactions thatinclude a performance condition; (b) classification of share-based payment transactions with net settlementfeatures; and (c) the ccounting for modifications of share-based payment transactions from cash-settled to equity-settled. Based on the assessment performed by the Group, this amendment will have no impact on the Group as theGroup operates an equity settled share based payment scheme.
The FASB and IASB issued their long awaited converged standard on revenue recognition on 29 May 2014. TheStandard outlines a single comprehensive model for entities to use in accounting for revenue arising from contractswith customers to improve comparability within industries, across industries, and across capital markets with theexemption of interest income. The revenue standard contains principles that an entity will apply to determine themeasurement of revenue and timing of when it is recognized. The underlying principle is that an entity willrecognize revenue to depict the transfer of goods or services to customers at an amount that the entity expects to beentitled to in exchange for those goods or services. The group is in the process of assessing the impact. Frompreliminary assessment, the application of this standard is not expected to result in material impact in the Group asrevenue from financial instrument is out of scope of the standard. As part of the going assessment, the Group iscurrently reviewing contracts with customers that may fall within the scope of IFRS 15 to determine the extent towhich fees and commission income will be affected by the implement of the standard.
IFRS 16 Leases (“IFRS 16”) eliminates the classification of leases as either operating leases or finance leases for alessee, and instead introduces a single lessee accounting model. Applying that model, a lessee is required torecognise: (a) assets and liabilities for all leases with a term of more than 12 months, unless the underlying asset isof low value; and (b) depreciation of lease assets separately from interest on lease liabilities in the statement ofcomprehensive income. The requirements relating to the definition of a lease have been changed from thoseincluded in IAS 17. Guidance is provided on how to determine short term leases as well as leases of low-value assets.The accounting requirements for lessors have largely remained unchanged. New disclosures regarding leases arealso introduced. The effective date of IFRS 16 is 1 January 2019, with an allowance for early adoption, provided theentity applies IFRS 15 Revenue from Contracts with Customers at the same time. The group is in the process ofassessing the impact. However, from preliminary assessment, the applicattion of this standard is not expected toresult in material impact in the Group.
a contractual arrangement between the group and other vote holders
rights arising from other contractual arrangements
76

Access Bank Plc
Consolidated and separate financial statements
For the year ended 31 December 2017
(b) Business combinations
•
•
•
(c) Loss of control
(d) Disposal of subsidiaries
When the Group ceases to have control, any retained interest in the entity is remeasured to its fair value at the datewhen control is lost, with the change in carrying amount recognised in income statement. The fair value is theinitial carrying amount for the purposes of subsequently accounting for the retained interest as an associate, jointventure or financial asset. In addition, any amounts previously recognised in other comprehensive income inrespect of that entity are accounted for as if the group had directly disposed of the related assets or liabilities. Thismay mean that amounts previously recognised in other comprehensive income are reclassified to the incomestatement.The gain/loss arising from disposal of subsidiaries is included in the profit/loss of discontinued operations in thestatement of comprehensive income, if the disposal subsidiary meets the criteria specified in IFRS 5.Foreign currency translation differences become realised when the related subsidiary is disposed.
Subsidiaries are measured at cost less impairment in the separate financial statement.
The Group applies IFRS 3 Business Combinations (revised) in accounting for business combinations.
the net recognised amount (generally fair value) of the identifiable assets acquired and liabilities assumed.
The subsidiaries are fully consolidated from the date on which control is transferred to the Group. They are de-consolidated from the date that control ceases.
the recognized amount of any non-controlling interests in the acquiree; plus if the business combination isachieved in stages, the fair value of the pre-existing equity interest in the acquiree; less
When share-based payment awards (replacement awards) are required to be exchanged for awards held by theacquiree’s employees (acquiree’s awards) and relate to past services, then all or a portion of the amount of theacquirer’s replacement awards is included in measuring the consideration transferred in the business combination.This determination is based on the market-based value of the replacement awards compared with the market-basedvalue of the acquiree’s awards and the extent to which the replacement awards relate to past and/or future service.
When this total is negative, a gain from a bargain purchase is recognised immediately in statement ofcomprehensive income.
The consideration transferred does not include amounts related to the settlement of pre-existing relationships. Suchamounts are generally recognised in in the income statement.
Transactions costs related to the acquisition, other than those associated with the issue of debt or equity securities,that the Group incurs in connection with a business combination are expensed as incurred.Any contingent consideration payable is measured at fair value at the acquisition date. If the contingent
consideration is classified as equity, then it is not re-measured and settlement is accounted for within equity.Otherwise, subsequent changes in the fair value of the contingent consideration are recognised in the incomestatement.
Business combinations are accounted for using the acquisition method as at the acquisition date, which is the dateon which control is transferred to the Group. Control is the power to govern the financial and operating policies ofan entity so as to obtain benefits from its activities. In assessing control, the Group takes into considerationpotential voting rights.
The Group measures goodwill at the acquisition date as the total of:
the fair value of the consideration transferred; plus
The Group elects on a transaction-by-transaction basis whether to measure non-controlling interest at its fair value,or at its proportionate share of the recognised amount of the identifiable net assets, at the acquisition date.
Upon the loss of control, the Group derecognises the assets and liabilities of the subsidiary, any non-controllinginterests and the other components of equity related to the subsidiary. Any surplus or deficit arising on the loss ofcontrol is recognised in the income statement. If the Group retains any interest in the previous subsidiary, thensuch interest is measured at fair value at the date that control is lost. Subsequently it is accounted for as an equity-accounted investee or in accordance with the Group's accounting policy for financial instruments.
77

Access Bank Plc
Consolidated and separate financial statements
For the year ended 31 December 2017
(e) Changes in ownership interests in subsidiaries without change of control
(f) Transactions eliminated on consolidation
3.4 Segment reporting
3.5 Foreign currency translation
(a) Functional and presentation currency
(b) Transactions and balances
(c) Group companies
[i]
Translation differences on non-monetary financial assets and liabilities such as equities held at fair value throughprofit or loss are recognised in the income statement as part of the fair value gain or loss. Translation differences onnon-monetary financial assets, such as equities classified as available for sale, are included in other comprehensiveincome.
Transactions with non-controlling interests that do not result in loss of control are accounted for as equitytransactions – that is, as transactions with the owners in their capacity as owners. The difference between fair valueof any consideration paid and the relevant share acquired of the carrying value of net assets of the subsidiary isrecorded in equity. Gains or losses on disposals to non-controlling interests are also recorded in equity.
The results and financial position of all the group entities (none of which has the currency of a hyper-inflationaryeconomy) that have a functional currency different from the presentation currency are translated into thepresentation currency as follows:
Items included in the financial statements of each of the group’s entities are measured using the currency of theprimary economic environment in which the entity operates (‘the functional currency’). The consolidated financialstatements are presented in Naira’, which is the group’s presentation currency.
The Group in the normal course of business sets up Structured Entries (SEs) for the sole purpose of raising financein foreign jurisdictions. The SEs raises finance in the currency of their jurisdictions and passes the proceeds to thegroup entity that set them up. All costs and interest on the borrowing are borne by the sponsoring group entity.These SEs are deemed to be extensions of the sponsoring entity, and hence, their functional currency is the same asthat of the sponsoring entity.
Inter-company transactions, balances, income and expenses on transactions between group companies areeliminated. Profits and losses resulting from intercompany transactions that are recognised in assets are alsoeliminated. Accounting policies of subsidiaries have been changed where necessary to ensure consistency with thepolicies adopted by the group.
An operating segment is a component of the Group that engages in business activities from which it can earnrevenues and incur expenses, including revenues and expenses that relate to transactions with any of the Group’sother components, whose operating results are reviewed regularly by the Executive Committee (being the chiefoperating decision maker) to make decisions about resources allocated to each segment and assess its performance,and for which discrete financial information is available.
Foreign currency transactions are translated into the functional currency using the exchange rates prevailing at thedates of the transactions or valuation where items are re-measured. Foreign exchange gains and losses resultingfrom the settlement of such transactions and from the translation at year-end exchange rates of monetary assetsand liabilities denominated in foreign currencies are recognised in the income statement. Changes in the fair valueof monetary securities denominated in foreign currency classified as available for sale are analysed betweentranslation differences resulting from changes in the amortised cost of the security and other changes in thecarrying amount of the security. Translation differences related to changes in amortised cost are recognised in theincome statement, and other changes in carrying amount are recognised in other comprehensive income.
assets and liabilities for each balance sheet presented are translated at the closing rate at the date of thatbalance sheet;
78

Access Bank Plc
Consolidated and separate financial statements
For the year ended 31 December 2017
[ii]
[iii]
3.6 Operating income
(a) Interest income and expense
•
•
(b) Fees and commission
Fee and commission presented in the income statement includes:
•
•
•
(c) Net loss/gains on investment securities
•
•
income and expenses for each income statement are translated at average exchange rates (unless this averageis not a reasonable approximation of the cumulative effect of the rates prevailing on the transaction dates, inwhich case income and expenses are translated at the rate on the dates of the transactions); and
Goodwill and fair value adjustments arising on the acquisition of a foreign entity are treated as assets and liabilitiesof the foreign entity and translated at the closing rate. Exchange differences arising are recognised in othercomprehensive income.
Interest income and expense for all interest-bearing financial instruments are recognised within "interest income"and "interest expense" in the consolidated income statement using the effective interest method.
When a loan commitment is not expected to result in the draw-down of a loan, loan commitment fees arerecognised on a straight-line basis over the commitment year.
Net loss/gains on investment securities comprise of the following:
all resulting exchange differences are recognised in other comprehensive income.
Credit related fees and commission: These fees are not integral to the loans and are therefore not included inthe EIR calculation. These are recognised as the related services are performed. When a loan commitment isnot expected to result in the draw-down of a loan, loan commitment fees are recognised on a straight-linebasis over the commitment year.
interest on available-for-sale investment securities calculated on an effective interest basis
Interest income and expense presented in the statement of comprehensive income include:
Other fees and commission income, includes card related commissions, commission on letters of credit,account servicing fees, investment management and other fiduciary activity fees, sales commission,placement fees and syndication fees. These fees and commissions are recognised as the related services areperformed
Net gains on financial instruments held as available for sale: This relates to gains arising from the disposal offinancial instruments held as available for sale as well as fair value changes reclassified from othercomprehensive income upon disposal.
Net gains/losses on financial instruments classified as held for trading: This includes the gains and lossesarising both on the purchase and sale of trading instruments and from changes in fair value of derivativesinstruments.
The effective interest method is a method of calculating the amortised cost of a financial asset or a financial liabilityand of allocating the interest income or interest expense over the relevant year. The effective interest rate is the ratethat exactly discounts the estimated future cash payments and receipts through the expected life of the financialasset or liability (or, where appropriate, a shorter year) to the net carrying amount of the financial asset or liability.When calculating the effective interest rate, the Group estimates future cash flows considering all contractual termsof the financial instruments but not future credit losses.
interest on financial assets and financial liabilities measured at amortised cost calculated on an effectiveinterest rate basis.
Current account maintenance fees (formerly Commission on Turnover): This fee is charged as N1 on everyN1,000 in respect of all customer induced debit transactions. This fee is recognised one-off by the bank.
Fees and commission income and expenses that are integral to the effective interest rate on a financial asset orliability are included in the measurement of the effective interest rate.
The calculation of the effective interest rate includes contractual fees paid or received, transaction costs, anddiscounts or premiums that are an integral part of the effective interest rate. Transaction costs are incrementalcosts that are directly attributable to the acquisition, issue or disposal of a financial asset or liability.
79

Access Bank Plc
Consolidated and separate financial statements
For the year ended 31 December 2017
(d) Foreign exchange income
(e) Other operating income
3.7 Lease payments
3.8 Income tax
(a) Current tax
(b) Deferred tax
Payments made under operating leases are recognised in the income statement on a straight-line basis over theterm of the lease. Lease incentives received are recognised as an integral part of the total lease expense, over theterm of the lease.
Minimum lease payments made under finance leases are apportioned between the finance expense and thereduction of the outstanding liability. The finance expense is allocated to each year during the lease term so as toproduce a constant periodic rate of interest on the remaining balance of the liability. Contingent lease paymentsshall be charged as expenses in the periods in which they are incurred.
The tax expense for the year comprises current and deferred tax. Tax is recognised in the income statement, exceptto the extent that it relates to items recognised in other comprehensive income or directly in equity. In this case, thetax is also recognised in other comprehensive income or directly in equity, respectively.
The current income tax charge is calculated on the basis of the tax laws enacted or substantively enacted at thebalance sheet date in the countries where the bank and its subsidiaries operate and generate taxable income.Management periodically evaluates positions taken in tax returns with respect to situations in which applicable taxregulation is subject to interpretation. It establishes provisions where appropriate on the basis of amounts expectedto be paid to the tax authorities.
Dividend on available for sale equity securities: This is recognised when the right to receive payment isestablished. Dividends are reflected as a component of other operating income.
Other operating income includes items such as dividends, gains on disposal of properties, rental income,income from asset management, brokerage and agency as well as income from other investments.
Deferred income tax is recognised, using the liability method, on temporary differences arising between the taxbases of assets and liabilities and their carrying amounts in the consolidated financial statements. However,deferred tax liabilities are not recognised if they arise from the initial recognition of goodwill; deferred income tax isnot accounted for if it arises from initial recognition of an asset or liability in a transaction other than a businesscombination that at the time of the transaction affects neither accounting nor taxable profit or loss. Deferredincome tax is determined using tax rates (and laws) that have been enacted or substantively enacted by the balancesheet date and are expected to apply when the related deferred income tax asset is realised or the deferred incometax liability is settled.
Foreign exchange income includes foreign exchange gains on revaluation and unrealised foreign exchange gains onrevaluation.
Deferred income tax assets are recognised only to the extent that it is probable that future taxable profit will beavailable against which the temporary differences can be utilised. Deferred income tax is provided on temporarydifferences arising on investments in subsidiaries and associates, except for deferred income tax liability where thetiming of the reversal of the temporary difference is controlled by the group and it is probable that the temporarydifference will not reverse in the foreseeable future.
Deferred income tax assets and liabilities are offset when there is a legally enforceable right to offset current taxassets against current tax liabilities and when the deferred income taxes assets and liabilities relate to income taxeslevied by the same taxation authority on either the same taxable entity or different taxable entities where there is anintention to settle the balances on a net basis.
80

Access Bank Plc
Consolidated and separate financial statements
For the year ended 31 December 2017
3.9 Financial assets and liabilities
The table below reconciles classification of financial instruments to the respective IAS 39 category.
Derivative financial assets
(a) Financial assets
Non pledged trading assets
Financial liabilities at fair value through profit or loss
Financial assets
Class (as determined bythe Group)
Cash and balances withbanks
Investment securities -debt securities (pledgedand non pledged)
Category(as defined by IAS 39)
Available for sale financial assets
Investment undermanagement
Financial liabilities at amortised cost
The Group allocates financial assets to the following IAS 39 categories: financial assets at fair value through profitor loss; loans and receivables; held-to-maturity investments; and available-for-sale financial assets. Managementdetermines the classification of its financial instruments at initial recognition.
Debt securities issued
Other liabilities
Loans and receivables
Financial liabilities
In accordance with IAS 39, all financial assets and liabilities (which include derivative financial instruments) haveto be reocognised in the consolidated statement of financial position and measured in accordance with theirassigned category.
Investment securities -equity securities
Financial assets at fair value through profit or loss
Derivatives
Deposits from banks
Deposits from customers
Interest bearing
Other assets
Loans and advances tocustomers
Investment securities -debt securities (pledgedand non pledged)
Held to maturity
Loans and advances to banks
The purchases and sales of financial assets are accounted for in the Group's books at settlement date.
81

Access Bank Plc
Consolidated and separate financial statements
For the year ended 31 December 2017
[i] Financial assets at fair value through profit or loss
•
•
•
[ii] Loans and receivables
[iii] Held-to-maturity
The assets or liabilities are managed, evaluated and reported internally on a fair value basis.
The asset or liability contains an embedded derivative that significantly modifies the cash flows that wouldotherwise be required under the contract.
Loans and receivables are non-derivative financial assets with fixed or determinable payments that are not quotedin an active market and that the Group does not intend to sell immediately or in the near term.
The Group designates certain financial assets upon initial recognition as at fair value through profit or loss (fairvalue option). This designation cannot subsequently be changed. According to IAS 39, the fair value option is onlyapplied when the following conditions are met:
This category comprises two sub-categories: financial assets classified as held for trading and financial assetsdesignated by the Group as at fair value through profit or loss upon initial recognition.
A financial asset is classified as held for trading if it is acquired or incurred principally for the purpose of selling orrepurchasing it in the near term or if it is part of a portfolio of identified financial instruments that are managedtogether and for which there is evidence of a recent actual pattern of short-term profit-taking. Derivatives are alsocategorised measured at fair value through profit or loss unless they are designated and effective as hedginginstruments. Financial assets held for trading consist of debt instruments, including money-market instruments, aswell as financial assets with embedded derivatives. They are recognised in the consolidated statement of financialposition as ‘non-pledged trading assets ’.
Finance lease receivables are reported within loans and receivables where the Group is the lessor in a leaseagreement. Such lease agreement transfers substantially all of the risks and rewards incidental to ownership of anasset to the lessee. The loans and receivables equal to the net investment in the lease is recognised and presentedwithin loans and advances.
The designation eliminates or significantly reduces an accounting mismatch which would otherwise arise.
When the Group purchases a financial asset and simultaneously enters into an agreement to resell the asset (or asubstantially similar asset) at a fixed price on a future date (“reverse repo or stock borrowing”), the arrangement isaccounted for as a loan or advance, and the underlying asset is not recognised in the Group’s financial statements.
Financial instruments included in this category are recognised initially at fair value; transaction costs are takendirectly to the consolidated income statement. Gains and losses arising from changes in fair value are includeddirectly in the consolidated income statement and are reported as "Net loss/gains on investment securities. Interestincome and expense and dividend income and expenses on financial assets held for trading are included in ‘Interestincome’, "Interest expense' or ‘Other operating income’, respectively. The instruments are derecognised when therights to receive cash flows have expired or the Group has transferred substantially all the risks and rewards ofownership and the transfer qualifies for derecognising.
Loans and receivables are initially recognised at fair value – which is the price that would be received to sell an assetor paid to transfer a liability in an orderly transaction between market participants at the measurement date – andmeasured subsequently at amortised cost using the effective interest rate method. Loans and receivables arereported in the consolidated statement of financial position as loans and advances to banks or customers or asinvestment securities. Interest on loans is included in the consolidated income statement and is reported as‘Interest income’. In the case of an impairment, the impairment loss is reported as a deduction from the carryingvalue of the loan and recognised in the consolidated income statement under "net impairment loss on financialassets"
Held-to-maturity investments are non-derivative assets with fixed or determinable payments and fixed maturitythat the Group has the positive intent and ability to hold to maturity, and which are not designated at fair valuethrough profit or loss, loans and receivables or available-for-sale.
82

Access Bank Plc
Consolidated and separate financial statements
For the year ended 31 December 2017
•
•
•
[iv] Available-for-sale
Availabe for sale instruments include investment securities.
[v] Investment under management
(b) Financial liabilities
[i] Financial liabilities at amortised cost
Sales or reclassification that are so close to maturity that changes on the market rate of interest would nothave a significant effect on the financial asset’s fair value.
The investment decision made by the Asset management within an agreed portfolio of high quality Nigerian fixedincome and money market instruments which are usually short tenured.The investments are carried as available-for-sale and accounting policy (3.9) (a) [iv] applies.
The Group classifies debt instruments as financial liabilities or equity in accordance with the contractual terms ofthe instrument.
Deposits and debt securities issued are the Group’s sources of debt funding. When the Group sells a financial assetand simultaneously enters into a “repo” or “stock lending” agreement to repurchase the asset (or a similar asset) ata fixed price on a future date, the arrangement is accounted for as a deposit, and the underlying asset continues tobe recognised in the Group’s financial statements as pledged assets.
These are initially recognised at fair value including direct and incremental transaction costs and measuredsubsequently at amortised cost, using the effective interest method. Any sale or reclassification of a significantamount of held-to-maturity investments not close to their maturity would result in the reclassification of all held-to-maturity investments as available-for- sale, and prevent the Group from classifying investment securities as held-to-maturity for the current and the following two financial years. However, sales and reclassifications in any of thefollowing circumstances would not trigger a reclassification:
Sales or reclassification after the Group has collected substantially all the asset’s original principal.
Sales or reclassification attributable to non-recurring isolated events beyond the Group’s control that couldnot have been reasonably anticipated.
Interest on held-to-maturity investments is included in the consolidated income statement and reported as ‘Interestincome’. In the case of an impairment, the impairment loss is been reported as a deduction from the carrying valueof the investment and recognised in the consolidated income statement as ‘net impairment loss on financial assets’.Held-to-maturity investments include treasury bills and bonds.
Available-for-sale investments are non-derivative investments that are not designated as another category offinancial assets. Unquoted equity securities whose fair value cannot be reliably measured are carried at cost andsubjected to impairment. All other available-for-sale investments are carried at fair value.
Interest income is recognised in the income statement using the effective interest method. Dividend income isrecognised in the income statement when the Group becomes entitled to the dividend. Foreign exchange gains orlosses on available-for-sale debt security investments are recognised in the income statement.
Investment under management are funds entrusted to Asset management firms who acts as agents to the bank forsafe keeping and management for investment purpose with returns on the underlying investments accruable to theBank, who is the principal.
Other fair value changes are recognised directly in other comprehensive income until the investment is sold orimpaired whereupon the cumulative gains and loses previously recognised in other comprehensive income arerecognised to the income statement as a reclassification adjustment.
A non-derivative financial asset may be reclassified from the available-for-sale category to the loans and receivablecategory if it otherwise would have met the definition of loans and receivables and if the Group has the intentionand ability to hold that financial asset for the foreseeable future or until maturity.
The Group classifies its financial liabilities, other than financial guarantees and loan commitments, as measured atamortised cost or fair value through profit or loss.
Financial liabilities that are not classified as at fair value through profit or loss are measured at amortised cost usingthe effective interest method. Interest expense is included in 'Interest expense' in the Statement of comprehensiveincome.
83

Access Bank Plc
Consolidated and separate financial statements
For the year ended 31 December 2017
[ii] Financial liabilities at fair value
(c) De-recognition
[i] Financial assets
In transactions in which the Group neither retains nor transfers substantially all the risks and rewards of ownershipof a financial asset and it retains control over the asset, the group continues to recognise the asset to the extent of itscontinuing involvement, determined by the extent to which it is exposed to changes in the value of the transferredasset.
Loans that are either subject to collective impairment assessment or individually significant and whose terms havebeen renegotiated are no longer considered to be past due but are treated as new loans. In subsequent years, theasset is considered to be past due and disclosed only if renegotiated again.
The Group derecognises a financial asset when the contractual rights to the cash flows from the financial assetexpire, or when it transfers the financial asset in a transaction in which substantially all the risks and rewards ofownership of the financial asset are transferred or in which the Group neither transfers nor retains substantially allthe risks and rewards of ownership and it does not retain control of the financial asset. Any interest in transferredfinancial assets that is created or retained by the Group is recognised as a separate asset or liability in the statementof financial position. On derecognition of a financial asset, the difference between the carrying amount of the asset(or the carrying amount allocated to the portion of the asset transferred), and the sum of (i) the considerationreceived ( including any new asset obtained less any new liability assumed) and (ii) any cumulative gain or loss thathad been recognised in other comprehensive income is recognised in the income statement.
On this statement of financial position, other financial liabilities carried at amortised cost include deposit frombanks, deposit from customers, interest bearing borrowings, debt securities issued and other liabilities.
The Group may enter into a variety of derivative financial instruments to manage its exposure to interest rate andforeign exchange rate risk, including foreign exchange forward contracts, interest rate swaps and foreign currencyoptions. Further details of derivative financial instruments are disclosed in Note 21 to the financial statements.Derivatives are initially recognised at fair value at the date a derivative contract is entered into and are subsequentlyremeasured to their fair value at each balance sheet date. A derivative with a positive fair value is recognised as afinancial asset whereas a derivative with a negative fair value is recognised as a financial liability. The resulting gainor loss is recognised in profit or loss immediately unless the derivative is designated and effective as a hedginginstrument, in which event the timing of the recognition in profit or loss depends on the nature of the hedgerelationship. Derivatives are presented as financial assets or financial liabilities.Derivative assets and liabilities are only offset if the transactions are with the same counterparty, a legal right ofoffset exists and the parties intend to settle on a net basis.
When assets are sold to a third party with a concurrent total rate of return swap on the transferred assets, thetransaction is accounted for as a secured financing transaction similar to repurchase transactions as the Groupretains all or substantially all the risks and rewards of ownership of such assets.
Deposits and debt securities issued are initially measured at fair value minus incremental direct transaction costs,and subsequently measured at their amortised cost using the effective interest method, except where the Groupdesignates liabilities at fair value through profit or loss.
The Group enters into transactions whereby it transfers assets recognised on its financial position, but retains eitherall or substantially all of the risks and rewards of the transferred assets or a portion of them. If all or substantiallyall risks and rewards are retained, then the transferred assets are not derecognised from the financial position.Transfers of assets with retention of all or substantially all risks and rewards include, for example, securities lendingand repurchase transactions.
In certain transactions the Group retains the obligation to service the transferred financial asset for a fee. Thetransferred asset is derecognised if it meets the derecognition criteria. An asset or liability is recognised for theservicing contract, depending on whether the servicing fee is more than adequate (asset) or is less than adequate(liability) for performing the servicing.
84
Access Bank Plc
Consolidated and separate financial statements
For the year ended 31 December 2017
[ii] Financial liabilities
(d) Offsetting
(e ) Sale and repurchase agreements
(f) Measurement
[i] Amortised cost measurement
[ii] Fair value measurement
The best evidence of the fair value of a financial instrument at initial recognition is the transaction price – i.e. thefair value of the consideration given or received. However, in some cases, the fair value of a financial instrument oninitial recognition may be different to its transaction price. If such fair value is evidenced by comparison with otherobservable current market transactions in the same instrument (without modification or repackaging) or based on avaluation technique whose variables include only data from observable markets, then the difference is recognised inthe income statement on initial recognition of the instrument.
Financial assets and liabilities are set off and the net amount presented in the statement of financial position when,and only when, the Group has a legal enforceable right to set off the amounts and intends either to settle on a netbasis or to realise the asset and settle the liability simultaneously.
Securities sold subject to repurchase agreements (‘repos’) remain on the statement of financial position; thecounterparty liability is included in amounts due to other banks, deposits from banks, other deposits or depositsdue to customers, as appropriate. Securities purchased under agreements to resell (reverse repos’) are recorded asmoney market placement. The difference between sale and repurchase price is treated as interest and accrued overthe life of the agreements using the effective interest method.
Fair value is the price that would be received to sell an asset or paid to transfer a liability in an orderly transactionbetween market participants at the measurement date.
The amortised cost of a financial asset or liability is the amount at which the financial asset or liability is measuredat initial recognition, minus principal repayments, plus or minus the cumulative amortisation using the effectiveinterest method of any difference between the initial amount recognised and the maturity amount, minus anyreduction for impairment.
The Group derecognises a financial liability when its contractual obligations are discharged or cancelled or expire.
When available, the Group measures the fair value of an instrument using quoted prices in an active market for thatinstrument. A market is regarded as active if quoted prices are readily available and represent actual and regularlyoccurring market transactions on an arm’s length basis.
If a market for a financial instrument is not active, the Group establishes fair value using valuation techniques.Valuation techniques include using recent arm’s length transactions between knowledgeable, willing parties (ifavailable), reference to the current fair value of other instruments that are substantially the same, and discountedcash flow analysis. The chosen valuation technique makes maximum use of market inputs, relies as little as possibleon estimates specific to the Group, incorporates all factors that market participants would consider in setting aprice, and is consistent with accepted economic methodologies for pricing financial instruments. Inputs to valuationtechniques reasonably represent market expectations and measures of the risk-return factors inherent in thefinancial instrument. The Group calibrates valuation techniques and tests them for validity using prices fromobservable current market transactions in the same instrument or based on other available observable market data.
Securities lent to counterparties are also retained in the financial statements. Securities borrowed are notrecognised in the financial statements, unless these are sold to third parties, in which case the purchase and sale arerecorded with the gain or loss included in trading income.
Income and expenses are presented on a net basis only when permitted under IFRSs, or for gains and losses arisingfrom a group of similar transactions such as in the Group’s trading activity. See note 5.1.5
85

Access Bank Plc
Consolidated and separate financial statements
For the year ended 31 December 2017
(g ) Identification and measurement of impairment
[i] Loans and receivables
[ii] Available for sale securities
In other cases the difference is not recognised in the income statement immediately but is recognised over the life ofthe instrument on an appropriate basis or when the instrument is redeemed, transferred or sold, or the fair valuebecomes observable.
Impairment losses on available-for-sale investment securities are recognised by transferring the cumulative lossthat has been recognised in other comprehensive income to the income statement as a reclassification adjustment.For debt securities, the group uses the criteria referred to in (i) above to assess impairment. If any such evidenceexists for available-for-sale financial assets, the cumulative loss – measured as the difference between theacquisition cost and the current fair value, less any impairment loss on that financial asset previously recognised inprofit or loss – is removed from equity and recognised in the income statement.
At each reporting date the Group assesses whether there is objective evidence that financial assets not carried at fairvalue through profit or loss are impaired. Financial assets are impaired when objective evidence demonstrates thata loss event has occurred after the initial recognition of the asset, and that the loss event has an impact on the futurecash flows on the asset that can be estimated reliably.
Assets and long positions are measured at a bid price; liabilities and short positions are measured at an askingprice. Where the Group has positions with offsetting risks, mid-market prices are used to measure the offsettingrisk positions and a bid or asking price adjustment is applied only to the net open position as appropriate. Fairvalues reflect the credit risk of the instrument and include adjustments to take account of the credit risk of theGroup entity and the counterparty where appropriate. Fair value estimates obtained from models are adjusted forany other factors, such as liquidity risk or model uncertainties, to the extent that the Group believes a third-partymarket participant would take them into account in pricing a transaction.
Objective evidence that financial assets (including equity securities) are impaired can include significant financialdifficulty of the obligor, default or delinquency by a borrower resulting in a breach of contract, restructuring of aloan or advance by the Group on terms that the Group would not otherwise consider, indications that a borrower orissuer will enter bankruptcy, the disappearance of an active market for a security, or other observable data relatingto a group of assets such as adverse changes in the payment status of borrowers or issuers in the group, or economicconditions that correlate with defaults in the group. In addition, for an investment in an equity security, asignificant or prolonged decline in its fair value below cost is objective evidence of impairment.
The Group considers evidence of impairment for loans and advances and held-to-maturity investments at both aspecific and collective level. All individually significant loans and advances and held-to maturity investmentsecurities are assessed for specific impairment. All individually significant loans and advances and held-to maturityinvestments found not to be specifically impaired are then collectively assessed for any impairment that has beenincurred but not yet identified. Loans and advances and held-to-maturity investment securities that are notindividually significant are collectively assessed for impairment by grouping together loans and advances and held-to-maturity investment securities (held at amortised cost) with similar characteristics.
In assessing collective impairment the Group uses statistical modeling of historical trends of the probability ofdefault, timing of recoveries and the amount of loss incurred, adjusted for management’s judgment as to whethercurrent economic and credit conditions are such that the actual losses are likely to be greater or less than suggestedby historical modeling. Default rates, loss rates and the expected timing of future recoveries are regularlybenchmarked against actual outcomes to ensure that they remain appropriate.
Impairment losses on assets carried at amortised cost are measured as the difference between the carrying amountof the financial assets and the present value of estimated cash flows discounted at the assets’ original effectiveinterest rate. Losses are recognised in the income statement and reflected in an allowance account against loans andadvances. Interest on the impaired asset continues to be recognised through the unwinding of the discount. When asubsequent event causes the amount of impairment loss to decrease, the impairment loss is reversed through profitor loss.
86

Access Bank Plc
Consolidated and separate financial statements
For the year ended 31 December 2017
(h) Cash and balances with banks
(i) Repossessed collateral
(j) Derivative financial instruments
(k) Reclassification of financial assets
For equity, a prolonged decline in the fair value of the security below its cost is also evidence that the asset isimpaired. Impairment losses recognised in the consolidated income statement on equity instruments are notreversed through the consolidated income statement. If, in a subsequent year, the fair value of an impaired available-for-sale debt security increases and the increase can be related objectively to an event occurring after theimpairment loss was recognised, then the impairment loss is reversed through the income statement; otherwise,any increase in fair value is recognised through OCI. Any subsequent recovery in the fair value of an impairedavailable-for-sale equity security is always recognised in OCI.
Reclassifications are made at fair value as of the reclassification date. Fair value becomes the new cost or amortisedcost as applicable, and no reversals of fair value gains or losses recorded before reclassification date aresubsequently made. Effective interest rates for financial assets reclassified to loans and receivables and held-to-maturity categories are determined at the reclassification date. Further increases in estimates of cash flows adjusteffective interest rates prospectively.
The Bank may choose to reclassify a non-derivative financial asset held for trading out of the held-for-tradingcategory if the financial asset is no longer held for the purpose of selling it in the near-term. Financial assets otherthan loans and receivables are permitted to be reclassified out of the held for trading category only in rarecircumstances arising from a single event that is unusual and highly unlikely to recur in the near-term. In addition,the Bank may choose to reclassify financial assets that would meet the definition of loans and receivables out of theheld-for-trading or available-for-sale categories if the Bank has the intention and ability to hold these financialassets for the foreseeable future or until maturity at the date of reclassification.
The Group writes off previously impaired loans and advances (and investment securities) when they aredetermined not to be recoverable. The Group writes off loans or investment debt securities that are impaired (eitherpartially or in full and any related allowance for impairment losses) when the Group credit team determines thatthere is no realistic prospect of recovery.
In the consolidated statement of cash flows, cash and cash equivalents includes cash in hand, unrestricted balanceswith foreign and central banks, money market placements and other short-term highly liquid investments withoriginal maturities of three months or less.
Derivatives are initially recognised at fair value on the date on which a derivative contract is entered into and aresubsequently remeasured at their fair value. Fair values are obtained from quoted market prices in active markets(for example, for exchange-traded options), including recent market transactions, and valuation techniques (forexample for swaps and currency transactions), including discounted cash flow models and options pricing models,as appropriate. All derivatives are carried as assets when fair value is positive and as liabilities when fair value isnegative.The Group mitigates the credit risk of derivatives by holding collateral in the form of cash.
Repossessed collateral are equities, investment properties or other investments repossessed from a customer andused to settle his outstanding obligation. Such investments are classified in accordance with the intention of theGroup in the asset class which they belong and are also separately disclosed in the financial statement.When collaterals are repossessed in satisfaction of a loan, the receivable is written down against the allowance forlosses. Repossessed collaterals are included in the financial statement based on how the Bank intends to realizebenefit from such collateral such as "Non current assets held for sale" and carried at the lower of cost or estimatedfair value less costs to sell, if the Group intends to sell or cost less accumulated depreciation, if for use in the normalcourse of business.
Cash and balances with banks include notes and coins on hand, balances held with central banks and highly liquidfinancial assets with original maturities of less than three months, which are subject to insignificant risk of changesin their fair value, and are used by the Group in the management of its short-term commitments.
87

Access Bank Plc
Consolidated and separate financial statements
For the year ended 31 December 2017
(l) Pledged assets
3.10 Property and equipment
(a) Recognition and measurement
(b) Subsequent costs
(c) Depreciation
Not depreciated
Over the shorter of the useful life of the item or lease term
60 years
4.5 years
6 years
5 years
Financial assets transferred to external parties that do not qualify for de-recognition are reclassified in thestatement of financial position from financial assets held for trading or investment securities to assets pledged ascollateral, if the transferee has received the right to sell or re-pledge them in the event of default from agreed terms.Initial recognition of assets pledged as collateral is at fair value, whilst subsequent measurement is based on theclassification of the financial asset. Assets pledged as collateral are either designated as held for trading, availablefor sale or held to maturity. Where the assets pledged as collateral are designated as held for trading, subsequentmeasurement is at fair value through profit and loss, whilst assets pledged as collateral designated as available forsale are measured at fair-value through equity. Assets pledged as collateral designated as held to maturity aremeasured at amortized cost.
Depreciation begins when an asset is available for use and ceases at the earlier of the date that the asset isderecognised or classified as held for sale in accordance with IFRS 5. A non-current asset or disposal group is notdepreciated while it is classified as held for sale.
Leasehold improvements and building
The asset's residual values and useful lives are reviewed, and adjusted if appropriate, at each date of the statementof financial position. Assets are reviewed for impairment whenever events or changes in circumstances indicate thatthe carrying amount may not be recoverable. An asset’s carrying amount is written down immediately to itsrecoverable amount if the asset’s carrying amount is greater than its estimated recoverable amount. The recoverableamount is the higher of the asset’s fair value less costs to sell and value in use.
The estimated useful lives for the current and comparative years of significant items of property and equipment areas follows:
Buildings
Computer hardware
Furniture and fittings
Depreciation is recognised in the income statement on a straight-line basis to write down the cost of items ofproperty and equipment, to their residual values over the estimated useful lives. Leased assets under finance leaseare depreciated over the shorter of the lease term and their useful lives.
Leasehold land
Motor vehicles
Subsequent costs are included in the asset's carrying amount or recognized as a separate asset, as appropriate, onlywhen it is probable that the future economic benefits associated with the item will flow to the Group and its cost canbe measured reliably. The costs of the day-to-day repairs and maintenance of property and equipment arerecognised in Income statement as incurred.
When significant parts of an item of property or equipment have different useful lives, they are accounted for asseparate items (major components) of property and equipment.
Items of property and equipment are measured at cost less accumulated depreciation and accumulated impairmentlosses. Cost includes expenditures that are directly attributable to the acquisition of the asset.
Capital work in progress is not depreciated. Upon completion it is transferred to the relevant asset category.Depreciation methods, useful lives and residual values are reassessed at each reporting date and adjusted ifappropriate.
The gain or loss on disposal of an item of property and equipment is determined by comparing the proceeds fromdisposal with the carrying amount of property and equipment, and are recognised net within other income in theIncome statement.
88

Access Bank Plc
Consolidated and separate financial statements
For the year ended 31 December 2017
(d) De-recognition
3.11 Intangible assets
(a) Goodwill
(b) Software
3.12 Leases
A group company is the lessee
(a) Operating lease
Subsequent expenditure on software assets is capitalised only when it increases the future economic benefitsembodied in the specific asset to which it relates. All other expenditure is expensed as incurred.
Amortisation is recognised in the income statement on a straight-line basis over the estimated useful life of thesoftware, from the date that it is available for use since this most closely reflects the expected pattern ofconsumption of future economic benefits embodied in the asset. Software has a finite useful life, the estimateduseful life of software is between three and five years. Amortisation methods, useful lives and residual values arereviewed at each financial year-end and adjusted if appropriate.
Leases in which a significant portion of the risks and rewards of ownership are retained by another party, the lessor,are classified as operating leases. Payments, including prepayments, made under operating leases (net of anyincentives received from the lessor) are charged to operating expenses in the income statement on a straight-linebasis over the year of the lease and used as investment property.
Leases are accounted for in accordance with IAS 17 and IFRIC 4. They are divided into finance leases and operatingleases.
Goodwill that arises upon the acquisition of subsidiaries is included in intangible assets. Subsequent to initialrecognition, goodwill is measured at cost less accumulated impairment losses. Goodwill has an indefinite useful lifeand it is tested annually for impairment.
Goodwill has an indefinite useful life and is tested annually as well as whenever a trigger event has been observedfor impairment by comparing the present value of the expected future cash flows from a cash generating unit withthe carrying value of its net assets, including attributable goodwill and carried at cost less accumulated impairmentlosses. Impairment losses on goodwill are not reversed. Gains and losses on the disposal of an entity include thecarrying amount of goodwill relating to the entity sold.
Software acquired by the Group is stated at cost less accumulated amortisation and accumulated impairment losses.Expenditure on internally developed software is recognised as an asset when the Group is able to demonstrate itsintention and ability to complete the development and use the software in a manner that will generate futureeconomic benefits, and can reliably measure the costs to complete the development. The capitalised costs ofinternally developed software include all costs directly attributable to developing the software, and are amortisedover its useful life. Internally developed software is stated at capitalised cost less accumulated amortisation andimpairment.
An item of property and equipment is derecognised on disposal or when no future economic benefits are expectedfrom its use or disposal. Any gain or loss arising on de-recognition of the asset (calculated as the difference betweenthe net disposal proceeds and the carrying amount of the asset) is included in income statement in the year theasset is derecognised.
Goodwill is allocated to cash-generating units or groups of cash-generating units for the purpose of impairmenttesting. The allocation is made to those cash-generating units or groups of cash-generating units that are expectedto benefit from the business combination in which the goodwill arose identified in accordance with IFRS 8.
89

Access Bank Plc
Consolidated and separate financial statements
For the year ended 31 December 2017
(b) Finance lease
A group company is the lessor
3.13 Impairment of non-financial assets
3.14 Discontinued operations
For the purpose of impairment testing, assets that cannot be tested individually are grouped together into thesmallest group of assets that generates cash inflows from continuing use that are largely independent of cashinflows of other assets or groups of assets (the "cash-generating unit" or CGU). Subject to an operating segmentceiling test, for the purposes of goodwill impairment testing, CGUs to which goodwill has been allocated areaggregated so that the level at which impairment is tested reflects the lowest level at which goodwill is monitoredfor internal reporting purposes. Goodwill acquired in a business combination is allocated to the groups of CGUsthat are expected to benefit from the synergies of the combination.
An impairment loss in respect of goodwill is not reversed. In respect of other assets, impairment losses recognisedin prior years are assessed at each reporting date for any indications that the loss has decreased or no longer exists.An impairment loss is reversed if there has been a change in the estimates used to determine the recoverableamount. An impairment loss is reversed only to the extent that the asset’s carrying amount does not exceed thecarrying amount that would have been determined, net of depreciation or amortisation, if no impairment loss hadbeen recognised.
Leases of assets where the Group has substantially all the risks and rewards of ownership are classified as financeleases. Finance leases are capitalised at the lease’s commencement at the lower of the fair value of the leasedproperty and the present value of the minimum lease payments. Each lease payment is allocated between theliability and finance charges so as to achieve a constant rate on the finance balance outstanding. The correspondingrental obligations, net of finance charges, are included in deposits from banks or deposits from customersdepending on the counter party. The interest element of the finance cost is charged to the income statement overthe lease year so as to produce a constant periodic rate of interest on the remaining balance of the liability for eachyear.
The recoverable amount of goodwill is estimated at each reporting date. An impairment loss is recognised if thecarrying amount of an asset or its cash-generating unit exceeds its recoverable amount. In assessing value in use,the estimated future cash flows are discounted to their present value using a pre-tax discount rate that reflectscurrent market assessments of the time value of money and the risks specific to the asset.
The Group presents discontinued operations in a separate line in the consolidated income statement if an entity or acomponent of an entity has been disposed of or is classified as held for sale and:(a) Represents a separate major line of business or geographical area of operations;(b) Is part of a single co-ordinated plan to dispose of a separate major line of business or geographical area ofoperations; or(c) Is a subsidiary acquired exclusively with a view to resale (for example, certain private equity investments).
Net profit from discontinued operations includes the net total of operating profit and loss before tax fromoperations, including net gain or loss on sale before tax or measurement to fair value less costs to sell anddiscontinued operations tax expense. A component of an entity comprises operations and cash flows that can beclearly distinguished, operationally and for financial reporting purposes, from the rest of the Group´s operationsand cash flows. If an entity or a component of an entity is classified as a discontinued operation, the Group restatesprior years in the consolidated income statement.
When assets are held subject to a finance lease, the present value of the lease payments is recognised as a receivable.The difference between the gross receivable and the present value of the receivable is recognised as unearnedfinance income. Lease income is recognised over the term of the lease using the net investment method (before tax),which reflects a constant periodic rate of return.
The carrying amounts of the Group’s non-financial assets other than goodwill and deferred tax assets, are reviewedat each reporting date to determine whether there is any indication of impairment. If any such indication existsthen the asset’s recoverable amount is estimated. For goodwill and intangible assets that have indefinite useful livesor that are not yet available for use, the recoverable amount is estimated each year at the same time.
90

Access Bank Plc
Consolidated and separate financial statements
For the year ended 31 December 2017
3.15 Non-current assets (or disposal groups) held for sale
3.16 Provisions
(a) Restructuring
3.17 Financial guarantees
3.18 Employee benefits
(a) Defined contribution plans
A defined contribution plan is a post employment benefit plan under which an entity pays fixed contributions into aseparate entity and will have no legal or constructive obliagtion to pay further amounts. Obligations forcontributions to defined contribution pension plans are recognised as an expense in the income statement whenthey are due in respect of service rendered before the end of the reporting year.
Non-current assets (or disposal groups) are classified as assets held for sale when their carrying amount is to berecovered principally through a sale transaction and a sale is considered highly probable. They are stated at thelower of carrying amount and fair value less costs to sell.Investment property classified as non-current asset held for sale are measured at fair value, gain or loss arisingfrom a change in the fair value of investment property is recognised in income statement for the year in which itarise.
A provision is recognised if, as a result of a past event, the Group has a present legal or constructive obligation thatcan be estimated reliably, and it is probable that an outflow of economic benefits will be required to settle theobligation. Provisions are determined by discounting the expected future cash flows at a pre-tax rate that reflectscurrent market assessments of the time value of money and, where appropriate, the risks specific to the liability.The increase in the provision due to passage of time is recognised as interest expenses.
A provision for restructuring is recognised when the Group has approved a detailed and formal restructuring plan,and the restructuring either has commenced or has been announced publicly. Future operating costs are notprovided for.
Impairment losses on initial classification as held for sale or distribution and subsequent gains and losses on re-measurement are recognised in the income statement. Gains are not recognised in excess of any cumulativeimpairment loss.
Once classified as held for sale or distribution, intangible assets and property, plant and equipment are no longeramortised or depreciated, and any equity-accounted investee is no longer equity accounted.
Non-current assets, or disposal groups comprising assets and liabilities, that are expected to be recovered primarilythrough sale or distribution rather than through continuing use, are classified as held for sale or distribution.Immediately before classification as held for sale or distribution, the assets, or components of a disposal group, arere-measured in accordance with the Group’s accounting policies. Thereafter generally the assets, or disposal group,are measured at the lower of their carrying amount and fair value less costs to sell. Any impairment loss on adisposal group is allocated first to goodwill, and then to the remaining assets and liabilities on pro rata basis, exceptthat no loss is allocated to inventories, financial assets, deferred tax assets, employee benefit assets, investmentproperty or biological assets, which continue to be measured in accordance with the Group’s accounting policies.
Financial guarantees which includes Letters of credit are contracts that require the Group to make specifiedpayments to reimburse the holder for a loss it incurs because a specified debtor fails to make payment when due inaccordance with the terms of a debt instrument. Financial guarantee liabilities are initially recognised at their fairvalue, and the initial fair value is amortised over the life of the financial guarantee. The guarantee liability issubsequently carried at the higher of this amortised amount and the present value of any expected payment (when apayment under the guarantee has become probable).Letters of credits which have been guaranteed by Access bank but funded by the customer is included in otherliabilities while those guaranteed and funded by the Bank is included in deposit from financial institutions.
91

Access Bank Plc
Consolidated and separate financial statements
For the year ended 31 December 2017
(b) Termination benefits
(c) Long-term Incentive Plan
(d) Short-term employee benefits
Prepaid contributions are recognised as an asset to the extent that a cash refund or a reduction in future paymentsis available. Contributions to a defined contribution plan that are due more than 12 months after the end of thereporting year in which the employees render the service are discounted to their present value at the reporting date.
Termination benefits are payable when employment is terminated by the group before the normal retirement date,or whenever an employee accepts voluntary redundancy in exchange for these benefits. The group recognisestermination benefits at the earlier of the following dates: (a) when the group can no longer withdraw the offer ofthose benefits; and (b) when the entity recognises costs for a restructuring that is within the scope of IAS 37 andinvolves the payment of termination benefits. In the case of an offer made to encourage voluntary redundancy, thetermination benefits are measured based on the number of employees expected to accept the offer. Benefits fallingdue more than 12 months after the end of the reporting year are discounted to their present value.
The Bank has a non-contributory, un-funded lump sum defined benefit plan for top executive management of theBank from General Manager and above based on the number of years spent in these positions.
Short-term employee benefit obligations are measured on an undiscounted basis and are expensed as the relatedservice is provided.
A liability is recognised for the amount expected to be paid under short-term cash bonus or profit-sharing plans ifthe Group has a present legal or constructive obligation to pay this amount as a result of past service provided bythe employee and the obligation can be estimated reliably.
Depending on their grade, executive staff of the Bank upon retirement are entitled to certain benefits based on theirlength of stay on that grade. The Bank's net obligation in respect of the long term incentive scheme is calculated byestimating the amount of future benefits that eligible employees have earned in return for service in the current andprior years. That benefit is discounted to determine its present value. The rate used to discount the postemployment benefit obligation is determined by reference to the yield on Nigerian Government Bonds, that havematurity dates approximating the terms of the Bank's obligations.
The calculation is performed annually by a qualified actuary using the projected unit credit method. When thebenefits of a plan are improved, the portion of the increased benefit relating to past service by employees isimmediately recognized in the income statement. The Bank recognizes all actuarial gains or losses and all expensesarising from defined benefit plan immediately in the balance sheet, with a charge or credit to other comprehensiveincome (OCI) in the years in which they occur. They are not recycled subsequently in the income statement.
The Bank operates a funded, defined contribution pension scheme for employees. Employees and the Bankcontribute 8% and 10% respectively of the qualifying staff salary in line with the provisions of the Pension ReformsAct 2014.
92

Access Bank Plc
Consolidated and separate financial statements
For the year ended 31 December 2017
(e) Share-based payment remuneration scheme
3.19 Share capital and reserves
(a) Share issue costs
(b) Dividend on the Bank’s ordinary shares
(c) Treasury shares
(d) Earnings per share
(e) Statutory credit reserve
Percentage
10%
50%
100%Lost
A more accelerated provision may be done using the subjective criteria. A 2% provision is taken on all risk assetsthat are not specifically provisioned.
Interest and/or principal overdue by 180 days but less than365 days
Interest and/or principal overdue by more than 365 days
Interest and/or principal overdue by 90 days but less than180 days
Incremental costs directly attributable to the issue of an equity instrument are deducted from the initialmeasurement of the equity instruments.
Dividends on ordinary shares are recognised in equity in the year when approved by the Bank’s shareholders.Dividends for the year that are declared after the end of the reporting year are dealt with in the subsequent eventsnote.
The Group applies IFRS 2 Share Based Payments in accounting for employee remuneration in the form of shares.Employee incentives include awards in the form of shares The cost of the employee services received in respect ofthe shares or share granted is recognised in the income statement over the year that employees provide services,generally the year between the date the award is granted or notified and the vesting date of the shares. The overallcost of the award is calculated using the number of shares and options expected to vest and the fair value of theshares or options at the date of grant.The number of shares expected to vest takes into account the likelihood that performance and service conditionsincluded in the terms of the awards will be met. Failure to meet the non-vesting condition is treated as a forfieture,resulting in an acceleration of recognition of the cost of the employee services.The fair value of shares is the market price ruling on the grant date, in some cases adjusted to reflect restrictions ontransferability.
Where the Bank or any member of the Group purchases the Bank’s share capital, the consideration paid is deductedfrom the shareholders’ equity as treasury shares until they are cancelled or disposed. Where such shares aresubsequently sold or reissued, any consideration received is included in shareholders’ equity.
Substandard
Doubtful
The Group presents basic and diluted earnings per share (EPS) for its ordinary shares. Basic EPS is calcuated bydividing the profit and loss attributable to ordinary shareholders of the Bank by the weighted average number ofordinary shares outstanding during the year. Diluted EPS is determined by adjusting the profit or loss attributableto ordinary shareholders and the weighted average number of ordinary shares outstanding for the effects of alldilutive potential ordinary shares.
Classification
In compliance with the Prudential Guidelines for Licensed Banks, the Group assesses qualifying financial assetsusing the guidance under the Prudential Guidelines. The guidelines apply objective and subjective criteria towardsproviding losses in risk assets. Assets are classified as performing or non- performing. Non performing assets arefurther classed as substandard, doubtful or lost with attendant provisions per the table below based on objectivecriteria.
Basis
93

Access Bank Plc
Consolidated and separate financial statements
For the year ended 31 December 2017
3.20 Levies
The Group recognizes liability to pay levies progressively if the obligating event occurs over a year of time. However,if the obligation is triggered on reaching a minimum threshold, the liability is recognised when that minimumthreshold is reached. The Group recognizes an asset if it has paid a levy before the obligating event but does not yethave a present obligation to pay that levy. The obligating event that gives rise to a liability to pay a levy is the eventidentified by the legislation that triggers the obligation to pay the levy.
Where the Prudential Guidelines provision is greater, the difference is appropriated from retained earnings andincluded in a non - distributable 'Statutory credit reserve'. Where the IAS 39 impairment is greater, noappropriation is made and the amount of IAS 39 impairment is recognised in the income statement.
Following an examination, the regulator may also require more amounts to be set aside on risk and other assets.Such additional amounts are recognised as an appropriation from retained earnings to statutory risk reserve.
The results of the application of Prudential Guidelines and the impairment determined for these assets under IAS39 are compared. The IAS 39 determined impairment charge is always included in the income statement.
94

Access Bank Plc
Consolidated and separate financial statementsFor the year ended 31 December 2017
4.0 Use of estimates and judgements
Key sources of estimation uncertainty
(i) Allowances for credit losses
Sensitivity of Exposure at default - Probability of Default (PD) & Loss Given Default (LGD)
Group Group Group Group
December 2017 December 2016 December 2017 December 2016
Impact on Profit before tax
20% reduction in expected cashflow from specifically impaired (14,757,060) (2,204,979) (14,529,752) (2,204,979)
loans and All customers rated 5 are specifically impaired
Increase in LGD and PD by 2% (727,376) (21,795,115) (716,172) (21,129,199)
Decrease in LGDs and PD by 2% 647,444 20,940,405 637,471 20,288,377
Increase in LGDs and PD by 10% (3,477,014) (23,504,536) (3,423,456) (22,911,741)
Decrease in LGDs and PD by 10% 3,397,082 19,230,984 3,344,756 18,707,632
These disclosures supplement the commentary on financial risk management (see note 5). Estimates where management has applied judgements are:(i) Allowances for credit losses(ii) Valuation of financial instruments(iii) Assessment of impairment of goodwill on acquired subsidiaries(iv) Defined benefit plan
Loans and advances to banks and customers are accounted for at amortised cost and are evaluated for impairment on a basis described in accountingpolicy (see note 3.9 g (i))
The Bank reviews its loan portfolios to assess impairment at least on a half yearly basis. In determining whether an impairment loss should berecorded in the income statement, the Bank makes judgements as to whether there is any observable data indicating an impairment trigger followedby measurable decrease in the estimated future cash flows from a portfolio of loans before the decrease can be identified with that portfolio. Thisevidence may include observable data indicating that there has been an adverse change in the payment status of borrowers in a bank, or national orlocal economic conditions that correlate with defaults on assets in the Bank.
The Bank makes use of estimates based on historical loss experience for assets with credit risk characteristics and objective evidence of impairmentsimilar to those in the portfolio when scheduling future cash flows. The methodology and assumptions used for estimating both the amount andtiming of future cash flows are reviewed regularly to reduce any differences between loss estimates and actual loss experience.
The specific component of the total allowances for impairment applies to financial assets evaluated individually for impairment and is based uponmanagement’s best estimate of the present value of the cash flows that are expected to be received. In estimating these cash flows, managementmakes judgements about a debtor’s financial situation and the net realisable value of any underlying collateral. Each impaired asset is assessed on itsmerits, and the workout strategy and estimate of cash flows considered recoverable are independently reviewed by the Credit Risk ManagementDepartment (CRMD).
A collective component of the total allowance is established for:• Groups of homogeneous loans that are not considered individually significant and• Groups of assets that are individually significant but were not found to be individually impaired
Collective allowance for groups of homogeneous loans is established using statistical modelling of historical trends of the probability of default,timing of recoveries and the amount of loss incurred, adjusted for management’s judgement as to whether current economic and credit conditions aresuch that the actual losses are likely to be greater or less than suggested by historical modelling. Default rates, loss rates and the expected timing offuture recoveries are regularly benchmarked against actual outcomes to ensure that they remain appropriate.
Collective allowance for group of assets that are individually significant but that were not found to be individually impaired cover credit lossesinherent in portfolios of loans and advances and held to maturity investment securities with similar credit characteristics when there is objectiveevidence to suggest that they contain impaired loans and advances and held to maturity investment securities, but the individual impaired itemscannot yet be identified. In assessing the need for collective loan loss allowances, management considers factors such as credit quality, portfolio size,concentrations, and economic factors. In order to estimate the required allowance, assumptions are made to define the way inherent losses aremodelled and to determine the required input parameters, based on historical experience and current economic conditions. The accuracy of theallowances depends on estimates of future cash flows for specific counterparty allowances and the model assumptions and parameters used indetermining collective allowances are estimated.
Had there been a 20% reduction in expected cashflows from all the significantlly impaired loans and customers rated ORR 5 facilities were impaired,there would have been an additional impairment of N14.8bn in the financial statements relating to this. In addition, if the PDs and LGDs wereincreased by 2%, impairment charge would have further increased by N716m but if the PDs and LGDs were decreased by 2%, there would have beena write back of impairment of N637m.
Loans and advances to corporatesLoans and advances to individuals
95

Access Bank Plc
Consolidated and separate financial statementsFor the year ended 31 December 2017
Statement of prudential adjustments
a)
b)
Statement of prudential adjustments December December
In thousands of Naira 2017 2016
Bank Note
Loans & advances:
Specific impairment allowances on loans to customers
- Loans to Individuals 23(b) 402,318 405,200
- Loans to Corporate 23(b) 35,614,441 9,679,116
Collective impairment allowances on loans to customers
- Loans to Individuals 23(b) 645,740 1,039,812
- Loans to Corporates 23(b) 19,626,902 19,151,386
Collective impairment allowances on loans to banks 22 41,506 23,386
Total impairment allowances on loans per IFRS 56,330,907 30,298,900
Total regulatory impairment based on prudential gudielines 91,389,173 65,357,166
Balance, beginning of the year 35,058,266 37,826,382
Additional transfers to regulatory risk reserve - (2,768,116)
Balance, end of the year 35,058,266 35,058,266
4.1 Valuation of financial instruments
• Prudential Provisions is less than IFRS provisions; IFRS determined provision is charged to the statement of comprehensive income. Thecumulative balance in the regulatory risk reserve is thereafter reversed to the general reserve account
Provisions under prudential guidelines are determined using the time based provisioning regime prescribed by the Revised Central Bank of Nigeria(CBN) Prudential Guidelines. This is at variance with the incurred loss model required by IFRS under IAS 39. As a result of the differences in themethodology/provision regime, there will be variances in the impairments allowances required under the two methodologies.
Paragraph 12.4 of the revised Prudential Guidelines for Deposit Money Banks in Nigeria stipulates that Banks would be required to make provisionsfor loans as prescribed in the relevant IFRS Standards when IFRS is adopted. However, Banks would be required to comply with the following:
Provisions for loans recognised in the profit and loss account should be determined based on the requirements of IFRS. However, the IFRSprovision should be compared with provisions determined under prudential guidelines and the expected impact/changes in general reservesshould be treated as follows:
• Prudential Provisions is greater than IFRS provisions; the excess provision resulting should be transferred from the general reserve account toa "regulatory risk reserve".
The non-distributable reserve should be classified under Tier 1 as part of the core capital.
The Bank has complied with the requirements of the guidelines as follows:
The Central Bank of Nigeria (CBN) via its cicrular BSD/DIR/GEN/LAB/08/052 issued on 11 November 2015, directed banks in Nigeria to increasethe general provision on performing loans from 1 percent to 2 percent for prudential review of credit portfolios in order to ensure adequate bufferagainst unexpected loan losses.
The table below analyses financial and non-financial instruments measured at fair value at the end of the financial year, by the level in the fair valuehierarchy into which the fair value measurement is categorised:
96

Access Bank Plc
Consolidated and separate financial statementsFor the year ended 31 December 2017
4.1.1 Recurring fair value measurements
In thousands of Naira
Group
December 2017
Level 1 Level 2 Level 3 Total
Assets
Investment under management
Government bonds - 357,441 - 357,441
Placements - - 6,283,077 6,283,077
Commercial paper - 6,992,904 - 6,992,904
Nigerian treasury bills 1,972,963 - - 1,972,963
Mutual funds - 2,664,746 - 2,664,746
Eurobonds - 1,986,000 - 1,986,000Non pledged trading assets
Treasury bills 37,743,819 - - 37,743,819Bonds 9,031,525 19,369 - 9,050,894Equity 59,348 - - 59,348
Derivative financial instrument - 93,419,293 - 93,419,293
Pledged assets
Treasury bills 157,172,849 - - 157,172,849
Bonds 30,748,762 - - 30,748,762
Investment securities
Available for sale
Treasury bills 29,977,451 - - 29,977,451
Bonds 35,684,865 18,394,503 - 54,079,368
Equity 1,147,387 8,760,176 59,673,535 69,581,098
Assets held for sale - - 9,479,967 9,479,967
303,538,969 132,594,432 75,436,579 511,569,980
Liabilities
Derivative financial instrument - 5,332,177 - 5,332,177
- 5,332,177 - 5,332,177
Group
December 2016
Level 1 Level 2 Level 3 Total
Assets
Investment under management
Placements - - 1,070,385 1,070,385
Commercial paper - 6,454,067 - 6,454,067
Nigerian treasury bills 2,887,102 - 2,887,102
Mutual funds - 2,629,693 - 2,629,693
Eurobonds - 1,830,000 - 1,830,000Non pledged trading assets
Treasury bills 34,381,635 - - 34,381,635Bonds 10,170,293 18,304 - 10,188,597Equity 59,348 - - 59,348
Derivative financial instrument - 156,042,984 - 156,042,984
Pledged assets
Treasury bills 188,239,520 - - 188,239,520
Bonds 7,516,209 - - 7,516,209
Investment securities
Available for sale
Treasury bills 69,346,601 - - 69,346,601
Bonds 29,252,094 3,431,482 - 32,683,576
Equity 1,147,387 7,451,138 59,673,535 68,272,060
Assets held for sale - - 140,727 140,727
343,000,189 177,857,668 60,884,647 581,742,503
Liabilities
Derivative financial instrument - 30,444,501 - 30,444,501
- 30,444,501 - 30,444,501
97

Access Bank Plc
Consolidated and separate financial statementsFor the year ended 31 December 2017
Bank
December 2017
In thousands of Naira
Level 1 Level 2 Level 3 Total
Assets
Investment under management
Government bonds - 357,441 - 357,441
Placements - - 6,283,077 6,283,077
Commercial paper - 6,992,904 - 6,992,904
Nigerian treasury bills 1,972,963 - - 1,972,963
Mutual funds - 2,664,746 - 2,664,746
Eurobonds - 1,986,000 - 1,986,000
Non pledged trading assets
Treasury bills 33,906,748 - - 33,906,748
Bonds 9,031,525 19,369 - 9,050,894
Equity 59,348 - - 59,348
Pledged assets
Treasury bills 157,172,849 - - 157,172,849
Bonds 30,748,762 - - 30,748,762
Derivative financial instrument - 92,390,219 - 92,390,219
Investment securities
Available for sale
Treasury bills 9,598,737 - - 9,598,737
Bonds 9,671,791 18,394,503 - 28,066,294
Equity 1,147,387 8,760,176 59,274,393 69,181,956
Asset held for sale - - 9,479,967 9,479,967
253,310,110 131,565,358 75,037,437 459,912,905
Liabilities
Derivative financial instrument - 5,306,450 - 5,306,450
- 5,306,450 - 5,306,450
Bank
December 2016
In thousands of Naira
Level 1 Level 2 Level 3 Total
Assets
Investment under management
Placements - - 1,070,385 1,070,385
Commercial paper - 6,454,067 - 6,454,067
Nigerian treasury bills 2,887,102 - 2,887,102
Mutual funds - 2,629,693 - 2,629,693
Eurobonds - 1,830,000 - 1,830,000
Non pledged trading assets
Treasury bills 34,381,635 - - 34,381,635
Bonds 10,170,293 18,304 - 10,188,597
Equity 59,348 - - 59,348
Pledged assets
Treasury bills 188,239,521 - - 188,239,521
Bonds 7,516,209 - - 7,516,209
Derivative financial instrument - 155,772,662 - 155,772,662
Investment securities
Available for sale
Treasury bills 40,960,665 - - 40,960,665
Bonds 18,025,037 3,431,482 - 21,456,519
Equity 1,147,387 7,451,138 49,821,881 58,420,406
Asset held for sale - - 140,727 140,727
303,387,197 177,587,344 51,032,993 532,007,535
Liabilities
Derivative financial instrument - 30,275,181 - 30,275,181
- 30,275,181 - 30,275,181
98

Access Bank Plc
Consolidated and separate financial statementsFor the year ended 31 December 2017
There were no transfers between levels 1 and 2 during the year.
4.1.2 Financial instruments not measured at fair value
Group
December 2017
In thousands of Naira
Level 1 Level 2 Level 3 Total
Assets
Cash and balances with banks - 953,944,176 - 953,944,176
Loans and advances to banks - - 68,049,702 68,049,702
- - 2,045,074,534 2,045,074,534
Pledged assets
Treasury bills 89,821,710 - - 89,821,710
Bonds 119,473,094 - - 119,473,094
Investment securities
Held to Maturity
Treasury bills 5,384,788 81,818,577 - 87,203,365
Bonds 2,352,196 34,238,386 - 36,590,582
Other assets - - 46,799,196 46,799,196
217,031,788 1,070,001,139 2,159,923,432 3,446,956,359
Liabilities
Deposits from financial institutions - - 450,196,970 450,196,970
Deposits from customers - - 2,244,879,075 2,244,879,075
Other liabilities - - 235,786,478 235,786,478
Debt securities issued 220,217,410 70,331,371 - 290,548,781
Interest-bearing borrowings - - 311,349,297 311,349,297
220,217,410 70,331,371 3,242,211,820 3,532,760,601
Group
December 2016
In thousands of Naira
Level 1 Level 2 Level 3 Total
Assets
Cash and balances with banks - 714,858,231 - 714,858,231
Loans and advances to banks - - 45,847,527 45,847,527
- - 1,771,419,816 1,771,419,816
Pledged assets
Bonds 79,336,927 - - 79,336,927
Investment securities
Held to Maturity
Treasury bills 27,347,558 - - 27,347,558
Bonds 30,729,231 - - 30,729,231
Other assets - - 41,796,068 41,796,068
137,413,716 714,858,231 1,859,063,411 2,711,335,358
Level 1 Level 2 Level 3 Total
Liabilities
Deposits from financial institutions - - 167,356,583 167,356,583
Deposits from customers - - 2,101,625,991 2,101,625,991
Other liabilities - - 111,117,648 111,117,648
Debt securities issued 170,399,997 142,415,186 - 312,815,183
Interest-bearing borrowings - - 303,178,641 303,178,641
170,399,997 142,415,186 2,683,278,863 2,996,094,046
Loans and advances to customers
Loans and advances to customers
99

Access Bank Plc
Consolidated and separate financial statementsFor the year ended 31 December 2017
Bank
December 2017
In thousands of Naira
Level 1 Level 2 Level 3 Total
Assets
Cash and balances with banks - 657,144,247 - 657,144,247
Loans and advances to banks - - 101,523,651 101,523,651
- - 1,822,018,996 1,822,018,996
Pledged assets
Treasury bills 89,821,710 - - 89,821,710
Bonds 119,473,094 - - 119,473,094
Investment securities
Held to maturity
Treasury bills 5,384,788 - - 5,384,788
Bonds 2,352,196 6,161,050 - 8,513,246
Other Assets - - 34,517,514 34,517,514
217,031,788 663,305,297 1,958,060,161 2,838,397,246
Liabilities
Deposits from financial institutions - - - -
Deposits from customers - - - -
Other liabilities - - 223,963,436 223,963,436
Debt securities issued 220,217,410 70,331,371 - 290,548,781
Interest-bearing borrowings - - 288,902,461 288,902,461
220,217,409 70,331,371 512,865,897 803,414,678
Bank
December 2016
In thousands of Naira
Level 1 Level 2 Level 3 Total
Assets
Cash and balances with banks - 517,997,249 - 517,997,249
Loans and advances to banks - - 104,651,099 104,651,099
- - 1,584,350,701 1,584,350,701
Pledged assets
Bonds 79,336,927 - - 79,336,927
Investment securities
Held to maturity
Bonds 30,729,231 - - 30,729,231
Other Assets - - 33,265,072 33,265,072
110,066,158 517,997,249 1,722,266,872 2,350,330,279
Liabilities
Deposits from financial institutions - - 95,107,837 95,107,837
Deposits from customers - - 1,825,471,578 1,825,471,578
Other liabilities - - 105,287,724 105,287,724
Debt securities issued 170,399,997 56,810,072 - 227,210,069
Interest-bearing borrowings - - 448,970,379 448,970,379
170,399,997 56,810,072 2,474,837,518 2,702,047,587
Loans and advances to customers
Loans and advances to customers
100

Access Bank Plc
Consolidated and separate financial statementsFor the year ended 31 December 2017
Financial instrument measured at fair value
(a) Financial instruments in level 1
(b) Financial instruments in level 2
(c) Financial instruments in level 3
The fair value of financial instruments traded in active markets is based on quoted market prices at the balance sheet date. A market is regarded asactive if quoted prices are readily and regularly available from an exchange, dealer, broker, industry group, pricing service, or regulatory agency, andthose prices represent actual and regularly occurring market transactions on an arm’s length basis. The quoted market price used for financial assetsheld by the group is the current bid price. These instruments are included in Level 1. Instruments included in Level 1 comprise primarily governmentbonds, corporate bonds, treasury bills and equity investments classified as trading securities or available for sale investments.
The fair value of financial instruments that are not traded in an active market are determined by using valuation techniques. These valuationtechniques maximise the use of observable market data where it is available and rely as little as possible on entity specific estimates. If all significantinputs required to fair value an instrument are observable, the instrument is included in level 2.
If one or more of the significant inputs is not based on observable market data, the instrument is included in Level 3. Specific valuation techniquesused to value financial instruments include:(i) Quoted market prices or dealer quotes for similar instruments;(ii) The fair value of forward foreign exchange contracts is determined using forward exchange rates at the balance sheet date, with the resulting valuediscounted back to present value;(iii) Other techniques, such as discounted cash flow analysis, are used to determine fair value for the remaining financial instruments.
For more complex instruments, the Group uses proprietary valuation models, which are usually developed from recognised valuation models. Someor all of the significant inputs into these models may not be observable in the market, and are derived from market prices or rates or are estimatedbased on assumptions. Examples of instruments involving significant unobservable inputs include certain Investment securities for which there is noactive market. Valuation models that employ significant unobservable inputs require a higher degree of management judgement and estimation inthe determination of fair value. Management judgement and estimation are usually required for selection of the appropriate valuation model to beused, determination of expected future cash flows on the financial instrument being valued, determination of the probability of counterparty defaultand prepayments and selection of appropriate discount rates. Fair value estimates obtained from models are adjusted for any other factors, such asliquidity risk or model uncertainties, to the extent that the Group believes that a third party market participant would take them into account inpricing a transaction. Fair values reflect the credit risk of the instrument and include adjustments to take account of the credit risk of the Group entityand the counterparty where appropriate.
For level 2 assets, fair value was obtained using a recent market transaction during the year under review. Fair values of unquoted debt securitieswere derived by interpolating prices of quoted debt secuirties with similar maturity profile and characteristics. There were no transfer between levels1 and 2 during the year.
The Group uses widely recognised valuation models for determining the fair value of its financial assets. Valuation techniques include net presentvalue and discounted cash flow models, comparison with similar instruments for which market observable prices exist and other valuation models.Assumptions and inputs used in valuation techniques include risk-free and benchmark interest rates, credit spreads and other premia used inestimating discount rates, bond and equity prices, foreign currency exchange rates, equity and equity index prices and expected price volatilities andcorrelations. The objective of valuation techniques is to arrive at a fair value measurement that reflects the price that would be received to sell theasset or paid to transfer the liability in an orderly transaction between market participants at the measurement date.
101

Access Bank Plc
Consolidated and separate financial statementsFor the year ended 31 December 2017
(ii) Valuation of financial instruments
Valuation techniques used to derive Level 2 fair values
Description Fair value at 31December 2017
Fair value if inputsincreased by 5%
Fair value if inputsdecreased by 5%
Relationship of observableinputs to fair value
Investment inMTN
8,760,176 9,198,185 8,322,167 The higher the share price as atthe last trade date, the higherthe fair value
Derivativefinancial assets
93,419,293
Derivativefinancialliabilities
5,332,177
Valuation techniques used to derive Level 3 fair values
Description Fair value at 31December 2017
ValuationTechnique
ObservableInputs
Fair value ifinputs increased
by 5%
Fair value if inputsdecreased by 5%
Fair value ifunobservable inputs
increased by 5%
Fair value ifunobservable inputs
decreased by 5%
Relationship ofunobservable inputs to
fair value
Investment inAfrica FinanceCorporation
50,882,911 Adjusted fairvaluecomparisonapproach
Average P/Bmultiples ofcomparablecompanies
53,427,057 48,338,765 53,427,057 48,338,765 The higher the illiquidity ratioand the earnings per sharehaircut adjustment the higherthe fair value
Investment inUnifiedPaymentSystem
3,130,451 Adjusted fairvaluecomparisonapproach
Median ofEnterprise valueto EBITDA ratio(EV/EBITDA)of similarcomparablecompanies
3,286,974 2,973,929 3,246,824 3,014,079 The higher the illiquidity ratioand the earnings per sharehaircut adjustment the higherthe fair value
Investment inCSCS
1,343,868 Adjusted fairvaluecomparisonapproach
Median ofEnterprise valueto EBITDA ratio(EV/EBITDA)of similarcomparablecompanies
1,411,061 1,276,675 1,408,673 1,279,062 The higher the illiquidity ratioand the earnings per sharehaircut adjustment the higherthe fair value
Investment inNIBSS
3,396,757 Adjusted fairvaluecomparisonapproach
Weighted Priceto earnings(P/E) ratio ofsimilarcomparablecompanies
3,566,595 3,226,919 3,566,595 3,226,919 The higher the illiquidity ratioand the earnings per sharehaircut adjustment the higherthe fair value
Investment inAfrexim
14,984 Adjusted fairvaluecomparisonapproach
Average P/Bmultiples ofcomparablecompanies
15,733 14,235 15,733 14,235 The higher the illiquidity ratioand the earnings per sharehaircut adjustment the higherthe fair value
Investment inFMDQ
130,610 Adjusted fairvaluecomparisonapproach
Average P/Bmultiples ofcomparablecompanies
137,141 124,080 137,141 124,080 The higher the illiquidity ratioand the earnings per sharehaircut adjustment the higherthe fair value
Investment inCRC
281,626 Adjusted fairvaluecomparisonapproach
Average P/Bmultiples ofcomparablecompanies
295,708 267,545 292,414 270,836 The higher the illiquidity ratioand the earnings per sharehaircut adjustment the higherthe fair value
NigerianMortageRefinanceCompany
93,186 Adjusted fairvaluecomparisonapproach
Average P/Bmultiples ofcomparablecompanies
97,845 88,526 97,845 88,526 The higher the illiquidity ratioand the earnings per sharehaircut adjustment the higherthe fair value
5,312,953 (5,312,953) The higher the market rate, thehigher the fair value of thederivative fiancial instument
Observable Inputs
Share price from last trade date
Number of units owned by Access bank
Fair value through quoted shareprice as at last trade date.
Valuation Technique
Forward and swap: Fair valuethrough market rate from aquoted marketFutures: Fair value throughreference market rate
Market rates from quoted market
Level 2 fair values of investments have been generally derived using the market approach. Below is a table showing sensitivity analysis of material unquoted investments categorised as Level 2 fair values.
Level 3 fair values of investments have been generally derived using the adjusted fair value comparison approach. Quoted price per earning or price per book value, enterprise value to EBITDA ratios of comparableentities in a similar industry were obtained and adjusted for key factors to reflect estimated ratios of the investment being valued. Adjusting factors used are the Illiquidity Discount which assumes a reduced earningon a private entity in comparison to a publicly quoted entity and the Haircut adjustment which assumes a reduced earning for an entity located in Nigeria contributed by lower transaction levels in comparison to anentity in a developed or emerging market.
102

Access Bank Plc
Consolidated and separate financial statements
For the year ended 31 December 2017
Reconciliation of Level 3 Items
The following tables presents the changes in Level 3 instruments for the year ended 31st December 2017
Equity Securities - Available for Sale Group Group Bank Bank
December 2017December 2016 December 2017 December 2016
Opening balance 50,069,031 37,159,966 49,821,881 35,516,671
Total unrealised gains or (losses) in OCI 5,111,787 15,449,958 5,107,631 15,449,958
Reclassification to profit or loss - (2,540,893) - (1,144,748)
Balance, year end 55,180,818 50,069,031 54,929,512 49,821,881
Assets Held for Sale Group Group Bank Bank
December 2017December 2016 December 2017 December 2016
Opening balance - 179,843 140,727 179,843
Cost of asset added 9,369,240 - 9,369,240 -
Cost of Asset disposed (30,000) (39,116) (30,000) (39,116)
Balance, year end 9,339,240 140,727 9,479,967 140,727
Varying valuation techniques were applied in the valuation of assets classified as Level 3
Disclosure Requirements for Level 3 Financial Instruments
Valuation Technique Unquoted Equity:
Description of Valuation Methodology and inputs:
Step 1:Identify quoted companies with similar line of business ,structure and size
Step 3: Derive the average or median of EV/EBITDA or the P/B or P/E ratios of these identified quoted companies
Step 6: Multipy the Adjusted Equity value by the present exchange rate for foreign currency investment
Step 7: Compare theAdjusted Equity value with the carrying value of the investment company to arrive at a net gain or loss
a. Enterprise Value (EV):
b. Earnings Before Interest ,Tax Depreciation and Tax (EBITDA ):
EBITDA = Operating Profit + Depreciation Expense + Amortization Expense
c. Price to Book (P/B Ratio):
The steps involved in estimating the fair value of the Group’s investment in each of the investees (i.e. unquoted equity securities) are as follows:
Step 2: Obtain the EV/EBITDA or the P/B or P/E ratios of these quoted companies identified from Bloomberg,Reuters or Nigeria StockExchange
Step 5: Discount the derived value of the investment company by Illiquidity discount of 25% and EPS Haircut Adjustment of 40% to obtian theAdjusted Equity Value
Step 4: Apply the lower of average (mean) or median of the identified quoted companies ratios on the EV/EBITDA or Book Value or Earnings ofthe investment company to get the value of the investment company
Enterprise value measures the value of the ongoing operations of a company.It is calculated as the market capitalization plus debt, minorityinterest and preferred shares, minus total cash and cash equivalents of the company .
EBITDA is earnings before interest, taxes, depreciation and amortization. EBITDA is one of the indicator's of a company's financial performanceand is used as a proxy for the earning potential of a business.
The price-to-book ratio (P/B Ratio) is used to compare a stock's market value to its book value. It is calculated by dividing the current closing priceof the stock by the latest company book value per share or by dividing the company's market capitalization by the company's total book value fromits balance sheet.
The investment valuation policy (IVP) of the Group provides the framework for accounting for the Group’s investment in unquoted equitysecurities and assets held for sale while also providing a broad valuation guideline to be adopted in valuing them. Furthermore, the IVP details howthe group decides its valuation policies and procedures and analysis changes in fair value measurements from year to year.
In accordance with IFRS 13 Fair Value Measurement, which outlines three approaches for valuing unquoted equity instruments; market approach,the income approach and the cost approach. The Group estimated the fair value of its investment in each of the unquoted equity securities at theend of the financial year using the Market approach.
The Adjusted fair value comparison approach of EV/EBITDA, P/E ratios and P/Bv ratios was adopted in valuing each of these equityinvestments taken into cognizance the suitability of the model to each equity investment and the availability of financial information whileminimizing the use of unobservable data.
The fair value of the other unquoted equity securities were derived using the Adjusted fair value comparison technique. Adjusted fair valuecomparison approach of EV/EBITDA, P/E ratios and P/B ratios are used as input data .
103

Access Bank Plc
Consolidated and separate financial statements
For the year ended 31 December 2017
d. Price to Earning (P/E Ratio):
The price-earnings ratio (P/E Ratio) values a company using the current share price relative to its per-share earnings.
Valuation Assumptions :
i. Illiquidity discount of 25% is used to discount the value of the investments that are not tradable
Basis of valuation:
Method of Valuation
(iii)
(iv) Defined benefit plan
The assets is being valued on a fair open market value approach. This implies that the value is based on the conservative estimates of the reasonableprice that can be obtained if and when the subject asset is offered for sale under the present market conditions.
The comparative method of valuation in the valuation of the asset. This method involves the analysis of recent transaction in such asset within thesame asset type and the size of the subject asset after due allowance have been made for preculiar attributes of the various asset concerned.
The key elements of the control framework for the valuation of financial instruments include model validation and independent price verification.These functions are carried out by an appropriately skilled Finance team, independent of the business area responsible for the products. The resultof the valuation are reviewed quarterly by senior management.
Assessment of impairment of goodwill on acquired subsidiariesGoodwill on acquired subsidiaries was tested for impairment using discounted cash flow valuation method. Projected cash flows were discounted topresent value using a discount rate of 19.50% (Dec. 2016: 19.5%) and a cash flow growth rate of 6.62% (Dec. 2016: 6.62%) over a year of four years.The Group determined the appropriate discount rate at the end of the year by making reference to 15 year government bond which is the longesttenured security in Rwanda. See note 29b for further details.
The present value of the long term incentive plan depends on a number of factors that are determined in an actuarial basis using a number ofassumptions. Any changes in these assumptions will impact the carrying amount of obligations. The assumptions used in determining the net cost(income) for pensions include the discount rate. The Group determines the appropriate discount rate at the end of the year. In determining theappropriate discount rate, reference is made to the yield on Nigerian Government Bonds that have maturity dates approximating the terms of therelated pension liability. Other key assumptions for pension obligations are based in part on current market conditions. See note 37 for thesensitivity analysis.
The sources of the observable inputs used for comparable technique were gotten from Reuters, Bloomberg and the Nigeria Stock Exchnage
ii. EPS Hair cut "emerging market" discount of 40% to take care of inflation and exchange rate impact being that the comparable companies arein foreign countries
104

Access Bank Plc
Consolidated and separate financial statements
For the year ended 31 December 2017
4.3 Financial assets and liabilities
Fair value measurement
Accounting classification measurement basis and fair values
The table below sets out the classification of each class of financial assets and liabilities, and their fair values.
Total carryingTrading Held-to- Available- amount Fair value
Group maturity for-sale
In thousands of Naira
31 December 2017
Cash and balances with banks - - 953,944,176 - - - 953,944,176 953,944,176
Investment under management - - - 20,257,131 - - 20,257,131 20,257,131
Non pledged trading assets
Treasury bills 37,743,819 - - - - - 37,743,819 37,743,819
Bonds 9,050,894 - - - - - 9,050,894 9,050,894
Equity 59,348 - - - - - 59,348 59,348
Derivative financial instruments - - - - 93,419,293 - 93,419,293 93,419,293
Loans and advances to banks - - 68,114,076 - - - 68,114,076 101,523,651
Loans and advances to customers - - 1,995,987,627 - - - 1,995,987,627 2,045,074,534
Pledged assets
Treasury bills 126,477,561 - - 132,195,254 - - 258,672,815 246,994,559
Bonds 68,554 161,264,920 - 27,108,115 - - 188,441,589 150,221,856
Investment securities
- Available for sale
Treasury bills - - - 29,977,451 - - 29,977,451 29,977,451
Bonds - - - 54,079,368 - - 54,079,368 54,079,368
Equity - - - 69,581,098 - - 69,581,098 69,581,098
- Held to Maturity
Treasury bills - 88,203,365 - - - - 88,203,365 87,203,365
Bonds 36,590,582 - - - - 36,590,582 36,590,582
Other assets - - 46,799,196 - - - 46,799,196 46,799,196
173,400,176 286,058,867 3,064,845,075 333,198,417 93,419,293 - 3,950,921,828 3,982,520,321
Deposits from financial institutions - - - - - 450,196,970 450,196,970 450,196,970
Deposits from customers - - - - - 2,244,879,075 2,244,879,075 2,244,879,075
Other liabilities - - - - - 235,786,478 235,786,478 235,786,478
Derivative financial instruments - - - 5,332,177 - 5,332,177 5,332,177
Debt securities issued - - - - - 302,106,706 302,106,706 290,548,781
Interest bearing borrowings - - - - - 311,617,187 311,617,187 311,349,297
- - - - 5,332,177 3,544,586,416 3,549,918,593 3,538,092,778
Loans and
receivables at
amortized cost
Fair value
through profit or
loss
Financial Liabilities
measured at
amortized cost
105

Access Bank Plc
Consolidated and separate financial statements
For the year ended 31 December 2017
Total carrying
Trading Held-to- Available- amount Fair value
Group maturity for-sale
In thousands of Naira
31 December 2016
Cash and balances with banks - - 713,889,105 - - - 713,889,105 714,858,231
Investment under management - - - 14,871,247 - - 14,871,247 14,871,247
Non pledged trading assets
Treasury bills 34,381,635 - - - - - 34,381,635 34,381,635
Bonds 10,188,597 - - - - - 10,188,597 10,188,597
Equity 59,348 - - - - - 59,348 59,348
Derivative financial instruments - - - - 156,042,984 - 156,042,984 156,042,984
Loans and advances to banks - - 45,203,002 - - - 45,203,002 104,651,099
Loans and advances to customers - - 1,809,459,172 - - - 1,809,459,172 1,771,419,816
Pledged assets
Treasury bills 105,841,302 - - 82,398,218 - - 188,239,520 188,239,520
Bonds - 119,191,773 - 7,516,209 - - 126,707,982 86,853,136
Investment securities
- Available for sale
Treasury bills - - - 69,346,601 - - 69,346,601 69,346,601
Bonds - - - 32,648,488 - - 32,648,488 32,683,577
Equity - - - 58,667,555 - - 58,667,555 58,667,555
- Held to Maturity
Treasury bills - 27,350,114 - - - - 27,350,114 27,347,558
Bonds 41,101,014 - - - - 41,101,014 30,729,231
Other assets - - 41,796,068 - - - 41,796,068 41,796,068
150,470,882 187,642,901 2,610,347,347 265,448,319 156,042,984 - 3,369,952,432 3,342,136,203
Deposits from financial institutions - - - - - 167,356,583 167,356,583 167,356,583
Deposits from customers - - - - - 2,089,197,286 2,089,197,286 2,101,625,991
Other liabilities - - - - - 111,117,648 111,117,648 111,117,648
Derivative financial instruments - - - 30,444,501 - 30,444,501 30,444,501
Debt securities issued - - - - - 316,544,502 316,544,502 312,815,183
Interest bearing borrowings - - - - - 299,543,707 299,543,707 303,178,641
- - - - 30,444,501 2,983,759,726 3,014,204,227 3,026,538,547
Financial Liabilities
measured at
amortized cost
Loans and
receivables at
amortized cost
Fair value
through profit or
loss
106

Access Bank Plc
Consolidated and separate financial statements
For the year ended 31 December 2017
Bank
In thousands of Naira31 December 2017
Cash and balances with banks - - 657,144,247 - - - 657,144,247 657,144,247
Investment under management - - - 20,257,131 - - 20,257,131 20,257,131
Non pledged trading assets
Treasury bills 33,906,748 - - - - - 33,906,748 33,906,748
Bonds 9,050,894 - - - - - 9,050,894 9,050,894
Equity 59,348 59,348 59,348
Derivative financial instruments - - - - 92,390,219 - 92,390,219 92,390,219
Loans and advances to banks - - 101,429,001 - - - 101,429,001 101,523,651
Loans and advances to customers - - 1,771,282,739 - - - 1,771,282,739 1,822,018,996
Pledged assets
Treasury bills 141,319,214 94,888,889 - 15,853,635 - - 252,061,738 246,994,559
Bonds 68,554 157,692,827 - 30,680,208 - - 188,441,589 150,221,856
Investment securities
Available for sale
Treasury bills - - - 9,598,737 - - 9,598,737 9,598,737
Bonds - - - 28,066,294 - - 28,066,294 28,066,294
Equity - - - 69,181,956 - - 69,181,956 69,181,956
Held to maturity
Treasury bills - 5,837,568 - - - - 5,837,568 5,384,788
Bonds - 9,116,855 - - - - 9,116,855 8,513,246
Other assets - - 34,517,514 - - - 34,517,514 34,517,514
184,404,758 267,536,139 2,564,373,501 173,637,961 92,390,219 - 3,282,342,578 3,288,830,184
Deposits from financial institutions - - - - - 276,140,835 276,140,835 -
Deposits from customers - - - - - 1,910,773,713 1,910,773,713 -
Derivative financial instruments - - - - 5,306,450 - 5,306,450 5,306,450
Other liabilities - - - - - 223,963,436 223,963,436 223,963,436
Debt securities issued - - - - - 302,106,706 302,106,706 290,548,781
Interest bearing borrowings - - - - - 282,291,141 282,291,141 288,902,461
- - - - 5,306,450 2,995,275,831 3,000,582,281 808,721,128
Trading Held-to-maturity Loans and
receivables at
amortised cost
Financial Liabilities
measured at
amortized cost
Available-for-sale Total carrying
amount
Fair value
through profit or
loss
Fair value
107

Access Bank Plc
Consolidated and separate financial statements
For the year ended 31 December 2017
Bank
In thousands of Naira
31 December 2016
Cash and balances with banks - - 517,997,249 - - - 517,997,249 517,997,249
Investment under management - - - 14,871,247 - - 14,871,247 14,871,247
Non pledged trading assets
Treasury bills 34,381,635 - - - - - 34,381,635 34,381,635
Bonds 10,188,597 - - - - - 10,188,597 10,188,597
Equity 59,348 59,348 59,348
Derivative financial instruments - - - - 155,772,662 - 155,772,662 155,772,662
Loans and advances to banks - - 104,006,574 - - - 104,006,574 104,651,099
Loans and advances to customers - - 1,594,562,345 - - - 1,594,562,345 1,584,350,701
Pledged assets
Treasury bills 105,841,302 - - 82,398,218 - - 188,239,520 188,239,521
Bonds - 119,191,773 - 7,516,209 - - 126,707,982 86,853,136
Investment securities
Available for sale
Treasury bills - - - 40,960,665 - - 40,960,665 40,960,665
Bonds - - - 21,456,519 - - 21,456,519 21,456,519
Equity - - - 58,420,406 - - 58,420,406 58,420,406
Held to maturity
Treasury bills - - - - - - - -
Bonds - 40,363,051 - - - - 40,363,051 30,729,231
Other assets - - 33,265,072 - - - 33,265,072 33,265,072
150,470,882 159,554,824 2,249,831,241 225,623,265 155,772,662 - 2,941,252,872 2,882,197,087
Deposits from financial institutions - - - - - 95,122,188 95,122,188 95,107,837
Deposits from customers - - - - - 1,813,042,872 1,813,042,872 1,825,471,578
Derivative financial instruments - - - - 30,275,181 - 30,275,181 30,275,181
Other liabilities - - - - - 105,287,724 105,287,724 105,287,724
Debt securities issued - - - - - 243,952,418 243,952,418 227,210,069
Interest bearing borrowings - - - - - 372,179,785 372,179,785 376,074,510
- - - - 30,275,181 2,629,584,987 2,659,860,168 2,659,426,899
Financial Liabilities
measured at
amortized cost
Trading Held-to-maturity Loans and
receivables at
amortised cost
Available-for-sale Fair value
through profit or
loss
Total carrying
amount Fair value
108

Access Bank Plc
Consolidated and separate financial statementsFor the year ended 31 December 2017
4.3 (b) Fair value of financial assets and liabilities not carried at fair value
(i) Cash
(ii) Loans and advances to banks and customers
(iii) Investment securities and pledged assets
(iv) Other assets
(v) Deposits from banks and customers
(vi) Other liabilities
(vii) Interest bearing borrowings
The estimated fair value of deposits with no stated maturity, which includes non-interest bearing deposits, is the amountrepayable on demand. The estimated fair value of fixed interest-bearing deposits not quoted in an active market is based ondiscounted cash flows using interest rates for new debts with similar remaining maturity.
The estimated fair value of fixed interest-bearing borrowings not quoted in an active market is based on the market rates forsimilar instruments for these debts over their remaining maturity.
The fair value for financial assets and liabilities that are not carried at fair value were determined respectively as follows:
The carrying amount of Cash and balances with banks is a reasonable approximation of fair value.
Loans and advances are net of charges for impairment. The estimated fair value of loans and advances represents thediscounted amount of estimated future cash flows expected to be received. Expected cash flows are discounted at currentmarket rates to determine fair value.
The fair values are based on market prices from financial market dealer price quotations. Where this information is notavailable, fair value is estimated using quoted market prices for securities with similar credit, maturity and yieldcharacteristics.
The fair value disclosed in the table above comprises equity securities held at cost less impairment and debt instruments.The fair value for these assets are based on estimations using market prices and earning multiples of quoted securities withsimilar characteristics.
The bulk of these financial assets have short maturities with their amounts of financial assets in is a reasonableapproximation of fair value.
The carrying amount of financial liabilities in other liabilities is a reasonable approximation of fair value. They comprise ofshort term liabilities which are available on demand to creditors with no contractual rates attached to them.
109

Access Bank Plc Consolidated and separate financial statements For the year ended 31 December 2017
110
FINANCIAL RISK MANAGEMENT
The Bank’s overall risk tolerance is established in the context of our earning power, capital and diversified
business model. The Bank’s organisational structure and business strategy is aligned with its risk
management philosophy.
As we navigate through new frontiers in a growth market in the ever-changing risk universe, proactive
Enterprise-Wide Risk Management Framework becomes even more critical. We continue to push the
frontiers of our overall risk profile through innovation for a sustainable future whilst remaining responsive
to the ever-changing risk universe.
Access Bank views and treats risk as an intrinsic part of business and maintains a disciplined approach to
its management of risk. Its Group Risk functions remain dynamic and responsive to the needs of
stakeholders as it improves its focus on the inter-relationships between risk types. The Bank uses periodic
reviews of risk exposure limits and risk control to position itself against adverse scenarios. This is an
invaluable tool with which the bank predicted and successfully managed both the local and global
recession which continued to impact the macro economy. Market volatility and economic uncertainty, like
was witnessed in 2008 are typically contained because the Group regularly subjects its exposures to a
range of stress tests across a wide variety of products, currencies, portfolios and customer segments.
The Bank’s risk management architecture, as designed, continued to balance corporate oversight with
well-defined risk management functions which fall into one of three categories where risk must be
managed: lines of business, governance and control, and corporate audit. The Board of Directors and
management of the Bank are committed to constantly establishing, implementing and sustaining tested
practices in risk management to match those of leading international banks. We are convinced that the
long-term sustainability of our Group depends critically on the proper governance and effective
management of our business. As such, risk management occupies a significant position of relevance and
importance in the Bank.
Risk strategies and policies are set by the Board of Directors of Access Bank. These policies, which define
acceptable levels of risk for day-to-day operations as well as the willingness of Access Bank to assume risk,
weighed against the expected rewards, are detailed in the Enterprise-Wide Risk Management (ERM)
Framework, which is a structured approach to identifying opportunities, assessing the risk inherent in
these opportunities and actively managing these risks in a cost-effective manner. Specific policies are also
in place for managing risks in the different core risk areas of credit, market and operational risks as well
as for other key risks such as liquidity, strategic and reputational risks.
The role of the Group Chief Risk Officer in Access Bank remains pivotal as he has the primary
responsibility for ensuring the effective implementation of the ERM Framework of both the Bank and its
subsidiaries. He provides robust challenge to the management teams based on quantitative and
qualitative metrics. The Bank’s ERM Framework and amendments thereto require Board approval, whilst
the Risk Management Division is responsible for the enforcement of the Bank’s risk policy by constantly
monitoring risk, with the aim of identifying and quantifying significant risk exposures and acting upon
such exposures as necessary.
Risk Management in Access Bank Plc. is part of our culture and everyone, from the most junior officer to
Executive Management, is cognisant of the risk culture. The bank’s officers approach every banking
transaction with care, taking into consideration the bank’s acceptable risk appetite and our stated risk
behavior and culture.

Access Bank Plc Consolidated and separate financial statements For the year ended 31 December 2017
111
To some institutions, risk is viewed as a threat or uncertainty, but to us, it goes beyond that. Risk to us,
presents potential opportunities to grow and develop our business within the context of our clearly
articulated and Board-driven risk appetite. Hence our approach to risk management is not limited to
considering downside impacts or risk avoidance; it also encompasses taking risk knowingly for
competitive advantage backed by strong market and macro analytics and scenario planning. Access Bank
approaches risk, capital and value management robustly and we believe that our initiatives to date have
positioned the Group at the leading edge of risk management.
Risk Management Framework
All activities and processes of Access Bank, involve the identification, measurement, evaluation,
acceptance and management of risk or combinations of risks. The Board, advised by the various Board
and Management Risk Committees, requires and encourages a strong risk governance culture which
shapes the Group’s attitude to risk. We believe that risk management encompasses the insights delivered
by information which facilitate appropriate actions. Access Bank benefits from having enhanced its Group
risk management framework, which gives full Group-wide coverage of a variety of risks. Our annual risk
cycle is designed to give management relevant, up-to-date information from which trends can be observed
and assessed. The governance structure supporting our risk cycle is designed to deliver the right
information, at the right time, to the right people.
Here in Access Bank, we have a holistic view of all major risks facing the bank. We remain vigilant with
regard to both known and emerging risks and ensure that we are strong enough to withstand any
exogenous shocks. Our Board-level risk committees play a critical role in providing oversight of risk
management and ensuring that our risk appetite, risk culture and risk profile are consistent with and
support our strategy to deliver long-term, sustainable success in achieving our strategic vision of being the
world’s most respected African Bank.
Risk, by definition, is dynamic in nature. The management of risk, consequently, must be evolving,
necessitating regular review of the effectiveness of each enterprise risk management component. It is in
the light of this that Access Bank’s ERM Framework is subject to continuous review to ensure effective
and cutting-edge risk management. The review is done in both of the following ways: via continuous self-
evaluation and monitoring by the risk management and compliance functions in conjunction with internal
audit; and through independent evaluation by external auditors, examiners and consultants.
We run an automated and workflow-driven approach to managing, communicating, and implementing
Governance, Risk Management and Compliance (GRC) policies and procedures across the Bank. This
provides an integrated and flexible platform for documenting and analysing risks, developing mitigation
plans, defining controls, and managing ongoing risk assessments. It provides clear visibility on key risk
indicators, assessment results, and compliance initiatives with integrated reporting of self-assessments,
independent assessments, and automated controls vis-à-vis set limit.
We believe that understanding and managing our risks and continuously improving our controls are
central to the delivery of our strategic objectives. The Board’s risk committees play an active role in
ensuring that we undertake well-measured, profitable, risk-taking activities that support long-term
sustainable growth.

Access Bank Plc Consolidated and separate financial statements For the year ended 31 December 2017
112
Balancing Risk and Return
Balancing risk and return and taking cognizance of the capital required demands rigorous analysis. The
ultimate aim is to optimize the upside and minimize the downside with a view to adding value to our
shareholders, and providing security to our other capital providers and clients, as well as ensuring overall
sustainability in our business activities.
Every business activity in our Group requires us to put capital at risk in exchange for the prospect of
earning a return. In some activities, the level of return is quite predictable, whereas in other activities the
level of return can vary over a very wide spectrum, ranging from a loss to a profit. Accordingly, over the
past year we have expended substantial energy on improving our risk and capital management
framework, to focus on taking risks where we:
Understand the nature of the risks we are taking, and what the range of outcomes could be under
various scenarios, for taking these risks;
Understand the capital required in order to assume these risks;
Understand the range of returns that we can earn on the capital required to back these risks; and
Attempt to optimize the risk-adjusted rate of return we can earn, by reducing the range of outcomes
and capital required arising from these risks, and increasing the certainty of earning an acceptable
return.
Our objective of balancing risk, return and capital has led us to enhance substantially our risk
management methodologies, in order to be able to identify threats, uncertainties and opportunities and in
turn develop mitigation and management strategies to achieve an optimal outcome.
Value is added for shareholders if our process allows us to demonstrate sustainable risk-adjusted returns
in excess of our cost of capital. The process provides security to our capital providers and clients by
assuring them that we are not taking on incremental risks which adversely affect the outcomes we have
contracted to deliver to them.
Enterprise-wide Scenario and Stress Testing
We use robust and appropriate scenario stress testing to assess the potential impact on the Group’s capital
adequacy and strategic plans. Our stress testing and scenario analysis programme is central to the
monitoring of strategic and potential risks. It highlights the vulnerabilities of our business and capital
plans to the adverse effects of extreme but plausible events. As a part of our core risk management
practices, the Bank conducts enterprise-wide stress tests on a periodic basis to better understand
earnings, capital and liquidity sensitivities to certain economic scenarios, including economic conditions
that are more severe than anticipated. The outcome of the testing and analysis is also used to assess the
potential impact of the relevant scenarios on the demand for regulatory capital compared with its supply.
These enterprise-wide stress tests provide an understanding of the potential impacts on our risk profile,
capital and liquidity. It generates and considers pertinent and plausible scenarios that have the potential
to adversely affect our business.
Stress testing and scenario analysis are used to assess the financial and management capability of Access
Bank to continue operating effectively under extreme but plausible trading conditions. Such conditions
may arise from economic, legal, political, environmental and social factors. Scenarios are carefully
selected by a group drawn from senior line of business, risk and finance executives. Impacts on each line

Access Bank Plc Consolidated and separate financial statements For the year ended 31 December 2017
113
of business from each scenario are then analyzed and determined, primarily leveraging the models and
processes utilized in everyday management routines.
Impacts are assessed along with potential mitigating actions that may be taken in each scenario. Analysis
from such stress scenarios is compiled for and reviewed through our Group ALCO, and the Enterprise
Risk Management Committee and serves to inform and be incorporated, along with other core business
processes, into decision making by management and the Board. The Bank would continue to invest in and
improve stress testing capabilities as a core business process.
Risk Analytics and Reporting
The Bank’s Risk Analytics and Reporting Group continues to champion the development and
entrenchment of integrated data architecture to enhance risk analytics and reporting within the enterprise-
wide risk management (ERM) space in Access Bank. The Group has aligned its governance and functions
to that of leading global financial institutions and also considered all contents as seen in most jurisdictions
where risk management is best practised.
The Group gives the Risk Management space a critical depth and dimension in its risk management
activities as it relates to data management and integration. The Group is responsible for enhancing all core
risk analytical and reporting functions that previously resided in the respective risk areas within our
Enterprise-wide Risk Management (ERM), while the Bank’s pre-defined governance structures in respect
of the above-mentioned functions is retained by the respective risk groups.
The Group remains the key driver in ensuring that Access Bank fully implements Basel II/III to the most
advanced levels in alignment with the Central Bank of Nigeria (CBN) prudential guidelines. The team is
also responsible for the Internal Capital Adequacy Assessment Process (ICAAP), stress testing, Liquidity
Risk measurement and other risk measurement activities. The group aligns its reporting with the Bank’s
predefined government structure such as BRMC, BCC and ERMC.
The functional set up of the Risk Analytics and Reporting group is as follows:
Data management and integration
Integrated Risk Analytics
Integrated Risk Reporting
Data Management and Integration.
This unit is responsible for the development and maintenance of the enterprise risk data architecture with
a roadmap geared to promoting data integrity, data quality and ensuring integration with risk analytics and
reporting.
The Group has a data governance structure which enforces risk data governance and discipline across the
Bank as well as data quality measurement metrics to reduce the Bank’s risk exposure due to data quality
issues.
An efficient structure has been put in place to ensure auto-reconciliation of data across risk and finance
silos to improve timeliness and consistency of risk reporting. The group is in the process of developing a
data structure model which will support the risk analytics and reporting activities, thus driving
improvements.

Access Bank Plc Consolidated and separate financial statements For the year ended 31 December 2017
114
Integrated Risk Analytics
The Group guides the analytical input into the implementation of various risk software and their on-going
implementation in Credit risk, Market risk, Operational risk and other risk areas. The unit also drives the
development as well as implementation of the internal and regulatory risk measurement methodology and
models for the core risk elements; examples of the model are Rating models, Scoring models, Probability of
Default (PD), Loss Given Default (LGD) and Exposure At Default (EAD) ,etc.
The unit designs stress test models and implements the same on the Bank’s portfolios and risk profile as
well as comprehensive risk analyses to provide insight into all current Strategic Business Unit (SBU) risk
profiles. The group also drives the full implementation of Basel II/III and manages the Internal Adequacy
Assessment Process (ICAAP).
In 2015, the Group deepened the Risk Embedded Performance Management Frame work as part of the
process of maintaining and aligning behaviours with the Bank’s moderate risk appetite. Business
performance will subsequently be monitored with a focus on financial performance and risk exposures
being aligned with the Bank’s risk appetite. The 2016 Budget was built with risk appetite as an integral part
of the financial target determination. Varieties of triggers were employed and an automated process was
created to efficiently track compliance and apply a risk charge to the various SBUs where there are
deviations.
Integrated Risk Reporting.
The Group strives to improve all in-house analytical reporting of risk management in the bank and
stimulate a culture of data-driven analytical insights for every decision impacting all risk touch points in
the risk management process.
The quality of risk reporting was also enhanced in 2015 by implementing an automated risk reporting
system known as the Risk Management Report Portal and the subsequent inclusion of the Subsidiary Risk
Management portal. This has led to easy and timely access to risk reports, provided early warning signals,
better limit monitoring and better decision making for all units across risk management.

Access Bank Plc Consolidated and separate financial statements For the year ended 31 December 2017
115
Stress Testing Forum
Stress testing framework
Our stress testing framework is designed to:
• contribute to the setting and monitoring of risk appetite
• identify key risks to our strategy, financial position, and reputation
• examine the nature and dynamics of the risk profile and assess the impact of stresses on our
profitability and business plans
• ensure effective governance, processes and systems are in place to co-ordinate and integrate stress
testing
• inform senior management
• ensure adherence to regulatory requirements
Risk Management Philosophy, Culture, Appetite and Objectives
Access Bank’s Risk Culture Statement:
At Access Bank, we embrace a moderate risk appetite, whilst delivering strategic objectives. We anticipate
the risks in our activities and reward behaviour that aligns with our core values, controls and regulations.
Challenges are discussed in an open environment of partnership and shared responsibility.
Access Bank’s Risk Management philosophy and culture remain fundamental to the delivery of our
strategic objectives. Risk Management is at the core of the operating structure of the Group. We seek to
limit adverse variations in earnings and capital by managing risk exposures within our moderate risk
appetite. Our risk management approach includes minimizing undue concentrations of exposure, limiting
potential losses from stress events and the prudent management of liquidity.
The Bank’s acclaimed risk management process has continued to achieve desired results as evidenced by
improved risk ratios and independent risk ratings. In line with the Group’s core value of excellence, the
Group’s risk management is continuously evolving and improving, given that there can be no assurance
Country Stress Testing
Business
Stress
Testing
Risk Type Stress Testing
Scenario
Selection
Analysis and
Impact
Assessment
Management
Action

Access Bank Plc Consolidated and separate financial statements For the year ended 31 December 2017
116
that all market developments, in particular those of extreme nature, can be fully anticipated at all times.
Hence, executive management has remained closely involved with important risk management initiatives,
which have focused particularly on preserving appropriate levels of liquidity and capital, as well as
managing the risk portfolios.
Risk Management is fundamental to the Group's decision-making and management process. It is
embedded in the role of all employees via the organizational culture, thus enhancing the quality of
strategic, capital allocation and day-to-day business decisions.
Access Bank considers risk management philosophy and culture as the set of shared beliefs, values,
attitudes and practices that characterize how the Bank considers risk in everything it does, from strategy
development and implementation to its day-to-day activities. In this regard, the Bank’s risk management
philosophy is that a moderate and guarded risk attitude ensures sustainable growth in shareholder value
and reputation.
The Bank believes that enterprise risk management provides the superior capabilities to identify and
assess the full spectrum of risks and to enable staff at all levels to better understand and manage risks.
This will ensure that:
Risk acceptance is done in a responsible manner;
The executive and the Board of the Bank have adequate risk management support;
Uncertain outcomes are better anticipated;
Accountability is strengthened; and
Stewardship is enhanced.
The Bank identifies the following attributes as guiding principles for its risk culture.
a) Management and staff:
Consider all forms of risk in decision-making;
Create and evaluate business-unit and Bank-wide risk profile to consider what is best for
their individual business units/department and what is best for the Bank as a whole;
Adopt a portfolio view of risk in addition to understanding individual risk elements;
Retain ownership and accountability for risk and risk management at the business unit or
other point of influence level;
Accept that enterprise risk management is mandatory, not optional;
Strive to achieve best practices in enterprise risk management;
Document and report all significant risks and enterprise-risk management deficiencies;
Adopt a holistic and integrated approach to risk management and bring all risks together
under one or a limited number of oversight functions;
Empower risk officers to perform their duties professionally and independently without
undue interference;
Ensure a clearly defined risk management governance structure;
Ensure clear segregation of duties between market facing business units and risk
management/control functions;
Strive to maintain a conservative balance between risk and profit considerations; and
Continue to demonstrate appropriate standards of behaviour in development of strategy
and pursuit of objectives.

Access Bank Plc Consolidated and separate financial statements For the year ended 31 December 2017
117
b) Risk officers partner with other stakeholders within and outside the Bank and are guided in the
exercise of their powers by a deep sense of responsibility, professionalism and respect for other parties.
c) The bank also partners with its customers to improve their attitude to risk management and encourage
them to build corporate governance culture into their business management
d) Risk management is governed by well-defined policies, which are clearly communicated across the
Bank.
e) Equal attention is paid to both quantifiable and non-quantifiable risks.
f) The Bank avoids products and businesses it does not understand.
Risk management process
Group Oversight Systems and Tools
Group Strategy and Business Planning
(Risk Appetite Limits and Policy Setting)
Risk and
Control
Assessments
Risk Identific
ation
Manageme
nt actio
ns
Monito
ring
Risk reporti
ng
Risk Adjusted
Performance
Management
Capital
Alloc
ation
(Risk Appetite Limits and Policy Setting)

Access Bank Plc Consolidated and separate financial statements For the year ended 31 December 2017
118
Group risk oversight approach
Our risk governance framework, of which our risk appetite framework is a significant element, ensures
the appropriate oversight of and accountability for the effective management of risk. Our oversight starts
with the strategy setting and business planning process. These plans help us articulate our appetite for
risk, which is then set as risk appetite limits for each business unit to work within.
The Bank’s risk management function provides a central oversight of risk management across the Bank
and subsidiaries to ensure that the full spectrum of risks facing the Bank are properly identified,
measured, monitored and controlled in order to minimize adverse outcomes.
The function is complemented by the financial control and strategy group in the management of strategic
and reputational risks.
The Chief Risk Officer coordinates the process of monitoring and reporting risks across the Bank. Internal
audit has the responsibility of auditing the risk management and control function to ensure that all units
charged with risk management perform their roles effectively on a continuous basis. Audit also tests the
adequacy of internal control and makes appropriate recommendations where there are weaknesses.
Strategy and Business Planning
Risk management is embedded in our business strategy and planning cycle. Testament to this is the
inclusion of risk management as one of our strategic priorities. By setting the business and risk strategy,
we are able to determine appropriate capital allocation and target setting for the Group and each of our
businesses.
All business units are required to consider the risk implications of their annual plans. These plans include
analysis of the impact of objectives on risk exposure. Throughout the year, we monitored business
performance regularly focusing both on financial performance and risk exposure. The aim is to continue
the process of integrating risk management into the planning and management process and to facilitate
informed decisions.
Through ongoing review, the links between risk appetite, risk management and strategic planning are
embedded in the business so that key decisions are made in the context of the risk appetite for each
business unit.
Risk Appetite
Risk appetite is an articulation and allocation of the risk capacity or quantum of risk Access Bank Group is
willing to accept in pursuit of its strategy, duly set and approved by the executive committee and the
Board, and integrated into our strategy, business, risk and capital plans. Risk appetite reflects the Group’s
capacity to sustain potential losses arising from a range of potential outcomes under different stress
scenarios.
The Bank defines its risk appetite in terms of both volatility of earnings and the maintenance of minimum
regulatory capital requirements under stress scenarios. Our risk appetite can be expressed in terms of how
much variability of return the Bank is prepared to accept in order to achieve a desired level of result. It is
determined by considering the relationship between risk and return. We measure and express risk
appetite qualitatively and in terms of quantitative risk metrics. The quantitative metrics include earnings

Access Bank Plc Consolidated and separate financial statements For the year ended 31 December 2017
119
at risk (or earnings volatility), Liquidity and economic capital adequacy. In addition, a large variety of risk
limits, triggers, ratios, mandates, targets and guidelines are in place for all the financial risks (e.g. credit,
market and asset and liability management risks).
The Bank’s risk profile is assessed through a ‘bottom-up’ analytical approach covering all of the Group’s
major businesses and products. The risk appetite is approved by the Board and forms the basis for
establishing the risk parameters within which the businesses must operate, including policies,
concentration limits and business mix.
In line with our standard practice, the risk appetite metrics were tracked against approved triggers and
exceptions were reported to management for prompt corrective actions. Key issues were also escalated to
the Enterprise Risk Management committee and the Board Risk Management Committee.
Risk management objectives
The broad risk management objectives of the Bank are:
o To identify and manage existing and new risks in a planned and coordinated manner with
minimum disruption and cost;
o To protect against unforeseen losses and ensure stability of earnings;
o To maximize earnings potential and opportunities;
o To maximize share price and stakeholder protection;
o To enhance credit ratings and depositor, analyst, investor and regulator perception; and
o To develop a risk culture that encourages all staff to identify risks and associated
opportunities and to respond to them with cost effective actions.
Scope of Risks
The scope of risks that are directly managed by the Bank is as follows:
Credit risk
Operational risk
Market and liquidity risk
Legal and compliance risk
Strategic risk
Reputational risk
Capital risk
These risks and the framework for their management are detailed in the enterprise risk management
framework.
Responsibilities and functions
The responsibilities of the Risk Management Division, the Financial Control and Strategy Group, and
other key stakeholders with respect to risk management are highlighted below:
Risk Management Division
a) Champion the implementation of the ERM Framework across the Bank and subsidiaries. Periodically
receive risk reports from management highlighting key risk areas, control failures and remedial action
steps taken by management.

Access Bank Plc Consolidated and separate financial statements For the year ended 31 December 2017
120
b) Develop risk policies, principles, process and reporting standards that define the Bank’s risk strategy
and appetite in line with the Bank’s overall business objectives.
c) Ensure that controls, skills and systems are in place to enable compliance with the Bank’s policies and
standards.
d) Facilitate the identification, measurement, assessment, monitoring and control of the level of risks in
the Bank.
e) Embed risk culture in the Bank to ensure that everyone in the bank takes into consideration Access
Bank risk appetite in whatever they do.
f) Collect, process, verify, monitor and distribute risk information across the Bank and other material risk
issues to senior management, the Board and regulators.
g) Monitor compliance with bank-wide risk policies and limits.
h) Empower Business unit risk champion to identify, monitor and report on the effectiveness of risk
mitigation plans in reducing risk incidence as related to day to day activities in the unit.
i) Ensure that laws, regulations and supervisory requirements are complied with including consequence
management.
j) Champion the implementation of Basel II and III.
k) Promote risk awareness and provide education on risk.
l) Provide assurance on compliance with internal and external policies with respect to risk management.
Financial Control and Strategy
a) Prepare and monitor the implementation of the Bank’s strategic plan
b) Conduct strategic and operational review of the Bank’s activities
c) Conduct regular scanning of the Bank’s operating environment
d) Coordinate and monitor the Bank’s rating exercises by external rating agencies
e) Prepare business intelligence reports for the Bank’s management
f) Prepare periodic management reports on subsidiaries and associates
g) Perform competitive analysis in comparison with industry peers
h) Conduct strategic/operational review of branches
Risk Management Governance Framework
The framework details Access Bank’s risk universe and governance structure comprising three distinct
layers:
1. The enterprise-wide risk management and corporate governance committee forums;

Access Bank Plc Consolidated and separate financial statements For the year ended 31 December 2017
121
2. The executive management committees; and
3. Risk management responsibilities per risk area.
CREDIT RISK MANAGEMENT
Credit risk arises from the failure of an obligor of the Bank to repay principal or interest at the stipulated
time or failure otherwise to perform as agreed. This risk is compounded if the assigned collateral only
partly covers the claims made to the borrower, or if its valuation is exposed to frequent changes due to
changing market conditions (i.e. market risk).
The Bank’s Risk Management philosophy is that moderate and guarded risk attitude will ensure
sustainable growth in shareholder value and reputation. Extension of credit in Access Bank is guided by
its Credit Risk and Portfolio Management Plan, which sets out specific rules for risk origination and
management of the loan portfolio. The Plan also sets out the roles and responsibilities of different
individuals and committees involved in the credit process.
We recognise the fact that our main asset is our loan portfolio. Therefore, we actively safeguard and strive
to continually improve the health of our loan portfolio. We scrutinize all applications and weed out
potential problem loans during the loan application phase, as well as constantly monitor existing loan
portfolio.
The goal of the Bank is to apply sophisticated but realistic credit models and systems to monitor and
manage credit risk. Ultimately these credit models and systems are the foundation for the application of
internal rating-based approach to calculation of capital requirements. The development, implementation
and application of these models are guided by the Bank’s Basel II strategy.
The pricing of each credit granted reflects the level of risks inherent in the credit. Subject to competitive
forces, Access Bank implements a consistent pricing model for loans to its different target markets. The
client’s interest is guarded at all times, and collateral quality is never the sole reason for a positive credit
decision.
Provisions for credit losses meet IFRS and prudential guidelines set forth by the Central Bank of the
countries where we operate, both for loans for which specific provisions exist as well as for the portfolio of
performing loans. Access Bank’s credit process requires rigorous proactive and periodic review of the
quality of the loan portfolio. This helps us to identify and remediate credit issues proactively.
The Criticized Assets Committee performs a quarterly review of loans with emerging signs of weakness;
the Management Credit Committee and the Board Credit Committee also perform reviews of the quality of
our loan portfolio on a quarterly basis. These are in addition to daily reviews performed by the various
Heads of Risk within the Credit Risk Management Groups.
Principal Credit Policies
The following are the principal credit policies of the Bank:
Credit Risk Management Policy: The core objective is to enable maximization of returns on a risk
adjusted basis from banking book credit risk exposures that are brought under the ambit of Credit Risk
Management Policy by putting in place robust credit risk management systems consisting of risk
identification, risk measurement, setting of exposure & risk limits, risk monitoring & control and
reporting of credit risk in the banking book.
Access Bank Plc Consolidated and separate financial statements For the year ended 31 December 2017
122
Credit Risk Mitigant Management Policy: The objective is to aid in effective credit portfolio
management through mitigation of credit risks by using credit risk mitigation techniques.
Credit Risk Rating Policy: The objective of this policy is to ensure reliable and consistent Obligor Risk
Ratings (ORRs) and Facility Risk Ratings (FRRs) throughout Access Bank and to provide guidelines for
risk rating for retail and non-retail exposures in the banking book covering credit and investment books of
the Bank.
Country and Cross Border Risk Management Policy: The objective of this policy is to establish a
consistent framework for the identification, measurement and management of country risk across Access
Bank.
Internal Capital Adequacy Assessment Process (ICAAP) Policy: The objectives of the policy are
identification of material risks, measurement of material risks, monitoring & control of material risks and
reporting of material risks.
Enterprise-wide Risk Management Policy: The core objective is to provide reasonable degree of
assurance to the Board of Directors that the risks threatening the Bank’s achievement of its vision are
identified, measured, monitored and controlled through an effective integrated risk management system
covering credit, market, operational, interest rate, liquidity and other material risks.
Responsibilities of Business Units and Independent Credit Risk Management
In Access Bank, Business units and independent credit risk management have a joint responsibility for the
overall accuracy of risk ratings assigned to obligors and facilities. Business Relationship Managers will be
responsible for deriving the ORR and FRR using approved methodologies as set out in this policy, however
independent credit risk management will validate such ratings.
Notwithstanding who derives the risk rating, Credit Risk Management is responsible for reviewing and
ensuring the correctness of the ORR and FRR assigned to a borrower and facilities. This review includes
ensuring the ongoing consistency of the business’ Risk Rating Process with Access Bank Risk Rating Policy;
ongoing appropriate application of the Risk Rating Process and tools; review of judgmental and qualitative
inputs into the Risk Rating Process; ensuring the timeliness and thoroughness of risk rating reviews; and
ensuring that the documentation of the Risk Rating Process is complete and current.
Credit Risk Management has the final authority if there is a question about a specific rating.
Credit Process
The Bank’s credit process starts with portfolio planning and target market identification. Within
identified target markets, credits are initiated by relationship managers. The proposed credits are
subjected to review and approvals by applicable credit approval authorities. Further to appropriate
approvals, loans are disbursed to beneficiaries.
On-going management of loans is undertaken by both relationship management teams and our Credit
Risk Management Group. The process is applied at the Head Office and in the subsidiaries.
If a preliminary analysis of a loan request by the account manager indicates that it merits further scrutiny,
it is then analyzed in greater detail by the account manager, with further detailed review by Credit Risk
Management. The concurrence of Credit Risk Management must be obtained for any credit extension. If

Access Bank Plc Consolidated and separate financial statements For the year ended 31 December 2017
123
the loan application passes the detailed analysis it is then submitted to the appropriate approval authority
for the size and risk rating of facilities
The standard credit evaluation process is based both on quantitative figures from the Financial
Statements and on an array of qualitative factors. Factual information on the borrower is collected as well
as pertinent macroeconomic data, such as an outlook for the relevant sector, etc. These subjective factors
are assessed by the analyst and all individuals involved in the credit approval process, relying not only on
quantitative factors but also on extensive knowledge of the company in question and its management.
Credit Risk Measurement
Risk Rating Methodology
The credit rating of the counterparty plays a fundamental role in final credit decisions as well as in the
terms offered for successful loan applications. Access Bank employs a robust credit rating system based
on international best practices (including Basel II recommendations) in the determination of the Obligor
and Facility risks and thus allows the bank to maintain its asset quality at a desired level.
In Access Bank, the objective of the Risk Rating Policy is to ensure reliable and consistent Obligor Risk
Ratings (‘ORRs’) and Facility Risk Ratings (‘FRRs’) throughout the Bank and to provide guidelines for risk
rating for retail and non – retail exposures in the bank.
The Risk rating policy incorporates credit risk rating models which estimate risk of obligor default and
facility risks (covering both recovery as well as exposure risk). These models are currently based on
expert judgment for Retail and Non-Retail Exposures. Our goal is to adopt the Internal Rating Based
(“IRB”) approach. The data required to facilitate the IRB approach are being gathered.
All Access Bank businesses that extend credit are subject to the Risk Rating Policy.
Credit Risk Rating Models in Access Bank Plc
The following are the credit risk rating models deployed by Access Bank.
For Retail Exposures:
Obligor Risk Rating (ORR) Models have been developed for:
1. Personal Loans
2. Credit Cards
3. Auto Loans
4. Mortgage Loans
Facility Risk Rating (FRR) Models have been developed for:
1. Loss Given Default (LGD)
2. Exposure at Default (EAD)
For Non – Retail Exposures:
Obligor Risk Rating (ORR) Models have been developed for:
1. Sovereign (Approach to rating Sovereign Exposures using External ratings)
2. Bank and NBFIs

Access Bank Plc Consolidated and separate financial statements For the year ended 31 December 2017
124
3. Corporate
- Manufacturing Sector
- Trading Sector
- Services Sector
- Real Estate Sector
4. Small and Medium Enterprises (SME) Without Financials
Facility Risk Rating (FRR) Models have been developed for
1. Loss Given Default (LGD)
2. Exposure at Default (EAD)
Risk Rating Process
In Access Bank, all businesses must have a documented and approved Risk Rating Process for deriving risk
ratings for all obligors and facilities (including those covered under Credit Programs). The Risk Rating
Process is the end-to-end process for deriving ORRs and FRRs and includes models, guidelines, support
adjustments, collateral adjustments, process controls, as well as any other defined processes that a business
undertakes in order to arrive at ORRs and FRRs. Risk rating process of each business must be in compliance
with the Bank’s Risk rating Policy and deviations must be explicitly approved.
Establishing the Risk Rating Process is the joint responsibility of the Business Manager and the Credit Risk
Manager associated with each business. The process must be documented and must be approved by the
Management Credit Committee.
The Risk Rating Process for each business must be reviewed and approved every three years, unless more
frequent review is specified as a condition of the approvals. Interim material changes to the Risk Rating
Process, as determined by the Credit Risk Manager for the business, must be re-approved.
Risk Rating Scale and external rating equivalent
Access Bank operates a 12-grade numeric risk rating scale. The risk rating scale runs from 1 to 8. Rating 1
represents the best obligors and facilities and rating 8 represents the worst obligors and facilities. The
risk rating scale incorporates sub-grades and full grades reflective of realistic credit migration patterns.
The risk rating scale and the external rating equivalent is detailed below:
Access Bank Risk
Rating
External Rating Grade
1 AAA Investment Grade
2+ AA
2 A
2- BBB
3+ BB+ Standard Grade
3 BB
3- BB-
4 B Non-Investment Grade
5 B-
6 CCC
7 C
8 D

Access Bank Plc Consolidated and separate financial statements For the year ended 31 December 2017
125
Credit Risk Control & Mitigation policy
Authority Limits on Credit
The highest credit approval authority is the Board of Directors, supported by the Board Credit Committee
and further by the Management Credit Committee. Individuals are also assigned credit approval
authorities in line with the Bank’s criteria for such delegation set out in its Credit Risk and Portfolio
Managament Plan. The principle of central management of risk and decision authority is maintained by
the Bank. The maximum amount of credit that may be approved at each subsidiary is limited, with
amounts above such limit being approved at the Head Office.
Potential credit losses from any given account, customer or portfolio are mitigated using a range of tools
such as collateral, credit insurance, credit derivatives and other guarantees. The reliance that can be
placed on these mitigants is carefully assessed in light of issues such as legal certainty and enforceability,
market valuation correlation and counterparty risk of the guarantor.
Where appropriate, credit derivatives are used to reduce credit risks in the portfolio. Due to their potential
impact on income volatility, such derivatives are used in a controlled manner with reference to their
expected volatility.
Collateral is held to mitigate credit risk exposures and risk mitigation policies determine the eligibility of
collateral types.
This structure gives Access Bank the possibility to incorporate much needed local expertise, but at the
same time manage risk on a global level. Local Credit Committees of the Bank’s subsidiaries are thus able
to grant credits, but the sum total of the exposure of the applicant and financially related counterparties is
limited, most commonly by the subsidiary’s capital. All applications that would lead to exposures
exceeding the set limit are referred to the appropriate approval authority in the Head Office.
The credit approval limits of the principal officers of the Group are shown in the table below
Approving Authority Approved Limit
(New Credits)
Approved Limit
(Renewals of existing credits)
Executive Director 150 200
Group Deputy Managing Directors 400 500
Group Managing Director/CEO 500 600
Managing Directors of bank subsidiaries See Below:
COUNTRY
APPROVAL LIMIT
(N)
GHANA 65 MILLION
RWANDA 20 MILLION

Access Bank Plc Consolidated and separate financial statements For the year ended 31 December 2017
126
In addition, approval and exposure limits based on internal Obligor Risk Ratings have been approved by
the Board for the relevant credit committees as shown in the table below;
Access
Bank
Risk
Rating
S&P Long
term
equivalent
Exposure Limit
(ORR-based LLL) for
New credits
Management Credit
Committee
Approval Limit
Board Credit
Committee
Approval Limit
Board of
Directors
Limit
1 AAA N41Bn N20bn N40bn
Legal
lending
limit
2+ AA N33bn N15bn N30bn
2 A N25bn N5bn N15bn
2- BBB N16bn N2bn N10bn
3+ BB+ N3bn N1bn N10bn
3 BB N1.7bn N0.8bn N10bn
3- BB- N.8bn N0.5bn N2bn
4 B Above N0.1bn
5 B-
Collateral Policies
It is the Group’s policy that all credit exposures are adequately collateralised. Credit risk mitigation is an
activity of reducing credit risk in an exposure or transferring it to counterparty, at facility level, by a safety
net of tangible and realizable securities including approved third-party guarantees/ insurance.
In Access Bank, strategies for risk reduction at the transaction level differ from that at the portfolio level.
At transaction level, the most common technique used by the bank is the collateralization of the
exposures, by first priority claims or obtaining a third party guarantee. For all credit risk mitigants that
meet the policy criteria, a clear set of procedures are applied to ensure that the value of the underlying
collateral is appropriately recorded and updated regularly.
Collateral types that are eligible for risk mitigation include: cash; residential, commercial and industrial
property; moveable assets such as motor vehicles, aircraft, plant and machinery; marketable securities;
commodities; bank guarantees; and letters of credit.
Other techniques include buying a credit derivative to offset credit risk at transaction level. At portfolio
level, asset securitisation, credit derivatives etc. are used to mitigate risks in the portfolio.
However the primary consideration for approving credits is hinged largely on the obligor’s financial
strength and debt-servicing capacity. The guidelines relating to risk mitigant as incorporated in the
guidance note of BCBS on “Principles for the Management of Credit Risk” (September 2000, Paragraph
34) are be taken into consideration while using a credit risk mitigant to control credit risk.

Access Bank Plc Consolidated and separate financial statements For the year ended 31 December 2017
127
“Bank can utilize transaction structure, collateral and guarantees to help mitigate risks (both identified
and inherent) in individual credits but transactions should be entered into primarily on the strength of the
borrower’s repayment capacity. Collateral cannot be a substitute for a comprehensive assessment of the
borrower or the counterparty, nor can it compensate for insufficient information. It should be recognized
that any credit enforcement actions (e.g. foreclosure proceedings) can eliminate the profit margin on the
transaction. In addition, Banks need to be mindful that the value of collateral may well be impaired by the
same factors that have led to the diminished recoverability of the credit.”
The range of collaterals acceptable to the Bank include:
Cash / Deposit (domestic and foreign currency) with the bank including certificates of deposit
or comparable instruments issued by the bank.
Certificates of Deposit from other banks.
Commodities.
Debt securities issued by sovereigns and public-sector enterprises.
Debt securities issued by banks and corporations.
Equities - Stocks / Share Certificates of quoted blue chip companies
Mortgage on Landed Property
Asset-backed securities.
Charge on assets (Fixed and/or Floating) - premises/ inventory/ receivables/ merchandise/
plant/ machinery etc.
Negative Pledges
Lien on Asset being financed
Stock Hypothecation
Shipping Documents (for imports)
Bankers’ Acceptance
Life Assurance Policies
Master Netting Arrangements - Traded Products
Credit risk from traded products is managed within the overall credit risk appetite for corporates and
financial institutions.
The credit risk exposure from traded products is derived from the positive mark-to-market value of the
underlying instruments, and an additional component to cater for potential market movements.
For derivative contracts, we limit our exposure to credit losses in the event of default by entering into
master netting agreements with certain counterparties. As required by IAS 32, exposures are only
presented net in the financial statement if there is a legal right to offset and the assets/liabilities will be
settled simultaneously.
It is the Group’s policy that all credit exposures are adequately collateralised. Credit risk mitigation is an
activity of reducing credit risk in an exposure.
Provisioning policy
A loan or loan portfolio is impaired and impairment losses are incurred only if there is objective evidence
of impairment as a result of one or more events that occurred after initial recognition of the asset (a ‘loss

Access Bank Plc Consolidated and separate financial statements For the year ended 31 December 2017
128
event’) and that loss event (or events) has an impact on the estimated future cash flows of the loan or loan
portfolio that can be reliably estimated.
MARKET RISK MANAGEMENT
Definition
Access Bank is faced with the risk of decline in its earnings and capital arising from adverse changes in
market variables; such as interest rate and foreign exchange rate. Market Risk is the risk that the value of
on/off-balance sheet positions will be adversely affected by movements in interest rates and currency
exchange rates. Access Bank is exposed to market risk through the positions created in its trading and
banking books.
Market risk policy, management and control
Over the years, the Nigerian financial market has witnessed a dramatic expansion in the array of financial
services and products. This tremendous growth in scale and scope has also generated new risks with global
consequences, especially market risk, necessitating an assessment of exposures to the volatility of the
underlying risk drivers.
These developments have prompted a comprehensive and dynamic Market Risk Policy, ALM Policy,
Liquidity Policy, Stress Testing Policy, e.t.c. to ensure that risks faced across business activities and on an
aggregate basis are within the stipulated risk appetite of the Bank. These policies have been benchmarked
with industry and international best practices, and CBN regulations.
The Board approves the risk appetite for trading and non-trading activities and risk limits are set within the
context of the approved market risk appetite. Limits are set based on the approved risk appetite, underlying
liquidity as well as legal limitations on individual positions imposed by the regulatory authorities in Nigeria.
The specific limits are proposed by the Group Head, market risk management and the Bank’s Group Chief
Risk Officer and approved by the Bank’s Executive Management, relevant management committees, and
ultimately by the Board.
The Bank runs a state-of-the-art integrated and straight through processing treasury system for enabling
efficient, monitoring and management of interest rate and foreign exchange risks in the bank. Liquidity,
Exchange Rate, and Interest Rate risks are managed through various metrics viz. Liquidity Gap Analysis,
Dynamic Cash Flow Analysis, Liquidity Ratios, Value at Risk (VaR), Earnings at Risk (EaR) and Sensitivity
Analysis. The primary aim of these processes is risk forecasting and impact mitigation through management
action and portfolio rebalancing.
The risk reporting mechanism in the Bank comprises disclosures and reporting to the various management
committees viz. Enterprise Risk Management Committee, Asset Liability Committee and the Board Risk
Management Committee. The Risk Committees receive daily/weekly risk dashboard and monthly/quarterly
reports which are presented at the committee meetings. Depending on the market conditions and risk
outlook, recommendations are made to the risk management committees in respect of the market risk
profile, risk appetite appraisal; as well as review of limits against actual position.
The Bank regularly conducts stress testing to monitor its vulnerability to unfavorable shocks. It monitors
and controls its risk, using various internal and regulatory risk limits for trading book and banking book

Access Bank Plc Consolidated and separate financial statements For the year ended 31 December 2017
129
which are set according to a number of criteria including economic scenario, business strategy,
management experience, peer analysis and the Bank’s risk appetite.
In line with the CBN circular on new capital adequacy framework, Access Bank has adopted the
standardised approach for market risk and is used in the annual computation of the Internal Capital
Adequacy Assessment Process (ICAAP) which involves the identification, measurement and assessment of
all material risks and resultant capital requirements.
Also, the bank has put in place a detailed plan for the full implementation for the Basel II & III
frameworks. A road map for the migration to more advanced capital computation method which factors in
the actual loss experience of the bank has also been drawn up and is being implemented.
Non-trading portfolio
The principal objective of market risk management of non-trading portfolios is to optimize net interest
income. Due to the size of the Bank’s holdings in rate-sensitive assets and liabilities, a major area of market
risk exposures in the bank is the interest rate on the banking book. This risk arises from the mismatch
between the future yield on assets and their funding cost, as a result of interest rate changes. The Bank uses
a variety of tools to track and manage this risk:
Re-pricing gap analysis (which allows the Bank to maintain a positive or negative gap depending
upon the forecast of interest rate position). The size of the gap is then adjusted to either hedge net
interest income against changing interest rates or to speculatively increase net interest income
Liquidity gap analysis
Earnings-at-Risk (EAR) using various interest rate forecasts
Sensitivity Analysis
Interest rate risk
Interest rate risk is the exposure of the Bank’s financial condition to adverse movements in interest rates,
yield curves and credit spreads. The Bank is exposed to interest rate risk through the interest bearing
assets and liabilities in its trading and banking books.
Re-pricing and Liquidity Gap Analysis
Access Bank’s objective for management of interest rate risk in the banking book is to ensure a higher
degree of interest rate mismatch margin stability and lower interest rate risk over an interest rate cycle.
This is achieved by hedging material exposures with the external market.
The Bank’s operations are subject to the risk of interest rate fluctuations to the extent that interest-
earning assets and interest-bearing liabilities mature or re-price at different times or in differing amounts.
In the case of floating rated assets and liabilities, the Bank is also exposed to basis risk, which is the
difference in re-pricing characteristics of the various floating rate indices, such as the savings rate and 90-
day NIBOR and different types of interest.
Non-traded interest rate risk arises in the banking book from the provision of retail and wholesale (non-
traded) banking products and services, as well as from certain structural exposures within the Group
balance sheet, mainly due to re-pricing timing differences between assets, liabilities and equity. These
risks impact both the earnings and the economic value of the Group. Overall non-trading interest rate risk
Access Bank Plc Consolidated and separate financial statements For the year ended 31 December 2017
130
positions are managed by Treasury, which uses investment securities, advances to banks and deposits
from banks to manage the overall position arising from the Group’s non-trading activities.
Earnings-at-Risk (EAR) Approach
The principal tool used to measure and control market risk exposure within the Group’s trading portfolios
is the open position limits using the Earnings at Risk approach. Specified limits have been set for open
positions limits, which are the expected maximum exposure the Group is to be exposed to. Risk
management activities are aimed at optimizing net interest income, given market interest rate levels
consistent with the Bank’s business strategies.
Interest-rate risk is monitored centrally with a Gap report. A limits framework is in place to ensure that
retained risk remains within approved appetite. Interest rate risk also arises in each of the Africa
subsidiary treasuries in the course of balance sheet management and facilitating customer activity. The
risk is managed by local treasury functions, subject to modest risk limits and other controls.
Sensitivity Analysis and Stress Testing
Sensitivity analysis and stress testing are risk measurement techniques that help us ensure that the risks
the Bank takes remain within our risk appetite and that our level of capital remains adequate. Sensitivity
analysis involves varying a single factor (e.g. a model input or specific assumption) to assess the impact on
various risk measures.
Stress testing generally involves consideration of the simultaneous movements in a number of risk factors.
It is used to measure the level of potential unexpected losses for Credit, Market (both trading and non-
trading), Operational and Liquidity Risks.
Under potential adverse conditions, stress testing plays an important role in supporting overall capital
management and adequacy assessment processes. Our enterprise-wide stress testing program utilizes
stress scenarios featuring a range of severities based on unlikely but possible adverse market and
economic events. These common stress scenarios are evaluated across the organization, and results are
integrated to develop an enterprise-wide view of the impacts on our financial results and capital
requirements. This program uses macro-economic projections and applies them as stress impacts on the
organization viz-a-viz the various risk types.
Trading portfolio
The measurement/control techniques used to measure and control traded market risk (interest rate and
foreign exchange risk) include daily valuation of positions, limit monitoring, gap analysis, sensitivity
analysis, Value at Risk, tail risk, stress testing, e.t.c.
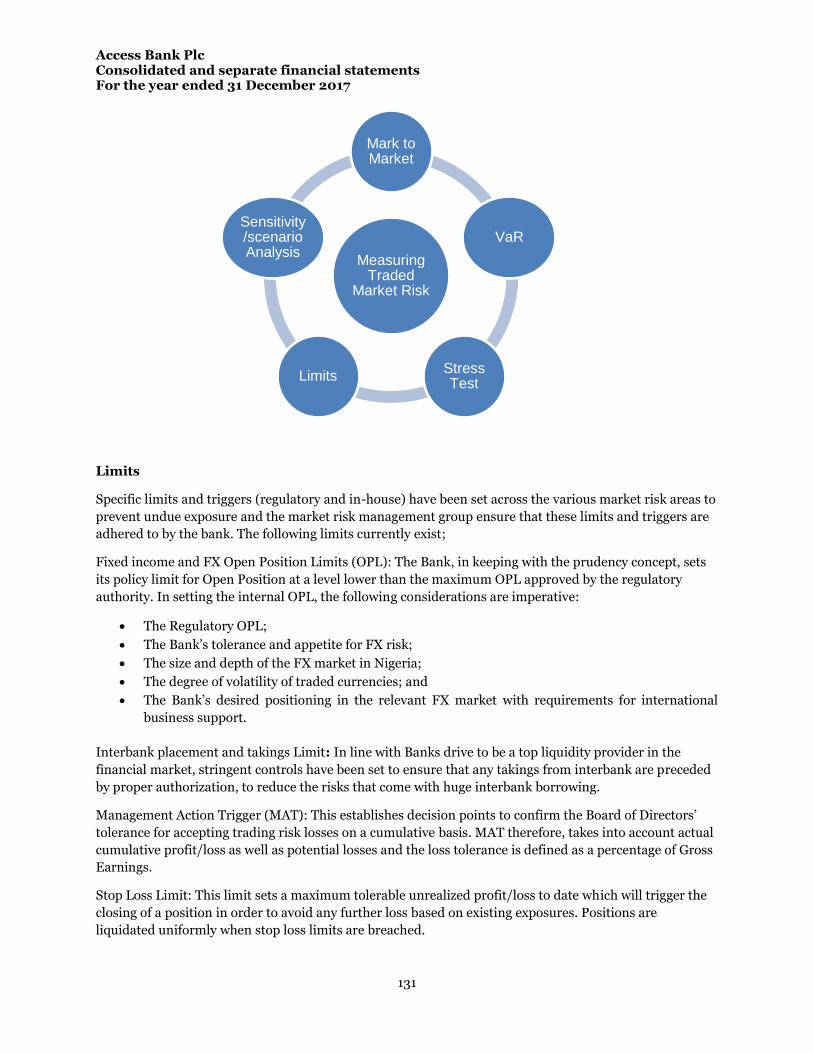
Access Bank Plc Consolidated and separate financial statements For the year ended 31 December 2017
131
Limits
Specific limits and triggers (regulatory and in-house) have been set across the various market risk areas to
prevent undue exposure and the market risk management group ensure that these limits and triggers are
adhered to by the bank. The following limits currently exist;
Fixed income and FX Open Position Limits (OPL): The Bank, in keeping with the prudency concept, sets
its policy limit for Open Position at a level lower than the maximum OPL approved by the regulatory
authority. In setting the internal OPL, the following considerations are imperative:
The Regulatory OPL;
The Bank’s tolerance and appetite for FX risk;
The size and depth of the FX market in Nigeria;
The degree of volatility of traded currencies; and
The Bank’s desired positioning in the relevant FX market with requirements for international
business support.
Interbank placement and takings Limit: In line with Banks drive to be a top liquidity provider in the
financial market, stringent controls have been set to ensure that any takings from interbank are preceded
by proper authorization, to reduce the risks that come with huge interbank borrowing.
Management Action Trigger (MAT): This establishes decision points to confirm the Board of Directors’
tolerance for accepting trading risk losses on a cumulative basis. MAT therefore, takes into account actual
cumulative profit/loss as well as potential losses and the loss tolerance is defined as a percentage of Gross
Earnings.
Stop Loss Limit: This limit sets a maximum tolerable unrealized profit/loss to date which will trigger the
closing of a position in order to avoid any further loss based on existing exposures. Positions are
liquidated uniformly when stop loss limits are breached.
Measuring Traded
Market Risk
Mark to Market
VaR
Stress Test
Limits
Sensitivity/scenario Analysis

Access Bank Plc Consolidated and separate financial statements For the year ended 31 December 2017
132
Dealer Limits: This limit sets a maximum transaction limit by a dealer. It is based on experience and
knowledge.
Value-at-Risk Limit: The normal VaR of the portfolio will be the Naira loss that will be exceeded 1% of the
time over a one day horizon. The VaR limits are linked to the Banks risk appetite and Treasury’ Budget.
To quantify the risk appetite with respect to trading intentions we set the VaR0 LIMIT as a % of this value.
These risk limits are set and reviewed at least annually to control Access Bank’s trading activities in line
with the defined risk appetite of the Group. Criteria for setting risk limits include relevant market
analysis, market liquidity and business strategy. Trading risk limits are set at an aggregate, risk category
and lower levels and are expressed in terms of VaR. This is further supported by a comprehensive set of
non-VaR limits, including foreign exchange position limits, stop loss limits and Management Action
Triggers. Appropriate performance triggers are also used as part of the risk management process.
Mark-to-Market (MTM)
The marking-to-market technique establishes historical profit/loss by revaluing money market exposures
to prevailing market prices. When no market prices are available for a specific contract period, mark-to-
model is used to derive the relevant market prices; it is the Bank’s policy to revalue all exposures
categorized under the securities trading portfolio on a daily basis. As a general guide, marking to market
is performed independently of the trading unit i.e. prices/rates are obtained from external sources.
Value at Risk (VaR)
Risk of losses arising from future potential adverse movements in market rates, prices and volatilities are
measured using a VaR methodology. VaR, in general, is a quantitative measure of market risk that applies
recent historic market conditions to estimate the potential future loss in market value that will not be
exceeded in a set time period at a set statistical confidence level.
VaR provides a consistent measure that can be applied across trading businesses and products over time
and can be set against actual daily trading profit and loss outcome. To assess their predictive power, VaR
models are back tested against actual results.
Access Bank uses an internal VaR model based on the historical simulation method. 300 days of historical
price and rate data is applied and updated daily. This internal model is used for measuring value at risk
over both a one-day holding period at a 99% confidence level. This model covers general market (position)
risk across all approved interest rate and foreign exchange products.
There are a number of considerations that should be taken into account when reviewing the VaR
numbers.
These are as follows:
Historical simulation assumes that the past is a good representation of the future. This may not
always be the case.
The assumed time horizon will not fully capture the market risk of positions that cannot be closed
out or hedged within this time horizon.
VaR does not indicate the potential loss beyond the selected percentile.
Intra-day risk is not captured.

Access Bank Plc Consolidated and separate financial statements For the year ended 31 December 2017
133
Prudent valuation practices are used in the VaR calculation when there is difficulty obtaining
rate/price information.
To complement VaR, stress testing and other sensitivity measures are used.
Back testing
The VaR model is an important market risk measurement and control tool and consequently the
performance of the model is regularly assessed for continued suitability. The main approach employed is a
technique known as back testing, which counts the number of days when daily trading losses exceed the
corresponding the VaR estimate.
The standard for back testing is to measure daily losses against the VaR measurement assuming a one-day
holding period and a 99% level of confidence. The green zone of four or less exceptions over a 12-month
period is consistent with a good working VaR model. Back testing reports are produced regularly.
Stress Testing
A consistent stress testing methodology is applied to trading and non-trading books. The stress testing
methodology assumes that scope for management action would be limited during a stress event, reflecting
the decrease in market liquidity that often occurs.
Losses beyond the confidence interval are not captured by a VaR calculation, which therefore gives no
indication of the size of unexpected losses in these situations. Market Risk complements the VaR
measurement by regular stress testing of market risk exposures to highlight the potential risk that may
arise from extreme market events that are rare but plausible.
Stress testing is an integral part of the market risk management framework and considers both historical
market events and forward-looking scenarios. Stress testing provides an indication of the potential size of
Inputs Outputs
Model
Result of Backtest
Confidence Level
Positions
Market Data
Backtest Procedure
Access Bank Plc Consolidated and separate financial statements For the year ended 31 December 2017
134
losses that could arise in extreme conditions. It helps to identify risk concentrations across business lines
and assist senior management in capital planning decisions.
The Bank performs two main types of stress/scenario testing. Firstly, risk factor stress testing, where
extended historical stress moves are applied to each of the main risk categories, which include interest
rate, equity, foreign exchange, commodity and credit spread risk. Secondly, the trading book is subjected
to multi-factor scenarios that simulate past periods of significant market disturbance and hypothetical
extreme yet plausible events.
Stress scenarios are regularly updated to reflect changes in risk profile and economic events. Regular
stress test scenarios are applied to interest rates, credit spreads, exchange rates, commodity prices and
equity prices. Ad hoc scenarios are also prepared reflecting specific market conditions and for particular
concentrations of risk that arise within the businesses.
LIQUIDITY RISK MANAGEMENT
Liquidity risk arises when the Bank is unable to meet expected or unexpected current or future cash flows
and collateral needs without affecting its daily operations or its financial condition. The Bank is managed
to preserve a high degree of liquidity so that it can meet the requirements of its customers at all times
including periods of financial stress.
The Bank has developed a liquidity management framework based on a statistical model underpinned by
conservative assumptions with regard to cash inflows and the liquidity of liabilities. In addition, liquidity
stress tests assuming extreme withdrawal scenarios are performed. These stress tests specify additional
liquidity requirements to be met by holdings of liquid assets.
The Bank’s liquidity has consistently been materially above the minimum liquidity ratio and the
requirements of its stress tests. Global funding and liquidity risk management activities are centralized
within Corporate Treasury. We believe that a centralized approach to funding and liquidity risk
management enhances our ability to monitor liquidity requirements, maximize access to funding sources,
minimizes borrowing costs and facilitate timely responses to liquidity events. We analyze and monitor our
liquidity risk, maintain excess liquidity and access diverse funding sources including our stable deposit
base.
The Board approves the Bank’s liquidity policy and contingency funding plan, including establishing
liquidity risk tolerance levels. The Group ALCO, in conjunction with the Board and its committees,
monitors our liquidity position and reviews the impact of strategic decisions on our liquidity. Liquidity
positions are measured by calculating the Bank’s net liquidity gap and by comparing selected ratios with
targets as specified in the liquidity risk management manual. In line with Basel III regulations, the Bank
has documented its internal Liquidity Adequacy Assessment Process (ILAAP).
Quantifications
Access Bank has adopted both qualitative and quantitative approaches to measuring liquidity risk.
Specifically, the Bank adopted the following approaches;
a) Funding and Liquidity plan;
b) Gap Analysis; and
c) Ratio Analysis

Access Bank Plc Consolidated and separate financial statements For the year ended 31 December 2017
135
The Funding and Liquidity plan defines the Bank’s sources and channels of utilization of funds. The
funding liquidity risk limit is quantified by calculating liquidity ratios and measuring/monitoring the
cumulative gap between our assets and liabilities. The Liquidity Gap Analysis quantifies the daily and
cumulative gap in a business as usual environment. The gap for any given tenor bucket represents the
borrowings from, or placements to, the market required to replace maturing liabilities or assets. The Bank
monitors the cumulative gap as a + or – 20% of the total risk assets and the gap as a + or – 20% of total
deposit liabilities.
Limit management and monitoring
Active management of liquidity through the framework of limits and control presented above is possible
only with proper monitoring capabilities. The monitoring process focuses on funding portfolios, the
forward balance sheet and general indicators; where relevant information and data are compared against
limits that have been established. The Bank’s Group Treasury is responsible for maintaining sufficient
liquidity by maintaining sufficient high ratio of liquid assets and available funding for near-term
liabilities. The secured liquidity measure is calculated and monitored by risk management. Increased
withdrawals of short-term funds are monitored through measurements of the deposit base in the Bank.
Liquidity risk is reported to the Board of Directors on a quarterly basis.
Contingency funding plan
Access Bank has a contingency funding plan which incorporates early warning indicators to monitor
market conditions. The Bank monitors its liquidity position and funding strategies on an ongoing basis,
but recognizes that unexpected events, economic or market conditions, earnings problems or situations
beyond its control could cause either a short or long-term liquidity crisis. It reviews its contingency
funding plan in the light of evolving market conditions and stress test results.
To monitor liquidity and funding, the Group Treasury prepares a liquidity worksheet that project sources
and uses of funds. The worksheet incorporates the impact of moderate risk and crisis situations. The
worksheet is an integral component of the contingency funding plan. Although it is unlikely that a funding
crisis of any significant degree could materialize, we consider it important to evaluate this risk and
formulate contingency plans should one occur.
The contingency funding plan covers: the available sources of contingent funding to supplement cash flow
shortages; the lead times to obtain such funding; the roles and responsibilities of those involved in the
contingency plans; and the communication and escalation requirements when early warning indicators
signal deteriorating market conditions. Both short term and long-term funding crises are addressed in the
contingency funding plan.

Access Bank Plc
Consolidated and separate financial statements
For the year ended 31 December 2017
5.1 Credit risk management
5.1.1 Maximum exposure to credit risk before collateral held or other credit enhancements
Credit risk exposures relating to financial assets are as follows:
Group Group Bank Bank
In thousands of Naira December 2017 December 2016 December 2017 December 2016
Cash and balances with banks
- Current balances with banks 217,862,989 115,380,195 177,770,685 106,594,205
- Unrestricted balances with central banks 28,837,649 139,954,922 7,976,547 33,160,736
- Restricted balances with central banks 357,173,356 250,831,529 354,986,209 248,547,664
- Money market placements 261,805,783 119,826,012 28,157,562 41,798,197
- Other deposits with central banks 88,214,622 87,896,447 88,214,622 87,896,447
Investment under management 20,257,131 14,871,247 20,257,131 14,871,247
Non pledged trading assets
Treasury bills 37,743,819 34,381,635 33,906,748 34,381,635
Bonds 9,050,894 10,188,597 9,050,894 10,188,597
Derivative financial instruments 93,419,293 156,042,984 92,390,219 155,772,662
Loans and advances to banks 68,114,076 45,203,002 101,429,001 104,006,574
Loans and advances to customers 1,995,987,627 1,809,459,172 1,771,282,738 1,594,562,345
Pledged assets
Treasury bills 258,672,815 188,239,520 252,061,738 188,239,520
Bonds 188,441,589 126,707,982 188,441,589 126,707,982
Investment securities
Available for sale
Treasury bills 29,977,451 69,346,601 9,598,737 40,960,665
Bonds 39,429,252 32,891,849 13,416,178 21,699,880
Held to Maturity
Treasury bills 88,203,365 27,350,114 5,837,568 -
Bonds 36,590,582 41,101,014 9,116,855 40,363,051
Other assets 46,799,196 41,796,068 34,517,514 33,265,072
Total 3,866,581,486 3,311,468,890 3,198,412,535 2,883,016,479
Off balance sheet exposures
Transaction related bonds and guarantees 370,892,995 186,251,718 225,158,636 136,163,848
Guaranteed facilities 171,002,109 99,582,709 81,335,619 85,513,821
Clean line facilities for letters of credit and other commitments 293,267,039 261,208,243 200,918,665 158,994,793
Future, swap and forward contracts 662,935,746 933,073,893 624,709,693 900,436,358
Total 1,498,097,889 1,480,116,563 1,132,122,613 1,281,108,820
5.1.2
Group Group Bank Bank
December 2017 December 2016 December 2017 December 2016
In thousands of Naira
Agriculture 41,049,807 22,746,128 33,387,238 16,358,431
Construction 201,778,198 136,719,717 167,640,113 107,339,808
Education 1,578,846 2,866,466 1,143,935 1,411,646
Finance and insurance 26,803,137 24,432,492 21,272,239 21,309,881
General 58,222,075 65,759,892 51,380,613 58,753,541
General commerce 246,861,833 192,758,058 202,234,986 139,729,100
Government 252,844,215 265,754,095 252,842,296 265,300,462
Information And communication 108,995,556 118,887,314 104,961,637 114,360,925
Other Manufacturing (Industries) 86,898,036 98,361,843 63,138,053 77,233,498
Basic Metal Products 2,447,738 2,978,984 2,447,738 2,978,984
Cement 28,230,573 26,141,390 28,230,573 26,141,390
Conglomerate 28,680,746 31,074,505 28,680,746 31,074,505
Steel Rolling Mills 23,690,560 65,431,551 23,690,560 65,431,551
Flourmills And Bakeries 35,728,951 5,045,937 25,574,476 5,045,937
Food Manufacturing 65,610,086 29,921,021 65,610,086 22,140,950
Oil And Gas - Downstream 125,782,480 155,875,311 117,101,483 130,605,016
Oil And Gas - Services 246,820,468 204,208,802 245,082,920 201,268,821
Oil And Gas - Upstream 124,627,587 105,211,512 124,627,587 105,211,512
Crude oil refining 36,001,965 33,386,262 36,001,965 33,386,262
Real estate activities 167,173,504 134,617,760 148,852,107 128,653,753
Transportation and storage 85,626,593 64,919,122 60,458,743 52,966,761
Power and energy 12,075,600 21,406,071 11,152,289 9,465,028
Professional, scientific and technical activities 4,920,204 3,229,824 2,631,415 1,913,153
Others 47,406,687 33,431,407 9,428,341 6,756,944
2,059,855,443 1,845,165,464 1,827,572,140 1,624,837,859
Balances included in Other Assets above are those subject to credit risks. The table above shows a worst-case scenario of credit risk exposure to the Group as at 31 December
2017 and 31 December 2016, without taking account of any collateral held or other credit enhancements attached.
The Directors are confident in their ability to continue to control exposure to credit risk which can result from both its Loans and Advances portfolio and debt securities.
Gross loans and advances to customers per sector is as analysed follows:
For on-balance-sheet assets, the exposures set out above are based on net amounts reported in the statements of financial position. Future, swap and forward contracts are the
nominal value of the contracts.
136

Access Bank Plc
Consolidated and separate financial statements
For the year ended 31 December 2017
5.1.3(a) Group
Credit quality by class
In thousands of Naira
December 2017 December 2016 December 2017 December 2016 December 2017 December 2016 December 2017 December 2016
Carrying amount 66,336,659 60,772,694 1,929,650,967 1,748,686,478 68,114,077 45,203,003 1,498,097,889 1,480,116,562
Neither past due nor impaired
Grade 1 : - - 125,458,686 140,577,674 66,799,117 44,515,864 767,924,971 697,527,499
Grade 2: - - 562,911,931 620,986,103 - - 416,377,679 254,394,923
Grade 3: 65,208,257 58,049,748 1,071,044,176 883,334,381 1,273,337 648,871 313,795,239 525,564,741
Grade 4: 896,996 1,630,027 75,682,756 85,410,961 - - - 2,629,399
Grade 5: - - 28,786,043 3,335,377 - - - -
Gross amount 66,105,253 59,679,776 1,863,883,592 1,733,644,496 68,072,454 45,164,735 1,498,097,889 1,480,116,562
Impairment (527,413) (616,914) (17,561,519) (19,158,011) (19,926) (9,006) - -
Carrying amount 65,577,840 59,062,861 1,846,322,074 1,714,486,485 68,052,528 45,155,729 1,498,097,889 1,480,116,562
Past due but not impaired:
Grade 6: 57,643 658,807 3,712,416 4,099,130 - -
Grade 7: 80,338 852,431 16,457,998 1,067,363 82,917 61,654
Grade 8: 446,868 690,396 7,761,468 5,034,436 - -
Gross amount 584,849 2,201,634 27,931,882 10,200,929 82,917 61,654
Impairment (153,373) (557,599) (4,755,924) (618,041) (21,369) (14,380)
Carrying amount 431,475 1,644,035 23,175,959 9,582,888 61,548 47,274
Past due and impaired:
Grade 6: Impaired 369,308 405,200 6,397,603 5,727,631
Grade 7: Impaired 16,640 23,012 74,180,182 5,845,857
Grade 8: Impaired 354,403 193,016 20,031,730 27,243,913
Gross amount 740,350 621,228 100,609,516 38,817,401
Allowance for impairment (413,006) (555,430) (40,456,581) (14,200,296)
Carrying amount 327,344 65,798 60,152,935 24,617,105
Loans and advances Loans and advances Loans and advances Off balance sheet
to Individuals Corporates to banks
137
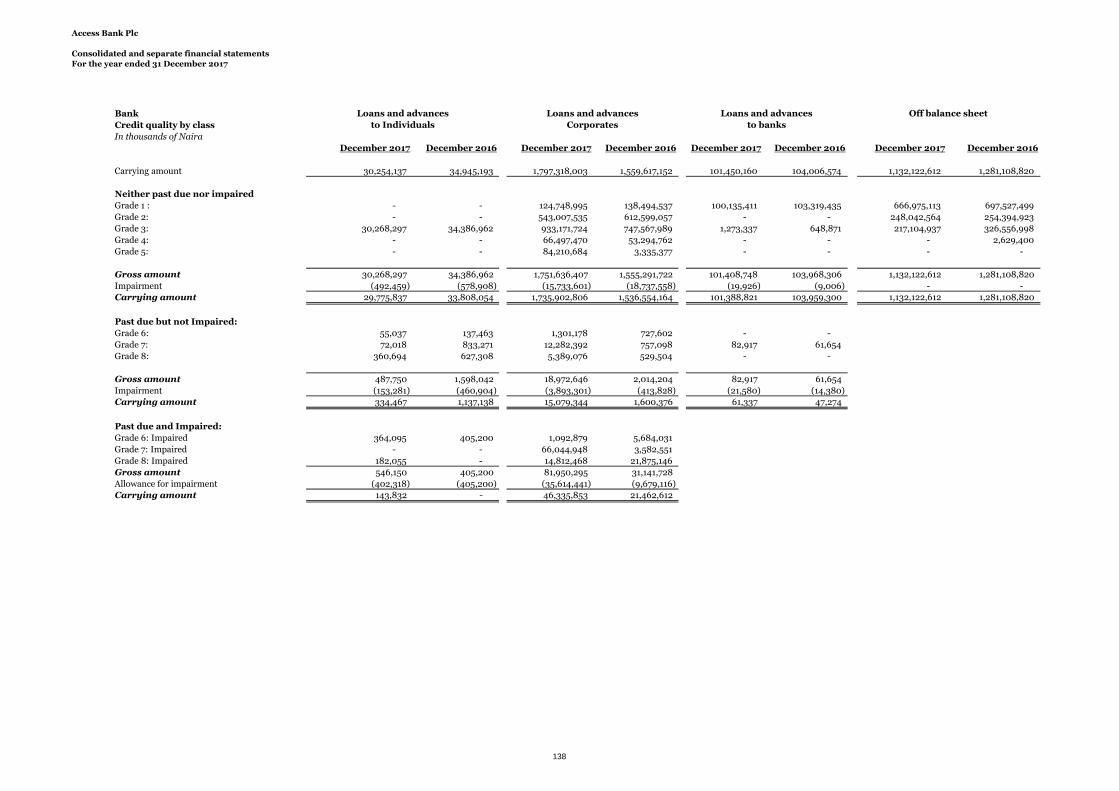
Access Bank Plc
Consolidated and separate financial statements
For the year ended 31 December 2017
Bank
Credit quality by class
In thousands of Naira
December 2017 December 2016 December 2017 December 2016 December 2017 December 2016 December 2017 December 2016
Carrying amount 30,254,137 34,945,193 1,797,318,003 1,559,617,152 101,450,160 104,006,574 1,132,122,612 1,281,108,820
Neither past due nor impaired
Grade 1 : - - 124,748,995 138,494,537 100,135,411 103,319,435 666,975,113 697,527,499
Grade 2: - - 543,007,535 612,599,057 - - 248,042,564 254,394,923
Grade 3: 30,268,297 34,386,962 933,171,724 747,567,989 1,273,337 648,871 217,104,937 326,556,998
Grade 4: - - 66,497,470 53,294,762 - - - 2,629,400
Grade 5: - - 84,210,684 3,335,377 - - - -
Gross amount 30,268,297 34,386,962 1,751,636,407 1,555,291,722 101,408,748 103,968,306 1,132,122,612 1,281,108,820
Impairment (492,459) (578,908) (15,733,601) (18,737,558) (19,926) (9,006) - -
Carrying amount 29,775,837 33,808,054 1,735,902,806 1,536,554,164 101,388,821 103,959,300 1,132,122,612 1,281,108,820
Past due but not Impaired:
Grade 6: 55,037 137,463 1,301,178 727,602 - -
Grade 7: 72,018 833,271 12,282,392 757,098 82,917 61,654
Grade 8: 360,694 627,308 5,389,076 529,504 - -
Gross amount 487,750 1,598,042 18,972,646 2,014,204 82,917 61,654
Impairment (153,281) (460,904) (3,893,301) (413,828) (21,580) (14,380)
Carrying amount 334,467 1,137,138 15,079,344 1,600,376 61,337 47,274
Past due and Impaired:
Grade 6: Impaired 364,095 405,200 1,092,879 5,684,031
Grade 7: Impaired - - 66,044,948 3,582,551
Grade 8: Impaired 182,055 - 14,812,468 21,875,146
Gross amount 546,150 405,200 81,950,295 31,141,728
Allowance for impairment (402,318) (405,200) (35,614,441) (9,679,116)
Carrying amount 143,832 - 46,335,853 21,462,612
Loans and advances Loans and advances Loans and advances Off balance sheet
to Individuals Corporates to banks
138

Access Bank Plc
Consolidated and separate financial statements
For the year ended 31 December 2017
5.1.3
(b) Aging analysis of credit quality
31 December 2017Loans to
individuals
Loans to
Corporates and
Banks Other assets
Loans to
individuals
Loans to
Corporates and
Banks Other assets
Past due & not impaired
Past due up to 30days 50,367 2,039,705 10,421,761 55,037 1,301,178 10,421,761
Past due up 30 - 60 days 329,850 11,908,951 34,394 72,018 12,365,309 34,394
Past due up 60 - 90 days 204,632 13,983,227 89 360,694 5,306,158 89
Total 584,849 27,931,882 10,456,244 487,750 18,972,646 10,456,244
Past due & impaired
Past due up to 91 - 180days 460,721 11,889,957 3,174,170 546,150 1,092,879 3,174,170
Past due up 180 - 360 days 41,897 69,976,067 149,719 - 66,044,948 149,719
Above 360days 237,732 18,743,492 4,423,580 - 14,812,468 4,423,580
Total 740,350 100,609,516 7,747,470 546,150 81,950,295 7,747,470
31 December 2016
Past due & not impaired
Past due up to 30days 658,807 4,099,130 33,760 137,463 727,602 33,760
Past due up 30 - 60 days 852,431 1,067,363 3,504 833,271 757,098 3,504
Past due up 60 - 90 days 690,396 5,034,436 34,830 627,308 529,504 34,830
Total 2,201,634 10,200,929 72,094 1,598,042 2,014,204 72,094
Past due & impaired
Past due up to 91 - 180days 405,200 5,727,631 170,490 405,200 5,684,031 170,490
Past due up 180 - 360 days 23,012 5,845,857 2,151,168 - 3,582,551 2,151,168
Above 360days 193,016 27,243,913 646,200 - 21,875,146 646,200
Total 621,229 38,817,401 2,967,858 405,200 31,141,728 2,967,858
Group Bank
139

Access Bank Plc
Consolidated and separate financial statementsFor the year ended 31 December 2017
5.1.3 Credit quality
(c) Credit quality by risk rating class
Group
In thousands of Naira
December 2017 December 2016 December 2017 December 2016 December 2017 December 2016
External Rating Equivalent Grade Risk Rating
AAA Investment 1 - - 125,458,686 140,577,676 66,799,326 44,515,863
AA Investment 2+ - - 200,441,984 172,873,234 - -
A Investment 2 - - 142,448,359 195,719,545 - -
BBB Investment 2- - - 220,021,589 252,393,325 - -
BB+ Standard 3+ 183,059 698,134 349,018,386 257,581,303 - -
BB Standard 3 63,821,628 56,772,887 594,512,129 532,076,799 1,273,337 648,871
BB- Standard 3- 1,203,570 577,003 127,991,434 93,676,279 - -
B Non-Investment 4 896,996 1,630,027 75,682,756 85,410,961 - -
B- Non-Investment 5 - 1,724 28,786,043 3,335,377 - -
CCC Non-Investment 6 426,950 1,064,007 10,110,020 9,826,761 - -
C Non-Investment 7 96,978 875,443 90,160,408 6,913,220 82,917 61,654
D Non-Investment 8 801,270 883,412 27,793,198 32,278,349 - -
Gross amount 67,430,452 62,502,637 1,992,424,991 1,782,662,829 68,155,580 45,226,388
Collective Impairment (680,786) (941,178) (21,401,515) (17,266,952) (41,506) (9,086)
Specific Impairment (413,006) (250,624) (41,372,509) (10,232,054) - -
Carrying amount 66,336,660 61,310,835 1,929,650,967 1,755,163,823 68,114,074 45,217,302
External Rating Equivalent Grade Risk Rating December 2017 December 2016 December 2017 December 2016
AAA-A Investment 1 314,229,021 499,960,107 77,838,681 130,383,150
A Investment 2 7,385,190 28,635,979 1,796,922 3,668,990
AA Investment 2+ 3,078,492 20,574,538 187,071 1,523,707
BBB Investment 2- 101,649,792 160,447,229 13,596,620 20,467,138
Gross amount 426,342,495 709,617,853 93,419,294 156,042,985
Collective Impairment - - - -
Specific Impairment - - - -
Carrying amount 426,342,495 709,617,853 93,419,294 156,042,985
Loans and advances Loans and advances Loans and advances
to Individuals to Corporates to banks
The external rating equivalent refers to the equivalent ratings for loans and advances by credit rating agencies. These instruments are neither past due nor impaired
Gross Nominal Fair Value
Derivative
Financial Instruments
140

Access Bank Plc
Consolidated and separate financial statementsFor the year ended 31 December 2017
Credit quality by risk rating class
Bank
In thousands of Naira
December 2017 December 2016 December 2017 December 2016 December 2017 December 2016
External Rating Equivalent Grade Risk Rating
AAA Investment 1 - - 124,748,995 138,494,537 100,114,041 103,319,435
AA Investment 2+ - - 199,561,424 171,528,084 - -
A Investment 2 - - 139,252,419 190,643,315 - -
BBB Investment 2- - - 204,193,692 250,427,658 - -
BB+ Standard 3+ 183,059 698,134 326,358,842 236,768,708 - -
BB Standard 3 28,559,373 33,111,826 486,690,642 428,534,577 1,273,337 648,871
BB- Standard 3- 477,807 577,003 120,122,240 82,264,705 - -
B Non-Investment 4 - - 66,497,470 53,294,762 - -
B- Non-Investment 5 - - 28,786,043 3,335,377 - -
CCC Non-Investment 6 419,132 542,663 2,394,057 6,411,633 - -
C Non-Investment 7 72,018 833,271 78,327,340 4,339,649 83,127 61,654
D Non-Investment 8 542,749 627,308 20,201,543 22,404,651 - -
Gross amount 30,254,138 36,390,205 1,797,134,707 1,588,447,656 101,470,506 104,029,960
Collective Impairment (645,740) (1,039,812) (19,626,902) (19,151,386) (41,506) (23,386)
Specific Impairment (402,318) (405,200) (35,614,441) (9,679,116) - -
Carrying amount 29,206,080 34,945,193 1,741,893,363 1,559,617,154 101,429,001 104,006,574
External Rating Equivalent Grade Risk Rating December 2017 December 2016 December 2017 December 2016
AAA-A Investment 1 314,229,021 499,960,107 77,838,681 130,383,150
A Investment 2 7,385,190 28,635,979 1,796,922 3,668,990
AA Investment 2+ 3,078,492 9,728,383 187,071 1,253,384
BBB Investment 2- 66,105,562 160,447,229 12,567,546 20,467,138
Gross amount 390,798,265 698,771,698 92,390,219 155,772,662
Collective Impairment - - - -
Specific Impairment - - - -
Carrying amount 390,798,265 698,771,698 92,390,219 155,772,662
Loans and advances
The external rating equivalent refers to the equivalent ratings for loans and advances by credit rating agencies.
Gross Nominal Fair Value
Derivative
Financial Instruments
to Individuals Corporates to banks
Loans and advances Loans and advances
141

Access Bank Plc
Consolidated and separate financial statementsFor the year ended 31 December 2017
5.1.3 The table below summarises the risk rating for other financial assest:
(d)
Group
In thousands of Naira
Total Grade 1-3 Grade 4-5 Grade 6 Grade 7 Grade 8
Cash and balances with banks
Cash on hand and balances with banks 217,912,766 217,912,766 - - - -
Restricted deposits with central banks 357,173,356 357,173,356 - - - -
Unrestricted balances with central banks 28,837,649 28,837,649 - - - -
Money market placements 261,805,783 261,805,783
Investment under management 20,257,131 20,257,131 - - - -
Non-pledged trading assets
Treasury bills 37,743,819 37,743,819 - - - -
Bonds 9,050,894 9,028,493 22,401 - - -
Equity 59,348 59,348 - - - -
Derivative financial instruments 93,419,293 93,419,293 - - - -
Pledged assets
Treasury bills 258,672,815 258,672,815 - - - -
Bonds 188,441,589 188,441,589 - - - -
Investment securities
- Available for sale
Treasury bills 29,977,451 29,977,451 - - - -
Bonds 39,429,252 39,429,252 - - - -
Equity 3,145,697 3,145,697 - - - -
- Held to Maturity
Treasury bills 88,203,365 88,203,365 - - - -
Bonds 36,590,582 36,590,582 - - - -
Other assets 46,799,196 46,799,196 - - - -
1,717,519,986 1,717,497,585 22,401 - - -
Group
In thousands of Naira
31 December 2016
Total Grade 1-3 Grade 4-5 Grade 6 Grade 7 Grade 8
Cash and balances with banks
Cash on hand and balances with banks 115,380,195 115,380,195 - - - -
Restricted deposits with central banks 250,831,529 250,831,529 - - - -
Unrestricted balances with central banks 139,954,922 139,954,922 - - - -
Money market placements 119,826,012 119,826,012 - - -
Investment under management 14,871,247 14,871,247 - - - -
Non-pledged trading assets
Treasury bills 34,381,635 34,381,635 - - - -
Bonds 10,188,597 10,180,206 8,391 - - -
Equity 59,348 59,348 - - - -
Derivative financial instruments 156,042,984 156,042,984 - - - -
Pledged assets
Treasury bills 188,239,520 188,239,520 - - - -
Bonds 126,707,982 126,707,982 - - - -
Investment securities
- Available for sale
Treasury bills 69,346,601 69,346,601 - - -
Bonds 32,891,849 32,891,849 - - - -
Equity 3,145,697 3,145,697 - - - -
- Held to Maturity
Treasury bills 27,350,114 27,350,114 - - - -
Bonds 41,101,014 41,101,014 - - - -
Other assets 41,796,068 41,796,068 - - - -
1,372,115,314 1,372,106,923 8,391 - - -
31 December 2017
142

Access Bank Plc
Consolidated and separate financial statementsFor the year ended 31 December 2017
The table below summarises the risk rating for other financial assest:
Bank
In thousands of Naira
Total Grade 1-3 Grade 4-5 Grade 6 Grade 7 Grade 8
Cash and balances with banks
Cash on hand and balances with banks 177,809,307 177,809,307 - - - -
Restricted deposits with central banks 443,200,831 443,200,831 - - - -
Unrestricted balances with central banks 7,976,547 7,976,547 - - - -
Money market placements 28,157,562 28,157,562 - - - -
Investment under management 20,257,131 20,257,131 - - - -
Non-pledged trading assets
Treasury bills 33,906,748 33,906,748 - - - -
Bonds 9,050,894 9,028,493 22,401 - - -
Equity 59,348 59,348 - - - -
Derivative financial instruments 92,390,219 92,390,219 - - - -
Pledged assets
Treasury bills 252,061,738 252,061,738 - - - -
Bonds 188,441,589 188,441,589 - - - -
Investment securities
Available for sale
Treasury bills - - - - - -
Bonds 13,416,178 13,416,178 - - - -
Equity - - - - - -
Held to Maturity
Treasury bills 5,837,568 5,837,568 - - - -
Bonds 9,116,855 9,116,855 - - - -
Other assets 34,517,513 34,517,513 - - - -
1,316,200,028 1,316,177,627 22,401 - - -
Bank
In thousands of Naira
Total Grade 1-3 Grade 4-5 Grade 6 Grade 7 Grade 8
Cash and balances with banks
Cash on hand and balances with banks 106,594,205 106,594,205 - - - -
Restricted deposits with central banks 336,444,111 336,444,111 - - - -
Unrestricted balances with central banks 33,160,736 33,160,736 - - - -
Money market placements 41,798,197 41,798,197 - - - -
Investment under management 14,871,247 14,871,247 - - - -
Non-pledged trading assets
Treasury bills 34,381,635 34,381,635 - - - -
Bonds 10,188,597 10,180,206 8,391 - - -
Equity 59,348 59,348 - - - -
Derivative financial instruments 155,772,662 155,772,662 - - - -
Pledged assets
Treasury bills 188,239,520 188,239,520 - - - -
Bonds 126,707,982 126,707,982 - - - -
Investment securities
Available for sale
Treasury bills 40,960,665 40,960,665 - - - -
Bonds 21,456,519 21,456,519 - - - -
Equity - - - - - -
Held to Maturity
Treasury bills - - - - - -
Bonds 40,363,051 40,363,051 - - - -
Other assets 33,265,072 33,265,072 - - - -
1,184,263,547 1,184,255,156 8,391 - - -
31 December 2017
31 December 2016
143

Access Bank Plc
Consolidated and separate financial statementsFor the year ended 31 December 2017
5.1.3 Credit quality
(e ) Credit quality by credit risk rating model
Group
In thousands of Naira
December 2017 December 2016 December 2017 December 2016 December 2017 December 2016
Risk Rating (ORR) Model
Auto Loan 1,878,145 2,511,013 1,620,583 2,003,352 - -
Credit Card 3,019,121 3,475,443 453,502 576,553 - 13,599
Finance Lease 1,226,099 60,912 3,620,889 3,946,347 5,484 8,455
Mortgage Loan 33,118,619 24,375,564 10,584,856 5,929,037 - -
Overdraft 2,494,735 5,639,049 199,670,621 181,242,213 1,350,771 647,541
Personal Loan 17,615,988 18,754,870 - - - -
Term Loan 7,175,548 6,964,075 1,269,661,821 1,102,912,471 - 40,930
Time Loan 902,195 721,712 506,812,720 486,052,855 66,799,326 44,515,863
Gross amount 67,430,452 62,502,636 1,992,424,991 1,782,662,828 68,155,581 45,226,388
Collective Impairment (680,786) (1,174,513) (21,401,515) (19,776,052) (41,506) (23,386)
Specific Impairment (413,006) (555,430) (41,372,509) (14,200,296) - -Carrying amount 66,336,660 60,772,693 1,929,650,966 1,748,686,480 68,114,076 45,203,002
Bank
In thousands of Naira
December 2017 December 2016 December 2017 December 2016 December 2017 December 2016
Risk Rating (ORR) Model
Auto Loan 1,671,616 2,426,024 1,620,583 2,003,352 - -
Credit Card 2,905,420 3,431,339 418,797 563,357 - 13,599
Finance Lease 63,923 60,912 3,620,889 3,946,347 5,484 8,455
Mortgage Loan 4,230,374 5,053,845 - 18,437 - -
Overdraft 2,367,502 5,033,990 154,534,930 135,065,623 1,350,771 647,541
Personal Loan 15,085,225 17,369,909 - - - -
Term Loan 3,125,406 2,427,653 1,194,329,450 1,032,873,587 - 40,930
Time Loan 804,672 586,531 442,610,058 413,976,953 100,114,252 103,319,435
Gross amount 30,254,135 36,390,205 1,797,134,706 1,588,447,654 101,470,507 104,029,960
Collective Impairment (645,740) (1,039,812) (19,626,902) (19,151,386) (41,506) (23,386)
Specific Impairment (402,318) (405,200) (35,614,441) (9,679,116) - -Carrying amount 29,206,077 34,945,193 1,741,893,362 1,559,617,153 101,429,002 104,006,574
Loans and advances Loans and advances Loans and advances
Loans and advances Loans and advances Loans and advances
to Individuals Corporates to banks
to Individuals to Corporates to banks
144

Access Bank Plc
Consolidated and separate financial statementsFor the year ended 31 December 2017
5.1.3 Disclosure of Collateral held against loans and advances to customers by fair value heirarchy
(g)
Group
In thousands of Naira Level 1 Leve1 2 Level 3 Level 1 Leve1 2 Level 3
December 2017 December 2016
Against neither past due and not impaired
Property - - 995,295,330 - - 914,144,760
Equities 18,533,713 36,354,348 - 57,865,380 15,916,553 -
Cash 129,525,855 - - 171,417,199 - -
Pledged goods/receivables - - 133,801,201 - - 141,014,518
Others - - 1,596,503,916 - - 846,303,836
Total 148,059,568 36,354,348 2,725,600,447 229,282,579 15,916,553 1,901,463,114
Against past due but not impaired:
Property - - 10,885,975 - - 4,985,770
Equities - - - - - -
Cash - - - - - -
Pledged goods/receivables - - 2,970,693 - - -
Others - - 14,416,593 - - 32,241
Total - - 28,273,261 - - 5,018,011
Against past due and impaired
Property - - 16,629,299 - - 29,237,351
Equities - - - 24,909 - -
Cash - - - 1,178,130 - -
Pledged goods/receivables - - 2,090,637 - - -
Others - - 17,312,492 - - 19,054,851
- - 36,032,428 1,203,039 - 48,292,202
Total 148,059,568 36,354,348 2,789,906,136 230,485,618 15,916,553 1,954,773,327
Bank
In thousands of Naira Level 1 Leve1 2 Level 3 Level 1 Leve1 2 Level 3
December 2017 December 2016
Against neither past due and not impaired
Property - - 852,166,224 - - 777,026,304
Equities 18,533,713 36,354,348 - 35,795,940 15,916,553 -
Cash 107,162,730 - - 153,127,205 - -
Pledged goods/receivables - - 133,801,201 - - 141,014,518
Others - - 1,445,196,657 - - 745,839,135
Total 125,696,443 36,354,348 2,431,164,082 188,923,145 15,916,553 1,663,879,957
Against past due but not impaired:
Property - - 5,544,609 - - 1,272,479
Equities - - - - - -
Cash - - - - - -
Pledged goods/receivables - - 2,970,693 - - -
Others - - 14,416,593 - - 32,241
Total - - 22,931,895 - - 1,304,720
Against past due and impaired
Property - - 7,654,848 - - 19,975,994
Equities - - - 24,909 - -
Cash - - - - - -
Pledged goods/receivables - - 2,090,637 - - -
Others - - 15,418,194 - - 18,115,344
- - 25,163,679 24,909 - 38,091,338
Total 125,696,443 36,354,348 2,479,259,656 188,948,054 15,916,553 1,703,276,015
Collateral held and other credit enhancements, and their financial effectThe general creditworthiness of a customer tends to be the most relevant indicator of credit quality of a loan extended to it. However, collateral provides additionalconsideration in the credit process and the Group generally requests that corporate borrowers provide collateral. The Group may take collateral in the form of a first chargeover real estate, floating charges over all corporate assets and other liens and guarantees. The Bank will sell or repossess a pledged collateral only in the event of a default andafter exploring other means of repayment. In addition to the Group's focus on creditworthiness, the Group aligns with its Credit Policy Guide to periodically review thevaluations of collaterals held against all loans to customers. This is done in line with the approved Framework for valuing various categories of collateral accepted by the Bank.
The fair values of collaterals are based upon last annual valuation undertaken by independent valuers on behalf of the bank. The valuation technique adopted for properties arebased on fair values of similar properties in the neigbourhood.The fair values of non-property collaterals (such as equities, bond, treasury bills, etc.) are determined with reference to market quoted prices or market values of similarinstruments.
There are no collaterals held against other financial assets. The Group obtained a property during the year by taking possession of collateral held as security against a loan. Thevalue of the collateral repossessed during the year was N9.4bn (2016: Nil). The Group's policy is to pursue timely realisation of the collateral in an orderly manner. The Groupdoes not generally use the non-cash collateral for its own operations. Hence, the repossessed collateral has been included in assets classified as held for sale (Note 31).
145

Access Bank Plc
Consolidated and separate financial statements
For the year ended 31 December 2017
5.1.4 Offsetting financial assets and financial liabilities
As at 31 December 2017
In thousands of Naira
The following financial assets are subject to offsetting
Gross amounts of
recognised
financial assets
Gross
amounts of
recognised
financial
liabilities
offset in the
statement
of financial
position
Net amounts
of financial
assets presented
in the statement
of financial
position
Financial assets
Loans and advances to banks 68,929,263 815,187 68,114,076
Total 68,929,263 815,187 68,114,076
As at 31 December 2017
Financial liabilities
Interest bearing borrowing 283,106,328 815,187 282,291,141
Total 283,106,328 815,187 282,291,141
As at 31 December 2016
In thousands of Naira
The following financial assets are subject to offsetting
Gross amounts of
recognised
financial assets
Gross
amounts of
recognised
financial
liabilities
offset in the
statement
of financial
position
Net amounts
of financial
assets presented
in the statement
of financial
position
Financial assets
Loans and advances to banks 45,954,156 751,154 45,203,002
Total 45,954,156 751,154 45,203,002
As at 31 December 2016
Financial liabilities
Interest bearing borrowing 300,294,861 751,154 299,543,707
Total 300,294,861 751,154 299,543,707
(1) Loans and advances to customers – amortised cost; and
(2) Interest bearing borrowings – amortised cost.
An obligation exists between the Bank and Access Finance B.V., for which Access Finance B.V. was expected to lend the Bank the sum of USD 2,462,000 as a
share premium loan. The loan agreement between both parties however permits that the obligation of Access Finance B.V. to grant the loan, be set off against
the obligation of the Bank to repay the loan such that each party's obligation either as a borrower or lender is discharged. In view of this, no loan payable has
been recognized in the Bank's financial statements.
In line the IAS 32 with the group currently has the legally enforceable right to set-off the recognised amount and it also intends to settle the borrowing on a
net basis.
The gross amounts of financial assets and financial liabilities disclosed in the above tables have been measured in the statement of financial position on the
following bases:
146

Access Bank Plc
Consolidated and separate financial statementsFor the year ended 31 December 2017
5.1.5 (a) Credit concentrationThe Group’s risk profile is assessed through a ‘bottom-up’ analytical approach covering all of the Group’s major businesses and products. The risk appetite is approved by the Board and forms the basisfor establishing the risk parameters within which the businesses must operate, including policies, concentration limits and business mix.
GroupBy Sector
December 2017In thousands of Naira Corporate Commercial Bank Retail Government Others Total
Cash and balances with banks - - 953,894,399 - - - 953,894,399Investment under management 11,643,650 - 6,283,077 - 2,330,403 - 20,257,131Non pledged trading assets
Treasury bills - - - - 37,743,819 - 37,743,819Bonds - 8,497 19,464 - 9,031,525 - 9,059,486
Derivative financial instruments 3,560,997 11,689,840 8,108,304 - 125,038,574 - 148,397,715Loans and advances to banks - - 68,114,076 - - - 68,114,076Loans and advances to customers
Auto Loan 120,445 586,865 - 2,742,750 - - 3,450,060Credit Card 50,596 394,810 - 2,965,221 - - 3,410,627Finance Lease 655,638 2,744,831 - 1,240,840 792 - 4,642,100Mortgage Loan 4,761,743 5,819,908 - 33,040,279 - - 43,621,930Overdraft 62,723,973 119,356,272 - 2,174,641 5,872 - 184,260,759Personal Loan - - - 17,137,946 - - 17,137,946Term Loan 460,442,901 519,862,064 - 7,066,329 252,696,580 - 1,240,067,875Time Loan 248,983,473 249,528,087 - 884,769 - - 499,396,330
Pledged assetsTreasury bills - - - - 258,672,815 - 258,672,815Bonds - - - - 188,441,589 - 188,441,589
Investment securities- Available for sale
Treasury bills - - - - 29,977,451 - 29,977,451Bonds 912,890 - 3,316,197 - 23,837,207 26,013,074 54,079,368
- Held to Maturity -Treasury bills - - - - 88,203,365 - 88,203,365Bonds 2,675,972 - - - 33,914,611 - 36,590,582
Other assets 25,934,436 3,381,399 12,846,281 1,036,130 88,305 3,512,644 46,799,196Total 822,466,714 913,372,574 1,052,581,798 68,288,905 1,049,982,907 29,525,718 3,936,218,618
Transaction related bonds and guarantees 249,278,494 118,106,528 - 3,507,974 - - 370,892,995Guaranteed facilities 41,064,509 123,932,728 - 6,004,872 - - 171,002,109
100,773,513 184,063,021 - 8,430,505 - - 293,267,039
Future, swap and forward contracts 53,713,545 64,076,506 284,158,615 - 260,987,080 - 662,935,746
Total 444,830,061 490,178,783 284,158,615 17,943,351 260,987,080 - 1,498,097,889
GroupBy Sector
December 2016In thousands of Naira Corporate Commercial Bank Retail Government Others Total
Cash and balances with banks - - 663,403,259 - - - 663,403,259Investment under management 10,913,760 - 1,070,385 - 2,887,102 - 14,871,247Non pledged trading assets
Treasury bills - - - - 34,381,635 - 34,381,635Bonds - 9,913 8,391 - 10,170,293 - 10,188,597
Derivative financial instruments 28,003,737 - 5,360,808 - 122,678,439 - 156,042,984Loans and advances to banks - - 45,203,002 - - - 45,203,002Loans and advances to customers
Auto Loan - - - 4,450,747 - - 4,450,747Credit Card 27,496 12,500 - 3,939,240 - - 3,979,235Finance Lease 2,404,390 1,259,848 - 312,384 11,275 - 3,987,898Mortgage Loan 5,323,073 416,377 - 24,431,400 49,707 - 30,220,557Overdraft 47,606,024 120,886,294 - 6,758,959 38,428 - 175,289,705Personal Loan - - - 18,072,072 - - 18,072,072Term Loan 418,496,135 396,250,334 - 8,006,467 265,966,313 - 1,088,719,249Time Loan 236,078,483 246,004,748 - 2,380,302 276,175 - 484,739,708
Pledged assetsTreasury bills - - - - 188,239,520 - 188,239,520Bonds - - - - 126,707,982 - 126,707,982
Investment securities- Available for sale
Treasury bills - - - - 69,346,601 - 69,346,601Bonds 377,207.00 - 5,814,936 - 26,699,706 - 32,891,849
- Held to Maturity -Treasury bills - - - - 27,350,114 - 27,350,114Bonds 3,036,929 - 1,032,857 - 37,031,227 - 41,101,013
Other assets 19,111,634 3,898,137 5,066,892 4,063,320 4,930,246 4,725,841 41,796,070Total 771,378,871 768,738,151 726,960,529 72,414,891 916,764,763 4,725,841 3,260,983,044
Transaction related bonds and guarantees 136,220,145 48,419,939 1,611,634 - - - 186,251,718Guaranteed facilities 85,363,987 14,068,722 150,000 - - - 99,582,710
140,720,906 17,865,294 69,563,933 2,771,057 30,287,053 - 261,208,242
Future, swap and forward contracts 314,341,917 - 185,130,561 - 433,601,415 - 933,073,893Total 676,646,955 80,353,956 256,456,128 2,771,057 463,888,468 - 1,480,116,563
The Group monitors concentrations of credit risk by sector and by geographic location. An analysis of concentrations of net credit risk at the reporting date is shown below:
Credit risk exposures relating to other credit commitmentsat gross amount are as follows:
Credit risk exposures relating to other credit commitmentsat gross amount are as follows:
Clean line facilities for letters of credit and othercommitments
Clean line facilities for letters of credit andother commitments
147

Access Bank Plc
Consolidated and separate financial statementsFor the year ended 31 December 2017
5.1.5(a)i
By geography
GroupDecember 2017 Nigeria Rest of Africa Europe Others TotalIn thousands of Naira
Cash and balances with banks 543,056,552 54,026,117 276,361,986 80,499,521 953,944,176Investment under management 20,257,131 - - - 20,257,131Non pledged trading assets
Treasury bills 33,906,748 3,837,071 - - 37,743,819Bonds 9,050,894 - - - 9,050,894
Derivative financial instruments 91,071,217 1,029,074 265,547 1,053,455 93,419,293Loans and advances to banks 1,293,590 - 66,820,486 - 68,114,076Loans and advances to customers
Auto Loan 3,243,530 206,530 - - 3,450,060Credit Card 3,263,598 147,029 - - 3,410,627Finance Lease 3,486,367 1,155,733 - - 4,642,100Mortgage Loan 4,162,867 359,036 39,100,026 - 43,621,930Overdraft 142,060,909 42,199,850 - - 184,260,759Personal Loan 14,613,195 2,524,752 - - 17,137,946Term Loan 1,165,111,472 39,818,776 34,763,385 - 1,239,693,633Time Loan 435,157,504 8,181,813 56,431,255 - 499,770,572
Pledged assetsTreasury bills 252,061,738 6,611,077 - - 258,672,815Bonds 188,441,589 - - - 188,441,589
Investment securities- Available for sale
Treasury bills 9,598,736 20,378,715 - - 29,977,451Bonds 28,066,294 16,017,820 - 9,995,254 54,079,368
- Held to MaturityTreasury bills 5,837,568 82,365,797 - - 88,203,365Bonds 7,051,660 2,065,195 - 27,473,727 36,590,582
Other assets 31,813,828 14,868,165 - 117,203 46,799,196Total 2,992,606,986 295,792,550 473,742,685 119,139,160 3,881,281,382
Transaction related bonds and guarantees 225,158,636 45,991,882 37,719,900 62,022,577 370,892,995Guaranteed facilities 81,335,619 9,074,661 70,737,891 9,853,938 171,002,109Clean line facilities for letters of credit and other commitments 200,918,665 47,189,190 27,083,771 18,075,413 293,267,039Future, swap and forward contracts 335,204,211 44,259,738 42,048,747 241,423,049 662,935,746
Total 842,617,131 146,515,471 177,590,309 331,374,977 1,498,097,889By geography
GroupDecember 2016 Nigeria Rest of Africa Europe Others TotalIn thousands of Naira
Cash and balances with banks 415,235,668 47,170,554 200,997,037 - 663,403,258Investment under management 14,871,247 - - - 14,871,247Non pledged trading assets
Treasury bills 34,381,635 - - - 34,381,635Bonds 10,170,293 - 18,304 - 10,188,597
Derivative financial instruments 149,856,253 1,388,281 97,119 4,701,331 156,042,983Loans and advances to banks 5,156,475 - 40,046,527 - 45,203,002Loans and advances to customers
Auto Loan 4,366,544 84,204 - - 4,450,748Credit Card 3,935,784 43,450 - - 3,979,235Finance Lease 3,987,898 - - - 3,987,898Mortgage Loan 4,996,952 918,895 24,304,711 - 30,220,557Overdraft 130,272,256 45,017,450 - - 175,289,705Personal Loan 16,789,104 1,282,968 - - 18,072,072Term Loan 1,017,646,255 48,440,037 22,632,958 - 1,088,719,249Time Loan 412,567,554 28,556,750 43,615,404 - 484,739,708
Pledged assetsTreasury bills 188,239,520 - - - 188,239,520Bonds 126,707,982 - - - 126,707,982
Investment securities- Available for sale
Treasury bills 40,960,665 6,092,117 22,293,819 - 69,346,602Bonds 18,939,219 13,297,546 655,084 - 32,891,849
- Held to MaturityTreasury bills - 27,350,114 - - 27,350,114Bonds 37,917,493 737,963 2,445,558 - 41,101,014
Other assets 32,437,346 7,685,644 1,673,078 - 41,796,067Total 2,669,436,141 228,065,973 358,779,599 4,701,331 3,260,983,045
Transaction related bonds and guarantees 136,163,848 48,420,025 1,667,845 - 186,251,718Guaranteed facilities 85,513,821 14,068,888 - - 99,582,709Clean line facilities for letters of credit and other commitments 158,994,793 16,950,311 85,263,139 - 261,208,243Future, swap and forward contracts 744,259,779 33,663,881 128,787,677 26,362,557 933,073,893
Total 1,124,932,241 113,103,105 215,718,659 26,362,557 1,480,116,564
Credit risk exposures relating to othr credit commitments atgross amount are as follows:
Credit risk exposures relating to othr credit commitments atgross amount are as follows:
Concentration by location for loans and advances is measured based on the location of the Group entity holding the asset, which has a high correlation with the location of theborrower. Concentration by location for investment securities is measured based on the location of the issuer of the security.
148

Access Bank Plc
Consolidated and separate financial statementsFor the year ended 31 December 2017
Credit risk management
5.1.5 (b) By Sector
BankDecember 2017In thousands of Naira Corporate Commercial Bank Retail Government Others Total
Cash and balances with banks - - 657,105,625 - - - 657,105,625Investment under management 11,643,650 - 6,283,077 - 2,330,404 - 20,257,131Non pledged trading assets
Treasury bills - - - - 33,906,748 - 33,906,748Bonds 19,369 - - - 9,031,525 - 9,050,894
Derivative financial instruments 821,635 - 1,332,133 - 90,236,451 - 92,390,219Loans and advances to banks - - 101,429,001 - - - 101,429,001Loans and advances to customers
Auto Loan 120,445 586,865 - 2,536,221 - - 3,243,530Credit Card 35,402 376,240 - 2,851,956 - - 3,263,598Finance Lease 655,638 2,744,831 - 85,107 792 - 3,486,368Mortgage Loan - - - 4,162,867 - - 4,162,867Overdraft 43,791,210 96,216,229 - 2,047,597 5,872 - 142,060,909Personal Loan - - - 14,613,195 - - 14,613,195Term Loan 428,695,546 480,870,715 - 3,033,846 252,694,662 - 1,165,294,769Time Loan 220,118,015 214,248,083 - 791,406 - - 435,157,504
Pledged assetsTreasury bills - - - - 252,061,738 - 252,061,738Bonds - - - - 188,441,589 - 188,441,589
Investment securitiesAvailable for sale
Treasury bills - - - - 9,598,737 - 9,598,737Bonds 912,890 - 3,316,197 - 23,837,207 - 28,066,294
Held to MaturityTreasury bills - - - - 5,837,568 - 5,837,568Bonds 2,675,972 - - - 6,440,883 - 9,116,855
Other assets 25,934,436 3,381,399 564,600 1,036,130 88,305 3,512,644 34,517,514Total 735,424,208 798,424,360 770,030,633 31,158,325 874,512,481 3,512,644 3,213,062,653
Transaction related bonds and guarantees 139,549,299 85,144,234 - 465,103 - 225,158,637Guaranteed facilities 37,159,996 39,919,139 - 4,256,484 - 81,335,619
41,018,285 151,469,875 - 8,430,505 - 200,918,665Future, swap and forward contracts 44,362,157 64,076,506 284,158,615 - 232,112,414 - 624,709,692
Total 262,089,738 340,609,754 284,158,615 13,152,092 232,112,414 - 1,132,122,613
By Sector
BankDecember 2016In thousands of Naira Corporate Commercial Bank Retail Government Others Total
Cash and balances with banks - - 480,395,147 - - - 480,395,147Investment under management 10,913,760 - 1,070,385 - 2,887,102 - 14,871,247Non pledged trading assets
Treasury bills - - - - 34,381,635 - 34,381,635Bonds - 9,913 8,391 - 10,170,293 - 10,188,597
Derivative financial instruments 28,003,737 - 5,360,808 - 122,408,117 - 155,772,662Loans and advances to banks - - 104,006,574 - - - 104,006,574Loans and advances to customers
Auto Loan - - - 4,366,544 - - 4,366,544Credit Card 26,799 - - 3,895,578 - - 3,922,377Finance Lease 2,404,390 1,259,848 - 312,384 11,275 - 3,987,898Mortgage Loan - 18,242 - 4,978,710 - - 4,996,952Overdraft 19,595,999 104,350,992 - 6,318,069 20,603 - 130,285,663Personal Loan - - - 16,789,104 - - 16,789,104Term Loan 371,285,015 375,330,466 - 5,193,606 265,837,168 - 1,017,646,255Time Loan 176,512,323 235,178,172 - 669,550 207,509 - 412,567,554
Pledged assetsTreasury bills - - - - 188,239,520 - 188,239,520Bonds - - - - 126,707,982 - 126,707,982
Investment securitiesAvailable for sale
Treasury bills - - - - 40,960,665 - 40,960,665Bonds 377,207 - 5,814,936 - 15,507,737 - 21,699,880
Held to MaturityTreasury bills - - - - - - -Bonds 3,036,929 - 1,032,857 - 36,293,265 - 40,363,051
Other assets 17,580,637 1,895,503 1,426,691 3,706,154 4,430,246 4,225,841 33,265,072Total 629,736,796 718,043,136 599,115,791 46,229,698 848,063,115 4,225,841 2,845,414,376
Transaction related bonds and guarantees 136,163,848 - - - - - 136,163,847Guaranteed facilities 85,363,821 - 150,000 - - - 85,513,821
128,707,741 - - - 30,287,053 - 158,994,793-
Future, swap and forward contracts 314,341,917 - 152,493,026 - 433,601,415 - 900,436,358Total 664,577,326 - 152,643,026 - 463,888,468 - 1,281,108,819
Clean line facilities for letters of credit and othercommitments
Clean line facilities for letters of credit and othercommitments
Credit risk exposures relating to other credit commitmentsat gross amount are as follows:
Credit risk exposures relating to other credit commitmentsat gross amount are as follows:
149

Access Bank Plc
Consolidated and separate financial statementsFor the year ended 31 December 2017
5.1.5 (b)i By geography
Bank Nigeria Rest of Africa Europe Others TotalDecember 2017In thousands of Naira
Cash and balances with banks 543,056,552 627,395 76,516,219 36,944,081 657,144,247Investment under management 20,257,131 - - - 20,257,131Non pledged trading assets
Treasury bills 33,906,748 - - - 33,906,748Bonds 9,050,894 - - - 9,050,894
Derivative financial instruments 91,071,217 - 265,547 1,053,455 92,390,219Loans and advances to banks 1,295,927 - 100,133,074 - 101,429,001Loans and advances to customers
Auto Loan 3,243,530 - - - 3,243,530Credit Card 3,263,598 - - - 3,263,598Finance Lease 3,486,368 - - - 3,486,368Mortgage Loan 4,162,867 - - - 4,162,867Overdraft 142,060,909 - - - 142,060,909Personal Loan 14,613,195 - - - 14,613,195Term Loan 1,165,294,769 - - - 1,165,294,769Time Loan 435,157,504 - - - 435,157,504
Pledged assetsTreasury bills 252,061,738 - - - 252,061,738Bonds 188,441,589 - - - 188,441,589
Investment securitiesAvailable for sale
Treasury bills 9,598,736 - - - 9,598,736Bonds 28,066,294 - - - 28,066,294
Held to MaturityTreasury bills 5,837,568 - - - 5,837,568Bonds 7,051,660 2,065,195 - - 9,116,855
Other assets 33,126,539 1,273,772 - 117,203 34,517,514Total 2,994,105,333 3,966,362 176,914,840 38,114,740 3,213,101,274
Transaction related bonds and guarantees 225,158,636 - - - 225,158,636Guaranteed facilities 81,335,619 - - - 81,335,619
200,918,665 - - - 200,918,665Future, swap and forward contracts 335,204,211 44,259,738 3,822,694 241,423,049 624,709,693
Total 842,617,132 44,259,738 3,822,694 241,423,049 1,132,122,613
By geography
Bank Nigeria Rest of Africa Europe Others TotalDecember 2016In thousands of Naira
Cash and balances with banks 415,235,668 - 65,159,480 - 480,395,148Investment under management 14,871,247 - - - 14,871,247Non pledged trading assets
Treasury bills 34,381,635 - - - 34,381,635Bonds 10,170,293 - 18,304 - 10,188,597
Derivative financial instruments 149,856,253 1,117,959 97,119 4,701,331 155,772,662Loans and advances to banks 5,156,475 - 98,850,099 - 104,006,574Loans and advances to customers
Auto Loan 4,366,544 - - - 4,366,544Credit Card 3,922,377 - - - 3,922,377Finance Lease 3,987,898 - - - 3,987,898Mortgage Loan 4,996,952 - - - 4,996,952Overdraft 130,285,663 - - - 130,285,663Personal Loan 16,789,104 - - - 16,789,104Term Loan 1,017,646,255 - - - 1,017,646,255Time Loan 412,567,554 - - - 412,567,554
Pledged assetsTreasury bills 188,239,520 - - - 188,239,520Bonds 126,707,982 - - - 126,707,982
Investment securitiesAvailable for sale
Treasury bills 40,960,665 - - - 40,960,665Bonds 18,939,219 - 2,760,661 - 21,699,880
Held to MaturityTreasury bills - - - - -Bonds 37,917,493 - 2,445,558 - 40,363,051
Other assets 32,437,346 808,611 19,115 - 33,265,072Total 2,669,436,141 1,926,570 169,350,336 4,701,331 2,845,414,378
Transaction related bonds and guarantees 136,163,848 - - - 136,163,848Guaranteed facilities 85,513,821 - - - 85,513,821Clean line facilities for letters of credit and other commitments 158,994,793 - - - 158,994,793Future, swap and forward contracts 744,259,779 32,748,881 97,065,142 26,362,557 900,436,358
Total 1,124,932,240 32,748,881 97,065,142 26,362,557 1,281,108,820
Clean line facilities for letters of credit and othercommitments
Credit risk exposures relating to othr credit commitments atgross amount are as follows:
Credit risk exposures relating to othr credit commitments atgross amount are as follows:
150

Access Bank Plc
Consolidated and separate financial statementsFor the year ended 31 December 2017
5.2.1 A summary of the Group’s interest rate gap position on financial instruments is as follows:Group
In thousands of Naira Less than 3 4 - 6 months 7 - 12 months 1 - 5 years More than Non-Interest Total
31 December 2017 months 5 years bearing
Non-derivative assets
Cash and balances with banks 261,805,783 - - - - 692,138,393 953,944,176
Investment under management 20,257,131 - - - - - 20,257,131
Non pledged trading assets
Treasury bills 5,704,968 11,234,566 20,804,285 - - - 37,743,819
Bonds 8,986 - - 611,845 8,430,064 - 9,050,894
Loans and advances to banks 26,504,665 17,981,691 16,520,473 7,107,247 - - 68,114,076
Loans and advances to customers
Auto Loan 116,269 95,730 196,956 3,041,105 - - 3,450,060
Credit Card 3,123,857 80,480 119,708 86,582 - - 3,410,627
Finance Lease 362,195 349,077 442,929 3,487,899 - - 4,642,100
Mortgage Loan 8,286,685 10,260,205 11,048,537 10,966,797 3,059,705 - 43,621,930
Overdraft 126,404,087 21,174,739 36,681,933 - - - 184,260,759
Personal Loan 1,725,515 957,406 2,966,665 11,424,561 63,800 - 17,137,946
Term Loan 37,116,977 46,779,903 68,620,065 504,054,980 583,495,950 - 1,240,067,875
Time Loan 232,362,639 128,968,472 115,410,787 22,654,432 - - 499,396,330
Pledged assets -
Treasury bills 118,193,104 67,658,924 72,820,788 - - - 258,672,815
Bonds - 20,724,258 - 31,622,727 136,094,604 - 188,441,589
Investment securities
- Available for sale
Treasury bills 3,967,666 3,892,918 22,116,867 - - - 29,977,451
Bonds - - 28,634,329 8,099,475 17,345,564 - 54,079,368
- Held to Maturity
Treasury bills 1,277,269 56,109,691 29,993,308 823,097 - - 88,203,365
Bonds 1,040,216 1,341,861 24,307,671 9,137,827 763,007 - 36,590,582
Other assets - - - - - 46,799,196 46,799,196
848,258,013 387,609,918 450,685,303 613,118,574 749,252,693 738,937,589 3,787,862,089
Non-derivative liabilities
Deposits from financial institutions 176,015,647 216,644,358 57,536,965 - - - 450,196,970
Deposits from customers 1,926,536,624 134,890,825 53,550,146 60,911,025 6,156,835 62,833,620 2,244,879,075
Other liabilties - - - 618,785 - 235,167,694 235,786,479
Debt securities issued 17,193,034 24,501,603 29,028,152 231,383,918 - - 302,106,706
Interest bearing borrowings - 2,625,903 76,614,381 232,376,902 - - 311,617,187
2,119,745,304 378,662,690 216,729,645 525,290,630 6,156,835 298,001,314 3,544,586,417
Total interest re-pricing gap (1,271,487,291) 8,947,229 233,955,658 87,827,944 743,095,858 440,936,275 243,275,672
Group
In thousands of Naira Less than 3 4 - 6 months 7 - 12 months 1 - 5 years More than Non-Interest Total
31 December 2016 months 5 years bearing
Non-derivative assets
Cash and balances with banks 118,063,803 1,762,209 - - - 594,063,093 713,889,105
Investment under management 14,871,247 - - - - - 14,871,247
Non pledged trading assets
Treasury bills 7,104,931 8,132,475 19,144,229 - - - 34,381,635
Bonds - - 1,993 10,245,951 - - 10,247,944
Loans and advances to banks 35,976,130 7,477,605 1,523,322 224,438 1,508 - 45,203,002
Loans and advances to customers
Auto Loan 48,036 140,524 285,619 3,722,834 253,735 - 4,450,748
Credit Card 3,857,163 187 16,538 105,348 - - 3,979,235
Finance Lease 196,694 9,501 166,902 3,614,801 - - 3,987,898
Mortgage Loan 24,310,113 759 39,255 1,195,811 4,674,619 - 30,220,557
Overdraft 104,827,946 8,168,255 61,356,628 936,877 - - 175,289,705
Personal Loan 273,440 162,550 1,426,014 15,957,194 252,875 - 18,072,071
Term Loan 30,863,690 14,132,484 16,004,301 454,903,302 572,815,472 - 1,088,719,250
Time Loan 257,669,712 58,309,804 99,697,734 69,062,457 - - 484,739,708
Pledged assets
Treasury bills 39,049,250 67,819,721 81,370,550 - - - 188,239,521
Bonds - 3,541,654 8,215,582 22,140,686 92,810,059 - 126,707,982
Investment securities
- Available for sale
Treasury bills 24,469,054 10,305,106 34,572,441 - - - 69,346,601
Bonds - 5,537,388 - 8,923,273 18,431,188 - 32,891,849
- Held to Maturity
Treasury bills 8,342,441 8,638,753 10,368,919 - - - 27,350,114
Bonds - 88,654 2,302,702 7,555,286 31,154,372 - 41,101,014
Other assets - - - - - 41,796,068 41,796,068
669,923,650 194,227,630 336,492,727 598,588,257 720,393,828 635,859,162 3,155,485,254
Non-derivative liabilities
Deposits from financial institutions 151,001,693 69,658 16,285,233 - - - 167,356,583
Deposits from customers 1,910,193,499 41,569,864 52,508,124 8,390,090 - 76,535,709 2,089,197,286
Other liabilties - - - - - 111,117,648 111,117,648
Debt securities issued 7,624,982 3,802,546 92,736,609 212,380,366 - - 316,544,502
Interest bearing borrowings - 2,057,477 60,029,752 219,372,282 - 18,084,196 299,543,707
2,068,820,173 47,499,545 221,559,718 440,142,738 - 205,737,553 2,983,759,725
Total interest re-pricing gap (1,398,896,524) 146,728,086 114,933,009 158,445,519 720,393,828 430,121,608 171,725,529
Re-pricing year
Re-pricing year
151
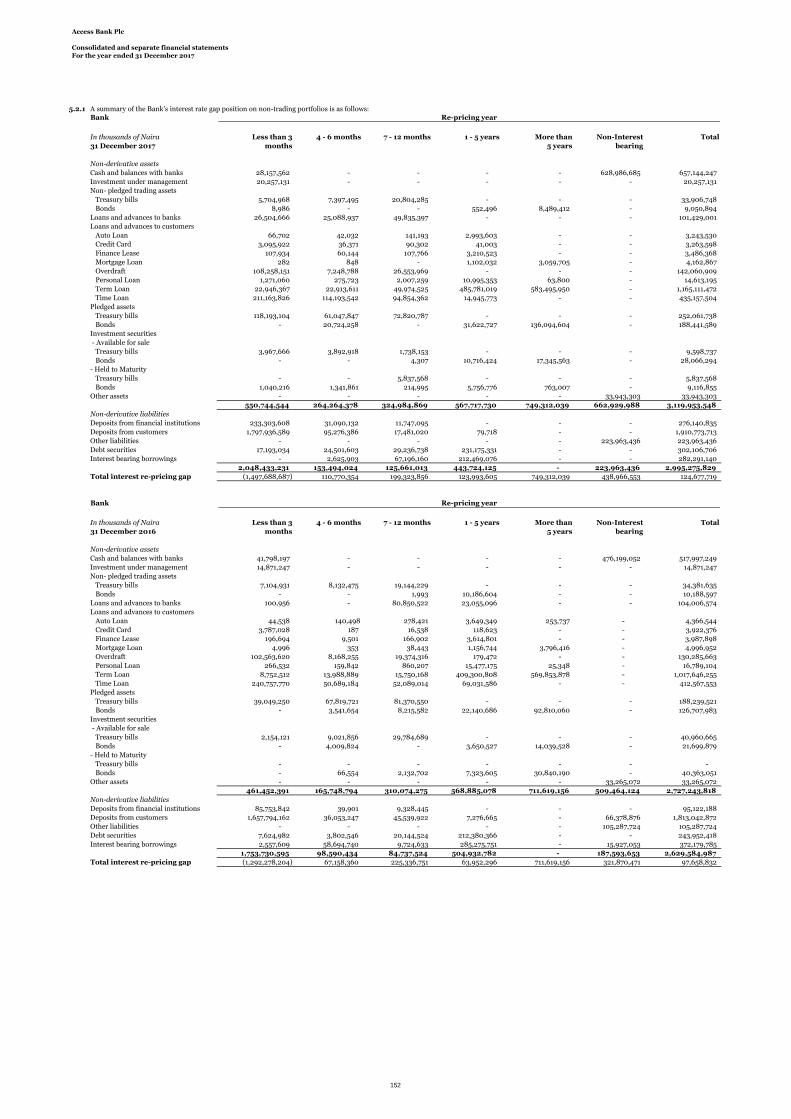
Access Bank Plc
Consolidated and separate financial statementsFor the year ended 31 December 2017
5.2.1 A summary of the Bank’s interest rate gap position on non-trading portfolios is as follows:Bank
In thousands of Naira Less than 3 4 - 6 months 7 - 12 months 1 - 5 years More than Non-Interest Total
31 December 2017 months 5 years bearing
Non-derivative assets
Cash and balances with banks 28,157,562 - - - - 628,986,685 657,144,247
Investment under management 20,257,131 - - - - - 20,257,131
Non- pledged trading assets
Treasury bills 5,704,968 7,397,495 20,804,285 - - - 33,906,748
Bonds 8,986 - - 552,496 8,489,412 - 9,050,894
Loans and advances to banks 26,504,666 25,088,937 49,835,397 - - - 101,429,001
Loans and advances to customers
Auto Loan 66,702 42,032 141,193 2,993,603 - - 3,243,530
Credit Card 3,095,922 36,371 90,302 41,003 - - 3,263,598
Finance Lease 107,934 60,144 107,766 3,210,523 - - 3,486,368
Mortgage Loan 282 848 - 1,102,032 3,059,705 - 4,162,867
Overdraft 108,258,151 7,248,788 26,553,969 - - - 142,060,909
Personal Loan 1,271,060 275,723 2,007,259 10,995,353 63,800 - 14,613,195
Term Loan 22,946,367 22,913,611 49,974,525 485,781,019 583,495,950 - 1,165,111,472
Time Loan 211,163,826 114,193,542 94,854,362 14,945,773 - - 435,157,504
Pledged assets
Treasury bills 118,193,104 61,047,847 72,820,787 - - - 252,061,738
Bonds - 20,724,258 - 31,622,727 136,094,604 - 188,441,589
Investment securities
- Available for sale
Treasury bills 3,967,666 3,892,918 1,738,153 - - - 9,598,737
Bonds - - 4,307 10,716,424 17,345,563 - 28,066,294
- Held to Maturity
Treasury bills - - 5,837,568 - - - 5,837,568
Bonds 1,040,216 1,341,861 214,995 5,756,776 763,007 - 9,116,855
Other assets - - - - - 33,943,303 33,943,303
550,744,544 264,264,378 324,984,869 567,717,730 749,312,039 662,929,988 3,119,953,548
Non-derivative liabilities
Deposits from financial institutions 233,303,608 31,090,132 11,747,095 - - - 276,140,835
Deposits from customers 1,797,936,589 95,276,386 17,481,020 79,718 - - 1,910,773,713
Other liabilities - - - - - 223,963,436 223,963,436
Debt securities 17,193,034 24,501,603 29,236,738 231,175,331 - - 302,106,706
Interest bearing borrowings - 2,625,903 67,196,160 212,469,076 - - 282,291,140
2,048,433,231 153,494,024 125,661,013 443,724,125 - 223,963,436 2,995,275,829
Total interest re-pricing gap (1,497,688,687) 110,770,354 199,323,856 123,993,605 749,312,039 438,966,553 124,677,719
Bank
In thousands of Naira Less than 3 4 - 6 months 7 - 12 months 1 - 5 years More than Non-Interest Total
31 December 2016 months 5 years bearing
Non-derivative assets
Cash and balances with banks 41,798,197 - - - - 476,199,052 517,997,249
Investment under management 14,871,247 - - - - - 14,871,247
Non- pledged trading assets
Treasury bills 7,104,931 8,132,475 19,144,229 - - - 34,381,635
Bonds - - 1,993 10,186,604 - - 10,188,597
Loans and advances to banks 100,956 - 80,850,522 23,055,096 - - 104,006,574
Loans and advances to customers
Auto Loan 44,538 140,498 278,421 3,649,349 253,737 - 4,366,544
Credit Card 3,787,028 187 16,538 118,623 - - 3,922,376
Finance Lease 196,694 9,501 166,902 3,614,801 - - 3,987,898
Mortgage Loan 4,996 353 38,443 1,156,744 3,796,416 - 4,996,952
Overdraft 102,563,620 8,168,255 19,374,316 179,472 - - 130,285,663
Personal Loan 266,532 159,842 860,207 15,477,175 25,348 - 16,789,104
Term Loan 8,752,512 13,988,889 15,750,168 409,300,808 569,853,878 - 1,017,646,255
Time Loan 240,757,770 50,689,184 52,089,014 69,031,586 - - 412,567,553
Pledged assets
Treasury bills 39,049,250 67,819,721 81,370,550 - - - 188,239,521
Bonds - 3,541,654 8,215,582 22,140,686 92,810,060 - 126,707,983
Investment securities
- Available for sale
Treasury bills 2,154,121 9,021,856 29,784,689 - - - 40,960,665
Bonds - 4,009,824 - 3,650,527 14,039,528 - 21,699,879
- Held to Maturity
Treasury bills - - - - - - -
Bonds - 66,554 2,132,702 7,323,605 30,840,190 - 40,363,051
Other assets - - - - - 33,265,072 33,265,072
461,452,391 165,748,794 310,074,275 568,885,078 711,619,156 509,464,124 2,727,243,818
Non-derivative liabilities
Deposits from financial institutions 85,753,842 39,901 9,328,445 - - - 95,122,188
Deposits from customers 1,657,794,162 36,053,247 45,539,922 7,276,665 - 66,378,876 1,813,042,872
Other liabilities - - - - - 105,287,724 105,287,724
Debt securities 7,624,982 3,802,546 20,144,524 212,380,366 - - 243,952,418
Interest bearing borrowings 2,557,609 58,694,740 9,724,633 285,275,751 - 15,927,053 372,179,785
1,753,730,595 98,590,434 84,737,524 504,932,782 - 187,593,653 2,629,584,987
Total interest re-pricing gap (1,292,278,204) 67,158,360 225,336,751 63,952,296 711,619,156 321,870,471 97,658,832
Re-pricing year
Re-pricing year
152

Access Bank Plc
Consolidated and separate financial statements
For the year ended 31 December 2017
Market risk management
5.2.2 Value at risk (VAR)
Group VAR by risk type
In thousands of Naira Average High Low Actual
Foreign exchange risk 678,320 2,352,213 17,806 652,213
Interest rate risk 434,481 1,379,604 190,525 309,754
Total 1,112,801 3,731,817 208,331 961,967
Group
Average High Low Actual
Foreign exchange risk 20,455 201,816 154 12,050
Interest rate risk 564,918 1,492,932 84,051 393,917
Total 585,373 1,694,748 84,205 405,967
Bank VAR by risk type
In thousands of Naira Average High Low Actual
Foreign exchange risk 620,677 2,274,938 17,391 631,477
Interest rate risk 334,481 1,379,604 190,525 309,754
Total 955,158 3,654,542 207,916 941,231
Bank
Average High Low Actual
Foreign exchange risk 19,275 198,717 31 11,309
Interest rate risk 564,918 1,492,932 84,051 393,917
Total 584,193 1,691,649 84,082 405,226
The Group trades on bonds, treasury bills and foreign currency. Market risk in trading portfolios is monitored and controlled using tools such as position limits,
value at risk and present value of an assumed basis points change in yields or exchange rates coupled with concentration limits. The major measurement
technique used to measure and control market risk is outlined below.
The Group applies a ‘value at risk’ (VaR) methodology to its trading portfolios at a group level to estimate the market risk of positions held and the maximum
losses expected, based upon a number of assumptions for various changes in market conditions. The Board sets limits on the value of risk that may be accepted
for the Group, which are monitored on a daily basis by Market Risk Unit. Interest rate risk in the non-trading book is measured through the use of interest rate
repricing gap analysis (Note 5.2.1).
VaR is a statistically based estimate of the potential loss on the current portfolio from adverse market movements. It expresses the ‘maximum’ amount the
Group might lose, but only to a certain level of confidence (99%). There is therefore a specified statistical probability (1%) that actual loss could be greater than
the VaR estimate. Value-at-risk estimates the potential maximum decline in the value of a position or portfolio, under normal market conditions, over a one-
day holding year. It also assumes that market moves occurring over this holding year will follow a similar pattern. The Group applies these historical changes in
rates, prices, etc. directly to its current positions - a method known as historical simulation. Actual outcomes are monitored regularly to test the validity of the
assumptions and parameters/ factors used in the VaR calculation.
The Access Bank value-at-risk method incorporates the factor sensitivities of the trading portfolio, the volatilities and correlations of the market risk factors.
The group uses the variance covariance method which derives likely future changes in market value from historical market volatility. Value at risks is estimated
on the basis of exposures outstanding at the close of business and therefore might not factor in the intra-day exposures. However, the bank does not only base
its risk estimates on Value at Risk, it uses Stress tests to provide an indication of the potential size of losses that could arise in extreme conditions by applying a
what-if analysis to further complement it. The results of the stress tests are reviewed by senior management in each business unit and by the Board of
Directors.
The trading book is made up of foreign currency, Bonds and Treasury bills instruments. The value at Risk of the trading book is as stated:
December 2017
December 2016
December 2017
December 2016
153

Access Bank Plc
Consolidated and separate financial statements
For the year ended 31 December 2017
The table below sets out information on the exposure to fixed and variable interest instruments.
Exposure to fixed and variable interest rate risk
Group
In thousands of Naira
31 December 2017 Fixed Floating
Non-interest
bearing Total
ASSETS N'000 N'000 N'000 N'000
Cash and balances with banks 261,805,783 - 692,138,393 953,944,176
Non pledged trading assets 46,794,713 - 59,348 46,854,061
Derivative financial instruments - - 93,419,293 93,419,293
Loans and advances to banks 68,114,076 - - 68,114,076
Loans and advances to customers 27,256,401 1,968,731,226 - 1,995,987,627
Pledged assets 447,114,404 - - 447,114,404
Investment securities:
– Available-for-sale 84,056,819 - 69,316,991 153,373,810
– Held-to-maturity 124,793,947 - - 124,793,947
TOTAL 1,059,936,143 1,968,731,226 854,934,025 3,883,601,394
LIABILITIES
Deposits from financial institutions 450,196,970 - - 450,196,970
Deposits from customers 1,172,733,890 1,072,145,186 - 2,244,879,076
Derivative financial instruments - - 5,332,177 5,332,177
Debt securities issued 302,106,706 - - 302,106,706
Interest-bearing borrowings 267,572,158 44,045,029 - 311,617,187
TOTAL 2,192,609,724 1,116,190,215 5,332,177 3,314,132,116
31 December 2016 Fixed Floating
Non-interest
bearing Total
ASSETS N'000 N'000 N'000 N'000
Cash and balances with banks 119,826,012 - 594,063,093 713,889,105
Non pledged trading assets 44,570,231 - 59,348 44,629,579
Derivative financial instruments - - 156,042,984 156,042,984
Loans and advances to banks 45,203,002 - - 45,203,002
Loans and advances to customers 4,891,994 1,804,567,178 - 1,809,459,172
Pledged assets 314,947,502 - - 314,947,502
Investment securities:
– Available-for-sale 102,238,450 - 58,424,194 160,662,644
– Held-to-maturity 68,451,128 - - 68,451,128
TOTAL 700,128,319 1,804,567,178 808,589,619 3,313,285,117
LIABILITIES
Deposits from financial institutions 167,356,583 - - 167,356,583
Deposits from customers 925,976,555 1,163,220,731 - 2,089,197,286
Derivative financial instruments - - 30,444,501 30,444,501
Debt securities issued 195,907,812 120,636,690 - 316,544,502
Interest-bearing borrowings 254,868,576 44,675,131 - 299,543,707
TOTAL 1,544,109,526 1,328,532,552 30,444,501 2,903,086,578
Bank
31 December 2017 Fixed Floating
Non-interest
bearing Total
ASSETS N'000 N'000 N'000 N'000
Cash and balances with banks 28,157,562 - 628,986,685 657,144,247
Non pledged trading assets 42,957,641 - 59,348 43,016,989
Derivative financial instruments - - 92,390,219 92,390,219
Loans and advances to banks 101,429,001 - - 101,429,001
Loans and advances to customers 29,616,824 1,741,665,914 - 1,771,282,739
Pledged assets 440,503,327 - - 440,503,327
Investment securities:
– Available-for-sale 23,014,914 - 68,917,849 91,932,764
– Held-to-maturity 14,954,423 - - 14,954,423
TOTAL 680,633,692 1,741,665,914 790,354,101 3,212,653,709
154

Access Bank Plc
Consolidated and separate financial statements
For the year ended 31 December 2017
LIABILITIES
Deposits from financial institutions 276,140,835 - - 276,140,835
Deposits from customers 1,035,810,196 874,963,517 - 1,910,773,713
Derivative financial instruments - - 5,306,450 5,306,450
Debt securities issued 302,106,706 - - 302,106,706
Interest-bearing borrowings 246,837,491 35,453,649 - 282,291,140
TOTAL 1,860,895,228 910,417,166 5,306,450 2,776,618,844
31 December 2016 Fixed Floating
Non-interest
bearing Total
ASSETS N'000 N'000 N'000 N'000
Cash and balances with banks 41,798,197 - 476,199,052 517,997,249
Non pledged trading assets 44,570,231 - 59,348 44,629,578
Derivative financial instruments - - 155,772,662 155,772,662
Loans and advances to banks 104,006,574 - - 104,006,574
Loans and advances to customers 4,374,708 1,590,187,637 - 1,594,562,345
Pledged assets 314,947,502 - - 314,947,502
Investment securities:
– Available-for-sale 62,660,545 - 58,177,045 120,837,589
– Held-to-maturity 40,363,051 - - 40,363,051
TOTAL 612,720,808 1,590,187,637 690,208,107 2,893,116,551
LIABILITIES
Deposits from financial institutions 95,122,188 - - 95,122,188
Deposits from customers 799,495,575 1,013,547,297 - 1,813,042,872
Derivative financial instruments - - 30,275,181 30,275,181
Debt securities issued 123,315,728 120,636,690 - 243,952,418
Interest-bearing borrowings 327,504,654 44,675,131 - 372,179,785
TOTAL 1,345,438,145 1,178,859,118 30,275,181 2,554,572,444
Interest rate risk
Cash flow and fair value interest rate risk
(i) Retained earnings arising from increase or decrease in net interest income and the fair value changes reported in profit or loss.
(ii) Fair value reserves arising from increases or decreases in fair value of available-for-sale financial instruments reported directly in other comprehensive
income.
The group’s interest rate risk arises from risk assets, long-term borrowings, deposits from banks and customers. Borrowings issued at variable rates expose the
group to cash flow interest rate risk. Other financial liabilities issued at fixed rates expose the group to fair value interest rate risk.
The management of interest rate risk against interest rate gap limits is supplemented with monitoring the sensitivity of the Group’s financial assets and
liabilities to various scenarios.
Interest rate movement have both cash flow and fair value effect depending on whether interest rate is fixed or floating. The impact resulting from adverse or
favourable movement flows from either retained earnings or OCI and ultimately ends in equity in the following manner:
Cash flow interest rate risk is the risk that the future cash flows of a financial instrument will fluctuate because of changes in market interest rates. Fair value
interest rate risk is the risk that the value of a financial instrument will fluctuate because of changes in market interest rates. The Group takes on exposure to
the effects of fluctuations in the prevailing levels of market interest rates on both its fair value and cash flow risks. Interest margins may increase as a result of
such changes but may reduce losses in the event that unexpected movements arise. The Board sets limits on the level of mismatch of interest rate repricing
(note 5.2.1) and value at risk (note 5.2.2) that may be undertaken, which is monitored daily by Group Treasury.
Derivative financial instruments include elements of interest rate differential between the applicable underlying currencies. Further details on the fair value of
derivatives have been discussed in Note3.9(J) of the financial statement.
155

Access Bank Plc
Consolidated and separate financial statements
For the year ended 31 December 2017
Group
Impact on net interest income of +/-1oo basis points changes in rates over a one year year (N'000)
Cashflow interest rate risk
Time Band
100 basis points
decline in rates
100 basis points
increase in rates
Less than 3 months (266,110) 266,110
6 months 105,710 (105,710)
12 months 2,338,170 (2,338,170)
2,177,770 (2,177,770)
Impact on net interest income of +/-1oo basis points changes in rates over a one year year (N'000)
Cashflow interest rate risk
Time Band
100 basis points
decline in rates
100 basis points
increase in rates
Less than 3 months (71,335) 71,335
6 months (1,868,207) 1,868,207
12 months (1,967,752) 1,967,752
(3,907,294) 3,907,294
Bank
Impact on net interest income of +/-1oo basis points changes in rates over a one year year (N'000)
Cashflow interest rate risk
Time Band
100 basis points
decline in rates
100 basis points
increase in rates
Less than 3 months (266,110) 266,110
6 months 105,710 (105,710)
12 months 2,338,170 (2,338,170)
2,177,770 (2,177,770)
Impact on net interest income of +/-1oo basis points changes in rates over a one year year (N'000)
Cashflow interest rate risk
Time Band
100 basis points
decline in rates
100 basis points
increase in rates
Less than 3 months (67,938) 67,938
6 months (1,612,292) 1,612,292
12 months (1,805,538) 1,805,538
(3,485,768) 3,485,768
Interest sensitivity analysis - 31 December 2017
Interest sensitivity analysis - 31 December 2016
Interest sensitivity analysis - 31 December 2017
Interest sensitivity analysis - 31 December 2016
The table above sets out the impact on net interest income of a 100 basis points parallel fall or rise in all yields. A parallel increase in yields by 100 basis points
would lead to an increase in net interest income while a parallel fall in yields by 100 basis points would lead to a decline in net interest income. The interest rate
sensitivities are based on simplified scenarios and assumptions, including that all positions will be retained and rolled over upon maturity. The figures
represent the effect of movements in net interest income based on the 100 basis point shift in interest rate and subject to the current interest rate exposures.
However, the effect has not taken into account the possible risk management measures undertaken by the Bank to mitigate interest rate risk. In practice, the
Assets and Liability Committee, ALCO seeks proactively to change the interest rate risk profile to minimize losses and optimise net revenues. The projections
also assume that interest rates on various maturities will move within similar ranges, and therefore do not reflect any potential effect on net interest income in
the event that some interest rates may change and others remain unchanged.
156

Access Bank Plc
Consolidated and separate financial statements
For the year ended 31 December 2017
Price sensitivity analysis on bonds and treasury bills
Group
Carrying Value
Impact of 50 basis
points increase in
yields
Impact of 100 basis
points increase in
yields
Impact on Statement of Comprehensive
Investment under management T-Bills
Held for trading Bonds 9,050,894 (2,123) (3,313)
Held for trading T-bills 37,743,819 (8,374) (16,748)
Pledged assets: Bonds 188,441,589 (118,783) (185,378)
Pledged assets: T-bills 258,672,815 (124,203) (248,405)
493,909,117 (253,483) (453,843)
Impact on Other Comprehensive Income
Available for sale investments 84,056,819 (1,359,839) (2,260,317)
TOTAL 577,965,935 (1,613,322) (2,714,159)
Carrying Value
Impact of 50 basis
points increase in
yields
Impact of 100 basis
points increase in
yields
Impact on Statement of Comprehensive
Investment under management T-Bills
Held for trading Bonds 10,188,597 (165,377) (327,492)
Held for trading T-bills 34,381,635 (103,935) (207,868)
Pledged assets: T-bills 104,560,978 (318,783) (637,563)
149,131,210 (588,095) (1,172,924)
Impact on Other Comprehensive Income
Available for sale investments 96,046,306 (859,399) (1,742,610)
TOTAL 245,177,516 (1,447,494) (2,915,534)
Carrying Value
Impact of 50 basis
points increase in
yields
Impact of 100 basis
points increase in
yields
Impact on Statement of Comprehensive Income
Held for trading Bonds 9,050,894 (2,106) (3,287)
Held for trading T.bills 33,906,748 (7,473) (14,946)
Pledged assets: Bonds 188,441,589 (118,800) (185,404)
Pledged assets: T-bills 252,061,738 (125,104) (250,207)
483,460,969 (253,483) (453,844)
Impact on Other Comprehensive Income
Available for sale investments 37,665,031 (1,359,839) (2,260,317)
TOTAL 521,126,000 (1,613,322) (2,714,160)
Carrying Value
Impact of 50 basis
points increase in
yields
Impact of 100 basis
points increase in
yields
Impact on Statement of Comprehensive Income
Held for trading Bonds 10,170,293 (165,377) (327,492)
Held for trading T.bills 34,381,635 (103,935) (207,868)
Pledged assets: T-bills 104,560,978 (318,783) (637,563)
149,112,906 (588,095) (1,172,924)
Impact on Other Comprehensive Income
Available for sale investments 111,555,830 (859,399) (1,742,610)
TOTAL 260,668,736 (1,447,494) (2,915,534)
31 December 2017
31 December 2016
The table below shows the impact of likely movement in yields on the value of bonds and treasury bills. This relates to the positions held for trade and available
for sale. Since an increase in yields would lead to decline in market values of bonds and treasury bills, the analysis was carried out to show the likely impact of
50 and 100 basis points increase in market yields. The impact of held for trading investments is on the income statement while the impact of available for sale
instruments is on the statement of other comprehensive income.
31 December 2017
31 December 2016
Bank
157

Access Bank Plc
Consolidated and separate financial statements
For the year ended 31 December 2017
Foreign currency sensitivity analysis
Group
Impact on statement
of comprehensive
income
Impact on statement
of comprehensive
income
In thousands of naira 31 December 2017 31 December 2016
Naira weakens by 10% (15,736,259) -
Naira weakens by 15% - (12,178,312)
Naira weakens by 30% - (24,356,625)
Bank
Impact on statement
of comprehensive
income
Impact on statement
of comprehensive
income
In thousands of naira 31 December 2017 31 December 2016
Naira weakens by 10% (13,400,561) -
Naira weakens by 15% - (13,038,569)
Naira weakens by 30% - (26,077,138)
Sensitivity analysis of derivative valuation
Impact on statement
of comprehensive
income
Impact on statement
of comprehensive
income
In thousands of naira 31-Dec-17 31-Dec-16
Naira weakens by 10% 16,751,618 16,751,618
Price sensitivity analysis on equity
For the equities, a sensitivity of the key valuation inputs is contained in note 4 of this financial statements.
The Group's principal foreign currency exposure is to US Dollars, as it constitutes a significant portion of the Group's foreign currency exposure as at 31
December 2017. The table below illustrates the hypothetical sensitivity of the Group and Bank's reported profit to a 10% increase in the US Dollar/Naira
exchange rates at the year end, assuming all other variables remain unchanged. The sensitivity rate of 10% increase represents the directors' assessment of a
reasonable possible change based on historic volatility.
The NGN/USD exchange rate applied in the conversion of balances as at year end is N331/USD1 (2016: N305/USD1). The strengthening or weakening of
Naira may not produce symmetrical results depending on the proportion and nature of balance sheet and the impact of derivatives.
Group carries out a sensitivity analysis to determine the effects that market variables may have on the fair value of the Group’s derivative financial instruments
and results of operations. Below is a sensitivity analysis of the derivatives to changes in spot rates. In doing this, all other variables have been held constant
while varying the spot rate at 10% and 20%.
The table below contains the summary of the impact of Naira depreciation against US Dollars on statement of comprehensive income.
158

Access Bank Plc
Consolidated and separate financial statementsFor the year ended 31 December 2017
5.2.3 The table below summarises the Group’s financial instruments at carrying amount, categorised by currency:
Financial instruments by currency
Group
In thousands of Naira
31 December 2017 Total Naira US GBP Euro Others
Cash and balances with banks 953,944,176 536,637,684 163,776,193 143,200,181 9,623,913 100,706,205
Investment under management 20,257,131 20,257,131 - - - -
Non-pledged trading assets
Treasury bills 37,743,819 33,906,748 - - - 3,837,071
Bonds 9,050,894 9,012,553 38,342 - - -
Equity 59,348 59,348 - - - -
Derivative financial instruments 93,419,293 92,390,219 - 871,060 4,656 153,358
Loans and advances to banks 68,114,076 1,295,927 66,818,149 - - -
Loans and advances to customers
Auto Loan 3,450,060 3,243,530 - - - 206,530
Credit Card 3,410,627 619,453 2,717,400 260 - 73,514
Finance Lease 4,642,100 3,486,368 - - - 1,155,733
Mortgage Loan 43,621,930 4,127,123 35,745 - - 39,459,062
Overdraft 184,260,759 125,726,417 16,334,492 - - 42,199,850
Personal Loan 17,137,946 13,684,110 929,085 - - 2,524,752
Term Loan 1,240,067,875 821,782,950 383,765,648 - - 34,519,277
Time Loan 499,396,330 160,962,875 326,038,284 52,976 3,972,146 8,370,048
Pledged assets
Treasury bills 258,672,816 252,061,738 - - - 6,611,078
Bonds 188,441,589 188,441,589 - - - -
Investment securities
- Available for sale
Treasury bills 29,977,451 9,598,737 20,378,714 - - -
Bonds 54,079,368 27,714,194 25,827,939 - - 537,235
Equity 69,581,098 69,181,956 - - - 399,142
- Held to Maturity
Treasury bills 88,203,365 5,837,568 - - - 82,365,797
Bonds 36,590,582 7,051,661 2,888,292 - - 26,650,629
Other assets 46,799,196 29,968,924 12,286,475 2,094,409 68,109 2,381,279
3,950,921,829 2,417,048,801 1,021,834,757 146,218,886 13,668,824 352,150,560
Deposits from financial institutions 450,196,970 - 395,997,362 10,254,479 12,759,626 31,185,503
Deposits from customers 2,244,879,075 1,567,707,471 357,139,781 154,965,544 14,087,735 150,978,544
Derivative financial instruments 5,332,177 4,455,736 - 871,060 4,656 725
235,786,478 106,714,552 117,132,975 2,725,726 3,448,905 5,764,320
Debt securities issued 302,106,706 70,984,362 231,122,344 - - -
311,617,187 224,994,913 85,925,654 - - 696,620
3,549,918,593 1,974,857,034 1,187,318,116 168,816,809 30,300,922 188,625,713
Off balance sheet exposuress
Transaction related bonds and guarantees 370,892,995 100,763,408 141,105,173 64,793,164 55,272,843 8,958,406
Guaranteed facilities 171,002,109 65,262,657 59,326,671 39,851,773 187,390 6,373,617
293,267,039 21,774 205,359,311 42,762,220 17,491,992 27,631,742
Future, swap and forward contracts 662,935,746 - 653,645,538 9,290,208 - -
1,498,097,889 166,047,839 1,059,436,694 156,697,366 72,952,226 42,963,765
Other liabilities
Interest bearing borrowings
Clean line facilities for letters of credit andother commitments
*Included in Others are balances the group has in other currencies which includes South Africa Rand,Japanese Yen, Ghanian Cedis, Dirham, Australian dollars, Canadian dollars, Swiss franc,Chinese Yuan etc.
159
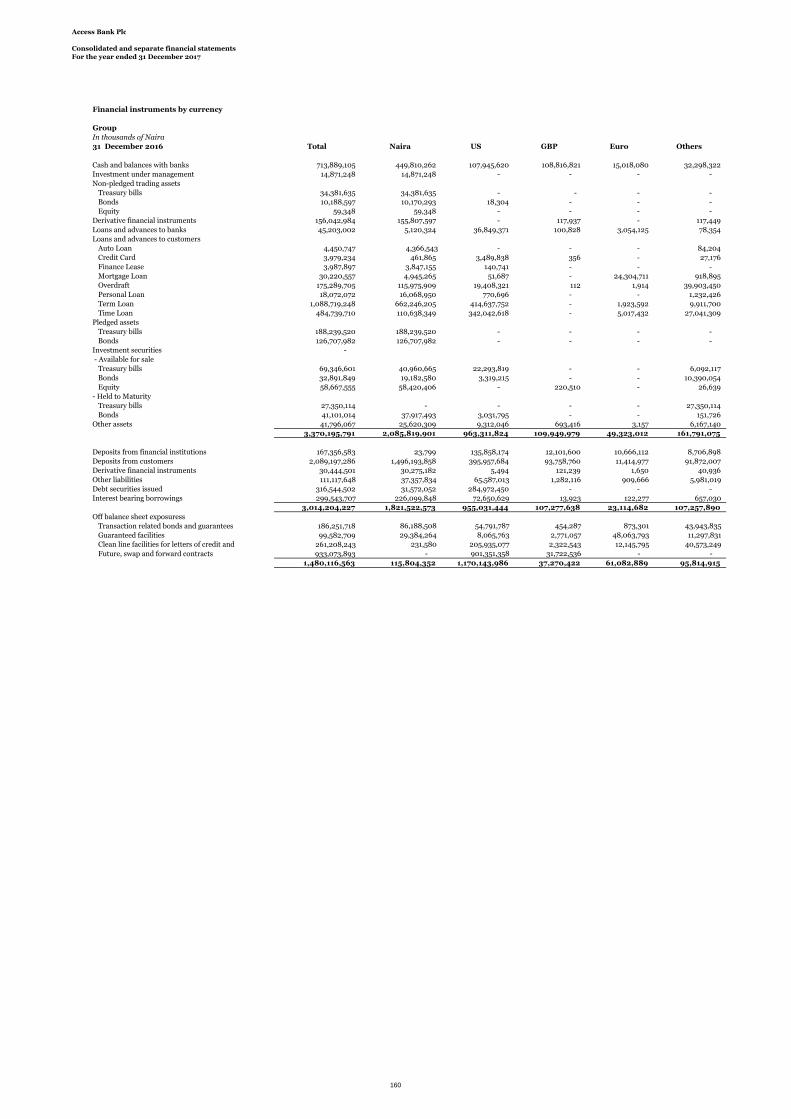
Access Bank Plc
Consolidated and separate financial statementsFor the year ended 31 December 2017
Financial instruments by currency
Group
In thousands of Naira
31 December 2016 Total Naira US GBP Euro Others
Cash and balances with banks 713,889,105 449,810,262 107,945,620 108,816,821 15,018,080 32,298,322
Investment under management 14,871,248 14,871,248 - - - -
Non-pledged trading assets
Treasury bills 34,381,635 34,381,635 - - - -
Bonds 10,188,597 10,170,293 18,304 - - -
Equity 59,348 59,348 - - - -
Derivative financial instruments 156,042,984 155,807,597 - 117,937 - 117,449
Loans and advances to banks 45,203,002 5,120,324 36,849,371 100,828 3,054,125 78,354
Loans and advances to customers
Auto Loan 4,450,747 4,366,543 - - - 84,204
Credit Card 3,979,234 461,865 3,489,838 356 - 27,176
Finance Lease 3,987,897 3,847,155 140,741 - - -
Mortgage Loan 30,220,557 4,945,265 51,687 - 24,304,711 918,895
Overdraft 175,289,705 115,975,909 19,408,321 112 1,914 39,903,450
Personal Loan 18,072,072 16,068,950 770,696 - - 1,232,426
Term Loan 1,088,719,248 662,246,205 414,637,752 - 1,923,592 9,911,700
Time Loan 484,739,710 110,638,349 342,042,618 - 5,017,432 27,041,309
Pledged assets
Treasury bills 188,239,520 188,239,520 - - - -
Bonds 126,707,982 126,707,982 - - - -
Investment securities -
- Available for sale
Treasury bills 69,346,601 40,960,665 22,293,819 - - 6,092,117
Bonds 32,891,849 19,182,580 3,319,215 - - 10,390,054
Equity 58,667,555 58,420,406 - 220,510 - 26,639
- Held to Maturity
Treasury bills 27,350,114 - - - - 27,350,114
Bonds 41,101,014 37,917,493 3,031,795 - - 151,726
Other assets 41,796,067 25,620,309 9,312,046 693,416 3,157 6,167,140
3,370,195,791 2,085,819,901 963,311,824 109,949,979 49,323,012 161,791,075
Deposits from financial institutions 167,356,583 23,799 135,858,174 12,101,600 10,666,112 8,706,898
Deposits from customers 2,089,197,286 1,496,193,858 395,957,684 93,758,760 11,414,977 91,872,007
Derivative financial instruments 30,444,501 30,275,182 5,494 121,239 1,650 40,936
111,117,648 37,357,834 65,587,013 1,282,116 909,666 5,981,019
Debt securities issued 316,544,502 31,572,052 284,972,450 - - -
299,543,707 226,099,848 72,650,629 13,923 122,277 657,030
3,014,204,227 1,821,522,573 955,031,444 107,277,638 23,114,682 107,257,890
Off balance sheet exposuress
Transaction related bonds and guarantees 186,251,718 86,188,508 54,791,787 454,287 873,301 43,943,835
Guaranteed facilities 99,582,709 29,384,264 8,065,763 2,771,057 48,063,793 11,297,831
261,208,243 231,580 205,935,077 2,322,543 12,145,795 40,573,249
Future, swap and forward contracts 933,073,893 - 901,351,358 31,722,536 - -
1,480,116,563 115,804,352 1,170,143,986 37,270,422 61,082,889 95,814,915
Other liabilities
Interest bearing borrowings
Clean line facilities for letters of credit and
160

Access Bank Plc
Consolidated and separate financial statementsFor the year ended 31 December 2017
5.2.3 The table below summaries the Bank’s financial instruments at carrying amount, categorised by currency:
Financial instruments by currency
Bank
In thousands of Naira
Total Naira US GBP Euro Others
Cash and balances with banks 657,144,247 536,637,684 107,413,980 2,762,465 9,623,913 706,205
Investment under management 20,257,131 20,257,131 - - - -
Non-pledged trading assets
Treasury bills 33,906,748 33,906,748 - - - -
Bonds 9,050,894 9,012,553 38,342 - - -
Equity 59,348 59,348 - - - -
Derivative financial instruments 92,390,219 92,390,219 - - - -
Loans and advances to banks 101,429,001 1,295,927 100,133,074 - - -
Loans and advances to customers
Auto Loan 3,243,530 3,243,530 - - - -
Credit Card 3,263,598 619,453 2,643,885 260 - -
Finance Lease 3,486,368 3,486,368 - - - -
Mortgage Loan 4,162,867 4,127,123 35,745 - - -
Overdraft 142,060,909 125,726,417 16,334,492 - - -
Personal Loan 14,613,195 13,684,110 929,085 - - -
Term Loan 1,165,294,769 821,782,950 343,511,819 - - -
Time Loan 435,157,504 160,962,875 268,931,936 52,976 2,909,240 2,300,476
Pledged assets
Treasury bills 252,061,738 252,061,738 - - - -
Bonds 188,441,589 188,441,589 - - - -
Investment securities -
Available for sale -
Treasury bills 9,598,737 9,598,737 - - - -
Bonds 28,066,294 27,714,194 352,100 - - -
Equity 69,181,956 69,181,956 - - - -
Held to Maturity
Treasury bills 5,837,568 5,837,568 - - - -
Bonds 9,116,855 7,051,661 2,065,194 - - -
Other assets 34,517,514 29,968,924 4,542,711 4,887 992 -
3,282,342,579 2,417,048,801 846,932,362 2,820,588 12,534,145 3,006,681
Deposits from financial institutions 276,140,835 - 267,588,985 - 6,482,044 2,069,806
Deposits from customers 1,910,773,713 1,577,026,973 323,377,322 5,700,968 4,668,185 265
Derivative financial instruments 5,306,450 5,306,450 - - - -
Other liabilities 223,963,436 106,714,552 113,189,353 279,505 3,778,831 1,195
Debt securities issued 302,106,706 70,984,362 231,122,344 - - -
282,291,141 224,994,913 57,296,228 - - -
3,000,582,280 1,985,027,249 992,574,232 5,980,473 14,929,060 2,071,266
Off balance sheet exposuress
Transaction related bonds and guarantees 225,158,636 164,420,932 528,085 22,338 60,187,281 -
Guaranteed facilities 81,335,619 23,298,855 54,922,784 - 3,113,980 -
200,918,665 - 181,761,573 1,004,791 17,484,858 667,443
Future, swap and forward contracts 624,709,693 - 624,709,693 - - -
1,132,122,613 187,719,787 861,922,135 1,027,129 80,786,119 667,443
31 December 2017
Interest bearing borrowings
Clean line facilities for letters of credit andother commitments
161

Access Bank Plc
Consolidated and separate financial statementsFor the year ended 31 December 2017
Financial instruments by currency
Bank
In thousands of Naira
Total Naira US GBP Euro Others
Cash and balances with banks 517,997,249 449,810,263 60,800,367 1,049,275 6,137,468 199,876
Investment under management 14,871,247 14,871,247 - - - -
Non-pledged trading assets
Treasury bills 34,381,635 34,381,635 - - - -
Bonds 10,188,597 10,170,293 18,304 - - -
Equity 59,348 59,348 - - - -
Derivative financial instruments 155,772,662 155,772,662 - - - -
Loans and advances to banks 104,006,574 5,120,323 98,886,251 - - -
Loans and advances to customers
Auto Loan 4,366,544 4,366,544 - - - -
Credit Card 3,922,377 461,866 3,460,156 356 - -
Finance Lease 3,987,897 3,847,155 140,741 - - -
Mortgage Loan 4,996,952 4,945,265 51,687 - - -
Overdraft 130,285,663 115,989,317 14,296,347 - - -
Personal Loan 16,789,104 16,068,950 720,154 - - -
Term Loan 1,017,646,255 662,246,205 355,400,050 - - -
Time Loan 412,567,554 110,638,348 297,462,741 - 4,214,043 252,422
Pledged assets
Treasury bills 188,239,520 188,239,520 - - - -
Bonds 126,707,982 126,707,982 - - - -
Investment securities
Available for sale
Treasury bills 40,960,665 40,960,665 - - - -
Bonds 21,699,880 19,182,580 2,517,300 - - -
Equity 58,420,406 58,420,406 - - - -
Held to Maturity
Treasury bills - - - - - -
Bonds 40,363,051 37,917,493 2,445,558 - - -
Other assets 33,265,072 25,620,310 7,640,386 3,506 870 -
2,941,496,233 2,085,798,377 843,840,041 1,053,137 10,352,381 452,298
Deposits from financial institutions 95,122,188 23,800 88,867,543 13,942 6,137,942 78,961
Deposits from customers 1,813,042,872 1,496,193,859 308,016,702 5,443,703 3,388,353 255
Derivative financial instruments 30,275,181 30,275,181 - - - -
Other liabilities 105,287,725 39,811,426 64,501,462 76,042 815,402 83,392
Debt securities issued 243,952,418 31,572,052 212,380,366 - - -
372,179,785 226,099,849 146,079,936 - - -
2,659,860,169 1,823,976,167 819,846,008 5,533,687 10,341,697 162,608
Off balance sheet exposuress
Transaction related bonds and guarantees 136,163,848 86,188,508 48,890,645 454,287 630,408 -
Guaranteed facilities 85,513,822 29,384,265 8,065,763 - 48,063,793 -158,994,795 231,581 149,868,358 1,893,686 5,828,248 1,172,921
Future, swap and forward contracts 900,436,358 - 900,436,358 - - -
1,281,108,822 115,804,354 1,107,261,124 2,347,973 54,522,449 1,172,921
Clean line facilities for letters of credit and
31 December 2016
Interest bearing borrowings
162

Access Bank Plc
Consolidated and separate financial statementsFor the year ended 31 December 2017
Liquidity risk management
The amounts in the table below have been compiled as follows:
Type of financial instrument Basis on which amounts are compiled
Non-derivative financial liabilities and financial assets
Trading derivative liabilities and assets forming part of the Group’s proprietary tradingoperations that are expected to be closed out before contractual maturity
Fair values at the date of the statement of financial position. This is because contractual maturities are not reflective of the liquidity riskexposure arising from these positions. These fair values are disclosed in the ‘less than one month’ column.
Trading derivative liabilities and assets that are entered into by the Group with its customersContractual undiscounted cash flows. This is because these instruments are not usually closed out before contractual maturity and so theGroup believes that contractual maturities are essential for understanding the timing of cash flows associated with these derivative positions.
The Group’s expected cash flows on some financial assets and financial liabilities vary significantly from the contractual cash flows. For example, demand deposits from customers are expected to remain stable or increase andunrecognised loan commitments are not all expected to be drawn down immediately. As part of the management of liquidity risk arising from financial liabilities, the Group holds liquid assets comprising Cash and balances with banks anddebt securities issued by federal government, which can be readily sold to meet liquidity requirements.In addition, the Group maintains agreed lines of credit with other banks and holds unencumbered assets eligible for use as collateral.
The following table shows the undiscounted cash flows on the Group’s financial assets and liabilities and on the basis of their earliest possible contractual maturity. The Gross nominal inflow / (outflow) disclosed in the table is thecontractual, undiscounted cash flow on the financial liability or commitment.
Undiscounted cash flows, which include estimated interest payments.
Issued financial guarantee contracts, and unrecognised loan commitments Earliest possible contractual maturity. For issued financial guarantee contracts, the maximum amount of the guarantee is allocated to theearliest year in which the guarantee could be called.
Derivative financial liabilities and financial assets held for risk management purposes Contractual undiscounted cash flows. The amounts shown are the gross nominal inflows and outflows for derivatives that have simultaneousgross settlement (e.g. forward exchange contracts and currency swaps) and the net amounts for derivatives that are net settled.
163

Access Bank Plc
Consolidated and separate financial statementsFor the year ended 31 December 2017
5.3.1 Residual contractual maturities of financial assets and liabilities
Group Carrying Gross nominal Less than 6 months 12 months 5 years More than
31 December 2017 amount inflow/(outflow) 3 months 5 years
In thousands of Naira
Cash and balances with banks 953,944,176 954,012,176 330,005,037 261,873,783 - - 362,133,356
Investment under management 20,257,131 16,923,280 13,877,216 3,046,063 - - -
Non-pledged trading assets
Treasury bills 37,743,819 36,591,854 5,754,587 7,808,409 23,028,858
Bonds 9,050,894 24,667,877 509,156 114,088 609,408 5,268,742 18,166,483
Derivative financial instruments 93,419,293 93,419,293 12,695,471 629,958 80,093,864
Loans and advances to banks 68,114,076 68,586,521 34,820,962 17,981,691 8,676,621 7,107,247 -
Loans and advances to customers
Auto Loan 3,450,060 3,498,728 128,961 108,498 194,929 3,066,341 -
Credit Card 3,410,627 3,472,624 3,181,916 44,453 121,620 87,633 37,001
Finance Lease 4,642,100 4,846,988 510,124 535,534 1,049,267 2,752,062 -
Mortgage Loan 43,621,930 43,703,475 8,433,689 10,405,972 11,429,184 11,602,490 1,832,139
Overdraft 184,260,759 202,165,354 140,503,847 14,946,975 38,950,797 - 7,763,737
Personal Loan 17,137,947 17,615,989 1,661,804 1,275,024 5,378,942 9,266,259 33,960
Term Loan 1,240,067,875 1,276,359,596 72,704,933 84,243,645 309,301,033 550,511,739 259,598,246
Time Loan 499,396,330 507,714,915 213,770,914 116,974,346 160,126,077 16,843,578 -
Pledged assets
Treasury bills 258,672,815 266,032,828 119,642,449 70,466,824 75,923,555 - -
Bonds 188,441,589 333,593,205 5,843,214 2,481,750 8,821,729 90,449,224 225,997,288
Investment securities
Available for sale
Treasury bills 29,977,451 32,529,011 6,000,297 24,578,714 1,950,000 - -
Bonds 54,079,368 111,384,906 2,693,868 1,617,346 4,319,922 53,212,754 49,541,016
Held to Maturity
Treasury bills 88,203,365 92,202,918 8,064,301 32,074,308 52,064,309 - -
Bonds 36,590,581 42,510,708 1,018,325 18,032,767 6,269,123 10,101,940 7,088,551
Other assets 46,799,196 76,560,762 46,162,812 3,161,155 9,355,050 17,881,745 -
3,881,281,382 4,208,393,007 1,027,983,883 672,401,304 797,664,287 778,151,754 932,191,777
Deposits from financial institutions 450,196,970 492,753,085 290,787,768 191,532,855 10,432,462 - -
Deposits from customers 2,244,879,075 2,526,911,645 1,322,388,754 882,033,700 28,665,196 293,823,995 -
Derivative financial instruments 5,332,177 5,332,177 4,433,573 650,884 247,719 - -
Other liabilities 235,786,478 237,574,121 144,535,406 69,146,396 23,891,209 1,110 -
Debt securities issued 302,106,706 321,682,651 17,697,737 26,535,721 277,449,193 -
Interest bearing borrowings 311,617,187 298,207,558 828,707 2,580,269 23,035,123 244,997,208 26,766,250
3,549,918,593 3,882,461,237 1,780,671,945 1,172,479,825 363,720,902 538,822,313 26,766,250
Gap (asset - liabilities) 331,362,790 325,931,771 (752,688,062) (500,078,521) 433,943,386 239,329,441 905,425,529
Cumulative liquidity gap (752,688,062) (1,252,766,583) (818,823,197) (579,493,756) 325,931,774
Off-balance sheet
Transaction related bonds and guarantees 370,892,995 370,892,996 69,692,770 45,345,626 158,847,644 97,006,956 -
Guaranteed facilities 171,002,109 171,002,109 53,451,112 30,394,198 14,113,357 73,043,442 -
commitments 293,267,039 293,267,039 167,575,246 98,015,062 27,676,731 - -
Future, swap and forward contracts 662,935,746 662,935,745 109,529,465 46,416,674 506,989,605 -
1,498,097,889 1,498,097,889 400,248,593 220,171,560 707,627,337 170,050,398 -
164

Access Bank Plc
Consolidated and separate financial statementsFor the year ended 31 December 2017
Group Carrying Gross nominal Less than 6 months 12 months 5 years More than
31 December 2016 amount inflow/(outflow) 3 months 5 years
In thousands of Naira
Cash and balances with banks 713,889,105 715,345,365 353,988,075 7,247,123 53,642,143 - 300,468,024
Investment under management 14,871,247 14,871,247 10,411,554 4,459,693 - - -
Non-pledged trading assets
Treasury bills 34,381,635 34,029,176 9,040,335 4,866,243 20,122,598 - -
Bonds 10,188,597 16,619,894 631,976 91,576 718,002 6,761,748 8,416,592
Derivative financial instruments 156,042,984 156,042,984 27,079,269 33,598,441 38,327,725 57,037,549 -
Loans and advances to banks 45,203,002 45,463,319 33,905,765 4,685,904 6,871,650 - -
Loans and advances to customers
Auto Loan 4,450,747 4,514,364 352,266 325,139 743,859 3,093,100 -
Credit Card 3,979,235 4,051,996 3,916,648 187 16,538 118,623 -
Finance Lease 3,987,897 4,007,259 709,657 370,719 725,035 2,201,848 -
Mortgage Loan 30,220,557 30,304,601 24,297,892 143,547 37,176 2,717,493 3,108,493
Overdraft 175,289,705 186,881,262 115,424,409 8,168,255 62,334,086 954,511 -
Personal Loan 18,072,072 18,754,869 3,212,043 1,692,016 4,106,747 9,486,725 257,338
Term Loan 1,088,719,249 1,109,876,546 92,812,191 37,992,342 70,123,875 620,946,018 288,002,120
Time Loan 484,739,708 486,774,566 321,897,757 36,295,722 63,668,031 64,913,055 -
Pledged assets
Treasury bills 188,239,520 209,782,953 40,001,539 74,184,000 95,597,414 - -
Bonds 126,707,982 210,020,281 1,841,690 7,536,150 12,442,115 53,256,317 134,944,010
Investment securities
Available for sale
Treasury bills 69,346,601 69,633,449 24,517,339 9,716,110 35,400,000 - -
Bonds 32,891,849 39,382,977 477,858 5,278,846 1,616,705 14,058,682 17,950,886
Held to Maturity
Treasury bills 27,350,114 28,180,997 16,686,645 4,378,220 7,116,132 - -
Bonds 41,101,013 98,737,384 6,191,560 3,272,392 4,798,727 26,230,505 58,244,199
Other assets 41,796,068 44,763,926 16,103,065 8,352,445 2,674,098 17,634,319 -3,311,468,889 3,528,039,417 1,103,499,533 252,655,073 481,082,654 879,410,493 811,391,662
Deposits from financial institutions 167,356,583 164,074,988 88,509,852 28,368,657 47,196,478 - -
Deposits from customers 2,089,197,286 2,131,487,288 1,770,249,157 169,609,396 131,265,649 60,363,086 -
Derivative financial instruments 30,444,501 30,444,581 6,319,085 9,071,764 15,053,732 - -
Other liabilities 111,117,648 111,134,476 34,280,188 64,128,143 12,124,191 601,954 -
Debt securities issued 316,544,502 414,465,451 11,105,760 14,661,659 388,698,032 - -
Interest bearing borrowings 299,543,707 349,046,526 5,715,379 11,935,782 16,675,458 95,242,608 219,477,299
3,014,204,227 3,200,653,309 1,916,179,421 297,775,401 611,013,540 156,207,648 219,477,299
Gap (asset - liabilities) 297,264,662 327,386,108 (812,679,888) (45,120,329) (129,930,886) 723,202,845 591,914,362
Cumulative liquidity gap (812,679,888) (857,800,217) (987,731,103) (264,528,259) 327,386,104
Off-balance sheet
Transaction related bonds and guarantees 221,127,530 186,251,718 58,396,012 20,312,880 13,591,530 93,951,296 -
Guaranteed facilities 94,135,927 99,582,709 12,734,834 3,939,865 12,160,759 68,912,931 1,834,320
Clean line facilities for letters of credit and other commitments 216,785,592 261,208,243 191,336,041 32,234,010 33,458,810 4,179,382 -
Future, swap and forward contracts 440,800,900 933,073,893 277,615,235 195,494,789 347,913,388 112,050,481 -
972,849,949 1,480,116,563 540,082,122 251,981,544 407,124,487 279,094,090 1,834,320
165

Access Bank Plc
Consolidated and separate financial statementsFor the year ended 31 December 2017
5.3.1 Residual contractual maturities of financial assets and liabilities
Bank Carrying Gross nominal Less than 6 months 12 months 5 years More than
31 December 2017 amount inflow/(outflow) 3 months 5 years
In thousands of Naira
Cash and balances with banks 657,144,247 657,824,247 269,040,476 28,837,562 - - 359,946,209
Investment under management 20,257,131 20,257,131 15,248,944 2,664,746 2,343,441 - -
Non-pledged trading assets
Treasury bills 33,906,748 36,591,854 5,754,587 7,808,409 23,028,858
Bonds 9,050,894 24,667,877 509,156 114,088 609,408 5,268,742 18,166,483
Derivative financial instruments 92,390,219 92,390,219 12,695,471 629,958 79,064,790
Loans and advances to banks 101,429,001 101,470,508 35,270,508 24,825,000 41,375,000 - -
Loans and advances to customers
Auto Loan 3,243,530 3,292,199 79,394 54,800 139,166 3,018,839 -
Credit Card 3,263,598 3,324,216 3,153,636 - 91,869 41,710 37,001
Finance Lease 3,486,368 3,684,811 254,252 244,990 712,494 2,473,076 -
Mortgage Loan 4,162,867 4,230,374 143,777 143,106 377,137 1,734,215 1,832,139
Overdraft 142,060,909 156,902,433 121,336,888 - 27,801,808 - 7,763,737
Personal Loan 14,613,195 15,085,225 1,205,845 591,838 4,418,034 8,835,548 33,960
Term Loan 1,165,294,769 1,197,454,857 57,453,678 59,296,709 289,574,849 531,531,376 259,598,246
Time Loan 435,157,504 443,414,730 192,556,762 102,184,076 139,554,312 9,119,579 -
Pledged assets
Treasury bills 252,061,738 260,032,828 119,642,449 64,466,824 75,923,555 - -
Bonds 188,441,589 333,593,205 5,843,214 2,481,750 8,821,729 90,449,224 225,997,288
Investment securities
Available for sale
Treasury bills 9,598,737 10,150,297 4,000,297 4,200,000 1,950,000 - -
Bonds 28,066,294 55,692,453 1,346,934 808,673 2,159,961 26,606,377 24,770,508
Held to Maturity
Treasury bills 5,837,568 5,957,035 - - 5,957,035 - -
Bonds 9,116,855 10,889,048 1,776,941 910,662 557,673 6,396,217 1,247,555
Other assets 34,517,514 64,618,113 46,024,737 - 835,486 17,757,889 -
3,213,101,274 3,501,523,658 893,337,945 300,263,191 705,296,604 703,232,792 899,393,126
Deposits from financial institutions 276,140,835 287,106,829 156,414,526 110,592,932 20,038,675 60,695 -
Deposits from customers 1,910,773,713 1,923,543,742 1,577,123,251 325,858,014 20,473,680 88,797 -
Derivative financial instruments 5,306,450 5,306,450 4,433,548 625,183 247,719 - -
Other liabilities 223,963,436 223,963,436 132,508,400 14,656,236 76,798,800 - -
Debt securities issued 302,106,706 321,682,651 17,697,737 26,535,721 277,449,193 - -
Interest bearing borrowings 282,291,141 295,636,255 123,648,978 65,728,142 46,536,781 32,239,324 27,483,030
3,000,582,281 3,057,239,362 2,011,826,439 543,996,228 441,544,848 32,388,817 27,483,030
Gap (asset - liabilities) 212,518,994 444,284,295 (1,118,488,494) (243,733,037) 263,751,756 670,843,975 871,910,096
Cumulative liquidity gap (1,118,488,494) (1,362,221,531) (1,098,469,775) (427,625,800) 444,284,295
Off balance-sheet
Transaction related bonds and guarantees 225,158,636 225,158,637 34,170,542 34,919,753 59,061,386 97,006,956 -
Guaranteed facilities 81,335,619 81,335,619 533,891 1,877,455 9,997,094 68,927,179 -
Clean line facilities for letters of credit and other commitments 200,918,665 200,918,665 111,792,227 79,466,674 9,659,764 - -
Future, swap and forward contracts 624,709,693 772,477,622 348,099,740 237,795,545 74,201,215 112,381,121 -
1,132,122,613 1,279,890,543 494,596,401 354,059,427 152,919,459 278,315,256 -
166

Access Bank Plc
Consolidated and separate financial statementsFor the year ended 31 December 2017
Bank Carrying Gross nominal Less than 6 months 12 months 5 years More than
31 December 2016 amount inflow/(outflow) 3 months 5 years
In thousands of Naira
Cash and balances with banks 517,997,249 519,266,390 160,192,964 7,247,123 53,642,143 - 298,184,159
Investment under management 14,871,247 13,041,247 10,411,554 2,629,693 - - -
Non-pledged trading assets
Treasury bills 34,381,635 34,029,176 9,040,335 4,866,243 20,122,598 - -
Bonds 10,188,597 16,619,893 631,976 91,576 718,002 6,761,748 8,416,592
Derivative financial instruments 155,772,662 155,772,662 26,810,280 33,597,108 38,327,725 57,037,549 -
Loans and advances to banks 104,006,574 106,370,619 17,606,339 35,495,655 53,268,624 - -
Loans and advances to customers
Auto Loan 4,366,544 4,429,376 349,123 325,117 737,390 3,017,746 -
Credit Card 3,922,377 4,008,296 3,872,947 187 16,538 118,623 -
Finance Lease 3,987,898 4,007,259 709,657 370,719 725,035 2,201,848 -
Mortgage Loan 4,996,952 5,072,282 71,128 143,142 36,366 2,588,525 2,233,121
Overdraft 130,285,663 140,086,013 112,363,969 8,168,255 19,374,316 179,472 -
Personal Loan 16,789,104 17,369,909 3,204,315 1,688,986 3,515,034 8,958,819 2,756
Term Loan 1,017,646,255 1,035,301,570 69,817,914 37,847,445 69,867,436 572,754,782 285,013,663
Time Loan 412,567,554 414,563,484 305,093,210 28,655,049 15,934,022 64,881,203 -
Pledged assets
Treasury bills 188,239,520 209,782,953 40,001,539 74,184,000 95,597,414 - -
Bonds 126,707,982 210,020,281 1,841,690 7,536,150 12,442,115 53,256,317 134,944,010
Investment securities
Available for sale
Treasury bills 40,960,665 47,318,516 2,202,406 9,716,110 35,400,000 - -
Bonds 21,699,880 38,217,811 477,858 5,278,846 1,616,705 13,114,026 17,730,376
Held to Maturity
Treasury bills - - - - - -
Bonds 40,363,051 88,365,459 2,217,396 288,326 3,453,755 24,516,142 57,889,841
Other assets 33,265,072 36,232,930 16,057,855 - 2,666,435 17,508,640 -
2,883,016,480 3,099,876,127 782,974,457 258,129,729 427,461,654 826,895,439 804,414,518
Deposits from financial institutions 95,122,188 93,373,197 88,509,852 4,824,256 39,089 - -
Deposits from customers 1,813,042,872 1,842,927,520 1,630,445,930 122,969,705 77,445,500 12,066,385 -
Derivative financial instruments 30,275,181 30,275,181 6,150,451 9,070,998 15,053,732 - -
Other liabilities 105,287,724 105,287,724 29,202,451 64,128,143 11,957,131 - -
Debt securities issued 243,952,418 336,873,750 8,452,867 14,661,659 313,759,224 - -
Interest bearing borrowings 372,179,785 426,638,227 8,368,272 11,935,782 91,614,266 95,242,608 219,477,299
2,659,860,168 2,835,375,599 1,771,129,823 227,590,543 509,868,942 107,308,993 219,477,299
Gap (asset - liabilities) 223,156,312 264,500,528 (988,155,366) 30,539,186 (82,407,288) 719,586,446 584,937,220
Cumulative liquidity gap (988,155,366) (957,616,181) (1,040,023,468) (320,437,022) 264,500,198
Off balance-sheet
Transaction related bonds and guarantees 136,163,848 136,163,848 11,965,448 19,613,726 12,336,612 92,248,061 -
Guaranteed facilities 85,513,821 85,513,821 5,276,228 2,913,364 6,576,977 68,912,931 1,834,320
Clean line facilities for letters of credit and other commitments 158,994,793 158,994,793 81,207,362 32,234,010 41,374,039 4,179,382 -
Future, swap and forward contracts 900,436,358 900,436,358 277,615,235 195,494,789 315,275,853 112,050,481 -
1,281,108,820 1,281,108,820 376,064,274 250,255,889 375,563,481 277,390,855 1,834,320
167
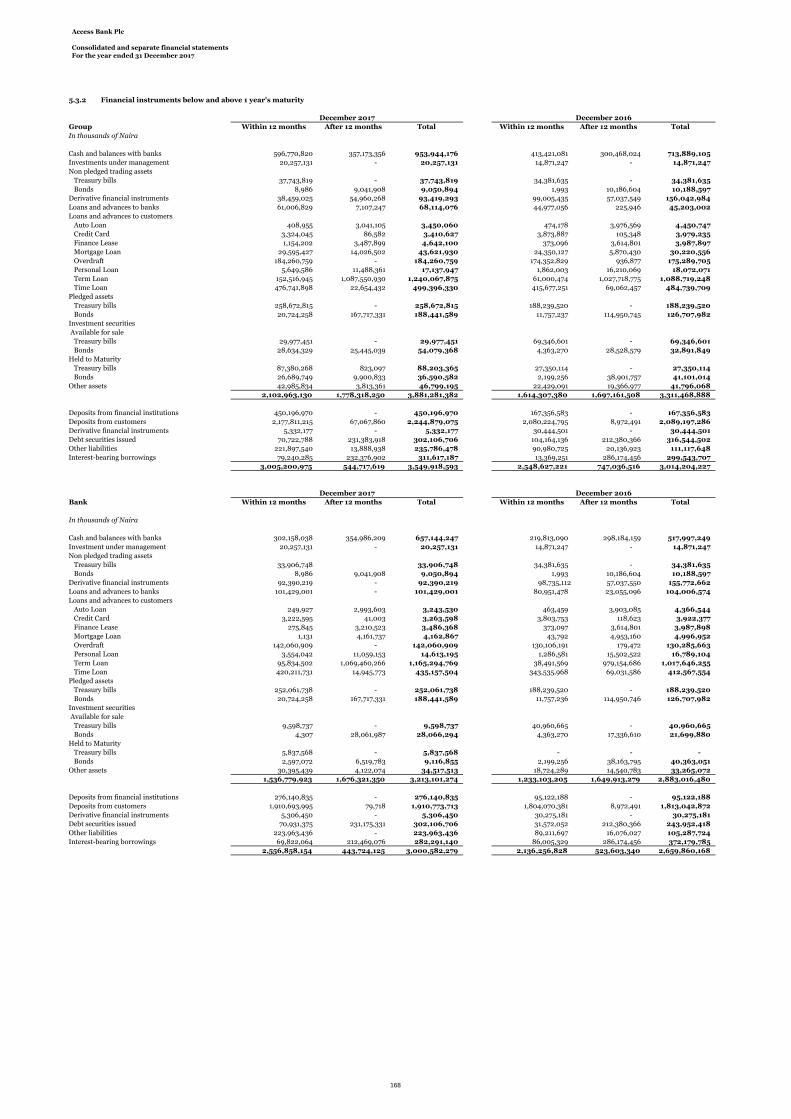
Access Bank Plc
Consolidated and separate financial statementsFor the year ended 31 December 2017
5.3.2 Financial instruments below and above 1 year's maturity
Group Within 12 months After 12 months Total Within 12 months After 12 months Total
In thousands of Naira
Cash and balances with banks 596,770,820 357,173,356 953,944,176 413,421,081 300,468,024 713,889,105
Investments under management 20,257,131 - 20,257,131 14,871,247 - 14,871,247
Non pledged trading assets
Treasury bills 37,743,819 - 37,743,819 34,381,635 - 34,381,635
Bonds 8,986 9,041,908 9,050,894 1,993 10,186,604 10,188,597
Derivative financial instruments 38,459,025 54,960,268 93,419,293 99,005,435 57,037,549 156,042,984
Loans and advances to banks 61,006,829 7,107,247 68,114,076 44,977,056 225,946 45,203,002
Loans and advances to customers
Auto Loan 408,955 3,041,105 3,450,060 474,178 3,976,569 4,450,747
Credit Card 3,324,045 86,582 3,410,627 3,873,887 105,348 3,979,235
Finance Lease 1,154,202 3,487,899 4,642,100 373,096 3,614,801 3,987,897
Mortgage Loan 29,595,427 14,026,502 43,621,930 24,350,127 5,870,430 30,220,556
Overdraft 184,260,759 - 184,260,759 174,352,829 936,877 175,289,705
Personal Loan 5,649,586 11,488,361 17,137,947 1,862,003 16,210,069 18,072,071
Term Loan 152,516,945 1,087,550,930 1,240,067,875 61,000,474 1,027,718,775 1,088,719,248
Time Loan 476,741,898 22,654,432 499,396,330 415,677,251 69,062,457 484,739,709
Pledged assets
Treasury bills 258,672,815 - 258,672,815 188,239,520 - 188,239,520
Bonds 20,724,258 167,717,331 188,441,589 11,757,237 114,950,745 126,707,982
Investment securities
Available for sale
Treasury bills 29,977,451 - 29,977,451 69,346,601 - 69,346,601
Bonds 28,634,329 25,445,039 54,079,368 4,363,270 28,528,579 32,891,849
Held to Maturity
Treasury bills 87,380,268 823,097 88,203,365 27,350,114 - 27,350,114
Bonds 26,689,749 9,900,833 36,590,582 2,199,256 38,901,757 41,101,014
Other assets 42,985,834 3,813,361 46,799,195 22,429,091 19,366,977 41,796,068
2,102,963,130 1,778,318,250 3,881,281,382 1,614,307,380 1,697,161,508 3,311,468,888
Deposits from financial institutions 450,196,970 - 450,196,970 167,356,583 - 167,356,583
Deposits from customers 2,177,811,215 67,067,860 2,244,879,075 2,080,224,795 8,972,491 2,089,197,286
Derivative financial instruments 5,332,177 - 5,332,177 30,444,501 - 30,444,501
Debt securities issued 70,722,788 231,383,918 302,106,706 104,164,136 212,380,366 316,544,502
Other liabilities 221,897,540 13,888,938 235,786,478 90,980,725 20,136,923 111,117,648
Interest-bearing borrowings 79,240,285 232,376,902 311,617,187 13,369,251 286,174,456 299,543,707
3,005,200,975 544,717,619 3,549,918,593 2,548,627,221 747,036,516 3,014,204,227
Bank Within 12 months After 12 months Total Within 12 months After 12 months Total
In thousands of Naira
Cash and balances with banks 302,158,038 354,986,209 657,144,247 219,813,090 298,184,159 517,997,249
Investment under management 20,257,131 - 20,257,131 14,871,247 - 14,871,247
Non pledged trading assets
Treasury bills 33,906,748 33,906,748 34,381,635 - 34,381,635
Bonds 8,986 9,041,908 9,050,894 1,993 10,186,604 10,188,597
Derivative financial instruments 92,390,219 - 92,390,219 98,735,112 57,037,550 155,772,662
Loans and advances to banks 101,429,001 - 101,429,001 80,951,478 23,055,096 104,006,574
Loans and advances to customers
Auto Loan 249,927 2,993,603 3,243,530 463,459 3,903,085 4,366,544
Credit Card 3,222,595 41,003 3,263,598 3,803,753 118,623 3,922,377
Finance Lease 275,845 3,210,523 3,486,368 373,097 3,614,801 3,987,898
Mortgage Loan 1,131 4,161,737 4,162,867 43,792 4,953,160 4,996,952
Overdraft 142,060,909 - 142,060,909 130,106,191 179,472 130,285,663
Personal Loan 3,554,042 11,059,153 14,613,195 1,286,581 15,502,522 16,789,104
Term Loan 95,834,502 1,069,460,266 1,165,294,769 38,491,569 979,154,686 1,017,646,255
Time Loan 420,211,731 14,945,773 435,157,504 343,535,968 69,031,586 412,567,554
Pledged assets
Treasury bills 252,061,738 - 252,061,738 188,239,520 - 188,239,520
Bonds 20,724,258 167,717,331 188,441,589 11,757,236 114,950,746 126,707,982
Investment securities
Available for sale
Treasury bills 9,598,737 - 9,598,737 40,960,665 - 40,960,665
Bonds 4,307 28,061,987 28,066,294 4,363,270 17,336,610 21,699,880
Held to Maturity
Treasury bills 5,837,568 - 5,837,568 - - -
Bonds 2,597,072 6,519,783 9,116,855 2,199,256 38,163,795 40,363,051
Other assets 30,395,439 4,122,074 34,517,513 18,724,289 14,540,783 33,265,072
1,536,779,923 1,676,321,350 3,213,101,274 1,233,103,205 1,649,913,279 2,883,016,480
Deposits from financial institutions 276,140,835 - 276,140,835 95,122,188 - 95,122,188
Deposits from customers 1,910,693,995 79,718 1,910,773,713 1,804,070,381 8,972,491 1,813,042,872
Derivative financial instruments 5,306,450 - 5,306,450 30,275,181 - 30,275,181
Debt securities issued 70,931,375 231,175,331 302,106,706 31,572,052 212,380,366 243,952,418
Other liabilities 223,963,436 - 223,963,436 89,211,697 16,076,027 105,287,724
Interest-bearing borrowings 69,822,064 212,469,076 282,291,140 86,005,329 286,174,456 372,179,785
2,556,858,154 443,724,125 3,000,582,279 2,136,256,828 523,603,340 2,659,860,168
December 2017 December 2016
December 2017 December 2016
168

Access Bank Plc
Consolidated and separate financial statementsFor the year ended 31 December 2017
6 Capital management
Group Group Bank Bank
December 2017 December 2016 December 2017 December 2016
In thousands of Naira
Tier 1 capital
Ordinary share capital 14,463,986 14,463,986 14,463,986 14,463,986
Share premium 197,974,816 197,974,816 197,974,816 197,974,816
Retained earnings 117,701,679 93,614,030 120,218,603 93,329,188
Other reserves 178,399,413 142,194,720 136,833,692 115,910,630
Non-controlling interests 6,907,515 6,247,028 - -
515,447,409 454,494,580 469,491,098 421,678,620
Add/(Less):
Fair value reserve for available-for-sale (36,111,322) (23,240,250) (35,267,471) (23,354,093)Foreign currency translation reserves (26,813,500) (11,992,025) - -
Other reserves (2,031,978) (1,211,978) (2,031,978) (1,008,118)
Total Tier 1 450,490,608 418,050,326 432,191,648 397,316,409
Add/(Less):
50% Investments in subsidiaries - - (43,897,316) (29,619,626)Deferred tax assets (740,402) (1,264,813) - -
Regulatory risk reserve (43,420,287) (42,932,550) (35,058,266) (35,058,266)
Intangible assets (8,295,855) (6,939,555) (5,981,905) (5,173,784)
Adjusted Tier 1 398,034,065 366,913,409 347,254,162 327,464,733
Tier 2 capital
Debt securities issued 79,440,000 97,600,000 79,440,000 97,600,000
Fair value reserve for available-for-sale
securities
Foreign currency translation reserves 26,813,500 11,992,025 - -
Other reserves 2,031,978 1,211,978 2,031,978 1,008,118
50% Investments in subsidiaries - - (43,897,316) (29,619,626)
Total Tier 2 144,396,800 134,044,253 72,842,135 92,342,587
Adjusted Tier 2 capital (33% of Tier 1) 132,664,754 122,292,239 72,842,135 92,342,587
Total regulatory capital 530,698,819 489,205,648 420,096,297 419,807,320
Risk-weighted assets 2,358,011,237 2,355,526,638 2,311,370,698 2,148,490,422
Capital ratios
22.51% 20.77% 18.18% 19.54%
16.88% 15.58% 15.02% 15.24%Total tier 1 capital expressed as a percentage of risk-weightedassets
The Bank’s objectives when managing capital, which is a broader concept than the ‘equity’ on the face of the statement of financial position, are:i) To comply with the capital requirements set by the Central Bank;ii) To safeguard the Bank’s ability to continue as a going concern so that it can continue to provide returns for shareholders and benefits for other stakeholders; andiii) To maintain a strong capital base to support the development of its business.
The capital adequacy ratio is the quotient of the capital base of the Bank and the Bank's risk weighted asset base. In accordance with Central Bank of Nigeria regulations, aminimum ratio of 16% (15% + additional 1%) is to be maintained for deposit money banks designated as significant financial institutions. Following the CBN guideline onregulatory capital computation, the Regulatory Risk Reserve has been excluded from the capital computation. Standardised approach has been adopted in computing therisk weighted assets for Credit, Operetional, and Market Risk. The following table provides an overview of the development of the capital ratios and risk-weighted assets(RWA):
Total regulatory capital expressed as a percentage of total risk-weighted assets
36,111,322 23,240,250 35,267,471 23,354,093
The regulatory capital requirements are strictly observed when managing capital. The Bank’s regulatory capital is managed by its Bank Treasury and comprises two tiers:- Tier 1 capital: This includes ordinary share capital, share premium, retained earnings and other reserves excluding regulatory reseres. Intangible assets, deferred taxassets and investment in subsidiaries were also deducted from Tier I capital for capital adequacy purposes; and- Tier 2 capital: This includes fair value reserves, foreign currency translation reserves with adjustments for investments in subsidiaries.
169
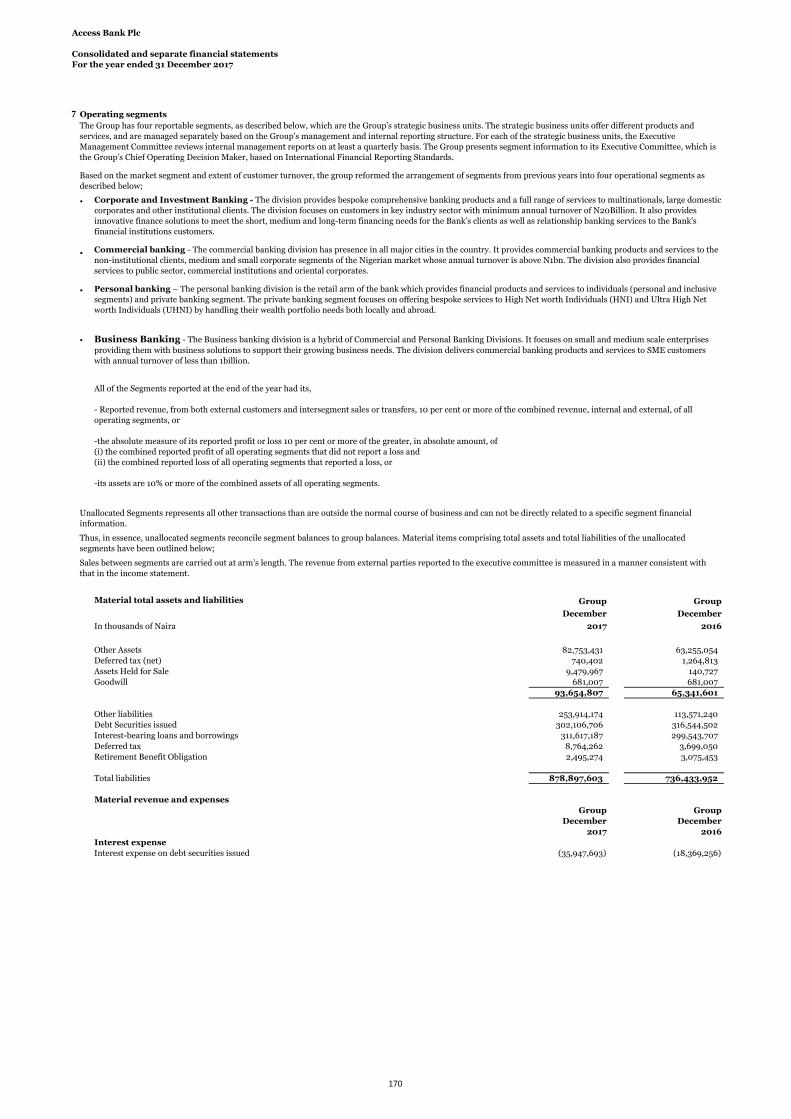
Access Bank Plc
Consolidated and separate financial statementsFor the year ended 31 December 2017
7 Operating segments
•
•
•
•
Material total assets and liabilities Group Group
December December
In thousands of Naira 2017 2016
Other Assets 82,753,431 63,255,054
Deferred tax (net) 740,402 1,264,813
Assets Held for Sale 9,479,967 140,727
Goodwill 681,007 681,007
93,654,807 65,341,601
Other liabilities 253,914,174 113,571,240
Debt Securities issued 302,106,706 316,544,502
Interest-bearing loans and borrowings 311,617,187 299,543,707
Deferred tax 8,764,262 3,699,050
Retirement Benefit Obligation 2,495,274 3,075,453
Total liabilities 878,897,603 736,433,952
Material revenue and expenses
Group Group
December December
2017 2016
Interest expense
Interest expense on debt securities issued (35,947,693) (18,369,256)
Sales between segments are carried out at arm’s length. The revenue from external parties reported to the executive committee is measured in a manner consistent withthat in the income statement.
Unallocated Segments represents all other transactions than are outside the normal course of business and can not be directly related to a specific segment financialinformation.
Thus, in essence, unallocated segments reconcile segment balances to group balances. Material items comprising total assets and total liabilities of the unallocatedsegments have been outlined below;
All of the Segments reported at the end of the year had its,
- Reported revenue, from both external customers and intersegment sales or transfers, 10 per cent or more of the combined revenue, internal and external, of alloperating segments, or
-the absolute measure of its reported profit or loss 10 per cent or more of the greater, in absolute amount, of(i) the combined reported profit of all operating segments that did not report a loss and(ii) the combined reported loss of all operating segments that reported a loss, or
-its assets are 10% or more of the combined assets of all operating segments.
Business Banking - The Business banking division is a hybrid of Commercial and Personal Banking Divisions. It focuses on small and medium scale enterprises
providing them with business solutions to support their growing business needs. The division delivers commercial banking products and services to SME customerswith annual turnover of less than 1billion.
The Group has four reportable segments, as described below, which are the Group’s strategic business units. The strategic business units offer different products andservices, and are managed separately based on the Group’s management and internal reporting structure. For each of the strategic business units, the ExecutiveManagement Committee reviews internal management reports on at least a quarterly basis. The Group presents segment information to its Executive Committee, which isthe Group’s Chief Operating Decision Maker, based on International Financial Reporting Standards.
Based on the market segment and extent of customer turnover, the group reformed the arrangement of segments from previous years into four operational segments asdescribed below;
Corporate and Investment Banking - The division provides bespoke comprehensive banking products and a full range of services to multinationals, large domesticcorporates and other institutional clients. The division focuses on customers in key industry sector with minimum annual turnover of N20Billion. It also providesinnovative finance solutions to meet the short, medium and long-term financing needs for the Bank’s clients as well as relationship banking services to the Bank'sfinancial institutions customers.
Commercial banking - The commercial banking division has presence in all major cities in the country. It provides commercial banking products and services to thenon-institutional clients, medium and small corporate segments of the Nigerian market whose annual turnover is above N1bn. The division also provides financialservices to public sector, commercial institutions and oriental corporates.
Personal banking – The personal banking division is the retail arm of the bank which provides financial products and services to individuals (personal and inclusivesegments) and private banking segment. The private banking segment focuses on offering bespoke services to High Net worth Individuals (HNI) and Ultra High Networth Individuals (UHNI) by handling their wealth portfolio needs both locally and abroad.
170

Access Bank Plc
Consolidated and separate financial statementsFor the year ended 31 December 2017
7a Operating segments (continued)
31 December 2017
Corporate &Investment Commercial Business Personal Unallocated Total continuing Total
In thousands of Naira Banking Banking Banking Banking Segments operations
Revenue:
Derived from external customers 130,005,493 71,052,261 16,524,325 28,993,324 - 246,575,403 246,575,403
Derived from other business segments - - - - - - -
Total Revenue 130,005,493 71,052,261 16,524,325 28,993,324 - 246,575,403 246,575,403
Interest Income 91,910,500 154,101,363 31,066,986 42,775,553 - 319,854,402 319,854,402
Interest expense (37,453,265) (64,996,071) (11,733,835) (15,291,099) (26,928,587) (156,402,857) (156,402,857)
Impairment Losses (27,669,368) (6,086,968) 578,891 (1,289,423) - (34,466,868) (34,466,868)
Profit/(Loss) on ordinary activities before taxation 74,573,148 26,177,424 1,667,521 4,582,976 (26,928,587) 80,072,482 80,072,482
Income tax expense (12,647,766) (4,386,483) (279,422) (767,957) - (18,081,628) (18,081,628)
Profit after tax 61,990,854 61,990,854
Assets and liabilities:
Loans and Advances to customers 625,016,339 998,546,813 64,104,240 51,776,501 - 1,739,443,893 1,739,443,893
Goodwill - - - - 681,007 681,007 681,007
Tangible segment assets 1,336,670,184 2,472,389,897 163,483,992 119,631,769 - 4,092,175,842 4,092,175,842
Unallocated segment assets - - - - 10,066,978 10,066,978 10,066,978
Total assets 1,336,670,184 2,472,389,897 163,483,992 119,631,769 10,066,978 4,102,242,820 4,102,242,820
Deposits from customers 397,529,002 976,398,417 311,944,929 559,006,727 - 2,244,879,075 2,244,879,075
Segment liabilities 478,495,638 1,642,561,437 524,774,213 940,397,769 - 3,586,229,057 3,586,229,057
Unallocated segment liabilities - - - - 566,354 566,354 566,354
Total liabilities 478,495,638 1,642,561,437 524,774,213 940,397,769 566,354 3,586,795,411 3,586,795,411
Net assets 858,174,547 829,828,460 (361,290,221) (820,766,000) 9,500,624 515,447,410 515,447,410
171

Access Bank Plc
Consolidated and separate financial statementsFor the year ended 31 December 2017
31 December 2016
Operating segments (continued)
Corporate &Investment Commercial Business Personal Unallocated Total continuing Total
In thousands of Naira Banking Banking Banking Banking Segments operations
Revenue:
Derived from external customers 141,391,638 145,070,057 29,336,906 65,522,183 - 381,320,783 381,320,783
Derived from other business segments (897) (2,251) 1,063 2,084 - - 0
Total Revenue 141,390,741 145,067,806 29,337,969 65,524,267 - 381,320,783 381,320,783
Interest Income 75,569,180 116,850,109 22,723,799 32,143,548 - 247,286,635 247,286,635
Interest expenses (34,582,829) (38,394,292) (7,051,917) (9,740,581) (18,369,256) (108,138,875) (108,138,875)
Impairment Losses (9,374,089) (10,448,863) (1,238,648) (891,219) - (21,952,819) (21,952,819)
Profit/(Loss) on ordinary activities before taxation 49,260,836 47,314,951 424,158 11,708,767 (18,369,256) 90,339,456 90,339,456
Income tax expense (18,900,109) (18,900,109)
Profit after tax 71,439,347 71,439,347
Assets and liabilities:
Loans and Advances to customers 702,318,575 1,028,136,471 66,283,947 57,923,181 - 1,854,662,174 1,854,662,174
Goodwill 681,007 681,007 681,007
Tangible segment assets 1,303,757,470 1,886,823,131 121,643,467 106,299,895 - 3,418,523,963 3,418,523,963
Unallocated segment assets - - - - 65,341,601 65,341,601 65,341,601
Total assets 1,303,757,470 1,886,823,131 121,643,467 106,299,895 65,341,601 3,483,865,564 3,483,865,564
Deposits from customers 480,494,494 970,978,683 243,016,286 394,707,823 - 2,089,197,286 2,089,197,286
Segment liabilities 358,575,114 1,407,188,270 254,397,381 284,733,397 - 2,304,894,163 2,304,894,163
Unallocated segment liabilities - - - - 724,476,821 724,476,821 724,476,821
Total liabilities 358,575,114 1,407,188,270 254,397,381 284,733,397 724,476,821 3,029,370,984 3,029,370,984
Net assets 945,182,356 479,634,861 (132,753,914) (178,433,503) (659,135,220) 454,494,580 454,494,580
172

Access Bank Plc
Consolidated and separate financial statements
For the year ended 31 December 2017
7b Geographical segments
The Group operates in three geographic regions, being:
• Nigeria
• Rest of Africa
• Europe
31 December 2017 Rest of
In thousands of Naira Nigeria Africa Europe Total
Derived from external customers 398,161,575 38,759,457 22,154,747 459,075,779
Derived from other segments - - - -
Total revenue 398,161,575 38,759,457 22,154,747 459,075,779
Interest income 274,670,641 28,223,362 16,960,399 319,854,402
Impairment losses (29,149,849) (5,317,020) - (34,466,869)
Interest expense (143,133,607) (6,302,975) (6,966,275) (156,402,857)
Net fee and commission income 45,785,985 5,819,745 4,991,587 56,597,317
Operating income 255,027,968 32,456,482 15,188,472 302,672,922
Profit before income tax 67,043,501 3,993,738 9,035,244 80,072,482
Assets and liabilities:
Loans and advances to customers and banks 1,872,711,740 95,388,270 96,001,693 2,064,101,703
Non current assets
Goodwill - 681,007 - 681,007
Total assets 3,499,683,979 (67,809,613) 670,368,454 4,102,242,820
Deposit from customers 1,910,773,713 130,741,584 203,363,778 2,244,879,075
Total liabilities 3,030,192,882 (39,075,909) 595,678,438 3,586,795,411
Net assets 469,491,098 (28,733,704) 74,690,016 515,447,409
Rest of
31 December 2016 Nigeria Africa Europe Total
Derived from external customers 331,000,972 42,385,383 7,934,428 381,320,783
Derived from other segments - - - -
Total revenue 331,000,972 42,385,383 7,934,428 381,320,783
Interest income 210,794,456 10,563,845 25,928,334 247,286,635
Impairment losses (17,641,127) (4,311,692) - (21,952,819)
Interest expense (94,777,050) (9,086,318) (4,275,507) (108,138,875)
Net fee and commission income 45,992,484 5,372,046 3,499,274 54,863,803Operating income 236,223,922 33,299,065 3,658,921 273,181,908
236,223,922 33,299,065 3,658,921 273,181,908
Profit before income tax 80,579,576 5,257,275 4,502,605 90,339,456
Assets and liabilities:
Loans and advances to customers 1,698,568,920 92,329,153 18,561,100 1,809,459,172
Non current assets
Goodwill - 681,007 - 681,007
Total assets 3,094,960,515 163,680,065 225,224,984 3,483,865,563
Deposit from customers 1,813,042,872 204,070,854 72,083,559 2,089,197,286
Total liabilities 2,673,281,895 155,057,459 201,031,629 3,029,370,984
Net assets 421,678,619 8,622,606 24,790,648 455,091,873
No revenue from transaction with a single external customer or a group of connected economic entities or counterparty amounted to 10% or more of the group's totalrevenue in year ended 31 December 2017 and for the year ended 31 December 2016. Information on revenue from external customers for each product and service hadnot been disclosed as the information is not readily available to the chief operating decision maker and the cost to develop is considered excessive.
173

Access Bank Plc
Consolidated and separate financial statementsFor the year ended 31 December 2017
8 Interest income
Group Group Bank Bank
In thousands of Naira December 2017 December 2016 December 2017 December 2016
Interest income
Cash and balances with banks 3,478,085 1,929,092 2,385,767 1,328,371
Loans and advances to banks 2,322,596 1,587,816 112,345 149,624
Loans and advances to customers 230,824,330 198,886,057 202,309,037 172,571,696
Investment securities
-Available for sale 31,226,746 16,769,084 29,005,464 15,366,667
-Held for trading 25,493,287 7,896,097 25,493,287 7,876,048
-Held to maturity 26,509,358 20,218,489 15,364,740 13,502,050
319,854,402 247,286,634 274,670,641 210,794,456
Interest expense
Deposit from financial institutions 16,715,851 7,434,354 14,788,823 6,822,272
Deposit from customers 91,365,483 77,187,483 81,326,332 60,921,911
Debt securities issued 35,947,693 18,369,256 35,947,693 13,569,723
Interest bearing borrowings and other borrowed funds 12,373,830 5,147,782 11,070,759 13,463,144
156,402,857 108,138,875 143,133,607 94,777,050
Net interest income 163,451,545 139,147,759 131,537,034 116,017,406
9 Net impairment charge on financial assets
Group Group Bank Bank
In thousands of Naira December 2017 December 2016 December 2017 December 2016
(34,466,868) (21,952,819) (29,149,848) (17,641,127)
(a) The additional impairment recognised during the year was a result of deterioration of the credit quality of risk asset.
10 Fee and commission income
Group Group Bank Bank
In thousands of Naira December 2017 December 2016 December 2017 December 2016
Credit related fees and commissions 24,453,050 17,921,606 21,072,063 12,487,249
Account maintenance charge and handling commission 6,454,479 2,615,538 5,859,439 2,203,851
Commission on bills and letters of credit 3,499,032 2,930,468 3,499,032 2,632,733
Commissions on collections 155,278 105,197 155,278 71,022
Commission on other financial services 10,043,893 3,324,878 3,139,616 1,664,160
Commission on virtual products 2,155,190 4,102,877 2,155,190 3,005,484
Commission on foreign currency denominated transactions 3,977,588 2,819,128 3,977,588 2,569,588
Channels and other E-business income 5,790,931 21,296,440 5,782,886 21,102,094
Retail account charges 144,893 324,368 144,893 256,303
56,674,334 55,440,500 45,785,985 45,992,484
17,151,635 19,431,462 15,507,373
Interest income for the year ended 31 December 2017 includes interest accrued on impaired financial assets of Group: N1.8Bn (31 December 2016:N2.24Bn) and Bank: N848Mn (31 December 2016: N1.74Bn).
Additional collective impairment charges on loans and advancesto banks(note 22)
(32,766,818)
(14,300) (18,120) (14,300)(18,120)
Additional specific impairment charges on loans and advances tocustomers (see note 23) (a) (17,874,149)
(81,718)(1,132,010)
The increase in interest income is attributable to the increase in value of loans and advances to customers and repricing.
Credit related fees and commissions are fees charged to corporate customers other than fees included in determining the effective interest rates relating toloans and advances carried at amortized cost.
Channels and other E-business income include income from electronic channels, card products and related services.
(13,846,554)
Additional collective impairment charges on loans and advancesto customers (note 23)
(2,742,435)
(29,365,940)
(2,458,338)
Additional (impairment)/write back on financial assets in otherassets (see note 26) (549,920) 315,930 (1,321,935)(1,321,935)
174

Access Bank Plc
Consolidated and separate financial statementsFor the year ended 31 December 2017
11 Net (loss)/gain on investment securities
a Net (loss)/gain on financial instruments designated as held for trading
Group Group Bank Bank
In thousands of Naira December 2017 December 2016 December 2017 December 2016
Fixed income securities 5,642,926 3,257,368 5,354,665 3,219,242
Derivative instruments (39,272,532) 50,105,544 (38,413,712) 50,061,509
(33,629,606) 53,362,912 (33,059,046) 53,280,751
b Net gains on financial instruments held as available for sale
Group Group Bank Bank
In thousands of Naira December 2017 December 2016 December 2017 December 2016
Fixed income securities 226,381 1,688,166 226,381 1,688,166
226,381 1,688,166 226,381 1,688,166
Total (33,403,225) 55,051,078 (32,832,665) 54,968,917
12 Net foreign exchange income/(loss)
Group Group Bank Bank
In thousands of Naira December 2017 December 2016 December 2017 December 2016
Foreign exchange trading income (net) 120,262,351 8,844,295 116,147,446 5,232,111
(12,330,254) (5,246,704) (12,526,107) (5,326,545)
107,932,097 3,597,591 103,621,339 (94,434)
13 Other operating income
Group Group Bank Bank
In thousands of Naira December 2017 December 2016 December 2017 December 2016
Dividends on available for sale equity securities 2,357,175 860,339 2,357,175 860,339
Gain on disposal of property and equipment 10,090 167,340 902 143,985
Rental income 23,973 43,839 23,973 36,509
Bad debt recovered 606,397 808,458 575,787 631,191
Cash management charges 269,671 265,683 269,671 265,683
Income from agency and brokerage 105,231 147,850 105,231 136,651
Income from asset management 3,274,157 1,030,994 3,274,157 1,030,994
Income from other investments 1,221,834 271,270 159,736 24,914
Income from disposal of available for sale securities (a) - 16,206,410 - 16,206,410
Income from other finacial services 149,643 142,795 149,643 2,873
8,018,171 19,944,978 6,916,275 19,339,549
14 Personnel expenses
Group Group Bank Bank
December 2017 December 2016 December 2017 December 2016
In thousands of Naira
Wages and salaries 51,643,332 48,450,043 39,220,187 39,323,574
753,058 1,196,994 753,058 1,196,995
Contributions to defined contribution plans 1,239,712 1,087,431 776,407 748,241
Restricted share performance plan (b) 1,170,693 1,061,070 1,023,860 884,777
54,806,795 51,795,538 41,773,512 42,153,587
Net (loss)/gains on financial instruments classified as held for trading includes the gains and losses arising both on the purchase and sale of tradinginstruments and from changes in fair value.
Increase in liability for long term incentive plan(see note 37 (a) (i))
(a) In 2016, the income from sale of other investments represents a gain of N16.2bn on the divestment of the Bank's 17.65 percent equity stake inStanbicIBTC Pension Managers. This divestment was done in compliance with the Central Bank of Nigeria (CBN) directive.
(Loss)/gain on financial instrument relates to fair value increase/(decrease) arising from derivative instruments to which the bank is a party in the normalcourse of business and are held at fair value. Fair value decrease would arise from the change in rate and maturity. Derivative financial instrumentsconsist of forward, swap and future contracts.
Unrealised foreign exchange loss on revaluation
Foreign exchange trading income includes realised gains on derivatives that matured during the year.
175
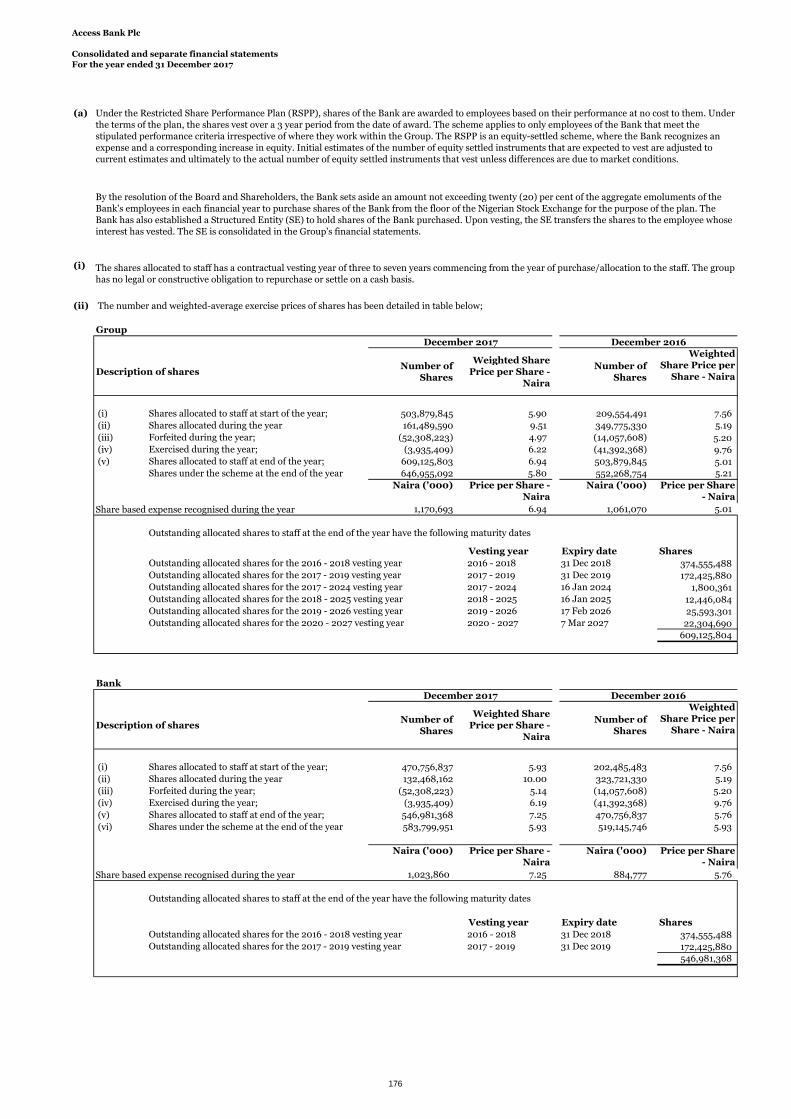
Access Bank Plc
Consolidated and separate financial statementsFor the year ended 31 December 2017
(a)
(i)
(ii) The number and weighted-average exercise prices of shares has been detailed in table below;
Group
Description of sharesNumber of
Shares
Weighted SharePrice per Share -
Naira
Number ofShares
WeightedShare Price per
Share - Naira
(i) Shares allocated to staff at start of the year; 503,879,845 5.90 209,554,491 7.56
(ii) Shares allocated during the year 161,489,590 9.51 349,775,330 5.19
(iii) Forfeited during the year; (52,308,223) 4.97 (14,057,608) 5.20(iv) Exercised during the year; (3,935,409) 6.22 (41,392,368) 9.76(v) Shares allocated to staff at end of the year; 609,125,803 6.94 503,879,845 5.01
Shares under the scheme at the end of the year 646,955,092 5.80 552,268,754 5.21
Naira ('000) Price per Share -Naira
Naira ('000) Price per Share- Naira
Share based expense recognised during the year 1,170,693 6.94 1,061,070 5.01
Outstanding allocated shares to staff at the end of the year have the following maturity dates
Vesting year Expiry date Shares
Outstanding allocated shares for the 2016 - 2018 vesting year 2016 - 2018 31 Dec 2018 374,555,488Outstanding allocated shares for the 2017 - 2019 vesting year 2017 - 2019 31 Dec 2019 172,425,880Outstanding allocated shares for the 2017 - 2024 vesting year 2017 - 2024 16 Jan 2024 1,800,361Outstanding allocated shares for the 2018 - 2025 vesting year 2018 - 2025 16 Jan 2025 12,446,084Outstanding allocated shares for the 2019 - 2026 vesting year 2019 - 2026 17 Feb 2026 25,593,301Outstanding allocated shares for the 2020 - 2027 vesting year 2020 - 2027 7 Mar 2027 22,304,690
609,125,804
Bank
Description of sharesNumber of
Shares
Weighted SharePrice per Share -
Naira
Number ofShares
WeightedShare Price per
Share - Naira
(i) Shares allocated to staff at start of the year; 470,756,837 5.93 202,485,483 7.56
(ii) Shares allocated during the year 132,468,162 10.00 323,721,330 5.19
(iii) Forfeited during the year; (52,308,223) 5.14 (14,057,608) 5.20
(iv) Exercised during the year; (3,935,409) 6.19 (41,392,368) 9.76
(v) Shares allocated to staff at end of the year; 546,981,368 7.25 470,756,837 5.76
(vi) Shares under the scheme at the end of the year 583,799,951 5.93 519,145,746 5.93
Naira ('000) Price per Share -Naira
Naira ('000) Price per Share- Naira
Share based expense recognised during the year 1,023,860 7.25 884,777 5.76
Outstanding allocated shares to staff at the end of the year have the following maturity dates
Vesting year Expiry date Shares
Outstanding allocated shares for the 2016 - 2018 vesting year 2016 - 2018 31 Dec 2018 374,555,488Outstanding allocated shares for the 2017 - 2019 vesting year 2017 - 2019 31 Dec 2019 172,425,880
546,981,368
Under the Restricted Share Performance Plan (RSPP), shares of the Bank are awarded to employees based on their performance at no cost to them. Underthe terms of the plan, the shares vest over a 3 year period from the date of award. The scheme applies to only employees of the Bank that meet thestipulated performance criteria irrespective of where they work within the Group. The RSPP is an equity-settled scheme, where the Bank recognizes anexpense and a corresponding increase in equity. Initial estimates of the number of equity settled instruments that are expected to vest are adjusted tocurrent estimates and ultimately to the actual number of equity settled instruments that vest unless differences are due to market conditions.
By the resolution of the Board and Shareholders, the Bank sets aside an amount not exceeding twenty (20) per cent of the aggregate emoluments of theBank's employees in each financial year to purchase shares of the Bank from the floor of the Nigerian Stock Exchange for the purpose of the plan. TheBank has also established a Structured Entity (SE) to hold shares of the Bank purchased. Upon vesting, the SE transfers the shares to the employee whoseinterest has vested. The SE is consolidated in the Group's financial statements.
The shares allocated to staff has a contractual vesting year of three to seven years commencing from the year of purchase/allocation to the staff. The grouphas no legal or constructive obligation to repurchase or settle on a cash basis.
December 2016December 2017
December 2017 December 2016
176

Access Bank Plc
Consolidated and separate financial statementsFor the year ended 31 December 2017
Group Group Bank Bank
December 2017 December 2016 December 2017 December 2016
Years Years Years YearsWeighted average contractual life of remaining shares 1.70 1.64 1.32 1.63
ii. The average number of persons other than directors, in employment at the Group level during the year comprise:
Group Group Bank Bank
December 2017 December 2016 December 2017 December 2016
Number Number Number NumberManagerial 309 292 241 233
Other staff 3,650 3,797 2,772 2,723
3,959 4,089 3,013 2,956
iii.
Group Group Bank Bank
December 2017 December 2016 December 2017 December 2016
Number Number Number Number
Below N900,000 236 306 - -
N900,001 - N1,990,000 291 408 10 9
N1,990,001 - N2,990,000 104 158 - -
N2,990,001 - N3,910,000 84 71 - -
N3,910,001 - N4,740,000 1,006 1,040 968 1,028
N4,740,001 - N5,740,000 24 21 1 -
N5,740,001 - N6,760,000 681 660 651 648
N6,760,001 - N7,489,000 17 31 - -
N7,489,001 - N8,760,000 453 481 437 446
N8,760,001 - N9,190,000 362 311 353 306
N9,190,001 - N11,360,000 33 29 - 1
N11,360,001 - N14,950,000 378 296 352 276
N14,950,001 - N17,950,000 12 10 - -
N17,950,001 - N21,940,000 187 177 173 167
N21,940,001 - N26,250,000 40 43 35 38
N26,250,001 - N30,260,000 8 3 - -
N30,261,001 - N45,329,000 43 44 33 37
3,959 4,089 3,013 2,956
15 Other operating expenses
Group Group Bank Bank
In thousands of Naira December 2017 December 2016 December 2017 December 2016
Premises and equipment costs 9,950,906 8,170,973 8,033,103 6,627,493
Professional fees 5,679,646 2,119,700 5,513,453 1,558,808
Insurance 1,332,628 1,093,148 1,068,010 893,562
Business travel expenses 6,766,599 6,980,197 6,303,654 6,442,06415,474,803 12,059,720 15,474,803 12,059,720
Deposit insurance premium 5,952,588 6,002,813 5,952,588 6,002,813
Auditor's remuneration 529,006 460,182 380,000 350,000
Administrative expenses 19,027,793 16,513,674 17,904,438 15,347,843
Board expenses 671,633 526,108 521,268 386,684
Communication expenses 4,263,329 2,523,023 3,031,550 1,698,749
IT and e-business expenses 16,077,936 13,983,760 13,559,140 12,246,639
Outsourcing costs 8,277,398 7,626,411 7,305,290 6,750,086
Advertisements and marketing expenses 6,038,146 4,211,075 4,812,368 3,771,607
Recruitment and training 2,424,516 1,639,273 2,207,928 1,342,458
Events, charities and sponsorship 5,462,666 2,618,909 4,106,144 2,447,297
Periodicals and subscriptions 1,142,566 1,007,974 984,488 869,154
Security expenses 3,518,297 3,104,455 3,201,277 2,691,644
Cash processing and management cost 2,148,653 1,671,083 1,846,990 1,548,319
Stationeries, postage and printing 1,532,751 1,576,253 1,330,451 1,205,990
Office provisions and entertainment 694,447 475,289 303,389 297,801
Net litigations claims (see note 34(i) 152,923 49,496 152,923 49,496
117,119,230 94,413,516 103,993,256 84,588,227
(a)
Employees, other than directors, earning more than N900,000 per annum, whose duties were wholly or mainly discharged in Nigeria, receivedremuneration (excluding pension contributions and certain benefits) in the following ranges:
Asset Management Corporation of Nigeria (AMCON) surcharge(see note (a) below)
This represents the Group’s contribution to AMCON’s sinking fund for the year ended 31 December 2017. All deposit money banks in Nigeria are requiredto contribute 0.5% of total assets as at the preceding year end to AMCON's sinking fund in line with existing guidelines. It is non-refundable and does notrepresent any ownership interest nor does it confer any rights or obligations (save to pay the levy) on the contributor.
The weighted average remaining contractual life of the outstanding allocated shares is :
177

Access Bank Plc
Consolidated and separate financial statementsFor the year ended 31 December 2017
16 Income tax expense
Group Group Bank Bank
December 2017 December 2016 December 2017 December 2016
In thousands of Naira
Current tax expense
Corporate income tax 9,124,532 6,096,035 5,640,954 3,571,312
IT tax 670,435 805,796 670,435 805,796
Education tax 1,081,830 - 1,081,841 -
Capital gains tax 11,145 3,808 11,145 3,808
Prior year’s under provision 1,841,940 - 1,841,940 -
12,729,882 6,905,639 9,246,315 4,380,916
Deferred tax expense
Origination of temporary differences 5,351,746 11,994,470 4,558,364 12,172,525
Income tax expense 18,081,628 18,900,109 13,804,679 16,553,441
Items included in OCI 188,399 - 188,399 -
Income tax expense 18,270,027 18,900,109 13,993,078 16,553,441
13,804,679.00
The movement in the current income tax liability is as follows:
Group Group Bank Bank
December 2017 December 2016 December 2017 December 2016
Balance at the beginning of the year 5,938,662 7,780,824 5,004,160 6,442,311
Tax paid (9,458,675) (8,007,140) (7,860,615) (5,222,302)
Income tax charge 10,887,942 6,905,639 7,404,375 4,380,916
Prior year’s under provision 1,878,365 - 1,841,940 -
Witholding tax utilisation (1,841,940) (596,764) (1,841,940) (596,765)
Reclassifications - - - -
Translation adjustments 117,503 (143,897) - -
Income tax receivable (32,273) - - -
Balance at the end of the year 7,489,586 5,938,662 4,547,920 5,004,160
Income tax liability is to be settled within one year
Group Group Group Group
In thousands of Naira December 2017 December 2017 December 2016 December 2016
Profit before income tax 80,072,482 90,339,456
Income tax using the domestic tax rate 30% 24,021,745 30% 27,101,837
Effect of tax rates in foreign jurisdictions -1% (444,737) 0% (399,963)
Information technology tax 1% 670,435 1% 805,796
Capital allowance utilised for the year 0% - 0% -
Non-deductible expenses 33% 26,198,636 20% 18,083,506
Tax exempt income -31% (24,663,027) -36% (32,335,829)
Tax losses unutilised 0% - 0% -
Education tax levy 1% 1,081,841 0% -
Capital gain tax 0% 11,145 0% 3,808
Under provided in prior years -14% (10,818,414) 0% -
Impact of dividend 3% 2,024,004 6% 5,640,954
Effective tax rate 23% 18,081,628 21% 18,900,109
Bank Bank Bank Bank
December 2017 December 2017 December 2016 December 2016
In thousands of Naira
Profit before income tax - 67,043,501 - 80,579,576Income tax using the domestic tax rate 30% 20,113,050 30% 24,173,873Effect of tax rates in foreign jurisdictions 0% - 0% -Information technology tax 1% 670,435 1% 805,796
Non-deductible expenses 37% 25,140,338 23% 18,188,958
Tax exempt income -36% (24,417,721) -40% (32,259,947)
Education tax levy 2% 1,081,841 0% -
Capital gain tax 0% 11,145 0% 3,808
Under provided in prior years -16% (10,818,414) 0% -
Impact of dividend 3% 2,024,004 7% 5,640,953
Effective tax rate 21% 13,804,679 21% 16,553,441
178
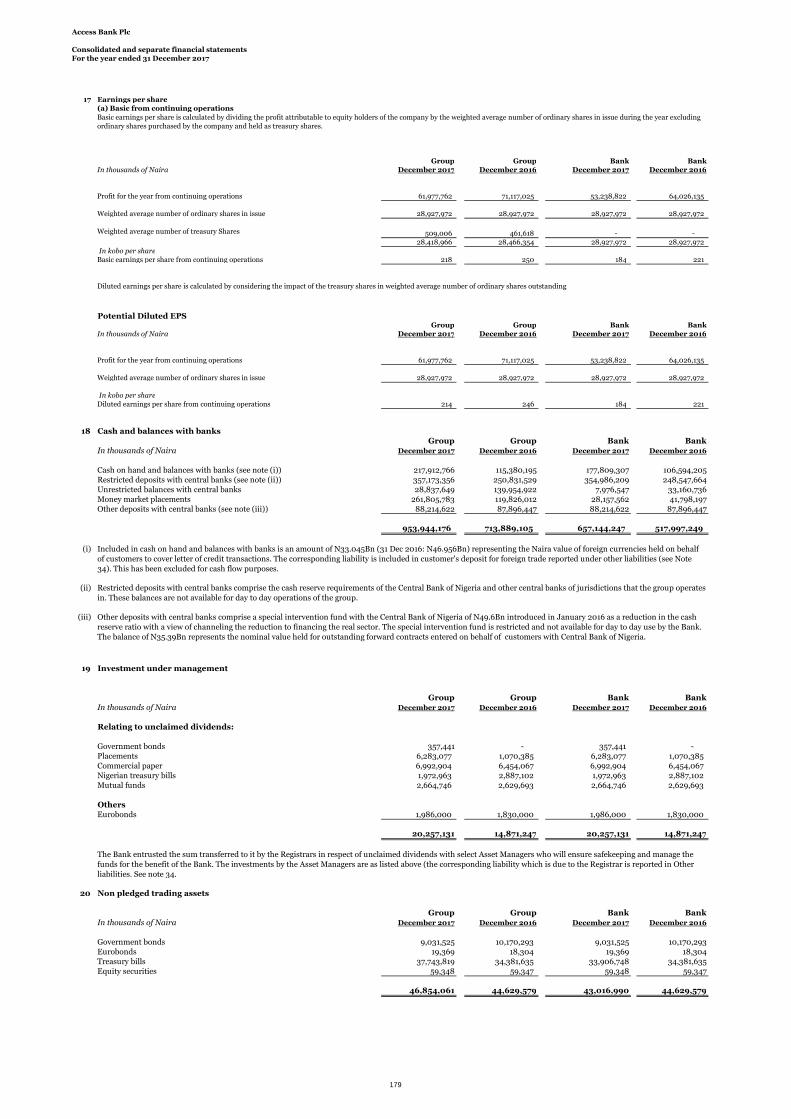
Access Bank Plc
Consolidated and separate financial statementsFor the year ended 31 December 2017
17 Earnings per share(a) Basic from continuing operations
Group Group Bank BankIn thousands of Naira December 2017 December 2016 December 2017 December 2016
Profit for the year from continuing operations 61,977,762 71,117,025 53,238,822 64,026,135
Weighted average number of ordinary shares in issue 28,927,972 28,927,972 28,927,972 28,927,972
Weighted average number of treasury Shares 509,006 461,618 - -28,418,966 28,466,354 28,927,972 28,927,972
In kobo per shareBasic earnings per share from continuing operations 218 250 184 221
Potential Diluted EPSGroup Group Bank Bank
In thousands of Naira December 2017 December 2016 December 2017 December 2016
Profit for the year from continuing operations 61,977,762 71,117,025 53,238,822 64,026,135
Weighted average number of ordinary shares in issue 28,927,972 28,927,972 28,927,972 28,927,972
In kobo per shareDiluted earnings per share from continuing operations 214 246 184 221
18 Cash and balances with banksGroup Group Bank Bank
In thousands of Naira December 2017 December 2016 December 2017 December 2016
Cash on hand and balances with banks (see note (i)) 217,912,766 115,380,195 177,809,307 106,594,205Restricted deposits with central banks (see note (ii)) 357,173,356 250,831,529 354,986,209 248,547,664Unrestricted balances with central banks 28,837,649 139,954,922 7,976,547 33,160,736Money market placements 261,805,783 119,826,012 28,157,562 41,798,197Other deposits with central banks (see note (iii)) 88,214,622 87,896,447 88,214,622 87,896,447
953,944,176 713,889,105 657,144,247 517,997,249
(i)
(ii)
(iii)
19 Investment under management
Group Group Bank BankIn thousands of Naira December 2017 December 2016 December 2017 December 2016
Relating to unclaimed dividends:
Government bonds 357,441 - 357,441 -Placements 6,283,077 1,070,385 6,283,077 1,070,385Commercial paper 6,992,904 6,454,067 6,992,904 6,454,067Nigerian treasury bills 1,972,963 2,887,102 1,972,963 2,887,102Mutual funds 2,664,746 2,629,693 2,664,746 2,629,693
OthersEurobonds 1,986,000 1,830,000 1,986,000 1,830,000
20,257,131 14,871,247 20,257,131 14,871,247
20 Non pledged trading assets
Group Group Bank BankIn thousands of Naira December 2017 December 2016 December 2017 December 2016
Government bonds 9,031,525 10,170,293 9,031,525 10,170,293Eurobonds 19,369 18,304 19,369 18,304Treasury bills 37,743,819 34,381,635 33,906,748 34,381,635Equity securities 59,348 59,347 59,348 59,347
46,854,061 44,629,579 43,016,990 44,629,579
The Bank entrusted the sum transferred to it by the Registrars in respect of unclaimed dividends with select Asset Managers who will ensure safekeeping and manage thefunds for the benefit of the Bank. The investments by the Asset Managers are as listed above (the corresponding liability which is due to the Registrar is reported in Otherliabilities. See note 34.
Basic earnings per share is calculated by dividing the profit attributable to equity holders of the company by the weighted average number of ordinary shares in issue during the year excludingordinary shares purchased by the company and held as treasury shares.
Included in cash on hand and balances with banks is an amount of N33.045Bn (31 Dec 2016: N46.956Bn) representing the Naira value of foreign currencies held on behalfof customers to cover letter of credit transactions. The corresponding liability is included in customer's deposit for foreign trade reported under other liabilities (see Note34). This has been excluded for cash flow purposes.
Restricted deposits with central banks comprise the cash reserve requirements of the Central Bank of Nigeria and other central banks of jurisdictions that the group operatesin. These balances are not available for day to day operations of the group.
Other deposits with central banks comprise a special intervention fund with the Central Bank of Nigeria of N49.6Bn introduced in January 2016 as a reduction in the cashreserve ratio with a view of channeling the reduction to financing the real sector. The special intervention fund is restricted and not available for day to day use by the Bank.The balance of N35.39Bn represents the nominal value held for outstanding forward contracts entered on behalf of customers with Central Bank of Nigeria.
Diluted earnings per share is calculated by considering the impact of the treasury shares in weighted average number of ordinary shares outstanding
179

Access Bank Plc
Consolidated and separate financial statementsFor the year ended 31 December 2017
21 Derivative financial instruments
In thousands of Naira
Group
Foreign exchange derivatives
Total derivative assets 426,342,495 93,419,293 709,617,854 156,042,984
280,403,522 8,311,492 390,410,492 65,280,723
145,938,973 85,107,801 319,207,362 90,762,261
237,298,924 (5,332,177) 223,456,040 (30,444,501)
145,200,611 (1,314,399) 41,349,705 (10,668,412)
92,098,313 (4,017,778) 182,106,335 (19,776,089)
Bank
Foreign exchange derivatives
390,798,265 92,390,219 698,771,698 155,772,662
145,938,973 8,311,492 319,207,362 65,280,723
244,859,292 84,078,727 379,564,336 90,491,939
233,911,428 (5,306,450) 201,664,660 (30,275,181)
145,200,611 (1,314,399) 41,349,705 (10,668,411)
88,710,817 (3,992,051) 160,314,955 (19,606,770)
22 Loans and advances to banks
Group Group Bank Bank
December 2017 December 2016 December 2017 December 2016
In thousands of Naira
Loans and advances to banks 68,155,581 45,226,388 101,470,507 104,029,960
Less collective allowances for impairment (41,506) (23,386) (41,506) (23,386)
68,114,076 45,203,002 101,429,001 104,006,574
Collective allowances for impairment on loans and advances to banks
Group Group Bank Bank
December 2017 December 2016 December 2017 December 2016
In thousands of Naira
Balance beginning of year 23,386 9,086 23,386 9,086
- Charge for the year 18,120 14,300 18,120 14,300
Balance end of year 41,506 23,386 41,506 23,386
Non-deliverable Future contracts
Forward and Swap contract
Total derivative assets
Forward and Swap contract
Total derivative liabilities
Fair ValueAssets/
(Liabilities)
December 2017 December 2016
Notionalamount
Fair ValueAssets/
(Liabilities)
Notionalamount
Total derivative liabilities
Non-deliverable Future contracts
Forward and Swap contract
Derivative financial instruments consist of forward,swap and future contracts. These are held for day to day cash management rather than for trading purposes andare held at fair value. The contracts have intended settlement dates of between 30 days and two years. All derivative contracts are considered to be valued withreference to data obtained from the Financial Market Dealer Quotation (FMDQ).
Included in other liabilities are security deposit for Swap and future deals which are deposits (collaterised deposits) by counter parties.
The movement in fair value is as a result of a depreciation of the functional currency of the group (Naira) within the year and a decrease in the volume oftransactions.
Forward and Swap contract
Fair ValueAssets/
(Liabilities)
December 2017 December 2016
Non-deliverable Future contracts
Non-deliverable Future contracts
Notionalamount
Fair ValueAssets/
(Liabilities)
Notionalamount
180

Access Bank Plc
Consolidated and separate financial statementsFor the year ended 31 December 2017
8,197.0
23 Loans and advances to customers
a Group
Specific Collective Total
December 2017 Gross impairment impairment impairment Carrying
In thousands of Naira amount allowance allowance allowance amount
Loans to individuals
Retail Exposures
Auto Loan (note 23c) 1,878,145 - (28,513) (28,513) 1,849,633
Credit Card 3,019,121 (4,573) (49,438) (54,011) 2,965,110
Finance Lease (note 23c) 1,226,099 (5,475) (2,528) (8,003) 1,218,096
Mortgage Loan 33,118,619 - (78,340) (78,340) 33,040,279
Overdraft 2,494,735 (138,278) (181,960) (320,238) 2,174,497
Personal Loan 17,615,988 (224,442) (253,600) (478,042) 17,137,946
Term Loan 7,175,548 (40,237) (68,982) (109,219) 7,066,329
Time Loan 902,195 - (17,426) (17,426) 884,769
Loans to corporate entities and other organizations
Non-Retail Exposures
Auto Loan (note 23c) 1,620,583 - (20,156) (20,156) 1,600,427
Credit Card 453,502 (1,036) (6,950) (7,985) 445,517
Finance Lease (note 23c) 3,620,889 (142,940) (53,943) (196,884) 3,424,005
Mortgage Loan 10,584,856 - (3,205) (3,205) 10,581,651
Overdraft 199,670,621 (11,143,666) (6,440,692) (17,584,359) 182,086,262
Term Loan 1,269,661,821 (24,099,294) (12,560,981) (36,660,276) 1,233,001,546
Time Loan 506,812,720 (5,985,572) (2,315,587) (8,301,159) 498,511,560
2,059,855,443 (41,785,515) (22,082,301) (63,867,816) 1,995,987,627
Group
Specific Collective Total
December 2016 Gross impairment impairment impairment Carrying
In thousands of Naira amount allowance allowance allowance amount
Loans to individuals
Retail Exposures
Auto Loan (note 23c) 2,511,013 - (42,628) (42,628) 2,468,384
Credit Card 3,475,443 (4,367) (58,216) (62,583) 3,412,860
Finance Lease (note 23c) 60,912 - (1,053) (1,053) 59,859
Mortgage Loan 24,375,564 - (79,867) (79,867) 24,295,697
Overdraft 5,639,049 (264,216) (538,680) (802,896) 4,836,153
Personal Loan 18,754,870 (286,847) (395,950) (682,798) 18,072,072
Term Loan 6,964,075 - (46,451) (46,451) 6,917,624
Time Loan 721,711 - (11,667) (11,667) 710,044
Loans to corporate entities and other organizations
Non-Retail Exposures
Auto Loan (note 23c) 2,003,352 - (20,988) (20,988) 1,982,363
Credit Card 576,553 - (10,178) (10,178) 566,375
Finance Lease (note 23c) 3,946,347 - (18,308) (18,308) 3,928,039
Mortgage Loan 5,929,037 - (4,176) (4,176) 5,924,861
Overdraft 181,242,213 (8,677,151) (2,111,511) (10,788,662) 170,453,553
Term Loan 1,102,912,471 (5,523,054) (15,587,793) (21,110,847) 1,081,801,625
Time Loan 486,052,854 (92) (2,023,099) (2,023,191) 484,029,664
1,845,165,464 (14,755,727) (20,950,566) (35,706,293) 1,809,459,172
Impairment on loans and advances to customers
In thousands of Naira December 2017 December 2016 December 2017 December 2016
Balance beginning of year 14,755,727 10,482,678 20,950,565 18,208,130
Impairment loss for the year:
- Charge for the year 32,766,818 17,874,149 1,132,010 2,742,435
Write-offs (5,737,029) (13,601,100) (273) -
Balance end of year 41,785,516 14,755,727 22,082,302 20,950,565
Specific allowances Collective allowances
181
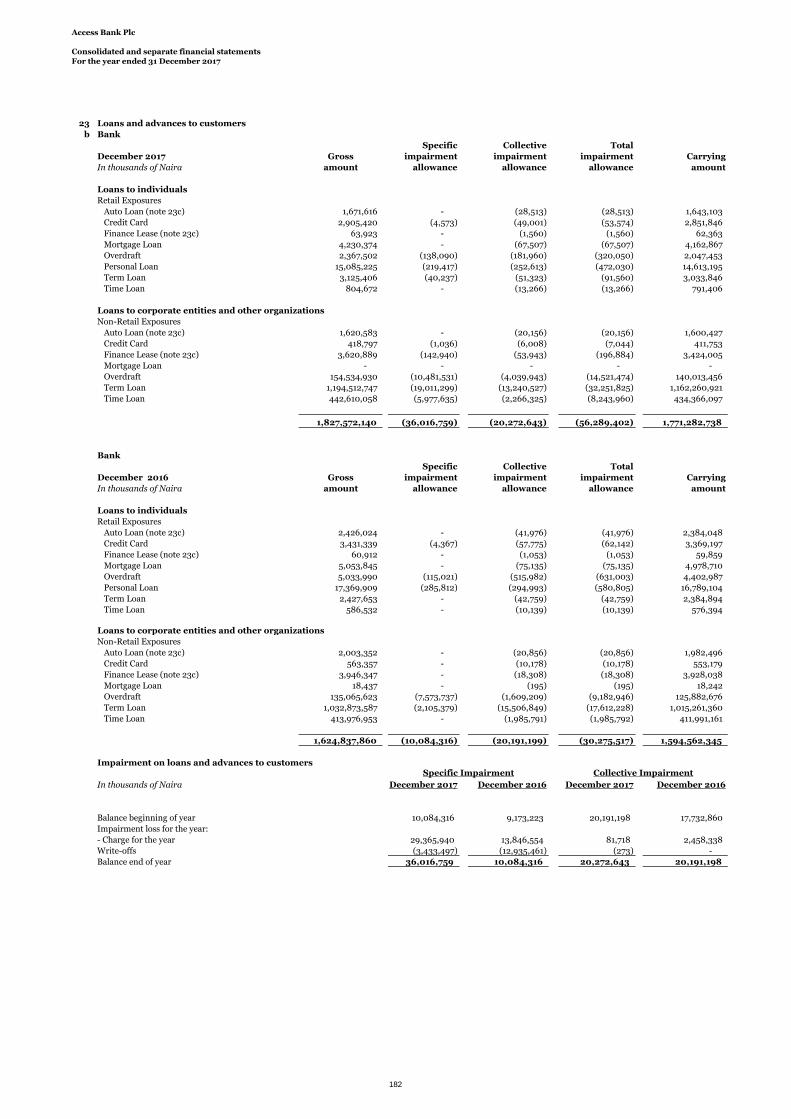
Access Bank Plc
Consolidated and separate financial statementsFor the year ended 31 December 2017
23 Loans and advances to customers
b Bank
Specific Collective Total
December 2017 Gross impairment impairment impairment Carrying
In thousands of Naira amount allowance allowance allowance amount
Loans to individuals
Retail Exposures
Auto Loan (note 23c) 1,671,616 - (28,513) (28,513) 1,643,103
Credit Card 2,905,420 (4,573) (49,001) (53,574) 2,851,846
Finance Lease (note 23c) 63,923 - (1,560) (1,560) 62,363
Mortgage Loan 4,230,374 - (67,507) (67,507) 4,162,867
Overdraft 2,367,502 (138,090) (181,960) (320,050) 2,047,453
Personal Loan 15,085,225 (219,417) (252,613) (472,030) 14,613,195
Term Loan 3,125,406 (40,237) (51,323) (91,560) 3,033,846
Time Loan 804,672 - (13,266) (13,266) 791,406
Loans to corporate entities and other organizations
Non-Retail Exposures
Auto Loan (note 23c) 1,620,583 - (20,156) (20,156) 1,600,427
Credit Card 418,797 (1,036) (6,008) (7,044) 411,753
Finance Lease (note 23c) 3,620,889 (142,940) (53,943) (196,884) 3,424,005
Mortgage Loan - - - - -
Overdraft 154,534,930 (10,481,531) (4,039,943) (14,521,474) 140,013,456
Term Loan 1,194,512,747 (19,011,299) (13,240,527) (32,251,825) 1,162,260,921
Time Loan 442,610,058 (5,977,635) (2,266,325) (8,243,960) 434,366,097
1,827,572,140 (36,016,759) (20,272,643) (56,289,402) 1,771,282,738
Bank
Specific Collective Total
December 2016 Gross impairment impairment impairment Carrying
In thousands of Naira amount allowance allowance allowance amount
Loans to individuals
Retail Exposures
Auto Loan (note 23c) 2,426,024 - (41,976) (41,976) 2,384,048
Credit Card 3,431,339 (4,367) (57,775) (62,142) 3,369,197
Finance Lease (note 23c) 60,912 - (1,053) (1,053) 59,859
Mortgage Loan 5,053,845 - (75,135) (75,135) 4,978,710
Overdraft 5,033,990 (115,021) (515,982) (631,003) 4,402,987
Personal Loan 17,369,909 (285,812) (294,993) (580,805) 16,789,104
Term Loan 2,427,653 - (42,759) (42,759) 2,384,894
Time Loan 586,532 - (10,139) (10,139) 576,394
Loans to corporate entities and other organizations
Non-Retail Exposures
Auto Loan (note 23c) 2,003,352 - (20,856) (20,856) 1,982,496
Credit Card 563,357 - (10,178) (10,178) 553,179
Finance Lease (note 23c) 3,946,347 - (18,308) (18,308) 3,928,038
Mortgage Loan 18,437 - (195) (195) 18,242
Overdraft 135,065,623 (7,573,737) (1,609,209) (9,182,946) 125,882,676
Term Loan 1,032,873,587 (2,105,379) (15,506,849) (17,612,228) 1,015,261,360
Time Loan 413,976,953 - (1,985,791) (1,985,792) 411,991,161
1,624,837,860 (10,084,316) (20,191,199) (30,275,517) 1,594,562,345
Impairment on loans and advances to customers
In thousands of Naira December 2017 December 2016 December 2017 December 2016
Balance beginning of year 10,084,316 9,173,223 20,191,198 17,732,860
Impairment loss for the year:
- Charge for the year 29,365,940 13,846,554 81,718 2,458,338
Write-offs (3,433,497) (12,935,461) (273) -
Balance end of year 36,016,759 10,084,316 20,272,643 20,191,198
Specific Impairment Collective Impairment
182

Access Bank Plc
Consolidated and separate financial statementsFor the year ended 31 December 2017
23(c) Advances under finance leases
Group Group Bank Bank
In thousands of Naira December 2017 December 2016 December 2017 December 2016
Gross investment in finance lease, receivable 10,199,511 10,459,206 8,389,355 10,327,104
Unearned finance income on finance leases (1,853,795) (1,937,583) (1,412,345) (1,890,469)
Net investment in finance leases 8,345,716 8,521,623 6,977,010 8,436,635
Gross investment in finance leases, receivable:
Less than one year 965,517 2,217,863 929,601 2,286,156
Between one and five years 9,013,294 7,976,709 7,319,275 7,782,749
Later than five years 136,735 264,634 140,479 258,199
10,115,546 10,459,206 8,389,355 10,327,104
Unearned finance income on finance leases (1,769,831) (1,937,583) (1,412,345) (1,890,469)
Present value of minimum lease payments 8,345,715 8,521,623 6,977,010 8,436,635
- Less than one year 784,328 2,018,383 874,224 2,091,526
- Between one and five years 7,468,946 6,215,439 5,992,296 6,064,306
- Later than five years 92,443 287,801 110,489 280,803
24 Pledged assets
Group Group Bank Bank
In thousands of Naira December 2017 December 2016 December 2017 December 2016
Treasury bills 258,672,815 188,239,520 252,061,738 188,239,520
Government bonds 188,441,589 126,707,982 188,441,589 126,707,982
447,114,404 314,947,502 440,503,327 314,947,502
Bank of Industry (BOI) 18,309,954 39,566,300 18,309,954 39,566,300
(i)
25 Investment securities
Group Group Bank Bank
Available for sale investment securities December 2017 December 2016 December 2017 December 2016
In thousands of Naira
Debt securities
Government bonds 34,112,643 11,738,700 9,319,691 546,731
Treasury bills 29,977,451 69,346,601 9,598,737 40,960,665
Eurobonds 1,572,222 2,760,661 352,100 2,760,661
Corporate bonds 3,744,387 3,431,482 3,744,387 3,431,482
State government bonds 14,650,116 14,961,006 14,650,116 14,961,006
Equity securities69,581,098 58,667,555 69,181,956 58,420,406
Unquoted equity securities at cost 3,145,697 3,145,697 3,145,697 3,145,697
156,783,614 164,051,703 109,992,684 124,226,649
(3,409,804) (3,389,059) (3,409,804) (3,389,059)
153,373,810 160,662,644 106,582,880 120,837,590
Specific allowance for impairment on available for saleinvestments
Loans and advances to customers at amortised cost include the following finance lease receivables for leases of certain property, automobile/vehicle and equipmentwhere the group is the lessor:
Present value of minimum lease payments may be analysed as:
Equity securities with readily determinable fair values (i)
The related liability for assets pledged as collateral include:
The assets pledged as collateral include assets pledged to third parties under secured borrowing with the related liability disclosed above. Also included in pledgedassets are assets pledged as collateral or security deposits to clearing house and payment agencies of N36.47bn (31 December 2016: N17.58Bn) for which there is norelated liability. The pledges have been made in the normal course of business of the Bank. In the event of default, the pledgee has the right to realise the pledgedassets.
The fair value of the unquoted equity securities carried at cost cannot be reliably estimated as there are no active market for these financial instruments; they havetherefore been disclosed at cost less impairment. These equity investments have been fully impaired and has a nil balance in the group financial statement.
183

Access Bank Plc
Consolidated and separate financial statementsFor the year ended 31 December 2017
(i) Equity securities with readily determinable fair values (carrying amount)
MTN Nigeria 8,760,176 7,451,138 8,760,176 7,451,138
Central Securities Clearing System Limited 1,343,868 1,559,612 1,343,868 1,559,612
Nigeria Interbank Settlement System Plc. 3,396,757 1,175,570 3,396,757 1,175,570
Unified Payment Services Limited 3,130,451 2,340,346 3,130,451 2,340,346
Africa Finance Corporation 50,882,911 44,230,177 50,882,911 44,230,177
E-Tranzact 1,147,387 1,147,387 1,147,387 1,147,387
14,984 10,754 14,984 10,754
130,610 130,610 130,610 130,610
Nigerian Mortage Refinance Company Plc. 93,186 93,186 93,186 93,186
Credit Reference company 281,626 281,626 281,626 281,626
Others 399,140 247,150 - -
69,581,098 58,667,555 69,181,956 58,420,406
Held to maturity investment securities
In thousands of Naira
Debt securities
Treasury bills 88,203,365 27,350,114 5,837,568 -
Federal government bonds 30,127,895 31,754,372 2,654,168 31,016,409
State government bonds 3,786,715 5,276,855 3,786,715 5,276,855
Corporate bonds 610,777 1,624,228 610,777 1,624,228
Eurobonds 2,065,195 2,445,558 2,065,195 2,445,558
124,793,947 68,451,128 14,954,423 40,363,050
Total 278,167,757 229,113,772 121,537,303 161,200,642
Specific allowance for impairment on available for sale investment securities
Group Group Bank Bank
In thousands of Naira December 2017 December 2016 December 2017 December 2016
Balance, beginning of year 3,389,059 3,326,077 3,389,059 3,326,077
Allowance written off - (21,358) - (21,358)
Revaluation difference 20,745 84,338 20,745 84,338
Balance, end of year 3,409,804 3,389,059 3,409,804 3,389,059
26 Other assets
Group Group Bank Bank
December 2017 December 2016 December 2017 December 2016
In thousands of Naira
Financial assets
Accounts receivable 29,153,379 23,063,084 15,988,773 13,804,165Receivable on E-business channels 16,502,776 2,333,865 16,502,776 2,253,689
Receivable from disposal of non-current asset - 19,341,974 - 19,341,974
Deposit for investment in AGSMEIS (i) 3,201,307 - 3,201,307 -
Subscription for investment (ii) 612,054 25,003 920,767 833,102
49,469,517 44,763,926 36,613,624 36,232,930
(i)
(ii)
Non-financial assets
Prepayments 34,611,077 20,751,237 29,329,123 16,668,917
Inventory 1,343,160 707,748 1,343,160 660,491
35,954,237 21,458,986 30,672,283 17,329,408
Gross other assets 85,423,754 66,222,912 67,285,907 53,562,338
Allowance for impairment on financial assets
Accounts receivable (2,645,320) (2,942,857) (2,071,109) (2,942,857)
Subscription for investment (25,001) (25,001) (25,001) (25,001)
82,753,433 63,255,054 65,189,797 50,594,480
Deposit for investment in AGSMEIS represents the Bank's deposit as equity investment in Agri-business/Small and Medium Enterprises Investment Scheme.As approved by the Bankers' Committee on 9th February 2017, all Deposit Money Banks are required to invest 5% of prior year's Profit After Tax as equityinvestment in the scheme.Subscription for investment balance relates to subscription for equity investments
FMDQ OTC Plc
African Export-import Bank
184

Access Bank Plc
Consolidated and separate financial statementsFor the year ended 31 December 2017
Movement in allowance for impairment on other assets:
Group Group Bank Bank
Accounts subscription for Accounts subscription for
Receivable investments Receivable investments
In thousands of Naira
Balance as at 1 January 2016 2,635,576 25,001 2,635,576 25,001
Impairment loss for the year:
- Additional provision 1,321,935 - 1,321,935 -
Net impairment 1,321,935 - 1,321,935 -
Allowance written off (1,016,504) - (1,016,504) -
Revaluation difference 1,848 - 1,848 -
Balance as at 31 December 2016/1 January 2017 2,942,855 25,001 2,942,855 25,001
Impairment loss for the year:
- Additional provision 549,920 - (315,930) -
Net impairment 549,920 - (315,930) -
Allowance written off (847,455) - (555,816) -
Balance as at 31 December 2017 2,645,320 25,001 2,071,109 25,001
Inventory consists of blank debit cards, cheque leaves, computer consumables and other stationery held by the Bank.Increase in prepayments resulted from services that have been paid in advance for the year for which the amortization will be over the relevant year of service. Theseinclude rents and advertisements.
185

Access Bank Plc
Consolidated and separate financial statementsFor the year ended 31 December 2017
27(a) Subsidiaries (with continuing operations)
(i) Group entities
Access Bank Gambia Limited Banking Gambia 88% 64%
Access Bank Sierra Leone Limited Banking Sierra Leone 97% 97%
Access Bank Rwanda Limited Banking Rwanda 75% 75%
Access Bank Zambia Banking Zambia 70% 92%
The Access Bank UK Banking United Kingdom 100% 100%
Access Bank R.D. Congo Banking Congo 99.98% 74%
Access Bank Ghana Banking Ghana 91% 91%
Access Finance B.V. Banking Netherlands 100% 100%
(ii) Structured entities:
Nature ofbusiness
Country ofincorporation December 2017 December 2016
Restricted Share Performance Plan (RSPP)Financialservices Nigeria 100% 100%
Access Finance B.V. was incorporated in 2011 and commenced operations in 2012. An obligation also exists between the Bank and Access FinanceB.V., for which Access Finance B.V. lent to the Bank the sum of USD 2,462,000 as a share premium loan. The loan agreement between both partieshowever permits that the obligation of Access Finance B.V. to grant the loan, be set off against the obligation of the Bank to repay the loan such thateach party's obligation either as a borrower or lender is discharged. In view of this, no loan payable has been recognized in the Bank's financialstatements.
The transaction for which the entity was set up matured during the year. Management has not decided on the possibility of the entity existingbeyond the maturity of the obligation.
Ownership interest
Set out below are the group's subsidiaries as at 31 December 2017. Unless otherwise stated, the subsidiaries listed below have share capitalconsisting solely of ordinary shares, which are held directly by the group and the proportion of ownership interests held equals to the voting rightsheld by the group. The country of incorporation is also their principal place of business.
There are no significant restrictions on the Group’s ability to access or use the assets and settle the liabilities of any member of the Group to theextent that regulation does not inhibit the group from having access, and in liquidation scenario, this restriction is limited to its level of investmentin the entity.There are no significant restrictions on the ability of subsidiaries to transfer funds to the Group in the form of cash dividends or repayment of loansand advances
Ownership interestNature ofbusiness
Country ofincorporation
December 2017 December 2016
186

Access Bank Plc
Consolidated and separate financial statements
For the year ended 31 December 2017
27(b) Investment in subsidiaries
Bank Bank
December 2017 December 2016
In thousands of Naira
Subsidiaries with continuing operations40,500,598 29,104,081
15,558,107 15,558,107
1,578,825 1,578,825
13,205,189 2,779,650
4,274,925 4,274,925
7,061,501 1,853,756
1,582,486 1,019,951
Investment in RSPP scheme 4,028,909 3,065,865
4,092 4,092
Balance, end of year 87,794,631 59,239,252
Access Bank, Gambia
Access Bank, UK
Access Bank, Ghana
Access Bank Rwanda
Access Bank, Congo
Access Bank, Zambia
Based on the contractual arrangements between the Group and the shareholders in each of the entities, the Group has the power to appoint andremove the majority of the board of Directors of each entity.
The relevant activities of each of the listed subsidiaries are determined by the Board of Directors of each entity based on simple majority shares.Therefore, the directors of the Group concluded that the Group has control over each of the above listed entities and were consolidated in thegroup financial statements.
Access Bank, Sierra Leone
Access Bank Finance B.V.
187

Access Bank Plc
Consolidated and separate financial statementsFor the year ended 31 December 2017
281 0 0 28 427 (c) Condensed results of consolidated entities report- absolute report- absolute
(i) The condensed financial data of the consolidated entities as at 31 December 2017, are as follows:
308 46 0.2766 0.2104 26.879 4.244 0.0461 221.976Condensed profit and loss
In thousands of naira
Operating income 14,962,209 21,529,191 3,084,907 4,172,949 1,686,079 1,028,016 986,333 - 118,255
Operating expenses (6,048,057) (14,070,445) (2,773,919) (3,410,831) (2,428,083) (798,685) (718,476) - (28,157)
Net impairment loss on financial assets - (3,062,381) (14,651) (393) (1,157,400) (22,008) (5,475) - -
Profit before tax 8,914,151 4,396,365 296,337 761,726 (1,899,404) 207,322 262,381 - 90,098
Income tax expense (1,810,740) (2,175,631) (189,704) - - (25,970) (76,147) - 1,243
Profit for the year 7,103,411 2,220,734 106,633 761,726 (1,899,404) 181,352 186,234 - 91,342
Assets
Cash and cash equivalents 311,472,705 86,741,693 15,134,815 20,494,593 13,555,223 1,958,940 1,191,427 - 502,841
Non pledged trading assets - 3,837,071 - - - - - - -
Pledged assets - - - - - 6,611,077 - - -
Derivative financial instruments 876,441 - 152,633 - - - - - -
Loans and advances to banks 163,088,579 - - - - - - - -
Loans and advances to customers 129,404,746 69,137,927 12,701,441 8,895,050 3,389,900 561,819 702,133 - -
Investment securities 63,926,977 67,369,279 4,916,259 - 16,873,602 762,287 2,782,050 - -
Other assets 2,178,222 12,335,432 779,994 1,064,059 1,952,200 1,133,583 551,709 - -
Investment in subsidiaries - - - - - - - 4,028,910 -
Property and equipment 183,100 9,540,301 447,829 1,355,224 802,356 813,711 295,397 - -
Intangible assets 324,125 330,471 635,960 108,950 117,500 84,665 31,270 - -
Deferred tax assets - 197,789 - - 482,534 - 60,079 - -
671,454,895 249,489,963 34,768,931 31,917,876 37,173,315 11,926,082 5,614,065 4,028,910 502,841
Financed by:
Deposits from banks 387,555,089 14,810,633 - - 2,136,129 18,579 - - -
Deposits from customers 203,729,763 167,004,704 28,071,794 18,694,179 25,324,734 7,672,977 3,738,792 - -
Derivative Liability 25,727 - - - - - - - -
Debt securities issued - - - - - - - - -
Retirement benefit obligations - - - - - - 13,358 - -
Current tax liabilities 1,195,829 1,540,259 45,738 130,601 - - - - 29,239
Other liabilities 4,625,682 1,842,876 606,838 8,825,132 639,747 761,165 140,223 - 47,737
Interest-bearing loans and borrowings - 26,819,317 2,156,640 - 350,090 - - - -
Deferred tax liabilities 58,656 641,257 154,059 - - 61,775 - - -
Equity 74,264,149 36,830,917 3,733,862 4,267,964 8,722,615 3,411,586 1,721,692 4,028,910 425,865
671,454,895 249,489,963 34,768,931 31,917,876 37,173,315 11,926,082 5,614,065 4,028,910 502,841
Net cashflow from investing activities (31,154,411) (2,020,906) (3,548,214) (387,615) 567,561 120,490 - - 68,162,205
Net cashflow from financing activities 10,255,390 7,247,347 (114,281) - (17,799) - (57,088) - (67,394,003)
Increase in cash and cash equivalents 47,114,822 61,467,964 505,117 17,133,014 17,141,349 697,018 (367,610) - 855,278
Cash and cash equivalent, beginning of year 192,853,632 33,677,911 8,240,384 2,523,369 9,360,900 810,868 1,144,498 - 152,390,477
Effect of exchange rate fluctuations on cash held - - - - - - - - (863,274)
Cash and cash equivalent, end of year 239,968,454 95,145,875 8,745,501 19,656,383 26,502,249 1,507,886 776,888 - 152,382,481
Access BankSierra Leone
Access BankInvestment in
RSPP
Access BankB.V.
The Access BankUK
Access Bank GhanaAccess Bank
RwandaAccess Bank
(R.D. Congo)Access Bank
ZambiaAccess Bank
Gambia
188

Access Bank Plc
Consolidated and separate financial statementsFor the year ended 31 December 2017
27 (d) Condensed results of consolidated entities
(i) The condensed financial data of the consolidated entities as at 31 December 2016, are as follows:
Condensed profit and loss
In thousands of naira
Operating income 8,563,021 18,801,271 2,734,273 2,489,687 1,742,976 930,033 949,130 - 170,898
Operating expenses (4,223,554) (10,518,589) (2,214,927) (2,036,649) (1,429,535) (639,171) (716,827) - (7,757)
Net impairment loss on financial assets - (3,697,655) (648,310) (1,095) (309,215) (106,733) (71,390) - -
Profit before tax 4,339,467 4,585,027 (128,964) 451,942 4,226 184,129 160,913 - 163,141
Taxation (867,924) (2,560,584) (15,851) (15,897) (21,186) (19,586) (4,297) - (12,084)
Profit for the year 3,471,543 2,024,443 (144,815) 436,046 (16,960) 164,544 156,617 - 151,057
Statement of financial position as at 31 December 2016
Assets
Cash and cash equivalents 206,090,386 53,060,292 12,843,280 4,081,910 7,748,129 1,850,740 3,189,614 - 433,441
Derivative financial instruments - 152,386 - - - - - -
Loans and advances to banks 105,115,705 - - - - - - - 72,641,947
Loans and advances to customers 90,553,072 93,656,210 12,888,097 11,764,620 4,580,996 1,011,580 442,252 - -
Pledged assets - - - - - - - - -
Investment securities 23,316,245 30,800,861 1,390,502 - 2,211,138 6,332,347 4,082,549 - -
Other assets 1,668,759 8,262,701 354,956 746,564 2,484,112 197,067 476,666 - 4,319
Investment in subsidiaires - - - - - - - 3,286,375 -
Property and equipment 98,390 8,039,370 733,065 1,425,053 734,526 845,656 408,520 - -
Intangible assets 320,219 436,493 - 85,669 100,736 102,207 39,440 - -
Deferred tax assets - 1,014,466 - - 432,094 - 168,936 - -
427,162,776 195,270,393 28,362,286 18,103,816 18,291,733 10,339,595 8,807,979 3,286,375 73,079,707
Financed by:
Deposits from banks 261,480,316 14,677,731 - 2,171,148 1,245,861 - 787,165 - -
Deposits from customers 119,243,361 146,112,643 22,459,781 10,524,795 12,947,085 6,389,283 5,637,268 - -
Derivative Liability 51,382 - - - - - - - -
Debt securities issued - - - - - - - - 72,592,084
Retirement benefit obligations 841 9,921 - - 95 - - - -
Current tax liabilities 607,272 1,843,534 (126,448) 63,564 - 7,331 - - 60,674
Other liabilities 1,998,068 1,498,809 614,869 834,620 642,039 686,957 477,233 - 41,673
Interest-bearing loans and borrowings - 159,393 1,848,571 - - - - - -
Contingent settlement provisions - - - - - - - - -
Deferred tax liability - - - - - - - - -
Equity 43,781,536 30,665,017 3,354,496 4,509,689 3,456,653 3,173,092 1,906,313 3,286,375 385,276
427,162,776 194,967,048 28,151,267 18,103,816 18,291,733 10,256,665 8,807,979 3,286,375 73,079,707
Net cashflow from investing activities (17,961,436) (7,188,778) (108,505) (490,831) - (2,784,760) - - -Net cashflow from financing activities 9,579,150 7,080,739 908,018 - - - - - -
Increase/(Decrease) in cash and cash equivalents 147,608,099 3,084,064 431,681 (2,272,754) - (757,388) - - 112,381,427
45,245,533 30,593,847 7,808,703 4,796,124 9,360,900 1,568,257 1,144,498 - 268,239
- - - - - - - - 39,740,811Cash and cash equivalent, end of year 192,853,632 33,677,911 8,240,384 2,523,369 9,360,900 810,868 1,144,498 - 152,390,477
Effect of exchange rate fluctuations on cash held
Cash and cash equivalent, beginning of year
Access BankSierra Leone
Access BankInvestment in
RSPP
Access BankB.V.
The Access BankUK
Access Bank GhanaAccess Bank
RwandaAccess Bank
(R.D. Congo)Access Bank
ZambiaAccess Bank
Gambia
189

Access Bank Plc
Consolidated and separate financial statementsFor the year ended 31 December 2017
28 Property and equipment
GroupIn thousands of Naira
Cost
Balance at 1 January 2017 55,996,220 9,742,073 24,028,522 35,303,353 11,615,441 5,491,263 142,176,872
Acquisitions 3,052,577 - 824,948 12,003,579 4,016,068 3,989,340 23,886,512
Disposals (134,651) - (142,057) (379,433) (298,209) - (954,350)
Transfers 1,359,946 - 79,880 33,632 12,132 (1,485,590) -
Translation difference 9,229 - 130,426 (141,548) (131,460) 638,935 505,582
Balance at 31 December 2017 60,283,321 9,742,073 24,921,719 46,819,583 15,213,972 8,633,948 165,614,616
Balance at 1 January 2016 49,254,893 7,818,982 17,762,955 29,241,820 9,898,894 7,755,533 121,733,077
Acquisitions 2,058,046 1,923,091 5,474,190 4,978,500 1,785,155 1,823,777 18,042,759
Disposals (122,313) - (290,101) (530,187) (558,855) (129,535) (1,630,992)
Transfers 3,586,520 - 74,632 87,346 - (3,748,497) -
Write-offs (187,281) - - (18,575) - (155,144) (361,001)
Reclassifications - - - - - (556,893) (556,893)
Translation difference 1,406,355 - 1,006,846 1,544,451 490,247 502,022 4,949,921
Balance at 31 December 2016 55,996,220 9,742,073 24,028,522 35,303,353 11,615,441 5,491,263 142,176,872
LeaseholdLand
Depreciation and impairment losses
Balance at 1 January 2017 11,193,974 - 15,046,823 24,636,684 7,190,340 - 58,067,821
Charge for the year 2,474,675 - 3,296,435 3,829,132 1,637,709 - 11,237,951
Disposal (14,752) - (136,531) (377,275) (257,232) - (785,790)
Translation difference (783,585) - 79,081 635,127 49,371 - (20,006)
Balance at 31 December 2017 12,870,312 - 18,285,808 28,723,668 8,620,188 - 68,499,976
Balance at 1 January 2016 9,286,024 - 12,318,555 20,442,415 6,356,156 - 48,403,149
Charge for the year 1,864,239 - 2,658,469 3,340,041 1,244,137 - 9,106,886
Disposal (10,538) - (281,617) (515,657) (428,352) - (1,236,164)
Write-Offs (14,219) - - (6,267) - (20,486)
Translation difference 68,468 - 351,416 1,376,152 18,399 - 1,814,435
Balance at 31 December 2016 11,193,974 - 15,046,823 24,636,684 7,190,340 - 58,067,820
Carrying amounts:
Balance at 31 December 2017 47,413,009 9,742,073 6,635,910 18,095,915 6,593,784 8,633,948 97,114,640
Balance at 31 December 2016 44,802,246 9,742,073 8,981,698 10,666,669 4,425,101 5,491,263 84,109,052
Total
Leaseholdimprovement and
building
Computerhardware
Furniture &fittings
Motorvehicles
Capital Work-in -progress
Total
Leaseholdimprovement and
building
Computerhardware
Furniture &fittings
Motorvehicles
Capital Work-in -progress
LeaseholdLand
190

Access Bank Plc
Consolidated and separate financial statementsFor the year ended 31 December 2017
28 Property and equipment
BankLeasehold
Land
Cost
Balance at 1 January 2017 47,904,498 9,742,073 20,614,356 30,775,870 9,694,750 3,216,721 121,948,268
Acquisitions 2,916,884 - 574,556 11,715,864 3,619,689 2,680,626 21,507,619
Disposals (134,651) - (135,822) (348,908) (208,597) - (827,978)
Transfers 617,063 - 184 3,055 541 (620,843) -
Balance at 31 December 2017 51,303,794 9,742,073 21,053,274 42,145,881 13,106,383 5,276,504 142,627,909
Balance at 1 January 2016 44,918,694 7,818,982 15,863,065 26,748,469 8,644,919 5,388,964 109,383,091
Acquisitions 1,147,630 1,923,091 5,008,811 4,490,233 1,477,917 655,470 14,703,152
Disposals (118,662) - (257,520) (492,138) (428,086) (129,535) (1,425,941)
Transfers 1,956,836 - - 29,306 - (1,986,142) -
Reclassifications - - - - - (556,893) (556,893)
Write-Offs - - - - - (155,143) (155,143)
Balance at 31 December 2016 47,904,498 9,742,073 20,614,356 30,775,870 9,694,750 3,216,721 121,948,266
Leasehold Leasehold Capital
improvement Land Computer Furniture & Motor work-in Total
Depreciation and impairment losses and buildings hardware fittings vehicles - progress
Balance at 1 January 2017 9,700,946 - 12,997,503 21,259,586 6,165,759 - 50,123,794
Charge for the year 993,644 - 2,578,761 4,455,043 1,471,732 - 9,499,180
Disposal (14,752) - (130,893) (344,195) (181,945) - (671,785)
Balance at 31 December 2017 10,679,838 - 15,445,371 25,370,434 7,455,546 - 58,951,189
(119,899) (4,929) (4,713)
Balance at 1 January 2016 8,207,291 - 10,985,168 18,767,401 5,522,848 - 43,482,708
Charge for the year 1,504,195 - 2,269,674 2,981,425 1,019,297 - 7,774,591
Disposal (10,540) - (257,339) (489,240) (376,386) - (1,133,505)
Balance at 31 December 2016 9,700,946 - 12,997,503 21,259,586 6,165,759 - 50,123,794
Carrying amounts:
Balance at 31 December 2017 40,623,955 9,742,073 5,607,903 16,775,447 5,650,837 5,276,504 83,676,722
Balance at 31 December 2016 38,203,552 9,742,074 7,616,853 9,516,285 3,528,992 3,216,722 71,824,473
Total
(a) The amount of contractual commitments for the acquisition of property and equipment as at 31 December 2017 is N322.2Mn (31 Dec 2016: N365Mn)
(b) Estimates of useful life and residual value, and the method of depreciation, are reviewed at a minimum at each reporting year. Any changes are accounted for prospectively as a change in estimate.
In thousands of Naira
Leaseholdimprovementand buildings
Computerhardware
Furniture &fittings
Motor vehicles Capital work-in- progress
191

Access Bank Plc
Consolidated and separate financial statements
For the year ended 31 December 2017
29 Intangible assets
Group
In thousands of Naira Goodwill WIP Purchased Total
Software
Cost
December 2017
Balance at 1 January 2017 681,007 286,724 14,858,925 15,826,656
Acquisitions - 881,374 2,573,350 3,454,724
Transfer - (55,155) 55,155 -
Write off - - (66,985) (66,985)
Translation difference - - 535,236 535,236
Balance at 31 December 2017 681,007 1,112,943 17,955,681 19,749,631
December 2016
Balance at 1 January 2016 681,007 - 12,060,445 12,741,452
Acquisitions - 286,724 2,250,300 2,537,024
Transfer - - 322,529 322,529
Write off - - (54,460) (54,460)
Translation difference - - 280,111 280,111
Balance at 31 December 2016 681,007 286,724 14,858,925 15,826,656
Amortization and impairment losses
Balance at 1 January 2017 - - 8,887,101 8,887,101
Amortization for the year - - 2,407,886 2,407,886
Write off - - (66,985) (66,985)
Translation difference - - 225,774 225,774
Balance at 31 December 2017 - - 11,453,776 11,453,776
Balance at 1 January 2016 - - 6,294,951 6,294,951
Amortization for the year - - 2,191,614 2,191,614
Translation difference - - 400,536 400,536
Balance at 31 December 2016 - - 8,887,101 8,887,101
Net Book Value
Balance at 31 December 2017 681,007 1,112,943 6,501,905 8,295,855
Balance at 31 December 2016 681,007 286,724 5,971,824 6,939,555
Bank
WIP Purchased Total
In thousands of Naira Software
Cost
December 2017
Balance at 1 January 2017 231,569 12,167,422 12,398,991
Acquisitions 881,374 1,873,350 2,754,724
Write off - (66,985) (66,985)
Balance at 31 December 2017 1,112,943 13,973,787 15,086,730
December 2016
Balance at 1 January 2016 - 10,348,678 10,348,678
Acquisitions 231,569 1,818,744 2,050,313
Balance at 31 December 2016 231,569 12,167,422 12,398,991
Amortization and impairment losses
Balance at 1 January 2017 - 7,225,207 7,225,207
Amortization for the year - 1,946,601 1,946,601
Write off - (66,985) (66,985)
Balance at 31 December 2017 - 9,104,823 9,104,823
Balance at 1 January 2016 - 5,370,770 5,370,770
Amortization for the year - 1,854,437 1,854,437
Balance at 31 December 2016 - 7,225,207 7,225,207
Carrying amounts
Balance at 31 December 2017 1,112,943 4,868,963 5,981,907
Balance at 31 December 2016 231,569 4,942,214 5,173,784
Amortization method used is straight line.
The work in progress relates to the cost of the CR2 Omnichannel Banking solution aimed at providing a unique experience to customers at every touch point
and empowering the bank to create, manage and deliver personalied product offerings and services to each customers or customer group across all channels.
There were no capitalised borrowing costs related to the internal development of software during the year under review, 31 December 2017 (2016: nil).
Computer software has a definite useful life of not more than five years in line with the Bank's accounting policy, while Goodwill has an indefinite useful life
and is annually assessed for impairment.
192

Access Bank Plc
Consolidated and separate financial statementsFor the year ended 31 December 2017
29(b) Intangible assets
(i) Goodwill is attributable to the acquisition of following subsidiaries:
December 2017 December 2016
In thousands of Naira
Access Bank Rwanda 681,007 681,007
681,007 681,007
(ii)
The recoverable amount was determined using a value-in-use computation as N3.5bn
Goodwill is monitored by the Group on an entity by entity basis
The key assumption used in computing the value-in-use for goodwill in during the year are as follows:
December 2017 December 2016
Compound annual volume growth (i) 5.44% 6.62%
Long term growth rate (ii) 4.70% 4.70%
Discount rate (ii) 19.50% 19.50%
Revenue Growth 9.60% 9.60%
(i) Compound annual volume growth rate in the initial four-year period.
(ii) Weighted average growth rate used to extrapolate cash flows beyond the budget year.
(ii) Pre-tax discount rate applied to the cash flow projections.
Cash Flow Forecast
Discount Rate
Long-term term growth rate
Revenue Growth
Sensitivity analysis of key assumptions used
10% 10%
increase decrease
Impact of change in discount rate on value-in-use computation (481,959) 626,557
Impact of change in growth rate on value-in-use computation 85,169 (79,926)
Impact of change in revenue growth on value-in-use computation 490,918 (490,918)
The recoverable amount of Goodwill as at 31 December 2017 is greater than its carrying amount and is thus not impaired.
Goodwill is reviewed annually for impairment, or more frequently when there are indications that impairment may have occurred. Impairmentassessment has been performed for the year, while no losses on goodwill were recognized during the year under review 31 December 2017 (31December 2016: Nil)
The recoverable amount of Goodwill as at 31 December 2017 was greater than its carrying amount and is thus not impaired.
Revenue growth were projected based on past growth, actual operating income and the company's 4 year strategic plan. The revenue growth of9.6% represents the average revenue growth of 4 years. The revenue growth was used to project the cashflow for the business.
Cash flows were projected based on past experience, actual operating results and the 4-year business plan. These cashflows are based on theexpected revenue growth for the entity over this 4-year period.
Pre-tax discount rate of 19.50% was applied in determining the recoverable amounts for the only entity with goodwill (Access Bank Rwanda). Thisdiscount rate was estimated using the risk-free rate and the country risk premium for Rwanda.
The long term growth rate applied was based on the long term growth rate in GDP of Rwanda
The key assumptions described above may change as economic and market conditions change. The Group estimates that reasonably possiblechanges in these assumptions are not expected to cause the recoverable amount of the subsidiaries (from which the goodwill arose) to declinebelow their carrying amount.
193

Access Bank Plc
Consolidated and separate financial statementsFor the year ended 31 December 2017
30 Deferred tax assets and liabilities
(a) Group
Deferred tax assets and liabilities are attributable to the following:
In thousands of NairaAssets Liabilities Net Assets Liabilities Net
Property and equipment, and software 9,608,714 (951,035) 8,657,679 14,329,164 (443,943) 13,885,221
Allowances/(Reversal) for loan losses 8,802,968 (2,460) 8,800,508 9,009,821 - 9,009,821
Tax loss carry forward 193,980 (86,571) 107,409 4,549,454 - 4,549,454
Exchange gain/(loss) unrealised - (25,549,678) (25,549,678) - (29,234,934) (29,234,934)
Employee benefits 63,438 - 63,438 11,421 - 11,421
- - -
- (843,619) (843,619) - (655,220) (655,220)
Deferred tax assets (net) 18,669,100 (27,433,362) (8,764,262) 27,899,860 (30,334,097) (2,434,237)
(b) Bank
Deferred tax assets and liabilities are attributable to the following:
In thousands of Naira
Assets Liabilities Net Assets Liabilities Net
Property and equipment, and software 9,508,714 - 9,508,714 13,937,906 - 13,937,906
Allowances/(Reversal) for loan losses 8,712,969 - 8,712,969 8,344,683 - 8,344,683
Tax loss carry forward - - - 4,505,813 - 4,505,813
Exchange gain unrealised - (25,226,579) (25,226,579) - (29,234,934) (29,234,934)
- (843,619) (843,619) - (655,220) (655,220)
Net deferred tax assets/(liabilities) 18,221,683 (26,070,198) (7,848,515) 26,788,402 (29,890,154) (3,101,752)
There were no unrecognized deferred tax assets or liabilities as at 31 December 2017 (31 December 2016: nil)
Group Group Bank Bank
December December December December
2017 2016 2017 2016
Deferred income tax assets
– Deferred income tax asset to be recovered after more than 12 months 8,907,917 13,559,276 8,712,969 12,850,495
– Deferred income tax asset to be recovered within 12 months 9,761,183 14,340,585 9,508,714 13,937,906
18,669,100 27,899,861 18,221,683 26,788,401
Deferred income tax liabilities
– Deferred income tax liability to be recovered after more than 12 months (27,433,362) (30,334,096) (26,070,198) (29,890,154)
– Deferred income tax liability to be recovered within 12 months - - - -
(27,433,362) (30,334,096) (26,070,198) (29,890,154)
(c) Movement on the net deferred tax assets / (liabilities) account during the year:
Group Group Bank Bank
December December December December
In thousands of Naira 2017 2016 2017 2016
Balance, beginning of year (2,434,236) 10,578,968 (3,101,754) 10,180,831
Tax charge (5,351,746) (11,994,560) (4,558,364) (12,172,525)
Translation adjustments (789,880) 91,416 - -
Items included in OCI (188,399) (1,110,059) (188,399) (1,110,059)
Net deferred tax assets/(liabilities) (8,764,261) (2,434,236) (7,848,515) (3,101,754)
Out of which
Deferred tax assets 18,669,100 27,899,860 18,221,683 26,788,401
Deferred tax liabilities (27,433,362) (30,334,096) (26,070,198) (29,890,154)
Items included in Other Comprehensive Income
Group Group Bank Bank
In thousands of Naira December December December December
2017 2016 2017 2016
Actuarial gain/loss on retirement benefit obligation
Gross loss on retirement benefit obligation 627,995 3,700,198 627,995 3,700,198
Deferred tax @ 30% (188,399) (1,110,059) (188,399) (1,110,059)Net balance loss after tax 439,597 2,590,139 439,597 2,590,139
Temporary difference relating to the Group's Investment in subsidiaries as at December 2017 is N14.5 billion (Dec 2016: N28.6 billion). As the Group exercises controlover the subsidiaries, it has the power to control the timing of the reversals of the temporary difference arising from its investments in them. The group has determinedthat the subsidiaries' profits and reserves will not be distributed in the foreseeable future and that the subsidiaries will not be disposed of. Hence, the deferred tax arisingfrom the temporary differences above will not be recognised.
December 2017 December 2016
Actuarial loss on retirement benefitobligation
December 2017 December 2016
Actuarial loss on retirement benefitobligation
Deferred tax asset are recognised for tax losses carried forward to the extent that the realisation of the related tax benefit through future taxable profits is probable. Afterreviews of the medium-term profit forecasts, the Group considers that there will be sufficient profits in the future against which these losses will be offset.
194

Access Bank Plc
Consolidated and separate financial statementsFor the year ended 31 December 2017
31 Assets classified as held for sale
Assets held for sale
Group Group Bank Bank
In thousands of Naira December 2017 December 2016 December 2017 December 2016
Balance at 1 January 140,727 179,843 140,727 179,843Additions 9,369,240 - 9,369,240 -
Disposals (30,000) (39,116) (30,000) (39,116)
Balance at 31 December 2017 9,479,967 140,727 9,479,967 140,727
32 Deposits from financial institutions
Group Group Bank Bank
December 2017 December 2016 December 2017 December 2016
In thousands of Naira
Money market deposits 165,366,714 85,020,959 107,484,428 26,209,999
Trade related obligations to foreign banks 284,830,256 82,335,624 168,656,407 68,912,189
450,196,970 167,356,583 276,140,835 95,122,188
33 Deposits from customers
Group Group Bank Bank
December 2017 December 2016 December 2017 December 2016
In thousands of Naira
Term deposits 1,172,733,890 925,976,555 1,035,810,196 799,495,575
Demand deposits 860,560,595 984,150,905 691,144,436 853,780,226
Saving deposits 211,584,590 179,069,826 183,819,081 159,767,071
2,244,879,075 2,089,197,286 1,910,773,713 1,813,042,872
34 Other liabilities
Group Group Bank Bank
In thousands of Naira December 2017 December 2016 December 2017 December 2016
Financial liabilities
Certified and bank cheques 1,614,507 2,430,832 1,537,858 2,018,166
E-banking payables ( see (a) below) 14,750,651 3,758,302 14,750,651 3,561,974
Collections account balances ( see (b) below) 113,274,691 18,677,355 110,802,951 17,692,904
Due to subsidiaries - - 347,385 714,192
Accruals 841,230 1,294,775 841,230 434,811
Creditors 14,773,251 5,043,127 3,838,501 3,404,70364,067,288 59,738,350 64,067,288 59,574,436
Agency services 51,446 37,984 51,446 36,140
Unclaimed dividend (see (d) below) 13,888,938 11,957,131 13,888,938 11,957,131
Other financial liabilities 12,524,476 8,179,792 13,837,188 5,893,267
235,786,478 111,117,648 223,963,436 105,287,724
Non-financial liabilities
Litigation claims provision 766,809 613,886 766,809 613,886
Other current non-financial liabilities 17,360,887 1,839,706 13,965,441 1,637,331
Total other liabilities 253,914,174 113,571,240 238,695,686 107,538,941
During the year, the Bank obtained a property by taking possession of collateral held as security against a loan. The value of the collateral repossessedduring the year was N9.4bn (2016: Nil). The Group's policy is to pursue timely realisation of the collateral in an orderly manner. The Group does notgenerally use the non-cash collateral for its own operations.This amount has been presented in Note 7 as unallocated segment in accordance with IFRS 8.
Customer deposits for foreign exchange( see (c) below)
195

Access Bank Plc
Consolidated and separate financial statementsFor the year ended 31 December 2017
56,847,216(a)
(b)
(c)
(d)
Group Group Bank Bank
Movement in litigation claims provision December 2017 December 2016 December 2017 December 2016
Opening balance 613,886 1,220,780 613,886 1,220,780
Additions 152,923 49,496 152,923 49,496
Payment - (656,390) - (656,390)
Closing balance 766,809 613,886 766,809 613,886
35 Debt securities issued Group Group Bank Bank
December 2017 December 2016 December 2017 December 2016
In thousands of Naira
Debt securities at amortized cost:
Eurobond debt from Access Bank B.V (see (a) below) - 72,592,084 - -
Eurobond debt security (see (b) below) 231,122,344 212,380,366 231,122,344 212,380,366
Commercial Papers (c) 70,984,362 31,572,052 70,984,362 31,572,052
302,106,706 316,544,502 302,106,706 243,952,418
Movement in Debt securities issued:
Group Bank
In thousands of Naira
Net debt as at 1 January 2017 316,544,502 243,952,418
Debt securities issued 121,486,981 121,486,981
Repayment of debt securities issued (151,694,953) (79,102,869)
Total changes from financing cash flows 286,336,530 286,336,530
The effect of changes in foreign exchange rates 18,173,205 18,173,205
Other changes
Interest expense 35,947,693 35,947,693
Interest paid (38,350,722) (38,350,722)Balance as at 31 December 2017 302,106,706 302,106,706
(a) This refers to USD350,000,000 7.25% guaranteed notes issued on 25 July 2012 by Access Finance B.V., Netherlands with a maturity date of 25 July2017 . In Oct 2016, USD 112,997,000 out of USD 350,000,000 was exchanged at a premium for a new note issued by Access Bank Plc.This has been fully redeemed on the maturity date.
(b) This refers to US$400,000,000 subordinated notes of 9.25% resettable interest issued on 24 December 2014 with a maturity date of 24 December2021 and US$300,000,000 notes of 10.5% interest issued on 19 October 2016 with a maturity date of 19 October 2021. These represent an amortizedcost of N231.18bn.
(c) This relates to short-term debt financing securities issued by the Bank.
The principal amount on both notes are payable at maturity, whilst interest is payable on a semi-annual basis at their respective interest rates.
E-banking payables represent settlements due to other banks use of their electronic channels by the Group’s customers. The Group’s Receivables fromother banks is contained in Note 26.
Collections are balances held in trust on behalf of customers for various transactions. These include escrows, collection for remittances, payments, etc.
Customer deposits for foreign exchange represents deposits customers have made to fulfil foreign currency obligations. The Group's process requiresthat all customers with foreign currency obligations deposit foreign currency to back these transactions. The corresponding balance is in Other depositswith central banks - Cash and balances with Banks.
Unclaimed dividend is the balance of dividend declared by the Bank but yet to be claimed by shareholders. The amount relates to the portion that hasbeen transferred to the Bank by the Registrar in accordance with Securities and Exchange Commission guidelines on Return of Unclaimed Dividends(See Note 19) for the corresponding assets with Asset Managers. The amount is payable on demand to shareholders.
196

Access Bank Plc
Consolidated and separate financial statements
For the year ended 31 December 2017
36 Interest bearing borrowings
Group Group Bank Bank
In thousands of Naira December 2017 December 2016 December 2017 December 2016
African Development Bank (see note (a)) 28,575,578 29,026,302 26,418,938 29,026,302
Netherlands Development Finance Company (see note (b)) 989,655 1,513,901 989,655 1,513,901
French Development Finance Company (see note (c)) 14,479,796 11,580,283 8,045,056 11,580,283
European Investment Bank (see note (d)) 41,880,625 26,979,759 21,842,579 26,979,759
International Finance Corporation (see note (e)) - 2,554,646 - 2,554,64617,641,231 9,766,871 17,641,231 9,766,871
Bank of Industry-Intervention Fund for SMEs (see note (g)) 2,186,572 4,500,284 2,186,572 4,500,284Bank of Industry-Power & Airline Intervention Fund (see note (h)) 10,975,439 12,881,897 10,975,439 12,881,897
Access Finance B.V. (see note (i)) - - - 74,425,0466,260,348 6,633,475 6,260,348 6,633,475
Central Bank of Nigeria - Salary Bailout facilities (see note (k)) 65,230,347 66,479,721 65,230,347 66,479,721Central Bank of Nigeria - Excess Crude Account (see note (l)) 122,585,415 125,837,600 122,585,415 125,837,600
Other loans and borrowings 812,182 1,788,968 115,561 -
311,617,187 299,543,707 282,291,140 372,179,785
(a)
(b)
(c)
(d)
(e)
(f)
(g)
(h)
Central Bank of Nigeria under the Commercial Agriculture Credit Scheme
(see note (f))
Special Refinancing & Restructuring Intervention fund (SRRIF) see note
(j)
The amount of N17,641,213,289 represents the outstanding balance on the on-lending facility granted to the Bank by Central Bank of Nigeria in collaboration
with the Federal Government of Nigeria (FGN) in respect of Commercial Agriculture Credit Scheme (CACS) established by both CBN and the FGN for
promoting commercial agricultural enterprises in Nigeria. The facility is for a maximum period of 7 years at a zero percent interest rate to the Bank however, a
management fee of 1% deductible at source is paid by the Bank under the on-lending agreement. The Bank did not provide security for this facility.From this
creditor, the bank has nil undrawn balance as at 31 December 2017.
The amount of N2,186,572,371 represents an outstanding balance on the intervention credit granted to the Bank by the Bank of Industry (BOI), a company
incorporated in Nigeria for the purpose of refinancing or restructuring existing loans to Small and Medium Scale Enterprises (SMEs) and manufacturing
companies. The total facility has a tenor of 10 years. A management fee of 1% deductible at source is paid by the Bank under the on-lending agreement and the
Bank is under obligation to on-lend to customers at an all-in interest rate of 7% per annum. Though the facility is meant for on-lending to borrowers in
specified sectors, the Bank remains the primary obligor to the BOI and therefore assumes the risk of default of customers. From this creditor, the bank has nil
undrawn balance as at 31 December 2017.
The amount of N10,975,438,589 represents the outstanding balance on intervention credit granted to the Bank by the Bank of Industry (BOI), a company
incorporated in Nigeria, to be applied to eligible power and airline projects. The total facility has a maximum tenor of 13.5 years. A management fee of 1%
deductible at source is paid by the Bank under the on-lending agreement and the Bank is under obligation to on-lend to customers at an all-in interest rate of
7% per annum. Though the facility is meant for on-lending to borrowers within the power and aviation sectors, the Bank remains the primary obligor to the
BOI and therefore assumes the risk of default of customers. From this creditor, the bank has nil undrawn balance as at 31 December 2017.
An on-lending facility of USD 50mn was granted to the Bank by the International Finance Corporation (IFC) in November 2013 (USD 50m) for a period of 5
years. The principal amount was repayable semi-annually from December 2014 while interest is paid semi annually at 4% above 6months LIBOR. The facility
matured in June 2017 and has been fully paid out to the counterparty International Finance Corporation (IFC).
The amount of N21,842,579,074 (USD 65,989,665) represents the outstanding balance on five on-lending facilities granted to the Bank by the European
Investment Bank (EIB) in May 2013(USD 25m), September 2013 (USD 26.75m) , June 2014 (USD 14.7m) , September 2015 (USD 27.9m) and March 2016
(USD 27.1m) for a period of 6 years each for the first three and year of 8 years each for the last two. The average annual effective interest rates are 3.48%,
2.97% , 3.18%, 2.97% and 2.97% respectively. From this creditor, the bank has nil undrawn balance as at 31 December 2017.
There have been no defaults in any of the borrowings covenants during the year.
The amount of N26,418,938,000 (USD 79,815,524) represents the outstanding balance in the on-lending facility granted to the Bank by AFDB (Africa
Development Bank) in two tranches. The first tranche of USD35 million has matured and was fully paid out in August 2016. The second tranche was disbursed
in August 2014 (USD 90m) for a year of 10years, while the third tranche came in June 2016 for (USD 10m) for a period of 9 years. The principal amount is
repayable semi-annually starting from February 2017 for both tranches. Interest is paid semi annually at 3% above 6 months LIBOR. The annual effective
interest rate is 4.10% and 4.14% respectively. From this creditor, the bank has nil undrawn balance as at 31 December 2017.
The amount of N989,654,959 (USD 2,989,894) represents the outstanding balance in the on-lending facility granted to the Bank by the Netherlands
Development Finance Company effective from 15 December 2012 and disbursed in February 2013 (USD 10m) for a period of 6.5 years. The principal amount is
repayable semi-annually from December 2015 while interest is paid semi annually at 3% above 6 months LIBOR. The annual effective interest rate is 5.16%.
From this creditor, the bank has nil undrawn balance as at 31 December 2017.
The amount of N8,045,055,547 (USD 24,305,304) represents the outstanding balance in the on-lending facility granted to the Bank by the French
Development Finance Company effective from 15 December 2012 and disbursed in four tranches; February 2013 (USD 6m) , October 2013 (USD 15m) , October
2013 (USD 9m) and November 2014 (USD 30m) for a period of 6.5 years for the first three tranches and 5 years for the fourth tranche. The principal amount is
repayable semi-annually from December 2014 with the fourth tranche repayable from January 2016 while interest is paid semi annually at 3% above 6 months
LIBOR. The annual effective interest rate is 4.36% for the first tranche, 4.04% for the second tranche, 4.06% for the third tranche and 4.57% for the fourth
tranche. From this creditor, the bank has nil undrawn balance as at 31 December 2017.
197

Access Bank Plc
Consolidated and separate financial statements
For the year ended 31 December 2017
(i)
(j)
(k)
(l)
(m) Movement in interest bearing loans and borrowings:
In thousands of Naira
Group Bank
Balance as at 1 January 2017 299,543,707 372,179,785
Proceeds from interest bearing borrowings 43,577,454 13,337,947
Repayment of interest bearing borrowings (34,371,397) (99,011,336)
Total changes from financing cash flows 308,749,764 286,506,396
The effect of changes in foreign exchange rates 4,664,912 4,319,235
Other changes
Interest expense 12,373,830 11,070,759
Interest paid (14,171,319) (19,605,250)
Balance as at 31 December 2017 311,617,187 282,291,140
The amount of N122,585,415,103 represents the outstanding balance on the excess crude account loans granted to the bank by the Central Bank of Nigeria for
onward disbursements to state governments. The facility has a tenor of 20 years with a 2% interest payable to the CBN. The Bank is under obligation to on-lend
to the states at an all-in interest rate of 9% per annum. From this creditor, the bank has nil undrawn balance as at 31 December 2017.
The amount of N65,230,346,639 represents the outstanding balance on the state salary bailout facilities granted to the bank by the Central Bank of Nigeria for
onward disbursements to state governments for payments of salary of workers of the states. The facility has a tenor of 20 years with a 2% interest payable to
the CBN. The Bank is under obligation to on-lend to the states at an all-in interest rate of 9% per annum. From this creditor, the bank has nil undrawn balance
as at 31 December 2017.
This relates to borrowings of Access Bank Plc from Access Finance BV in respect of the dollar guaranteed notes issued by Access Finance B.V., Netherlands
which was due on 25 July 2017. The notes were issued on 25 July 2012 for a period of 5 years with the principal amount repayable at the end of the tenor while
interest on the Notes is payable semi-annually at 7.34%, in arrears on 25 January and 25 July in each year. In Oct 2016 , USD 112,997,000 out of USD
350,000,000 was exchanged at a premium for a new note issued by Access Bank Plc .The annual effective interest rate is 7.57%. The notes matured on 25th
July 2017 and was fully redeemed at maturity.
The amount of N6,260,347,857 represents the outstanding balance on intervention credit granted to the bank by the Bank of Industry (BOI) under the Special
refinancing and Restructuring intervention fund, with a 10 year tenor which is due on the 31 August 2024. The bank has a 36 months moratorium on the
facility after which principal repayment will be charged quarterly. Though the facility is meant for on-lending to borrowers in specified sectors, the Bank
remains the primary obligor to the BOI and therefore assumes the risk of default of customers. From this creditor, the bank has nil undrawn balance as at 31
December 2017.
198

Access Bank Plc
Consolidated and separate financial statementsFor the year ended 31 December 2017
37 Retirement benefit obligation
Group Group Bank Bank
In thousands of Naira December 2017 December 2016 December 2017 December 2016
Liability for defined contribution obligations 13,358 10,856 - -
2,495,274 3,075,453 2,481,916 3,064,597
(a) Defined benefit obligations
The amounts recognised in the statement of financial position are as follows:
Group Group Bank Bank
In thousands of Naira December 2017 December 2016 December 2017 December 2016
Post employment benefit plan (see note (i) below) 2,481,916 3,064,597 2,481,916 3,064,597
Recognised liability 2,481,916 3,064,597 2,481,916 3,064,597
(i) Post employment benefit plan
Group Group Bank Bank
In thousands of Naira December 2017 December 2016 December 2017 December 2016
Deficit on defined benefit obligations at 1 January 3,064,597 5,567,800 3,064,597 5,567,800
Charge for the year:
-Interest costs 495,674 692,268 495,674 692,268
-Current service cost 257,384 504,727 257,384 504,727
-Benefits paid (707,744) - (707,744) -
Net actuarial gain/(loss) for the year remeasured in OCI:
(602,798) (577,343) (602,798) (577,343)
(25,197) (3,122,855) (25,197) (3,122,855)
Balance, end of year 2,481,916 3,064,597 2,481,916 3,064,597
Expense recognised in income statement:
Current service cost 257,384 504,727 257,384 504,727
Interest on obligation 495,674 692,268 495,674 692,268
Total expense recognised in profit and loss (see Note 14) 753,058 1,196,995 753,058 1,196,995
31 December 2017
In thousands of Naira
Decrease inassumption by 1%
Liability changesto
Totalcomprehensive
income
Effect of changes in the assumption to the discount rate
Increase in liability by5.6%
2,621,835 (139,919)
Effect of changes in assumption to the salary growthDecrease in liability by4.9%
2,361,130 120,786
Effect of changes in assumption to the mortality rateDecrease in liability by0.2%
2,475,795 6,121
The Bank operates a non-contributory, unfunded lump sum defined benefit post employment benefit plan for top executive management of the Bankfrom General Manager and above based on the number of years spent in these positions. The scheme is also aimed at rewarding executive directors andother senior executives for the contributions to achieving the Bank's long-term growth objectives.
There is no funding arrangement with a trustee for the Post employment benefit plan as the Bank pays for all obligations from its current year profit assuch obligations fall due. Depending on their grade, executive staff of the Bank upon retirement are entitled to certain benefits based on their length ofstay on that grade.
Recognised liability for defined benefit obligations (see note(a) below)
3,064,597 3,064,5972,481,916 2,481,916
The sensivities below relates to Group and Bank.
The weighted average duration of the defined benefit obligation is 8years. The information on the maturity profile of the defined benefit plan includesthe maturity analysis and the distribution of the timing of payment. The estimated contribution to the plan for the next annual reporting year is:N629Mn
The amount recognised in the statement of financial position is as follows:
Remeasurements - Actuarial gains and losses arising fromchanges in demographic assumptions
Remeasurements - Actuarial gains and losses arising fromchanges in financial assumption
Impact on defined benefit obligation
199

Access Bank Plc
Consolidated and separate financial statementsFor the year ended 31 December 2017
Increase inassumption by 1%
Liability changesto
Totalcomprehensive
income
Effect of changes in the assumption to the discount rate
Decrease in liability by5.2%
2,352,750 129,166
Effect of changes in assumption to the salary growthIncrease in the liabilityby 5.2%
2,611,416 (129,500)
Effect of changes in assumption to the mortality rateIncrease in the liabilityby 0.3%
2,488,587 (6,671)
31 December 2016
In thousands of Naira
Decrease inassumption by 1%
Liability changesto
Totalcomprehensive
income
Effect of changes in the assumption to the discount rate
Increase in liability by7.7%
3,232,367 (167,770)
Effect of changes in assumption to the salary growthDecrease in liability by6.75%
2,909,189 155,408
Effect of changes in assumption to the mortality rateDecrease in liability by6.75%
3,057,012 7,585
Increase inassumption by 1%
Liability changesto
Totalcomprehensive
income
Effect of changes in the assumption to the discount rateIncrease in the liabilityby 6.9%
2,910,376 154,221
Effect of changes in assumption to the salary growthIncrease in the liabilityby 7.3%
3,232,322 (167,725)
Effect of changes in assumption to the mortality rateIncrease in the liabilityby 0.03%
3,073,008 (8,411)
Impact on defined benefit obligation
Impact on defined benefit obligation
The above sensitivity analysis are based on a change in an assumption while holding all other assumptions constant. In practice, this is unlikely to occur,and changes in some of the assumptions may be correlated. When calculating the sensitivity of the defined benefit obligation to significant actuarialassumptions the same method (present value of the defined benefit obligation calculated with the projected unit credit method at the end of the year)has been applied as when calculating the pension liability recognised within the statement of financial position. The methods and types of assumptionsused in preparing the sensitivity analysis did not change compared to the previous year.
Impact on defined benefit obligation
200
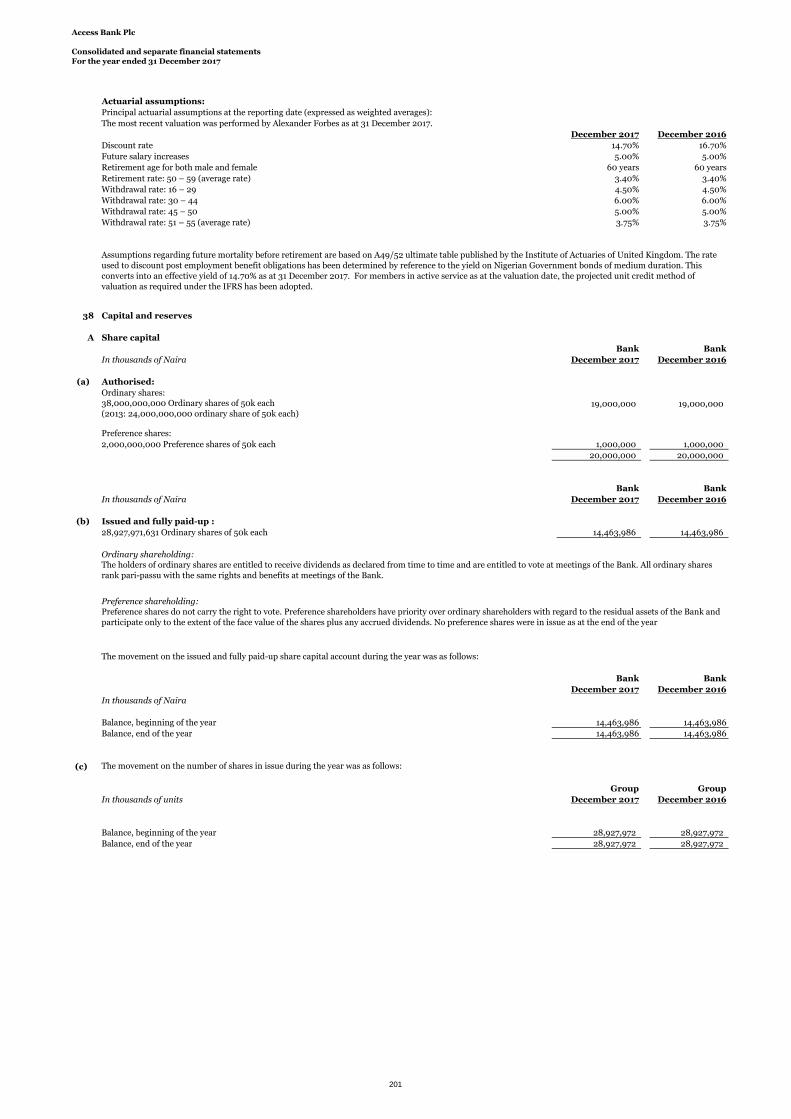
Access Bank Plc
Consolidated and separate financial statementsFor the year ended 31 December 2017
Actuarial assumptions:
Principal actuarial assumptions at the reporting date (expressed as weighted averages):
The most recent valuation was performed by Alexander Forbes as at 31 December 2017.
December 2017 December 2016
Discount rate 14.70% 16.70%
Future salary increases 5.00% 5.00%
Retirement age for both male and female 60 years 60 years
Retirement rate: 50 – 59 (average rate) 3.40% 3.40%
Withdrawal rate: 16 – 29 4.50% 4.50%
Withdrawal rate: 30 – 44 6.00% 6.00%
Withdrawal rate: 45 – 50 5.00% 5.00%
Withdrawal rate: 51 – 55 (average rate) 3.75% 3.75%
38 Capital and reserves
A Share capital
Bank Bank
In thousands of Naira December 2017 December 2016
(a) Authorised:
Ordinary shares:
19,000,000 19,000,000
Preference shares:
2,000,000,000 Preference shares of 50k each 1,000,000 1,000,000
20,000,000 20,000,000
Bank Bank
In thousands of Naira December 2017 December 2016
(b) Issued and fully paid-up :
28,927,971,631 Ordinary shares of 50k each 14,463,986 14,463,986
Ordinary shareholding:
Preference shareholding:
The movement on the issued and fully paid-up share capital account during the year was as follows:
Bank Bank
December 2017 December 2016
In thousands of Naira
Balance, beginning of the year 14,463,986 14,463,986
Balance, end of the year 14,463,986 14,463,986
(c) The movement on the number of shares in issue during the year was as follows:
Group Group
In thousands of units December 2017 December 2016
Balance, beginning of the year 28,927,972 28,927,972
Balance, end of the year 28,927,972 28,927,972
Assumptions regarding future mortality before retirement are based on A49/52 ultimate table published by the Institute of Actuaries of United Kingdom. The rateused to discount post employment benefit obligations has been determined by reference to the yield on Nigerian Government bonds of medium duration. Thisconverts into an effective yield of 14.70% as at 31 December 2017. For members in active service as at the valuation date, the projected unit credit method ofvaluation as required under the IFRS has been adopted.
The holders of ordinary shares are entitled to receive dividends as declared from time to time and are entitled to vote at meetings of the Bank. All ordinary sharesrank pari-passu with the same rights and benefits at meetings of the Bank.
Preference shares do not carry the right to vote. Preference shareholders have priority over ordinary shareholders with regard to the residual assets of the Bank andparticipate only to the extent of the face value of the shares plus any accrued dividends. No preference shares were in issue as at the end of the year
38,000,000,000 Ordinary shares of 50k each(2013: 24,000,000,000 ordinary share of 50k each)
201

Access Bank Plc
Consolidated and separate financial statementsFor the year ended 31 December 2017
B Share premium
Share premium is the excess paid by shareholders over the nominal value for their shares.
Group Group
December 2017 December 2016
In thousands of Naira
Balance, beginning of the year 197,974,816 197,974,816
Balance, end of the year 197,974,816 197,974,816
C Retained earnings
Group Group Bank Bank
December 2017 December 2016 December 2017 December 2016
Retained earnings 117,701,679 93,614,030 120,218,603 93,329,188
D Other components of equity
Group Group Bank Bank
December 2017 December 2016 December 2017 December 2016
Other regulatory reserves (see i(a) below) 70,562,156 62,615,212 60,986,896 53,001,072Share Scheme reserve 2,031,978 1,211,978 2,031,978 1,008,118Treasury Shares (4,028,910) (3,286,375) - -Capital Reserve 3,489,080 3,489,080 3,489,081 3,489,081Fair value reserve 36,111,322 23,240,250 35,267,471 23,354,093Foreign currency translation reserve 26,813,500 11,992,025 - -Regulatory risk reserve 43,420,287 42,932,550 35,058,266 35,058,266
178,399,413 142,194,720 136,833,692 115,910,630
(i) Other Reserves
Other regulatory reserves
Statutory reserves
SMEEIS Reserves
i(a)
December 2017 December 2016 December 2017 December 2016 December 2017 December 2016Group
In thousand of Naira
Opening 61,788,644 49,271,343 826,568 826,568 62,615,212 50,097,911
Transfers during the year 7,946,944 12,517,301 - - 7,946,944 12,517,301
Closing 69,735,588 61,788,644 826,568 826,568 70,562,156 62,615,212
Bank
In thousand of Naira
Opening 52,174,504 42,570,584 826,568 826,568 53,001,072 43,397,152
Transfers during the year 7,985,824 9,603,920 - - 7,985,824 9,603,920
Closing 60,160,328 52,174,504 826,568 826,568 60,986,896 53,001,072
(ii) Share scheme reserve
This represents the total expenses incurred in providing the Bank's shares to its qualifying staff members under the RSPP scheme.
(iii) Treasury shares
(iv) Capital reserve
(v) Fair value reserve
The Small and Medium Enterprises Equity Investment Scheme (SMEEIS) reserve is maintained to comply with the Central Bank of Nigeria (CBN)/ Banker'scommittee's requirement that all licensed deposit money banks in Nigeria set aside a portion of the profit after tax in a fund to be sued to finance equity investmentin qualifying small and medium scale enterprises. Under the terms of the guideline (amended by a CBN letter dated 11 July 2006), the contributions will be 10% ofprofit after tax and shall continue after the first 5 years but banks' contribution shall thereafter reduce to 5% of profit after tax
However, this is no longer mandatory. Therefore, no additional appropriation has been done during the year.
The small and medium scale industries equity investment scheme reserves are non-distributable.
Statutory reserves
Nigerian banking regulations require the Bank to make an annual appropriation to a statutory reserve. As stipulated by S.16(1) of the Banks and Other FinancialInstitution Act of Nigeria, an appropriation of 30% of profit after tax is made if the statutory reserve is less than paid-up share capital and 15% of profit after tax ifthe statutory reserve is greater than the paid up share capital.
This represents the shares held by the new RSPP scheme which have not yet been allocated to staff based on the pre-determined vesting conditions.
This balance represents the surplus nominal value of the reconstructed shares of the Bank which was transferred from the share capital account to the capital reserveaccount after the share capital reconstruction in October 2006. The Shareholders approved the reconstruction of 13,956,321,723 ordinary shares of 50 kobo each ofthe Bank in issue to 6,978,160,860 ordinary shares of 50 kobo each by the creation of 1 ordinary shares previously held.
The fair value reserve comprises the net cumulative change in the fair value of available-for-sale investments until the investment is derecognised or impaired.
TotalSMEEIS Reserves
202

Access Bank Plc
Consolidated and separate financial statementsFor the year ended 31 December 2017
(vi) Foreign currency translation reserve
(vii) Regulatory risk reserve
(viii) Retained earnings
D Non-controlling interest
This represents the Non-controlling interest's (NCI) portion of the net assets of the Group
Group Group
December 2017 December 2016
In thousands of Naira
Access Bank, Gambia 310,883 1,142,313
Access Bank, Sierra Leone 43,387 57,189
Access Bank Zambia 2,609,806 276,532
Access Bank, Rwanda 933,465 838,624
Access Bank, Congo 887 1,172,519
Access Bank, Ghana 3,009,086 2,759,852
6,907,514 6,247,029
This represents the NCI share of profit/(loss) for the year
Group Group
December 2017 December 2016
In thousands of Naira
Access Bank, Gambia 21,714 59,235
Access Bank, Sierra Leone 4,693 4,698
Access Bank Zambia (221,560) (980)
Access Bank, Rwanda 26,658 (36,204)
Access Bank, Congo 151 113,372
Access Bank, Ghana 181,434 182,200
13,090 322,322
Group Group
December 2017 December 2016
Proportional Interest of NCI in subsidiaries % %
Access Bank, Gambia 12% 36%
Access Bank, Sierra Leone 3% 3%
Access Bank Zambia 30% 8%
Access Bank, Rwanda 25% 25%
Access Bank Congo 0% 26%
Access Bank, Ghana 9% 9%
E Transactions with non-controlling interests
This balance appears only in the Group accounts and represents the foreign currency exchange difference arising from translating the results and financial positionof all the group entities (none of which has the currency of a hyper-inflationary economy) that have a functional currency different from the presentation currency.
The regulatory risk reserves warehouses the difference between the allowance for impairment losses on balance on loans and advances based on Central Bank ofNigeria prudential guidelines and Central Bank of the foreign subsidiaries regulations, compared with the loss incurred model used in calculating the impairmentunder IFRSs.
During the year, the Access Bank Plc acquired additional shares in Access Bank Congo and Access Bank Gambia. This resulted in changes in its ownership interestsin the subsidiaries, but the transactions did not result in a loss of control. Furthermore, the Group's holding in Access Bank Zambia reduced as a result of issuance ofshares to third party outside the Group by Access Bank Zambia. This diluted Access bank Plc's holding in Access Bank Zambia. However,control was not lost as aresult of the dilution. The Group adjusted the carrying amounts of the controlling and non-controlling interests to reflect the changes in the relative interests in thesubsidiaries. The impact was recognised directly in equity.
Retained earnings are the carried forward recognised income net of expenses plus current year profit attributable to shareholders.
203

Access Bank Plc
Consolidated and separate financial statements
For the year ended 31 December 2017
E Dividends
Bank Bank
December 2017 December 2016
In thousands of Naira
Interim dividend paid (2017: 25k, 2016: 25k) 7,231,992 7,231,993
Final dividend paid (2017: 40k, 2016: 40k) 11,571,188 11,571,188
18,803,180 18,803,181
Number of shares 28,927,972 28,927,972
The Directors proposed a final dividend of 40k for the year ended 31 December 2017
39 Contingencies
Claims and litigation
Contingent liability and commitments
Nature of instruments
Acceptances, bonds, guarantees and other obligations for the account of customers:
a. These comprise:
Group Group Bank Bank
December 2017 December 2016 December 2017 December 2016
In thousands of Naira
Contingent liabilities:
Transaction related bonds and guarantees 184,867,177 68,423,783 144,763,718 59,637,792
Financial guarantees 28,837,649 139,954,922 7,976,547 33,160,736
261,805,783 119,826,012 28,157,562 41,798,197
Commitments: - - - -
17,913,690 13,041,247 17,913,690 13,041,247
- - - -
Future, swap and forward contracts - - - -
493,424,299 341,245,964 198,811,517 147,637,972
40 Cash and cash equivalent
(a) Cash and cash equivalents include the following for the purposes of the statement of cash flows:
Group Group Bank Bank
December 2017 December 2016 December 2017 December 2016
In thousands of Naira
Cash on hand and balances with banks 184,867,177 68,423,783 144,763,718 59,637,792
Unrestricted balances with central banks 28,837,649 139,954,922 7,976,547 33,160,736
Money market placements 261,805,783 119,826,012 28,157,562 41,798,197
Investment under management 17,913,690 13,041,247 17,913,690 13,041,247
493,424,299 341,245,964 198,811,517 147,637,972
(b) Reconciliation of movements of liabilities to cash flows arising from financing activities
Group Bank Group Bank
December 2017 December 2017 December 2017 December 2017
Net debt as at 1 January 2017 316,544,502 243,952,418 299,543,707 372,179,785
Proceeds from interest bearing borrowings - - 43,577,454 13,337,948
Repayment of interest bearing borrowings - - (34,371,397) (99,011,336)
Debt securities issued 121,486,981 121,486,981 - -
Repayment of debt securities issued (151,694,953) (79,102,869) - -
Total changes from financing cash flows 286,336,530 286,336,530 308,749,764 286,506,397
The effect of changes in foreign exchange rates 18,173,205 18,173,205 4,664,912 4,319,235
Other changes
Interest expense 35,947,693 35,947,693 12,373,830 11,070,759
Interest paid (38,350,722) (38,350,722) (14,171,319) (19,605,250)
Balance as at 31 December 2017 302,106,706 302,106,706 311,617,187 282,291,140
Other contingent liabilities include transaction related custom and performance bonds and are generally short term commitments to third parties which are not directly
dependent on the customer's credit worthiness. Commitments to lend are agreements to lend to a customer in the future, subject to certain conditions. Such commitments
are either made for a fixed year, or have no specific maturity dates but are cancellable by the lender subject to notice requirements. Documentary credits commit the Group
to make payments to third parties, on production of documents, which are usually reimbursed immediately by customers.
The table below summarises the fair value amount of contingent liabilities and commitments off-financial position risk:
Clean line facilities for letters of credit, unconfirmed letters of credit and
other commitments
The Bank granted clean line facilities for letters of credit during the year to guarantee the performance of customers to third parties.
Contractual capital commitments undertaken by the Bank during the year amounted to N322.2Mn (31 Dec 2016: N365.4Mn)
Cash and cash equivalent for the purpose of the preparation of the statement of cash flows excludes cash collaterals held for letters of credit and the mandatory cash deposit
held with the Central Bank of Nigeria.
Debt securities issued Interest bearing borrowings
The Group is a party to numerous legal actions arising out of its normal business operations. The Directors believe that, based on currently available information and advice
of counsel, none of the outcomes that result from such proceedings will have a material adverse effect on the financial position of the Group, either individually or in the
aggregate. No provision has been made for the year ended 31 December 2017.
In common with other banks, Group conducts business involving acceptances, performance bonds and indemnities. The majority of these facilities are offset by
corresponding obligations of third parties. Contingent liabilities and commitments comprise acceptances, endorsements, guarantees and letters of credit.
An acceptance is undertaken by a bank to pay a bill of exchange drawn on a customer. The Group expects most acceptances to be presented, but reimbursement by the
customer is normally immediate. Endorsements are residual liabilities of the Group in respect of bills of exchange, which have been paid and subsequently rediscounted.
Guarantees and letters of credit are given as security to support the performance of a customer to third parties. As the Group will only be required to meet these obligations
in the event of the customer's default, the cash requirements of these instruments are expected to be considerably below their nominal amounts.
204

Access Bank Plc
Consolidated and separate financial statementsFor the year ended 31 December 2017
41 Contraventions of the Banks and Other Financial Institutions Act of Nigeria and CBN circulars
S/N Regulatory Body Infraction
i) Central Bank of Nigeria
ii) Central Bank of Nigeria
iii) Central Bank of Nigeria
iv) Central Bank of Nigeria
v) Central Bank of Nigeria
vi) Central Bank of Nigeria
vii) Central Bank of Nigeria
42 Events after reporting date
43 Related party transactions
Transactions with key management personnel
Parent
(a) Loans and advances to related parties
year ended 31 December 2017
Directors andother key
managementpersonnel (and
close familymembers) Subsidiaries Total
In thousands of Naira
Balance, beginning of year 1,030,899 92,014,601 93,045,500
Net movement during the year 2,998,509 15,919,197 18,917,706
Balance, end of year 4,029,408 107,933,798 111,963,206
Interest income earned 275,232 1,310,286 1,585,518
Bad or doubtful debts due from related parties expense - - -
The loans issued to directors and other key management personnel (and close family members) as at 31 December 2017 of N4.03Bn are repayable in various cyclesranging from monthly to annually over the tenor. The transactions were carried out at arms length and have an average tenor of 4 years. The loans are collateralisedby a combination of lien on shares of quoted companies, fixed and floating debentures, corporate guarantee, negative pledge, domiciliation of proceeds of company'sreceivables, legal mortgages and cash.
The loan to subsidiaries relates to a foreign interbank placements of USD302M granted during the year. It is a non-collateralised placement advanced at an averageinterest rate of 1.49% and a tenor less than 12 months. This loan has been eliminated on consolidation and does not form part of the reported Group loans andadvances balance.
No impairment losses have been recorded against balances outstanding during the year with key management personnel, and no specific allowance has been madefor impairment losses on balances with key management personnel and their immediate relatives at year end.
The parent company, which is also the ultimate parent company, is Access Bank Plc.
Subsequent to the end of the reporting year, the Board of Directors proposed a final dividend of 40k each payable to shareholders on register of shareholding at theclosure date.There are no other post balance sheet event that require disclosure in these consolidated financial statements.
Parties are considered to be related if one party has the ability to control the other party or exercise influence over the other party in making financial andoperational decisions, or one other party controls both. The definition includes subsidiaries, associates, joint ventures and the Group’s pension schemes, as well askey management personnel.
The Group’s key management personnel, and persons connected with them, are also considered to be related parties. The definition of key management includes theclose members of family of key personnel and any entity over which key management exercise control. The key management personnel have been identified as theexecutive and non-executive directors of the Group. Close members of family are those family members who may be expected to influence, or be influenced by thatindividual in their dealings with Access Bank Plc and its subsidiaries.
The bank granted various credit facilities to its subsidiary companies and key management personnel. Key Management Personnel is defined as members of theBoard of Directors of the bank, including their close members of family and any entity over which they exercise control. Close member of family are those who maybe expected to influence or be influenced by that individual in dealings with the bank.The rates and terms agreed are comparable to other facilities being held in the bank's portfolio. Details of these are described below:
Sum of N60 million in respect of BVN registration
Sum of N6 million in respect of unutilized foreign exchange from CBN
Sum of N2 million in respect of the implementation of external auditors' recommendation
Sum of N2 million for non-compliance as regards Bancassurance
Sum of N2 million in respect of CBN FX examination
Sum of N4 million in respect of injection of capital to subsidiaries
Sum of N2 million in respect of KYC requirement
205

Access Bank Plc
Consolidated and separate financial statementsFor the year ended 31 December 2017
(b) Deposits from related parties
Directors (andclose family
members andrelated entities) Subsidiaries Total
year ended 31 December 2017
In thousands of Naira
Balance, beginning of year 2,038,024 109,626,264 111,664,288
Net movement during the year 1,062,274 67,025,939 68,088,213
Balance, end of year 3,100,298 176,652,203 179,752,501
Interest expenses on deposits 215,665 5,609,001 5,824,665
(c ) Borrowings from related parties
Subsidiaries Total
In thousands of Naira
Borrowings at 1 January 2017 74,425,046 74,425,046
Net movement during the year (74,425,046) (74,425,046)
Borrowings at 31 December 2017 - -
Interest expenses on borrowings 3,268,610 3,268,610
(d) Other balances and transactions with related parties
Directors (andclose family
members andrelated entities) Subsidiaries Total
In thousands of Naira
Cash and cash equivalent - 21,126,935 21,126,935
Deposit from financial institutions - 326,279 326,279
Receivables - 462,754 462,754
Other Liabilities - 347,385 347,385
Fee and commission expense - 716,978 716,978
Off balance sheet exposures - 850,714 850,714
The deposits are majorly term deposit with an average interest rate and tenor of approximately 8.37% and 5months for directors and 3.18% and 3.5 months forsubsidiaries.
The borrowings from subsidiaries represent the borrowings of Access Bank Plc from Access Finance BV in respect of the dollar guaranteed notes issued by AccessFinance B.V, Netherlands which matured on 25 July 2017. The notes were issued on 25 July 2012 for a year of 5 years with the principal amount repayable at the endof the tenor while interest on the Notes is payable semi-annually at 7.34%, in arrears on 25 January and 25 July in each year. The annual effective interest rate is7.79%. In October 2016 , USD 112,997,000 out of USD 350,000,000 was exchanged at a premium for a new note issued by Access Bank Plc.The notes matured on 25 July 2017 and it was fully redeemed.
206

Access Bank Plc
Consolidated and separate financial statementsFor the year ended 31 December 2017
(e) Key management personnel compensation for the year comprises:
Directors’ remuneration
December 2017 December 2016
In thousands of Naira
Non-executive Directors
Fees 58,125 51,875
Other emoluments:
Allowances 411,044 320,335
469,169 372,210
Executive directors
Short term employee's benefit 237,820 264,220
Defined contribution plan 14,364 14,813
Share based payment 39,189 52,960
Long term incentive plan 707,744 -
999,117 331,993
(f) Directors remuneration:
Remuneration paid to directors of the Bank (excluding pension contributions and other benefits) was as follows:
December 2017 December 2016
In thousands of Naira
Fees as Directors 58,125 51,875
Other emoluments 303,982 207,898
Wages and salaries 237,820 264,220
Allowances 107,063 112,438
The Directors remuneration show above includes
December 2017 December 2016
Chairman 50,513 41,993
Highest paid director 85,160 85,160
The emoluments of all other directors fell within the following ranges:
December 2017 December 2016
N13,000,001-N20,000,000 6 6
N20,000,001-N37,000,000 8 8
14 14
207

Access Bank Plc
Consolidated and separate financial statementsFor the year ended 31 December 2017
44
1 Combined Industrial Agro Consult. Ltd. Ex-Chairman Mr. Gbenga Oyebode Term Loan 31,250,000 Performing Corporate Guarantee of Assets Management Group Limited.
2 Asset Management Group Limited Ex-Chairman Mr. Gbenga Oyebode Time loan 1,444,848,074 Performing
3 Sic Property and Investment Company Ltd Ex Non-executive director Mr Ortisedere Otubu Term Loan 119,983,765 Performing 1. Legal Mortgage
2. Personal Guarantee3. Debenture
4 Paul Usoro & Company Non-executive director Mr Paul Usoro Overdraft 8,123,918 Performing Cash collateralCredit Card 46,655,178 Performing Cash collateral
Balance, end of year 1,650,860,935
OutstandingPrincipal
Status Nature of security
1. Pledged properties at Ikoyi Lagos2. Personal guarantee3 Domicilliation of Rental Income
Director-related exposures
Access Bank has some exposures that are related to its Directors. The Bank however follows a strict process before granting such credits to its Directors. The requirements for creating and managing this category of risk assets include the following amongst others:
b. Full compliance with the relevant CBN policies on insider-related lending.c. All affected Directors are precluded from taking part in the approval process of credit request wherein they have interest.
a. Complete adherence to the requirements for granting insider-related exposure as stated in the Bank’s Credit Policy Guidelines, the Insider-related Policy as well as the Bank’s duly approved Standard Operating Procedure for managing insider-relatedexposures.
S/N Name of borrower Relationship to reportinginstitution
Name of relatedDirectors
d. The related Director is required to execute a document authorizing the Bank to use their accruable dividends to defray any related-obligor's delinquent exposures.e. The Directors are required to execute documents for the transfer of their shares to the Bank’s nominated broker to ensure effective control as required by the CBN policy to enhance the bank’s Corporate Governance structure.f. Section 89 of the Bank’s Article of Association also reiterated that “a related Director shall vacate office or cease to be a Director, if the Director directly or indirectly enjoys a facility from the Bank that remains non-performing for a year of more than12months.”
Below is a schedule showing the details of the Bank’s director-related lending:
The Bank’s gross exposure to all its directors as at 31 December 2017 is N1.65bn. However, the relevant obligors under this category also have credit balances and deposits maintained in their bank accounts which mitigate the risks to the bank.
Facility type
208

Access Bank Plc
Consolidated and separate financial statements
For the year ended 31 December 2017
45 Non-audit services
Service Description Sum
N'000
1
9,975
2 11,500
21,475
In the Bank's opinion, the provision of these services to the bank did not impair the independence and objectivity of the external auditor.
During the year, the Bank's auditor, PricewaterHouseCoopers, were awarded the following contracts;
Advisory services on development of recovery and resolution plan to besubmitted to the Central Bank of Nigeria and Nigeria Deposit InsuranceCorporation as part of regulatory requirements for systemically importantfinancial institutions.
Revenue assurance exercise and script development to block income leakagesand facilitate recoveries
Recovery and resolution plan
Automation of revenue assurancereviews
209
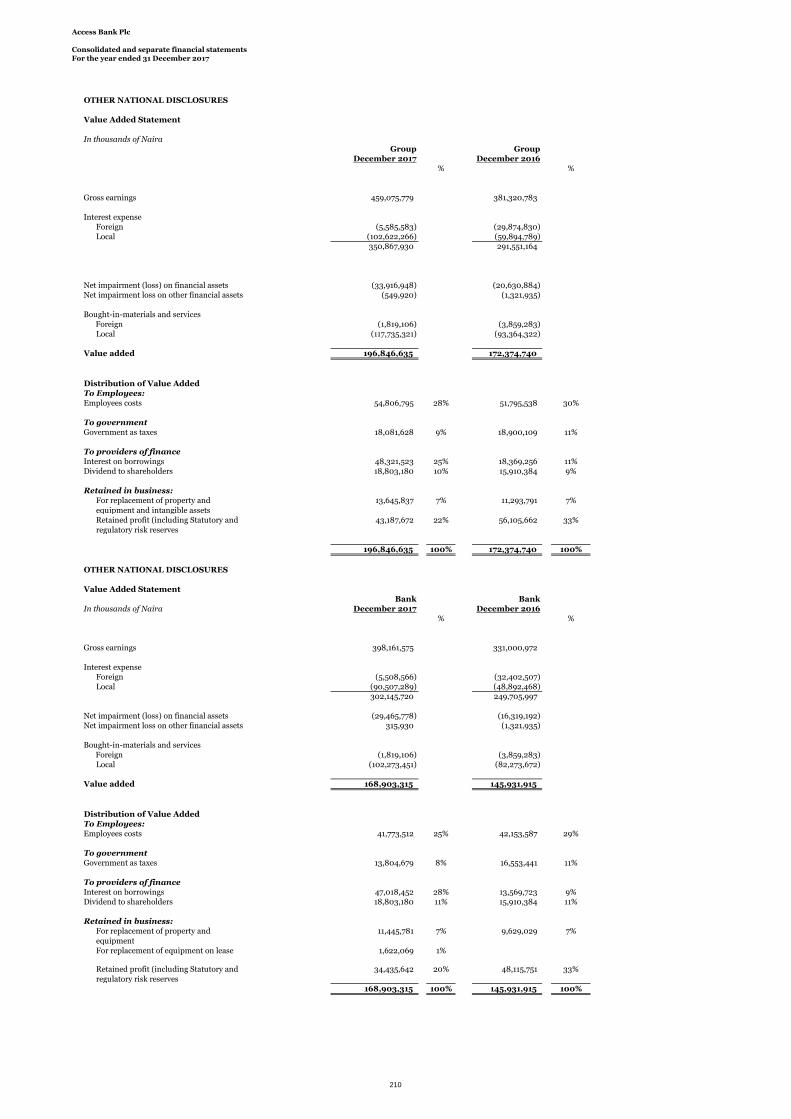
Access Bank Plc
Consolidated and separate financial statementsFor the year ended 31 December 2017
OTHER NATIONAL DISCLOSURES
Value Added Statement
In thousands of NairaGroup Group
December 2017 December 2016% %
Gross earnings 459,075,779 381,320,783
Interest expenseForeign (5,585,583) (29,874,830)Local (102,622,266) (59,894,789)
350,867,930 291,551,164
Net impairment (loss) on financial assets (33,916,948) (20,630,884)Net impairment loss on other financial assets (549,920) (1,321,935)
Bought-in-materials and servicesForeign (1,819,106) (3,859,283)Local (117,735,321) (93,364,322)
Value added 196,846,635 172,374,740
Distribution of Value AddedTo Employees:Employees costs 54,806,795 28% 51,795,538 30%
To governmentGovernment as taxes 18,081,628 9% 18,900,109 11%
To providers of financeInterest on borrowings 48,321,523 25% 18,369,256 11%Dividend to shareholders 18,803,180 10% 15,910,384 9%
Retained in business:For replacement of property andequipment and intangible assets
13,645,837 7% 11,293,791 7%
Retained profit (including Statutory andregulatory risk reserves
43,187,672 22% 56,105,662 33%
196,846,635 100% 172,374,740 100%
OTHER NATIONAL DISCLOSURES
Value Added StatementBank Bank
In thousands of Naira December 2017 December 2016% %
Gross earnings 398,161,575 331,000,972
Interest expenseForeign (5,508,566) (32,402,507)Local (90,507,289) (48,892,468)
302,145,720 249,705,997
Net impairment (loss) on financial assets (29,465,778) (16,319,192)Net impairment loss on other financial assets 315,930 (1,321,935)
Bought-in-materials and servicesForeign (1,819,106) (3,859,283)Local (102,273,451) (82,273,672)
Value added 168,903,315 145,931,915
Distribution of Value AddedTo Employees:Employees costs 41,773,512 25% 42,153,587 29%
To governmentGovernment as taxes 13,804,679 8% 16,553,441 11%
To providers of financeInterest on borrowings 47,018,452 28% 13,569,723 9%Dividend to shareholders 18,803,180 11% 15,910,384 11%
Retained in business:For replacement of property andequipment
11,445,781 7% 9,629,029 7%
For replacement of equipment on lease 1,622,069 1%
Retained profit (including Statutory andregulatory risk reserves
34,435,642 20% 48,115,751 33%
168,903,315 100% 145,931,915 100%
210

Access Bank Plc
Consolidated and separate financial statementsFor the year ended 31 December 2017
OTHER NATIONAL DISCLOSURES
Other financial Information
Five-year Financial Summary
December 2017 December 2016 December 2015 December 2014 December 2013
Group
12 months 12 months 12 months 12 months 12 months
In thousands of Naira N’000 N’000 N’000 N’000 N’000
Assets
Cash and balances with banks 953,944,176 713,889,105 478,409,336 405,014,793 439,459,541
Investment under management 20,257,131 14,871,247 10,403,608 - -
Non pledged trading assets 46,854,061 44,629,579 52,298,422 28,411,644 3,877,969
Pledged assets 447,114,404 314,947,502 203,715,397 87,072,147 63,409,851
Derivative financial instruments 93,419,293 156,042,984 77,905,020 24,866,681 102,123
Loans and advances to banks 68,114,076 45,203,002 42,733,910 12,435,659 24,579,875
Loans and advances to customers 1,995,987,627 1,809,459,172 1,365,830,831 1,110,464,442 786,169,703
Trading properties - - - - -
Investment securities 278,167,757 229,113,772 186,223,126 270,211,388 353,811,348
Insurance receivables - - - -
Other assets 82,753,431 63,255,054 83,014,503 56,310,620 52,019,723
Investment properties - - - - 23,974,789
Investments in equity accounted investee - - - - 3,623,326
Investment in subsidiary - - - - -
Property and equipment 97,114,640 84,109,052 73,329,927 69,659,707 67,243,305
Intangible assets 8,295,855 6,939,555 6,440,616 5,592,991 3,659,072
Deferred tax assets 740,402 1,264,813 10,845,612 10,881,984 10,687,635
Assets classified as held for sale 9,479,967 140,727 179,843 23,438,484 2,847,740
Total assets 4,102,242,820 3,483,865,564 2,591,330,151 2,104,360,540 1,835,466,000
Liabilities
Deposits from financial institutions 450,196,970 167,356,583 72,914,421 119,045,423 72,147,956
Deposits from customers 2,244,879,075 2,089,197,286 1,683,244,320 1,454,419,052 1,331,418,659
Derivative financial instruments 5,332,177 30,444,501 3,077,927 1,989,662 32,955
Claims payable - - - - -
Current tax liabilities 7,489,586 5,938,662 7,780,824 8,180,969 6,899,558
Other liabilities 253,914,174 113,571,240 69,355,947 21,689,079 56,847,216
Deferred tax liabilities 8,764,262 3,699,050 266,644 59,038 37,861
Liabilities on investment contracts - - - - -
Liabilities on insurance contracts - - - - -
Debt securities issued 302,106,706 316,544,502 149,853,640 138,481,179 55,828,248
Interest-bearing borrowings 311,617,187 299,543,707 231,467,161 79,816,309 64,338,982
Retirement benefit obligations 2,495,274 3,075,453 5,567,800 3,269,100 1,933,021
Contingent settlement provisions - - - - -
Liabilities classified as held for sale - - - - 1,499,495
Total liabilities 3,586,795,411 3,029,370,984 2,223,528,684 1,826,949,811 1,590,983,951
Equity
Share capital and share premium 212,438,802 212,438,802 212,438,802 172,477,671 172,477,671
Retained earnings 117,701,679 93,614,030 51,730,369 34,139,453 22,232,374
Other components of equity 178,399,413 142,194,720 99,732,330 67,262,761 48,003,894
Non controlling interest 6,907,515 6,247,028 3,899,966 3,530,844 1,768,110
Total equity 515,447,409 454,494,580 367,801,467 277,410,729 244,482,049
Total liabiities and Equity 4,102,242,819 3,483,865,564 2,591,330,151 2,104,360,540 1,835,466,000
Gross earnings 459,075,779 381,320,783 337,404,230 245,383,536 206,891,219
Profit before income tax 80,072,482 90,339,456 75,038,117 52,022,290 44,996,410
Profit from continuing operations 61,990,852 71,439,347 65,868,773 43,063,479 36,101,830
Discontinued operations - - - (87,267) 265,760
Profit for the year 61,990,852 71,439,347 65,868,773 42,976,212 36,367,590
Non controlling interest 13,090 322,322 536,233 560,883 195,762
Profit attributable to equity holders 61,977,762 71,117,024 65,332,540 42,415,329 36,171,828
Dividend paid 18,803,180 15,910,384 15,241,014 13,729,777 13,729,777
Earning per share - Basic 218k 249k 265k 189k 158k- Adjusted 214k 245k 262k 189k 158k
Number of ordinary shares of 50k 28,927,971,631 28,927,971,631 28,927,971,631 22,882,918,908 22,882,918,908
211

Access Bank Plc
Consolidated and separate financial statementsFor the year ended 31 December 2017
OTHER NATIONAL DISCLOSURES
Other financial Information
Five-year Financial Summary
December 2017 December 2016 d December 2015 December 2014 December 2013
Bank
12 months 12 months 12 months 12 months 12 months
In thousands of Naira N’000 N’000 N’000 N’000 N’000
Assets
Cash and balances with banks 657,144,247 517,997,249 405,998,636 351,174,879 395,808,747
Investment under management 20,257,131 14,871,247 10,403,608 - -
Non pledged trading assets 43,016,990 44,629,579 52,298,422 28,411,644 3,877,969
Pledged assets 440,503,327 314,947,502 200,464,624 85,183,353 63,347,823
Derivative financial instruments 92,390,219 155,772,662 77,852,349 24,831,145 72,675
Loans and advances to banks 101,429,001 104,006,574 60,414,721 55,776,837 13,048,651
Loans and advances to customers 1,771,282,739 1,594,562,345 1,243,215,309 1,019,908,848 735,300,741
Trading properties - - - - -
Investment securities 121,537,303 161,200,642 155,994,798 226,137,983 309,071,802
Insurance receivables - - - - -
Other assets 65,189,797 50,594,480 78,623,381 48,246,307 44,326,360
Investment properties - - - - 23,974,789
Investments in equity accounted investee - - - - 1,521,812
Investment in subsidiary 87,794,631 59,239,252 45,439,246 40,120,572 38,029,992
Property and equipment 83,676,722 71,824,472 65,900,384 64,160,327 63,203,245
Intangible assets 5,981,905 5,173,784 4,977,908 4,436,814 2,661,553
Deferred tax assets - - 10,180,832 10,128,537 9,847,853
Assets classified as held for sale 9,479,967 140,727 179,843 23,438,484 -
Total assets 3,499,683,979 3,094,960,515 2,411,944,061 1,981,955,730 1,704,094,012
Liabilities
Deposits from banks 276,140,835 95,122,188 63,343,785 134,509,662 61,295,352
Deposits from customers 1,910,773,713 1,813,042,872 1,528,213,883 1,324,800,611 1,217,176,793
Derivative financial instruments 5,306,450 30,275,181 2,416,378 1,737,791 -
Debt securities issued 302,106,706 243,952,418 78,516,655 73,155,391 -
Claims payable - - -
Current tax liabilities 4,547,920 5,004,160 6,442,311 7,113,226 6,075,590
Other liabilities 238,695,686 107,538,941 64,094,358 16,870,132 52,092,559
Retirement benefit obligations 2,481,916 3,064,597 5,567,800 3,267,364 -
Liabilities on investment contracts - - -
Liabilities on insurance contracts - - - - -
Interest-bearing borrowings 282,291,141 372,179,785 302,919,987 146,345,767 120,342,026
Contingent settlement provisions - - - - 1,929,695
Deferred tax liabilities 7,848,515 3,101,753 - - -
Liabilities classified as held for sale - - - - -
Total liabilities 3,030,192,882 2,673,281,895 2,051,515,157 1,707,799,944 1,458,912,015
Equity
Share capital and share premium 212,438,802 212,438,802 212,438,802 172,477,671 172,477,671
Retained earnings 120,218,603 93,329,188 49,459,102 36,499,779 23,095,392
Other components of equity 136,833,692 115,910,630 98,531,000 65,178,336 49,608,934
Total equity 469,491,098 421,678,620 360,428,904 274,155,786 245,181,997
Total liabilities and Equity 3,499,683,979 3,094,960,515 2,411,944,061 1,981,955,730 1,704,094,012
Gross earnings 398,161,575 331,000,972 302,061,975 221,610,769 182,888,906
Profit before income tax 67,043,501 80,579,576 65,177,914 46,142,422 31,365,396
Profit for the year 53,238,822 64,026,135 65,868,773 39,941,126 26,211,844
Dividend paid 18,803,180 15,910,384 13,729,777 13,729,777 12,588,538
Earning per share - Basic 184k 237k 174k 114k 157k
- Adjusted 184k 237k 174k 114k 157k
Number of ordinary shares of 50k 28,927,971,631 28,927,971,631 22,882,918,908 22,882,918,908 22,882,918,908
212


