NREL is a national laboratory of the U.S. Department of Energy, Office of Energy Efficiency & Renewable Energy, operated by the Alliance for Sustainable Energy, LLC.
This report is available at no cost from the National Renewable Energy Laboratory (NREL) at www.nrel.gov/publications.
Contract No. DE-AC36-08GO28308
Acoustic Noise Test Report for the SWIFT Wind Turbine in Boulder, CO Jason Roadman and Arlinda Huskey National Renewable Energy Laboratory
Technical Report NREL/TP-5000-58244 April 2013
NREL is a national laboratory of the U.S. Department of Energy, Office of Energy Efficiency & Renewable Energy, operated by the Alliance for Sustainable Energy, LLC.
This report is available at no cost from the National Renewable Energy Laboratory (NREL) at www.nrel.gov/publications.
National Renewable Energy Laboratory 15013 Denver West Parkway Golden, Colorado 80401 303-275-3000 • www.nrel.gov
Contract No. DE-AC36-08GO28308
Acoustic Noise Test Report for the SWIFT Wind Turbine in Boulder, CO Jason Roadman and Arlinda Huskey National Renewable Energy Laboratory
Prepared under Task No. WE11.0206
Technical Report NREL/TP-5000-58244 April 2013

NOTICE
This report was prepared as an account of work sponsored by an agency of the United States government. Neither the United States government nor any agency thereof, nor any of their employees, makes any warranty, express or implied, or assumes any legal liability or responsibility for the accuracy, completeness, or usefulness of any information, apparatus, product, or process disclosed, or represents that its use would not infringe privately owned rights. Reference herein to any specific commercial product, process, or service by trade name, trademark, manufacturer, or otherwise does not necessarily constitute or imply its endorsement, recommendation, or favoring by the United States government or any agency thereof. The views and opinions of authors expressed herein do not necessarily state or reflect those of the United States government or any agency thereof.
This report is available at no cost from the National Renewable Energy Laboratory (NREL) at www.nrel.gov/publications.
Available electronically at http://www.osti.gov/bridge
Available for a processing fee to U.S. Department of Energy and its contractors, in paper, from:
U.S. Department of Energy Office of Scientific and Technical Information P.O. Box 62 Oak Ridge, TN 37831-0062 phone: 865.576.8401 fax: 865.576.5728 email: mailto:[email protected]
Available for sale to the public, in paper, from:
U.S. Department of Commerce National Technical Information Service 5285 Port Royal Road Springfield, VA 22161 phone: 800.553.6847 fax: 703.605.6900 email: [email protected] online ordering: http://www.ntis.gov/help/ordermethods.aspx
Cover Photos: (left to right) PIX 16416, PIX 17423, PIX 16560, PIX 17613, PIX 17436, PIX 17721
Printed on paper containing at least 50% wastepaper, including 10% post consumer waste.

Swift IEC Acoustic Noise Report 130215 Page 1 of 39
Acoustic Noise Test Report for the
SWIFT Wind Turbine in
Boulder, CO
Conducted for
National Renewable Energy Laboratory 15013 Denver West Parkway
Golden, Colorado 80401
Conducted by
National Wind Technology Center National Renewable Energy Laboratory
15013 Denver West Parkway Golden, Colorado 80401
Jason Roadman Arlinda Huskey
28 February 2013
Swift IEC Acoustic Noise Report 130215 Page 2 of 39

Swift IEC Acoustic Noise Report 130215 Page 3 of 39
Table of Contents 1 Background ........................................................................................................................................... 5 2 Test Summary ....................................................................................................................................... 5 3 Test Turbine Configuration ................................................................................................................. 6 4 Test Site Description ............................................................................................................................ 8 5 Test Equipment ..................................................................................................................................... 9
5.1 Equipment Descriptions ................................................................................................................... 9 5.2 Instrument Locations ..................................................................................................................... 10
6 Results ................................................................................................................................................. 10 6.1 Test Conditions .............................................................................................................................. 10 6.2 Standardized Wind Speed Calculation ........................................................................................... 10 6.3 Apparent Sound Power Level ........................................................................................................ 11 6.4 One-Third Octave Analysis ........................................................................................................... 13 6.5 Tonality .......................................................................................................................................... 15 6.6 Uncertainty ..................................................................................................................................... 18
7 Exceptions ........................................................................................................................................... 18 7.1 Exceptions to the Standard ............................................................................................................. 18 7.2 Exceptions to the Quality Assurance System ................................................................................ 18
References ................................................................................................................................................. 19 Appendix B. Pictures ................................................................................................................................ 21 Appendix C. Calibration Sheets .............................................................................................................. 24 List of Tables Table 1. Test Results Summary ................................................................................................................. 6 Table 2. SWIFT Wind Turbine General Data ............................................................................................. 6 Table 3. Sources of Noise Near the Turbine ............................................................................................. 8 Table 4. Equipment Used for Acoustic Test ............................................................................................. 9 Table 5. Reference Microphone Positions for Turbine and Background Measurements ................. 10 Table 6. Test Parameters Used in Wind Speed Calculations ............................................................... 11 Table 7. Sound Pressure and Power Levels for Standardized Integer Wind Speeds ........................ 12 (6 m/s Through 11 m/s) ............................................................................................................................. 12 Table 8. One-Third Octave Analysis for Wind Speed Bins 6 Through 8 m/s ...................................... 13 Table 9. One-Third Octave Analysis for Wind Speed Bins 9 Through 11 m/s .................................... 14 Table 10. Tonality Results (In dBA) ......................................................................................................... 16 Table 11. Type B Uncertainty Components for Sound Power Levels and Tonality ........................... 18 Table 12. AWEA Rated Sound Level ....................................................................................................... 20

Swift IEC Acoustic Noise Report 130215 Page 4 of 39
List of Figures Figure 1. SWIFT test turbine at the NWTC ................................................................................................ 7 Figure 2. Map of the test site ..................................................................................................................... 8 Figure 3. Measured and binned sound pressure levels as ................................................................... 11 a function of the standardized wind speed ............................................................................................ 11 Figure 4. Sound power levels as a function of the standardized wind speed .................................... 12 Figure 5. One-third octave levels ............................................................................................................ 15 Figure 6. Classification of spectral lines for the 3,849 Hz tone (typical in the 10 m/s bin) ............... 17 Figure 7. Classification of spectral lines for the 3,921 Hz tone (typical in the 11 m/s bin) ............... 17 Figure B1. Picture of the sound board during the test ......................................................................... 21 Figure B2. The test turbine as viewed from the reference microphone position ............................... 22 Figure B3. The test turbine as viewed from the meteorological mast ................................................. 23 Figure C1. Calibration sheet for the microphone 2406811 ................................................................... 24 Figure C2. Calibration sheet for the microphone 2406809 ................................................................... 25 Figure C3. Calibration sheet for the sound level meter ........................................................................ 26 Figure C4. Calibration sheet for the acoustic calibrator ....................................................................... 27 Figure C5. Calibration sheet for the primary anemometer ................................................................... 28 Figure C6. Post-test calibration sheet for the primary anemometer ................................................... 29 Figure C7. Page 1 of the power transducer calibration sheet .............................................................. 30 Figure C8. Calibration sheet for the pressure transducer .................................................................... 31 Figure C9. Calibration sheet for the temperature sensor ..................................................................... 32 Figure C10. Calibration sheet for the wind vane ................................................................................... 33 Figure C11. Calibration sheet for the signal conditioning module 1496266 ....................................... 34 Figure C12. Post-test calibration sheet for the signal conditioning module 1496266 ....................... 35 Figure C13. Calibration sheet for the signal conditioning module 14A34EE ..................................... 36 Figure C15. Calibration sheet for the signal conditioning module 1494F69 ....................................... 38 Figure C16. Post-test calibration sheet for the signal conditioning module 1494F69 ....................... 39
Swift IEC Acoustic Noise Report 130215 Page 5 of 39
1 Background An acoustic noise test was conducted as part of the U.S. Department of Energy’s (DOE’s) Independent Testing project. This project was established to help reduce the barriers of wind energy expansion by providing independent testing results for small wind turbines. Several turbines were selected for testing at the National Wind Technology Center (NWTC), as a part of the Small Wind Turbine Independent Testing project. Acoustic noise testing is one of up to five tests that may be performed on turbines. Other tests include duration, safety and function, power performance, and power quality. Located in Grand Rapids, Michigan, Cascade Engineering is the North American distributor of the SWIFT turbine (manufactured by Renewable Devices). Cascade Engineering was the recipient of the DOE grant and provided the turbine for testing.
The primary goal of this test was to characterize the acoustic emissions of the SWIFT wind turbine in accordance with the International Electrotechnical Commission’s (IEC) standard, Wind Turbine Generator Systems - Part 11: Acoustic Noise Measurement Techniques, IEC 61400-11, Edition 2.1, 2006-11; hereafter referred to as the “Standard.” This test report documents the measurement techniques, turbine configuration, test site, test equipment, and results for the following quantities at integer wind speeds from 6 to 11 m/s:
• Apparent sound power level
• Third octave band levels
• Tonality. Engineers at the NWTC conducted the acoustic noise test in accordance with the National Renewable Energy Laboratory’s (NREL’s) quality system procedures to ensure that this final test report meets the full requirements accreditation by A2LA. NREL’s quality system procedures require that the test meet all applicable requirements specified by A2LA and ISO/IEC 17025 (or to note any exceptions in the test report).
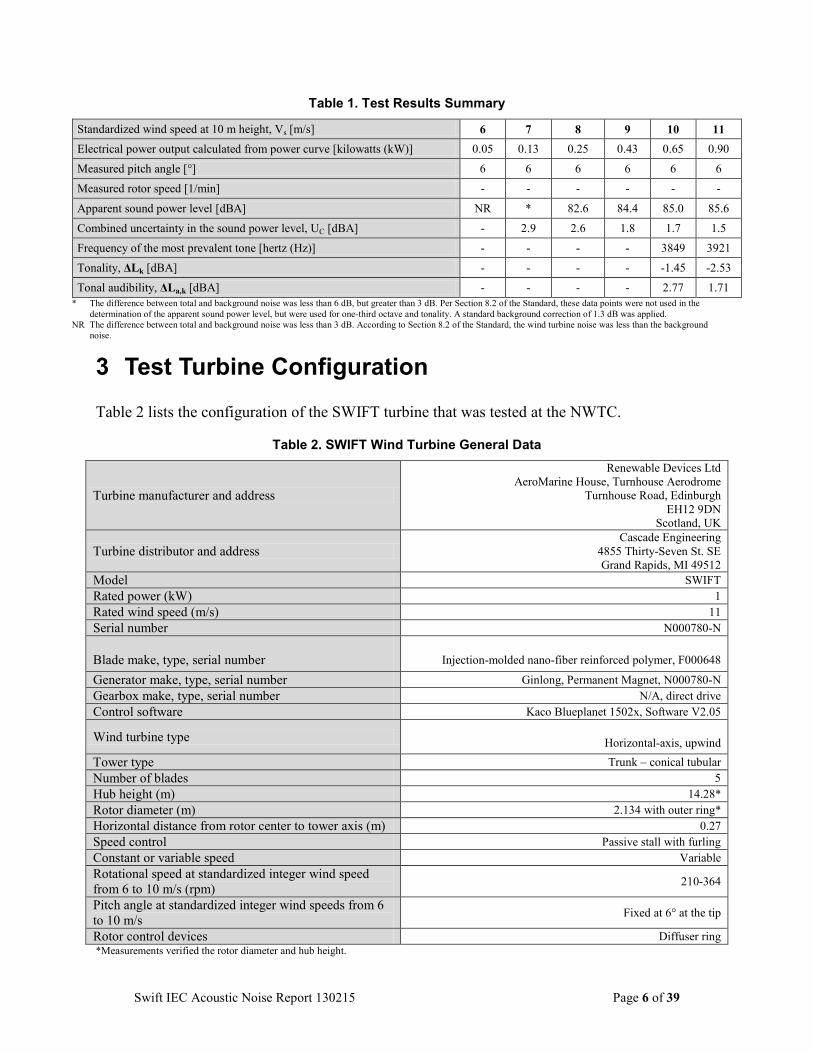
2 Test Summary The turbine was tested in accordance with the Standard. Turbine acoustic emissions and meteorological data were collected on 6 April 2012, 24 May 2012, and 28 May 2012. Standardized wind speed (at 10 m) was derived from wind speed measured at hub height (14.28 m). Table 1 gives a summary of the test results.
Swift IEC Acoustic Noise Report 130215 Page 6 of 39
Table 1. Test Results Summary
Standardized wind speed at 10 m height, Vs [m/s] 6 7 8 9 10 11 Electrical power output calculated from power curve [kilowatts (kW)] 0.05 0.13 0.25 0.43 0.65 0.90
Measured pitch angle [°] 6 6 6 6 6 6
Measured rotor speed [1/min] - - - - - -
Apparent sound power level [dBA] NR * 82.6 84.4 85.0 85.6
Combined uncertainty in the sound power level, UC [dBA] - 2.9 2.6 1.8 1.7 1.5
Frequency of the most prevalent tone [hertz (Hz)] - - - - 3849 3921
Tonality, ΔLk [dBA] - - - - -1.45 -2.53
Tonal audibility, ΔLa,k [dBA] - - - - 2.77 1.71 * The difference between total and background noise was less than 6 dB, but greater than 3 dB. Per Section 8.2 of the Standard, these data points were not used in the
determination of the apparent sound power level, but were used for one-third octave and tonality. A standard background correction of 1.3 dB was applied. NR The difference between total and background noise was less than 3 dB. According to Section 8.2 of the Standard, the wind turbine noise was less than the background
noise.
3 Test Turbine Configuration Table 2 lists the configuration of the SWIFT turbine that was tested at the NWTC.
Table 2. SWIFT Wind Turbine General Data
Turbine manufacturer and address
Renewable Devices Ltd AeroMarine House, Turnhouse Aerodrome
Turnhouse Road, Edinburgh EH12 9DN
Scotland, UK
Turbine distributor and address Cascade Engineering
4855 Thirty-Seven St. SE Grand Rapids, MI 49512
Model SWIFT Rated power (kW) 1 Rated wind speed (m/s) 11 Serial number N000780-N
Blade make, type, serial number Injection-molded nano-fiber reinforced polymer, F000648
Generator make, type, serial number Ginlong, Permanent Magnet, N000780-N Gearbox make, type, serial number N/A, direct drive Control software Kaco Blueplanet 1502x, Software V2.05
Wind turbine type Horizontal-axis, upwind Tower type Trunk – conical tubular Number of blades 5 Hub height (m) 14.28* Rotor diameter (m) 2.134 with outer ring* Horizontal distance from rotor center to tower axis (m) 0.27 Speed control Passive stall with furling Constant or variable speed Variable Rotational speed at standardized integer wind speed from 6 to 10 m/s (rpm) 210-364
Pitch angle at standardized integer wind speeds from 6 to 10 m/s Fixed at 6° at the tip
Rotor control devices Diffuser ring *Measurements verified the rotor diameter and hub height.

Swift IEC Acoustic Noise Report 130215 Page 7 of 39
Figure 1. SWIFT test turbine at the NWTC
(Photo by Ismael Mendoza, NREL 22083)

Swift IEC Acoustic Noise Report 130215 Page 8 of 39
4 Test Site Description The SWIFT wind turbine was located at test site 3.1 of the NWTC, approximately 8 km south of Boulder, Colorado. The site consists of mostly flat terrain with short vegetation (see Appendix A for photos) and has prevailing winds bearing 292° relative to true north. Figure 2 shows the turbine and meteorological tower locations, as well as nearby obstructions. NREL limited assessments of power and energy production to data obtained when winds were within the 178° to 311° measurement sector. In this measurement sector, the influence of terrain and obstructions on the anemometer is small and meets the requirements of IEC 61400-12-1(without conducting a site calibration test). Table 3 lists the nearby turbines and whether or not they were operating during data collection.
Figure 2. Map of the test site
(Source: NREL 2011)
Table 3. Sources of Noise Near the Turbine
Source Location Shutdown for noise test E 1.5 4.0 Yes Alstom ECO100 3.0 MW 4.1 Yes Controls Advanced Research Turbine (CART)-3 4.3 Yes CART-2 4.3 Yes Siemens 2.3 MW 4.4 No Southwest Windpower Skystream (Two turbines) 3.2 Yes Viryd CS8 3.3 Yes NW100 1.2 No Test shed heating, ventilating, and air conditioning (HVACs) 3.1, 3.2, 3.3 Yes
Sound Boards

Swift IEC Acoustic Noise Report 130215 Page 9 of 39
5 Test Equipment 5.1 Equipment Descriptions Table 4 shows the equipment used for the test. All instruments meet the requirements defined by the Standard.
Table 4. Equipment Used for Acoustic Test
Instrument Manufacturer Model Number
Serial Number
Calibration Due Date
Digital recorder and signal analyzer
Delta Acoustics NoiseLab 1258E43 9 Nov 2012
Microphone Bruel & Kjaer 4189-A-021 2395209 2395206
8 Nov 2012 8 Nov 2012
Preamplifier Bruel & Kjaer 4012 2373721 2373719
8 Nov 2012 8 Nov 2012
Calibrator Bruel & Kjaer 4231 2388951 19 Dec 2012
Anemometer Thies First Class 0609006 7 Apr 2012 Wind vane Met One SS 201 W5515 25 Oct 2012 Nacelle anemometer
NA NA NA NA
Pressure sensor Vaisala PTB101B C1040008 25 Oct 2012 Temperature sensor
Met One T-200 0603-1 20 Oct 2012
Power transducer Secondwind Phaser 5FM-4A20
04607 8 Nov 2012
Data acquisition National Instruments
CompactDAQ w/ LabView cDAQ-9172 NI 9229 NI 9217 NI 9205
13AB4F9 14A34EE 1494F69 1496266
NA 22 Mar 2012 22 Mar 2012 22 Mar 2012
The calibration on the primary anemometer and the data acquisition modules expired during the test. Post-test calibration sheets are included in Appendix C. The anemometer and modules were found to be within tolerance.

Swift IEC Acoustic Noise Report 130215 Page 10 of 39
5.2 Instrument Locations The primary anemometer on the meteorological tower was used to derive the standardized wind speed. This tower was located 5.20 m from the test turbine, at a bearing of 302o true north, with the anemometer at a height of 14.33 m. The wind vane was mounted at a height of 11.35 m on the meteorological tower. The turbine was 2.4 rotor diameters from the meteorological tower, within the range of 2 and 4 rotor diameters specified in the Standard.
Table 5 provides the location of the microphone for the measurement sessions.
Table 5. Reference Microphone Positions for Turbine and Background Measurements
Microphone Distance Turbine
[m]
Slant Distance
[m]
Position Relative to Turbine [deg true]
6 Apr 2012 16.54 22.05 80 24 May 2012 16.34 21.90 110 28 May 2012 16.34 21.90 110
6 Results 6.1 Test Conditions The analysis was done using the measured wind speed and 10-second averages of the data. NREL engineers have found that using 10-second averages instead of 1-minute averages better characterizes the dynamic nature of small turbines. The range of standardized wind speeds and wind directions used for the analysis were 2.1 to 18.1 m/s and 245.8 to 304.8 degrees, respectively. The range of temperature and pressure were 9.7°C to 18.1°C and 80.4 kPa to 81.3 kPa, respectively.
6.2 Standardized Wind Speed Calculation Standardized wind speed, Vs, was calculated using Equation 1 and the values in Table 6, where Vz is the measured wind speed.
=
00
00
lnln
lnln
zz
zH
zH
zz
VV
ref
ref
ref
zs (1)
Swift IEC Acoustic Noise Report 130215 Page 11 of 39
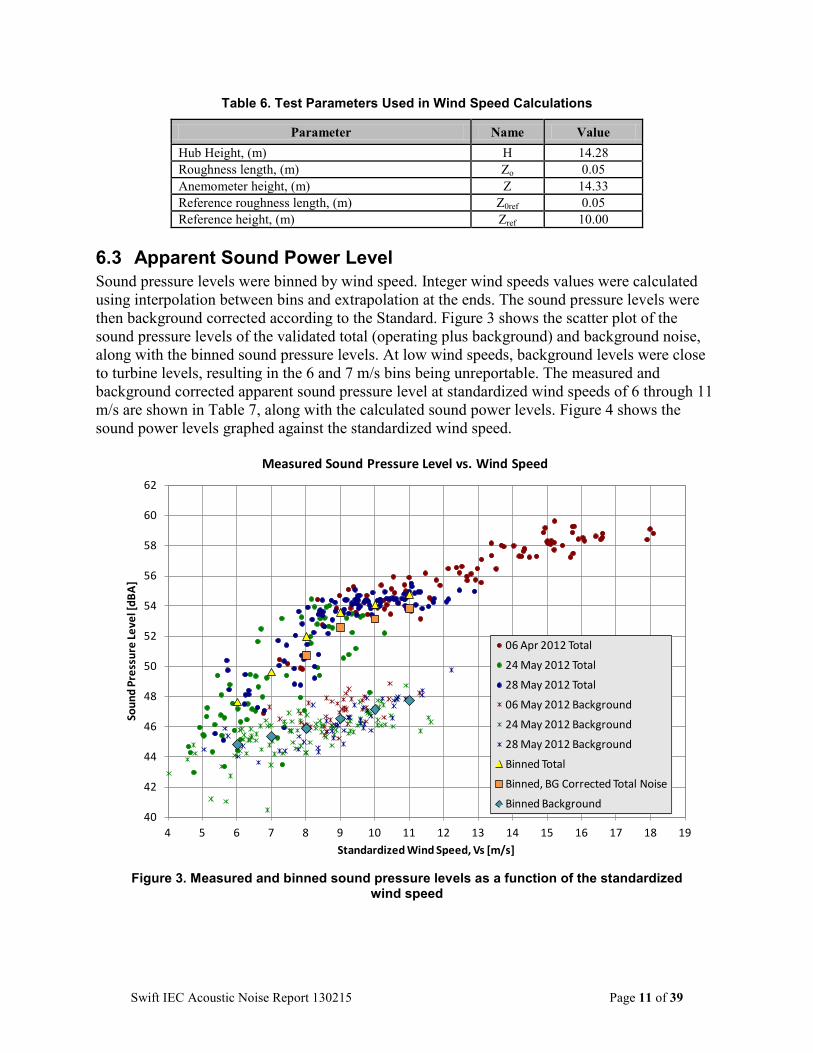
Table 6. Test Parameters Used in Wind Speed Calculations
Parameter Name Value Hub Height, (m) H 14.28 Roughness length, (m) Zo 0.05 Anemometer height, (m) Z 14.33 Reference roughness length, (m) Z0ref 0.05 Reference height, (m) Zref 10.00
6.3 Apparent Sound Power Level Sound pressure levels were binned by wind speed. Integer wind speeds values were calculated using interpolation between bins and extrapolation at the ends. The sound pressure levels were then background corrected according to the Standard. Figure 3 shows the scatter plot of the sound pressure levels of the validated total (operating plus background) and background noise, along with the binned sound pressure levels. At low wind speeds, background levels were close to turbine levels, resulting in the 6 and 7 m/s bins being unreportable. The measured and background corrected apparent sound pressure level at standardized wind speeds of 6 through 11 m/s are shown in Table 7, along with the calculated sound power levels. Figure 4 shows the sound power levels graphed against the standardized wind speed.
Figure 3. Measured and binned sound pressure levels as a function of the standardized
wind speed
40
42
44
46
48
50
52
54
56
58
60
62
4 5 6 7 8 9 10 11 12 13 14 15 16 17 18 19
Soun
d Pr
essu
re Le
vel [
dBA]
Standardized Wind Speed, Vs [m/s]
Measured Sound Pressure Level vs. Wind Speed
06 Apr 2012 Total
24 May 2012 Total
28 May 2012 Total
06 May 2012 Background
24 May 2012 Background
28 May 2012 Background
Binned Total
Binned, BG Corrected Total Noise
Binned Background
Swift IEC Acoustic Noise Report 130215 Page 12 of 39
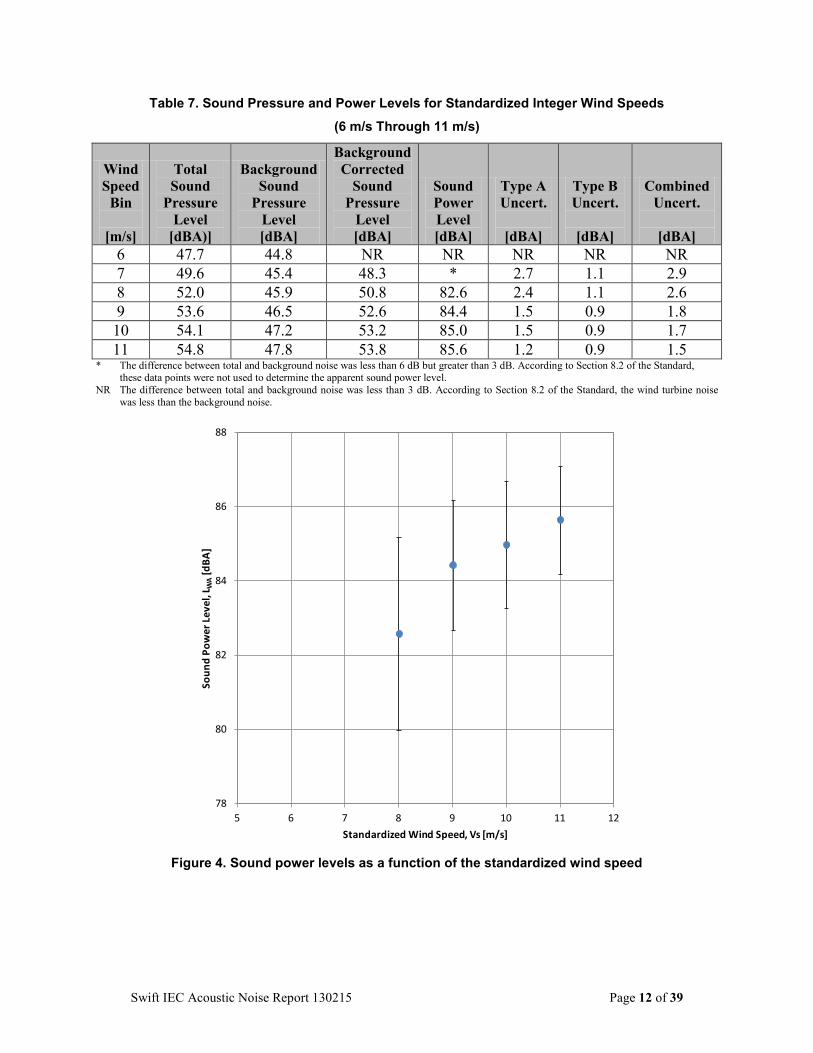
Table 7. Sound Pressure and Power Levels for Standardized Integer Wind Speeds
(6 m/s Through 11 m/s)
* The difference between total and background noise was less than 6 dB but greater than 3 dB. According to Section 8.2 of the Standard, these data points were not used to determine the apparent sound power level.
NR The difference between total and background noise was less than 3 dB. According to Section 8.2 of the Standard, the wind turbine noise was less than the background noise.
Figure 4. Sound power levels as a function of the standardized wind speed
78
80
82
84
86
88
5 6 7 8 9 10 11 12
Soun
d Po
wer
Leve
l, L W
A[d
BA]
Standardized Wind Speed, Vs [m/s]
Wind Speed
Bin
[m/s]
Total Sound
Pressure Level
[dBA)]
Background Sound
Pressure Level [dBA]
Background Corrected
Sound Pressure
Level [dBA]
Sound Power Level [dBA]
Type A Uncert.
[dBA]
Type B Uncert.
[dBA]
Combined Uncert.
[dBA]
6 47.7 44.8 NR NR NR NR NR 7 49.6 45.4 48.3 * 2.7 1.1 2.9 8 52.0 45.9 50.8 82.6 2.4 1.1 2.6 9 53.6 46.5 52.6 84.4 1.5 0.9 1.8 10 54.1 47.2 53.2 85.0 1.5 0.9 1.7 11 54.8 47.8 53.8 85.6 1.2 0.9 1.5

Swift IEC Acoustic Noise Report 130215 Page 13 of 39
6.4 One-Third Octave Analysis One-third octave levels were analyzed at standardized wind speeds of 6, 7, 8, 9, 10, and 11 m/s. The results (with uncertainty) are provided in Table 8, Table 9, and Figure 5.
Table 8. One-Third Octave Analysis for Wind Speed Bins 6 Through 8 m/s
Center Frequency
6 m/s One-Third Octave
Levels
7 m/s One-Third Octave
Levels
8 m/s One-Third Octave
Levels [Hz] [dBA] [dBA] [dBA] 50 NR NR NR 63 NR NR NR 80 29.6* ± 2.3 NR NR 100 NR NR NR 125 NR NR NR 160 NR NR NR 200 38.8* ± 2.1 NR NR 250 NR 39.8 ± 2.2 42.3 ± 1.9 315 NR NR 38.7* ± 2.1 400 NR NR NR 500 35.4* ± 2.1 40.2 ± 2.1 40.4 ± 1.9 630 34.9* ± 2.0 37.7* ± 2.1 40.6 ± 2.0 800 NR 37.6* ± 2.2 41.5 ± 2.0 1000 34.6* ± 2.1 38.7 ± 2.1 42.5 ± 2.0 1250 36.3 ± 2.0 38.9 ± 2.1 42.6 ± 2.0 1600 32.0 ± 2.1 36.3 ± 2.2 40.4 ± 2.0 2000 29.5 ± 2.1 32.6 ± 2.1 36.4 ± 2.0 2500 NR 27.4* ± 2.2 31.9 ± 2.1 3150 NR NR 27.7* ± 2.1 4000 28.4 ± 2.4 NR 25.3* ± 2.0 5000 NR NR NR 6300 NR NR NR 8000 NR NR NR 10000 NR NR NR
* The difference between total and background noise was less than 6 dB but greater than 3 dB. A standard background correction of 1.3 dB was applied according to Section 8.2 of the Standard.
NR The difference between total and background noise was less than 3 dB. According to Section 8.2 of the Standard, the wind turbine noise was less than the background noise.

Swift IEC Acoustic Noise Report 130215 Page 14 of 39
Table 9. One-Third Octave Analysis for Wind Speed Bins 9 Through 11 m/s
Center Frequency
9 m/s One-Third Octave
Levels
10 m/s One-Third Octave
Levels
11 m/s One-Third Octave
Levels [Hz] [dBA] [dBA] [dBA] 50 NR NR NR 63 NR NR NR 80 NR NR NR 100 NR NR NR 125 NR NR NR 160 NR NR NR 200 NR NR 39.3* ± 2.1 250 41.8 ± 2.0 38.8* ± 2.0 38.3* ± 2.0 315 41.7* ± 2.1 45.8 ± 2.0 47.8 ± 1.9 400 NR NR 38.6* ± 2.0 500 39.9* ± 2.0 38.9* ± 2.0 39.1* ± 2.0 630 42.1 ± 1.9 41.4 ± 1.9 40.8* ± 2.0 800 43.2 ± 1.8 42.9 ± 1.9 42.0 ± 1.9 1000 44.8 ± 1.8 45.0 ± 1.8 44.8 ± 1.8 1250 45.1 ± 1.9 45.7 ± 1.8 45.5 ± 1.8 1600 43.5 ± 1.9 44.4 ± 1.8 44.6 ± 1.8 2000 39.7 ± 1.9 41.1 ± 1.9 42.9 ± 1.9 2500 35.9 ± 1.9 37.3 ± 1.9 38.7 ± 1.9 3150 31.3 ± 2.0 32.9 ± 2.0 34.7 ± 1.9 4000 27.4* ± 2.0 30.6 ± 2.2 35.3 ± 2.3 5000 NR NR NR 6300 NR NR NR 8000 NR NR NR 10000 NR NR NR
* The difference between total and background noise was less than 6 dB but greater than 3 dB. A standard background correction of 1.3 dB was applied according to Section 8.2 of the Standard.
NR The difference between total and background noise was less than 3 dB. According to Section 8.2 of the Standard, the wind turbine noise was less than the background noise.

Swift IEC Acoustic Noise Report 130215 Page 15 of 39
Figure 5. One-third octave levels
6.5 Tonality The tonality analysis resulted in reportable tones for 10 and 11 m/s, as shown in Table 10. NREL engineers believe that these tones originated from the furling mechanism. The furling mechanism activated at Vs ~ 10 m/s and generated enough noise that it was impossible to collect valid background data above 10 m/s. On 6 Apr 2012, the mechanism was lubricated and the audible squeak was no longer noticeable. As a result, no audible tones existed for the 24 May 2012 or 28 May 2012 measurement sessions.
Additionally, engineers heard a rattle emanating from the nose cone in low wind speeds. As the turbine speed increased, the rattle disappeared. However, no quantitative comments can be made concerning this rattle, as the background levels at these wind speeds were within 3 dBA of the turbine levels.
Cascade Engineering was made aware of both of these noises.
0
10
20
30
40
50
50 63 80 100
125
160
200
250
315
400
500
630
800
1000
1250
1600
2000
2500
3150
4000
5000
6300
8000
1000
0
Soun
d Pr
essu
re Le
vel [
dBA]
Frequency [Hz]
6 m/s
7 m/s
8 m/s
9 m/s
10 m/s
11 m/s

Swift IEC Acoustic Noise Report 130215 Page 16 of 39
Table 10. Tonality Results (In dBA)
Wind Speed: 10 m/s 11m/s f [Hz] 3,849 3,921 ∆Ltn,1 -21.5 -21.5 ∆Ltn,2 -3.7 -21.5 ∆Ltn,3 -21.5 -21.5 ∆Ltn,4 -21.5 -21.5 ∆Ltn,5 -21.5 -21.5 ∆Ltn,6 -21.5 -21.5 ∆Ltn,7 -21.5 -21.5 ∆Ltn,8 -21.5 -21.5 ∆Ltn,9 -21.5 -21.5 ∆Ltn,10 -21.5 -21.5 ∆Ltn,11 -21.5 -21.5 ∆Ltn,12 9.1 8.1 ∆Lk -1.5 -2.5 ∆La,k 2.77 1.7
UA N/A1 N/A1 UB 2.1 2.1 UC N/A1 N/A1
Figure 6 and Figure 7 show a 10-second energy averaged spectrum indicating the classification of spectral lines for each of the identified tones.
1 Tone was intermittent. Type A uncertainty was not calculated for the bipolar sample distribution.

Swift IEC Acoustic Noise Report 130215 Page 17 of 39
Figure 6. Classification of spectral lines for the 3,849 Hz tone (typical in the 10 m/s bin)
Figure 7. Classification of spectral lines for the 3,921 Hz tone (typical in the 11 m/s bin)
0
5
10
15
20
25
30
35
40
3522
3546
3570
3594
3618
3642
3666
3690
3714
3738
3762
3786
3810
3834
3858
3882
3906
3930
3954
3978
4002
4026
4050
4074
4098
4122
4146
4170
Soun
d Pr
essu
re Le
vel [
dB]
Frequency [Hz]
Masking
Tone
Neither
0
5
10
15
20
25
30
35
3588
3612
3636
3660
3684
3708
3732
3756
3780
3804
3828
3852
3876
3900
3924
3948
3972
3996
4020
4044
4068
4092
4116
4140
4164
4188
4212
4236
Soun
d Pr
essu
re Le
vel [
dB]
Frequency [Hz]
Masking
Tone
Neither

Swift IEC Acoustic Noise Report 130215 Page 18 of 39
6.6 Uncertainty The type A uncertainties for sound power levels, one-third octave levels, and tonality were calculated using the methods prescribed in the Standard. The type B uncertainty components are shown in Table 11.
Table 11. Type B Uncertainty Components for Sound Power Levels and Tonality
Var Description
Type B Uncertainty for Sound Power Level (SPL)
dBA
Type B Uncertainty for
1/3 Octave Levels (TOB)
dBA
Type B Uncertainty for Tonality
dBA
Comment
UB1 Calibration 0.2 0.2 0.1 Assumption, used typical value UB2 Instrument 0.2 0.2 0.2 Assumption, used typical value
UB3 Board 0.3 1.7 1.7 The board was placed well and used the typical value
UB4 Distance 0.1 0.1 0.05 Assumption, used typical value UB5 Impedance 0.1 0.1 0.1 Assumption, used typical value UB6 Turbulence 0.4 0.4 0.2 Assumption, used typical value
UB7 Wind speed,
measured Varies with wind
speed
Varies with wind speed and one-
third octave center frequency bin
0.6
Calculated per IEC 61400-12-1 Ed. 1.0, 205-12, and converted to dBA for SPL and TOB. Typical value for tonality
UB8 Direction 0.3 0.3 0.3 Assumption, used typical value
UB9 Background Varies with wind
speed
Varies with wind speed and one-
third octave center frequency bin
Varies by tone Standard deviation of the applied correction
7 Exceptions 7.1 Exceptions to the Standard The analysis prescribed in the standard was altered for the small wind turbine by using 10-second averages instead of 1-minute averages to better characterize the dynamic nature of this turbine. In addition, binning by wind speed was used instead of regression analysis, and the integer values were calculated by interpolating between bins and extrapolating at the ends.
7.2 Exceptions to the Quality Assurance System The primary anemometer and data acquisition modules were used past the calibration due dates. The instruments and modules were post-test calibrated. The anemometer and modules were found to be within tolerances.

Swift IEC Acoustic Noise Report 130215 Page 19 of 39
References International Electrotechnical Commission (IEC). (2006). Wind Turbine Generator Systems – Part 11 Acoustic Noise Measurement Techniques, IEC 61400-11, Ed 2.1, 2006-11, Geneva, Switzerland.

Swift IEC Acoustic Noise Report 130215 Page 20 of 39
Appendix A. American Wind Energy Association Standard Acoustic Analysis The American Wind Energy Association (AWEA) standard requires that the wind turbine sound levels be measured and reported in accordance with the IEC 61400-11 standard, and includes the following modifications:
• Using a 10-second averaging period
• Using the measured wind speed
• Using the method of bins
• Covering a wide wind speed range as possible
• Describing any obvious changes in sound at high wind speeds
• Reporting the AWEA Rated Sound Level. During the test, NREL engineers analyzed the data to calculate the 10-second averages. To ensure that the acoustic data was downwind from the turbine, the wind direction was filtered to assure that the measurement board was within 15 degrees of the downwind position. The data were also filtered by the provided status to determine the total (operating plus background), background, and interrupted/excluded data. The data were binned by the standardized wind speed into 1m/s wind speed bins centered on the integer wind speed. The bin centers were calculated by interpolation (and extrapolation at the ends).
The AWEA Rated Sound Level is defined as: the sound level that will not be exceeded 95% of the time (assuming an average wind speed of 5 m/s); a Rayleigh wind speed distribution; 100% availability; and an observer location that is 60 m from the rotor center. This requirement defines the AWEA wind speed to be 9.8 m/s at hub height. The total and background noise for 9.8 m/s were obtained by interpolation between the 9 and 10 m/s binned values. The two values are used to obtain the background corrected sound pressure level. Next, the sound power level is calculated. The AWEA Rated Sound Level is then calculated using this value.
Table 12. AWEA Rated Sound Level
AWEA Rated Sound Level
dBA
Combined Uncertainty
dBA 38.3 1.9

Swift IEC Acoustic Noise Report 130215 Page 21 of 39
Appendix B. Pictures
Figure B1. Picture of the sound board during the test
(Photo by Jason Roadman, NREL)

Swift IEC Acoustic Noise Report 130215 Page 22 of 39
Figure B2. The test turbine as viewed from the reference microphone position
(Photo by Jason Roadman, NREL)

Swift IEC Acoustic Noise Report 130215 Page 23 of 39
Figure B3. The test turbine as viewed from the meteorological mast
(Photo by Ismael Mendoza, NREL 22083)

Swift IEC Acoustic Noise Report 130215 Page 24 of 39
Appendix C. Calibration Sheets
Figure C1. Calibration sheet for the microphone 2406811

Swift IEC Acoustic Noise Report 130215 Page 25 of 39
Figure C2. Calibration sheet for the microphone 2406809
Swift IEC Acoustic Noise Report 130215 Page 26 of 39
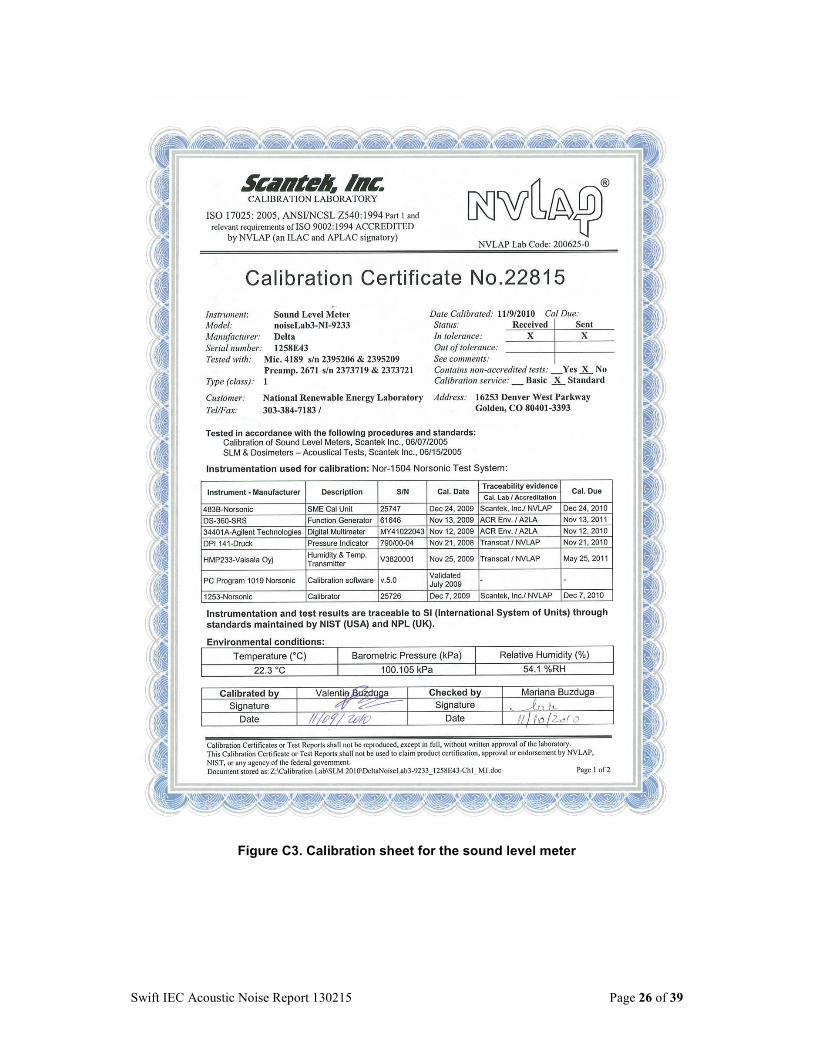
Figure C3. Calibration sheet for the sound level meter

Swift IEC Acoustic Noise Report 130215 Page 27 of 39
Figure C4. Calibration sheet for the acoustic calibrator

Swift IEC Acoustic Noise Report 130215 Page 28 of 39
Figure C5. Calibration sheet for the primary anemometer

Swift IEC Acoustic Noise Report 130215 Page 29 of 39
Figure C6. Post-test calibration sheet for the primary anemometer

Swift IEC Acoustic Noise Report 130215 Page 30 of 39
Figure C7. Page 1 of the power transducer calibration sheet

Swift IEC Acoustic Noise Report 130215 Page 31 of 39
Figure C8. Calibration sheet for the pressure transducer

Swift IEC Acoustic Noise Report 130215 Page 32 of 39
Figure C9. Calibration sheet for the temperature sensor

Swift IEC Acoustic Noise Report 130215 Page 33 of 39
Figure C10. Calibration sheet for the wind vane

Swift IEC Acoustic Noise Report 130215 Page 34 of 39
Figure C11. Calibration sheet for the signal conditioning module 1496266

Swift IEC Acoustic Noise Report 130215 Page 35 of 39
Figure C12. Post-test calibration sheet for the signal conditioning module 1496266

Swift IEC Acoustic Noise Report 130215 Page 36 of 39
Figure C13. Calibration sheet for the signal conditioning module 14A34EE

Swift IEC Acoustic Noise Report 130215 Page 37 of 39
Figure C14. Post-test calibration sheet for the signal conditioning module 14A34EE

Swift IEC Acoustic Noise Report 130215 Page 38 of 39
Figure C15. Calibration sheet for the signal conditioning module 1494F69

Swift IEC Acoustic Noise Report 130215 Page 39 of 39
Figure C16. Post-test calibration sheet for the signal conditioning module 1494F69


