Download - ACPI Monthly Viewpoint: March 2017

MONTHLY VIEWPOINT
From the Chief Investment Officer Marco E Pabst
07th
March 2017
ACPI Investments Ltd.
Pegasus House | 37-43 Sackville Street | London W1S 3EH
T +44 (0)20 3697 9580 | F +44 (0)20 3697 9501 | E [email protected]
www.acpi.com
1
Buy everything
“Lenin wanted to destroy the state and that’s my goal too. I want to bring everything crashing down and
destroy all of today’s establishment.” Steve Bannon in 2013
Summary
Controversial and unfounded Trump statements are beginning to threaten his more credible agenda
With markets buying the rumours, they are almost priced to perfection while monetary tightening risks are rising
This is currently balanced by what looks like a new investment cycle across many large economies
Gold is attractive at current levels despite declining physical demand
Investment demand for precious metals is rising and supply will structurally fall over the next three years
It is difficult these days to keep any market commentary a
Trump-free zone. But as equity investors seem to be on bull
market auto pilot it is important not to lose sight of the
robustness of the assumptions they are making, knowingly or
implicitly, and the idiosyncratic risks that come with the
Trump persona.
The risk here is that very positive policy goals such as
smaller government, tax cuts and de-regulation get de-railed
by incompetent statements, ill-chosen personnel and
pointless side shows such as the endless battle with the
press, Hillary Clinton’s campaign or Ivanka’s business
issues.
These serve no real purpose other than making a point but
are responsible for Trump’s quickly declining approval ratings, also amongst his supporters. His statements, for instance,
during Netanyahu’s visit unfortunately only revealed the lack of any coherent idea with regards to the Israeli-Palaestinian
conflict (“I’m looking at a two-state and one-state, and I like the one that both parties like. I’m very happy with the one that
both parties like.”). Sometimes it is just better not to say anything.
Exhibit 1: Performance of different asset classes in 2016
Source(s): ACPI, Bloomberg
-10%
-5%
0%
5%
10%
15%
MS
CI W
orl
d
S&
P 5
00
Eu
rop
e (
Sto
xx 6
00
)
Eu
rozo
ne
(S
tox
x 5
0)
UK
(F
TS
E1
00
)
Ja
pa
n (
Nik
ke
i)
MS
CI E
me
rgin
g M
ark
ets
Bra
sil
Ru
ss
ia
Ind
ia
Ch
ina (
Sh
an
gh
ai)
Ho
ng
Ko
ng
Wo
rld
Fix
ed
In
co
me
Wo
rld
Go
ve
rnm
en
t B
on
ds
US
Tre
as
uri
es
Eu
rozo
ne
go
vt
bo
nd
s
Lo
an
s, to
tal
retu
rn
US
Hig
h y
ield
Glo
ba
l H
igh
yie
ld
EM
ha
rd c
urr
en
cy
de
bt
Eu
rozo
ne
co
rp b
on
ds
Do
lla
r in
de
x
Eu
ro
Po
un
d S
terl
ing
Ja
pa
ne
se
Yen
Ch
ines
e R
MB
Ind
ian
Ru
pe
e
Glo
ba
l c
om
mo
dit
ies
En
erg
y
Pre
cio
us
me
tals
Ag
ric
ult
ura
l c
om
mo
ds
Eq
uit
y R
EIT
S
New
Yo
rk h
om
es
Lo
nd
on
ho
me
s
Ge
rma
n h
om
es
Beij
ing
ho
me
s
Glo
ba
l h
ed
ge
fu
nd
s

MONTHLY VIEWPOINT
From the Chief Investment Officer Marco E Pabst
07th
March 2017
ACPI Investments Ltd.
Pegasus House | 37-43 Sackville Street | London W1S 3EH
T +44 (0)20 3697 9580 | F +44 (0)20 3697 9501 | E [email protected]
www.acpi.com
2
The result of this approach is an aggressive backlash from mainstream media outlets and an increasing alienation of people
who would otherwise agree with most of Trump’s proposals. Appointing people such as Steve Bannon to key roles in
government and letting him drive the more controversial initiatives is something that risks discrediting all other more agreeable
projects.
Exhibit 2: Trump’s approval ratings (lhs) and compared to other Presidents (rhs) at the Mid-February point
Source(s): Gallup
The reason this is important for investors is that markets are almost priced to perfection, implicitly assuming a fairly swift
implementation of the tax reform proposals into law. We should also not forget that even in the best case scenario, none of
these laws will be approved before the end of the year. Trump’s recent change of tack in moving Obamacare reform before
tax reform makes things even more difficult to assess. In addition, should Trump manage further to erode his Republican
support base or even become untenable then we should expect some rather severe disruptions and delays. This could quickly
send markets into a tailspin.
For now, investors are focussing on the positive and this is the prospect of meaningful tax cuts for corporates and individuals
that would imply potentially very large increases in net earnings, especially for more domestically-focused companies in the
US. The crux of the matter is in the border-adjustment tax (BAT) and the fact that tax reform would have to be roughly
revenue neutral.
Exhibit 3: Regulatory roadmap for the US financial sector
Source(s): Morgan Stanley

MONTHLY VIEWPOINT
From the Chief Investment Officer Marco E Pabst
07th
March 2017
ACPI Investments Ltd.
Pegasus House | 37-43 Sackville Street | London W1S 3EH
T +44 (0)20 3697 9580 | F +44 (0)20 3697 9501 | E [email protected]
www.acpi.com
3
As discussed in the annual outlook, the impact on earnings from tax cuts and deregulation could potentially be very
substantial, even if the full impact might not be felt before 2018. Furthermore, there is hope that deregulation in the banking
sector will ease the flow of credit and improve profitability of the industry. It is too early to review this topic as it is not clear at
all how the proposed initiatives will affect the sector, although some assumptions can be made about the range of outcomes.
Exhibit 4: Impact of various measures on earnings per share (EPS) for US financials
Source(s): Morgan Stanley
One can easily see from the chart above, that EPS (earnings per share) upside is quite substantial with possible increases of
between 10% and 30%, which explains why the sector shows such relative strength at the moment even after the gains of last
year. More interestingly, the best performing sector so far this year are NASDAQ stocks, i.e. technology and growth
businesses. This is somewhat counter-intuitive considering Trump’s difficult relationship with the sector and his focus on
domestic and old economy businesses. Even more ironic in this context is that energy stocks are amongst the weakest
relative performers.
Exhibit 5: Relative performance of various sectors versus S&P500 year-to-date (normalised)
Source(s): ACPI, Bloomberg
MONTHLY VIEWPOINT
From the Chief Investment Officer Marco E Pabst
07th
March 2017
ACPI Investments Ltd.
Pegasus House | 37-43 Sackville Street | London W1S 3EH
T +44 (0)20 3697 9580 | F +44 (0)20 3697 9501 | E [email protected]
www.acpi.com
4
Markets have been on a tear over the past months and February was the strongest month for risk assets since July of last
year. Positive momentum and sentiment are the driving forces rather than hard evidence of renewed earnings growth. ‘Buy
the rumour, sell the fact’ is the motto and any doubts about the validity and timeliness of the new emperors promises are
simply shrugged off by investors, at least for the time being.
Thus, it has been more than 145 (calendar) days since the S&P500 lost more than 1% on a daily basis. We believe that
sentiment, in the short term, is too exuberant as shown in the latest Investors Intelligence survey (newsletter writers) that
reached a new record high at 63.1% at the end of February. The last time the survey recorded such a high reading was on
30th January 1987. This does not constitute a longer-term sell signal but highlights that markets are short-term overbought.
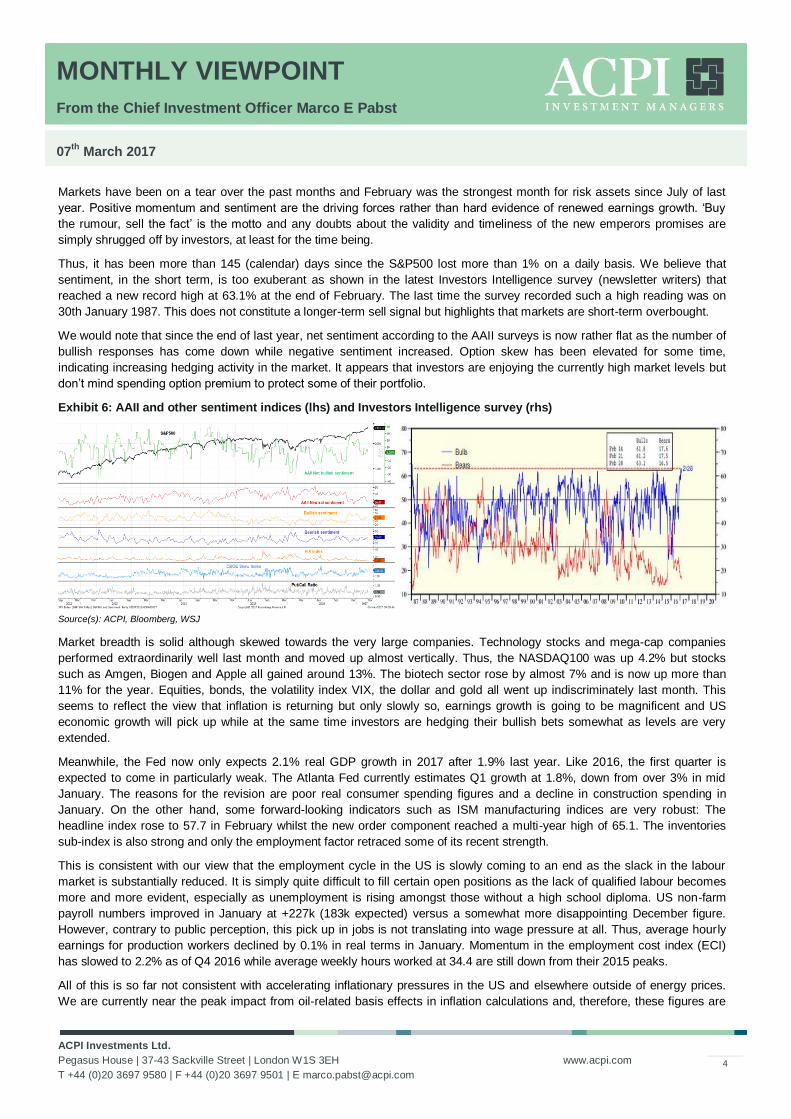
We would note that since the end of last year, net sentiment according to the AAII surveys is now rather flat as the number of
bullish responses has come down while negative sentiment increased. Option skew has been elevated for some time,
indicating increasing hedging activity in the market. It appears that investors are enjoying the currently high market levels but
don’t mind spending option premium to protect some of their portfolio.
Exhibit 6: AAII and other sentiment indices (lhs) and Investors Intelligence survey (rhs)
Source(s): ACPI, Bloomberg, WSJ
Market breadth is solid although skewed towards the very large companies. Technology stocks and mega-cap companies
performed extraordinarily well last month and moved up almost vertically. Thus, the NASDAQ100 was up 4.2% but stocks
such as Amgen, Biogen and Apple all gained around 13%. The biotech sector rose by almost 7% and is now up more than
11% for the year. Equities, bonds, the volatility index VIX, the dollar and gold all went up indiscriminately last month. This
seems to reflect the view that inflation is returning but only slowly so, earnings growth is going to be magnificent and US
economic growth will pick up while at the same time investors are hedging their bullish bets somewhat as levels are very
extended.
Meanwhile, the Fed now only expects 2.1% real GDP growth in 2017 after 1.9% last year. Like 2016, the first quarter is
expected to come in particularly weak. The Atlanta Fed currently estimates Q1 growth at 1.8%, down from over 3% in mid
January. The reasons for the revision are poor real consumer spending figures and a decline in construction spending in
January. On the other hand, some forward-looking indicators such as ISM manufacturing indices are very robust: The
headline index rose to 57.7 in February whilst the new order component reached a multi-year high of 65.1. The inventories
sub-index is also strong and only the employment factor retraced some of its recent strength.
This is consistent with our view that the employment cycle in the US is slowly coming to an end as the slack in the labour
market is substantially reduced. It is simply quite difficult to fill certain open positions as the lack of qualified labour becomes
more and more evident, especially as unemployment is rising amongst those without a high school diploma. US non-farm
payroll numbers improved in January at +227k (183k expected) versus a somewhat more disappointing December figure.
However, contrary to public perception, this pick up in jobs is not translating into wage pressure at all. Thus, average hourly
earnings for production workers declined by 0.1% in real terms in January. Momentum in the employment cost index (ECI)
has slowed to 2.2% as of Q4 2016 while average weekly hours worked at 34.4 are still down from their 2015 peaks.
All of this is so far not consistent with accelerating inflationary pressures in the US and elsewhere outside of energy prices.
We are currently near the peak impact from oil-related basis effects in inflation calculations and, therefore, these figures are
MONTHLY VIEWPOINT
From the Chief Investment Officer Marco E Pabst
07th
March 2017
ACPI Investments Ltd.
Pegasus House | 37-43 Sackville Street | London W1S 3EH
T +44 (0)20 3697 9580 | F +44 (0)20 3697 9501 | E [email protected]
www.acpi.com
5
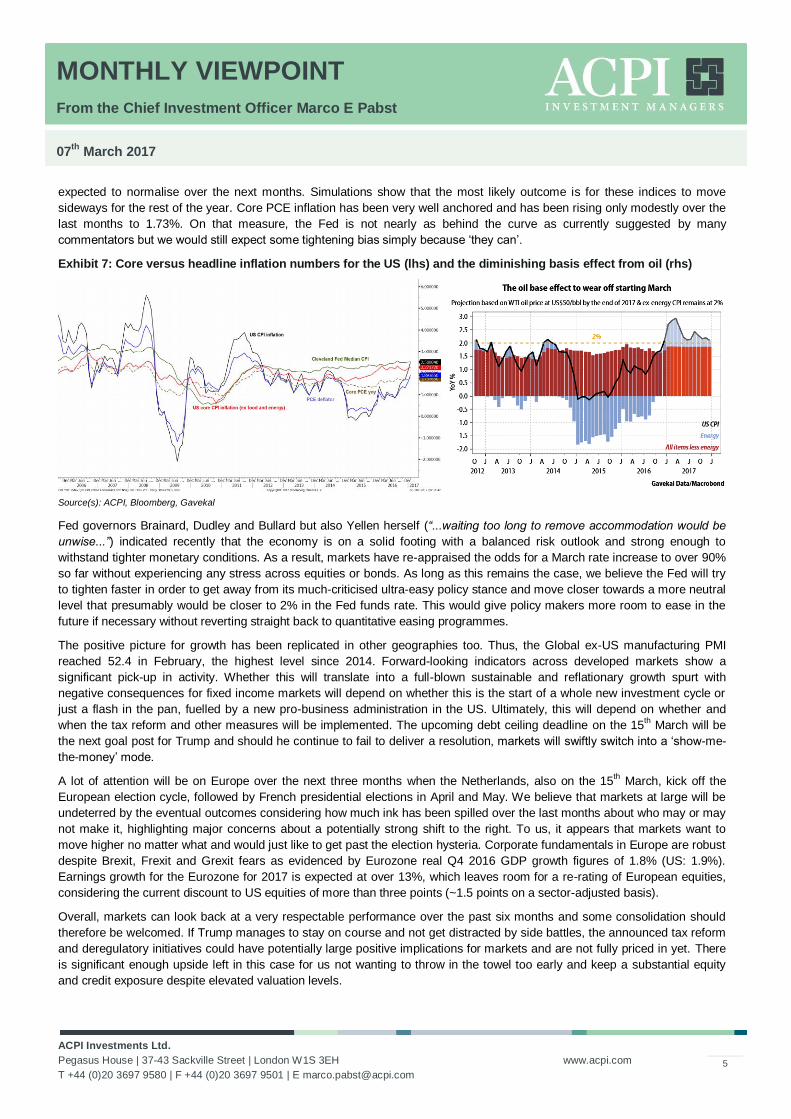
expected to normalise over the next months. Simulations show that the most likely outcome is for these indices to move
sideways for the rest of the year. Core PCE inflation has been very well anchored and has been rising only modestly over the
last months to 1.73%. On that measure, the Fed is not nearly as behind the curve as currently suggested by many
commentators but we would still expect some tightening bias simply because ‘they can’.
Exhibit 7: Core versus headline inflation numbers for the US (lhs) and the diminishing basis effect from oil (rhs)
Source(s): ACPI, Bloomberg, Gavekal
Fed governors Brainard, Dudley and Bullard but also Yellen herself (“...waiting too long to remove accommodation would be
unwise...”) indicated recently that the economy is on a solid footing with a balanced risk outlook and strong enough to
withstand tighter monetary conditions. As a result, markets have re-appraised the odds for a March rate increase to over 90%
so far without experiencing any stress across equities or bonds. As long as this remains the case, we believe the Fed will try
to tighten faster in order to get away from its much-criticised ultra-easy policy stance and move closer towards a more neutral
level that presumably would be closer to 2% in the Fed funds rate. This would give policy makers more room to ease in the
future if necessary without reverting straight back to quantitative easing programmes.
The positive picture for growth has been replicated in other geographies too. Thus, the Global ex-US manufacturing PMI
reached 52.4 in February, the highest level since 2014. Forward-looking indicators across developed markets show a
significant pick-up in activity. Whether this will translate into a full-blown sustainable and reflationary growth spurt with
negative consequences for fixed income markets will depend on whether this is the start of a whole new investment cycle or
just a flash in the pan, fuelled by a new pro-business administration in the US. Ultimately, this will depend on whether and
when the tax reform and other measures will be implemented. The upcoming debt ceiling deadline on the 15th March will be
the next goal post for Trump and should he continue to fail to deliver a resolution, markets will swiftly switch into a ‘show-me-
the-money’ mode.
A lot of attention will be on Europe over the next three months when the Netherlands, also on the 15th March, kick off the
European election cycle, followed by French presidential elections in April and May. We believe that markets at large will be
undeterred by the eventual outcomes considering how much ink has been spilled over the last months about who may or may
not make it, highlighting major concerns about a potentially strong shift to the right. To us, it appears that markets want to
move higher no matter what and would just like to get past the election hysteria. Corporate fundamentals in Europe are robust
despite Brexit, Frexit and Grexit fears as evidenced by Eurozone real Q4 2016 GDP growth figures of 1.8% (US: 1.9%).
Earnings growth for the Eurozone for 2017 is expected at over 13%, which leaves room for a re-rating of European equities,
considering the current discount to US equities of more than three points (~1.5 points on a sector-adjusted basis).
Overall, markets can look back at a very respectable performance over the past six months and some consolidation should
therefore be welcomed. If Trump manages to stay on course and not get distracted by side battles, the announced tax reform
and deregulatory initiatives could have potentially large positive implications for markets and are not fully priced in yet. There
is significant enough upside left in this case for us not wanting to throw in the towel too early and keep a substantial equity
and credit exposure despite elevated valuation levels.

MONTHLY VIEWPOINT
From the Chief Investment Officer Marco E Pabst
07th
March 2017
ACPI Investments Ltd.
Pegasus House | 37-43 Sackville Street | London W1S 3EH
T +44 (0)20 3697 9580 | F +44 (0)20 3697 9501 | E [email protected]
www.acpi.com
6
I have not reflected on gold for quite some time and the recent rise in inflationary pressures and the relatively tumultuous start
of Trump’s term might be a good opportunity to catch up on the topic.
We added some gold exposure back in 2016 on our view that inflation is likely on the rise relative to policy rates, in other
words, real short-term interest rates are not expected to rise and if so, not by much. Real interest rates tend to be gold’s major
adversary and as long as they are in check, precious metals tend to do well. It is therefore no surprise that in an environment
of falling interest rates and an inflating money supply, precious metals perform well as a store of value, which explains the
sector’s performance since 2000 where gold compounded at more than 10% annually.
Exhibit 8: Gold and silver prices since 1992 and non-commercial positioning at futures exchange Comex
Source(s): ACPI, Bloomberg
In contrast to previous decades, however, gold and silver are no longer the hedges of choice against geopolitical turmoil. US
Treasuries and the dollar are more suitable and liquid to accommodate such hedging needs in today’s markets. Nonetheless,
there are several reasons why we re-established some gold exposure last year.
After ten years of a fairly spectacular bull market, precious metals prices began to consolidate in 2011 and 2012. Five years
ago, ‘gold bugs’ were everywhere and industry conferences were standing room only. Central banks had a target on their
backs as arch enemies, whereby, according to gold supporters, endless money printing would make fiat money worthless
and, thus, gold would offer the only safe haven option for investors. Clearly, this was at the peak in prices and precious metals
faded somewhat into the background.
However, after a 50% correction over the past five years, we believe that the time is about right for long-term investors to
reconsider the sector. After all, precious metals also serve as an important diversifier of risk as can be seen in the low
correlations between gold and the MSCI World index where correlations are currently at only around 10%. With regard to
bonds, precious metals tend to be positively correlated most of the time and also more highly so. Currently, this measure is
close to 50% which speaks for the typical risk-off character of precious metals and bonds.
MONTHLY VIEWPOINT
From the Chief Investment Officer Marco E Pabst
07th
March 2017
ACPI Investments Ltd.
Pegasus House | 37-43 Sackville Street | London W1S 3EH
T +44 (0)20 3697 9580 | F +44 (0)20 3697 9501 | E [email protected]
www.acpi.com
7
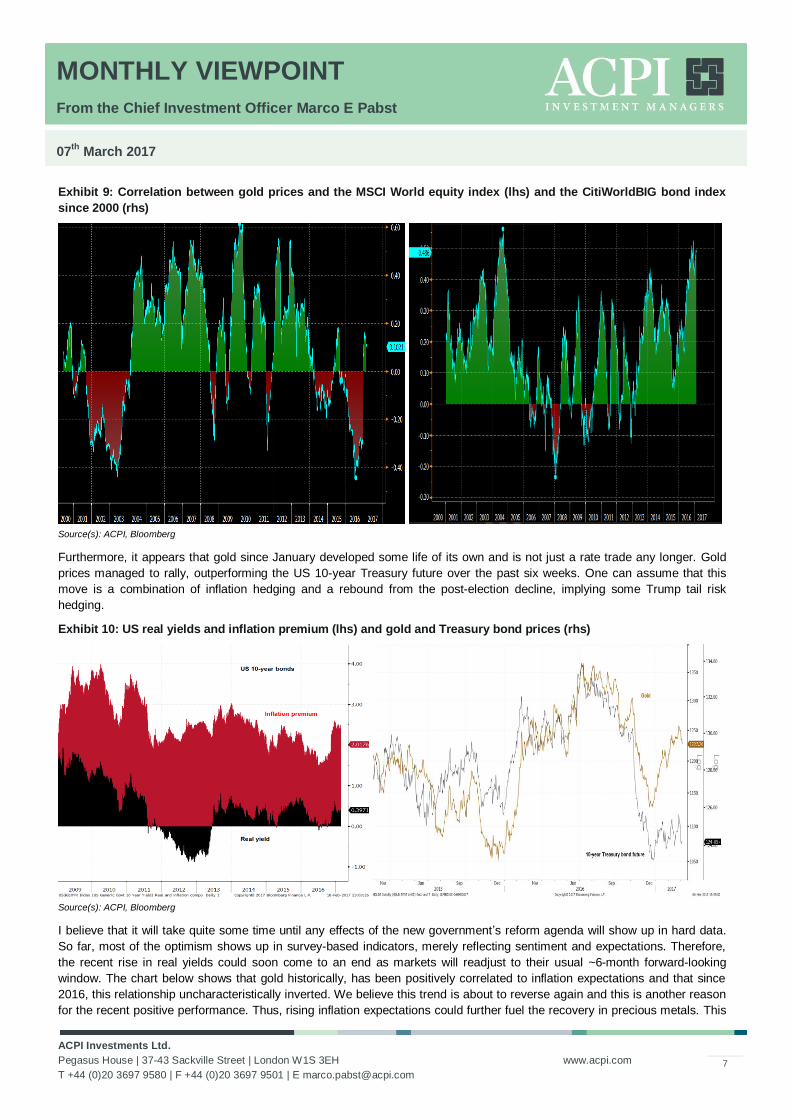
Exhibit 9: Correlation between gold prices and the MSCI World equity index (lhs) and the CitiWorldBIG bond index
since 2000 (rhs)
Source(s): ACPI, Bloomberg
Furthermore, it appears that gold since January developed some life of its own and is not just a rate trade any longer. Gold
prices managed to rally, outperforming the US 10-year Treasury future over the past six weeks. One can assume that this
move is a combination of inflation hedging and a rebound from the post-election decline, implying some Trump tail risk
hedging.
Exhibit 10: US real yields and inflation premium (lhs) and gold and Treasury bond prices (rhs)
Source(s): ACPI, Bloomberg
I believe that it will take quite some time until any effects of the new government’s reform agenda will show up in hard data.
So far, most of the optimism shows up in survey-based indicators, merely reflecting sentiment and expectations. Therefore,
the recent rise in real yields could soon come to an end as markets will readjust to their usual ~6-month forward-looking
window. The chart below shows that gold historically, has been positively correlated to inflation expectations and that since
2016, this relationship uncharacteristically inverted. We believe this trend is about to reverse again and this is another reason
for the recent positive performance. Thus, rising inflation expectations could further fuel the recovery in precious metals. This
MONTHLY VIEWPOINT
From the Chief Investment Officer Marco E Pabst
07th
March 2017
ACPI Investments Ltd.
Pegasus House | 37-43 Sackville Street | London W1S 3EH
T +44 (0)20 3697 9580 | F +44 (0)20 3697 9501 | E [email protected]
www.acpi.com
8
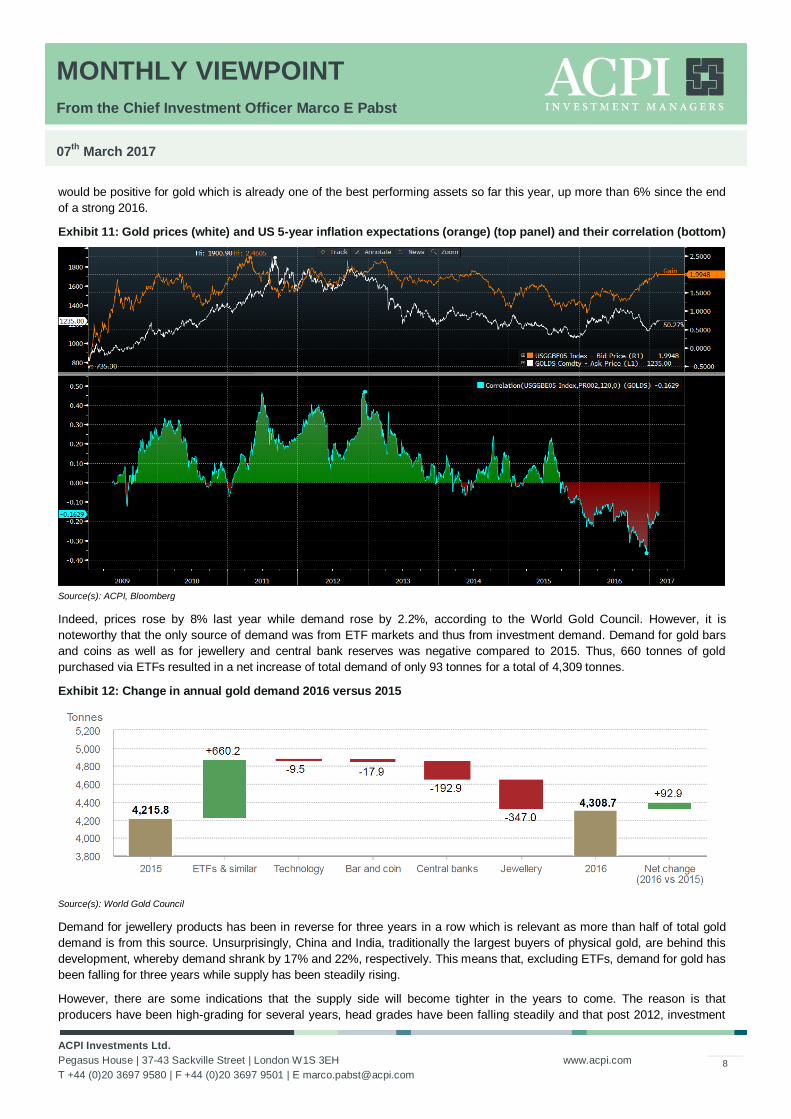
would be positive for gold which is already one of the best performing assets so far this year, up more than 6% since the end
of a strong 2016.
Exhibit 11: Gold prices (white) and US 5-year inflation expectations (orange) (top panel) and their correlation (bottom)
Source(s): ACPI, Bloomberg
Indeed, prices rose by 8% last year while demand rose by 2.2%, according to the World Gold Council. However, it is
noteworthy that the only source of demand was from ETF markets and thus from investment demand. Demand for gold bars
and coins as well as for jewellery and central bank reserves was negative compared to 2015. Thus, 660 tonnes of gold
purchased via ETFs resulted in a net increase of total demand of only 93 tonnes for a total of 4,309 tonnes.
Exhibit 12: Change in annual gold demand 2016 versus 2015
Source(s): World Gold Council
Demand for jewellery products has been in reverse for three years in a row which is relevant as more than half of total gold
demand is from this source. Unsurprisingly, China and India, traditionally the largest buyers of physical gold, are behind this
development, whereby demand shrank by 17% and 22%, respectively. This means that, excluding ETFs, demand for gold has
been falling for three years while supply has been steadily rising.
However, there are some indications that the supply side will become tighter in the years to come. The reason is that
producers have been high-grading for several years, head grades have been falling steadily and that post 2012, investment
MONTHLY VIEWPOINT
From the Chief Investment Officer Marco E Pabst
07th
March 2017
ACPI Investments Ltd.
Pegasus House | 37-43 Sackville Street | London W1S 3EH
T +44 (0)20 3697 9580 | F +44 (0)20 3697 9501 | E [email protected]
www.acpi.com
9
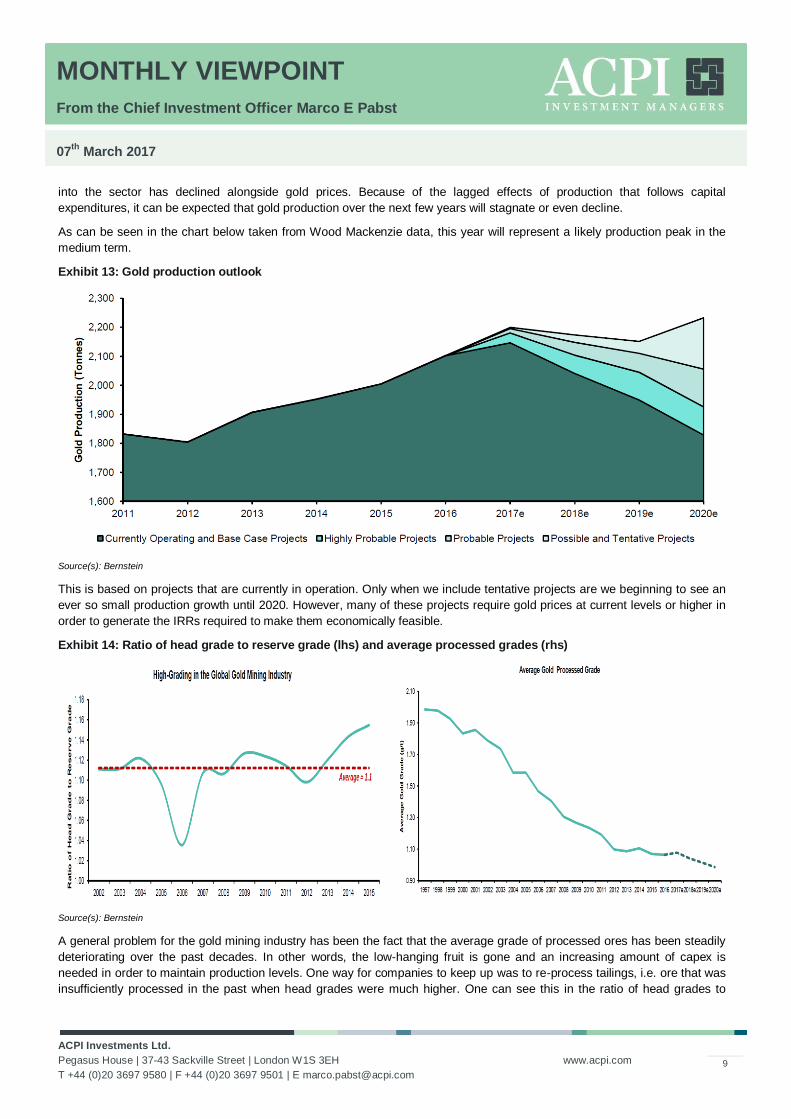
into the sector has declined alongside gold prices. Because of the lagged effects of production that follows capital
expenditures, it can be expected that gold production over the next few years will stagnate or even decline.
As can be seen in the chart below taken from Wood Mackenzie data, this year will represent a likely production peak in the
medium term.
Exhibit 13: Gold production outlook
Source(s): Bernstein
This is based on projects that are currently in operation. Only when we include tentative projects are we beginning to see an
ever so small production growth until 2020. However, many of these projects require gold prices at current levels or higher in
order to generate the IRRs required to make them economically feasible.
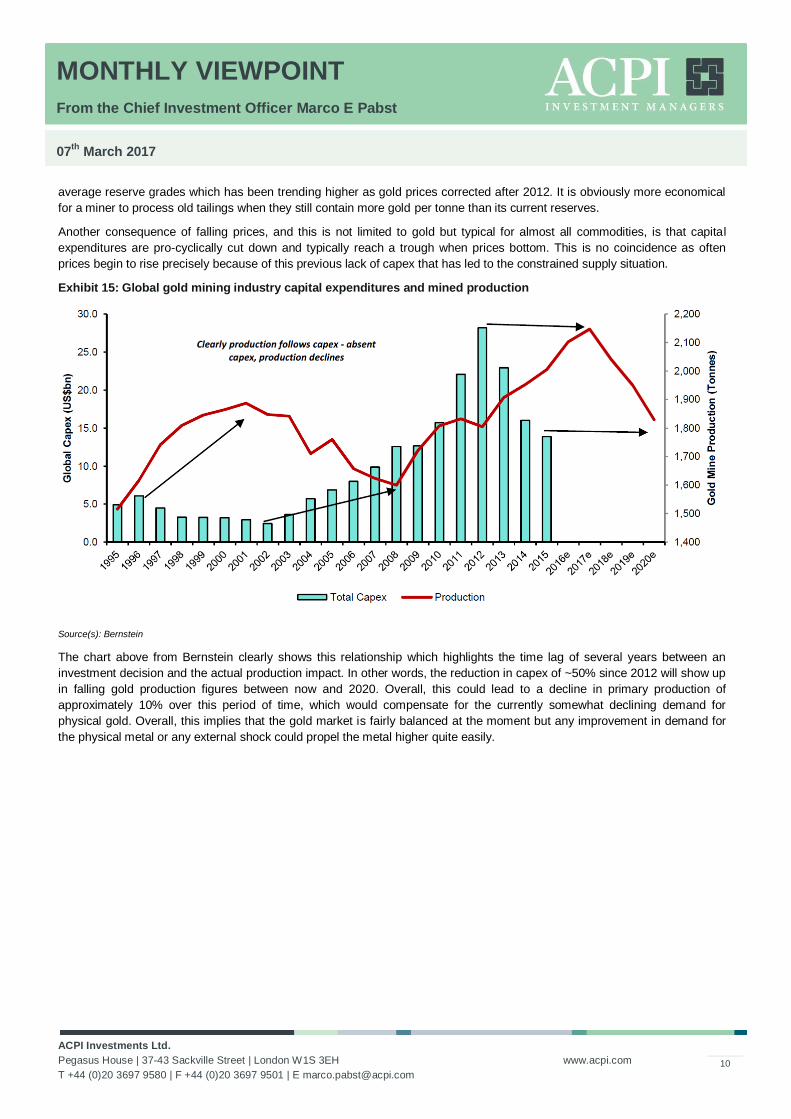
Exhibit 14: Ratio of head grade to reserve grade (lhs) and average processed grades (rhs)
Source(s): Bernstein
A general problem for the gold mining industry has been the fact that the average grade of processed ores has been steadily
deteriorating over the past decades. In other words, the low-hanging fruit is gone and an increasing amount of capex is
needed in order to maintain production levels. One way for companies to keep up was to re-process tailings, i.e. ore that was
insufficiently processed in the past when head grades were much higher. One can see this in the ratio of head grades to
MONTHLY VIEWPOINT
From the Chief Investment Officer Marco E Pabst
07th
March 2017
ACPI Investments Ltd.
Pegasus House | 37-43 Sackville Street | London W1S 3EH
T +44 (0)20 3697 9580 | F +44 (0)20 3697 9501 | E [email protected]
www.acpi.com
10
average reserve grades which has been trending higher as gold prices corrected after 2012. It is obviously more economical
for a miner to process old tailings when they still contain more gold per tonne than its current reserves.
Another consequence of falling prices, and this is not limited to gold but typical for almost all commodities, is that capital
expenditures are pro-cyclically cut down and typically reach a trough when prices bottom. This is no coincidence as often
prices begin to rise precisely because of this previous lack of capex that has led to the constrained supply situation.
Exhibit 15: Global gold mining industry capital expenditures and mined production
Source(s): Bernstein
The chart above from Bernstein clearly shows this relationship which highlights the time lag of several years between an
investment decision and the actual production impact. In other words, the reduction in capex of ~50% since 2012 will show up
in falling gold production figures between now and 2020. Overall, this could lead to a decline in primary production of
approximately 10% over this period of time, which would compensate for the currently somewhat declining demand for
physical gold. Overall, this implies that the gold market is fairly balanced at the moment but any improvement in demand for
the physical metal or any external shock could propel the metal higher quite easily.

MONTHLY VIEWPOINT
From the Chief Investment Officer Marco E Pabst
07th
March 2017
ACPI Investments Ltd.
Pegasus House | 37-43 Sackville Street | London W1S 3EH
T +44 (0)20 3697 9580 | F +44 (0)20 3697 9501 | E [email protected]
www.acpi.com
11
Global economic monitor
Source(s): ACPI, Bloomberg
Sept Oct Nov Dec Jan Feb Trend
Citi Economic Surprise US -5.1 -8.1 17.8 23.3 31.8 34.7
Citi Economic Surprise G10 3.0 14.5 31.4 33.0 36.9 41.9
Citi Economic Surprise Europe 2.6 40.8 56.9 53.1 55.3 71.1
Citi Economic Surprise EM -11.0 -13.9 -4.4 18.1 37.1 46.6
Citi Economic Surprise UK 79.7 75.0 46.3 49.6 69.8 92.3
ISM manufacturing 51.7 52.0 53.5 54.5 56.0 57.7
ISM new orders 57.3 55.9 56.1 60.5 59.5 63.2
Global manufacturing PMI 51.7 53.1 53.2 53.6 53.9 53.5
China manufacturing PMI 50.4 51.2 51.7 51.4 51.3 51.6
Japan manufacturing PMI 50.4 51.4 51.3 52.4 52.7 53.3
US durable goods orders 0.3 5.0 -4.7 -0.8 1.8
US initial jobless claims 246 266 268 237 248 223
US Industrial production -0.3 0.3 -0.2 0.6 -0.3
Euro Industrial production -0.8 0.2 1.5 -1.6
Japan Industrial production 0.6 0.0 1.5 0.7 -0.8
US retail sales 1.0 0.7 0.2 1.0 0.4
Euro retail sales -0.1 1.2 -0.2 -0.5 -0.1
Japan retail sales -1.7 -0.2 1.7 0.7 1.0
China retail sales 10.7 10.0 10.8 10.9
US consumer confidence 103.5 100.8 109.4 113.3 111.6 114.8
Euro consumer confidence -8.2 -8.0 -6.2 -5.1 -4.8 -6.2
ifo German business expectations 104.5 106.0 105.4 105.5 103.2 104.0
China export trade -10.4 -7.9 -1.5 -6.2 7.9
South Korea export trade -5.9 -3.2 2.5 6.4 11.2 20.2
German export trade 0.4 2.0 4.3 3.3
China monthly money supply 11.5 11.6 11.4 11.3 11.3
US personal income 0.4 0.4 0.2 0.3 0.4
MONTHLY VIEWPOINT
From the Chief Investment Officer Marco E Pabst
07th
March 2017
ACPI Investments Ltd.
Pegasus House | 37-43 Sackville Street | London W1S 3EH
T +44 (0)20 3697 9580 | F +44 (0)20 3697 9501 | E [email protected]
www.acpi.com
12
The Global PMI heatmap
Source(s): ACPI, Bloomberg Co
un
try
/ R
egi
on
Cat
ego
ry /
Se
cto
rFe
b-2
017
Jan
-201
7D
ec-
2016
No
v-20
16O
ct-2
016
Sep
-201
6A
ug-
2016
Jul-
2016
Jun
-201
6M
ay-2
016
Ap
r-20
16M
ar-2
016
Feb
-201
6Ja
n-2
016
De
c-20
15N
ov-
2015
Oct
-201
5Se
p-2
015
Au
g-20
15Ju
l-20
15Ju
n-2
015
May
-201
5A
pr-
2015
Mar
-201
5Fe
b-2
015
Au
stri
aM
anu
fact
uri
ng
57.2
57.3
56.3
55.4
53.9
53.5
52.1
53.4
54.5
52.0
52.0
52.8
51.9
51.2
50.6
51.4
53.0
52.5
50.5
52.4
51.2
50.3
50.1
47.7
48.7
Bra
zil
Co
mp
osi
te#N
/A44
.745
.245
.344
.946
.144
.446
.442
.338
.339
.040
.839
.045
.143
.944
.542
.742
.744
.840
.841
.042
.944
.247
.051
.3
Bra
zil
Man
ufa
ctu
rin
g46
.944
.045
.246
.246
.346
.045
.746
.043
.241
.642
.646
.044
.547
.445
.643
.844
.147
.045
.847
.246
.545
.946
.046
.249
.6
Bra
zil
Serv
ice
s#N
/A45
.145
.144
.443
.945
.342
.745
.641
.437
.337
.438
.636
.944
.443
.545
.543
.041
.744
.839
.139
.942
.544
.647
.952
.3
Can
ada
Man
ufa
ctu
rin
g54
.753
.551
.851
.551
.150
.351
.151
.951
.852
.152
.251
.549
.449
.347
.548
.648
.048
.649
.450
.851
.349
.849
.048
.948
.7
Ch
ina
Co
mp
osi
te52
.652
.253
.552
.952
.951
.451
.851
.950
.350
.550
.851
.349
.450
.149
.450
.549
.948
.048
.850
.250
.651
.251
.351
.851
.8
Ch
ina
Man
ufa
ctu
rin
g51
.751
.051
.950
.951
.250
.150
.050
.648
.649
.249
.449
.748
.048
.448
.248
.648
.347
.247
.347
.849
.449
.248
.949
.650
.7
Ch
ina
Serv
ice
s52
.653
.153
.453
.152
.452
.052
.151
.752
.751
.251
.852
.251
.252
.450
.251
.252
.050
.551
.553
.851
.853
.552
.952
.352
.0
Cze
ch R
ep
ub
lic
Man
ufa
ctu
rin
g57
.655
.753
.852
.253
.352
.050
.149
.351
.853
.353
.654
.355
.556
.955
.654
.254
.055
.556
.657
.556
.955
.554
.756
.155
.6
De
velo
pe
d M
arke
tsM
anu
fact
uri
ng
54.1
54.2
53.7
52.9
52.6
51.5
51.2
51.4
51.2
50.3
50.5
50.9
50.8
52.1
52.0
52.3
52.6
51.7
51.9
52.1
51.7
52.1
51.9
52.7
52.6
De
velo
pe
d M
arke
tsSe
rvic
es
53.6
54.5
53.8
54.0
53.6
51.7
51.5
51.3
51.5
51.8
52.3
51.7
51.2
53.3
53.9
54.8
54.2
53.9
55.2
54.7
54.4
54.8
55.7
56.0
54.9
De
velo
pe
d M
arke
tsC
om
po
site
54.0
54.6
54.1
54.0
53.7
51.9
51.7
51.5
51.4
51.4
51.9
51.7
51.2
53.2
53.7
54.6
54.0
53.6
54.6
54.4
53.9
54.4
55.0
55.7
54.7
Egyp
tW
ho
le E
con
om
y46
.743
.342
.841
.842
.046
.347
.048
.947
.547
.646
.944
.548
.148
.048
.245
.047
.250
.251
.249
.250
.249
.949
.849
.646
.8
Eme
rgin
g M
arke
tsC
om
po
site
52.1
51.9
51.9
51.4
51.8
51.1
51.3
51.5
49.9
49.5
49.9
50.5
49.0
50.1
49.4
50.2
49.7
49.0
49.8
50.2
50.0
50.8
51.2
51.6
51.9
Eme
rgin
g M
arke
tsM
anu
fact
uri
ng
51.3
50.8
51.0
50.7
51.0
50.4
50.1
50.3
49.3
49.5
49.6
50.2
48.9
49.3
49.0
49.2
49.0
48.5
48.6
49.1
49.9
49.8
49.6
50.0
51.1
Eme
rgin
g M
arke
tsSe
rvic
es
52.0
52.1
51.5
50.9
51.0
51.0
51.2
51.5
50.5
49.1
49.9
50.1
48.9
50.8
49.5
50.2
50.4
49.9
50.7
51.2
49.7
51.3
51.8
52.0
51.8
Euro
pe
an U
nio
nC
om
po
site
55.6
54.6
54.9
54.1
53.6
52.9
53.0
51.8
52.9
53.1
52.8
53.3
53.0
54.1
54.5
54.5
54.2
53.5
54.5
54.5
54.9
54.1
54.9
55.0
54.1
Euro
pe
an U
nio
nM
anu
fact
uri
ng
55.3
55.3
55.0
53.5
53.4
52.9
51.9
51.4
52.7
51.4
51.5
51.7
51.4
52.4
52.9
52.8
52.6
52.0
52.3
52.6
52.6
52.3
52.2
52.6
51.8
Euro
pe
an U
nio
nSe
rvic
es
55.0
53.9
54.4
54.1
53.3
52.3
52.8
51.5
52.7
53.4
52.9
53.3
53.2
54.1
54.5
54.6
54.3
53.6
54.7
54.8
55.4
54.4
55.4
55.3
54.5
Euro
zon
eC
om
po
site
56.0
54.4
54.4
53.9
53.3
52.6
52.9
53.2
53.1
53.1
53.0
53.1
53.0
53.6
54.3
54.2
53.9
53.6
54.3
53.9
54.2
53.6
53.9
54.0
53.3
Euro
zon
eM
anu
fact
uri
ng
55.4
55.2
54.9
53.7
53.5
52.6
51.7
52.0
52.8
51.5
51.7
51.6
51.2
52.3
53.2
52.8
52.3
52.0
52.3
52.4
52.5
52.2
52.0
52.2
51.0
Euro
zon
eR
eta
il#N
/A50
.150
.448
.648
.649
.651
.048
.948
.550
.647
.949
.250
.148
.949
.048
.551
.351
.951
.454
.250
.451
.449
.548
.646
.4
Euro
zon
eSe
rvic
es
55.5
53.7
53.7
53.8
52.8
52.2
52.8
52.9
52.8
53.3
53.1
53.1
53.3
53.6
54.2
54.2
54.1
53.7
54.4
54.0
54.4
53.8
54.1
54.2
53.7
Euro
zon
eC
on
stru
ctio
n#N
/A50
.752
.351
.449
.449
.148
.648
.346
.548
.447
.549
.051
.350
.349
.448
.747
.848
.847
.247
.146
.047
.246
.247
.146
.2
Fran
ceC
om
po
site
55.9
54.1
53.1
51.4
51.6
52.7
51.9
50.1
49.6
50.9
50.2
50.0
49.3
50.2
50.1
51.0
52.6
51.9
50.2
51.5
53.3
52.0
50.6
51.5
52.2
Fran
ceM
anu
fact
uri
ng
52.2
53.6
53.5
51.7
51.8
49.7
48.3
48.6
48.3
48.4
48.0
49.6
50.2
50.0
51.4
50.6
50.6
50.6
48.3
49.6
50.7
49.4
48.0
48.8
47.6
Fran
ceR
eta
il#N
/A53
.150
.447
.347
.549
.153
.051
.651
.050
.648
.245
.548
.148
.946
.647
.851
.949
.649
.552
.948
.948
.746
.245
.743
.6
Fran
ceSe
rvic
es
56.4
54.1
52.9
51.6
51.4
53.3
52.3
50.5
49.9
51.6
50.6
49.9
49.2
50.3
49.8
51.0
52.7
51.9
50.6
52.0
54.1
52.8
51.4
52.4
53.4
Fran
ceC
on
stru
ctio
n51
.550
.150
.650
.347
.547
.845
.344
.842
.343
.841
.642
.744
.643
.042
.244
.843
.844
.242
.340
.638
.440
.037
.735
.934
.9
Ge
rman
yC
om
po
site
56.1
54.8
55.2
55.0
55.1
52.8
53.3
55.3
54.4
54.5
53.6
54.0
54.1
54.5
55.5
55.2
54.2
54.1
55.0
53.7
53.7
52.6
54.1
55.4
53.8
Ge
rman
yM
anu
fact
uri
ng
56.8
56.4
55.6
54.3
55.0
54.3
53.6
53.8
54.5
52.1
51.8
50.7
50.5
52.3
53.2
52.9
52.1
52.3
53.3
51.8
51.9
51.1
52.1
52.8
51.1
Ge
rman
yR
eta
il#N
/A50
.352
.049
.651
.053
.054
.152
.051
.654
.051
.054
.152
.549
.550
.549
.652
.454
.054
.757
.754
.055
.852
.653
.051
.5
Ge
rman
ySe
rvic
es
54.4
53.4
54.3
55.1
54.2
50.9
51.7
54.4
53.7
55.2
54.5
55.1
55.3
55.0
56.0
55.6
54.5
54.1
54.9
53.8
53.8
53.0
54.0
55.4
54.7
Ge
rman
yC
on
stru
ctio
n#N
/A52
.054
.953
.952
.952
.451
.651
.650
.452
.753
.455
.859
.657
.955
.552
.551
.852
.450
.350
.650
.750
.851
.053
.353
.1
Gre
ece
Man
ufa
ctu
rin
g47
.746
.649
.348
.348
.649
.250
.448
.750
.448
.449
.749
.048
.450
.050
.248
.147
.343
.339
.130
.246
.948
.046
.548
.948
.4
Ho
ng
Ko
ng
Wh
ole
Eco
no
my
49.6
49.9
50.3
49.5
48.2
49.3
49.0
47.2
45.4
47.2
45.3
45.5
46.4
46.1
46.4
46.6
46.6
45.7
44.4
48.2
49.2
47.6
48.6
49.6
50.7
Ind
iaC
om
po
site
50.7
49.4
47.6
49.1
55.4
52.4
54.6
52.4
51.1
50.9
52.8
54.3
51.2
53.3
51.6
50.2
52.6
51.5
52.6
52.0
49.2
51.2
52.5
53.2
53.5
Ind
iaM
anu
fact
uri
ng
50.7
50.4
49.6
52.3
54.4
52.1
52.6
51.8
51.7
50.7
50.5
52.4
51.1
51.1
49.1
50.3
50.7
51.2
52.3
52.7
51.3
52.6
51.3
52.1
51.2
Ind
iaSe
rvic
es
50.3
48.7
46.8
46.7
54.5
52.0
54.7
51.9
50.3
51.0
53.7
54.3
51.4
54.3
53.6
50.1
53.2
51.3
51.8
50.8
47.7
49.6
52.4
53.0
53.9
Ind
on
esi
aM
anu
fact
uri
ng
49.3
50.4
49.0
49.7
48.7
50.9
50.4
48.4
51.9
50.6
50.9
50.6
48.7
48.9
47.8
46.9
47.8
47.4
48.4
47.3
47.8
47.1
46.7
46.4
47.5
Ire
lan
dC
om
po
site
57.8
59.3
58.4
55.5
54.0
54.8
56.9
56.5
59.2
59.1
58.1
60.7
59.5
61.1
59.2
60.2
57.7
59.5
59.7
61.8
60.9
60.8
59.7
59.8
60.7
Ire
lan
dM
anu
fact
uri
ng
53.8
55.5
55.7
53.7
52.1
51.3
51.7
50.2
53.0
51.5
52.6
54.9
52.9
54.3
54.2
53.3
53.6
53.8
53.6
56.7
54.6
57.1
55.8
56.8
57.5
Ire
lan
dSe
rvic
es
60.6
61.0
59.1
56.0
54.6
56.2
59.7
59.5
61.2
61.7
59.8
62.8
62.1
64.0
61.8
63.6
60.1
62.4
62.1
63.4
63.3
61.4
60.6
60.9
61.4
Ire
lan
dC
on
stru
ctio
n#N
/A55
.758
.959
.862
.358
.758
.461
.059
.755
.956
.462
.368
.863
.658
.655
.556
.355
.856
.559
.165
.763
.357
.252
.952
.0
Ital
yC
om
po
site
54.8
52.8
52.9
53.4
51.1
51.1
51.9
52.2
52.6
50.8
53.1
52.4
53.7
53.8
56.0
54.3
53.9
53.4
55.0
53.5
54.0
53.7
53.9
52.4
51.0
Ital
yM
anu
fact
uri
ng
55.0
53.0
53.2
52.2
50.9
51.0
49.8
51.2
53.5
52.4
53.9
53.5
52.2
53.2
55.6
54.9
54.1
52.7
53.8
55.3
54.1
54.8
53.8
53.3
51.9
Ital
yR
eta
il#N
/A45
.647
.948
.846
.545
.043
.240
.340
.245
.242
.646
.649
.447
.950
.247
.748
.851
.748
.750
.746
.748
.349
.045
.742
.3
Ital
ySe
rvic
es
54.1
52.4
52.3
53.3
51.0
50.7
52.3
52.0
51.9
49.8
52.1
51.2
53.8
53.6
55.3
53.4
53.4
53.3
54.6
52.0
53.4
52.5
53.1
51.6
50.0
Ital
yC
on
stru
ctio
n49
.949
.250
.248
.545
.945
.147
.746
.944
.947
.245
.345
.846
.147
.248
.647
.346
.448
.548
.049
.247
.049
.348
.451
.149
.2
Jap
anC
om
po
site
52.2
52.3
52.8
52.0
51.3
48.9
49.8
50.1
49.0
49.2
48.9
49.9
51.0
52.6
52.2
52.3
52.3
51.2
52.9
51.5
51.5
51.6
50.7
49.4
50.0
Jap
anM
anu
fact
uri
ng
53.3
52.7
52.4
51.3
51.4
50.4
49.5
49.3
48.1
47.7
48.2
49.1
50.1
52.3
52.6
52.6
52.4
51.0
51.7
51.2
50.1
50.9
49.9
50.3
51.6
Jap
anSe
rvic
es
51.3
51.9
52.3
51.8
50.5
48.2
49.6
50.4
49.4
50.4
49.3
50.0
51.2
52.4
51.5
51.6
52.2
51.4
53.7
51.2
51.8
51.5
51.3
48.4
48.5
Leb
ano
nW
ho
le E
con
om
y#N
/A47
.747
.046
.943
.845
.145
.045
.544
.444
.844
.145
.047
.449
.147
.946
.947
.148
.147
.849
.349
.348
.049
.048
.948
.7
Me
xico
Man
ufa
ctu
rin
g50
.650
.850
.251
.151
.851
.950
.950
.651
.153
.652
.453
.253
.152
.252
.453
.053
.052
.152
.452
.952
.053
.353
.853
.854
.4
Ne
the
rlan
ds
Man
ufa
ctu
rin
g58
.356
.557
.357
.055
.753
.453
.553
.252
.052
.752
.653
.651
.752
.453
.453
.553
.753
.053
.956
.056
.255
.554
.052
.552
.2
Po
lan
dM
anu
fact
uri
ng
54.2
54.8
54.3
51.9
50.2
52.2
51.5
50.3
51.8
52.1
51.0
53.8
52.8
50.9
52.1
52.1
52.2
50.9
51.1
54.5
54.3
52.4
54.0
54.8
55.1
Ru
ssia
Co
mp
osi
te55
.458
.356
.655
.853
.753
.152
.953
.553
.551
.251
.350
.850
.648
.447
.850
.549
.050
.949
.350
.949
.551
.650
.846
.844
.7
Ru
ssia
Man
ufa
ctu
rin
g52
.554
.753
.753
.652
.451
.150
.849
.551
.549
.648
.048
.349
.349
.848
.750
.150
.249
.147
.948
.348
.747
.648
.948
.149
.7
Sau
di A
rab
iaW
ho
le E
con
om
y57
.056
.755
.555
.053
.255
.356
.656
.054
.454
.854
.254
.554
.453
.954
.456
.355
.756
.558
.757
.756
.157
.058
.360
.158
.5
Sou
th A
fric
aW
ho
le E
con
om
y50
.551
.351
.650
.850
.550
.749
.849
.949
.650
.247
.947
.049
.149
.649
.149
.647
.547
.949
.348
.949
.250
.151
.551
.650
.0
Sou
th K
ore
aM
anu
fact
uri
ng
49.2
49.0
49.4
48.0
48.0
47.6
48.6
50.1
50.5
50.1
50.0
49.5
48.7
49.5
50.7
49.1
49.1
49.2
47.9
47.6
46.1
47.8
48.8
49.2
51.1
Spai
nC
om
po
site
57.0
54.7
55.5
55.2
54.4
54.1
54.8
53.7
55.7
54.8
55.2
55.1
54.5
55.3
55.2
56.2
55.0
54.6
58.8
58.3
55.8
58.3
59.1
56.9
56.0
Spai
nM
anu
fact
uri
ng
54.8
55.6
55.3
54.5
53.3
52.3
51.0
51.0
52.2
51.8
53.5
53.4
54.1
55.4
53.0
53.1
51.3
51.7
53.2
53.6
54.5
55.8
54.2
54.3
54.2
Spai
nSe
rvic
es
57.7
54.2
55.0
55.1
54.6
54.7
56.0
54.1
56.0
55.4
55.1
55.3
54.1
54.6
55.1
56.7
55.9
55.1
59.6
59.7
56.1
58.4
60.3
57.3
56.2
Taiw
anM
anu
fact
uri
ng
54.5
55.6
56.2
54.7
52.7
52.2
51.8
51.0
50.5
48.5
49.7
51.1
49.4
50.6
51.7
49.5
47.8
46.9
46.1
47.1
46.3
49.3
49.2
51.0
52.1
Turk
ey
Man
ufa
ctu
rin
g49
.748
.747
.748
.849
.848
.347
.047
.647
.449
.448
.949
.250
.350
.952
.250
.949
.548
.849
.350
.149
.050
.248
.548
.049
.6
Un
ite
d A
rab
Em
irat
es
Wh
ole
Eco
no
my
56.0
55.3
55.0
54.2
53.3
54.1
54.7
55.3
53.4
54.0
52.8
54.5
53.1
52.7
53.3
54.5
54.0
56.0
57.1
55.8
54.7
56.4
56.8
56.3
58.1
Un
ite
d K
ingd
om
Co
mp
osi
te53
.855
.456
.755
.354
.853
.953
.547
.452
.553
.152
.053
.652
.855
.955
.255
.755
.253
.455
.256
.757
.555
.958
.558
.556
.6
Un
ite
d K
ingd
om
Man
ufa
ctu
rin
g54
.655
.755
.953
.554
.555
.453
.448
.252
.450
.649
.751
.150
.952
.551
.252
.554
.851
.551
.752
.351
.452
.252
.353
.854
.2
Un
ite
d K
ingd
om
Serv
ice
s53
.354
.556
.255
.254
.552
.652
.947
.452
.353
.552
.353
.752
.755
.655
.555
.954
.953
.355
.657
.458
.556
.559
.558
.956
.7
Un
ite
d K
ingd
om
Co
nst
ruct
ion
52.5
52.2
54.2
52.8
52.6
52.3
49.2
45.9
46.0
51.2
52.0
54.2
54.2
55.0
57.8
55.3
58.8
59.9
57.3
57.1
58.1
55.9
54.2
57.8
60.1
Un
ite
d S
tate
sM
anu
fact
uri
ng
54.2
55.0
54.3
54.1
53.4
51.5
52.0
52.9
51.3
50.7
50.8
51.5
51.3
52.4
51.2
52.8
54.1
53.1
53.0
53.8
53.6
54.0
54.1
55.7
55.1
Un
ite
d S
tate
sSe
rvic
es
53.8
55.6
53.9
54.6
54.8
52.3
51.0
51.4
51.4
51.3
52.8
51.3
49.7
53.2
54.3
56.1
54.8
55.1
56.1
55.7
54.8
56.2
57.4
59.2
57.1
Un
ite
d S
tate
sC
om
po
site
54.1
55.8
54.1
54.9
54.9
52.3
51.5
51.8
51.2
50.9
52.4
51.3
50.0
53.2
54.0
55.9
55.0
55.0
55.7
55.7
54.6
56.0
57.0
59.2
57.2
Vie
tnam
Man
ufa
ctu
rin
g54
.251
.952
.454
.051
.752
.952
.251
.952
.652
.752
.350
.750
.351
.551
.349
.450
.149
.551
.352
.652
.254
.853
.550
.751
.7
Wo
rld
Co
mp
osi
te53
.553
.953
.653
.253
.151
.751
.551
.751
.150
.951
.351
.450
.752
.352
.353
.252
.752
.453
.453
.352
.853
.253
.854
.553
.8
Wo
rld
Man
ufa
ctu
rin
g52
.952
.752
.752
.051
.951
.050
.751
.050
.450
.150
.250
.750
.050
.950
.751
.051
.050
.450
.550
.850
.951
.150
.851
.551
.9
Wo
rld
Serv
ice
s53
.354
.053
.553
.152
.951
.651
.251
.651
.351
.251
.751
.350
.852
.752
.653
.653
.253
.154
.454
.053
.353
.854
.655
.054
.0
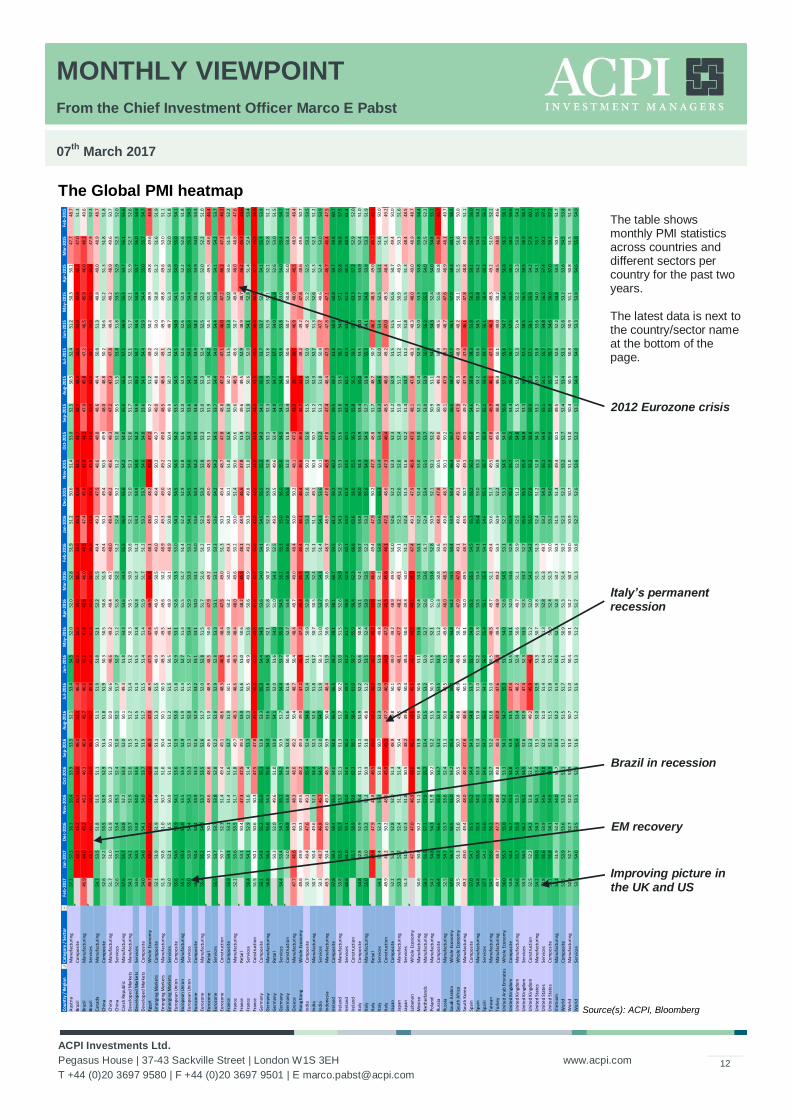
The table shows monthly PMI statistics across countries and different sectors per country for the past two years. The latest data is next to the country/sector name at the bottom of the page.
2012 Eurozone crisis
Brazil in recession
Italy’s permanent recession
Improving picture in the UK and US
EM recovery
MONTHLY VIEWPOINT
From the Chief Investment Officer Marco E Pabst
07th
March 2017
ACPI Investments Ltd.
Pegasus House | 37-43 Sackville Street | London W1S 3EH
T +44 (0)20 3697 9580 | F +44 (0)20 3697 9501 | E [email protected]
www.acpi.com
13
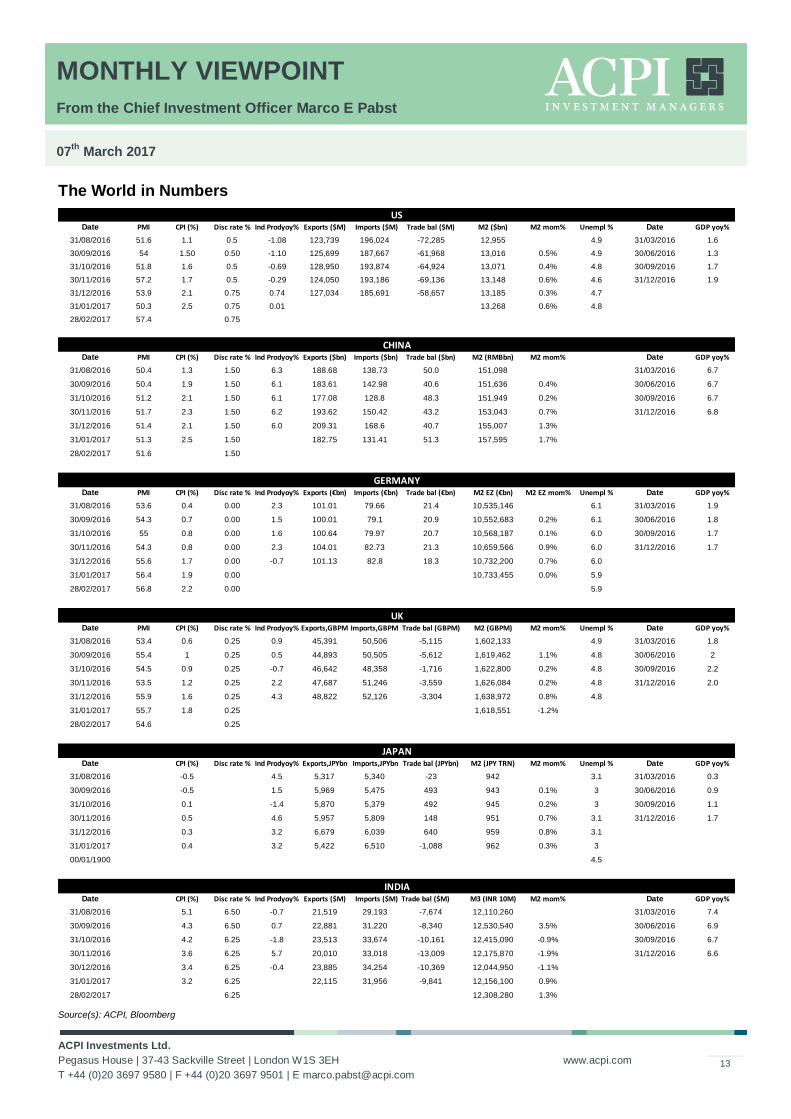
The World in Numbers
Source(s): ACPI, Bloomberg
Date PMI CPI (%) Disc rate % Ind Prodyoy% Exports ($M) Imports ($M) Trade bal ($M) M2 ($bn) M2 mom% Unempl % Date GDP yoy%
31/08/2016 51.6 1.1 0.5 -1.08 123,739 196,024 -72,285 12,955 4.9 31/03/2016 1.6
30/09/2016 54 1.50 0.50 -1.10 125,699 187,667 -61,968 13,016 0.5% 4.9 30/06/2016 1.3
31/10/2016 51.8 1.6 0.5 -0.69 128,950 193,874 -64,924 13,071 0.4% 4.8 30/09/2016 1.7
30/11/2016 57.2 1.7 0.5 -0.29 124,050 193,186 -69,136 13,148 0.6% 4.6 31/12/2016 1.9
31/12/2016 53.9 2.1 0.75 0.74 127,034 185,691 -58,657 13,185 0.3% 4.7
31/01/2017 50.3 2.5 0.75 0.01 13,268 0.6% 4.8
28/02/2017 57.4 0.75
Date PMI CPI (%) Disc rate % Ind Prodyoy% Exports ($bn) Imports ($bn) Trade bal ($bn) M2 (RMBbn) M2 mom% Date GDP yoy%
31/08/2016 50.4 1.3 1.50 6.3 188.68 138.73 50.0 151,098 31/03/2016 6.7
30/09/2016 50.4 1.9 1.50 6.1 183.61 142.98 40.6 151,636 0.4% 30/06/2016 6.7
31/10/2016 51.2 2.1 1.50 6.1 177.08 128.8 48.3 151,949 0.2% 30/09/2016 6.7
30/11/2016 51.7 2.3 1.50 6.2 193.62 150.42 43.2 153,043 0.7% 31/12/2016 6.8
31/12/2016 51.4 2.1 1.50 6.0 209.31 168.6 40.7 155,007 1.3%
31/01/2017 51.3 2.5 1.50 182.75 131.41 51.3 157,595 1.7%
28/02/2017 51.6 1.50
Date PMI CPI (%) Disc rate % Ind Prodyoy% Exports (€bn) Imports (€bn) Trade bal (€bn) M2 EZ (€bn) M2 EZ mom% Unempl % Date GDP yoy%
31/08/2016 53.6 0.4 0.00 2.3 101.01 79.66 21.4 10,535,146 6.1 31/03/2016 1.9
30/09/2016 54.3 0.7 0.00 1.5 100.01 79.1 20.9 10,552,683 0.2% 6.1 30/06/2016 1.8
31/10/2016 55 0.8 0.00 1.6 100.64 79.97 20.7 10,568,187 0.1% 6.0 30/09/2016 1.7
30/11/2016 54.3 0.8 0.00 2.3 104.01 82.73 21.3 10,659,566 0.9% 6.0 31/12/2016 1.7
31/12/2016 55.6 1.7 0.00 -0.7 101.13 82.8 18.3 10,732,200 0.7% 6.0
31/01/2017 56.4 1.9 0.00 10,733,455 0.0% 5.9
28/02/2017 56.8 2.2 0.00 5.9
Date PMI CPI (%) Disc rate % Ind Prodyoy% Exports,GBPM Imports,GBPM Trade bal (GBPM) M2 (GBPM) M2 mom% Unempl % Date GDP yoy%
31/08/2016 53.4 0.6 0.25 0.9 45,391 50,506 -5,115 1,602,133 4.9 31/03/2016 1.8
30/09/2016 55.4 1 0.25 0.5 44,893 50,505 -5,612 1,619,462 1.1% 4.8 30/06/2016 2
31/10/2016 54.5 0.9 0.25 -0.7 46,642 48,358 -1,716 1,622,800 0.2% 4.8 30/09/2016 2.2
30/11/2016 53.5 1.2 0.25 2.2 47,687 51,246 -3,559 1,626,084 0.2% 4.8 31/12/2016 2.0
31/12/2016 55.9 1.6 0.25 4.3 48,822 52,126 -3,304 1,638,972 0.8% 4.8
31/01/2017 55.7 1.8 0.25 1,618,551 -1.2%
28/02/2017 54.6 0.25
Date CPI (%) Disc rate % Ind Prodyoy% Exports,JPYbn Imports,JPYbn Trade bal (JPYbn) M2 (JPY TRN) M2 mom% Unempl % Date GDP yoy%
31/08/2016 -0.5 4.5 5,317 5,340 -23 942 3.1 31/03/2016 0.3
30/09/2016 -0.5 1.5 5,969 5,475 493 943 0.1% 3 30/06/2016 0.9
31/10/2016 0.1 -1.4 5,870 5,379 492 945 0.2% 3 30/09/2016 1.1
30/11/2016 0.5 4.6 5,957 5,809 148 951 0.7% 3.1 31/12/2016 1.7
31/12/2016 0.3 3.2 6,679 6,039 640 959 0.8% 3.1
31/01/2017 0.4 3.2 5,422 6,510 -1,088 962 0.3% 3
00/01/1900 4.5
Date CPI (%) Disc rate % Ind Prodyoy% Exports ($M) Imports ($M) Trade bal ($M) M3 (INR 10M) M2 mom% Date GDP yoy%
31/08/2016 5.1 6.50 -0.7 21,519 29,193 -7,674 12,110,260 31/03/2016 7.4
30/09/2016 4.3 6.50 0.7 22,881 31,220 -8,340 12,530,540 3.5% 30/06/2016 6.9
31/10/2016 4.2 6.25 -1.8 23,513 33,674 -10,161 12,415,090 -0.9% 30/09/2016 6.7
30/11/2016 3.6 6.25 5.7 20,010 33,018 -13,009 12,175,870 -1.9% 31/12/2016 6.6
30/12/2016 3.4 6.25 -0.4 23,885 34,254 -10,369 12,044,950 -1.1%
31/01/2017 3.2 6.25 22,115 31,956 -9,841 12,156,100 0.9%
28/02/2017 6.25 12,308,280 1.3%
INDIA
US
CHINA
GERMANY
UK
JAPAN
MONTHLY VIEWPOINT
From the Chief Investment Officer Marco E Pabst
07th
March 2017
ACPI Investments Ltd.
Pegasus House | 37-43 Sackville Street | London W1S 3EH
T +44 (0)20 3697 9580 | F +44 (0)20 3697 9501 | E [email protected]
www.acpi.com
14
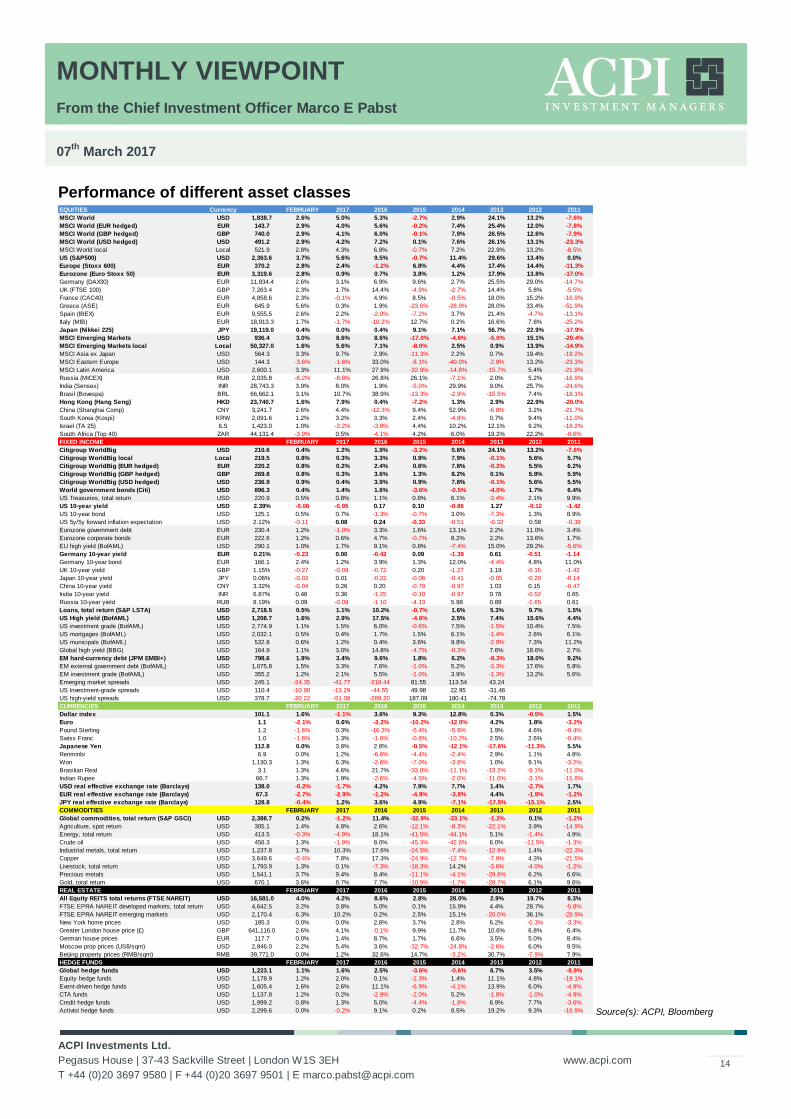
Performance of different asset classes
Source(s): ACPI, Bloomberg
EQUITIES Currency FEBRUARY 2017 2016 2015 2014 2013 2012 2011
MSCI World USD 1,838.7 2.6% 5.0% 5.3% -2.7% 2.9% 24.1% 13.2% -7.6%
MSCI World (EUR hedged) EUR 143.7 2.9% 4.0% 5.6% -0.2% 7.4% 25.4% 12.0% -7.8%
MSCI World (GBP hedged) GBP 740.0 2.9% 4.1% 6.0% -0.1% 7.9% 26.5% 12.6% -7.9%
MSCI World (USD hedged) USD 491.2 2.9% 4.2% 7.2% 0.1% 7.6% 26.1% 13.1% -23.3%
MSCI World local Local 521.9 2.8% 4.3% 6.8% -0.7% 7.2% 22.9% 13.2% -8.5%
US (S&P500) USD 2,363.6 3.7% 5.6% 9.5% -0.7% 11.4% 29.6% 13.4% 0.0%
Europe (Stoxx 600) EUR 370.2 2.8% 2.4% -1.2% 6.8% 4.4% 17.4% 14.4% -11.3%
Eurozone (Euro Stoxx 50) EUR 3,319.6 2.8% 0.9% 0.7% 3.8% 1.2% 17.9% 13.8% -17.0%
Germany (DAX30) EUR 11,834.4 2.6% 3.1% 6.9% 9.6% 2.7% 25.5% 29.0% -14.7%
UK (FTSE 100) GBP 7,263.4 2.3% 1.7% 14.4% -4.9% -2.7% 14.4% 5.8% -5.5%
France (CAC40) EUR 4,858.6 2.3% -0.1% 4.9% 8.5% -0.5% 18.0% 15.2% -16.9%
Greece (ASE) EUR 645.9 5.6% 0.3% 1.9% -23.6% -28.9% 28.0% 33.4% -51.9%
Spain (IBEX) EUR 9,555.5 2.6% 2.2% -2.0% -7.2% 3.7% 21.4% -4.7% -13.1%
Italy (MIB) EUR 18,913.3 1.7% -1.7% -10.2% 12.7% 0.2% 16.6% 7.8% -25.2%
Japan (Nikkei 225) JPY 19,119.0 0.4% 0.0% 0.4% 9.1% 7.1% 56.7% 22.9% -17.9%
MSCI Emerging Markets USD 936.4 3.0% 8.6% 8.6% -17.0% -4.6% -5.0% 15.1% -20.4%
MSCI Emerging Markets local Local 50,327.0 1.6% 5.6% 7.1% -8.0% 2.5% 0.9% 13.9% -14.9%
MSCI Asia ex Japan USD 564.3 3.3% 9.7% 2.9% -11.3% 2.2% 0.7% 19.4% -19.2%
MSCI Eastern Europe USD 144.3 -3.6% -1.6% 33.0% -8.1% -40.0% -2.9% 13.2% -23.3%
MSCI Latin America USD 2,600.1 3.3% 11.1% 27.9% -32.9% -14.8% -15.7% 5.4% -21.9%
Russia (MICEX) RUB 2,035.8 -8.2% -8.8% 26.8% 26.1% -7.1% 2.0% 5.2% -16.9%
India (Sensex) INR 28,743.3 3.9% 8.0% 1.9% -5.0% 29.9% 9.0% 25.7% -24.6%
Brasil (Bovespa) BRL 66,662.1 3.1% 10.7% 38.9% -13.3% -2.9% -15.5% 7.4% -18.1%
Hong Kong (Hang Seng) HKD 23,740.7 1.6% 7.9% 0.4% -7.2% 1.3% 2.9% 22.9% -20.0%
China (Shanghai Comp) CNY 3,241.7 2.6% 4.4% -12.3% 9.4% 52.9% -6.8% 3.2% -21.7%
South Korea (Kospi) KRW 2,091.6 1.2% 3.2% 3.3% 2.4% -4.8% 0.7% 9.4% -11.0%
Israel (TA 25) ILS 1,423.0 1.0% -3.2% -3.8% 4.4% 10.2% 12.1% 9.2% -18.2%
South Africa (Top 40) ZAR 44,131.4 -3.9% 0.5% -4.1% 4.2% 6.0% 19.2% 22.2% -0.6%
FIXED INCOME FEBRUARY 2017 2016 2015 2014 2013 2012 2011
Citigroup WorldBig USD 210.6 0.4% 1.2% 1.9% -3.2% 0.8% 24.1% 13.2% -7.6%
Citigroup WorldBig local Local 219.5 0.8% 0.3% 3.3% 0.9% 7.9% -0.1% 5.6% 5.7%
Citigroup WorldBig (EUR hedged) EUR 220.2 0.8% 0.2% 2.4% 0.6% 7.8% -0.2% 5.5% 6.2%
Citigroup WorldBig (GBP hedged) GBP 269.8 0.8% 0.3% 3.6% 1.3% 8.2% 0.1% 5.8% 5.9%
Citigroup WorldBig (USD hedged) USD 236.9 0.9% 0.4% 3.9% 0.9% 7.8% -0.1% 5.6% 5.5%
World government bonds (Citi) USD 896.3 0.4% 1.4% 1.6% -3.6% -0.5% -4.0% 1.7% 6.4%
US Treasuries, total return USD 220.9 0.5% 0.8% 1.1% 0.8% 6.1% -3.4% 2.1% 9.9%
US 10-year yield USD 2.39% -0.06 -0.05 0.17 0.10 -0.86 1.27 -0.12 -1.42
US 10-year bond USD 125.1 0.5% 0.7% -1.3% -0.7% 3.0% -7.3% 1.3% 8.9%
US 5y/5y forward inflation expectation USD 2.12% -0.11 0.08 0.24 -0.33 -0.51 -0.32 0.58 -0.39
Eurozone government debt EUR 230.4 1.2% -1.0% 3.3% 1.6% 13.1% 2.2% 11.0% 3.4%
Eurozone corporate bonds EUR 222.6 1.2% 0.6% 4.7% -0.7% 8.2% 2.2% 13.6% 1.7%
EU high yield (BofAML) USD 290.1 1.0% 1.7% 9.1% 0.8% -7.4% 15.0% 29.2% -5.6%
Germany 10-year yield EUR 0.21% -0.23 0.00 -0.42 0.09 -1.39 0.61 -0.51 -1.14
Germany 10-year bond EUR 166.1 2.4% 1.2% 3.9% 1.3% 12.0% -4.4% 4.8% 11.0%
UK 10-year yield GBP 1.15% -0.27 -0.09 -0.72 0.20 -1.27 1.19 -0.15 -1.42
Japan 10-year yield JPY 0.06% -0.03 0.01 -0.22 -0.06 -0.41 -0.05 -0.20 -0.14
China 10-year yield CNY 3.32% -0.04 0.26 0.20 -0.79 -0.97 1.03 0.15 -0.47
India 10-year yield INR 6.87% 0.46 0.36 -1.25 -0.10 -0.97 0.78 -0.52 0.65
Russia 10-year yield RUB 8.19% 0.09 -0.09 -1.10 -4.13 5.98 0.89 -1.65 0.61
Loans, total return (S&P LSTA) USD 2,718.5 0.5% 1.1% 10.2% -0.7% 1.6% 5.3% 9.7% 1.5%
US High yield (BofAML) USD 1,208.7 1.6% 2.9% 17.5% -4.6% 2.5% 7.4% 15.6% 4.4%
US investment grade (BofAML) USD 2,774.9 1.1% 1.5% 6.0% -0.6% 7.5% -1.5% 10.4% 7.5%
US mortgages (BofAML) USD 2,032.1 0.5% 0.4% 1.7% 1.5% 6.1% -1.4% 2.6% 6.1%
US municipals (BofAML) USD 532.8 0.6% 1.2% 0.4% 3.6% 9.8% -2.9% 7.3% 11.2%
Global high yield (BBG) USD 164.9 1.1% 3.0% 14.8% -4.7% -0.3% 7.6% 18.6% 2.7%
EM hard-currency debt (JPM EMBI+) USD 798.6 1.9% 3.4% 9.6% 1.8% 6.2% -8.3% 18.0% 9.2%
EM external government debt (BofAML) USD 1,075.8 1.5% 3.3% 7.6% -1.0% 5.2% -3.3% 17.6% 5.8%
EM investment grade (BofAML) USD 355.2 1.2% 2.1% 5.5% -1.0% 3.9% -1.3% 13.2% 5.6%
Emerging market spreads USD 245.1 -24.35 -41.77 -218.44 81.55 113.54 43.24
US Investment-grade spreads USD 110.4 -10.90 -13.29 -44.55 49.98 22.95 -31.46
US high-yield spreads USD 378.7 -20.22 -51.08 -289.20 187.09 180.41 -74.78
CURRENCIES FEBRUARY 2017 2016 2015 2014 2013 2012 2011
Dollar index 101.1 1.6% -1.1% 3.6% 9.3% 12.8% 0.3% -0.5% 1.5%
Euro 1.1 -2.1% 0.6% -3.2% -10.2% -12.0% 4.2% 1.8% -3.2%
Pound Sterling 1.2 -1.6% 0.3% -16.3% -5.4% -5.9% 1.9% 4.6% -0.4%
Swiss Franc 1.0 -1.6% 1.3% -1.6% -0.8% -10.2% 2.5% 2.6% -0.4%
Japanese Yen 112.8 0.0% 3.8% 2.8% -0.5% -12.1% -17.6% -11.3% 5.5%
Renminbi 6.9 0.0% 1.2% -6.6% -4.4% -2.4% 2.9% 1.1% 4.8%
Won 1,130.3 1.3% 6.3% -2.6% -7.0% -3.8% 1.0% 9.1% -3.2%
Brasilian Real 3.1 1.3% 4.6% 21.7% -33.0% -11.1% -13.2% -9.1% -11.0%
Indian Rupee 66.7 1.3% 1.9% -2.6% -4.5% -2.0% -11.0% -3.1% -15.8%
USD real effective exchange rate (Barclays) 138.0 -0.2% -1.7% 4.2% 7.9% 7.7% 1.4% -2.7% 1.7%
EUR real effective exchange rate (Barclays) 67.3 -2.7% -2.9% -1.2% -4.9% -3.8% 4.4% -1.9% -1.2%
JPY real effective exchange rate (Barclays) 128.8 -0.4% 1.2% 3.6% 4.9% -7.1% -17.5% -15.1% 2.5%
COMMODITIES FEBRUARY 2017 2016 2015 2014 2013 2012 2011
Global commodities, total return (S&P GSCI) USD 2,388.7 0.2% -1.2% 11.4% -32.9% -33.1% -1.2% 0.1% -1.2%
Agriculture, spot return USD 305.1 1.4% 4.8% 2.6% -12.1% -8.3% -22.1% 3.9% -14.9%
Energy, total return USD 413.5 -0.3% -4.9% 18.1% -41.5% -44.1% 5.1% -1.4% 4.9%
Crude oil USD 456.3 1.3% -1.9% 8.0% -45.3% -42.6% 6.0% -11.5% -1.3%
Industrial metals, total return USD 1,237.8 1.7% 10.3% 17.6% -24.5% -7.4% -12.9% 1.4% -22.3%
Copper USD 3,649.6 -0.4% 7.8% 17.3% -24.9% -12.7% -7.9% 4.3% -21.5%
Livestock, total return USD 1,793.9 1.3% 0.1% -7.3% -18.3% 14.2% -3.6% -4.0% -1.2%
Precious metals USD 1,541.1 3.7% 9.4% 8.4% -11.1% -4.1% -29.8% 6.2% 6.6%
Gold, total return USD 670.1 3.6% 8.7% 7.7% -10.9% -1.7% -28.7% 6.1% 9.6%
REAL ESTATE FEBRUARY 2017 2016 2015 2014 2013 2012 2011
All Equity REITS total returns (FTSE NAREIT) USD 16,581.0 4.0% 4.2% 8.6% 2.8% 28.0% 2.9% 19.7% 8.3%
FTSE EPRA NAREIT developed markets, total return USD 4,642.5 3.2% 3.8% 5.0% 0.1% 15.9% 4.4% 28.7% -5.8%
FTSE EPRA NAREIT emerging markets USD 2,170.4 6.3% 10.2% 0.2% 2.5% 15.1% -20.0% 36.1% -28.9%
New York home prices USD 185.3 0.0% 0.0% 2.8% 3.7% 2.8% 6.2% -0.3% -3.3%
Greater London house price (£) GBP 641,116.0 2.6% 4.1% -0.1% 9.9% 11.7% 10.6% 6.8% 6.4%
German house prices EUR 117.7 0.0% 1.4% 8.7% 1.7% 6.6% 3.5% 5.0% 8.4%
Moscow prop prices (US$/sqm) USD 2,846.0 2.2% 5.4% 3.6% -32.7% -24.8% -2.6% 6.0% 9.5%
Beijing property prices (RMB/sqm) RMB 39,771.0 0.0% 1.2% 32.6% 14.7% -3.2% 30.7% -7.9% 7.9%
HEDGE FUNDS FEBRUARY 2017 2016 2015 2014 2013 2012 2011
Global hedge funds USD 1,223.1 1.1% 1.6% 2.5% -3.6% -0.6% 6.7% 3.5% -8.9%
Equity hedge funds USD 1,178.9 1.2% 2.0% 0.1% -2.3% 1.4% 11.1% 4.8% -19.1%
Event-driven hedge funds USD 1,605.4 1.6% 2.6% 11.1% -6.9% -4.1% 13.9% 6.0% -4.9%
CTA funds USD 1,137.8 1.2% 0.2% -2.9% -2.0% 5.2% -1.8% -1.0% -4.9%
Credit hedge funds USD 1,999.2 0.8% 1.3% 5.0% -4.4% -1.8% 6.9% 7.7% -3.6%
Activist hedge funds USD 2,299.6 0.0% -0.2% 9.1% 0.2% 8.5% 19.2% 9.3% -16.9%
MONTHLY VIEWPOINT
From the Chief Investment Officer Marco E Pabst
07th
March 2017
ACPI Investments Ltd.
Pegasus House | 37-43 Sackville Street | London W1S 3EH
T +44 (0)20 3697 9580 | F +44 (0)20 3697 9501 | E [email protected]
www.acpi.com
15
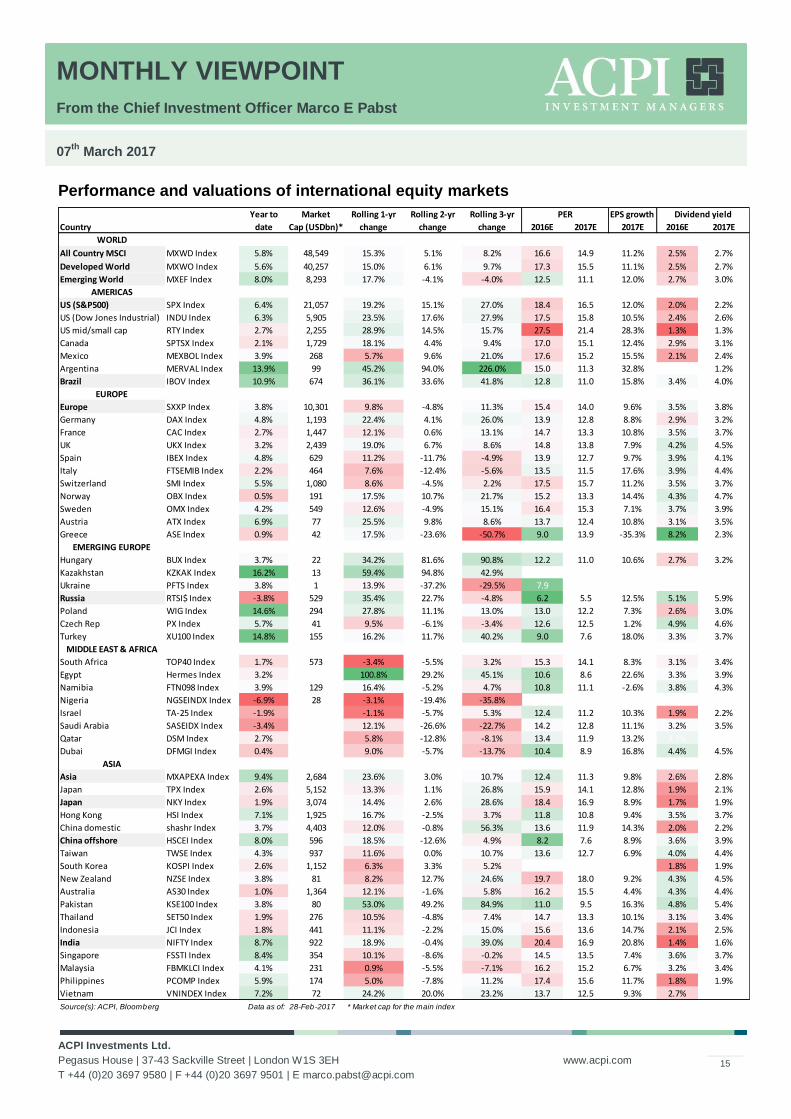
Performance and valuations of international equity markets
Year to Market Rolling 1-yr Rolling 2-yr Rolling 3-yr EPS growth
Country date Cap (USDbn)* change change change 2016E 2017E 2017E 2016E 2017E
WORLD
All Country MSCI MXWD Index 5.8% 48,549 15.3% 5.1% 8.2% 16.6 14.9 11.2% 2.5% 2.7%
Developed World MXWO Index 5.6% 40,257 15.0% 6.1% 9.7% 17.3 15.5 11.1% 2.5% 2.7%
Emerging World MXEF Index 8.0% 8,293 17.7% -4.1% -4.0% 12.5 11.1 12.0% 2.7% 3.0%
AMERICAS
US (S&P500) SPX Index 6.4% 21,057 19.2% 15.1% 27.0% 18.4 16.5 12.0% 2.0% 2.2%
US (Dow Jones Industrial) INDU Index 6.3% 5,905 23.5% 17.6% 27.9% 17.5 15.8 10.5% 2.4% 2.6%
US mid/small cap RTY Index 2.7% 2,255 28.9% 14.5% 15.7% 27.5 21.4 28.3% 1.3% 1.3%
Canada SPTSX Index 2.1% 1,729 18.1% 4.4% 9.4% 17.0 15.1 12.4% 2.9% 3.1%
Mexico MEXBOL Index 3.9% 268 5.7% 9.6% 21.0% 17.6 15.2 15.5% 2.1% 2.4%
Argentina MERVAL Index 13.9% 99 45.2% 94.0% 226.0% 15.0 11.3 32.8% 1.2%
Brazil IBOV Index 10.9% 674 36.1% 33.6% 41.8% 12.8 11.0 15.8% 3.4% 4.0%
EUROPE
Europe SXXP Index 3.8% 10,301 9.8% -4.8% 11.3% 15.4 14.0 9.6% 3.5% 3.8%
Germany DAX Index 4.8% 1,193 22.4% 4.1% 26.0% 13.9 12.8 8.8% 2.9% 3.2%
France CAC Index 2.7% 1,447 12.1% 0.6% 13.1% 14.7 13.3 10.8% 3.5% 3.7%
UK UKX Index 3.2% 2,439 19.0% 6.7% 8.6% 14.8 13.8 7.9% 4.2% 4.5%
Spain IBEX Index 4.8% 629 11.2% -11.7% -4.9% 13.9 12.7 9.7% 3.9% 4.1%
Italy FTSEMIB Index 2.2% 464 7.6% -12.4% -5.6% 13.5 11.5 17.6% 3.9% 4.4%
Switzerland SMI Index 5.5% 1,080 8.6% -4.5% 2.2% 17.5 15.7 11.2% 3.5% 3.7%
Norway OBX Index 0.5% 191 17.5% 10.7% 21.7% 15.2 13.3 14.4% 4.3% 4.7%
Sweden OMX Index 4.2% 549 12.6% -4.9% 15.1% 16.4 15.3 7.1% 3.7% 3.9%
Austria ATX Index 6.9% 77 25.5% 9.8% 8.6% 13.7 12.4 10.8% 3.1% 3.5%
Greece ASE Index 0.9% 42 17.5% -23.6% -50.7% 9.0 13.9 -35.3% 8.2% 2.3%
EMERGING EUROPE
Hungary BUX Index 3.7% 22 34.2% 81.6% 90.8% 12.2 11.0 10.6% 2.7% 3.2%
Kazakhstan KZKAK Index 16.2% 13 59.4% 94.8% 42.9%
Ukraine PFTS Index 3.8% 1 13.9% -37.2% -29.5% 7.9
Russia RTSI$ Index -3.8% 529 35.4% 22.7% -4.8% 6.2 5.5 12.5% 5.1% 5.9%
Poland WIG Index 14.6% 294 27.8% 11.1% 13.0% 13.0 12.2 7.3% 2.6% 3.0%
Czech Rep PX Index 5.7% 41 9.5% -6.1% -3.4% 12.6 12.5 1.2% 4.9% 4.6%
Turkey XU100 Index 14.8% 155 16.2% 11.7% 40.2% 9.0 7.6 18.0% 3.3% 3.7%
MIDDLE EAST & AFRICA
South Africa TOP40 Index 1.7% 573 -3.4% -5.5% 3.2% 15.3 14.1 8.3% 3.1% 3.4%
Egypt Hermes Index 3.2% 100.8% 29.2% 45.1% 10.6 8.6 22.6% 3.3% 3.9%
Namibia FTN098 Index 3.9% 129 16.4% -5.2% 4.7% 10.8 11.1 -2.6% 3.8% 4.3%
Nigeria NGSEINDX Index -6.9% 28 -3.1% -19.4% -35.8% 27.6%
Israel TA-25 Index -1.9% -1.1% -5.7% 5.3% 12.4 11.2 10.3% 1.9% 2.2%
Saudi Arabia SASEIDX Index -3.4% 12.1% -26.6% -22.7% 14.2 12.8 11.1% 3.2% 3.5%
Qatar DSM Index 2.7% 5.8% -12.8% -8.1% 13.4 11.9 13.2% 3.7% 4.0%
Dubai DFMGI Index 0.4% 9.0% -5.7% -13.7% 10.4 8.9 16.8% 4.4% 4.5%
ASIA
Asia MXAPEXA Index 9.4% 2,684 23.6% 3.0% 10.7% 12.4 11.3 9.8% 2.6% 2.8%
Japan TPX Index 2.6% 5,152 13.3% 1.1% 26.8% 15.9 14.1 12.8% 1.9% 2.1%
Japan NKY Index 1.9% 3,074 14.4% 2.6% 28.6% 18.4 16.9 8.9% 1.7% 1.9%
Hong Kong HSI Index 7.1% 1,925 16.7% -2.5% 3.7% 11.8 10.8 9.4% 3.5% 3.7%
China domestic shashr Index 3.7% 4,403 12.0% -0.8% 56.3% 13.6 11.9 14.3% 2.0% 2.2%
China offshore HSCEI Index 8.0% 596 18.5% -12.6% 4.9% 8.2 7.6 8.9% 3.6% 3.9%
Taiwan TWSE Index 4.3% 937 11.6% 0.0% 10.7% 13.6 12.7 6.9% 4.0% 4.4%
South Korea KOSPI Index 2.6% 1,152 6.3% 3.3% 5.2% 1.8% 1.9%
New Zealand NZSE Index 3.8% 81 8.2% 12.7% 24.6% 19.7 18.0 9.2% 4.3% 4.5%
Australia AS30 Index 1.0% 1,364 12.1% -1.6% 5.8% 16.2 15.5 4.4% 4.3% 4.4%
Pakistan KSE100 Index 3.8% 80 53.0% 49.2% 84.9% 11.0 9.5 16.3% 4.8% 5.4%
Thailand SET50 Index 1.9% 276 10.5% -4.8% 7.4% 14.7 13.3 10.1% 3.1% 3.4%
Indonesia JCI Index 1.8% 441 11.1% -2.2% 15.0% 15.6 13.6 14.7% 2.1% 2.5%
India NIFTY Index 8.7% 922 18.9% -0.4% 39.0% 20.4 16.9 20.8% 1.4% 1.6%
Singapore FSSTI Index 8.4% 354 10.1% -8.6% -0.2% 14.5 13.5 7.4% 3.6% 3.7%
Malaysia FBMKLCI Index 4.1% 231 0.9% -5.5% -7.1% 16.2 15.2 6.7% 3.2% 3.4%
Philippines PCOMP Index 5.9% 174 5.0% -7.8% 11.2% 17.4 15.6 11.7% 1.8% 1.9%
Vietnam VNINDEX Index 7.2% 72 24.2% 20.0% 23.2% 13.7 12.5 9.3% 2.7% #VALUE!
Source(s): ACPI, Bloomberg Data as of: 28-Feb-2017 * Market cap for the main index
PER Dividend yield
MONTHLY VIEWPOINT
From the Chief Investment Officer Marco E Pabst
07th
March 2017
ACPI Investments Ltd.
Pegasus House | 37-43 Sackville Street | London W1S 3EH
T +44 (0)20 3697 9580 | F +44 (0)20 3697 9501 | E [email protected]
www.acpi.com
16
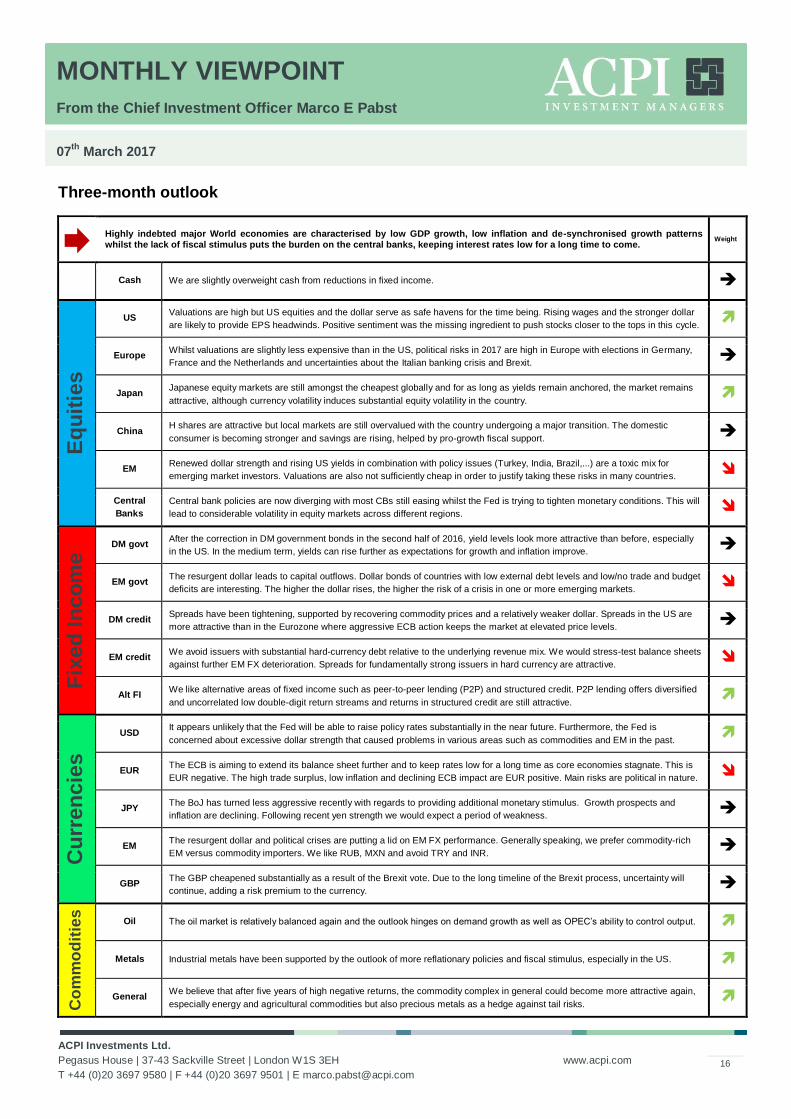
Three-month outlook
Highly indebted major World economies are characterised by low GDP growth, low inflation and de-synchronised growth patterns whilst the lack of fiscal stimulus puts the burden on the central banks, keeping interest rates low for a long time to come.
Weight
Cash We are slightly overweight cash from reductions in fixed income.
Eq
uit
ies
US Valuations are high but US equities and the dollar serve as safe havens for the time being. Rising wages and the stronger dollar
are likely to provide EPS headwinds. Positive sentiment was the missing ingredient to push stocks closer to the tops in this cycle.
Europe Whilst valuations are slightly less expensive than in the US, political risks in 2017 are high in Europe with elections in Germany,
France and the Netherlands and uncertainties about the Italian banking crisis and Brexit.
Japan Japanese equity markets are still amongst the cheapest globally and for as long as yields remain anchored, the market remains
attractive, although currency volatility induces substantial equity volatility in the country.
China H shares are attractive but local markets are still overvalued with the country undergoing a major transition. The domestic
consumer is becoming stronger and savings are rising, helped by pro-growth fiscal support.
EM Renewed dollar strength and rising US yields in combination with policy issues (Turkey, India, Brazil,...) are a toxic mix for
emerging market investors. Valuations are also not sufficiently cheap in order to justify taking these risks in many countries.
Central
Banks
Central bank policies are now diverging with most CBs still easing whilst the Fed is trying to tighten monetary conditions. This will
lead to considerable volatility in equity markets across different regions.
Fix
ed
In
co
me DM govt
After the correction in DM government bonds in the second half of 2016, yield levels look more attractive than before, especially
in the US. In the medium term, yields can rise further as expectations for growth and inflation improve.
EM govt The resurgent dollar leads to capital outflows. Dollar bonds of countries with low external debt levels and low/no trade and budget
deficits are interesting. The higher the dollar rises, the higher the risk of a crisis in one or more emerging markets.
DM credit Spreads have been tightening, supported by recovering commodity prices and a relatively weaker dollar. Spreads in the US are
more attractive than in the Eurozone where aggressive ECB action keeps the market at elevated price levels.
EM credit We avoid issuers with substantial hard-currency debt relative to the underlying revenue mix. We would stress-test balance sheets
against further EM FX deterioration. Spreads for fundamentally strong issuers in hard currency are attractive.
Alt FI We like alternative areas of fixed income such as peer-to-peer lending (P2P) and structured credit. P2P lending offers diversified
and uncorrelated low double-digit return streams and returns in structured credit are still attractive.
Cu
rren
cie
s
USD It appears unlikely that the Fed will be able to raise policy rates substantially in the near future. Furthermore, the Fed is
concerned about excessive dollar strength that caused problems in various areas such as commodities and EM in the past.
EUR The ECB is aiming to extend its balance sheet further and to keep rates low for a long time as core economies stagnate. This is
EUR negative. The high trade surplus, low inflation and declining ECB impact are EUR positive. Main risks are political in nature.
JPY The BoJ has turned less aggressive recently with regards to providing additional monetary stimulus. Growth prospects and
inflation are declining. Following recent yen strength we would expect a period of weakness.
EM The resurgent dollar and political crises are putting a lid on EM FX performance. Generally speaking, we prefer commodity-rich
EM versus commodity importers. We like RUB, MXN and avoid TRY and INR.
GBP The GBP cheapened substantially as a result of the Brexit vote. Due to the long timeline of the Brexit process, uncertainty will
continue, adding a risk premium to the currency.
Co
mm
od
itie
s
Oil The oil market is relatively balanced again and the outlook hinges on demand growth as well as OPEC’s ability to control output.
Metals Industrial metals have been supported by the outlook of more reflationary policies and fiscal stimulus, especially in the US.
General We believe that after five years of high negative returns, the commodity complex in general could become more attractive again,
especially energy and agricultural commodities but also precious metals as a hedge against tail risks.

MONTHLY VIEWPOINT
From the Chief Investment Officer Marco E Pabst
07th
March 2017
ACPI Investments Ltd.
Pegasus House | 37-43 Sackville Street | London W1S 3EH
T +44 (0)20 3697 9580 | F +44 (0)20 3697 9501 | E [email protected]
www.acpi.com
17
DISCLAIMER
This document is provided for informational purposes only. It does not constitute an offer to sell or a solicitation to buy any security or other financial instrument.
While based on information believed to be reliable, no guarantee is given that it is accurate or complete. Any investments referred to may not be suitable for the
specific investment objectives, financial situation or individual needs of recipients. Reliance should not be placed on the views and information expressed herein
when making any individual investment and/or strategic decisions.
You should also be aware that the value of investments and any income from them can go down as well as up, and you may not receive back the amount you
originally invested. There can be no assurances that appreciation in value of investments will occur, or that currency fluctuations will not affect the outcomes of any
investment adversely.
Past performance of the index or individual funds is not a guide to future performance.
Certain funds invest in emerging markets which by their nature are higher risk and potentially more volatile than those inherent in established markets.
This material is for the use of intended recipients only and the contents may not be reproduced, redistributed, or copied in whole or in part for any purpose without
the consent of the issuer of this document.
Where foreign securities are included in collective investment schemes, there may be additional risks that arise because of events in different jurisdictions. These
may include but are not limited to; potential constraints on liquidity and the repatriation of funds, macroeconomic risks, political risks, foreign exchange risks, tax
risks, settlement risks and potential limitations on the availability of market information.
Issued by ACPI Investment Ltd (Registered in England - Number 03781549, at 37-43 Sackville Street, London, W1S 3EH), which is authorised and regulated by the
Financial Conduct Authority (Register Number 192403). Details can be found on the following link www.fca.org.uk/register.
© 2017 ACPI Investments Limited. All rights reserved. No part of the website may be reproduced by any means, whether graphically, electronically, mechanically or
otherwise howsoever, including without limitation photocopying and recording on magnetic tape, or included in any information store and/or retrieval system without
the prior written permission of ACPI Investments Limited.
UK – London
Pegasus House 37-43 Sackville Street London W1S 3EH United Kingdom T +44 20 3697 9501
Channel Islands – Jersey
Third Floor 7 The Esplanade St Helier JE2 3QA T +44 (0)1534 716444
South Africa – Johannesburg
1st floor
Dunkeld Place 12 North Road Dunkeld West 2196 PO Box 411325 Craighall, 2024 T +27 11 771 5315


