ADCO Meeting FY14 Budget Update
Wednesday Feb 6, 20133:00 p.m.
Presented by Bob JokelaAssistant Supt. Finance & Operations

Budget Bucket SummarySource Bonds City*** Grants Revolving School
ChoicePurpose Capital
ImproveOperations: Salaries
Operations-Restricted Uses
Operations/Capital- Restricted Uses
Strategic Investments
∫ (Function of) City Balance Sheet, City Revenue + Income (State Tax Receipts)
State Economy; Sales + Inc Tax, City Rev+ Inc.;Health Ins.;Students Attending Elsewhere
Federal and State Tax Receipts; Federal Deficit
Specific Program Operations (e.g Nutrition Services, E-Rate, PD, Athletics)
Students Incoming to FPS from other districts

FY14 Ch70 Preliminary Summary
• See attached spreadsheets:– Preliminary Summary– Regional District Community member $
contribution• FY14 Foundation Budget Detail• FY14 vs. FY13 Foundation Budget comparison• Unknown at this time: City guidance for FY14

FPS Ch70- PRELIMINARY97 FITCHBURG
Aid Calculation FY14 Comparison to FY13
FY13 FY14 Change Pct Chg
Prior Year Aid Enrollment 5,420 5,397 -23 -0.42%
1 Chapter 70 FY13 43,692,664 Foundation budget 58,628,763 60,278,208 1,649,445 2.81%
Required district contribution 14,936,099 15,863,259 927,160 6.21%
Foundation Aid Chapter 70 aid 43,692,664 44,414,949 722,285 1.65%
2 Foundation budget FY14 60,278,208 Required net school spending (NSS) 58,628,763 60,278,208 1,649,445 2.81%
3 Required district contribution FY14 15,863,259
4 Foundation aid (2 -3) 44,414,949 Target aid share 70.51% 71.63%
5 Increase over FY12 (4 - 1) 722,285 C70 % of foundation 74.52% 73.68%
6 Minimum $25 per pupil increase 0
Required NSS % of foundation 100.00% 100.00%
Non-Operating District Reduction to Foundation
7 Reduction to foundation 0
FY14 Chapter 70 Aid8 sum of line 1, 5 and 6 minus 7 44,414,949
40
50
60
70
Mill
ion
s
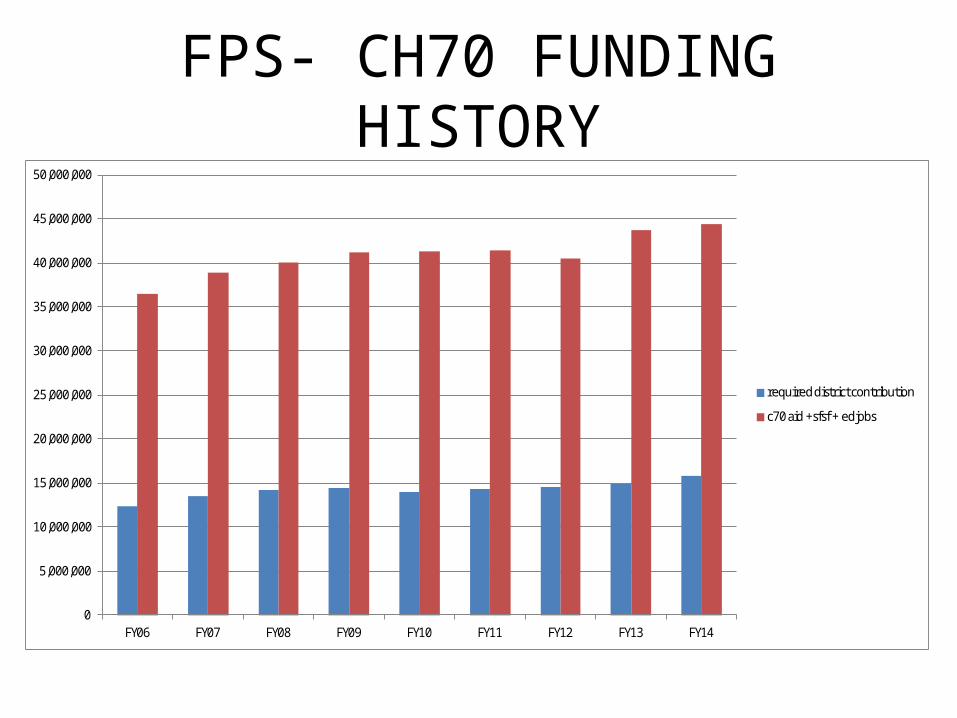
FPS- CH70 FUNDING HISTORY
0
5,000,000
10,000,000
15,000,000
20,000,000
25,000,000
30,000,000
35,000,000
40,000,000
45,000,000
50,000,000
FY06 FY07 FY08 FY09 FY10 FY11 FY12 FY13 FY14
required district contribution
c70 aid +sfsf + edjobs

Grants Funding Trends
$-
$2,000,000
$4,000,000
$6,000,000
$8,000,000
$10,000,000
$12,000,000
$14,000,000
FY08 FY09 FY10 FY 11 FY 12 FY 13
GRANTS
ARRA

FPS Health Care Costs
2006 2007 2008 2009 2010 2011 2012 2013 2014 $-
$1.00
$2.00
$3.00
$4.00
$5.00
$6.00
$7.00
$8.00
$9.00
RetiredActive
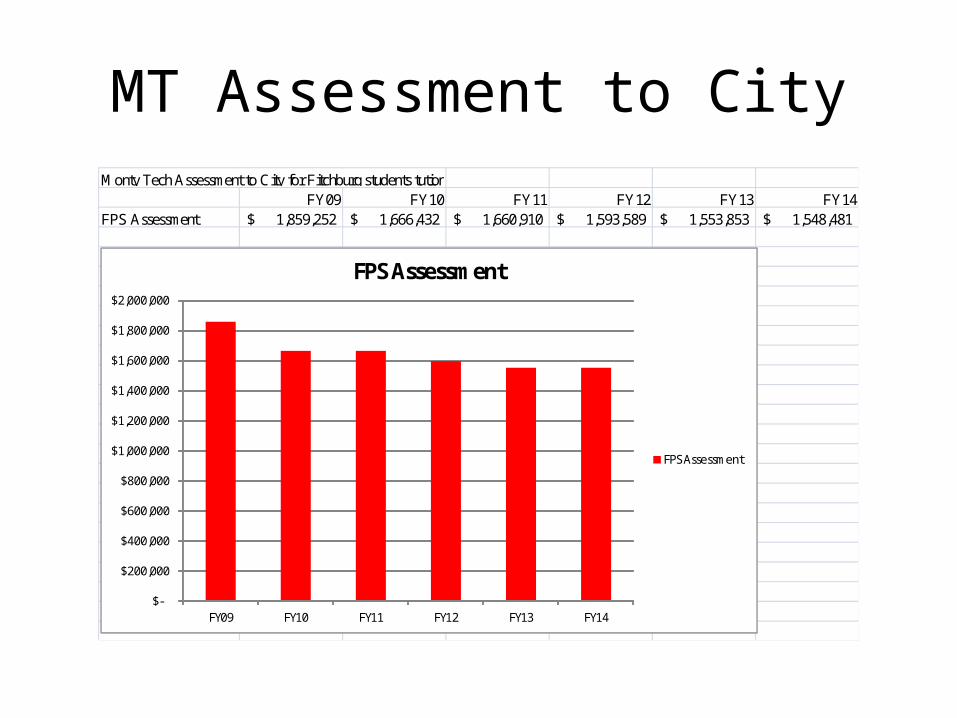
MT Assessment to CityMonty Tech Assessment to City for Fitchburg students tution
FY09 FY10 FY11 FY12 FY13 FY14FPS Assessment 1,859,252$ 1,666,432$ 1,660,910$ 1,593,589$ 1,553,853$ 1,548,481$
$-
$200,000
$400,000
$600,000
$800,000
$1,000,000
$1,200,000
$1,400,000
$1,600,000
$1,800,000
$2,000,000
FY09 FY10 FY11 FY12 FY13 FY14
FPS Assessment
FPS Assessment

Total FPS & MT Enrollment Trend
Enrollment FY11 FY12 FY13 FY14MT Total Enrollment 1378 1407 1443 1453F-Burg to MT 406 403 412 395FPS Total 5579 5343 5420 5397F-burg students as % MT 29% 29% 29% 27%
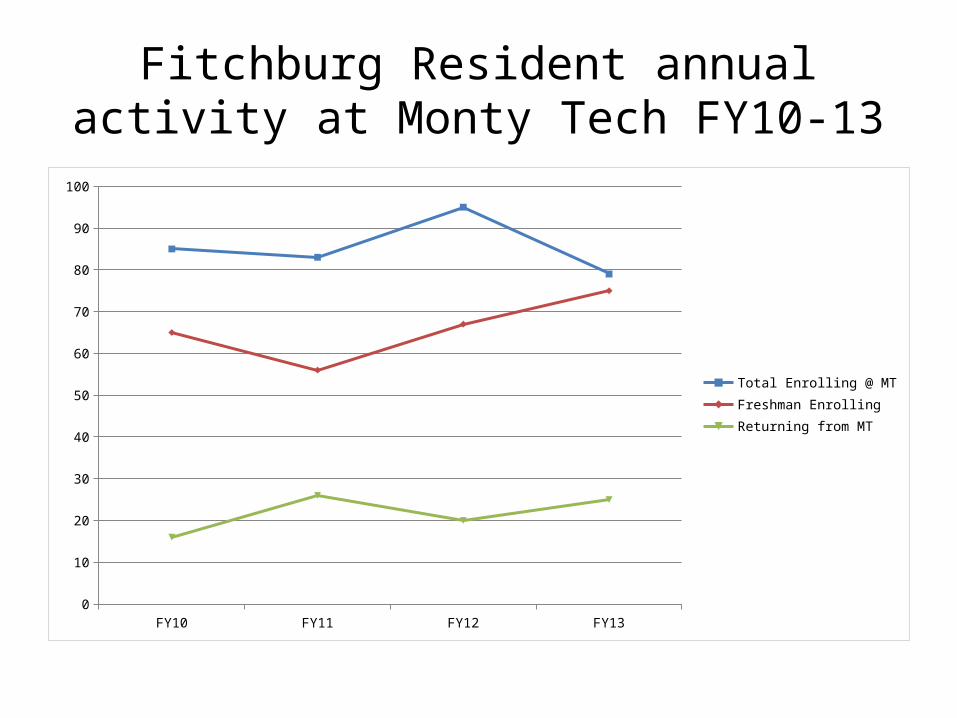
Fitchburg Resident annual activity at Monty Tech FY10-13
FY10 FY11 FY12 FY130
10
20
30
40
50
60
70
80
90
100
Total Enrolling @ MTFreshman EnrollingReturning from MT

FPS & MT Per Pupil Spending
PPE FY07 FY08 FY09 FY10 FY11 FY12 FY13 FY14FPS 11,351$ 11,782$ 12,573$ 12,747$ 12,446$ 8,364$ 10,817$ 11,169$ MT 15,747$ 16,938$ 16,791$ 17,153$ 19,020$ 14,163$ 14,804$ 14,896$ Variance (4,396)$ (5,156)$ (4,218)$ (4,406)$ (6,574)$ (5,799)$ (3,987)$ (3,727)$ FPS Discount -28% -30% -25% -26% -35% -41% -27% -25%
$(10,000)
$(5,000)
$-
$5,000
$10,000
$15,000
$20,000
$25,000
FY07 FY08 FY09 FY10 FY11 FY12 FY13 FY14
FPS
MT
Variance
Per Pupil Expenditures: FPS vs MT

School Choice Trends: In and Out
2004 2005 2006 2007 2008 2009 2010 2011 2012 20130
50
100
150
200
250
300
350
400
450
500
n of incoming choice pupils n of choice pupils at other districts
nu
mb
er o
f fu
ll-ti
me
equ
ival
ent
pu
pils
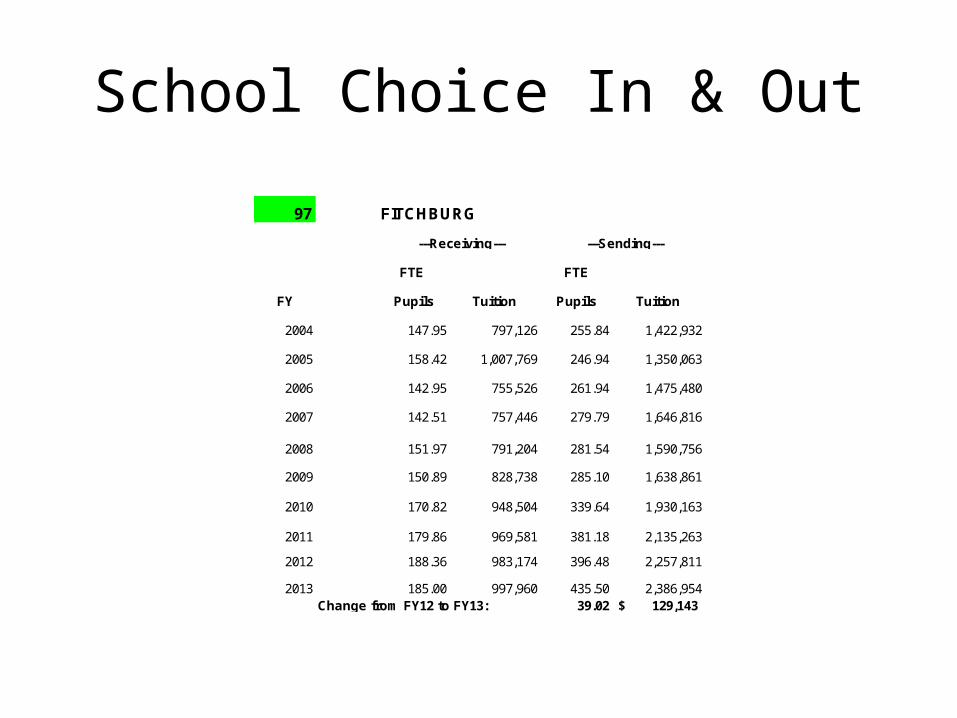
School Choice In & Out
97 FITCHBURG
FTE FTE
FY Pupils Tuition Pupils Tuition
2004 147.95 797,126 255.84 1,422,932
2005 158.42 1,007,769 246.94 1,350,063
2006 142.95 755,526 261.94 1,475,480
2007 142.51 757,446 279.79 1,646,816
2008 151.97 791,204 281.54 1,590,756
2009 150.89 828,738 285.10 1,638,861
2010 170.82 948,504 339.64 1,930,163
2011 179.86 969,581 381.18 2,135,263
2012 188.36 983,174 396.48 2,257,811
2013 185.00 997,960 435.50 2,386,954Change from FY12 to FY13: 39.02 129,143$
---Receiving--- ---Sending---
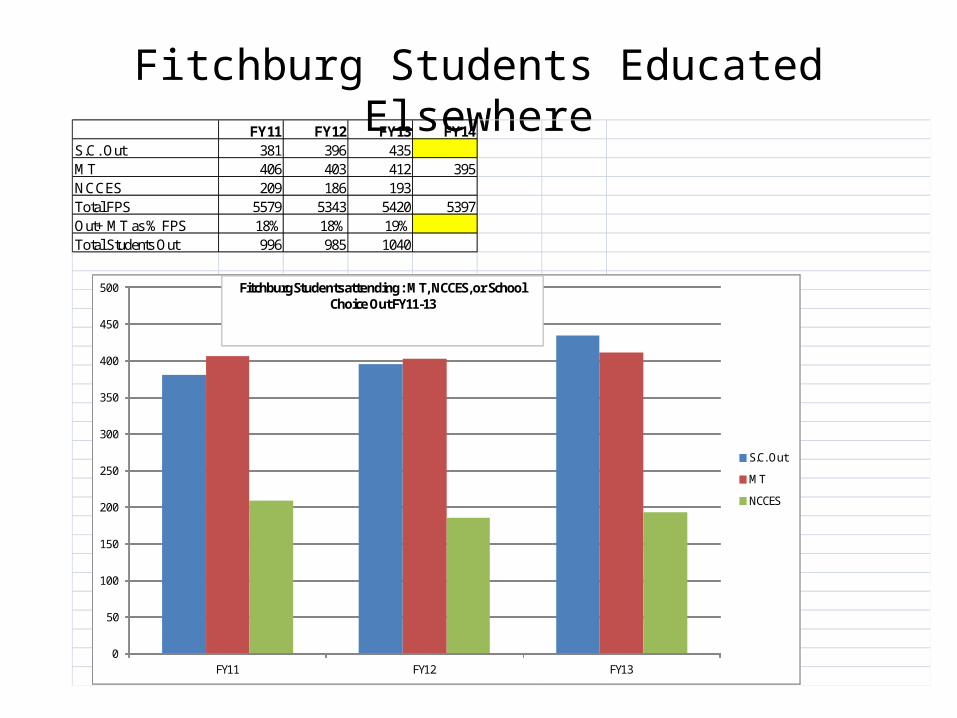
Fitchburg Students Educated Elsewhere
Total FPS on right had Y-axis
FY11 FY12 FY13 FY14S.C. Out 381 396 435MT 406 403 412 395NCCES 209 186 193Total FPS 5579 5343 5420 5397Out+ MT as % FPS 18% 18% 19% Total Students Out 996 985 1040
0
50
100
150
200
250
300
350
400
450
500
FY11 FY12 FY13
S.C. Out
MT
NCCES
Fitchburg Students attending : MT, NCCES, or School Choice Out FY11-13
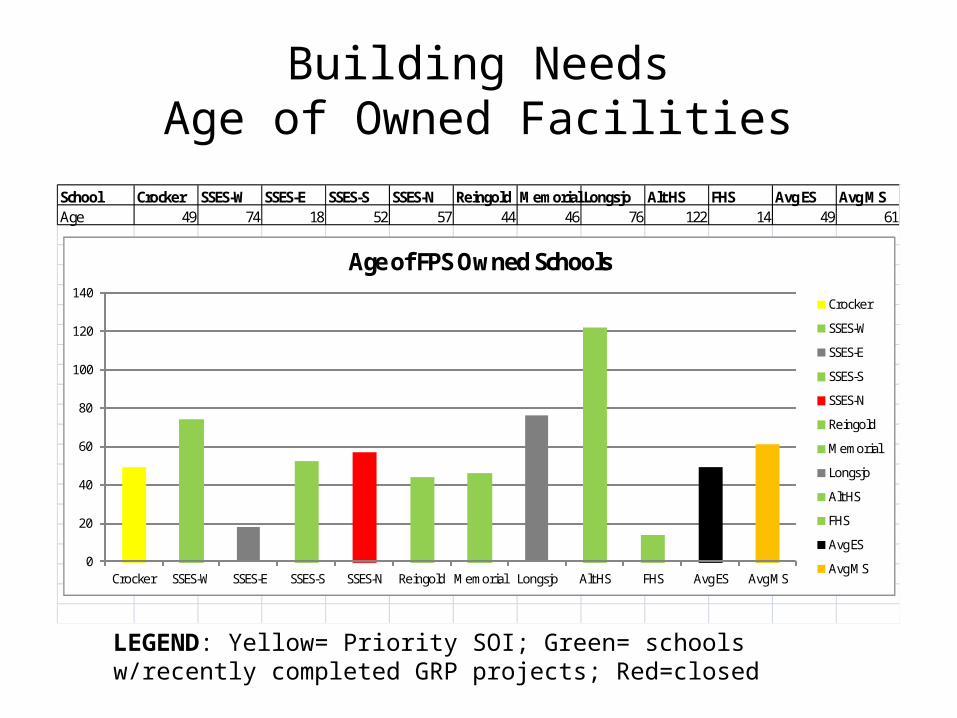
Building NeedsAge of Owned Facilities
School Crocker SSES-W SSES-E SSES-S SSES-N Reingold Memorial Longsjo Alt HS FHS Avg ES Avg MSAge 49 74 18 52 57 44 46 76 122 14 49 61
0
20
40
60
80
100
120
140
Crocker SSES-W SSES-E SSES-S SSES-N Reingold Memorial Longsjo Alt HS FHS Avg ES Avg MS
Age of FPS Owned Schools
Crocker
SSES-W
SSES-E
SSES-S
SSES-N
Reingold
Memorial
Longsjo
Alt HS
FHS
Avg ES
Avg MS
LEGEND: Yellow= Priority SOI; Green= schools w/recently completed GRP projects; Red=closed
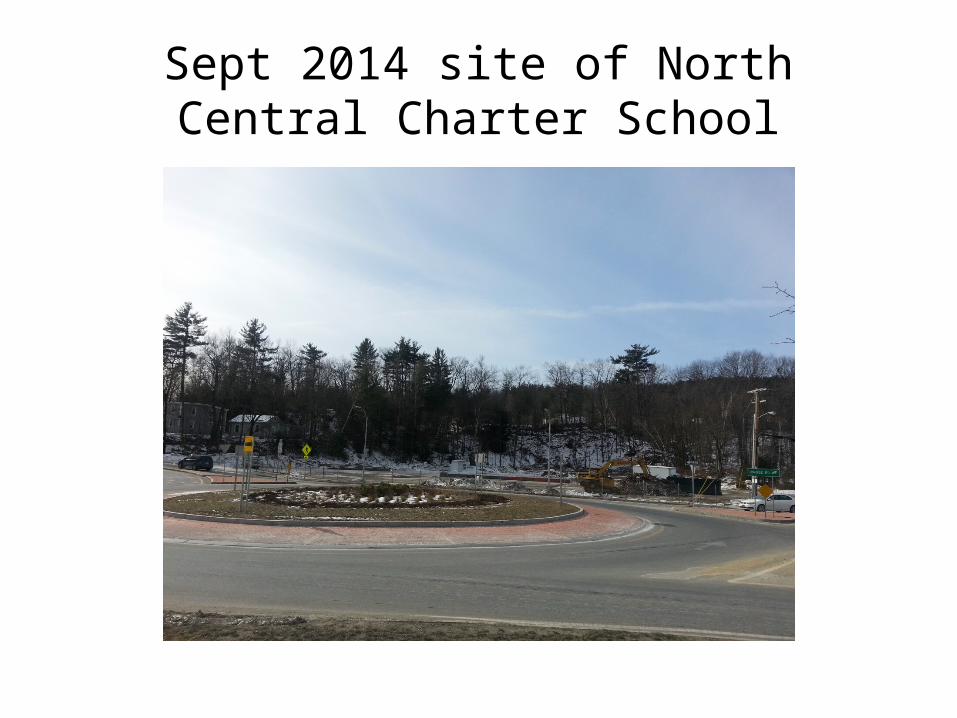
Sept 2014 site of North Central Charter School
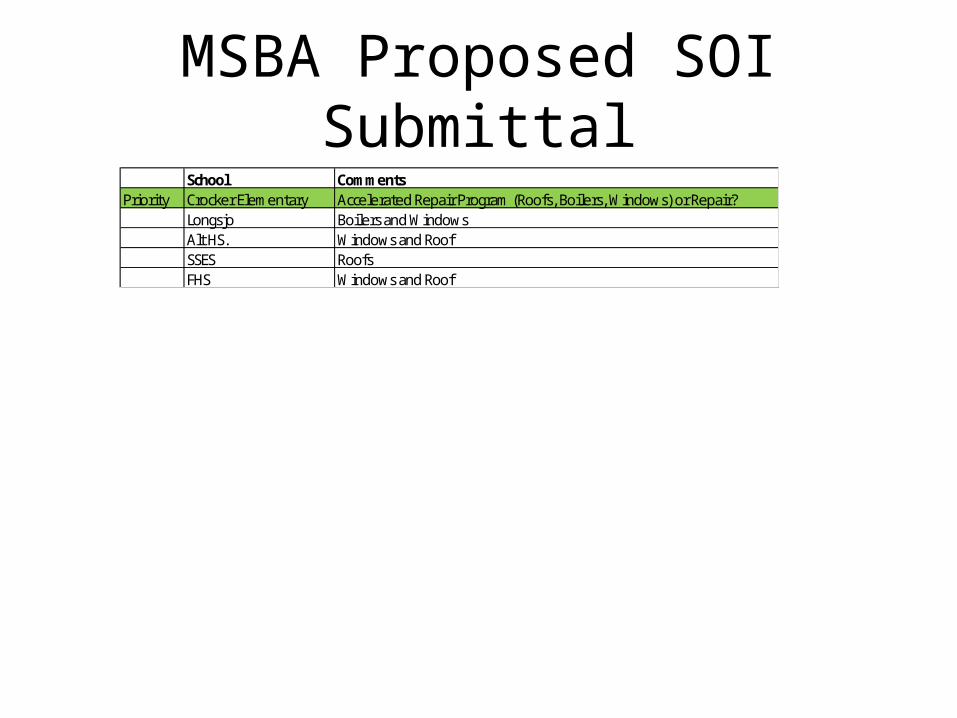
MSBA Proposed SOI SubmittalSchool Comments
Priority Crocker Elementary Accelerated Repair Program (Roofs, Boilers, Windows) or Repair?Longsjo Boilers and WindowsAlt HS. Windows and RoofSSES RoofsFHS Windows and Roof
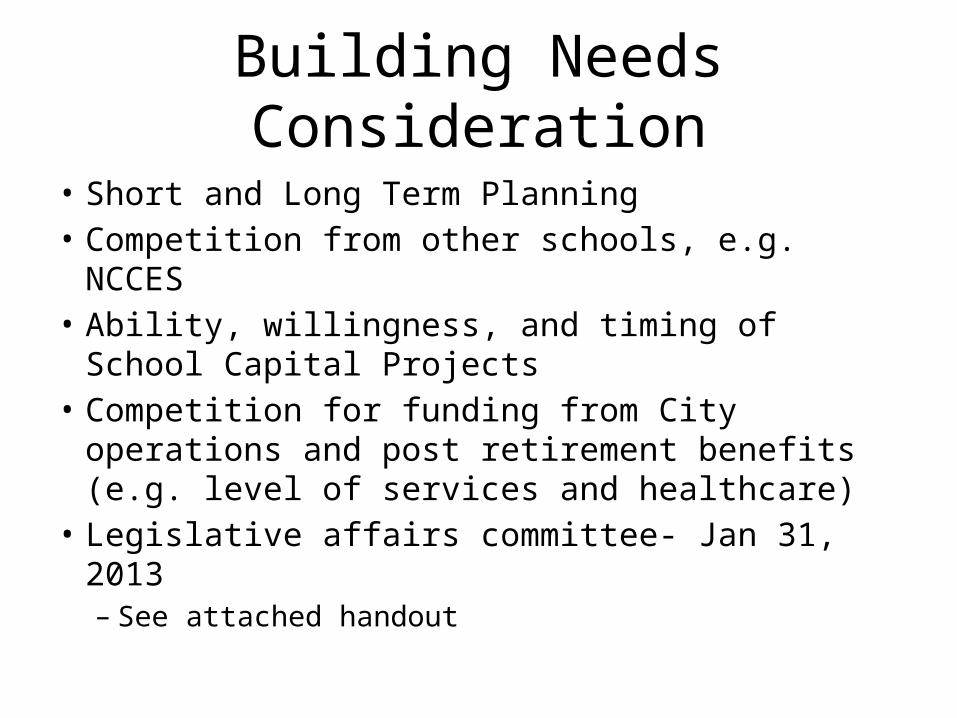
Building Needs Consideration
• Short and Long Term Planning• Competition from other schools, e.g. NCCES• Ability, willingness, and timing of School Capital
Projects• Competition for funding from City operations
and post retirement benefits (e.g. level of services and healthcare)
• Legislative affairs committee- Jan 31, 2013– See attached handout
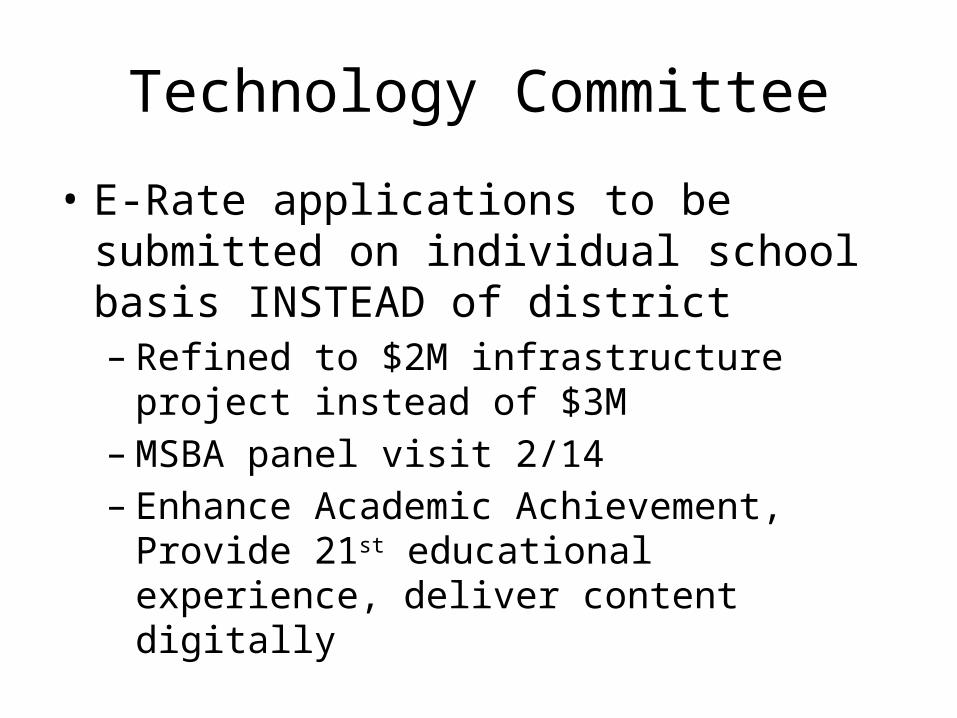
Technology Committee
• E-Rate applications to be submitted on individual school basis INSTEAD of district– Refined to $2M infrastructure project instead of
$3M– MSBA panel visit 2/14– Enhance Academic Achievement, Provide 21st
educational experience, deliver content digitally

Technology Funding3/11 Approved Bond*
E-Rate Revolving
RTTT City Budget School Choice
$3M/$600K $50K TBD ? Strategic Inv.
•Assumes 80% reimbursement of eligible investments on technology by Schools & Library Division of the Federal Communications Commission (“E-Rate”)•MSBA Interest?


