Human Journals
Research Article
June 2021 Vol.:18, Issue:4
© All rights are reserved by Pierre Gerard Tchieta et al.
Adsorption of Chromium (VI) and Orange Methyl onto Activated Carbon
Obtained from The Cores of Canarium ovatum : Influence of Functionalization
www.ijsrm.humanjournals.com
Keywords: Functionalization, Simultaneous Adsorption, Boehm
Analysis, Pollutant, Affinity
ABSTRACT
This work highlights the effect of the functionalization of activated carbon with sulfuric acid on its affinity towards inorganic and organic pollutants during simultaneous adsorption. The virgin activated carbon was obtained by chemical activation with phosphoric acid, then the modified activated carbon was obtained by carrying out a 20% functionalization with sulfuric acid. The lignocellulosic nature of the plant material used was verified by thermogravimetric analysis. The two adsorbents were characterized by Fourier transform infrared analysis; evaluation of functional groups of surfaces using Boehm analysis and porosity parameters namely iodine number and methylene blue number. The isotherms of Langmuir, Freundlich, Temkin, DR and Frumkin were studied. The kinetics were studied using pseudo-first order, pseudo-second order, Elovich, and intraparticle models. Fourier transform infrared analysis and Boehm analysis show an increase in phenolic groups; carboxylic and lactonic acids on the surface of the modified activated carbon. The results obtained reflect a drop in the specific surface area through the very significant drop in the iodine number (from 1422.40mg/g to 381.00mg/g). The Langmuir isotherm has the highest values of the correlation coefficient at the surface of the modified activated carbon (0.9943 and 0.9563), the Freundlich isotherm has the highest R2 for the adsorption of Cr (VI) at the surface of activated carbon (0.9037) and the Temkin isotherm has the highest R2 for adsorption of orange methyl to the surface of activated carbon (0.9869). The pseudo-first order model best describes the chromium (VI) adsorption kinetics at the surface of virgin activated carbon with the highest R2 (0.6947). While the latter is better described on the surface of activated carbon modified by the pseudo-second order model (R2 = 0.9944). Elovich model has the highest correlation coefficient values for the adsorption of methyl orange to the surface of virgin activated carbon and modified activated carbon (0.9929 and 0.9905, respectively).
Caroline Lincold Nintedem Magapgie, Geordamie
Chimi Tchatchouang, Rostand Ndjantou Tchoumi,
Pierre Gerard Tchieta*, Jacques Bomiko
Mbouombouo, Harlette Zapenaha Poumve, Esther
Judith Maffeu, Robert Djientieu Leumaleu, Juliette
Cathérine Vardamides
Chemistry Laboratory, Faculty of Science, University of
Douala; BP 24157 Douala, Cameroon
Submitted: 22 May 2021
Accepted: 28 May 2021
Published: 30 June 2021

www.ijsrm.humanjournals.com
Citation: Pierre Gerard Tchieta et al. Ijsrm.Human, 2021; Vol. 18 (4): 1-23.
2
INTRODUCTION
The release into the water of pollutants with various natures and toxicities remains a major
concern. This precious liquid nevertheless represents an incomparable stake in the life of living
beings. Among the most dangerous contaminants that can be found in water, we have metal ions
such as Cr (VI) and organic dyes such as orange methyl. These can be found in nature as a result
of rock erosion and soil leaching for Cr (VI) or due to industrial activities [1]. These pollutants
have mutagenic and carcinogenic properties and are highly toxic to living beings [2]. The World
Health Organization also sets the limit for the concentration of Cr (VI) in water at 0.05mg/l and
that of orange methyl at 3.1mg/l [3, 4]. One of the methods of treating water loaded with Cr (VI)
is reduction in Cr (III), however, this requires expensive reagents. On the other hand, this
reduction is incomplete and thus leads to obtaining toxic sludge [5, 6]. The adsorption on
activated carbon is therefore presented as the best method of water decontamination because it
has the advantage of being very effective on a wide range of pollutants [7]. The studies currently
carried out relate to the various techniques for improving the properties of activated carbon.
Several studies have therefore been carried out on the modification of the surface of activated
carbon with noble metals, namely silver; palladium; platinum, or with essential heavy metals
including iron, as well as modification by oxidation with agents such as sulfuric acid and nitric
acid [7-9]. These treatments can be at the origin of the creation or the multiplication of oxygen
functions which could have an impact on the porous properties on the surface of the adsorbent
material [10, 11]. Indeed, certain works mentioned in the literature show that an acid
functionalization of activated carbon leads to the reduction of the specific surface area and the
development of surface chemical functions, such as -OH; -COOH; -CO and -SO3H functions
[12-14]. All these parameters have an influence on the adsorbtion behavior of activated carbon
[12, 15, 16]. In this wake, studies have been carried out on the functionalization of carbon
nanotubes with nitric acid for the adsorption of Cr (VI) [6]. These help to say that such a
treatment promotes an ion exchange phenomenon between the -OH found on the surface of the
activated carbon and the various anionic forms of Cr (VI) in solution [17-19].
The objective of this work is to synthesize an activated carbon functionalized with sulfuric acid
and to study its affinity towards organic pollutants such as orange methyl and metal ions such as
Cr(VI). Functionalized activated carbon will be characterized by infrared analysis; the Boehm

www.ijsrm.humanjournals.com
Citation: Pierre Gerard Tchieta et al. Ijsrm.Human, 2021; Vol. 18 (4): 1-23.
3
titration; the evaluation of the pH of the zero charge point as well as the porosity indicators
namely the methylene blue number and the iodine number. The effect of functionalization will
be evaluated for the adsorption of orange methyl and Cr (VI).
MATERIALS AND METHODS
Phosphoric acid 85% (H3PO4), sodium hydroxide (NaOH), hydrochloric acid 36% (HCl) and
sulfuric acid 98% (H2SO4) were supplied by JHD Laboratories; sodium bicarbonate (NaHCO3)
and sodium carbonate (Na2CO3) are produced by BIOCHEM laboratories; sodium thiosulphate
(Na2S2O3) and sodium chloride (NaCl) are supplied by KERMEL laboratories; diiodine (I2) and
potassium iodide (KI) are obtained from RIEDEL-DE HAEN laboratories; methylene blue and
methyl orange are supplied by TRUST CHEMICAL ECO laboratories; potassium dichromate
(K2Cr2O7) and starch are produced by JHD Laboratories.
Preparation of activated carbon
The activated carbon used is obtained from the cores of Canarium Ovatum collected in the
locality of Mbouda (10°12” east longitude and 5°30” north latitude) in the region of western
Cameroon. This is synthesized by chemical activation with phosphoric acid.
The cores of Canarium Ovatum are washed thoroughly with distilled water and then dried at
room temperature before being crushed and sieved to obtain a powder with a particle size of less
than 250μm. The powder obtained was impregnated with phosphoric acid according to the
powder/activator mass ratio 1/3, dried at 105°C. The resulting solid is calcined at 450°C in a
NABERTHERN brand electric furnace with a temperature rise of 5°C/min and a residence time
of one hour. After this calcination, the carbon is allowed to cool to room temperature in the oven
before removal. The activated carbon obtained is washed with distilled water until obtaining
water with a pH close to 7, it is finally dried in an oven at 105°C. After this procedure we obtain
activated carbon (AC).
Functionalization of the activated carbon obtained
20% functionalization using sulfuric acid was performed. A mass of 25g of activated carbon is
introduced into a volume of 100ml of a sulfuric acid solution of concentration 0.5g/l. The whole
is stirred for 4 hours before being dried at 105°C. The solid resulting from this step is washed
www.ijsrm.humanjournals.com
Citation: Pierre Gerard Tchieta et al. Ijsrm.Human, 2021; Vol. 18 (4): 1-23.
4
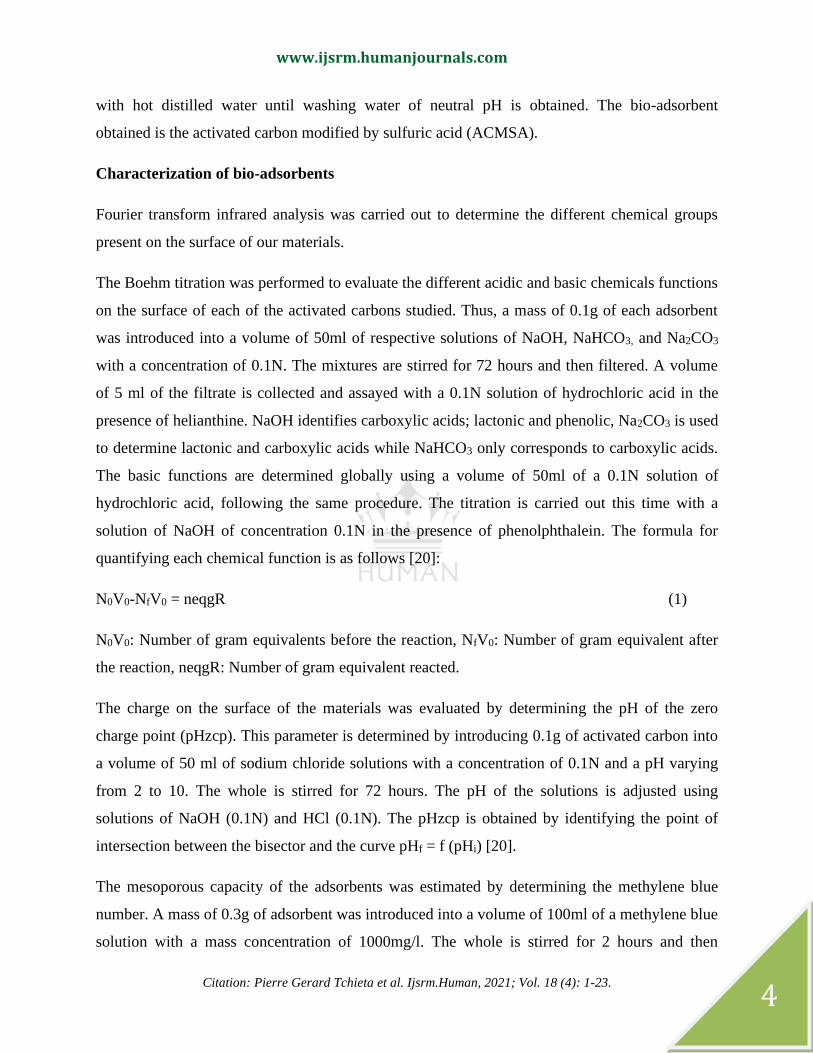
with hot distilled water until washing water of neutral pH is obtained. The bio-adsorbent
obtained is the activated carbon modified by sulfuric acid (ACMSA).
Characterization of bio-adsorbents
Fourier transform infrared analysis was carried out to determine the different chemical groups
present on the surface of our materials.
The Boehm titration was performed to evaluate the different acidic and basic chemicals functions
on the surface of each of the activated carbons studied. Thus, a mass of 0.1g of each adsorbent
was introduced into a volume of 50ml of respective solutions of NaOH, NaHCO3, and Na2CO3
with a concentration of 0.1N. The mixtures are stirred for 72 hours and then filtered. A volume
of 5 ml of the filtrate is collected and assayed with a 0.1N solution of hydrochloric acid in the
presence of helianthine. NaOH identifies carboxylic acids; lactonic and phenolic, Na2CO3 is used
to determine lactonic and carboxylic acids while NaHCO3 only corresponds to carboxylic acids.
The basic functions are determined globally using a volume of 50ml of a 0.1N solution of
hydrochloric acid, following the same procedure. The titration is carried out this time with a
solution of NaOH of concentration 0.1N in the presence of phenolphthalein. The formula for
quantifying each chemical function is as follows [20]:
N0V0-NfV0 = neqgR (1)
N0V0: Number of gram equivalents before the reaction, NfV0: Number of gram equivalent after
the reaction, neqgR: Number of gram equivalent reacted.
The charge on the surface of the materials was evaluated by determining the pH of the zero
charge point (pHzcp). This parameter is determined by introducing 0.1g of activated carbon into
a volume of 50 ml of sodium chloride solutions with a concentration of 0.1N and a pH varying
from 2 to 10. The whole is stirred for 72 hours. The pH of the solutions is adjusted using
solutions of NaOH (0.1N) and HCl (0.1N). The pHzcp is obtained by identifying the point of
intersection between the bisector and the curve pHf = f (pHi) [20].
The mesoporous capacity of the adsorbents was estimated by determining the methylene blue
number. A mass of 0.3g of adsorbent was introduced into a volume of 100ml of a methylene blue
solution with a mass concentration of 1000mg/l. The whole is stirred for 2 hours and then

www.ijsrm.humanjournals.com
Citation: Pierre Gerard Tchieta et al. Ijsrm.Human, 2021; Vol. 18 (4): 1-23.
5
filtered; the filtrate is passed through a spectrophotometer at a wavelength of 660nm. The
methylene blue number is given by the formula:
(mg/g)= ×0.1 (2)
The mesoporous surface can be approximated by applying the formula [21]:
(3)
Ci: initial concentration of the solution, Cf: residual concentration of the solution, mCA: mass of
activated carbon, SBM: area of methylene blue in m2/g, Q∞: maximum quantity in mg/g of
adsorbed methylene blue obtained by the Langmuir isotherm, S: area occupied by a methylene
blue molecule (S = 175A2), NA: Avogadro number (NA = 6.02 × 10²³mol-1), MBM: molar mass
of methylene blue (MBM = 319.859g/mol).
The estimation of the microporous capacity is made by determining the iodine number. A mass
of 0.1g of adsorbent is introduced into a volume of 20ml of iodine solution (N = 0.02N). The
whole is stirred for 3 hours and then filtered and 10ml of the filtrate is taken before being
determined using a 0.1N sodium thiosulfate solution. 2 drops of starch are used as an indicator of
the change from the blue color of the solution to colorless marking the end of the dosage. A
blank test should be performed under the same conditions without activated carbon. The iodine
number is given by the relation [22]:
(4)
Vb: volume of thiosulfate for the blank, Vs: volume of thiosulfate for the adsorbed solution, mCA:
mass of activated carbon.
Batch adsorption
The different solutions of chromium (VI) and orange methyl will be determined using a UV-
visible spectrophotometer at the respective wavelengths of 354nm and 460nm. The adsorbed
quantity will be obtained thanks to the relation:

www.ijsrm.humanjournals.com
Citation: Pierre Gerard Tchieta et al. Ijsrm.Human, 2021; Vol. 18 (4): 1-23.
6
Qe(mg/g)= (5)
Qe: amount adsorbed at equilibrium, Ci: initial concentration in mg/l, Ce: residual concentration
in mg/l, Vads: volume adsorbed in ml, mCA: mass of activated carbon in g.
The study of the effect of some parameters such as contact time (5min to 65min); the mass of
adsorbent (0.03g to 1.2g); the pH of the solution (2 to 10) and the initial concentration (100mg/l
to 300mg/l) was carried out at room temperature.
Isotherms study
The adsorption equilibrium of our various bio-adsorbents has been studied using isotherms from
Langmuir, Freundlich, Temkin, Dubinin-Radushkevich and Frumkin.
Langmuir isotherm [23]:
The linear form of this isotherm is: (6)
(7)
qe: quantity adsorbed at equilibrium in mg/g, Qmax: maximum quantity in mg/g of pollutant
adsorbed in a monolayer at the surface of the adsorbent, b: Langmuir constant in l/mg linked to
free energy, Ce: residual concentration at equilibrium in mg/l, RL: Langmuir constant (RL˃1
unfavorable adsorption, RL=1 linear adsorption, 0˂RL˂1 favorable adsorption, RL=0
irreversible adsorption), C0: concentration initial pollutant expressed in mg/l. Qmax and b are
deduced from the intercept and the slope on the plot of as a function of .
Freundlich isotherm [23]:
The linearization of its equation is given by the formula:
(8)
KF: Freundlich constant indicating the adsorption capacity, 1/n: Freundlich constant indicating
the adsorption intensity (1/n˃1 unfavorable adsorption, 1/n=1 homogeneous adsorption and no
www.ijsrm.humanjournals.com
Citation: Pierre Gerard Tchieta et al. Ijsrm.Human, 2021; Vol. 18 (4): 1-23.
7
interaction between species, 0˂1/n˂1 favorable adsorption); it corresponds to the slope on the
plot of the line of logqe as a function of logCe.
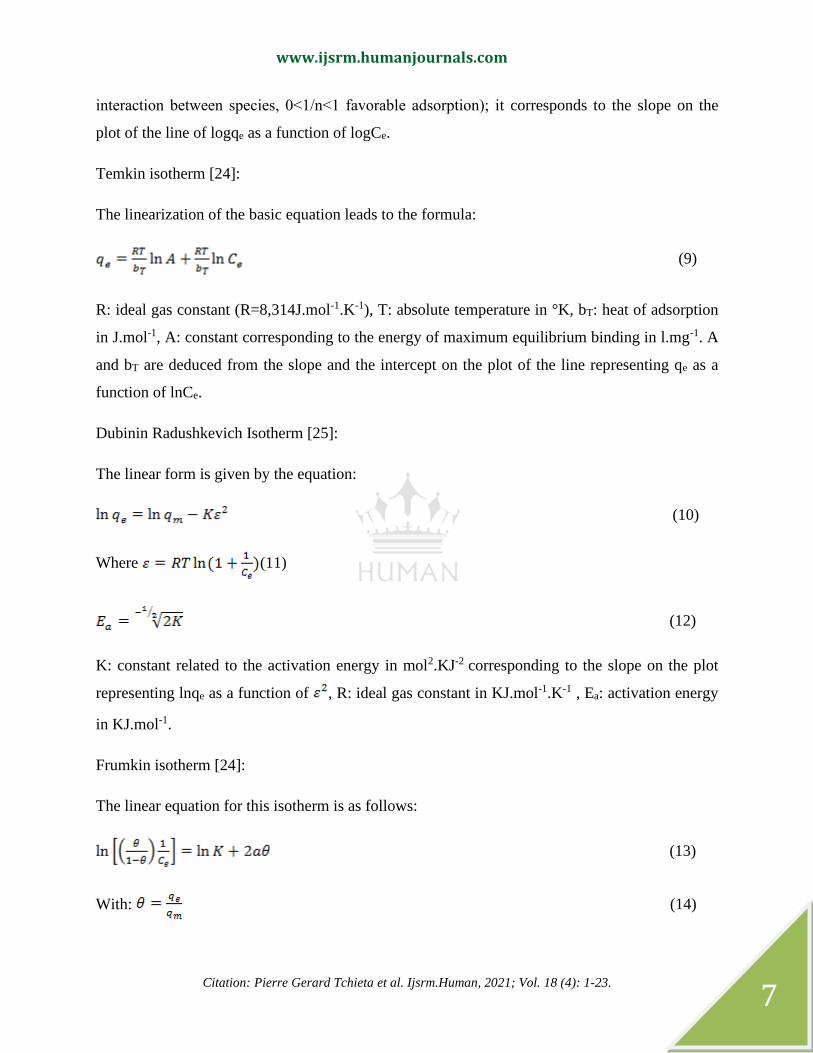
Temkin isotherm [24]:
The linearization of the basic equation leads to the formula:
(9)
R: ideal gas constant (R=8,314J.mol-1.K-1), T: absolute temperature in °K, bT: heat of adsorption
in J.mol-1, A: constant corresponding to the energy of maximum equilibrium binding in l.mg-1. A
and bT are deduced from the slope and the intercept on the plot of the line representing qe as a
function of lnCe.
Dubinin Radushkevich Isotherm [25]:
The linear form is given by the equation:
(10)
Where (11)
(12)
K: constant related to the activation energy in mol2.KJ-2 corresponding to the slope on the plot
representing lnqe as a function of , R: ideal gas constant in KJ.mol-1.K-1 , Ea: activation energy
in KJ.mol-1.
Frumkin isotherm [24]:
The linear equation for this isotherm is as follows:
(13)
With: (14)
www.ijsrm.humanjournals.com
Citation: Pierre Gerard Tchieta et al. Ijsrm.Human, 2021; Vol. 18 (4): 1-23.
8
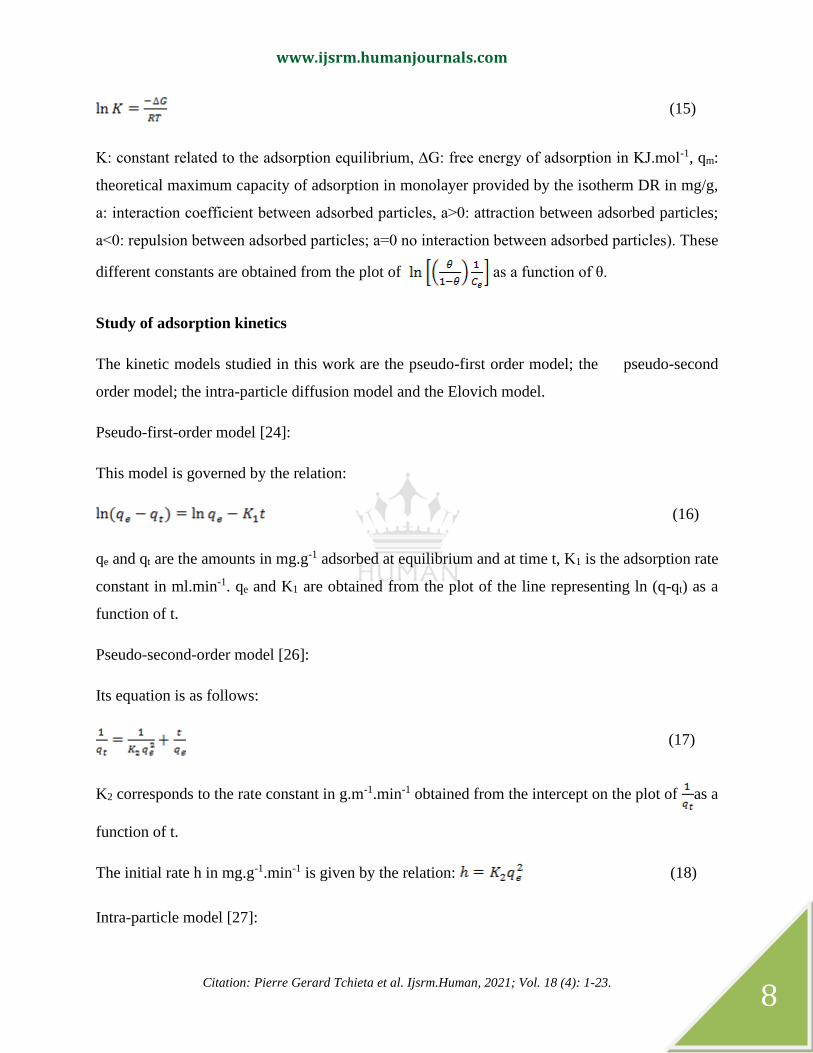
(15)
K: constant related to the adsorption equilibrium, ∆G: free energy of adsorption in KJ.mol-1, qm:
theoretical maximum capacity of adsorption in monolayer provided by the isotherm DR in mg/g,
a: interaction coefficient between adsorbed particles, a˃0: attraction between adsorbed particles;
a˂0: repulsion between adsorbed particles; a=0 no interaction between adsorbed particles). These
different constants are obtained from the plot of as a function of θ.
Study of adsorption kinetics
The kinetic models studied in this work are the pseudo-first order model; the pseudo-second
order model; the intra-particle diffusion model and the Elovich model.
Pseudo-first-order model [24]:
This model is governed by the relation:
(16)
qe and qt are the amounts in mg.g-1 adsorbed at equilibrium and at time t, K1 is the adsorption rate
constant in ml.min-1. qe and K1 are obtained from the plot of the line representing ln (q-qt) as a
function of t.
Pseudo-second-order model [26]:
Its equation is as follows:
(17)
K2 corresponds to the rate constant in g.m-1.min-1 obtained from the intercept on the plot of as a
function of t.
The initial rate h in mg.g-1.min-1 is given by the relation: (18)
Intra-particle model [27]:

www.ijsrm.humanjournals.com
Citation: Pierre Gerard Tchieta et al. Ijsrm.Human, 2021; Vol. 18 (4): 1-23.
9
Its equation is as follows:
(19)
Kp is the intra-particle diffusion constant expressed in mg.g-1.min-1/2, C is the thickness of the
diffusion layer. They are obtained by identifying the slope and the intercept on the plot
representing qt as a function of t1/2.
Elovich model [28]:
This model is governed by equation:
(20)
α is the initial adsorption rate constant in mg.g-1.min-1 and β is the desorption constant in g.mg-1.
These constants are obtained by plotting the line qt as a function of lnt.
RESULTS AND DISCUSSION
Characterization of the adsorbents
Thermogravimetric analysis
This analysis was carried out in the laboratories of the Faculty of Sciences of the University of
Yaoundé. The thermogram in figure no 1 shows the gradual decomposition of the plant precursor
as a function of the temperature.

www.ijsrm.humanjournals.com
Citation: Pierre Gerard Tchieta et al. Ijsrm.Human, 2021; Vol. 18 (4): 1-23.
10
Figure no. 1: TGA / DSC of Canarium Ovatum powder
This decomposition takes place in three stages: a mass loss of 15.48% at 82°C which could
correspond to the disappearance of the physisorbed moisture on the plant material surface [29];
the decomposition of hemicellulose and cellulose at 282°C resulting in a mass loss of 33.31%
and finally, the mass loss of 29.48% observed at 417°C could correspond to thermal
decomposition lignin. From 450°C, an almost constant evolution of the mass is observed; there is
no more loss of mass. This confirms the lignocellulosic nature of the plant material and makes it
possible to set the calcination temperature for obtaining the activated carbon at 450°C.
Fourier transform infrared analysis (FTIR)
Figure no 2 shows the infrared spectra of Canarium Ovatum powder (COP) as well as virgin
activated carbon (AC) and Activated Carbon Modified with Sulfuric acid (ACMSA).
www.ijsrm.humanjournals.com
Citation: Pierre Gerard Tchieta et al. Ijsrm.Human, 2021; Vol. 18 (4): 1-23.
11
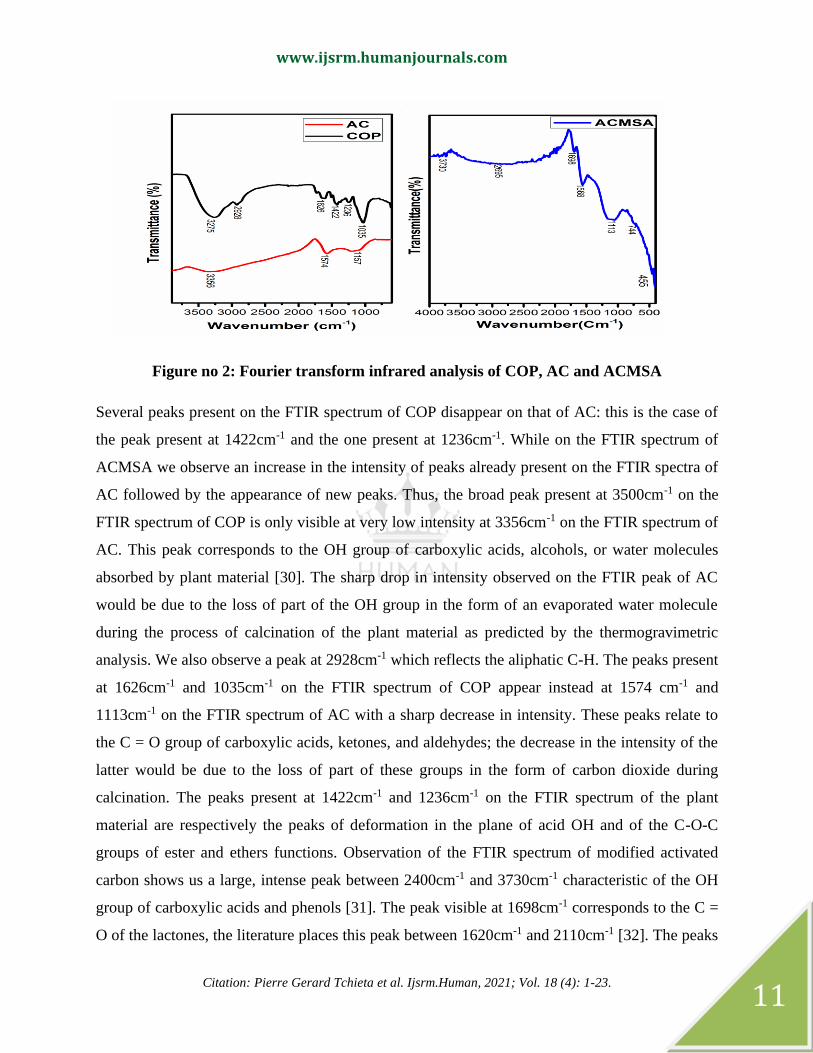
Figure no 2: Fourier transform infrared analysis of COP, AC and ACMSA
Several peaks present on the FTIR spectrum of COP disappear on that of AC: this is the case of
the peak present at 1422cm-1 and the one present at 1236cm-1. While on the FTIR spectrum of
ACMSA we observe an increase in the intensity of peaks already present on the FTIR spectra of
AC followed by the appearance of new peaks. Thus, the broad peak present at 3500cm-1 on the
FTIR spectrum of COP is only visible at very low intensity at 3356cm-1 on the FTIR spectrum of
AC. This peak corresponds to the OH group of carboxylic acids, alcohols, or water molecules
absorbed by plant material [30]. The sharp drop in intensity observed on the FTIR peak of AC
would be due to the loss of part of the OH group in the form of an evaporated water molecule
during the process of calcination of the plant material as predicted by the thermogravimetric
analysis. We also observe a peak at 2928cm-1 which reflects the aliphatic C-H. The peaks present
at 1626cm-1 and 1035cm-1 on the FTIR spectrum of COP appear instead at 1574 cm-1 and
1113cm-1 on the FTIR spectrum of AC with a sharp decrease in intensity. These peaks relate to
the C = O group of carboxylic acids, ketones, and aldehydes; the decrease in the intensity of the
latter would be due to the loss of part of these groups in the form of carbon dioxide during
calcination. The peaks present at 1422cm-1 and 1236cm-1 on the FTIR spectrum of the plant
material are respectively the peaks of deformation in the plane of acid OH and of the C-O-C
groups of ester and ethers functions. Observation of the FTIR spectrum of modified activated
carbon shows us a large, intense peak between 2400cm-1 and 3730cm-1 characteristic of the OH
group of carboxylic acids and phenols [31]. The peak visible at 1698cm-1 corresponds to the C =
O of the lactones, the literature places this peak between 1620cm-1 and 2110cm-1 [32]. The peaks

www.ijsrm.humanjournals.com
Citation: Pierre Gerard Tchieta et al. Ijsrm.Human, 2021; Vol. 18 (4): 1-23.
12
present respectively at 1568cm-1 and 1113cm-1 were already visible on the FTIR spectrum of the
unmodified activated carbon at 1574cm-1 and 1157cm-1, we just notice an increase in the
intensity of these peaks following modification with sulfuric acid. This behavior is moreover
visible on all the peaks of the FTIR spectra of ACMSA and is explained by the oxidizing
character of sulfuric acid which tends to promote the development of oxygen functions which is
manifested in the FTIR spectra by increasing peak intensities [33]. The literature associates the
peak at 744cm-1 with out-of-plane distortion vibrations of aromatic C-H groups [34].
Physico-chemical characteristics of activated carbon:
The physicochemical characteristics of AC and ACMSA are presented in Table no 1.
Table no. 1: physicochemical characteristics of AC and ACMSA
AC ACMSA
IdBM (mg/g) 318.99 327.35
SBM (m2/g) 499.04 569.63
IdI2 (mg/g) 1422.40 381.00
pHZCP 6.00 5.80
We observe from Table 1 a low increase in the methylene blue number as well as in the
mesoporous surface area and a very significant decrease in the iodine number which must
necessarily lead to a sharp decrease in the surface area occupied by the micropores. This
decrease in porosity could be explained by the fact that the oxygenated functions developed form
on the surface of the pores, thus leading to the narrowing of the latter [33]. On the other hand, we
also observe a decrease in the pH of the zero charge point of the activated carbon functionalized
with sulfuric acid compared to that of virgin activated carbon this would mean that the modified
activated carbon is more acidic than the unmodified activated carbon. . This result is verified by
the result provided by the infrared analysis which shows an increase in oxygen functions on the
surface of ACMSA responsible for the acidity.
Boehm titration
Table no 2 summarizes the results of the Boehm titration of virgin activated carbon and modified
activated carbon.

www.ijsrm.humanjournals.com
Citation: Pierre Gerard Tchieta et al. Ijsrm.Human, 2021; Vol. 18 (4): 1-23.
13
Table no 2: Surface functions of AC and ACMSA
Quantity of
Functional
group (meqg/g)
Total group
(meqg/g)
AC
Carboxylic acid 0.01
0.028 Phenolic acid 0.013
Lactonic Acid 0.005
Base 0.009 0.009
ACMSA
Carboxylic acid 0.016
0.034 Phenolic acid 0.012
Lactonic Acid 0,006
Base 0,002 0.002
We observe from this table no 2 an increase in the amount of acidic functional groups when
switching from virgin activated carbon to modified activated carbon (from 0.028meqg/g to
0.034meqg/g) and a large decrease in the quantity of functional groups basic (from 0.009meqg/g
to 0.002meqg/g). The increase in acidity at the surface of CAAS is mainly due to the increase in
the quantity of functional groups of carboxylic acids and phenolic acids. Sulfuric acid is
therefore believed to be responsible for the oxidation of certain functional groups such as the
quinones responsible for the basicity on the surface of the activated carbon [33]. This result
justifies the pHzcp values found.
Adsorption tests
Contact time effect
The effect of time on the simultaneous removal of chromium (VI) and orange methyl is shown in
figure no 3 and figure no 4.
www.ijsrm.humanjournals.com
Citation: Pierre Gerard Tchieta et al. Ijsrm.Human, 2021; Vol. 18 (4): 1-23.
14
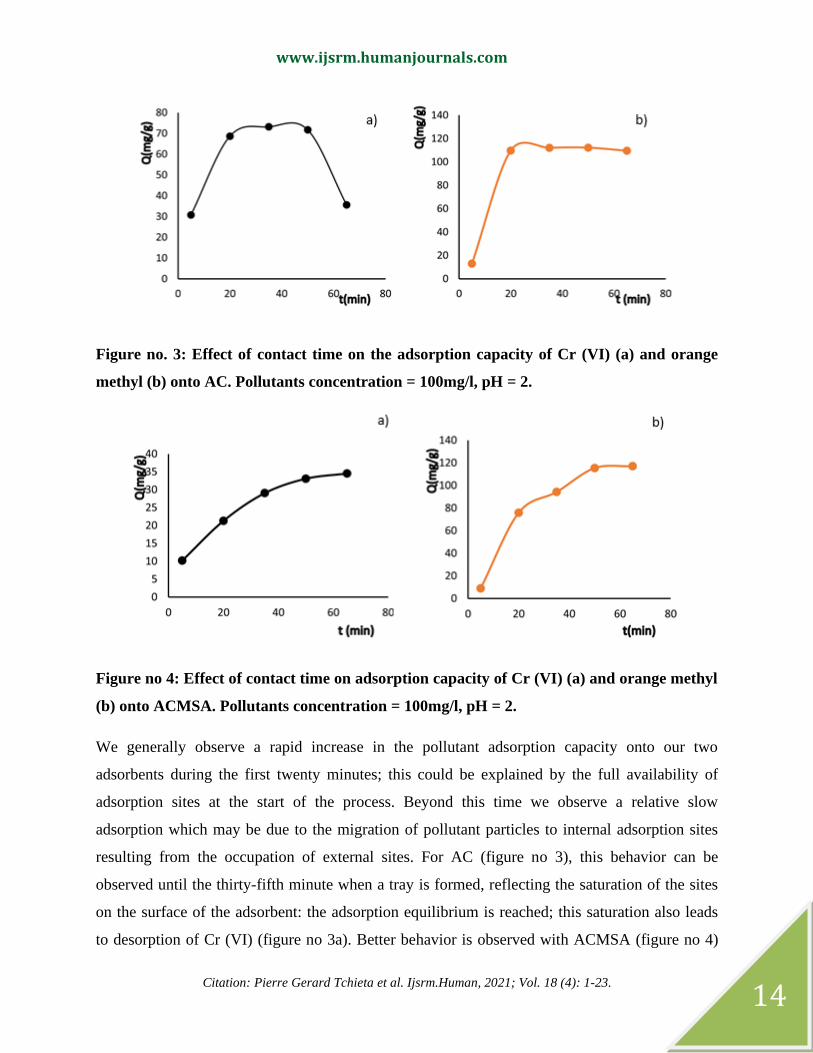
Figure no. 3: Effect of contact time on the adsorption capacity of Cr (VI) (a) and orange
methyl (b) onto AC. Pollutants concentration = 100mg/l, pH = 2.
Figure no 4: Effect of contact time on adsorption capacity of Cr (VI) (a) and orange methyl
(b) onto ACMSA. Pollutants concentration = 100mg/l, pH = 2.
We generally observe a rapid increase in the pollutant adsorption capacity onto our two
adsorbents during the first twenty minutes; this could be explained by the full availability of
adsorption sites at the start of the process. Beyond this time we observe a relative slow
adsorption which may be due to the migration of pollutant particles to internal adsorption sites
resulting from the occupation of external sites. For AC (figure no 3), this behavior can be
observed until the thirty-fifth minute when a tray is formed, reflecting the saturation of the sites
on the surface of the adsorbent: the adsorption equilibrium is reached; this saturation also leads
to desorption of Cr (VI) (figure no 3a). Better behavior is observed with ACMSA (figure no 4)

www.ijsrm.humanjournals.com
Citation: Pierre Gerard Tchieta et al. Ijsrm.Human, 2021; Vol. 18 (4): 1-23.
15
where saturation occurs from the sixtieth minute and no desorption is visible. This large action
time for ACMSA could be explained by the development of more oxygenated functions on the
surface of the latter which would intervene in the adsorption process following a phenomenon of
ion exchange between the OH of the acid functions and the anionic form of chromium [34, 35].
Effect of solution pH
Figure no 5 shows the effect of pH of the solution on the adsorption capacity of Cr (VI) and
orange methyl.
Figure no. 5: Effect of pH on the adsorption capacity of Cr(VI) and orange methyl onto AC
(a) and ACMSA (b). Pollutants concentration = 100mg/l, Contact time = 35min.
The initial pH of the solution influences the charge on the surface of the adsorbent material and
the ionic form of the pollutant [36]. The adsorption to the surfaces of AC and ACMSA is
maximum at pH 2, it decreases with increasing pH and becomes very low in strongly basic
media (pH˃8). This could be explained by the fact that at low pH values our materials have a
positively charged surface; Cr(VI) is present as an anion in aqueous medium (HCrO4- and CrO4
2-
) as well as orange methyl [37], adsorption could be easily favored by the establishment of
electrostatic strengths between the particles of the different forms of Cr(VI), orange methyl and
the respective surfaces of the activated carbon. In aquous medium with a basic pH, the presence
of excess OH- ions creates competition between those OH- and anionic pollutants present in the
medium, which would explain the drop in adsorption capacity at the respective surfaces of AC
and ACMSA.
b)

www.ijsrm.humanjournals.com
Citation: Pierre Gerard Tchieta et al. Ijsrm.Human, 2021; Vol. 18 (4): 1-23.
16
Effect of adsorbent mass
Figure no. 6 shows the effect of adsorbent mass on the adsorption capacity of Cr(VI) and orange
methyl onto AC and ACMSA.
Figure no. 6: Effect of adsorbent mass on the adsorption capacity of Cr (VI) and orange
methyl onto AC (a) and ACMSA(b). Pollutants concentration = 100mg/l, Contact time =
35min, pH = 2.
The absorption capacity of Cr(VI) and orange methyl onto AC and ACMSA decreases. This
could be explained by the fact that the increase in the mass of adsorbent leads to the aggregation
of adsorption sites making them inaccessible [38]. However, we find that if the adsorption of
Cr(VI) is maximum with a mass of activated carbon equal to 0.04g, that of orange methyl is
maximum with a mass of activated carbon equal to 0.05g.
Effect of initial concentration:
Figure no. 7 shows the effect of the initial pollutant concentration on the removal percentage at
the surface of our respective adsorbents.
a) b)

www.ijsrm.humanjournals.com
Citation: Pierre Gerard Tchieta et al. Ijsrm.Human, 2021; Vol. 18 (4): 1-23.
17
Figure no. 7: Effect of the initial pollutant concentration on the removal percentage of
Cr(VI) and orange methyl onto AC (a) and ACMSA (b). Contact time = 5min, pH = 2.
We see a decrease in the absorption percentage of Cr(VI) and orange methyl when we move
from low concentrations (100mg/l) to high initial concentrations (300mg/l) regardless of the
activated carbon. Indeed the adsorption percentage goes from 80% and 90% to almost zero and
5% respectively for AC and ACMSA about the adsorption of orange methyl and from 10% and
30% to 8% and 10% respectively for AC and ACMSA concerning the adsorption of Cr(VI). This
could be explained by the fact that we have an increase in the pollutant concentration for a
constant amount of activated carbon and therefore for a constant specific surface [39].
Furthermore, we note that the modification of the surface of the activated carbon with sulfuric
acid is at the origin of the increase in the adsorption percentage of 10% for orange methyl and
20% for Cr(VI).
Adsorption isotherms
The mathematical description of the adsorption equilibrium gives useful information on the
adsorption mechanism, the surface properties of the adsorbent as well as the affinity between the
adsorbate and the adsorbent thanks to the parameters obtained from the straight lines regressions
[40]. These parameters are grouped in Table no 3.
www.ijsrm.humanjournals.com
Citation: Pierre Gerard Tchieta et al. Ijsrm.Human, 2021; Vol. 18 (4): 1-23.
18
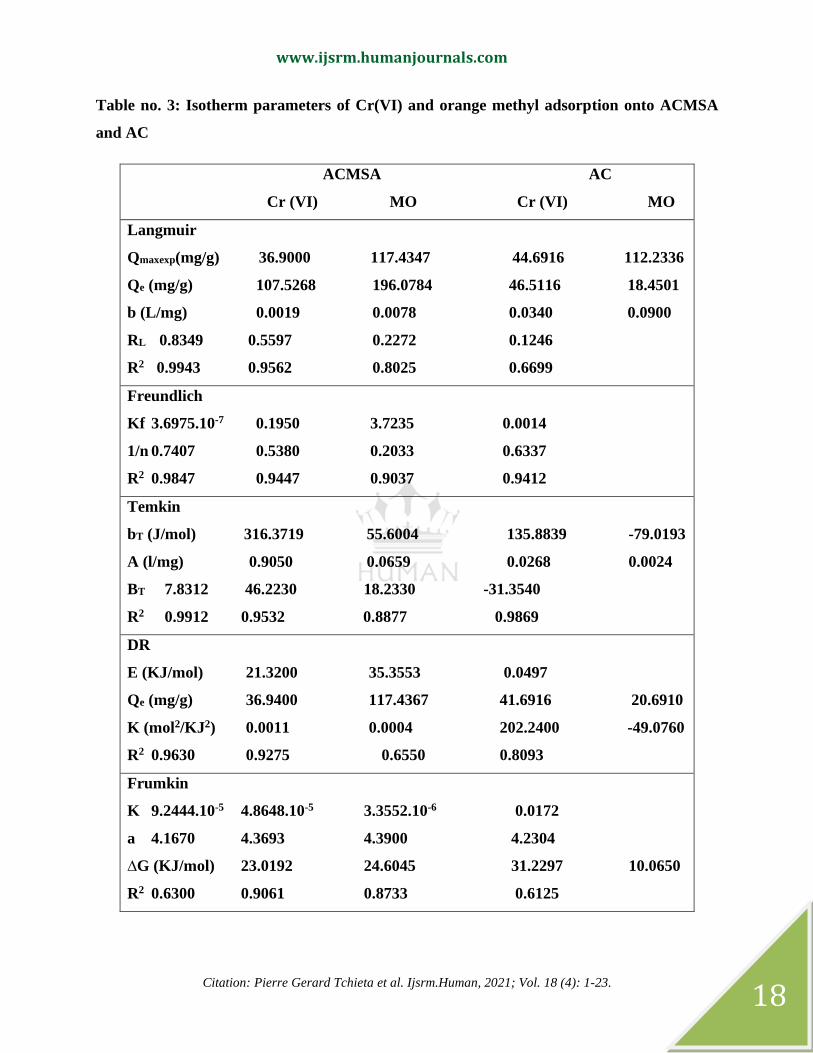
Table no. 3: Isotherm parameters of Cr(VI) and orange methyl adsorption onto ACMSA
and AC
ACMSA AC
Cr (VI) MO Cr (VI) MO
Langmuir
Qmaxexp(mg/g) 36.9000 117.4347 44.6916 112.2336
Qe (mg/g) 107.5268 196.0784 46.5116 18.4501
b (L/mg) 0.0019 0.0078 0.0340 0.0900
RL 0.8349 0.5597 0.2272 0.1246
R2 0.9943 0.9562 0.8025 0.6699
Freundlich
Kf 3.6975.10-7 0.1950 3.7235 0.0014
1/n 0.7407 0.5380 0.2033 0.6337
R2 0.9847 0.9447 0.9037 0.9412
Temkin
bT (J/mol) 316.3719 55.6004 135.8839 -79.0193
A (l/mg) 0.9050 0.0659 0.0268 0.0024
BT 7.8312 46.2230 18.2330 -31.3540
R2 0.9912 0.9532 0.8877 0.9869
DR
E (KJ/mol) 21.3200 35.3553 0.0497
Qe (mg/g) 36.9400 117.4367 41.6916 20.6910
K (mol2/KJ2) 0.0011 0.0004 202.2400 -49.0760
R2 0.9630 0.9275 0.6550 0.8093
Frumkin
K 9.2444.10-5 4.8648.10-5 3.3552.10-6 0.0172
a 4.1670 4.3693 4.3900 4.2304
∆G (KJ/mol) 23.0192 24.6045 31.2297 10.0650
R2 0.6300 0.9061 0.8733 0.6125

www.ijsrm.humanjournals.com
Citation: Pierre Gerard Tchieta et al. Ijsrm.Human, 2021; Vol. 18 (4): 1-23.
19
In view of the results obtained, the Langmuir isotherm has the highest R2 for the adsorption of
orange methyl to the surface of ACMSA (0.956). This also has a correlation coefficient close to
1 for the adsorption of Cr(VI) to the surface of that adsorbent (0.9943). The Freundlich isotherm
has the highest R2 for adsorption of Cr(VI) to the surface of virgin activated carbon (0.9037).
Temkin isotherm has the highest correlation coefficient value for the adsorption of orange
methyl to the surface of AC (0.9869). In view of this, we deduce that the Langmuir isotherm best
describes the adsorption of the two pollutants to the surface of the modified activated carbon
while the Freundlich and Temkin isotherms are those which best describe the adsorption of
Cr(VI) and orange methyl respectively on the surface of virgin activated carbon. On the other
hand, the values between zero and one of Langmuir's constant RL indicate favorable adsorption
of the two pollutants to the surface of the two adsorbents. The values of Temkin's constant
related to binding energy are high at the surface of ACMSA (0.905l/mg and 0.6599l/mg)
compared to those at the surface of AC (0.0268l/mg and 0.0024l/mg) which would reflect an
increase in the binding strengths between the adsorbates and ACMSA [41]. That would be due to
the increase in oxygen functions at the surface of the activated carbon following the
functionalization with sulfuric acid. Values greater than 8KJ/mol of the binding energy provided
by the D-R isotherm would indicate chemisorption [42]. However, the values of the Frumkin
constant are all greater than zero, reflecting an attraction between the adsorbed species [43]; that
attraction could be due to the presence in the aqueous medium of two different types of
pollutants. However, even if the functionalization seems to have improved the adsorption at the
surface of the modified activated carbon, the high value of the binding energy reflecting
chemical adsorption and the fact that the Freundlich isotherm is the one that best describes the
Adsorption of Cr(VI) to the surface of AC reveals an effect contrary to the expected effect.
I. Kinetic
The pseudo-first-order, pseudo-second-order, Elovich, and intraparticular kinetic models were
studied and the values of parameters provided by the latter are shown in table no 4.
www.ijsrm.humanjournals.com
Citation: Pierre Gerard Tchieta et al. Ijsrm.Human, 2021; Vol. 18 (4): 1-23.
20
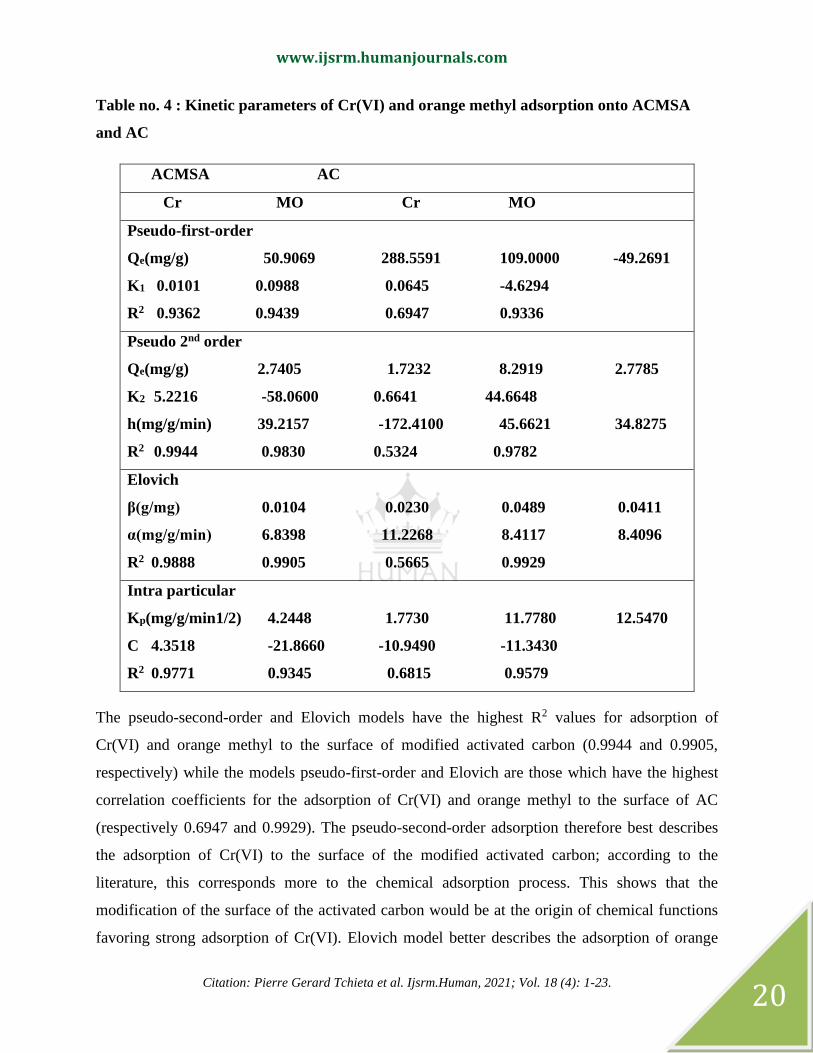
Table no. 4 : Kinetic parameters of Cr(VI) and orange methyl adsorption onto ACMSA
and AC
ACMSA AC
Cr MO Cr MO
Pseudo-first-order
Qe(mg/g) 50.9069 288.5591 109.0000 -49.2691
K1 0.0101 0.0988 0.0645 -4.6294
R2 0.9362 0.9439 0.6947 0.9336
Pseudo 2nd order
Qe(mg/g) 2.7405 1.7232 8.2919 2.7785
K2 5.2216 -58.0600 0.6641 44.6648
h(mg/g/min) 39.2157 -172.4100 45.6621 34.8275
R2 0.9944 0.9830 0.5324 0.9782
Elovich
β(g/mg) 0.0104 0.0230 0.0489 0.0411
α(mg/g/min) 6.8398 11.2268 8.4117 8.4096
R2 0.9888 0.9905 0.5665 0.9929
Intra particular
Kp(mg/g/min1/2) 4.2448 1.7730 11.7780 12.5470
C 4.3518 -21.8660 -10.9490 -11.3430
R2 0.9771 0.9345 0.6815 0.9579
The pseudo-second-order and Elovich models have the highest R2 values for adsorption of
Cr(VI) and orange methyl to the surface of modified activated carbon (0.9944 and 0.9905,
respectively) while the models pseudo-first-order and Elovich are those which have the highest
correlation coefficients for the adsorption of Cr(VI) and orange methyl to the surface of AC
(respectively 0.6947 and 0.9929). The pseudo-second-order adsorption therefore best describes
the adsorption of Cr(VI) to the surface of the modified activated carbon; according to the
literature, this corresponds more to the chemical adsorption process. This shows that the
modification of the surface of the activated carbon would be at the origin of chemical functions
favoring strong adsorption of Cr(VI). Elovich model better describes the adsorption of orange

www.ijsrm.humanjournals.com
Citation: Pierre Gerard Tchieta et al. Ijsrm.Human, 2021; Vol. 18 (4): 1-23.
21
methyl onto ACMSA and AC. The adsorption of Cr(VI) onto AC is best described by the
pseudo-first-order model. The values of α and β are 8.4096mg/g/min and 0.0411g/mg for the
adsorption of orange methyl onto AC and 11.2268mg/g/min and 0.0230g/mg for the adsorption
of the latter to the surface of ACMSA. The increase of the initial rate adsorption α and the
decrease of the initial desorption rate β indicates that the acid treatment would be at the origin of
the increase of the adsorbent capacity to adsorb more and hardly achieve desorption. Similar
results are obtained for the adsorption of orange methyl onto bamboo waste and bamboo waste
modified with acid [44]. The existence of the constant C found with the intra-particle model
shows that this model is not the step controlling the adsorption mechanism [45].
CONCLUSION
In this study, the impact of the functionalization of activated carbon with sulfuric acid was
evaluated for the affinity of the latter towards an inorganic pollutant such as chromium (VI) and
a pollutant organic like orange methyl. The modification of activated carbon with sulfuric acid
increase the quantity of some functional groups on the surface of this activated carbon, namely
phenols, carboxylic acids and lactonic acids. This modification is responsible for the reduction of
the iodine number (from 1422.40mg/g to 381mg/g). The adsorption of chromium (VI) and
methyl orange to the surface of CA is best described by the isotherm of Freundlich (R2 = 0.9037)
and Temkin (R2 = 0.9869) while the adsorption kinetics of these two pollutants to the surface of
that adsorbent is better described by the pseudo-first-order model (R2 = 0.6947) and Elovich (R2
= 0.9929). Following the acid treatment, the adsorption of Cr (VI) and orange methyl to the
surface of the activated carbon modified is now better described by the Langmuir isotherm (R2 =
0.9943 and 0.9562) and the kinetics of Adsorption is best described by the pseudo-second-order
(R2 = 0.9944) and Elovich isotherm(R2 = 0.9905).
REFERENCES
[1] Imene, C. (2017). Study of the Elimination of Cr (VI) ions by Physicochemical Processes Application to Chrome
Plating Waters. University of the mentouri-Constantine brothers; Faculty of Exact Sciences Department of
Chemistry, 21
[2] Kahu, S. S., Shekhawat, A., Sravanan, D., Jugade, R. M. (2016). Two fold modified chitosan for enhanced
adsorption of hexavalent chromium from simulated wastewater and industrial effluents. Carbohydrate Polymers,
146, 264–273
[3] Aksas, H. (2012). Kinetic and thermodynamic study of the adsorption of heavy metals by the use of natural
adsorbents. M’Hamed Bougara-Boumerdes University, Faculty of Engineering Sciences, 12

www.ijsrm.humanjournals.com
Citation: Pierre Gerard Tchieta et al. Ijsrm.Human, 2021; Vol. 18 (4): 1-23.
22
[4] Tafer, R. (2007). Direct and induced photodegradation of organic micro-pollutants (case of an azo dye).
Mentouri-Constantine University; Algeria, 119
[5] Goswami, S., Ghosh, U. C. (2005). Studies on adsorption behaviour of Cr (VI) onto synthetic hydrous stannic
oxide[J]. Water SA, 31, 597-602
[6] Yi-jun, X., Arrigo, R., Liu ,X., Su, D. S. (2011). Characterization and use of functionalized carbon nanotubes for
the adsorption of heavy metal anions. New Carbon Materials, 26, 57-62
[7] Donnet, J. B., Papirer, E., Dauksch, H. (1974). Carbon fibers—their place in modern technology. The Plastics
Institute, London, 58
[8] Kutics, K., Suzuki, M. (1990). 2nd Korea-Japan Symposium on Sep. Seoul, TSeolech, 395
[9] Pittman, C., He, G. R., Wu, B., Gardner, S. D. (1997). Chemical modification of carbon fiber surfaces by nitric
acid oxidation followed by reaction with tetraethylenepentamine. Carbon, 35, 317–331
[10] Moreno-Castilla, C., Carrasco-Marin, F., Mueden, A. (1997). The creation of acid carbon surfaces by treatment
with (NH4)2S2O8. Carbon, 35, 1619–1626
[11] Moreno-Castilla, C., Ferro-Garcia, M., Joly, J. P., Bautista-Toledo, I., Carrasco-Marin, F., Rivera-Utrilla, J.
(1995). Activated carbon surface modifications by nitric acid, hydrogen peroxide, and ammonium peroxydisulfate
treatments. Langmuir, 11, 4386–4392
[12] Carmo, M., Linardi, M., Poco, J. G. R. (2008). H2O2 treated carbon black as electrocatalyst support for polymer
electrolyte membrane fuel cell applications. International Journal of Hydrogen Energy, 33, 6289
[13] Carmo, M., Linardi, M., Poco, J. G. R. (2009). Characterization of nitric acid functionalized carbon black and
its evaluation as electrocatalyst support for direct methanol fuel cell applications. Applied Catalysis A e General,
355, 132
[14] Chen, J. P., Wu, S. N. (2004). Acid/base-treated activated carbons: characterization of functional groups and
metal adsorptive properties. Langmuir, 20, 2233
[15] De la Fuente, J. L. G., Rojas, S., Martinez-Huerta, M.V., Terreros, P., Pena, M. A., Fierro, J. L. G. (2006).
Functionalization of carbon support and its influence on the electrocatalytic behaviour of Pt/C in H2 and CO
electrooxidation. Carbon, 44,1919
[16] De la Fuente, J. L. G., Martinez-Huerta, M. V., Rojas, S., HernandezFernandez, P., Terreros, P., Fierro, J. L. G.
(2009). Tailoring and structure of PtRu nanoparticles supported on functionalized carbon for DMFC applications:
new evidence of the hydrous ruthenium oxide phase. Applied Catalysis B e Environmental, 88, 505
[17] Xu, Y. J., Weinberg, G., Liu, X. (2008). Nanoarchitecturing of activated carbon: facile strategy for chemical
functionalization of the surface of activated carbon [J]. Adv Funct Mater, 18, 3613-3619
[18] Su, D. S., Chen, X., Weinberg, G. (2005). Hierarchically structured carbon: synthesis of carbon nanofibers
nested inside or immobi lized onto modified activated carbon [J]. Angew Chem Int Ed, 44, 5488-5492
[19] Arup, K. S., Dennis, C. (1986). Important process variables in chromate ion exchange [J]. Environ Sci
Technol., 20, 149-155
[20] Ndi, J .N. (2014). Textural properties and adsorption characteristics of activated carbon prepared from cola (c.
acuminata) nut shells: Application for the elimination of methylene blue from aqueous solution. University of
Yaounde I, Faculty of science, 31
[21] Sido-Pabyam, M., Guèye, M., Blin, J., Somé, E. (2009). Biomass residue valorisation into activated charcoal -
Efficiency tests on bacteria and pesticides. International institute for water and environmental engineering, 68, 65-73
[22] Avom, J., Ketcha, J.M., Babale, D. D., Ngono, A. I., Patrick, G. (2002). Adsorption of iodine by activated
carbon from stems of palm bunches. Waste - French journal of industrial ecology, 30, 26-32
[23] Canan, A. B. (2006). Applicability of the various adsorption models of three dyes adsorption onto activated
carbon prepared waste apricot. Journal of Hazardous Materials, 232-241
[24] Moradi, O. (2016). Applicability comparison of different models for ammonium ion adsorption by multi-walled
carbon nanotube. Arabian Journal of Chemistry, 1170-1176
[25] Mahmoud, T., Nassima, B., Salem, B., Hassina, G. (2014). Preparation and characterization of an activated
carbon from the bitter almond shell (Prunus amygdalus). Biotechnol. Agron. Soc. Approx, 18, 492-502
www.ijsrm.humanjournals.com
Citation: Pierre Gerard Tchieta et al. Ijsrm.Human, 2021; Vol. 18 (4): 1-23.
23
[26] Oliveira, E.A., Montanher, S. F., Andrade, A. D., Nobrega, J. A., Rollemberg, M. C. (2005). Equilibrium
studies for the sorption of chromium and nickel from aqueous solution using raw rice bran. Process Biochem, 40,
3485–90
[27] Folasegun, A. D., Kovo, G. A. (2014). Simultaneous adsorption of Ni(II) and Mn(II) ions from aqueous
solution unto a Nigerian kaolinite clay. j materres technol, 3, 129-141
[28] Weber, W. J., Morris, J. C. (1963) Kinetics of adsorption on carbon from solution. J Sanit Eng Div Am Soc
Civil Eng, 89, 31-60
[29] Soltes, E., Elder, T. (1981). Pyrolis in organic chemicals from biomass. CRC press, Boca Raton, FL
[30] Keye, M. M., Prinsloo, F. F. (2012). Loading of cobalt on carbon nanofibers. Stud. Surf. Sci. Catal, [31] Boehm
H.P. Surface oxides on carbon and their analysis: a critical assessment.Carbon, 2002, 40: 145-149
[31] Biniak, S., Szymanski, G., Siedlewski, J., Swiatkowski, A. (1997). The characterization of activated carbons
with oxygen and nitrogen surface groups. Carbon, 35, 1799-1810
[32] Anisuzzaman, S. M., Joseph, C. G., Taufiq-Yap, Y. H., Krishnaiah, D., Tay, V. V. (2015). Modification of
commercial activated carbon for the removal of 2,4-dichlorophenol from simulated wastewater. Journal of King
Saud University – Science, 27, 318–330
[33] Prabhu, A., Ahmed, A. S., Srinivasakannan, C. (2020). Surface functionalization methodologies on activated
carbons and their benzene adsorption. Carbon Letters, 1976-4251
[34] Imamoglu, M, Tekir, O. (2008). Removal of copper (II) and lead (II) ions from aqueous solution by adsorption
on activated carbon from a new precursor hazelnut husks. Desalination, 13, 228–108
[35] Trifi, I. M. (2013). Study of the elimination of chromium (VI) by adsorption on activated alumina on cross
ionic dialysis
[36] DIBI, K. (2016). Elimination of orange methyl in water by adsorption on activated carbon prepared from palm
kernel seeds. Laboratory of Environmental Sciences, 12
[37] Adeyeye, E. L., Ayejuyo, O. O. (1994). Chemical composition of cala acuminate and Garcinia kola seeds
grown in Nigeria. Int. J. Food Sci. Nut., 45
[38] Folasegun, A. D., Kovo, G. A. (2014). Simultaneous adsorption of Ni(II) and Mn(II) ions from aqueous
solution unto a Nigerian kaoliniteclay. J. materres technol., 3, 129–141
[39] Das, B., Mondal, N. K. (2011). Calcareous soil as a new adsorbent to remove lead from aqueous solution:
equilibrium, kinetic and thermodynamic study. Univ. J. Environ Res. Technol., 14,515–30.
[40] Amel, B., Benaouda, B., Abdelaziz, B., Nouredine, B. & Laurent, D. (2015). The influence of surface
functionalization of activated carbon on dyes and metal ion removal from aqueous media. Desalination and Water
Treatment, 1-13
[41] Gupta, V. K., Rastogi, A., Nayak, A. (2010). Adsorption studies on the removal of hexavalent chromium from
aqueous solution using a low cost fertilizer industry waste material. J. Colloid Interface Sci., 342, 783–842
[42] Banat, F., Al-Asheh, S., Al-Makhadmeh, L. (2002). Kinetics and equilibrium study of cadmium ion sorption
onto date pits: an agricultural waste. Adsorpt. Sci. Technol., 20, 245–60
[43] Khan, T. A., Dahiya, S. and Ali, I. (2012). Gazi University J. Sci., 59


