
aegon.com
United Kingdom
Executing our strategy
Analyst & Investor Conference, London – June 19, 2013
Adrian Grace Clare Bousfield
Management Board Member Chief Financial Officer – UK Chief Executive Officer – UK

2
Continued commitment and focus on execution of strategy in the high growth segments of
“Workplace” and “At Retirement”
Responding to market changes by providing flexible and simple solutions
Focusing on needs of customers in our core markets through broadening distribution channels
One Platform to meet the needs of all of our customer segments and propositions
Solid progress towards group targets; focus on a capital-light, fee-based business model
Generating cash flow/dividends and maintaining cost discipline
Key messages

3
Strategic overview
Aegon UK strategy
Customer centric
Valuable retention and
growth of assets
Efficient business model
Stable and capital-light
Focus on core markets – Workplace & At Retirement
Customer focus through simplicity
Diversify distribution
Capital efficiency
Segment led distribution
Technology centred
Retention driven
Consolidation focused
Cashflows/dividend flows
Our Balanced Scorecard
Customer
Cashflow
Charges
Expenses
Investment performance
MCVNB
Employee
Risk Tolerance
Capital

4
Customer needs are changing
Our
Customer
Promise
Most
important
Least
important
1. Income certainty
2. Simple offer
3. Loyalty rewards
4. Decision-making support
5. Digital convenience
6. Low charges
7. Investment choice
8. Access to cash
What our target customers care about
the most
Sectors
Workplace
Savings
Target
Customers
Source: Experian, Aegon UK internal (including internal research with existing customers)
Personas
At Retirement
Simple
Rewarding Reassuring
Target Customers Customer Attributes Customer Promise

5
At Retirement Workplace Savings
“Gated” solutions for employee
segments
Launched June 2012
One Platform with three solutions to meet evolving customer needs……….
Non-Advised
Self service availability for the D.I.Y.
market
To be launched to existing customers
Accumulation and decumulation
capability for the adviser market
Launched November 2011
…..existing assets can be transferred to the Platform enabling
consolidation in a low cost capital-light model
Aegon Retirement Choices (ARC) Self Invested Personal
Pension (SIPP)
Cash Individual
Savings Account (ISA) Stocks and Shares ISA
General Investment Account
(GIA - net and gross) International Bond
Cash Insured Funds Alternative
Investments Equities Exchange Traded Funds (ETFs) Collectives
Dedicated Websites Reporting & MI
Online self-serve
Empowering Employees and customers
to develop their own solutions
Gated Access Online Administration
One Platform
Investments
Protection and Annuities

6
The Workplace Savings Market
Our target customers...
....and ISA market is ~GBP 350bn with ~70% of employees expecting
employers to facilitate ISA savings in the future
Estimate net revenues from workplace defined
contribution (DC) for pension providers in 2022:
GBP 2.6bn (2012: ~GBP 1bn)
Key market drivers are increasing the importance of the
workplace for savings:
► 1.3 million employers must take action for pension
reform
► 11 million people will be eligible for auto-enrolment
► 6-9 million new savers or saving more as a result of
auto-enrolment
► GBP 800bn of assets moving from defined benefit (DB)
to DC and buyout over 20 years
Leveraging the workplace to consolidate assets
There are ~GBP 1.2trn pensions assets in the UK
Workplace Savings market (and growing)
Source: Oliver Wyman, Mercer, Spence Johnson, DWP
DC asset growth over time (GBP million)
7
….. and moving up in the large corporate space
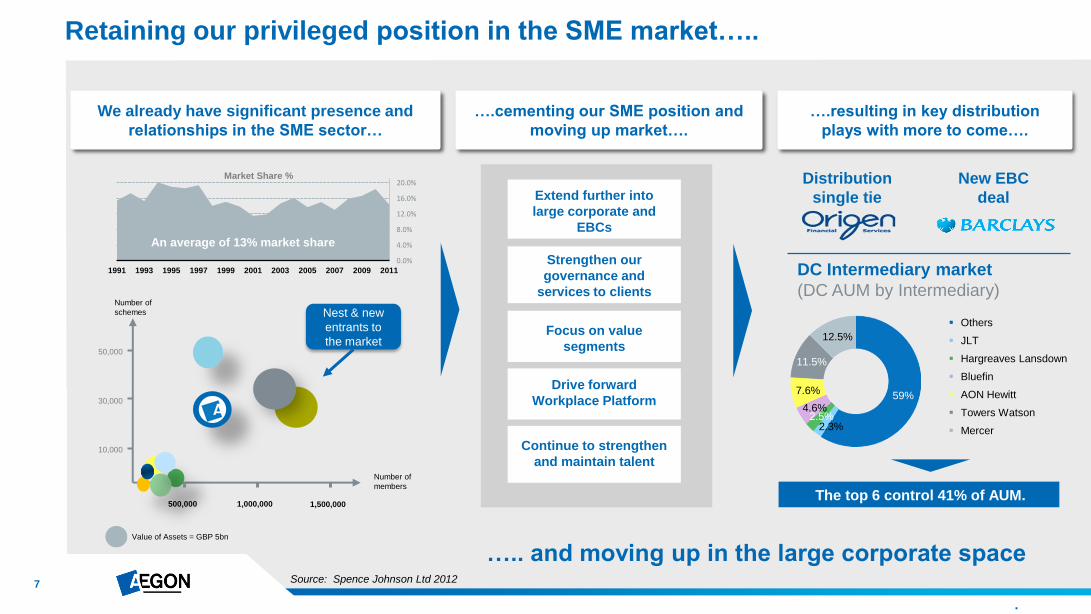
59%
2.3% 2.5%
4.6%
7.6%
11.5%
12.5%
We already have significant presence and
relationships in the SME sector…
….resulting in key distribution
plays with more to come….
….cementing our SME position and
moving up market….
Retaining our privileged position in the SME market…..
Extend further into
large corporate and
EBCs
Strengthen our
governance and
services to clients
Focus on value
segments
Drive forward
Workplace Platform
Continue to strengthen
and maintain talent
Source: Spence Johnson Ltd 2012
New EBC
deal
Number of
schemes
Number of
members
10,000
30,000
50,000
500,000 1,000,000 1,500,000
Value of Assets = GBP 5bn
Nest & new
entrants to
the market
Distribution
single tie
The top 6 control 41% of AUM.
DC Intermediary market
(DC AUM by Intermediary)
Others
JLT
Hargreaves Lansdown
Bluefin
AON Hewitt
Towers Watson
Mercer
An average of 13% market share
0.0%
4.0%
8.0%
12.0%
16.0%
20.0%
2011 2009 2007 2005 2003 2001 1999 1997 1995 1993 1991
Market Share %
An average of 13% market share
8
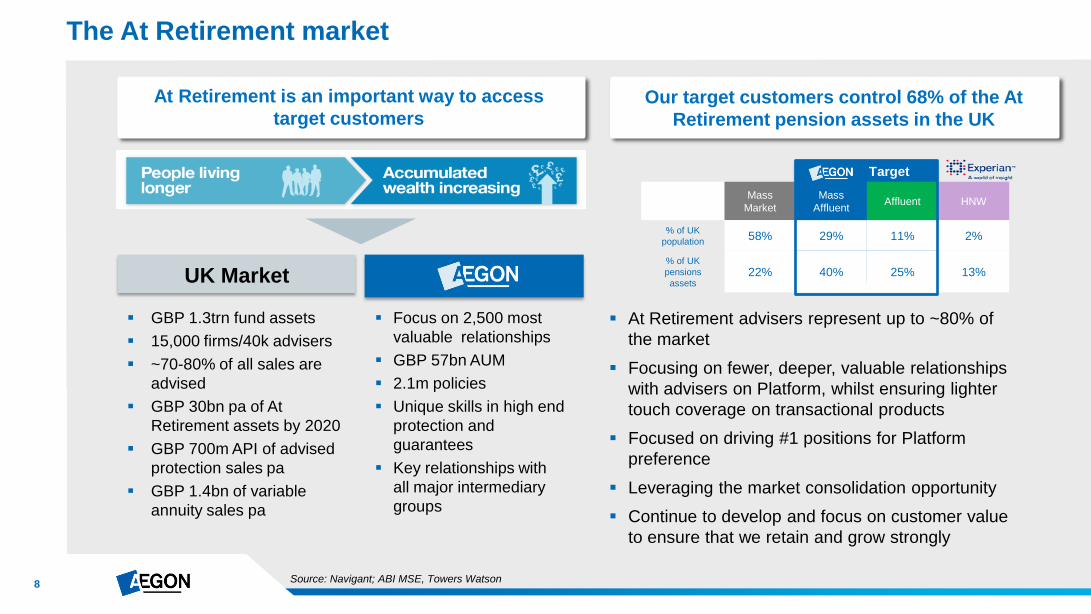
Our target customers control 65% of the GBP
4.8trn pension assets in the UK
The At Retirement market
At Retirement is an important way to access
target customers
Adviser Market UK Market Adviser Market
Mass
Market
Mass
Affluent Affluent HNW
% of UK
population 58% 29% 11% 2%
% of UK
pensions
assets 22% 40% 25% 13%
Target
Source: Navigant; ABI MSE, Towers Watson
Focus on 2,500 most
valuable relationships
GBP 57bn AUM
2.1m policies
Unique skills in high end
protection and
guarantees
Key relationships with
all major intermediary
groups
Our target customers control 68% of the At
Retirement pension assets in the UK
GBP 1.3trn fund assets
15,000 firms/40k advisers
~70-80% of all sales are
advised
GBP 30bn pa of At
Retirement assets by 2020
GBP 700m API of advised
protection sales pa
GBP 1.4bn of variable
annuity sales pa
At Retirement advisers represent up to ~80% of
the market
Focusing on fewer, deeper, valuable relationships
with advisers on Platform, whilst ensuring lighter
touch coverage on transactional products
Focused on driving #1 positions for Platform
preference
Leveraging the market consolidation opportunity
Continue to develop and focus on customer value
to ensure that we retain and grow strongly

9
At Retirement business models are changing rapidly
Challenges
driven by RDR
Impacting
adviser
models
Resulting in
significant
change
Driving new
adviser
outcomes
Revenue model
Cost to serve
Personal
insurance cover
Capital
Qualifications
Profitability
Cash flow
Post RDR
Proposition
Need to segment
customers
► Networks for sale
► Firms going out
of business
► Providers going
direct
► Providers controlling
access
► Banks withdrawing
advice
► Rapid platform
adoption
► Seeking to earn
adviser charging
on existing assets
► Extending across
value chain
► Advice gap for
many customers
► Survival more than
customer outcomes

10
The Retail Distribution Review (RDR) has created growth in the Non-Advised market
The UK Non-Advised market is currently valued at GBP 94.5bn, excluding traditional
pension assets
Growth in the Non-Advised space is expected to be driven by consolidation of investors’ assets
The Non-Advised market is significant and growing
Forecast growth of the Non-Advised platform market 2012 - 2014
Source: Platforum Direct Platform Report 2012
GIA
ISA
SIPP
73
94.5
135
180
0
20
40
60
80
100
120
140
160
180
200
2011 2012 2013 2014 A
uA
(G
BP
bn
)
UK Non-Advised Platform 2012
(Market Share by player)
37%
29%
13%
7%
5% 5% 4%
Hargreaves Lansdown
Other
Barclays Stockbrokers
Fidelity
TD Direct Investing
Selftrade
Alliance Trust Savings
~40%
~40%
~20%

11
Developing our proposition to capitalise on the Non-Advised market……
Based on mass affluent platform customers
Move to Non-Advised is
happening
2012
The value of our customer base is significant
68%
24%
9%
Source: Navigant; Aegon UK FastStat
% Non-Advised Aegon UK customer
base pension assets per Q1 2013
(523k policies)
Mass Market Mass Affluent Affluent High Net Worth
33.7% 26.4% 23% 20.3%
Non-Advised customers with Aegon
have an average share of pensions
assets of ~20%
We are focused on increasing our
share of wallet through active
engagement with these customers
We will help customers consolidate
both their pension and non-pension
assets
Leveraging our channels in
Workplace, Retail and Non-Advised
to drive consolidation
Consolidation opportunity
Historical view The future
GBP 9.2bn
Non-Advised
Aegon UK
AUM
18%
SIPP &
Other
Pension
Products
~70%
GIA
~10%
Significant
Positive
Upturn
Pension assets with Aegon
SIPP
~20%
ISA
~20%
2017
37%
51%
12%
Advised
Non-Advised
Disengaged

12
ARC adoption attracts valuable customers while
retaining & growing existing customers
Fast growing award winning Platform
New Business Completed each month GBP m
(ARC and One Retirement)
2013
Aegon Retirement Choices Platform performance
Awarded two major industry awards for Innovation
and Best Workplace platform (Platforum)
Approx 900 firms are actively trading and the rate of
uptake is increasing
Growing at a rate of more than GBP 100 million per
month (and increasing) in Retail
Higher value customers
Average pension pot
Attract non-pension
Average AUM
Consolidate other sources
Average pension pot
Share of Wallet % of all pension assets
Retain % consolidating on transfer from
Packaged
One Retirement ARC
Dec 2012 May 2013
ARC Packaged
~GBP 60k ~GBP 20k
~GBP 55k Not available
~GBP 100k
~60% ~20%
~50%
consolidate bringing 60%
more funds
Not
applicable
Not
applicable
Award winning
platform
13
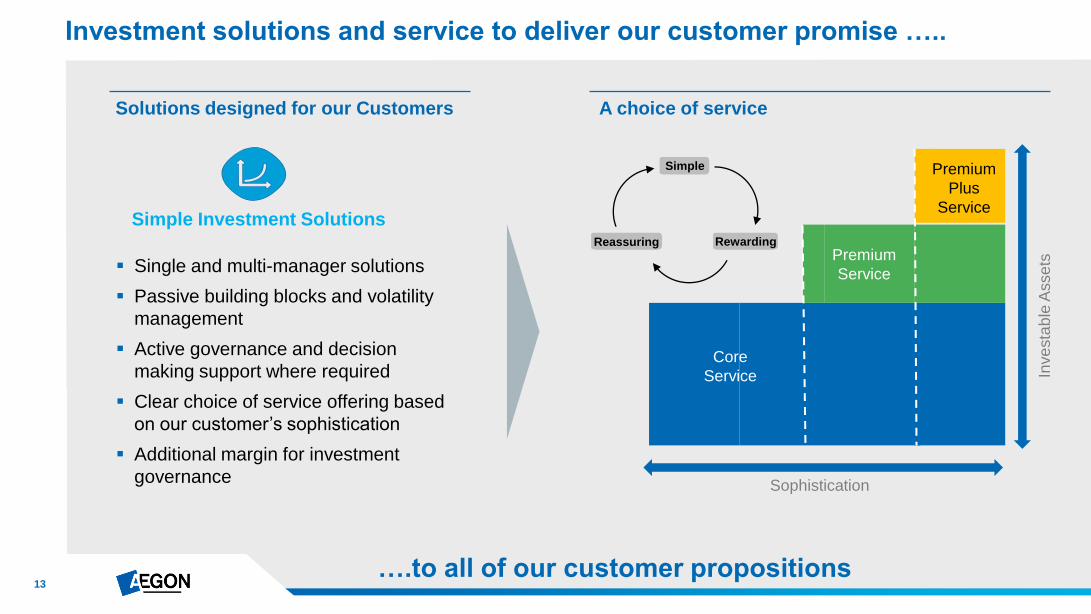
Investment solutions and service to deliver our customer promise …..
Solutions designed for our Customers
Single and multi-manager solutions
Passive building blocks and volatility
management
Active governance and decision
making support where required
Clear choice of service offering based
on our customer’s sophistication
Additional margin for investment
governance
A choice of service
Simple Investment Solutions
….to all of our customer propositions
Sophistication
Inve
sta
ble
Asse
ts
Core
Service
Premium
Service
Premium
Plus
Service
Simple
Rewarding Reassuring
14
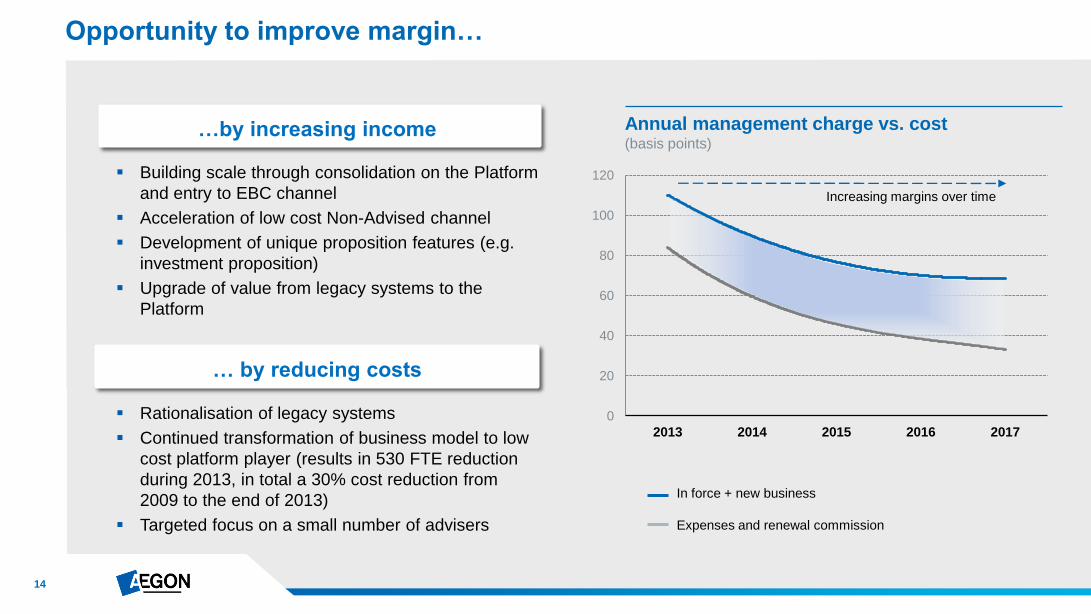
Opportunity to improve margin…
Annual management charge vs. cost (basis points)
In force + new business
Expenses and renewal commission
Building scale through consolidation on the Platform
and entry to EBC channel
Acceleration of low cost Non-Advised channel
Development of unique proposition features (e.g.
investment proposition)
Upgrade of value from legacy systems to the
Platform
… by reducing costs
…by increasing income
Increasing margins over time
0
20
40
60
80
100
120
2013 2014 2015 2016 2017
Rationalisation of legacy systems
Continued transformation of business model to low
cost platform player (results in 530 FTE reduction
during 2013, in total a 30% cost reduction from
2009 to the end of 2013)
Targeted focus on a small number of advisers

15
Reducing costs and headcount…
Cost, GBP m
Cost
reductions
Headcount,
FTE
Disposal of
non-core
businesses
~(87)
~(7) ~25
~370
~260
0
500
1000
1500
2000
2500
3000
3500
4000
4500
0
50
100
150
200
250
300
350
400
Cost base &
efficiencies 2009 Outsourcing
& closing 2013
Cost savings Structural Change
& Pos Sols
Incl. Origen
Further cost
reductions
planned
GB
P m
FT
E Incl. Origen
Investment
~(40)
….and over delivering on our 25% cost savings commitment
Cost savings (FTE and GBP million)

16
Managing capital across multiple frameworks
United
Kingdom
Pillar 1 ratio
~160% ( ~120% excl. CSA*)
Pillar 2 ratio (ICAAP+)
~140% ( ~130% excl. CSA*)
Continue to manage the capital position
using the capital target approach –
consistent with Group policy
Target for UK represents the additional
capital required to withstand adverse
plausible events and still meet capital
requirements (Pillar 1 target 175% of
requirement, Pillar 2 target 125% of
requirement)
Market conditions (credit spread
tightening) in 2013 improves economic
capital but negatively impacts Pillar 1
Pillar 1 is forecast to improve as we repay
the securitisations over the next two years
Solvency II
> 2016
In
Development
Local solvency ratios per Q1 2013 = current binding constraint
* Capital Support Agreement

17
~130
~35
~55 ~20
(10)
Operational free cash flows strengthen local balance sheet
GBP million 2012
Earnings on in-force 330
Return on free surplus 5
Release of required surplus (10)
New business strain (185)
Normalized operational free cash flow 140
Repayment of securitisation (150)
Total operational free cash flow (10)
Securitisation Commission Cost Base
Improving capital generation
Movement in Pillar I capital generation (OFCF) GBP m
Transform 20121
1. Excluding market impacts, capital injections and other one-off items.
2015
EUR million 2012
Americas ~900
Netherlands ~250
United Kingdom ~175
New Markets ~50
Total normalized operational free cash flow ~1,375
Normalized operational free cash flows – United Kingdom
~200-250
Operational free cash flows represent capital generation in local
operating units using the current local binding capital metric
Plans for future capital and growing cash flows in the UK :
► No initial commission post RDR
► Securitisation payments concluding (2014/15)
► Retain pension business
► Stabilise capital position
► Reduce cost base
► Transform business (asset growth benefit)
► Profitable annuity and protection sales

18
Clear targets to support overall Group targets
Achieve a
return on capital* of
8%
by 2015
Reduce operating expenses
by
25%
of underlying earnings by 2015
~75%
More than double fee-based
earnings to
by end 2011
* Excludes allocation of NV Holdings expenses to the UK
Increase annual operational
free cash flow to
GBP 200-250
million by 2015
19
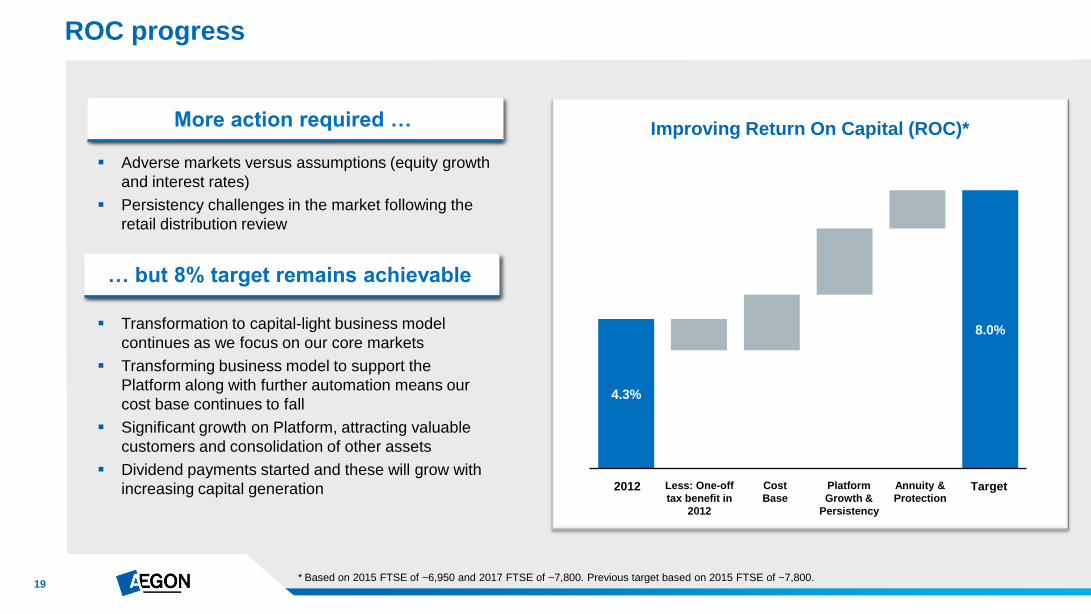
4.3%
8.0%
ROC progress
Cost
Base
Improving Return On Capital (ROC)*
Platform
Growth &
Persistency
Annuity &
Protection Target 2012
Transformation to capital-light business model
continues as we focus on our core markets
Transforming business model to support the
Platform along with further automation means our
cost base continues to fall
Significant growth on Platform, attracting valuable
customers and consolidation of other assets
Dividend payments started and these will grow with
increasing capital generation
Adverse markets versus assumptions (equity growth
and interest rates)
Persistency challenges in the market following the
retail distribution review
More action required …
Less: One-off
tax benefit in
2012
* Based on 2015 FTSE of ~6,950 and 2017 FTSE of ~7,800. Previous target based on 2015 FTSE of ~7,800.
… but 8% target remains achievable
20
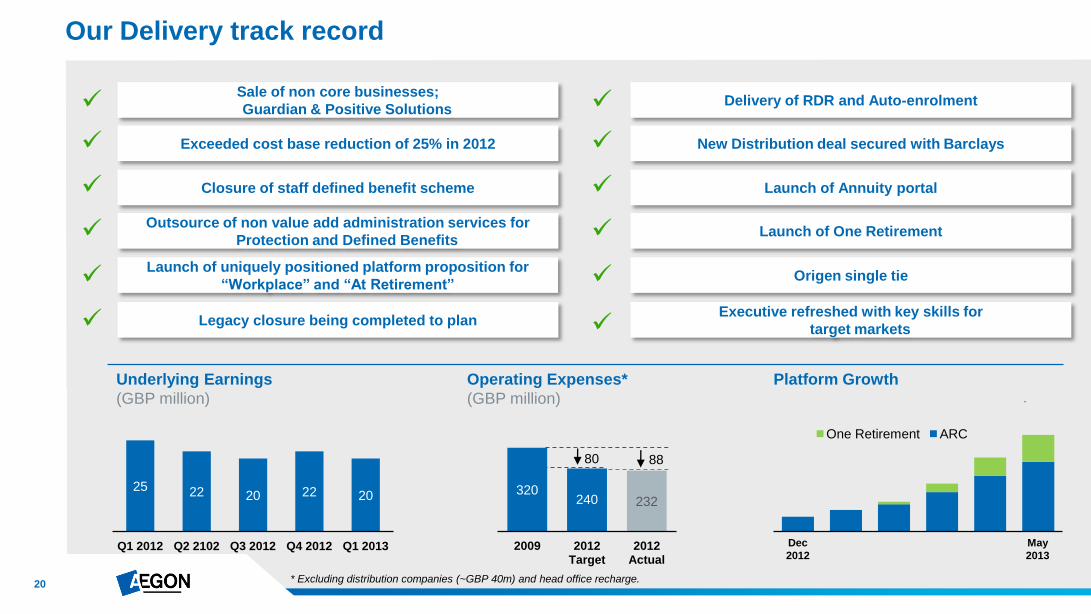
One Retirement ARC
320 240 232
2009 2012 Target
2012 Actual
80 88
Our Delivery track record
Sale of non core businesses;
Guardian & Positive Solutions
Exceeded cost base reduction of 25% in 2012
Closure of staff defined benefit scheme
Outsource of non value add administration services for
Protection and Defined Benefits
Launch of uniquely positioned platform proposition for
“Workplace” and “At Retirement”
Legacy closure being completed to plan
Delivery of RDR and Auto-enrolment
New Distribution deal secured with Barclays
Launch of Annuity portal
Launch of One Retirement
Origen single tie
Executive refreshed with key skills for
target markets
Operating Expenses*
(GBP million)
Underlying Earnings
(GBP million)
25 22 20 22 20
Q1 2012 Q2 2102 Q3 2012 Q4 2012 Q1 2013 Dec
2012
May
2013
* Excluding distribution companies (~GBP 40m) and head office recharge.
Platform Growth

21
Conclusion
Focused on high growth segments within the third largest life and pensions market in the world
A clear track record of delivery established
Energised management team capable of delivery
A core strategic focus on the Workplace and At Retirement markets and the emerging
Non-Advised segment
Unique Platform capability can be adopted to suit our three core markets
Proposition will be enhanced with a strong investment proposition and a developing focus on
protection and annuities where appropriate
A capital-light, fee generating business model

For questions please contact Investor Relations
+31 70 344 8305
P.O. Box 85
2501 CB The Hague
The Netherlands

23
Disclaimer
Cautionary note regarding non-IFRS measures This document includes the non-IFRS financial measures: underlying earnings before tax, income tax, income before tax and market consistent value of new business. These non-IFRS measures are calculated by consolidating on a proportionate basis Aegon’s joint ventures and associated companies. The reconciliation of these measures, except for market consistent value of new business, to the most comparable IFRS measure is provided in note 3 "Segment information" of Aegon’s condensed consolidated interim financial statements. Market consistent value of new business is not based on IFRS, which are used to report Aegon’s primary financial statements and should not be viewed as a substitute for IFRS financial measures. Aegon may define and calculate market consistent value of new business differently than other companies. Aegon believes that its non-IFRS measures, together with the IFRS information, provide meaningful information about the underlying operating results of Aegon’s business including insight into the financial measures that senior management uses in managing the business.
Local currencies and constant currency exchange rates This document contains certain information about Aegon’s results, financial condition and revenue generating investments presented in USD for the Americas and GBP for the United Kingdom, because those businesses operate and are managed primarily in those currencies. Certain comparative information presented on a constant currency basis eliminates the effects of changes in currency exchange rates. None of this information is a substitute for or superior to financial information about Aegon presented in EUR, which is the currency of Aegon’s primary financial statements.
Forward-looking statements The statements contained in this document that are not historical facts are forward-looking statements as defined in the US Private Securities Litigation Reform Act of 1995. The following are words that identify such forward-looking statements: aim, believe, estimate, target, intend, may, expect, anticipate, predict, project, counting on, plan, continue, want, forecast, goal, should, would, is confident, will, and similar expressions as they relate to Aegon. These statements are not guarantees of future performance and involve risks, uncertainties and assumptions that are difficult to predict. Aegon undertakes no obligation to publicly update or revise any forward-looking statements. Readers are cautioned not to place undue reliance on these forward-looking statements, which merely reflect company expectations at the time of writing. Actual results may differ materially from expectations conveyed in forward-looking statements due to changes caused by various risks and uncertainties. Such risks and uncertainties include but are not limited to the following:
Changes in general economic conditions, particularly in the United States, the Netherlands and the United Kingdom;
Changes in the performance of financial markets, including emerging markets, such as with regard to:
– The frequency and severity of defaults by issuers in Aegon’s fixed income investment portfolios;
– The effects of corporate bankruptcies and/or accounting restatements on the financial markets and the resulting decline in the value of equity and debt securities Aegon holds; and
– The effects of declining creditworthiness of certain private sector securities and the resulting decline in the value of sovereign exposure that Aegon holds;
Changes in the performance of Aegon’s investment portfolio and decline in ratings of Aegon’s counterparties;
Consequences of a potential (partial) break-up of the euro;
The frequency and severity of insured loss events;
Changes affecting mortality, morbidity, persistence and other factors that may impact the profitability of Aegon’s insurance products;
Reinsurers to whom Aegon has ceded significant underwriting risks may fail to meet their obligations;
Changes affecting interest rate levels and continuing low or rapidly changing interest rate levels;
Changes affecting currency exchange rates, in particular the EUR/USD and EUR/GBP exchange rates;
Changes in the availability of, and costs associated with, liquidity sources such as bank and capital markets funding, as wel l as conditions in the credit markets in general such as changes in borrower and counterparty creditworthiness;
Increasing levels of competition in the United States, the Netherlands, the United Kingdom and emerging markets;
Changes in laws and regulations, particularly those affecting Aegon’s operations, ability to hire and retain key personnel, the products Aegon sells, and the attractiveness of certain products to its consumers;
Regulatory changes relating to the insurance industry in the jurisdictions in which Aegon operates;
Changes in customer behavior and public opinion in general related to, among other things, the type of products also Aegon sells, including legal, regulatory or commercial necessity to meet changing customer expectations;
Acts of God, acts of terrorism, acts of war and pandemics;
Changes in the policies of central banks and/or governments;
Lowering of one or more of Aegon’s debt ratings issued by recognized rating organizations and the adverse impact such action may have on Aegon’s ability to raise capital and on its liquidity and financial condition;
Lowering of one or more of insurer financial strength ratings of Aegon’s insurance subsidiaries and the adverse impact such action may have on the premium writings, policy retention, profitability and liquidity of its insurance subsidiaries;
The effect of the European Union’s Solvency II requirements and other regulations in other jurisdictions affecting the capita l Aegon is required to maintain;
Litigation or regulatory action that could require Aegon to pay significant damages or change the way Aegon does business;
As Aegon’s operations support complex transactions and are highly dependent on the proper functioning of information technology, a computer system failure or security breach may disrupt Aegon’s business, damage its reputation and adversely affect its
results of operations, financial condition and cash flows;
Customer responsiveness to both new products and distribution channels;
Competitive, legal, regulatory, or tax changes that affect profitability, the distribution cost of or demand for Aegon’s products;
Changes in accounting regulations and policies may affect Aegon’s reported results and shareholders’ equity;
The impact of acquisitions and divestitures, restructurings, product withdrawals and other unusual items, including Aegon’s ability to integrate acquisitions and to obtain the anticipated results and synergies from acquisitions;
Catastrophic events, either manmade or by nature, could result in material losses and significantly interrupt Aegon’s business; and
Aegon’s failure to achieve anticipated levels of earnings or operational efficiencies as well as other cost saving initiatives.
Further details of potential risks and uncertainties affecting Aegon are described in its filings with the Netherlands Authority for the Financial Markets and the US Securities and Exchange Commission, including the Annual Report. These forward-looking statements speak only as of the date of this document. Except as required by any applicable law or regulation, Aegon expressly disclaims any obligation or undertaking to release publicly any updates or revisions to any forward-looking statements contained herein to reflect any change in Aegon’s expectations with regard thereto or any change in events, conditions or circumstances on which any such statement is based.


