Sept
embe
r 200
9
Government of AfghanistanMinistry of Counter Narcotics
Afghanistan Opium Survey 2009
Summary Findings
ABBREVIATIONS ANP Afghan National Police CNPA Counter Narcotics Police of Afghanistan GLE Governor-led eradication ICMP Illicit Crop Monitoring Programme (UNODC) ISAF International Security Assistance Force MCN Ministry of Counter-Narcotics PEF Poppy Eradication Force UNODC United Nations Office on Drugs and Crime ACKNOWLEDGEMENTS The following organizations and individuals contributed to the implementation of the 2009 Afghanistan Opium Survey and to the preparation of this report: Ministry of Counter-Narcotics: Dr. Mohammad Zafar (Deputy Minister), Mohammad Ibrahim Azhar (Deputy Minister) Dr. Mohammad Nabi Hussaini (Director General), Policy &Coordination, Mir Abdullah (Deputy Director of Survey and Monitoring Directorate) Survey Coordinators: Eshaq Masumi (Central Region), Abdul Mateen (Eastern Region), Abdul Latif Ehsan (Western Region), Fida Mohammad (Northern Region), Mohammed Ishaq Anderabi (North-Eastern Region), Hashmatullah Asek (Southern Region) Mohammad Khyber Wardak (Data entry supervisor), Mohammad Ajmal (Data entry), Sahar (Data entry), Mohammad Hakim Hayat (Data entry). Remote sensing analysts: Ahmad Jawid Ghiasee and Sayed Sadat Mehdi Eradication reporters: Ramin Sobhi and Zia Ulhaq. United Nations Office on Drugs and Crime (Kabul) Jean-Luc Lemahieu (Country Representative), Elisabeth Bayer (Deputy Representative), Devashish Dhar (International Project Coordinator), Ziauddin Zaki (National Project Coordinator), Abdul Mannan Ahmadzai (Survey Officer), Noor Mohammad Sadiq (Database Developer) Survey Coordinators: Abdul Basir Basiret (Eastern Region), Abdul Jalil (Northern Region), Abdul Qadir Palwal (Southern Region), Fawad Alahi (Western Region), Mohammad Rafi (North-eastern Region), Rahimullah Omar (Central Region), Sayed Ahmad (Southern Region), Abdul Rahim Marikh (Eastern Region), Fardin Osmani (Northern Region) Provincial Coordinators: Fazal Mohammad Fazli (Southern Region), Mohammad Alam Ghalib (Eastern Region), Altaf Hussain Joya (Western Region), Mohammed Alem Yaqubi (North-eastern Region), Lutfurhaman Lutfi (Northern Region) United Nations Office on Drugs and Crime (Vienna) Sandeep Chawla (Director, Division for Policy Analysis and Public Affairs), Angela Me (Chief, Statistics and Surveys Section-SASS), Shirish Ravan (Programme Officer), Martin Raithelhuber (Programme Officer), Patrick Seramy (Database management), Javier Teran (Statistician), Coen Bussink (GIS Expert) (all SASS/ICMP), Kristina Kuttnig (Public Information Assistant, Studies and Threat Analysis Section), Hakan Demirbuken (Research Expert, Studies and Threat Analysis Section), Andrea Mancini (Project Coordinator, Technical Cooperation Section 2) The implementation of the survey would not have been possible without the dedicated work of the field surveyors, who often faced difficult security conditions. The UNODC Illicit Crop Monitoring activities in Afghanistan were made possible by financial contributions from the Governments of Germany, Norway, the United Kingdom and the United States of America.
Afghanistan Opium Survey 2009
Summary Findings
September 2009

COMMENTARY BY THE EXECUTIVE DIRECTOR The bottom is starting to fall out of the Afghan opium market. For the second year in a row, cultivation, production, work-force, prices, revenues, exports and its GDP share are all down, while the number of poppy-free provinces and drug seizures continue to rise. Yet, Afghan drugs still have catastrophic consequences. They fund criminals, insurgents, and terrorists in Afghanistan and abroad. Collusion with corrupt government officials keeps undermining public trust, security, and the law. The taint of money-laundering is harming the reputation of banks in the Gulf, and farther afield. The vulnerable are most at risk: drug use in Afghanistan is a growing problem, particularly among refugees. Drug addiction and HIV are spreading death and misery along opiate trafficking routes, particularly in Central Asia and Russia. Around the world, but especially in Europe, once again tens of thousands will die this year from heroin overdoses. It is therefore essential to use this time of political change in Afghanistan to analyze the forces that are shrinking the opium market, and those needed to push further this process which is vulnerable to relapse. The opium market plummets In 2009, opium cultivation in Afghanistan decreased by 22%, from 157,000 hectares (ha) in 2008 to 123,000 ha today. In Helmand alone, cultivation declined by a third, to less than 70,000 ha. Indeed, the major drop in Helmand corresponds to the entire national decline this year: -34,000 ha. The dramatic turn-around in Helmand can be attributed to an effective mix of sticks and carrots: governor leadership; a more aggressive counter-narcotics offensive; terms of trade more favourable to legal crops; and the (related) successful introduction of food zones to promote licit farming. Around the country, the number of poppy-free provinces has increased from 18 to 20. Opium cultivation in four other provinces (Kabul at 132 ha, Kunar at 164 ha, Laghman at 135 ha and Nangarhar at 294 ha) is marginal. In three others (Badakhshan, Hirat and Nimroz) poppy-free status is within reach in the next farming season. At that point, more than two-thirds of the country would be poppy-free. Today, about a third is. Production has dropped less dramatically because farmers have extracted more opium per bulb. Whereas in the Golden Triangle, poppies yield about 10 kg of opium per hectare, this year Afghan poppies (grown in the most fertile and best irrigated part of the country) yielded a record 56 kg/ha – a 15% increase over last year’s already high figure of 49 kg. As a result, while cultivation decreased by 22%, in 2009 opium production was down by 10% to 6,900 tons. Still, to put this in perspective, the expected 800 ton decline is equivalent to roughly twice the amount currently supplied by the Golden Triangle, with a retail value of around $8 billion in consuming nations.
Over-supply at the source and lower market penetration (in Europe) are pushing opium prices down. Wholesale (farm gate) prices in Afghanistan have fallen by a third in the past year: from $70/kg to $48/kg for fresh opium; from $95/kg to $64/kg for the dry variety. In Afghanistan, opium values (in nominal terms) have not been this low since the late 1990s, when the Taliban were in power, and the opium harvest was half the size of today. This year opium farmers saw their (gross) earnings per hectare shrink by one quarter, to $3,562/ha down from $4,662/ha in 2008. Falling prices and lower cultivation this year caused a 40% collapse in the total farm-gate value of opium production in Afghanistan, for a total of $438 million. This is equivalent to 4% of the country’s (licit) GDP, down from 12% in 2007, and an unprecedented 27% in 2002. The fact that 800,000 fewer people are involved in opium production, compared to 2008, is another indication that the drug industry is becoming less attractive. Afghan and NATO forces are compounding the pressure caused by market forces. After some reticence, the link between drugs and insurgency is now under attack, literally. In the first half of 2009, military operations destroyed over 90 tons of precursor chemicals, 450t of seeds, 50t of opium, 7t of morphine, 1.5t of heroin, 19t of cannabis resin and 27 labs. While this has knocked out only a fraction of the Afghan drug economy, it has increased the risks of drug trafficking, and created a deterrent for the future. Indeed, our Survey shows that farmers are increasingly wary of retaliation, trading has become more discreet, and stocks are now buried underground. The impunity enjoyed thus far by the Afghan drug economy is under threat. The risks/rewards balance is starting to tilt against drugs. The birth of Afghan narco-cartels Despite the progress, opium remains a major source of income in one of the world’s poorest and most unstable countries. Farmers may grow it to stave off poverty. Criminals, insurgents and corrupt officials surely engage in its trade in the common pursuit of greed and power. There is growing evidence – from tougher counter-narcotics and improved intelligence – that some anti-government elements in Afghanistan are turning into narco-cartels. It has happened elsewhere in the world. In Colombia, for example, drug trafficking (by FARC and ELN) started as a means to a political end – a way of funding an ideologically motivated guerrilla movement. Yet, the world over, drug money eventually trumps ideology, and becomes as addictive as the dope itself. Afghanistan is approaching this point. After years of collusion with criminal gangs and corrupt officials, some insurgents are now opportunistically moving up the value chain: not just taxing supply, but getting involved in producing, processing, stocking and exporting drugs. The impact this has on the stability of Afghanistan, and the ways and means to oppose it, require attention.
Avoiding a relapse Progress in Afghanistan should not be measured only by the rising number of opium free provinces or by the declining size of poppy fields. Counter-narcotics must be a growing part of national efforts to improve living standards and governance and, therefore, should be a higher priority in international assistance programmes. Eradicate poverty, not just poppies. The world over, development is the most powerful means to contain the twin threats of drugs and insurgency. In Afghanistan, many farmers grow opium because they depend on loans provided by traders as a down payment for the subsequent drug harvest. Historically this has trapped farmers in debt bondage. Micro-credits can free farmers from their drug masters. Infrastructures, storage facilities and access to markets can help them market their (licit) crops. This has happened, but in an inadequate and fragmented way. In post-election Afghanistan, the rural development push must be as robust as the current military offensive – to feed and employ farmers, not just to search and destroy their drugs. There is no need to bribe farmers to stay away from drugs: market forces are already doing this. The new terms of trade caused by an over-supply of drugs and an under-supply of food are already convincing farmers that it pays not to grow poppies – especially if/once the climate of impunity starts fading. Two corollaries follow. (i) Just as the military are preparing for a surge, an assistance leap in the countryside is needed. Aid has been generous, but is choked by high costs of intermediation. (ii) Just as the military are reducing their operational caveats, development assistance needs fewer restrictions. The combination of individual foreign-sponsored projects around each PRT (understandably, to protect the fighting boys), does not amount to a coherent assistance program for Afghanistan. In short, what is needed to consolidate recent gains, and to push the process forward are more assistance, greater coherence, and fewer bottlenecks at delivery. Target rich criminals, not poor farmers. In the past the focus was on eradication, rather than interdiction. It didn’t work. Over the past two years, only 10,000 hectares of opium were eradicated: less than 4% of the amount planted, with an enormous human and economic cost. Interdiction, not a priority, suffered. As a result, although 90% of the world’s opium comes from Afghanistan, less than 2% is seized there (more than 20% of global cocaine supply is seized by its main producer, Colombia). Afghan and NATO forces have started to disrupt the drug trade by dismantling high value assets. More is needed, for example going after the handful of drug kingpins who control the bulk of the trade. Security Council Resolution 1735 of December 2007 called for them to be listed, their travels banned, their assets seized. So far no names have been submitted to the Council. Major traffickers should be reported to the Security Council and brought to justice – not executed in violation of international law or pardoned for political expediency. Missing stocks a threat. Annual world demand for illicit opium has never exceeded 5,000 tons. Yet, over the past few years, including in 2009, Afghan supply has well-exceeded this amount. Illicit drug stockpiles may have now reached 10,000 tons – enough to satisfy two years of world (heroin) addiction, or three years of medical (morphine) prescription. At a time of declining prices, commercial traders would not hold on to
devaluing assets. So the opium stocks are probably in the hands of people who are not motivated solely by commercial interests. After all, opium ages well; it is a means of payment easily transported, with a world-wide market. Intelligence agencies should defuse the ticking-bomb of opium stock-piles, before these become the source of potential sinister scenarios. A truly regional approach. In southern Afghanistan, for years insurgents and drug traffickers alike have taken advantage of the strategic depth in Pakistan to regroup and strike again, moving opium, equipment, arms and foot soldiers back and forth, in reaction to law enforcement pressure. At present, under combined NATO/Afghan pressure the business is being pushed south and east. Yet, although a quarter of all Afghan narcotics is smuggled through Pakistan, there are no seizures in Pakistan’s Federally Administered Tribal (border) Areas. The recent Af/Pak focus is welcome, yet too narrow. Yearly, as much as half of Afghanistan’s opium is exported through Iran, threatening border security and spreading addiction. This is why UNODC has brokered a Trilateral Platform among Afghanistan, Iran and Pakistan to share counter-narcotics intelligence and run joint operations. It is working, with results operationally small but symbolically big. The northern axis is also crucial. Drugs moving north (along the Silk Road) through Central Asia into Russia and China are spreading addiction, HIV and insurgency. Expectations are high regarding the impact the UNODC-brokered Central Asia Intelligence Centre (CARICC) will have. An historical error Controlling drugs in Afghanistan will not solve all of the country’s problems, but the country’s problems can not be solved without controlling drugs. A second consecutive year of much lower opium cultivation and production is welcome news. The major decrease in Helmand demonstrates that progress is possible, even under the toughest conditions. Does this biennium represent a market correction, or a downward trend? It is too early to tell, but progress very much depends on improved security. Like never before, the fates of counter-narcotics and counter-insurgency are inextricably linked. So much has been invested to contain the drug economy in Afghanistan, that it would be an historical error to allow this undeniable progress to be undermined not in the opium fields of poor farmers, but in the killing fields of suicide bombers.
Antonio Maria Costa Executive Director
United Nations Office on Drugs and Crime
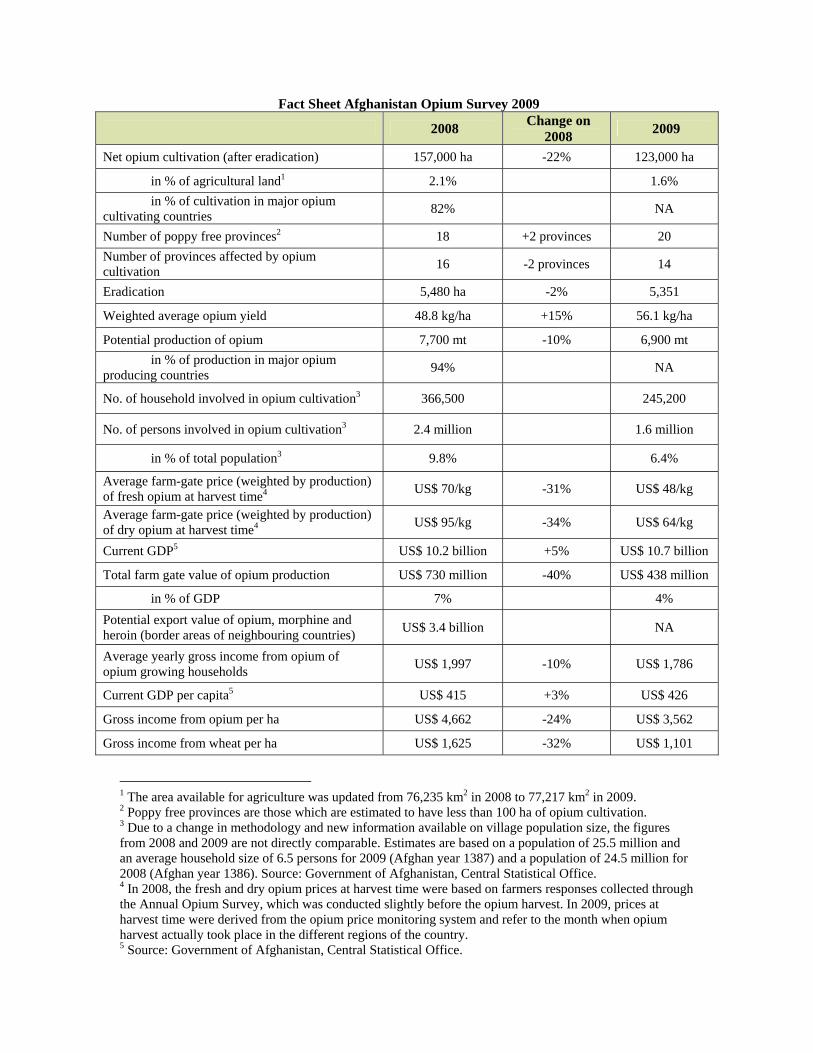
Fact Sheet Afghanistan Opium Survey 2009
2008 Change on 2008 2009
Net opium cultivation (after eradication) 157,000 ha -22% 123,000 ha
in % of agricultural land1 2.1% 1.6% in % of cultivation in major opium cultivating countries 82% NA
Number of poppy free provinces2 18 +2 provinces 20 Number of provinces affected by opium cultivation 16 -2 provinces 14
Eradication 5,480 ha -2% 5,351
Weighted average opium yield 48.8 kg/ha +15% 56.1 kg/ha
Potential production of opium 7,700 mt -10% 6,900 mt in % of production in major opium producing countries 94% NA
No. of household involved in opium cultivation3 366,500 245,200
No. of persons involved in opium cultivation3 2.4 million 1.6 million
in % of total population3 9.8% 6.4%
Average farm-gate price (weighted by production) of fresh opium at harvest time4 US$ 70/kg -31% US$ 48/kg
Average farm-gate price (weighted by production) of dry opium at harvest time4 US$ 95/kg -34% US$ 64/kg
Current GDP5 US$ 10.2 billion +5% US$ 10.7 billion
Total farm gate value of opium production US$ 730 million -40% US$ 438 million
in % of GDP 7% 4% Potential export value of opium, morphine and heroin (border areas of neighbouring countries) US$ 3.4 billion NA
Average yearly gross income from opium of opium growing households US$ 1,997 -10% US$ 1,786
Current GDP per capita5 US$ 415 +3% US$ 426
Gross income from opium per ha US$ 4,662 -24% US$ 3,562
Gross income from wheat per ha US$ 1,625 -32% US$ 1,101
1 The area available for agriculture was updated from 76,235 km2 in 2008 to 77,217 km2 in 2009. 2 Poppy free provinces are those which are estimated to have less than 100 ha of opium cultivation. 3 Due to a change in methodology and new information available on village population size, the figures from 2008 and 2009 are not directly comparable. Estimates are based on a population of 25.5 million and an average household size of 6.5 persons for 2009 (Afghan year 1387) and a population of 24.5 million for 2008 (Afghan year 1386). Source: Government of Afghanistan, Central Statistical Office. 4 In 2008, the fresh and dry opium prices at harvest time were based on farmers responses collected through the Annual Opium Survey, which was conducted slightly before the opium harvest. In 2009, prices at harvest time were derived from the opium price monitoring system and refer to the month when opium harvest actually took place in the different regions of the country. 5 Source: Government of Afghanistan, Central Statistical Office.

1
SUMMARY FINDINGS
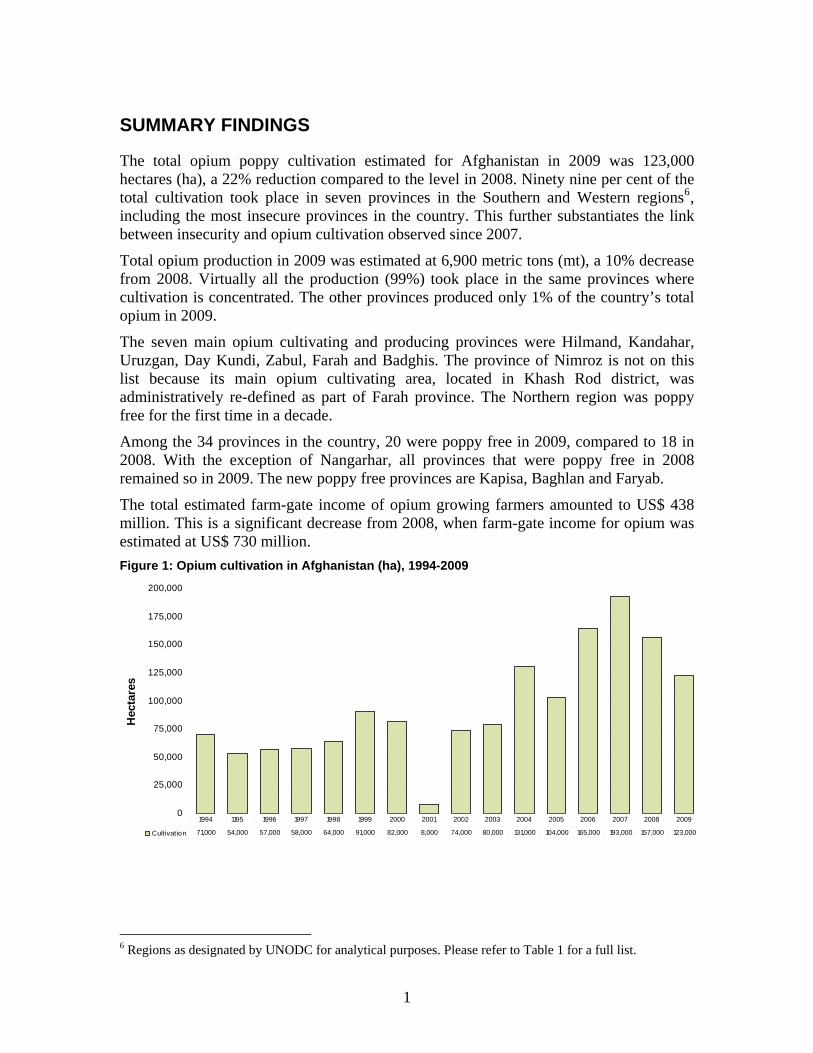
The total opium poppy cultivation estimated for Afghanistan in 2009 was 123,000 hectares (ha), a 22% reduction compared to the level in 2008. Ninety nine per cent of the total cultivation took place in seven provinces in the Southern and Western regions6, including the most insecure provinces in the country. This further substantiates the link between insecurity and opium cultivation observed since 2007.
Total opium production in 2009 was estimated at 6,900 metric tons (mt), a 10% decrease from 2008. Virtually all the production (99%) took place in the same provinces where cultivation is concentrated. The other provinces produced only 1% of the country’s total opium in 2009.
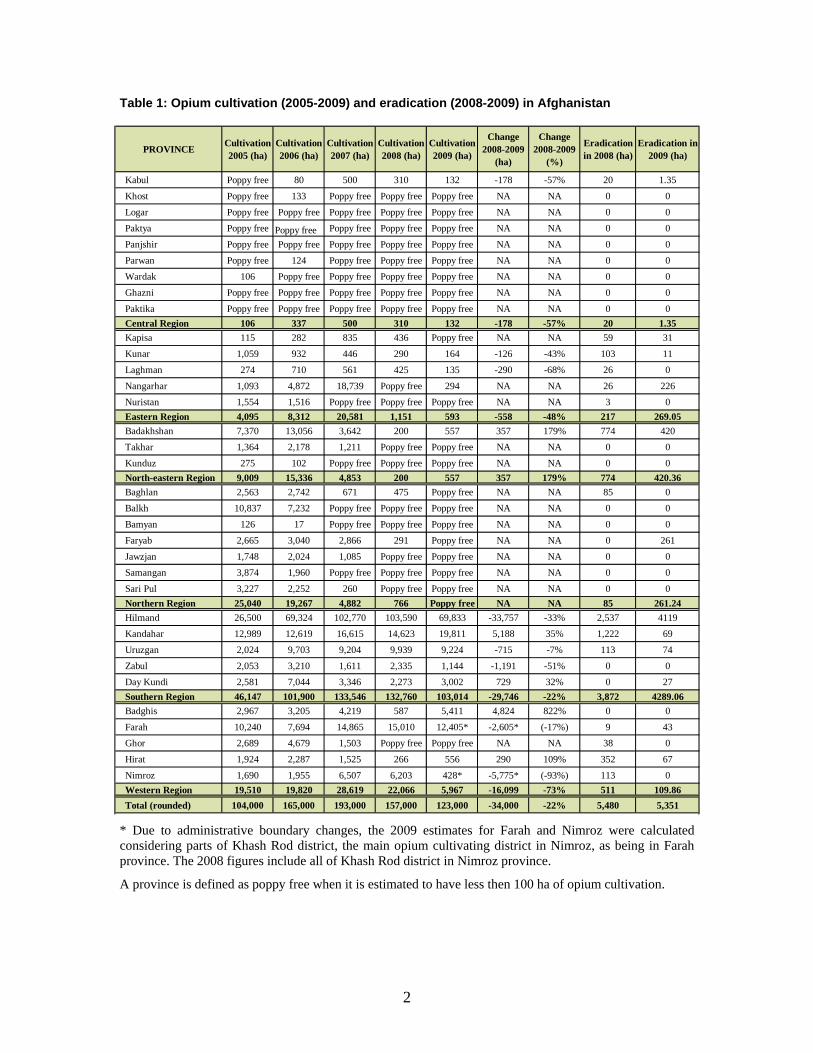
The seven main opium cultivating and producing provinces were Hilmand, Kandahar, Uruzgan, Day Kundi, Zabul, Farah and Badghis. The province of Nimroz is not on this list because its main opium cultivating area, located in Khash Rod district, was administratively re-defined as part of Farah province. The Northern region was poppy free for the first time in a decade.
Among the 34 provinces in the country, 20 were poppy free in 2009, compared to 18 in 2008. With the exception of Nangarhar, all provinces that were poppy free in 2008 remained so in 2009. The new poppy free provinces are Kapisa, Baghlan and Faryab.
The total estimated farm-gate income of opium growing farmers amounted to US$ 438 million. This is a significant decrease from 2008, when farm-gate income for opium was estimated at US$ 730 million. Figure 1: Opium cultivation in Afghanistan (ha), 1994-2009
0
25,000
50,000
75,000
100,000
125,000
150,000
175,000
200,000
Hec
tare
s
Cultivation 71,000 54,000 57,000 58,000 64,000 91,000 82,000 8,000 74,000 80,000 131,000 104,000 165,000 193,000 157,000 123,000
1994 1195 1996 1997 1998 1999 2000 2001 2002 2003 2004 2005 2006 2007 2008 2009
6 Regions as designated by UNODC for analytical purposes. Please refer to Table 1 for a full list.
2
Table 1: Opium cultivation (2005-2009) and eradication (2008-2009) in Afghanistan
PROVINCE Cultivation 2005 (ha)
Cultivation 2006 (ha)
Cultivation 2007 (ha)
Cultivation 2008 (ha)
Cultivation 2009 (ha)
Change 2008-2009
(ha)
Change 2008-2009
(%)
Eradication in 2008 (ha)
Eradication in 2009 (ha)
Kabul Poppy free 80 500 310 132 -178 -57% 20 1.35
Khost Poppy free 133 Poppy free Poppy free Poppy free NA NA 0 0
Logar Poppy free Poppy free Poppy free Poppy free Poppy free NA NA 0 0Paktya Poppy free Poppy free Poppy free Poppy free Poppy free NA NA 0 0
Panjshir Poppy free Poppy free Poppy free Poppy free Poppy free NA NA 0 0
Parwan Poppy free 124 Poppy free Poppy free Poppy free NA NA 0 0Wardak 106 Poppy free Poppy free Poppy free Poppy free NA NA 0 0
Ghazni Poppy free Poppy free Poppy free Poppy free Poppy free NA NA 0 0
Paktika Poppy free Poppy free Poppy free Poppy free Poppy free NA NA 0 0Central Region 106 337 500 310 132 -178 -57% 20 1.35Kapisa 115 282 835 436 Poppy free NA NA 59 31
Kunar 1,059 932 446 290 164 -126 -43% 103 11
Laghman 274 710 561 425 135 -290 -68% 26 0
Nangarhar 1,093 4,872 18,739 Poppy free 294 NA NA 26 226Nuristan 1,554 1,516 Poppy free Poppy free Poppy free NA NA 3 0Eastern Region 4,095 8,312 20,581 1,151 593 -558 -48% 217 269.05Badakhshan 7,370 13,056 3,642 200 557 357 179% 774 420Takhar 1,364 2,178 1,211 Poppy free Poppy free NA NA 0 0
Kunduz 275 102 Poppy free Poppy free Poppy free NA NA 0 0North-eastern Region 9,009 15,336 4,853 200 557 357 179% 774 420.36Baghlan 2,563 2,742 671 475 Poppy free NA NA 85 0Balkh 10,837 7,232 Poppy free Poppy free Poppy free NA NA 0 0
Bamyan 126 17 Poppy free Poppy free Poppy free NA NA 0 0
Faryab 2,665 3,040 2,866 291 Poppy free NA NA 0 261
Jawzjan 1,748 2,024 1,085 Poppy free Poppy free NA NA 0 0Samangan 3,874 1,960 Poppy free Poppy free Poppy free NA NA 0 0
Sari Pul 3,227 2,252 260 Poppy free Poppy free NA NA 0 0Northern Region 25,040 19,267 4,882 766 Poppy free NA NA 85 261.24Hilmand 26,500 69,324 102,770 103,590 69,833 -33,757 -33% 2,537 4119Kandahar 12,989 12,619 16,615 14,623 19,811 5,188 35% 1,222 69
Uruzgan 2,024 9,703 9,204 9,939 9,224 -715 -7% 113 74
Zabul 2,053 3,210 1,611 2,335 1,144 -1,191 -51% 0 0Day Kundi 2,581 7,044 3,346 2,273 3,002 729 32% 0 27Southern Region 46,147 101,900 133,546 132,760 103,014 -29,746 -22% 3,872 4289.06Badghis 2,967 3,205 4,219 587 5,411 4,824 822% 0 0
Farah 10,240 7,694 14,865 15,010 12,405* -2,605* (-17%) 9 43Ghor 2,689 4,679 1,503 Poppy free Poppy free NA NA 38 0
Hirat 1,924 2,287 1,525 266 556 290 109% 352 67
Nimroz 1,690 1,955 6,507 6,203 428* -5,775* (-93%) 113 0Western Region 19,510 19,820 28,619 22,066 5,967 -16,099 -73% 511 109.86Total (rounded) 104,000 165,000 193,000 157,000 123,000 -34,000 -22% 5,480 5,351
* Due to administrative boundary changes, the 2009 estimates for Farah and Nimroz were calculated considering parts of Khash Rod district, the main opium cultivating district in Nimroz, as being in Farah province. The 2008 figures include all of Khash Rod district in Nimroz province.
A province is defined as poppy free when it is estimated to have less then 100 ha of opium cultivation.

3
Opium cultivation decreases by 22% in 2009
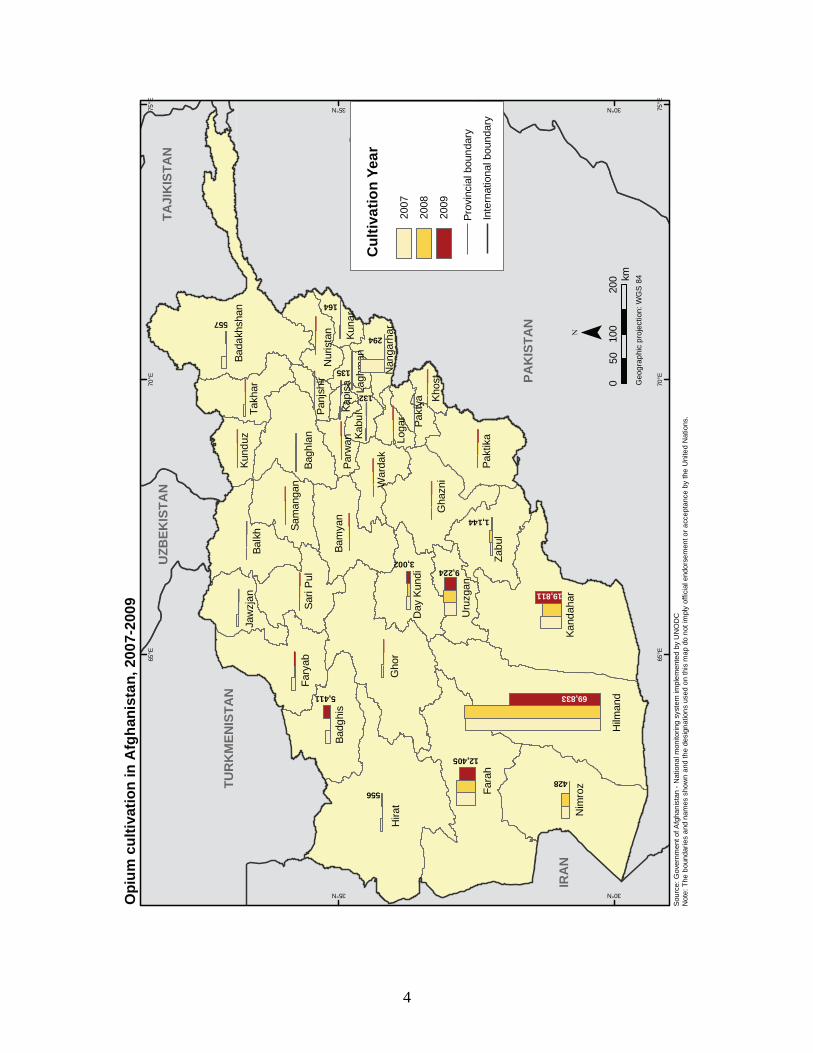
The area under opium cultivation in Afghanistan decreased by 22% in 2009, from 157,000 ha in 2008 to 123,000 ha, 99% of which was concentrated in the Southern and Western regions. Opium poppy cultivation decreased in all regions except the North-eastern region, where in any case very little cultivation remained.
The regional divide of opium cultivation between the south and rest of the country continued to deepen in 2009. Most of the opium cultivation is confined to the south and west, which are dominated by insurgency and organized criminal networks. This mirrors the sharper polarization of the security situation between the lawless south and relatively stable north of the country.
The major differences between opium cultivation patterns in 2009 compared to 2008 were a drastic decrease in cultivation in Hilmand province, which contributed the bulk of the overall decrease; a significant increase in opium cultivation in Badghis and Kandahar provinces; and mixed signals from the Eastern region, where Kapisa became poppy free for the first time. Nangarhar, however, could not retain the poppy free status it had achieved in 2008, but the level of opium cultivation remained low.
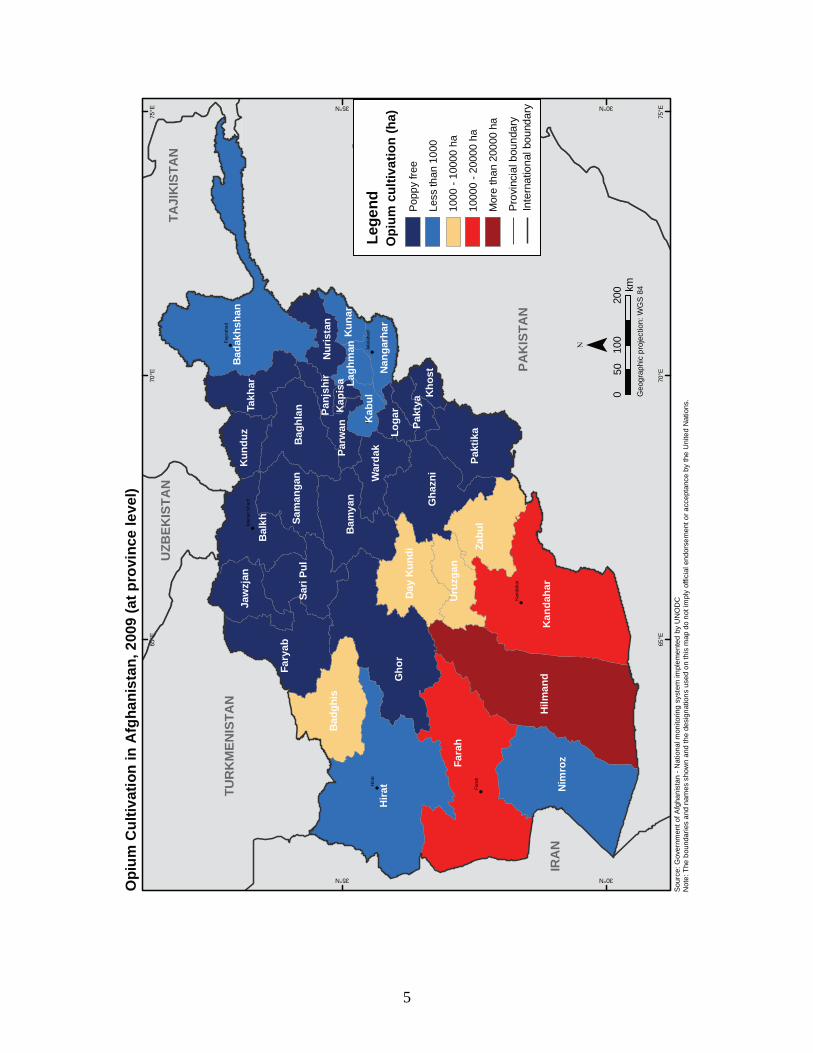
Number of poppy free provinces increases to 20 in 2009
The number of poppy free provinces7 increased to 20 in 2009, compared to 18 in 2008 and 13 in 2007. Kapisa (Eastern region), Baghlan and Faryab (both Northern region) provinces became poppy free for the first time.
Table 2: Provinces with poppy free status in 2009 (<100 ha poppy cultivation)
Region Province Central region Ghazni, Khost, Logar, Paktika, Paktya, Panjshir, Parwan, Wardak, Kapisa* Northern region Balkh, Bamyan, Jawzjan, Samangan, Sari Pul, Faryab*, Baghlan* North-Eastern region Kunduz, Takhar Eastern region Nuristan Western region Ghor
* Provinces which were not poppy free in 2008 but became poppy free in 2009.
Almost all provinces free of poppy in 2008 remained poppy free in 2009, with exception of Nangarhar. Campaigns against poppy cultivation and effective law enforcement by the Government contributed to maintaining the provinces’ poppy free status. Efforts were made in the remaining poppy cultivating provinces in the Eastern (Kunar, Laghman, Nangarhar), Central (Kabul) and Northern regions (Badakhshan) to considerably reduce cultivation, but despite the low levels remaining in 2009, they did not drop under the 100 ha poppy free threshold.
7 A province is defined as poppy free when it is estimated to have less then 100 ha of opium cultivation.
4
Hira
t
Fara
h
Nim
roz
Hilm
and
Kand
ahar
Zabu
lPa
ktik
a
Gha
zni
Uru
zgan
Gho
r
Badg
his
Fary
ab
Jaw
zjan
Sari
Pul
Balk
h Sam
anga
n
Kund
uzTa
khar
Bada
khsh
an
Nur
ista
n Kuna
rLa
ghm
anKa
pisa
Parw
an
Bagh
lan
Bam
yan
War
dak
Loga
r Pakt
ya Khos
tNan
garh
ar
Panj
shir
Day
Kun
di
Kabu
l
13275
°E
75°E
70°E
70°E
65°E
65°E
35°N
35°N
30°N
30°N
Opi
umcu
ltiva
tion
inA
fgha
nist
an,2
007-
2009
TUR
KM
ENIS
TAN
IRA
N
PAK
ISTA
N
TAJI
KIS
TAN
UZB
EKIS
TAN
Sour
ce:G
over
nmen
tofA
fgha
nist
an-N
atio
nalm
onito
ring
syst
emim
plem
ente
dby
UN
OD
CN
ote:
The
boun
darie
san
dna
mes
show
nan
dth
ede
sign
atio
nsus
edon
this
map
dono
tim
ply
offic
iale
ndor
sem
ento
racc
epta
nce
byth
eU
nite
dN
atio
ns.
Geo
grap
hic
proj
ectio
n:W
GS
84
020
010
0km
50
69,833
19,811
428
12,405
556
5,411
9,224
1,144
557
3,002
294
164
135
Cul
tivat
ion
Year
2007
2008
2009
Prov
inci
albo
unda
ry
Inte
rnat
iona
lbou
ndar
y
5
Hira
t
Fara
h
Gho
r
Hilm
and
Nim
roz
Kan
daha
r
Bad
akhs
han
Bal
kh
Gha
zni
Zabu
l
Fary
ab
Pakt
ika
Bad
ghis
Bag
hlan
Bam
yan
Sari
Pul
Takh
ar
Day
Kun
di
Jaw
zjan
Uru
zgan
War
dak
Nur
ista
n
Kun
duz
Sam
anga
n
Kun
ar
Loga
r
Pakt
ya
Kab
ul
Parw
an
Kho
stNan
garh
ar
Panj
shir La
ghm
anK
apis
a
Fara
h
Hira
t
Kand
ahar
Fayz
abad
Jala
laba
d
Maz
ariS
harif
75°E
75°E
70°E
70°E
65°E
65°E
35°N
35°N
30°N
30°N
TUR
KM
ENIS
TAN
IRA
N
PAK
ISTA
N
TAJI
KIS
TAN
UZB
EKIS
TAN
020
010
0
Sour
ce:G
over
nmen
tofA
fgha
nist
an-N
atio
nalm
onito
ring
syst
emim
plem
ente
dby
UN
OD
CN
ote:
The
boun
darie
san
dna
mes
show
nan
dth
ede
sign
atio
nsus
edon
this
map
dono
tim
ply
offic
iale
ndor
sem
ento
racc
epta
nce
byth
eU
nite
dN
atio
ns.G
eogr
aphi
cpr
ojec
tion:
WG
S84km
50
Opi
umC
ultiv
atio
n in
Afg
hani
stan
, 200
9 (a
t pro
vinc
e le
vel)
Lege
ndO
pium
cul
tivat
ion
(ha)
Prov
inci
albo
unda
ryIn
tern
atio
nalb
ound
ary
Popp
yfre
e
Less
than
1000
1000
0-2
0000
ha
Mor
eth
an20
000
ha
1000
-100
00ha
6
All provinces of the Northern region are poppy free for the first time in almost a decade
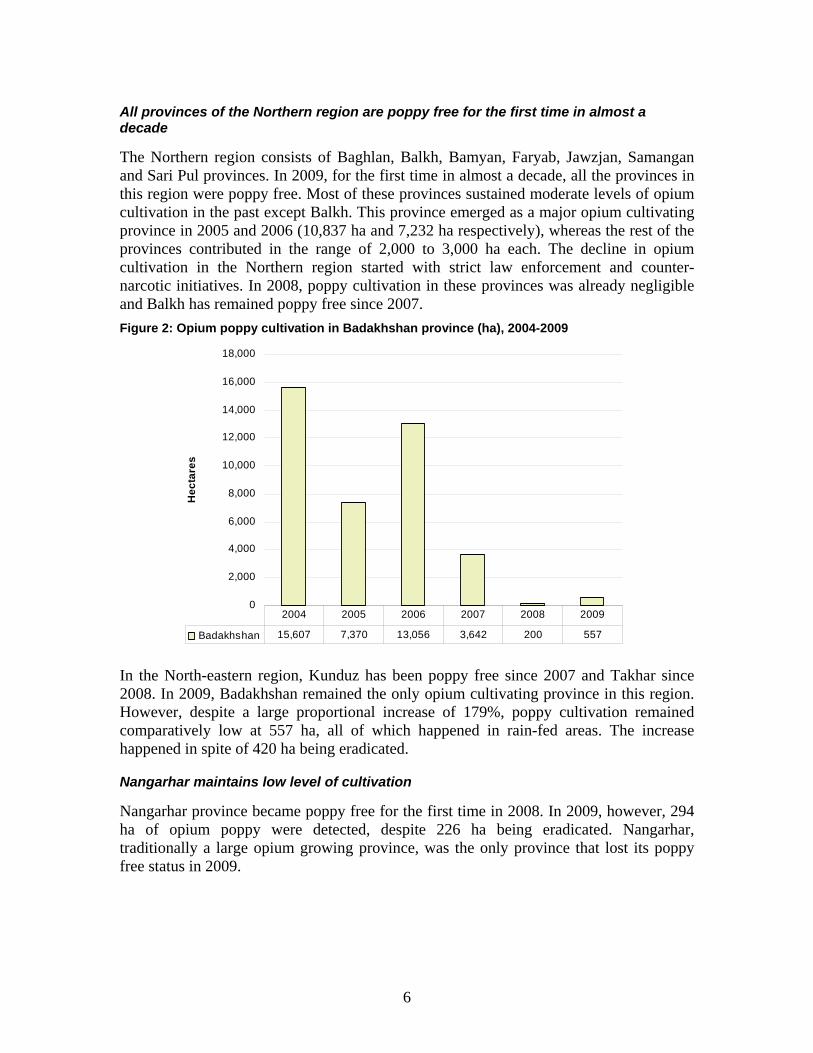
The Northern region consists of Baghlan, Balkh, Bamyan, Faryab, Jawzjan, Samangan and Sari Pul provinces. In 2009, for the first time in almost a decade, all the provinces in this region were poppy free. Most of these provinces sustained moderate levels of opium cultivation in the past except Balkh. This province emerged as a major opium cultivating province in 2005 and 2006 (10,837 ha and 7,232 ha respectively), whereas the rest of the provinces contributed in the range of 2,000 to 3,000 ha each. The decline in opium cultivation in the Northern region started with strict law enforcement and counter-narcotic initiatives. In 2008, poppy cultivation in these provinces was already negligible and Balkh has remained poppy free since 2007. Figure 2: Opium poppy cultivation in Badakhshan province (ha), 2004-2009
0
2,000
4,000
6,000
8,000
10,000
12,000
14,000
16,000
18,000
Hec
tare
s
Badakhshan 15,607 7,370 13,056 3,642 200 557
2004 2005 2006 2007 2008 2009
In the North-eastern region, Kunduz has been poppy free since 2007 and Takhar since 2008. In 2009, Badakhshan remained the only opium cultivating province in this region. However, despite a large proportional increase of 179%, poppy cultivation remained comparatively low at 557 ha, all of which happened in rain-fed areas. The increase happened in spite of 420 ha being eradicated.
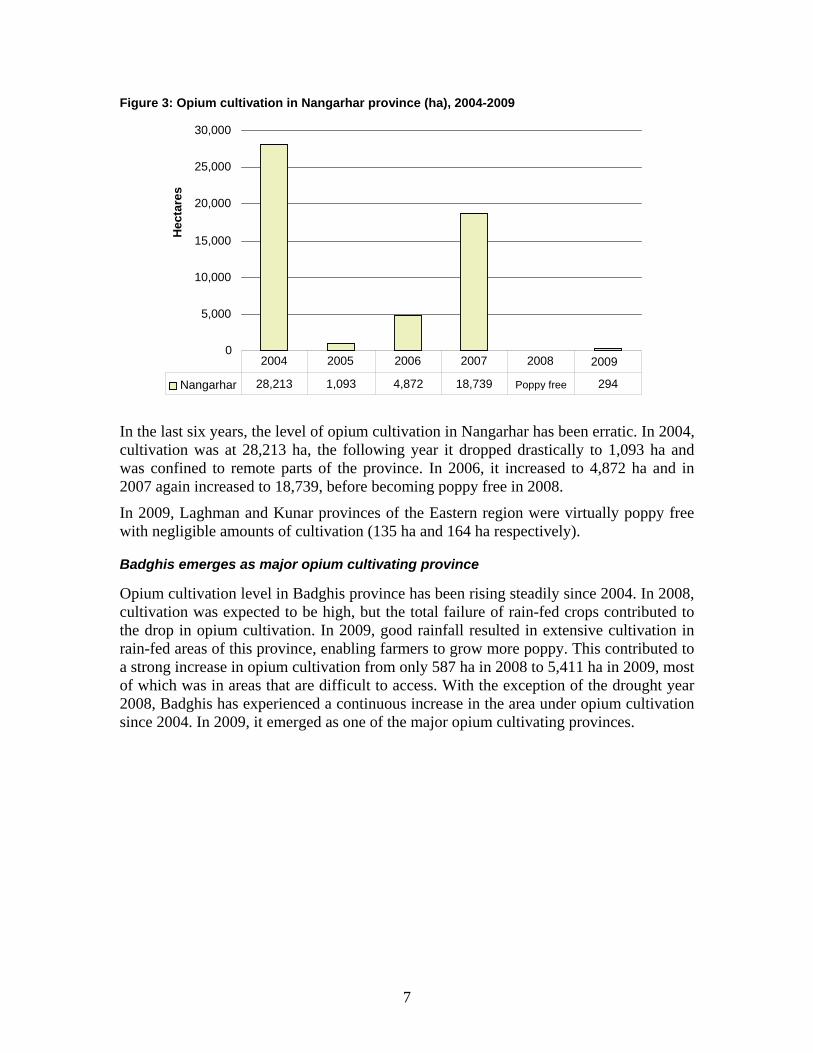
Nangarhar maintains low level of cultivation
Nangarhar province became poppy free for the first time in 2008. In 2009, however, 294 ha of opium poppy were detected, despite 226 ha being eradicated. Nangarhar, traditionally a large opium growing province, was the only province that lost its poppy free status in 2009.
7
Figure 3: Opium cultivation in Nangarhar province (ha), 2004-2009
In the last six years, the level of opium cultivation in Nangarhar has been erratic. In 2004, cultivation was at 28,213 ha, the following year it dropped drastically to 1,093 ha and was confined to remote parts of the province. In 2006, it increased to 4,872 ha and in 2007 again increased to 18,739, before becoming poppy free in 2008.
In 2009, Laghman and Kunar provinces of the Eastern region were virtually poppy free with negligible amounts of cultivation (135 ha and 164 ha respectively).
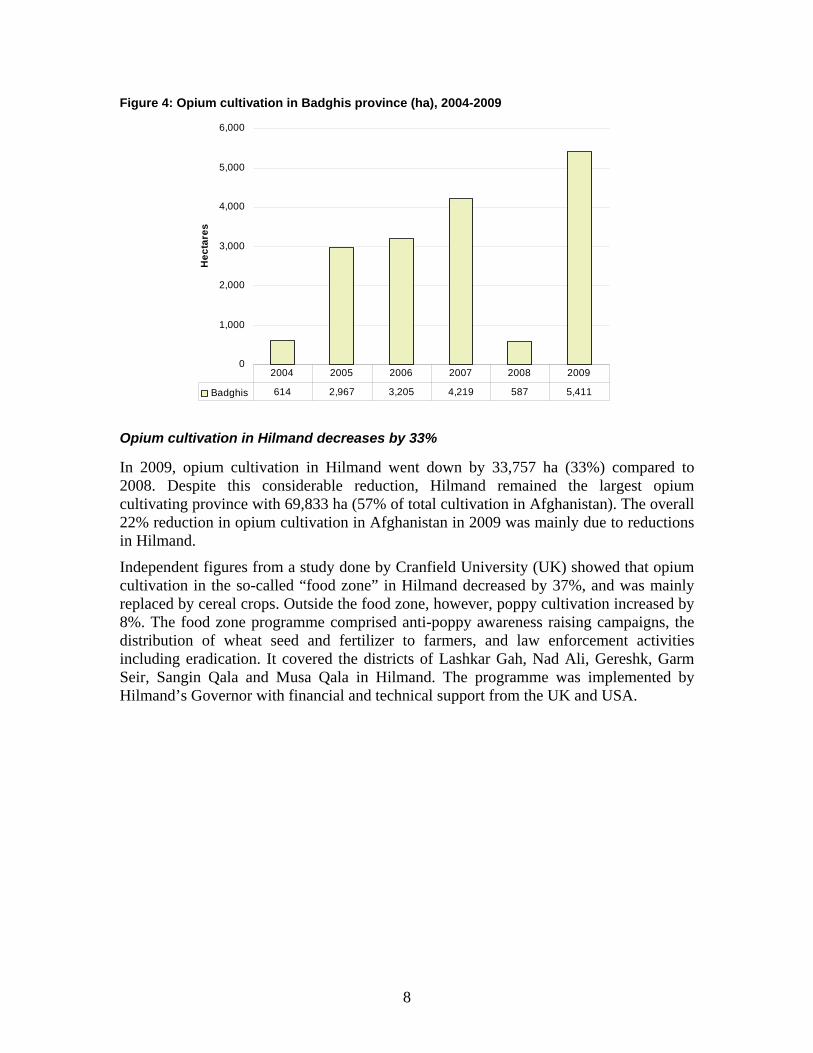
Badghis emerges as major opium cultivating province
Opium cultivation level in Badghis province has been rising steadily since 2004. In 2008, cultivation was expected to be high, but the total failure of rain-fed crops contributed to the drop in opium cultivation. In 2009, good rainfall resulted in extensive cultivation in rain-fed areas of this province, enabling farmers to grow more poppy. This contributed to a strong increase in opium cultivation from only 587 ha in 2008 to 5,411 ha in 2009, most of which was in areas that are difficult to access. With the exception of the drought year 2008, Badghis has experienced a continuous increase in the area under opium cultivation since 2004. In 2009, it emerged as one of the major opium cultivating provinces.
0
5,000
10,000
15,000
20,000
25,000
30,000
Hec
tare
s
Nangarhar 28,213 1,093 4,872 18,739 Poppy free 294 2004 2005 2006 2007 2008 2009
8
Figure 4: Opium cultivation in Badghis province (ha), 2004-2009
0
1,000
2,000
3,000
4,000
5,000
6,000
Hec
tare
s
Badghis 614 2,967 3,205 4,219 587 5,411
2004 2005 2006 2007 2008 2009
Opium cultivation in Hilmand decreases by 33%
In 2009, opium cultivation in Hilmand went down by 33,757 ha (33%) compared to 2008. Despite this considerable reduction, Hilmand remained the largest opium cultivating province with 69,833 ha (57% of total cultivation in Afghanistan). The overall 22% reduction in opium cultivation in Afghanistan in 2009 was mainly due to reductions in Hilmand.
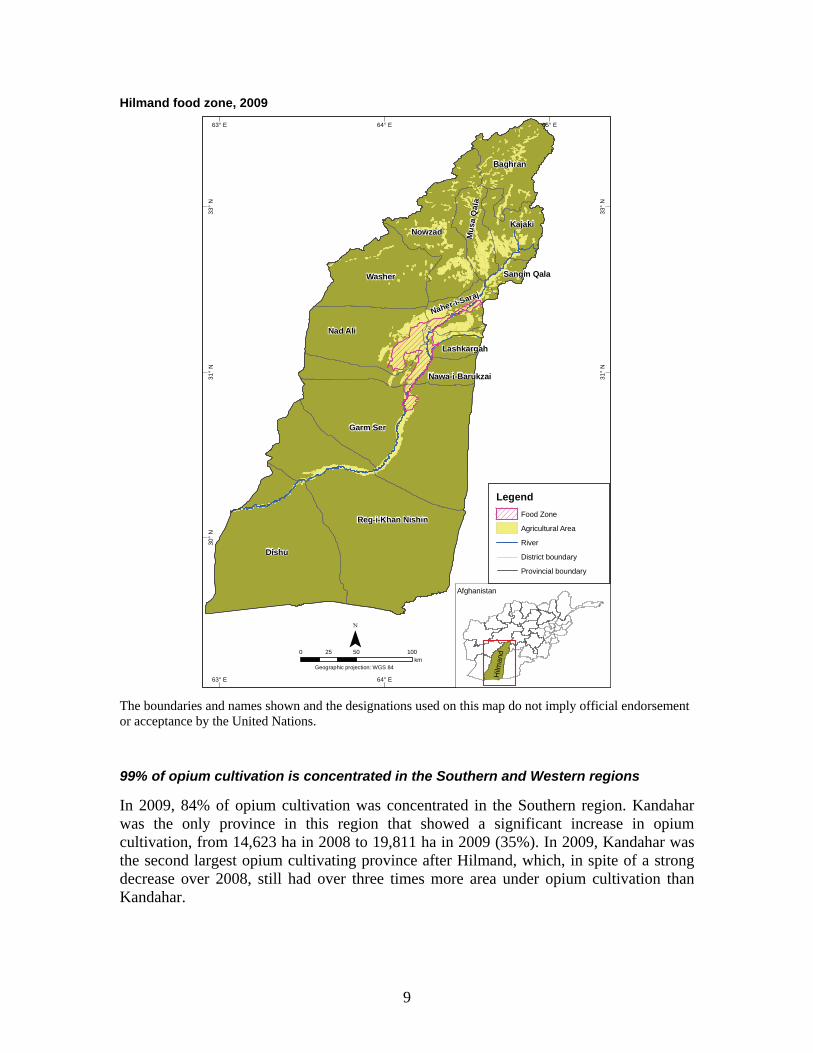
Independent figures from a study done by Cranfield University (UK) showed that opium cultivation in the so-called “food zone” in Hilmand decreased by 37%, and was mainly replaced by cereal crops. Outside the food zone, however, poppy cultivation increased by 8%. The food zone programme comprised anti-poppy awareness raising campaigns, the distribution of wheat seed and fertilizer to farmers, and law enforcement activities including eradication. It covered the districts of Lashkar Gah, Nad Ali, Gereshk, Garm Seir, Sangin Qala and Musa Qala in Hilmand. The programme was implemented by Hilmand’s Governor with financial and technical support from the UK and USA.
9
Hilmand food zone, 2009
Dishu
Garm Ser
Reg-i-Khan Nishin
Nad Ali
Washer
Nowzad
Baghran
Kajaki
Nawa-i-Barukzai
Naher-i-Saraj
Mus
aQ
ala
Sangin Qala
Lashkargah
65° E
65° E
64° E
64° E
63° E
63° E
33°
N
33°
N
31°
N
31°
N
30°
N
30°
N
Afghanistan
Hilm
and0 50 10025
kmGeographic projection: WGS 84
LegendFood Zone
District boundary
Provincial boundary
River
Agricultural Area
The boundaries and names shown and the designations used on this map do not imply official endorsement or acceptance by the United Nations.
99% of opium cultivation is concentrated in the Southern and Western regions
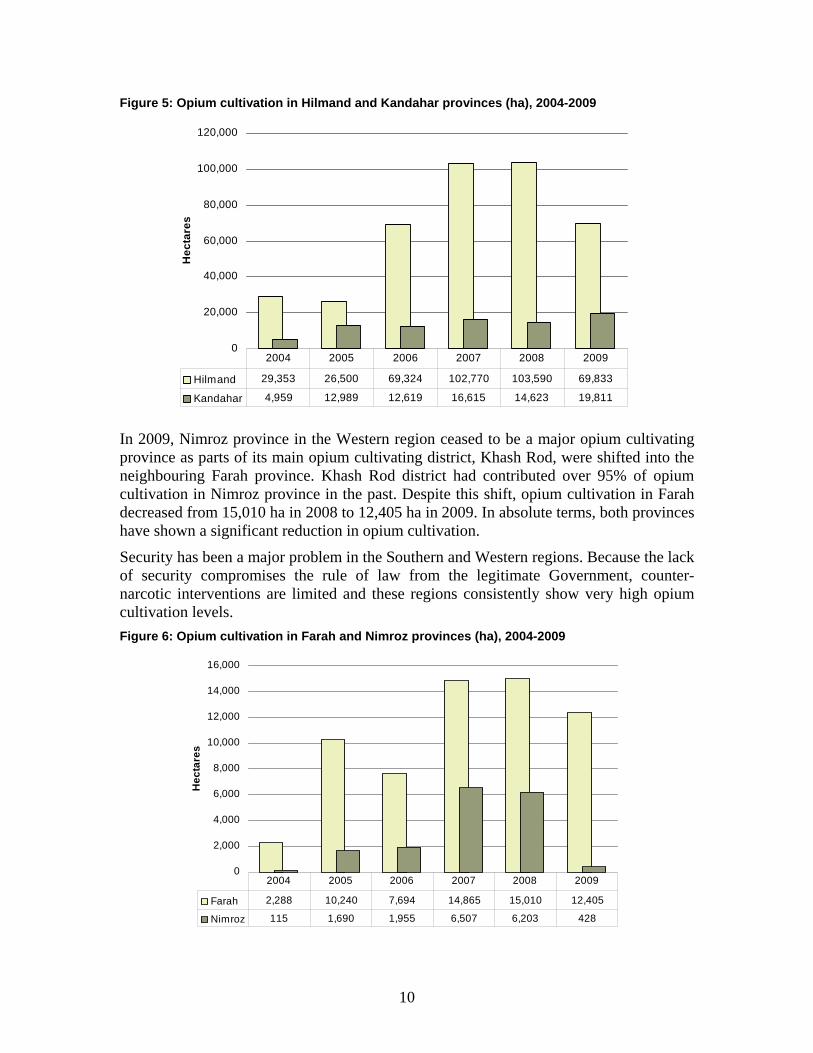
In 2009, 84% of opium cultivation was concentrated in the Southern region. Kandahar was the only province in this region that showed a significant increase in opium cultivation, from 14,623 ha in 2008 to 19,811 ha in 2009 (35%). In 2009, Kandahar was the second largest opium cultivating province after Hilmand, which, in spite of a strong decrease over 2008, still had over three times more area under opium cultivation than Kandahar.
10
Figure 5: Opium cultivation in Hilmand and Kandahar provinces (ha), 2004-2009
0
20,000
40,000
60,000
80,000
100,000
120,000
Hec
tare
s
Hilmand 29,353 26,500 69,324 102,770 103,590 69,833
Kandahar 4,959 12,989 12,619 16,615 14,623 19,811
2004 2005 2006 2007 2008 2009
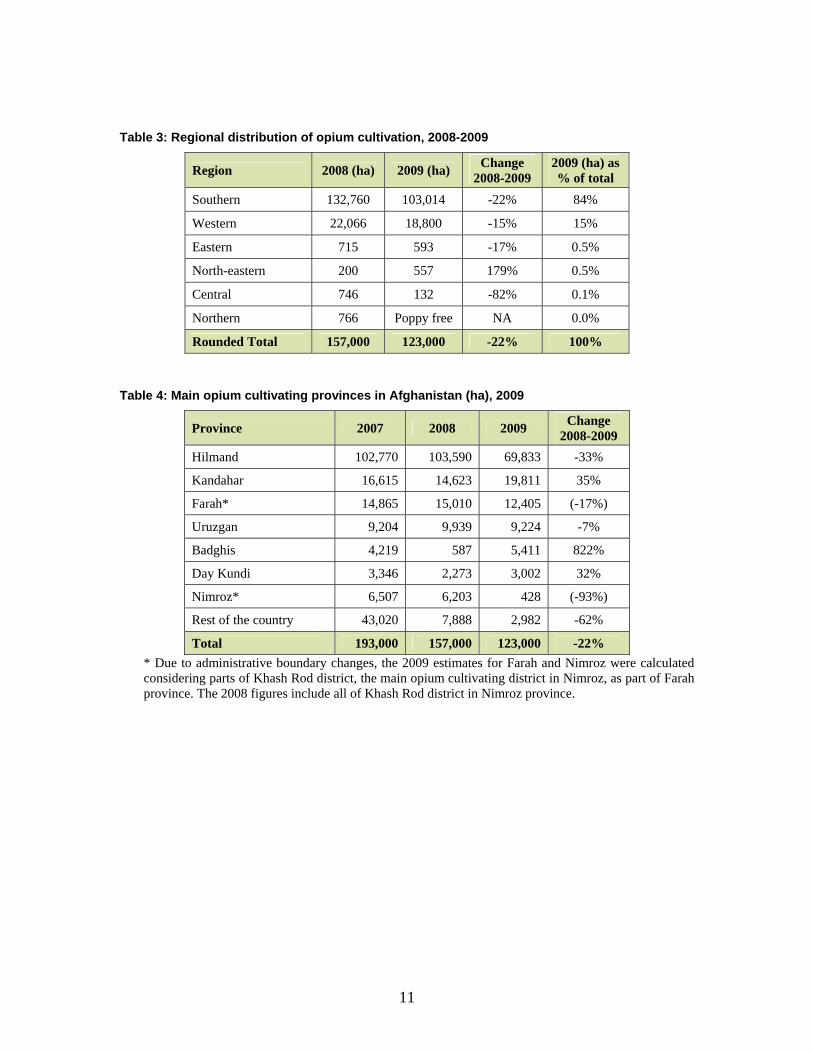
In 2009, Nimroz province in the Western region ceased to be a major opium cultivating province as parts of its main opium cultivating district, Khash Rod, were shifted into the neighbouring Farah province. Khash Rod district had contributed over 95% of opium cultivation in Nimroz province in the past. Despite this shift, opium cultivation in Farah decreased from 15,010 ha in 2008 to 12,405 ha in 2009. In absolute terms, both provinces have shown a significant reduction in opium cultivation.
Security has been a major problem in the Southern and Western regions. Because the lack of security compromises the rule of law from the legitimate Government, counter-narcotic interventions are limited and these regions consistently show very high opium cultivation levels. Figure 6: Opium cultivation in Farah and Nimroz provinces (ha), 2004-2009
0
2,000
4,000
6,000
8,000
10,000
12,000
14,000
16,000
Hec
tare
s
Farah 2,288 10,240 7,694 14,865 15,010 12,405
Nimroz 115 1,690 1,955 6,507 6,203 428
2004 2005 2006 2007 2008 2009
11
Table 3: Regional distribution of opium cultivation, 2008-2009
Region 2008 (ha) 2009 (ha) Change 2008-2009
2009 (ha) as % of total
Southern 132,760 103,014 -22% 84%
Western 22,066 18,800 -15% 15%
Eastern 715 593 -17% 0.5%
North-eastern 200 557 179% 0.5%
Central 746 132 -82% 0.1%
Northern 766 Poppy free NA 0.0%
Rounded Total 157,000 123,000 -22% 100%
Table 4: Main opium cultivating provinces in Afghanistan (ha), 2009
Province 2007 2008 2009 Change 2008-2009
Hilmand 102,770 103,590 69,833 -33%
Kandahar 16,615 14,623 19,811 35%
Farah* 14,865 15,010 12,405 (-17%)
Uruzgan 9,204 9,939 9,224 -7%
Badghis 4,219 587 5,411 822%
Day Kundi 3,346 2,273 3,002 32%
Nimroz* 6,507 6,203 428 (-93%)
Rest of the country 43,020 7,888 2,982 -62%
Total 193,000 157,000 123,000 -22% * Due to administrative boundary changes, the 2009 estimates for Farah and Nimroz were calculated considering parts of Khash Rod district, the main opium cultivating district in Nimroz, as part of Farah province. The 2008 figures include all of Khash Rod district in Nimroz province.

12
Figure 7: Airborne collection of ground reference information over Hilmand, 2009
False colour satellite image of the same area acquired on 11 April 2009 showing poppy and wheat fields in different shades of red.
13
Potential opium production in Afghanistan declines to 6,900 mt in 2009
The average yield (weighted by production) for Afghanistan in 2009 was 56.1 kg/ha, compared to 48.8 kg/ha in 2008. Overall, weather conditions were favorable for agricultural crops in 2009 and there were no reports of damages caused by unfavorable weather, diseases or pests. As a consequence, potential opium production decreased by only 10% to 6,900 mt, despite opium cultivation dropping by 22%.
In the last two years, unusually high opium yields have been estimated for Afghanistan. This is the result of many different factors, among which are good climatic conditions, low levels of plant diseases and pests, and the shift of the opium cultivation to the fertile southern lowlands where irrigation and improved farming techniques are more widespread than in other parts of the country. Opium yield is estimated using a correlation between poppy capsule sizes (volumes) and numbers on the one hand and the harvested opium gum on the other. This correlation was established in scientific harvest trials in Thailand, Pakistan and Afghanistan in the 1990s and early 2000s. However, the capsule sizes and numbers observed in recent years in Afghanistan, mainly in the Southern region, are much higher than those observed during these trials and exceed the range of values for which the correlation was established. It is uncertain how opium yield and capsule size and numbers correlate when these numbers are as high as those observed in Afghanistan during the last two years. Further research into opium yield is therefore necessary. The findings of this research may well lead to a revision of opium yield estimates in Afghanistan.
Table 5: Average opium yield by region in Afghanistan, 2008-2009
Region 2008 Average yield (kg/ha)
2009 Average yield (kg/ha) Change
Central (Parwan, Paktya, Wardak, Khost, Kabul, Logar, Ghazni, Paktika, Panjshir) 36.2 NA* NA
Eastern (Nangarhar, Kunar, Laghman, Nuristan, Kapisa) 39.3 36.2 -8%
North-east (Badakhshan, Takhar, Kunduz) 31.4 34.3 9%
Northern (Bamyan, Jawzjan, Sari Pul, Baghlan, Faryab, Balkh, Samangan) 54.6 NA* NA
Southern (Hilmand, Uruzgan, Kandahar, Zabul, Day Kundi) 52.1 58.5 12%
Western (Ghor, Hirat, Farah, Nimroz, Badghis) 29.7 43.9 48%
Weighted national average 48.8 56.1 15%
* For the Central region, no regional yield figure was calculated due to a low number of yield measurements in this region. The Northern region was poppy free.
14
Uru
zgan
Panj
shir
19
Hira
t
Fara
h
Hilm
and
Gho
r
Nim
roz
Kand
ahar
Bada
khsh
an
Day
Kun
di
Gha
zni
Balk
h
Zabu
l
Fary
abBa
dghi
s
Pakt
ika
Bagh
lan
Sari
Pul
Bam
yan
Takh
arJa
wzj
an
Parw
an
War
dak
Sam
anga
n
Kund
uz
Nur
ista
nKu
nar
Kabu
l
Nan
garh
ar
Khos
t
Pakt
ya
Loga
r
Lagh
man
Kapi
sa
Fara
h
Hira
tKa
bul
Kand
ahar
Fayz
abad
Jala
laba
d
Maz
ariS
harif
75°E
75°E
70°E
70°E
65°E
65°E
35°N
35°N
30°N
30°N
Opi
umpr
oduc
tion
inA
fgha
nist
anby
prov
ince
(mt),
2009
TUR
KM
ENIS
TAN
IRA
NPA
KIS
TAN
TAJI
KIS
TAN
UZB
EKIS
TAN
Sour
ce:G
over
nmen
tofA
fgha
nist
an-N
atio
nalm
onito
ring
syst
emim
plem
ente
dby
UN
OD
CN
ote:
The
boun
darie
san
dna
mes
show
nan
dth
ede
sign
atio
nsus
edon
this
map
dono
tim
ply
offic
iale
ndor
sem
ento
racc
epta
nce
byth
eU
nite
dN
atio
ns.
Geo
grap
hic
proj
ectio
n:W
GS
84
020
010
0km
50
4,08
5
19545
24
176
540
67
1,15
9
238
56
11N
/AM
ain
city
Prov
inci
albo
unda
ryIn
tern
atio
nalb
ound
ary
Lege
nd
Opi
umpr
oduc
tion
(met
ricto
n)1,
000
15
IRA
NIR
AN
PAK
ISTA
NPA
KIS
TAN
IND
IAIN
DIA
TUR
KM
ENIS
TAN
TUR
KM
ENIS
TAN
TAJI
KIS
TAN
TAJI
KIS
TAN
UZB
EKIS
TAN
UZB
EKIS
TAN
75°E
75°E
70°E
70°E
65°E
65°E
60°E
60°E
35°N
35°N
30°N
30°N
Reg
iona
lopi
umcu
ltiva
tion
and
prod
uctio
nin
Afg
hani
stan
,200
9
Sour
ce:G
over
nmen
tofA
fgha
nist
an-N
atio
nalm
onito
ring
syst
emim
plem
ente
dby
UN
OD
CN
ote:
The
boun
darie
san
dna
mes
show
nan
dth
ede
sign
atio
nsus
edon
this
map
dono
tim
ply
offic
iale
ndor
sem
ento
racc
epta
nce
byth
eU
nite
dN
atio
ns.
Sout
hern
Wes
tern
Cen
tral
Nor
ther
n
010
020
050
KmG
eogr
aphi
cpr
ojec
tion,
Dat
umW
GS
84
6,026
18,800
557
0
103,014
825
132
0
19
East
ern
21
593
Nor
th-e
aste
rn
East
ern
Nor
thEa
ster
n
20581
Lege
nd Cul
tivat
ion
(ha)
Prov
inci
albo
unda
ry
Inte
rnat
iona
lbou
ndar
y
Pro
duct
ion
(mt)
16
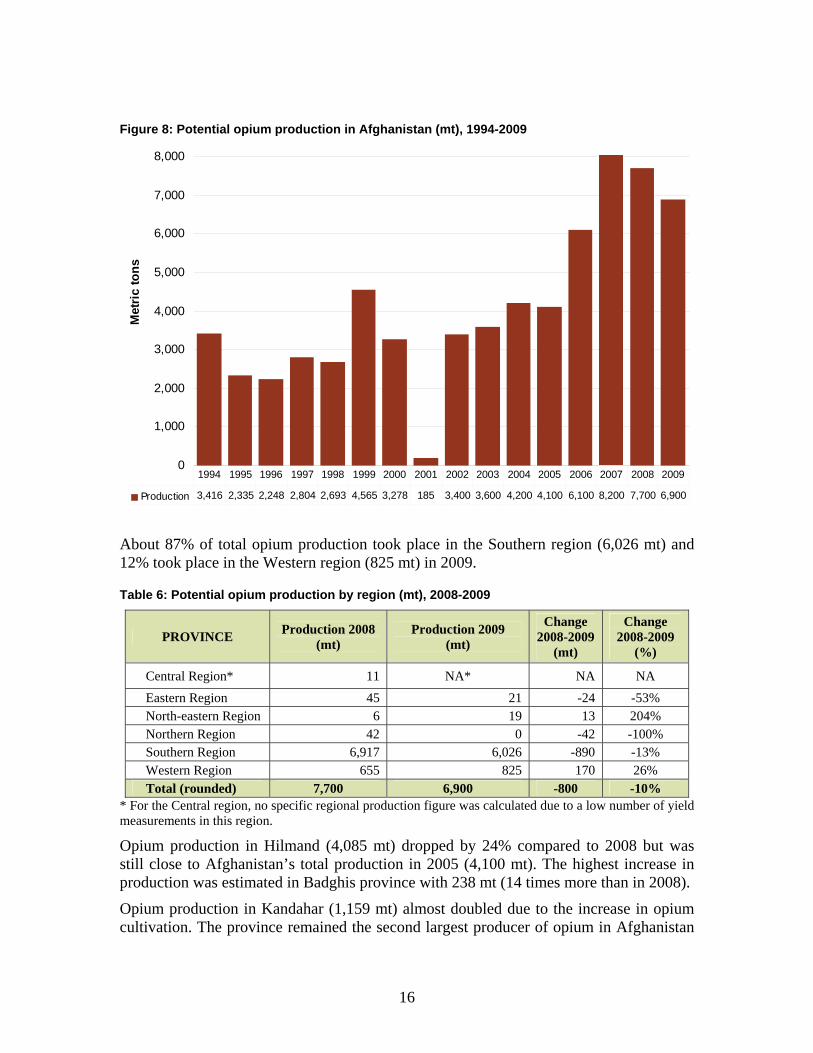
Figure 8: Potential opium production in Afghanistan (mt), 1994-2009
0
1,000
2,000
3,000
4,000
5,000
6,000
7,000
8,000
Met
ric to
ns
Production 3,416 2,335 2,248 2,804 2,693 4,565 3,278 185 3,400 3,600 4,200 4,100 6,100 8,200 7,700 6,900
1994 1995 1996 1997 1998 1999 2000 2001 2002 2003 2004 2005 2006 2007 2008 2009
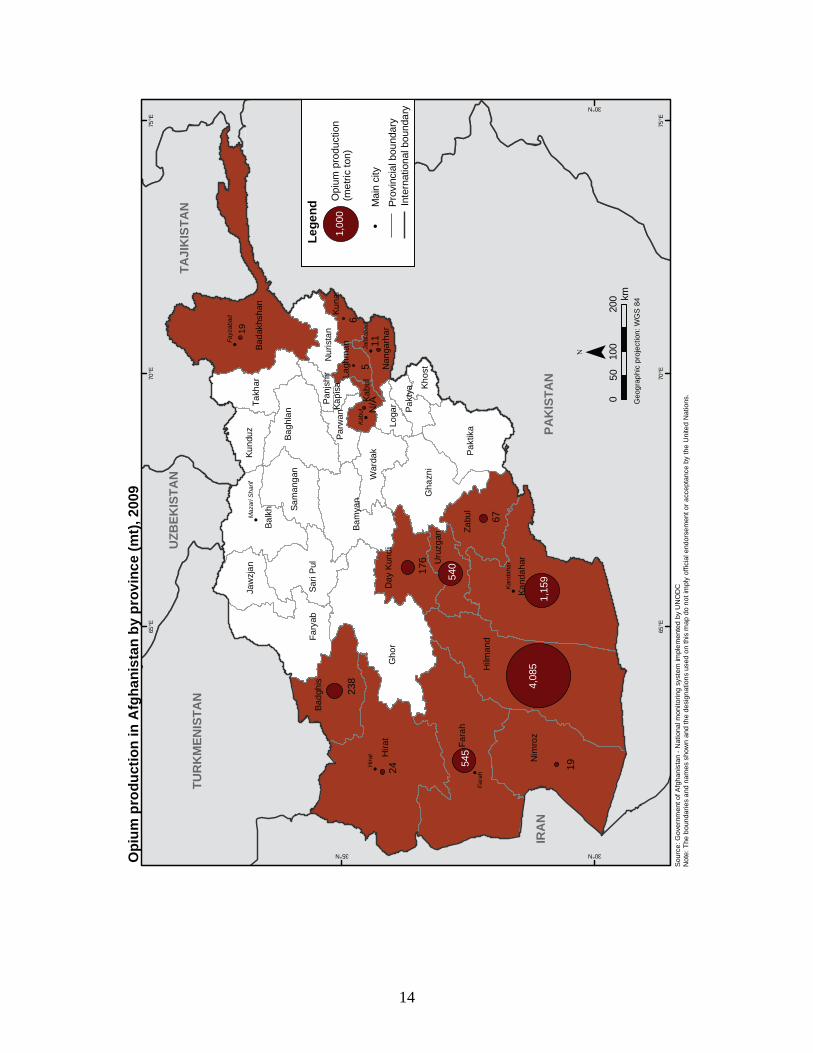
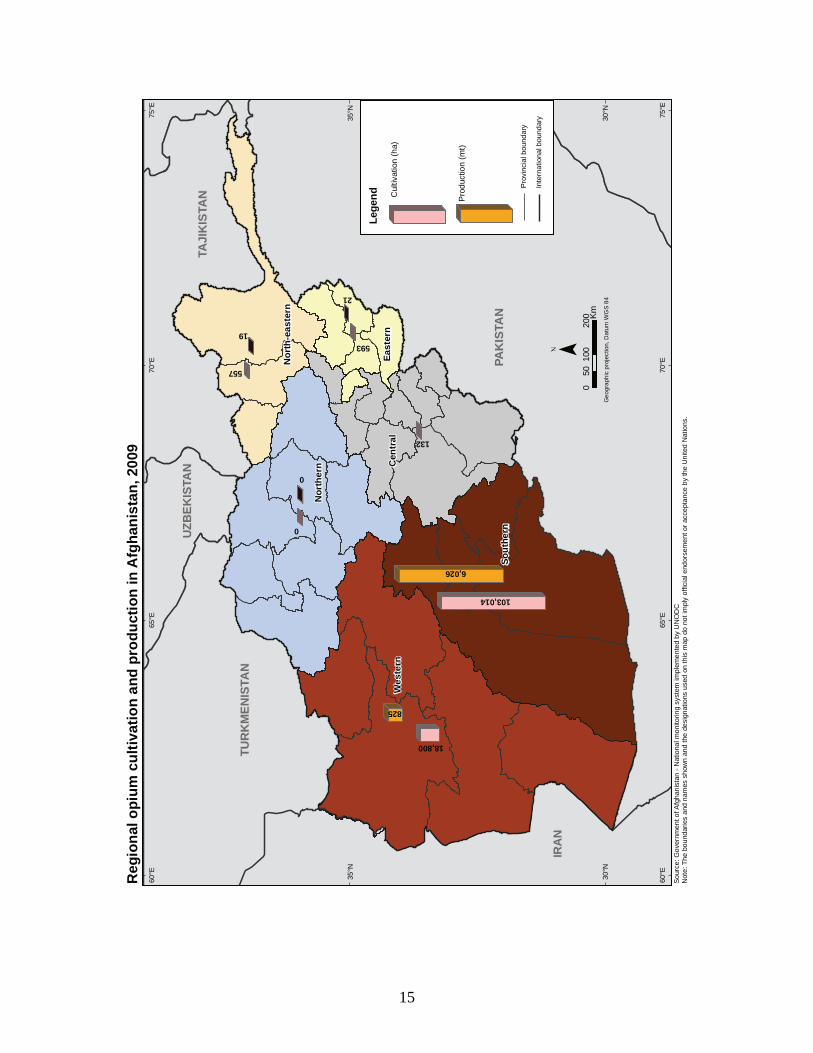
About 87% of total opium production took place in the Southern region (6,026 mt) and 12% took place in the Western region (825 mt) in 2009.
Table 6: Potential opium production by region (mt), 2008-2009
PROVINCE Production 2008 (mt)
Production 2009 (mt)
Change 2008-2009
(mt)
Change 2008-2009
(%)
Central Region* 11 NA* NA NA Eastern Region 45 21 -24 -53% North-eastern Region 6 19 13 204% Northern Region 42 0 -42 -100% Southern Region 6,917 6,026 -890 -13% Western Region 655 825 170 26% Total (rounded) 7,700 6,900 -800 -10%
* For the Central region, no specific regional production figure was calculated due to a low number of yield measurements in this region.
Opium production in Hilmand (4,085 mt) dropped by 24% compared to 2008 but was still close to Afghanistan’s total production in 2005 (4,100 mt). The highest increase in production was estimated in Badghis province with 238 mt (14 times more than in 2008).
Opium production in Kandahar (1,159 mt) almost doubled due to the increase in opium cultivation. The province remained the second largest producer of opium in Afghanistan
17
in 2009. Other provinces that contributed significantly to production were Farah (545 mt), Uruzgan (540 mt) and Day Kundi (176 mt) and Zabul (67 mt).
Table 7: Potential opium production in main opium producing provinces (mt), 2008-2009
PROVINCE Production 2008 (mt)
Production 2009 (mt)
Change 2008-2009
(mt)
Change 2008-2009
(%) Hilmand 5,397 4,085 -1,312 -24% Kandahar 762 1,159 397 52% Farah 446 545 99 22% Uruzgan 518 540 22 4% Badghis 17 238 220 1263% Day Kundi 118 176 57 48% Zabul 122 67 -55 -45%
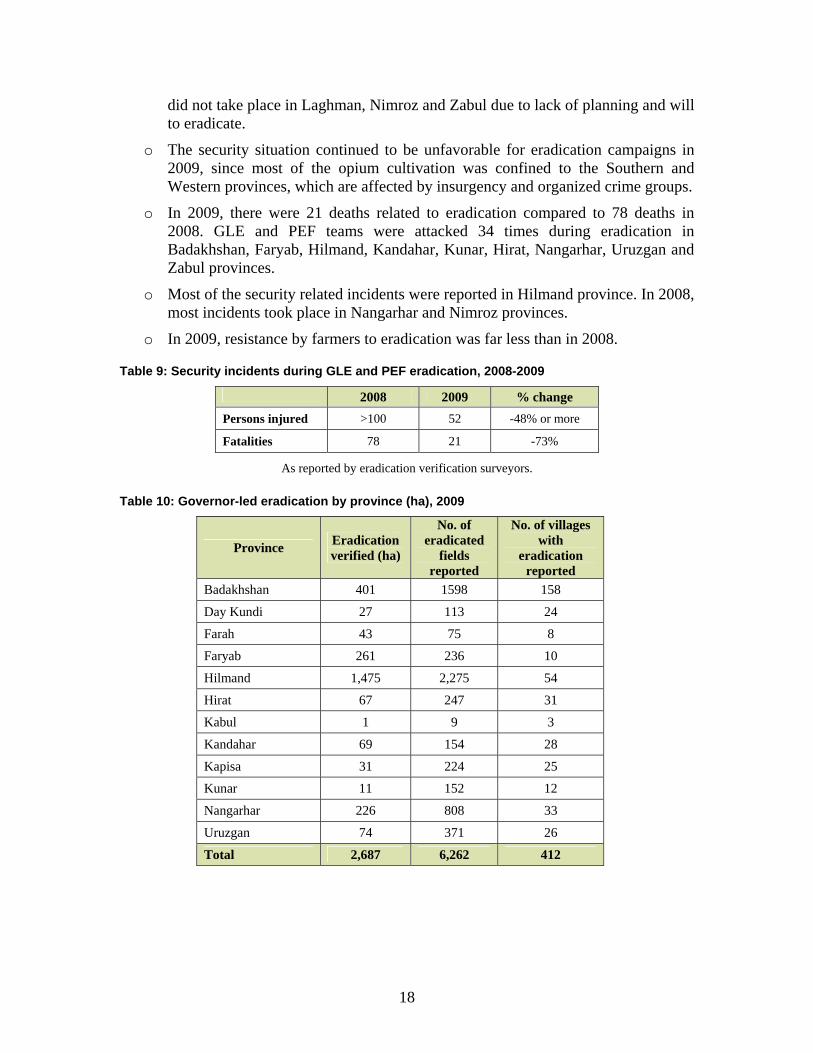
Eradication remains at low level of 2008
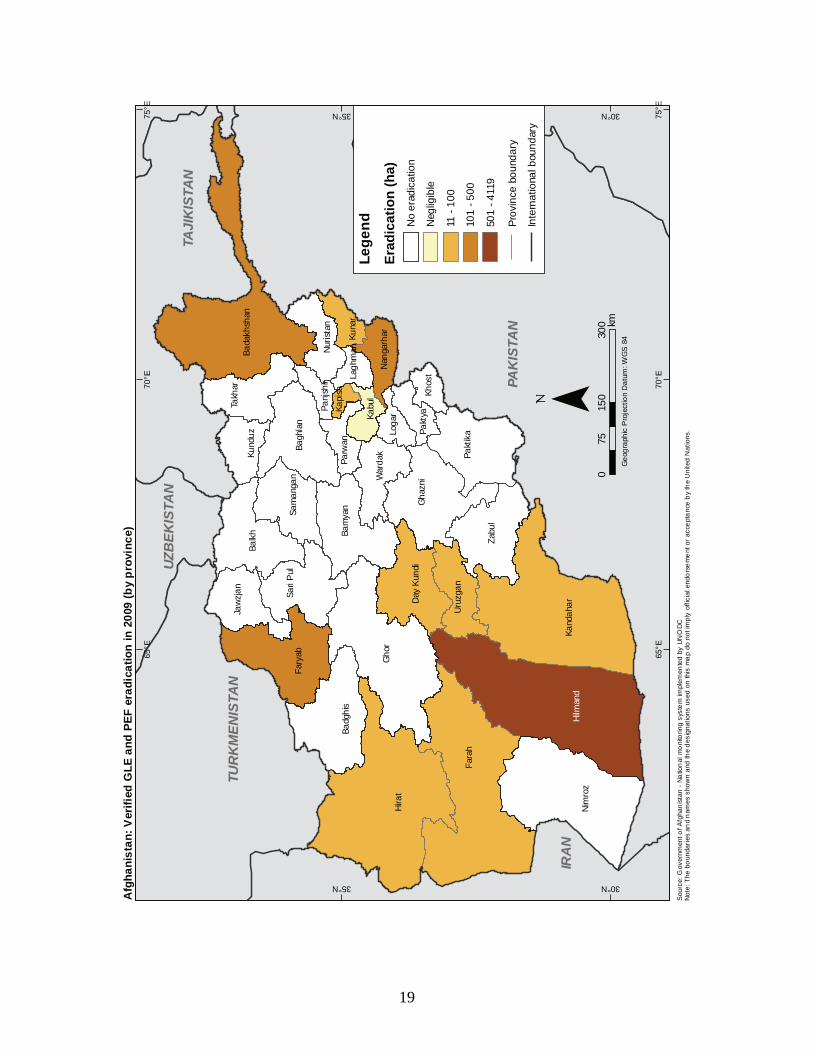
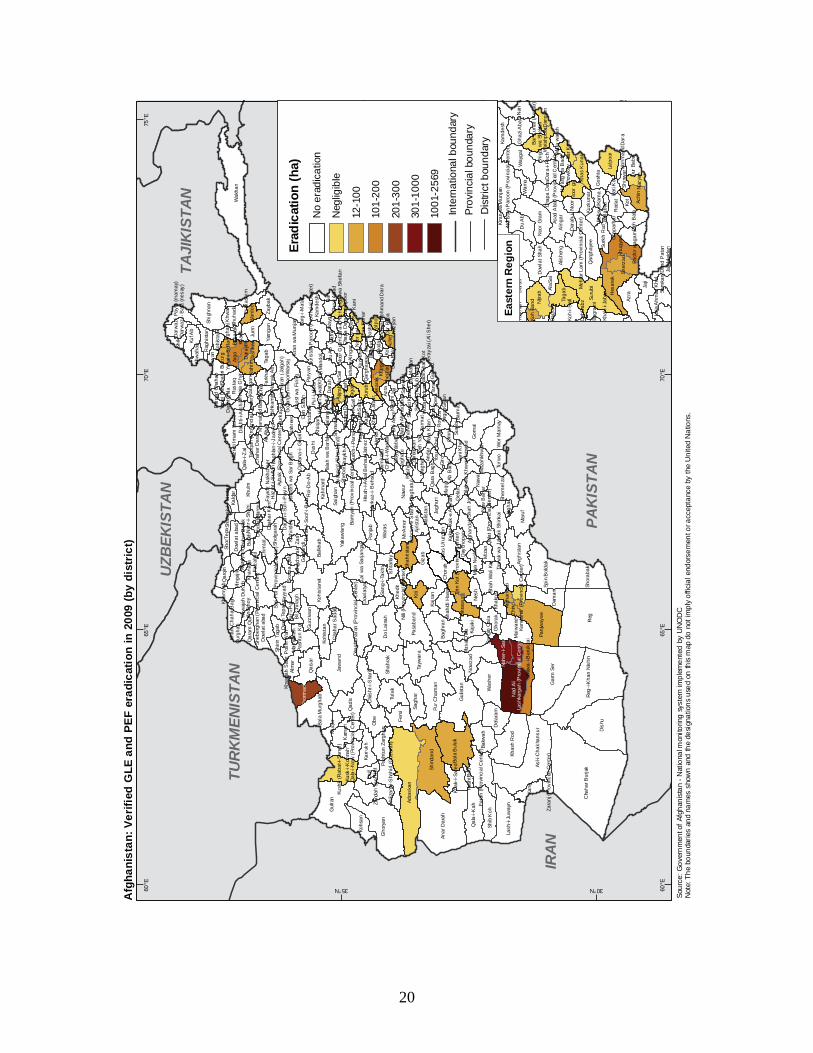
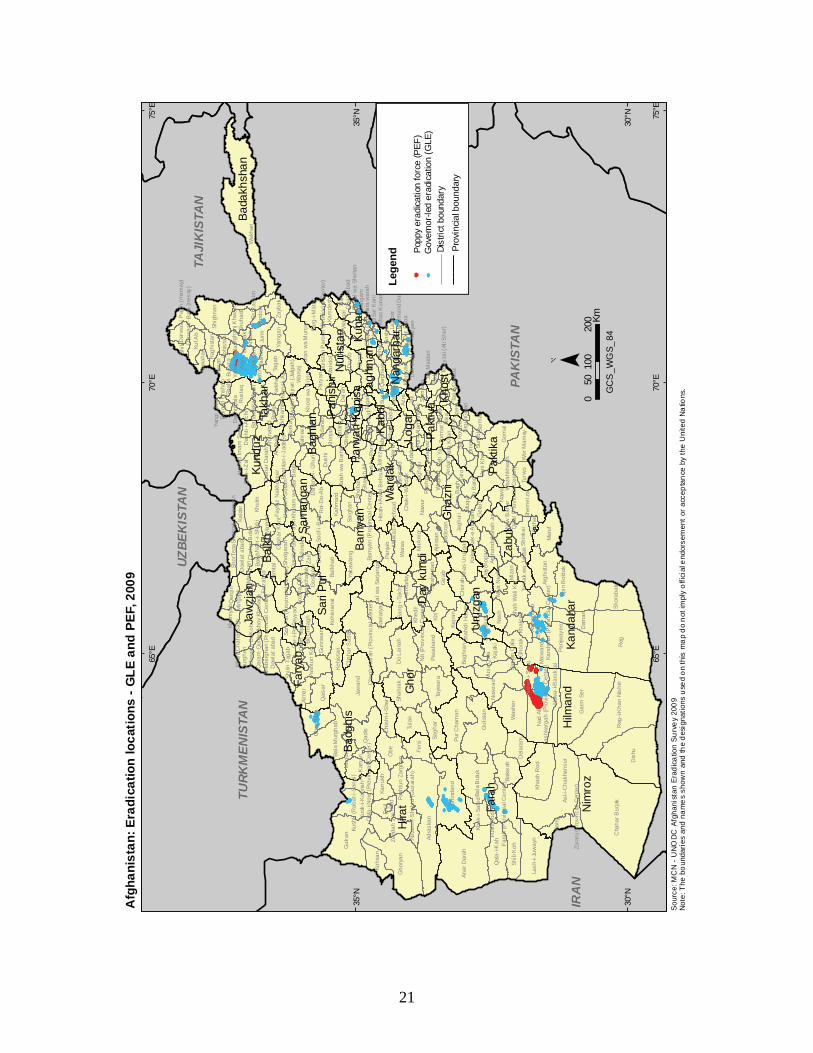
A total of 5,351 ha of eradicated poppy fields were verified by MCN/UNODC including Governor-led eradication (GLE) (2,687 ha) and eradication executed by the Poppy Eradication Force (PEF) (2,663 ha). GLE was carried out in 12 provinces whereas PEF conducted eradication only in Hilmand and Badakhshan provinces. The final figures of eradication in Hilmand and Badakhshan provinces were adjusted after verification using satellite images since cases of over-reporting were observed in the preliminary reports received from these provinces.
Table 8: Eradication and cultivation in Afghanistan (ha) 2005-2009
Year 2005 2006 2007 2008 2009 GLE (ha) 4,000 13,050 15,898 4,306 2,687 PEF (ha) 210 2,250 3,149 1,174 2,663 Total (ha) 4,210 15,300 19,510 5,480 5,351 Opium cultivation (ha)* 104,000 165,000 193,000 157,000 123,000 Eradication as % of opium cultivation 4% 9% 10% 3% 4%
* Net opium cultivation after eradication
Points of note regarding eradication carried out in 2009 were:
o Total eradication was around 4% of the total opium cultivation.
o Eradication was insignificant in major opium growing provinces like Kandahar, Farah and Uruzgan.
o Timely eradication could have made Kunar, Laghman, Kabul, Badakhshan, Nangarhar, Hirat and Nimroz province poppy free considering the low level of cultivation in these provinces.
o Eradication took place in 12 provinces in 2009 compared to 17 in 2008. Unlike last year, eradication did not take place in Ghor, Baghlan, Jawzjan and Nuristan because of negligible opium cultivation in these provinces. However, eradication
18
did not take place in Laghman, Nimroz and Zabul due to lack of planning and will to eradicate.
o The security situation continued to be unfavorable for eradication campaigns in 2009, since most of the opium cultivation was confined to the Southern and Western provinces, which are affected by insurgency and organized crime groups.
o In 2009, there were 21 deaths related to eradication compared to 78 deaths in 2008. GLE and PEF teams were attacked 34 times during eradication in Badakhshan, Faryab, Hilmand, Kandahar, Kunar, Hirat, Nangarhar, Uruzgan and Zabul provinces.
o Most of the security related incidents were reported in Hilmand province. In 2008, most incidents took place in Nangarhar and Nimroz provinces.
o In 2009, resistance by farmers to eradication was far less than in 2008.
Table 9: Security incidents during GLE and PEF eradication, 2008-2009
2008 2009 % change Persons injured >100 52 -48% or more
Fatalities 78 21 -73%
As reported by eradication verification surveyors.
Table 10: Governor-led eradication by province (ha), 2009
Province Eradication verified (ha)
No. of eradicated
fields reported
No. of villages with
eradication reported
Badakhshan 401 1598 158
Day Kundi 27 113 24
Farah 43 75 8
Faryab 261 236 10
Hilmand 1,475 2,275 54
Hirat 67 247 31
Kabul 1 9 3
Kandahar 69 154 28
Kapisa 31 224 25
Kunar 11 152 12
Nangarhar 226 808 33
Uruzgan 74 371 26
Total 2,687 6,262 412
19
TUR
KM
ENIS
TAN
TUR
KM
ENIS
TAN
UZB
EKIS
TAN
UZB
EKIS
TAN
TAJI
KIS
TAN
TAJI
KIS
TAN
PAK
ISTA
NPA
KIS
TAN
IND
IAIN
DIA
IRA
NIR
AN
Hira
t
Fara
h
Gho
r
Hilm
and
Nim
roz
Kand
ahar
Bada
khsh
an
Gha
zni
Balk
h
Zabu
l
Fary
abBa
ghla
n
Badg
his
Pakt
ika
Sari
Pul
Takh
ar
Bam
yan
Day
Kun
di
Jaw
zjan
Uru
zgan
War
dak
Nur
ista
n
Kund
uz
Sam
anga
n
Pakt
ya
Parw
an
Loga
r
Kuna
r
Kabu
lN
anga
rhar
Khos
t
Panj
shir La
ghm
anKa
pisa
75°E
75°E
70°E
70°E
65°E
65°E
35°N
35°N
30°N
30°N
Afg
hani
stan
:Ver
ified
GLE
and
PEF
erad
icat
ion
in20
09(b
ypr
ovin
ce)
Sou
rce:
Gov
ernm
ento
fAfg
han
ista
n-
Na
tion
alm
oni
torin
gsy
ste
mim
plem
ente
dby
UN
OD
CN
ote:
The
boun
dari
esan
dn
ames
show
nan
dth
ed
esig
natio
nsus
edon
this
ma
pdo
noti
mpl
yof
ficia
lend
ors
em
ent
orac
cept
anc
eb
yth
eU
nite
dN
atio
ns.
Geo
grap
hic
Pro
ject
ion
Dat
um:W
GS
84
015
030
075
km
Lege
nd
Erad
icat
ion
(ha)
No
erad
icat
ion
Neg
ligib
le
11-1
00
101
-500
501
-411
9
Prov
ince
boun
dary
Inte
rnat
iona
lbou
ndar
y
20
IRA
N
PAK
ISTA
N
IND
IA
TUR
KM
ENIS
TAN
TAJI
KIS
TAN
UZB
EKIS
TAN
Reg
Dis
hu
Cha
harB
urja
k
Wak
han
Adra
skan
Gar
mSe
r
Jaw
and
Anar
Dar
ah
Gul
ran
Gho
ryan
Gul
ista
n
Naw
ur
Shin
dand
Reg
-i-K
han
Nis
hin
Yaka
wla
ng
Nad
Ali
Obe
Giz
ab
Gom
al
Kohi
stan
at
Qad
is
Dam
an
Was
her
Asl-i
-Cha
khan
sur
Mar
uf
Panj
way
ee
PurC
ham
an
Shah
rak
Khas
hR
od
Tula
k
Now
zad
Bala
Bul
uk
Khul
m
War
as
Kiti
Spin
Bol
dak
Do
Lain
ah
Pasa
band
Tayw
ara
Cho
rah
Shor
abak
War
saj
Argh
ista
n
Fers
i
Shig
hnan
Qai
sar
Balk
hab
Lash
-i-Ju
way
n
Bagh
ran
Sagh
ar
Enjil
Dus
hi
Qal
a-i-K
ah
Bala
Mur
ghab
Kaja
ki
Mai
wan
d
Shin
kai
Bakw
ah
Kohs
an
Shib
Koh
Kajra
nJa
ghur
i
Naw
a
Del
aram
Rus
taq
MirA
mor
Panj
ab
Jurm
Kohi
stan
Wor
Mam
ay
Alm
ar
Karr
ukh
Nes
h
Khed
ir
Taga
b
Roi
-Do-
Ab
Turw
o
Argo
KufA
b
Dow
lata
bad
Zari
Yam
gan
Zayb
ak
Qal
a-i-Z
al
Ajris
tan
Saig
han
Pary
an
Giro
Gur
ziw
an
Gho
rak
Qar
qin
Jalre
z
Miz
an
Azra
Isht
arla
y
Shor
Tepa
Sang
-i-Ta
kht
Kahm
ard
Kald
arD
owla
taba
d
Kira
nw
aM
unja
n
Man
dol
Shem
elza
i
Cha
ghch
aran
(Pro
vinc
ialC
ente
r)La
lwa
Sarja
ngal
Chi
mta
l
Pash
tun
Kot
Kang
Shah
Wal
iKot
Zend
ahJa
n
Mal
ista
n
Gho
rmac
h
Zurm
at
Suru
bi
Shah
Joi
Khak
rez
Mar
kaz-
i-B
ehsu
d
Shol
gara
h
Khas
Uru
zgan
Tala
hw
aB
arfa
k
Gel
an
Shah
rista
n
Jaji
Muq
ur
Barm
al
Sheb
ar
Shuh
ada
Chi
isht
-i-S
harif
AbK
amar
i
Sayy
ad
Dih
raw
udDow
laty
ar
Fark
har
Shiri
nTa
gab
Dar
ah-i-
Soof
-i-B
ala
Bagh
lan-
i-Jad
eed
Mus
aQ
ala
Naw
a-i-B
aruk
zai
Burk
a
Barg
-i-M
atal
Qar
aB
agh
Khin
jan
Day
chop
an
Khw
ajah
DuK
oh
Muq
ur
Shik
i
Khak
-i-Sa
fed
Argh
anda
b
Fara
h(P
rovi
ncia
lCen
ter)
Kush
k(R
abat
-i-Sa
ngi)
Nar
i
Rag
hist
an
Kam
desh
Faiz
abad
Waz
ahkh
wah
Min
gajik
Kish
inde
h
Zhire
Khos
twa
Firin
gG
osfa
ndi
Shah
idiH
asas
Anda
rab
Alin
gar
Kish
im
Anda
r
Dar
ah
War
dooj
AbB
and
Kusk
-i-K
ohna
h
Khan
abad
Naw
Bah
ar
Nah
reen
Nah
er-i-
Sara
j
BilC
hira
gh
Pash
tun
Zarg
hun
Pul-i
-Ala
m
Eshk
ashi
m
Nijr
ab
Jani
Khe
l
Way
gal
Khur
amw
aSa
rBag
h
Bang
i
Cha
hab
Tash
kan
Qar
amQ
ul
Du
Ab
Niiz
am-i-
Sha
hid
(Guz
arah
)
Dai
mird
ad
Sayy
idab
ad
Qur
ghan
Nah
r-i-S
hahi
Balk
h
Dah
ana-
i-G
huri
Cha
harS
adah
Sang
char
ak
Kham
yab
Dar
ah-i-
Suf-i
-Pay
in
Cha
harD
arah
Ner
kh
Shay
khA
li
Haz
rati
Imam
Sahi
b
Taga
b
Qar
ghay
ee
Pul-i
-His
ar
Surk
h-i-P
arsaSh
inw
ari
Cha
harK
ent
Noo
rGra
m
Deh
Yak
Mar
dyan
Tarn
akw
aJa
ldak
Khw
ahan
Sper
aHes
arak
Tana
y
Mar
mul
Achi
n
Urg
un
Alis
heng
Sari
Pul(
Pro
vinc
ialC
ente
r)
His
ah-i-
Aw
alB
ehsu
d
Eshk
amis
h
Om
na
Jagh
atu
Sheb
ergh
an(P
rovi
ncia
lCen
ter)
Cha
k-i-W
arda
k
Cha
l
Sala
ng
Qus
hTe
pah
Miy
aN
eshi
n
Qal
at(P
rovi
ncia
lCen
ter)
Atgh
ar
Gos
hta
Kohi
stan
Dar
ayim
Khug
yani
Shah
riBu
zurg
Bam
yan
(Pro
vinc
ialC
ente
r)
Yaw
an
Fayr
ozN
akhc
heer
Haz
rat-i
-Sul
tan
Khos
hi
Lalp
oor
Tirin
Kot(
Pro
vinc
ialC
ente
r)
Das
hti-i
-Arc
hi
SarR
owza
Ayba
k(P
rovi
ncia
lCen
ter)
Dila
hw
aK
hwos
ham
and
Kabu
l
Dar
waz
-i-B
ala
(nes
ay)
Rod
at
Koh-
i-Saf
iD
owla
tSha
h
Nam
akA
b
Sher
zad
Kala
fgan
Dar
qad
Khar
war
AliA
bad
Khan
aqa
Kaka
rKa
k-e
Afg
han
Kot
Sar-
i-Pol
Dar
waz
-iPa
yin
(mam
ay)
Argh
anda
b
Deh
Sab
z
Wag
haz
Cha
paD
ara
Khan
iCha
harB
agh
Yafta
l-i-S
ufla
Yosu
fKhe
l
Gha
ziA
bad
AlaS
aiD
ara-
i-Pec
h
Suru
biKhak
-i-Ja
bar
Bagr
amDeh
Sal
ah
Andk
hoy
Bak
Ziru
k
Wam
aSy
ahgi
rd(G
horb
and)
Sozm
aQ
ala
Khas
h
Argh
anjK
hwah
Deh
Bal
a
Ras
hida
n
Behs
ud
Nur
ista
nP
aroo
n(P
rovi
ncia
lCen
ter)
Cha
harB
olak
Baha
rak
Gur
buz
Kam
a
Push
tRod
Sang
inQ
ala
Giy
an
Cha
rkh
Pagh
man
Mat
aK
han
His
sa-i-
Aw
al(K
hinj
)
Noo
rgal
Woz
aJa
dran
Shut
ul
Ahm
adab
adSa
mka
ni
Talo
qan
(Pro
vinc
ialC
ente
r)Khw
aja
Gha
r
Sayy
idK
aram
Khas
Kun
ar
Deh
dadi
Lash
karg
ah(P
rovi
ncia
lCen
ter)
Kuzk
unar
Zana
khan
Hira
t
Jaji
Mai
dan
Dur
Baba
Zara
nj(P
rovi
ncia
lCen
ter)
Khw
ajah
Hijr
an(J
alga
h)
Naz
yan
Saba
ri(Y
aqub
i)
Das
htiQ
ala
Kand
ahar
(Pro
vinc
lalC
ente
r)
Cho
wke
y
Una
ba
Qal
a-i-N
ow(P
rovi
ncia
lCen
ter)
Nili
(Pro
vinc
ialC
ente
r)
Shig
alw
aSh
elta
nW
atah
poor
Yang
iQal
a
SarK
ani
Nad
irSha
hK
otTe
rayz
ai(A
liS
her)
Bahr
am-e
Sha
hid
(Jag
hatu
)
Khw
ajah
Sab
zP
oshi
Wal
i
Shin
war
Goz
arga
h-i-N
oor
Moh
man
dD
ara
Mai
man
ah
Shah
rak-
i-Hai
rata
n
75°E
75°E
70°E
70°E
65°E
65°E
60°E
60°E
35°N
35°N
30°N
30°N
Sour
ce:G
over
nmen
tofA
fgha
nist
an-N
atio
nalm
onito
ring
syst
emim
plem
ente
dby
UN
OD
CN
ote:
The
boun
darie
san
dna
mes
show
nan
dth
ede
sign
atio
nsus
edon
this
map
dono
tim
ply
offic
iale
ndor
sem
ento
racc
epta
nce
byth
eU
nite
dN
atio
ns.
Afg
hani
stan
:Ver
ified
GLE
and
PEF
erad
icat
ion
in20
09(b
ydi
stric
t)
Suru
bi Jaji
Man
dol
Azra
Alin
gar
Nar
iD
arah
Nijr
ab
Way
gal
Du
Ab
Taga
b
Qar
ghay
ee
Noo
rG
ram
Hes
arak
Achi
n
Alis
heng
Gos
hta La
lpoo
rR
odat
Dow
latS
hah
Kot
Kam
desh
AlaS
ai
Wam
a
Kam
aSu
rkh
Rud
Khug
yani
Sher
zad
Cha
paD
ara
Gha
ziA
bad
Dar
a-i-P
ech
Koh-
i-Saf
i
Deh
Bal
a
Behs
ud
Noo
rga
l
Pach
irw
agam
Khas
Kun
arKu
zkun
ar
Sam
kani
Nur
ista
nP
aroo
n(P
rovi
ncia
lCen
ter)
Khak
-i-Ja
bar
Dur
Baba
Naz
yan
Cho
wke
y
Shig
alw
aSh
elta
nW
atah
poor
His
sa-i-
Aw
al(K
hinj
)
Dan
gam
SarK
ani
Meh
tarL
am(P
rovi
ncia
lCen
ter)
Laja
Ahm
adK
hel
Cha
parh
ar
Shin
war
Dar
ah-i-
Noo
r
Bati
Kot
Dan
dP
atan
Ruk
hah
Koh
Band
Moh
man
dD
ara
Mar
aw
arah
Nar
ang
wa
Bad
il
BarK
unar
(Asm
ar)
Bagr
am
Bagr
ami
Jala
laba
d
Deh
Sab
z
Asad
Aba
d(P
rovi
ncia
lCen
ter)
Jaji
Mai
dan
Kira
nw
aM
unja
n
East
ern
Reg
ion
No
erad
icat
ion
Neg
ligib
le
12-1
00
101-
200
201-
300
301-
1000
1001
-256
9
Dis
trict
boun
dary
Erad
icat
ion
(ha)
Inte
rnat
iona
lbou
ndar
yPr
ovin
cial
boun
dary
21
IRA
NIR
AN
TAJI
KIS
TAN
TAJI
KIS
TAN
PAK
ISTA
NPA
KIS
TAN
INDI
AIN
DIA
TURK
MEN
ISTA
NTU
RKM
ENIS
TAN
UZBE
KIS
TAN
UZBE
KIS
TAN
Hira
t Fara
h
Gho
r
Hilm
and
Kand
ahar
Nim
roz
Bada
khsh
an
Balk
h
Gha
zni
Zabu
l
Fary
ab
Badg
his
Pakt
ika
Bagh
lan
Bam
yan
Sari
Pul
Takh
ar
Day
kund
i
Jaw
zjan
War
dak
Uru
zgan
Sam
anga
n
Nur
ista
n
Kund
uz
Khos
tNan
garh
arKuna
r
Kabu
l
Loga
r
Parw
an Pakt
iya
Panj
shir
Lagh
man
Kapi
sa
Reg
Dis
hu
Cha
harB
urja
k
Wak
han
Adra
skan
Gar
mSe
r
Jaw
and
Anar
Dar
ah
Gul
ran
Gho
ryan
Gul
ista
n
Naw
ur
Shin
dand
Reg
-i-K
han
Nis
hin
Yaka
wla
ng
Nad
Ali
Obe
Giz
ab
Gom
al
Kohi
stan
at
Qad
is
Dam
an
Was
her
Asl-i
-Cha
khan
sur
Mar
uf
Panj
way
ee
PurC
ham
an
Shah
rak
Khas
hR
od
Tula
k
Now
zad
Bala
Bul
uk
Khul
m
War
as
Kiti
Spin
Bol
dak
Do
Lain
ah
Pasa
band
Tayw
ara
Cho
rah
Shor
abak
War
saj
Argh
ista
n
Fers
i
Shig
hnan
Qai
sar
Balk
hab
Lash
-i-Ju
way
n
Bagh
ran
Sagh
ar
Enjil
Dus
hi
Qal
a-i-K
ah
Bala
Mur
ghab
Kaja
ki
Mai
wan
d
Shin
kai
Bakw
ah
Kohs
an
Shib
Koh
Kajra
nJa
ghur
i
Naw
a
Del
aram
Rus
taq
MirA
mor
Panj
ab
Jurm
Kohi
stan
Wor
Mam
ay
Alm
ar
Karr
ukh
Nes
h
Khed
ir
Taga
b
Roi
-Do-
Ab
Turw
o
Argo
KufA
b
Dow
lata
bad
Zari
Yam
gan
Zayb
ak
Ajris
tan
Saig
han
Pary
anG
urzi
wan
Gho
rak
Qar
qin
Jalre
z
Miz
an
Azra
Kahm
ard
Kald
arD
owla
taba
d
Kira
nw
aM
unja
n
Man
dol
Shem
elza
i
Cha
ghch
aran
(Pro
vinc
ialC
ente
r) Lalw
aSa
rjang
al
Chi
mta
l
Pash
tun
Kot
Kang
Shah
Wal
iKot
Qal
a-i-Z
al
Zend
ahJa
n
Mal
ista
n
Giro
Gho
rmac
h
Zurm
at
Suru
bi
Shah
Joi
Khak
rez
Mar
kaz-
i-B
ehsu
d
Shol
gara
h
Khas
Uru
zgan
Tala
hw
aB
arfa
k
Gel
an
Shah
rista
n
Jaji
Muq
ur
Barm
al
Sheb
ar
Shuh
ada
Chi
isht
-i-S
harif
AbK
amar
i
Sayy
ad
Dih
raw
ud
Dow
laty
ar
Fark
har
Isht
arla
y
Shiri
nTa
gab
Shor
Tepa
Dar
ah-i-
Soof
-i-B
ala
Sang
-i-Ta
kht
Bagh
lan-
i-Jad
eed
Mus
aQ
ala
Naw
a-i-B
aruk
zai
Burk
a
Barg
-i-M
atal
Qar
aB
agh
Khin
jan
Day
chop
an
Khw
ajah
DuK
oh
Muq
ur
Shik
i
Khak
-i-Sa
fed
Argh
anda
b
Fara
h(P
rovi
ncia
lCen
ter)
Kush
k(R
abat
-i-Sa
ngi)
Nar
i
Rag
hist
an
Kam
desh
Faiz
abad
Waz
ahkh
wah
Min
gajik
Kish
inde
h
Zhire
Khos
twa
Firin
gG
osfa
ndi
Shah
idiH
asas
Anda
rab
Alin
gar
Kish
im
Anda
r
Dar
ah
War
dooj
AbB
and
Kusk
-i-K
ohna
h
Khan
abad
Naw
Bah
ar
Nah
reen
Nah
er-i-
Sara
j
BilC
hira
gh
Pash
tun
Zarg
hun
Pul-i
-Ala
m
Eshk
ashi
m
Nijr
ab
Jani
Khe
l
Way
gal
Khur
amw
aSa
rBag
h
Bang
i
Cha
hab
Tash
kan
Qar
amQ
ul
Du
Ab
Niiz
am-i-
Sha
hid
(Guz
arah
)
Dai
mird
ad
Sayy
idab
ad
Qur
ghan
Nah
r-i-S
hahi
Balk
h
Dah
ana-
i-G
huri
Cha
harS
adah
Sang
char
ak
Kham
yab
Dar
ah-i-
Suf-i
-Pay
in
Cha
harD
arah Ner
kh
Shay
khA
li
Haz
rati
Imam
Sahi
b
Taga
b
Qar
ghay
ee
Surk
h-i-P
arsaSh
inw
ari
Cha
harK
ent
Deh
Yak
Mar
dyan
Tarn
akw
aJa
ldak
Khw
ahan
Sper
aHes
arak
Tana
y
Mar
mul
Achi
n
Urg
un
Sari
Pul(
Pro
vinc
ialC
ente
r)
His
ah-i-
Aw
alB
ehsu
d
Eshk
amis
h
Om
na
Jagh
atu
Sheb
ergh
an(P
rovi
ncia
lCen
ter)
Cha
k-i-W
arda
k
Sala
ng
Qus
hTe
pah
Miy
aN
eshi
n
Qal
at(P
rovi
ncia
lCen
ter)
Atgh
ar
Gos
hta
Kohi
stan
Dar
ayim
Khug
yani
Shah
riBu
zurg
Bam
yan
(Pro
vinc
ialC
ente
r)
Yaw
an
Fayr
ozN
akhc
heer
Haz
rat-i
-Sul
tan
Khos
hi
Lalp
oor
Das
hti-i
-Arc
hi
SarR
owza
Kabu
l
Dar
waz
-i-B
ala
(nes
ay)
Koh-
i-Saf
i
Nam
akA
b
Kala
fgan
Dar
qad
Khar
war
AliA
bad
Khan
aqa
Kaka
rKa
k-e
Afg
han
Sar-
i-Pol
Dar
waz
-iP
ayin
(mam
ay)
Argh
anda
b
Wag
haz
Cha
paD
ara
Khan
iCha
harB
agh
Yafta
l-i-S
ufla
Gha
ziA
bad
Suru
biKhak
-i-Ja
bar
Andk
hoy
Bak
Ziru
k
Sozm
aQ
ala
Khas
h
Argh
anjK
hwah
Deh
Bal
a
Ras
hida
n
Behs
ud
Nur
ista
nP
aroo
n(P
rovi
ncia
lCen
ter)
Cha
harB
olak
Baha
rak
Gur
buz
Push
tRod
Sang
inQ
ala
Giy
an
Mat
aK
han
Noo
rga
l
Sam
kani
Khas
Kun
ar
Lash
karg
ah(P
rovi
ncia
lCen
ter)
Hira
t
Jaji
Mai
dan
Nik
a
Baha
rak
Dur
Baba
Zara
nj(P
rovi
ncia
lCen
ter)
Khw
ajah
Hijr
an(J
alga
h)
Naz
yan
Das
htiQ
ala
Kand
ahar
(Pro
vinc
lalC
ente
r)
Qal
a-i-N
ow(P
rovi
ncia
lCen
ter)
Nili
(Pro
vinc
ialC
ente
r)
Shig
alw
aSh
elta
n
Yang
iQal
a
Dan
gam
SarK
ani
Tera
yzai
(Ali
She
r)Sh
wak
Moh
man
dD
ara
Mar
aw
arah
Shah
rak-
i-Hai
rata
n
75°E
75°E
70°E
70°E
65°E
65°E
35°N
35°N
30°N
30°N
Afg
hani
stan
:Era
dica
tion
loca
tions
-GLE
and
PEF,
2009
Sou
rce:
MC
N-
UN
OD
CA
fgha
nist
anE
rad
ica
tion
Su
rve
y20
09
Not
e:T
hebo
unda
ries
and
nam
es
show
nan
dth
ed
esig
natio
nsu
sed
on
this
ma
pd
on
otim
ply
offi
cial
end
orse
men
tor
acce
pta
nce
byth
eU
nite
dN
atio
ns.
010
020
050
KmG
CS
_WG
S_84
Lege
nd Popp
yer
adica
tion
forc
e(P
EF)
Dist
rictb
ound
ary
Prov
incia
lbou
ndar
y
Gov
erno
r-led
erad
icat
ion
(GLE
)
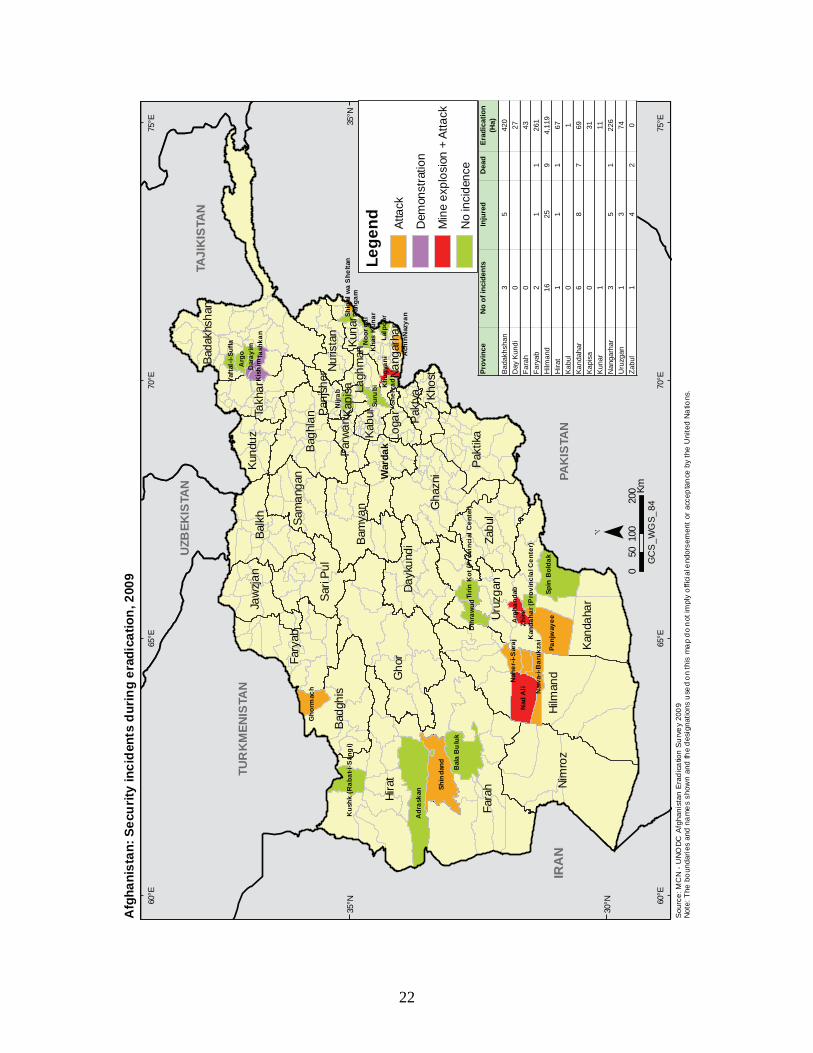
22
IRA
NIR
AN
PAK
ISTA
N
IND
IAIN
DIA
TUR
KM
ENIS
TAN
TAJI
KIS
TAN
TAJI
KIS
TAN
UZB
EKIS
TAN
Hira
t
Fara
h
Gho
r
Hilm
and
Nim
roz
Kand
ahar
Bada
khsh
an
Gha
zni
Balk
h
Zabu
l
Fary
abBa
ghla
n
Badg
his
Pakt
ika
Sari
Pul
Dayk
undi
Takh
ar
Bam
yan
Jaw
zjan
Uruz
gan
War
dak
Nuris
tan
Kund
uz
Sam
anga
n
Kuna
rKa
bul
Nang
arha
rLo
gar
Khos
tPa
ktya
Parw
an
Panj
sher
Lagh
man
Kapi
sa
Adr
aska
n Shin
dand
Nad
Ali
Panj
way
ee
Bal
aB
ulu
k
Spin
Bol
dak
Arg
o
Gho
rmac
h
Suru
bi
Dih
raw
ud
Naw
a-i-B
aruk
zai
Kus
hk(R
abat
-i-S
ang
i)
Zhire
Kis
him
Nah
er-i-
Sar
aj
Nijr
ab
Tash
kan
Ach
in
Dar
ayim
Khu
gyan
i
Tirin
Kot
(Pro
vinc
ialC
ente
r)
Lalp
oor
Sher
zad
Arg
hand
ab
Yaft
al-i-
Sufla N
oorg
alK
has
Kun
ar
Naz
yan
Kan
daha
r(P
rovi
ncla
lCen
ter)
Shig
alw
aS
helta
nD
anga
m
75°E
75°E
70°E
70°E
65°E
65°E
60°E
60°E
35°N
35°N
30°N
30°N
Afg
hani
stan
:Sec
urity
inci
dent
sdu
ring
erad
icat
ion,
2009
Sou
rce:
MC
N-
UN
OD
CA
fgha
nist
anE
rad
ica
tion
Su
rve
y20
09
Not
e:T
hebo
unda
ries
and
nam
es
show
nan
dth
ed
esig
natio
nsu
sed
on
this
ma
pd
on
otim
ply
offi
cial
end
orse
men
tor
acce
pta
nce
byth
eU
nite
dN
atio
ns.
010
020
050
KmG
CS
_WG
S_84
Lege
nd Atta
ck
Dem
onst
ratio
n
Min
eex
plos
ion
+At
tack
No
inci
denc
ePr
ovin
ceN
oof
inci
dent
sIn
jure
dD
ead
Erad
icat
ion
(Ha)
Bada
khsh
an3
542
0D
ayKu
ndi
027
Fara
h0
43Fa
ryab
21
126
1H
ilman
d16
259
4,11
9H
irat
11
167
Kabu
l0
1Ka
ndah
ar6
87
69Ka
pisa
031
Kuna
r1
11N
anga
rhar
35
122
6U
ruzg
an1
374
Zabu
l1
42
0

23
Although the highest eradication of 4,119 ha was reported from Hilmand (1,475 ha GLE and 2,644 PEF eradication), this amount is very low (6%) considering the amount of opium cultivation in this province (69,833 ha). Eradication in Kandahar (69 ha) was negligible in comparison to the total cultivation of 19,811 ha in this province. Eradication in Badakhshan and Nangarhar, however, were 50% and 43% respectively of the total area under opium cultivation in these provinces. Figure 9: Distribution of GLE and PEF total eradication by province, 2009
8.5%
9.8%
15.0%
55.1%
1%
0.1%
0.4%
1.0%
1.2%
1.6%
2.5%
2.6%
2.8%
99%
0% 50% 100%
Kabul
Kunar
Day Kundi
Kapisa
Farah
Hirat
Kandahar
Uruzgan
Nangarhar
Faryab
Badakhshan
Hilmand
GLE PEF
PEF eradication activities started already in January 2009. The main part of the GLE eradication was carried out in the month of March and efforts continued until June 2009. Manual eradication using sticks was carried out during late flowering to capsule stage in Nangarhar and Badakhshan provinces.
Opium prices continue to fall in 2009
In 2009, the average farm-gate price of dry opium at harvest time (weighted by production) was US$ 64/kg; 34% lower than in 2008. For the same period, farm-gate prices of fresh opium fell by 31% to US$ 48/kg (weighted price) at harvest time.8 These were the lowest prices recorded since 2001.
MCN/UNODC has monitored opium prices on a monthly basis in various provinces of Afghanistan since 1994. Monthly prices have shown a decreasing trend since 2005 in all regions. Since mid-2007, opium prices at the trading level in the Western and Eastern
8 In 2008, the fresh and dry opium prices at harvest time were based on farmers responses collected through the Annual Opium Survey, which was conducted slightly before the opium harvest. In 2009, prices at harvest time were derived from the opium price monitoring system and refer to the month when opium harvest actually took place in the different regions of the country.

24
regions tend to be higher than prices in other regions. Since 2005, opium prices have been converging across the different regions of Afghanistan. Figure 10: Afghanistan, dry opium prices reported by traders, by region (US$/kg), January 2005 to July 2009
0
100
200
300
Jan-
05
Apr
-05
Jul-0
5
Oct
-05
Jan-
06
Apr
-06
Jul-0
6
Oct
-06
Jan-
07
Apr
-07
Jul-0
7
Oct
-07
Jan-
08
Apr
-08
Jul-0
8
Oct
-08
Jan-
09
Apr
-09
Jul-0
9
US$
/kg
Eastern Southern Western North-eastern Northern
Table 11: Regional farm-gate prices of dry opium at harvest time (US$/kg), 2008-2009
Region Average Dry Opium Price
(US$/kg) 2008
Average Dry Opium Price
(US$/kg) 2009 Change
Central 171 160* -6%
Eastern 105 90 -14%
North-eastern 85 75 -12%
Northern 97 64 -34%
Southern 70 62 -11%
Western 103 72 -30% National average price weighted by production**
95 64 -33%
* Prices for the Central region were taken from the annual village survey as there is no monthly opium price monitoring in the Central region.
** In 2008, the dry opium prices at harvest time were based on farmers responses collected through the Annual Opium Survey, which was conducted slightly before the opium harvest. In 2009, prices at harvest time were derived from the opium price monitoring system and refer to the month when opium harvest actually took place in the different regions of the country.
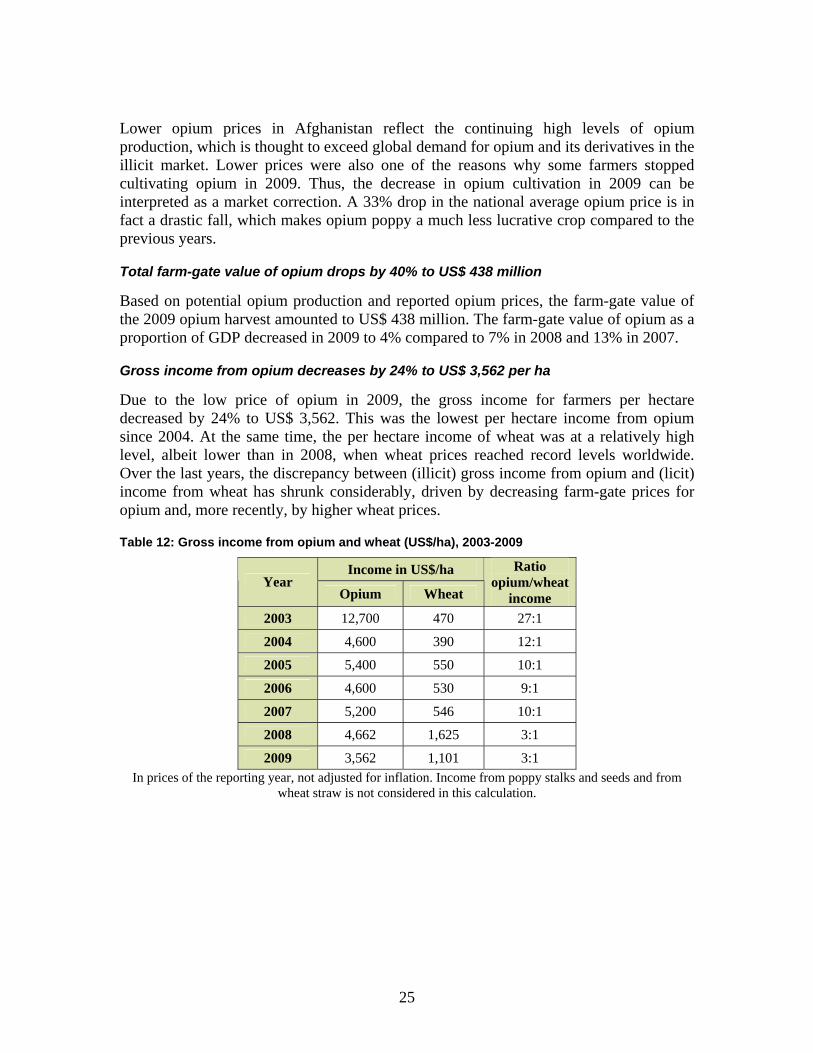
25
Lower opium prices in Afghanistan reflect the continuing high levels of opium production, which is thought to exceed global demand for opium and its derivatives in the illicit market. Lower prices were also one of the reasons why some farmers stopped cultivating opium in 2009. Thus, the decrease in opium cultivation in 2009 can be interpreted as a market correction. A 33% drop in the national average opium price is in fact a drastic fall, which makes opium poppy a much less lucrative crop compared to the previous years.
Total farm-gate value of opium drops by 40% to US$ 438 million
Based on potential opium production and reported opium prices, the farm-gate value of the 2009 opium harvest amounted to US$ 438 million. The farm-gate value of opium as a proportion of GDP decreased in 2009 to 4% compared to 7% in 2008 and 13% in 2007.
Gross income from opium decreases by 24% to US$ 3,562 per ha
Due to the low price of opium in 2009, the gross income for farmers per hectare decreased by 24% to US$ 3,562. This was the lowest per hectare income from opium since 2004. At the same time, the per hectare income of wheat was at a relatively high level, albeit lower than in 2008, when wheat prices reached record levels worldwide. Over the last years, the discrepancy between (illicit) gross income from opium and (licit) income from wheat has shrunk considerably, driven by decreasing farm-gate prices for opium and, more recently, by higher wheat prices.
Table 12: Gross income from opium and wheat (US$/ha), 2003-2009
Income in US$/ha Year
Opium Wheat
Ratio opium/wheat
income 2003 12,700 470 27:1
2004 4,600 390 12:1
2005 5,400 550 10:1
2006 4,600 530 9:1
2007 5,200 546 10:1
2008 4,662 1,625 3:1
2009 3,562 1,101 3:1 In prices of the reporting year, not adjusted for inflation. Income from poppy stalks and seeds and from
wheat straw is not considered in this calculation.

26
Figure 11: Reasons for stopping opium cultivation in or before 2009 (n=1,877 farmers)
0.1%
1%
1%
1%
2%
2%
2%
3%
3%
4%
4%
4%
6%
16%
18%
33%
0% 20% 40%
It is not the custom
High cost of inputs (fertilizer, labours etc)
Other
Fear of eradication
Fear of government
Lack of water
It is harmful for human beings
No response/No data
High price of wheat
Elders and shura decision
Land/climate conditions not suitable
Lack of experience
Not enough yield
It is against Islam
Low sale price of opium
It was banned by government
Reasons for cultivating and/or stopping cultivation
In 2009, farmers who stopped cultivating opium in 2009 or before were asked about their major reason for doing so. The Government ban on opium cultivation was mentioned by about 33% of the respondents, making it the most frequently cited reason for stopping. Low sale prices of opium were the second main reason. In previous years, low opium prices were mentioned by only a very small percentage of farmers. This provides some evidence for the argument that reduction in opium cultivation is partly a response to market changes.
The high sale price was the most important reason cited by farmers (61%) for cultivating opium poppy in 2009. Provision of basic food and shelter for the family, high demand for opium and the fact that it was an easy way to earn money were other important reasons given.
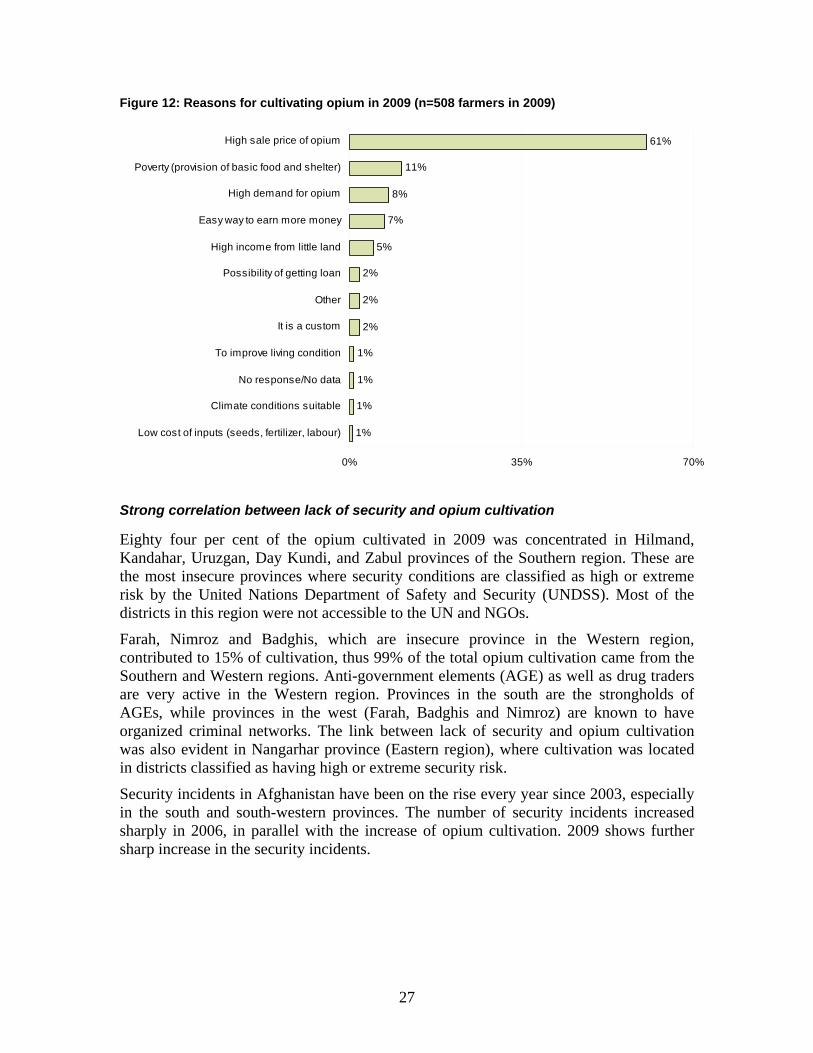
27
Figure 12: Reasons for cultivating opium in 2009 (n=508 farmers in 2009)
1%
1%
1%
1%
2%
2%
2%
5%
7%
8%
11%
61%
0% 35% 70%
Low cost of inputs (seeds, fertilizer, labour)
Climate conditions suitable
No response/No data
To improve living condition
It is a custom
Other
Possibility of getting loan
High income from little land
Easy way to earn more money
High demand for opium
Poverty (provision of basic food and shelter)
High sale price of opium
Strong correlation between lack of security and opium cultivation
Eighty four per cent of the opium cultivated in 2009 was concentrated in Hilmand, Kandahar, Uruzgan, Day Kundi, and Zabul provinces of the Southern region. These are the most insecure provinces where security conditions are classified as high or extreme risk by the United Nations Department of Safety and Security (UNDSS). Most of the districts in this region were not accessible to the UN and NGOs.
Farah, Nimroz and Badghis, which are insecure province in the Western region, contributed to 15% of cultivation, thus 99% of the total opium cultivation came from the Southern and Western regions. Anti-government elements (AGE) as well as drug traders are very active in the Western region. Provinces in the south are the strongholds of AGEs, while provinces in the west (Farah, Badghis and Nimroz) are known to have organized criminal networks. The link between lack of security and opium cultivation was also evident in Nangarhar province (Eastern region), where cultivation was located in districts classified as having high or extreme security risk.
Security incidents in Afghanistan have been on the rise every year since 2003, especially in the south and south-western provinces. The number of security incidents increased sharply in 2006, in parallel with the increase of opium cultivation. 2009 shows further sharp increase in the security incidents.
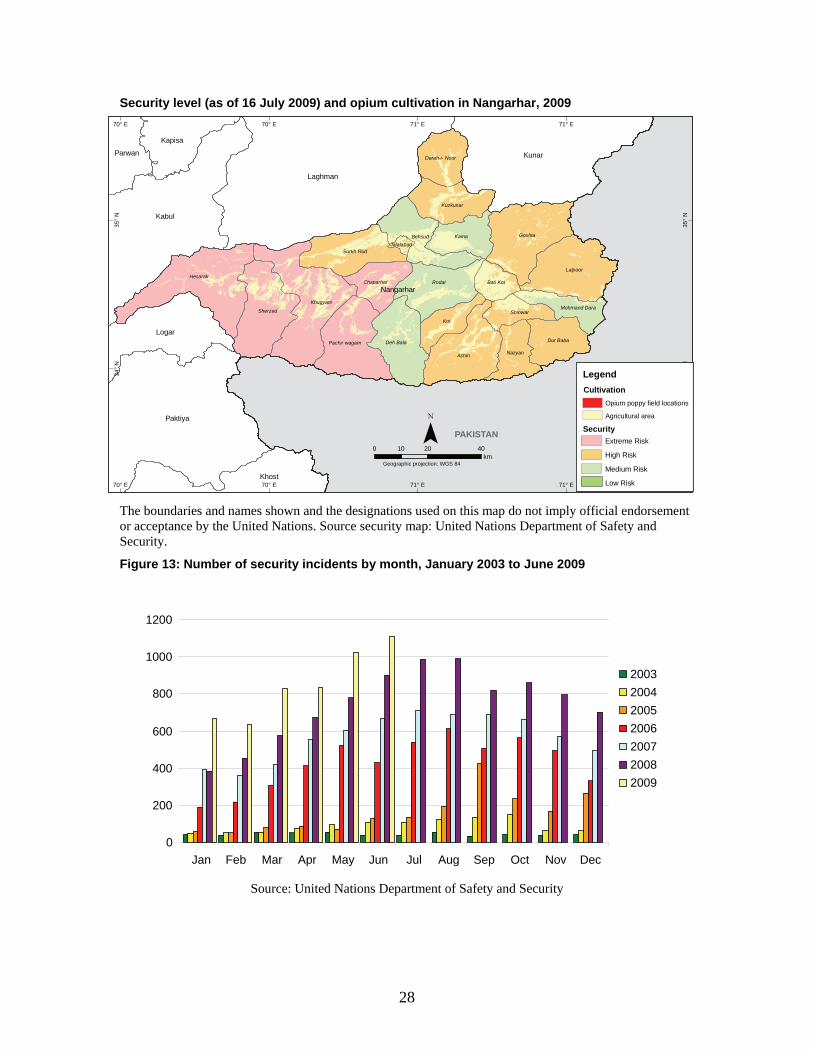
28
Security level (as of 16 July 2009) and opium cultivation in Nangarhar, 2009
Nangarhar
Laghman
Paktiya
Kabul
Kunar
Logar
Khost
Kapisa
Parwan
Hesarak
Achin
Goshta
Khugyani
Lalpoor
Rodat
Sherzad
Kot
Deh Bala
Behsud Kama
Surkh Rud
Pachir wagam
Kuzkunar
Dur Baba
Nazyan
Chaparhar
Shinwar
Darah-i- Noor
Bati Kot
Mohmand Dara
Jalalabad
PAKISTAN
71° E
71° E
70° E
70° E
71° E
71° E
70° E
70° E35
°N
35°
N
34°
N
34°
N
0 20 4010km
Geographic projection: WGS 84
Legend
Security
Cultivation
Agricultural area
Opium poppy field locations
Extreme Risk
High Risk
Medium Risk
Low Risk The boundaries and names shown and the designations used on this map do not imply official endorsement or acceptance by the United Nations. Source security map: United Nations Department of Safety and Security.
Figure 13: Number of security incidents by month, January 2003 to June 2009
Source: United Nations Department of Safety and Security
0
200
400
600
800
1000
1200
Jan Feb Mar Apr May Jun Jul Aug Sep Oct Nov Dec
2003200420052006200720082009
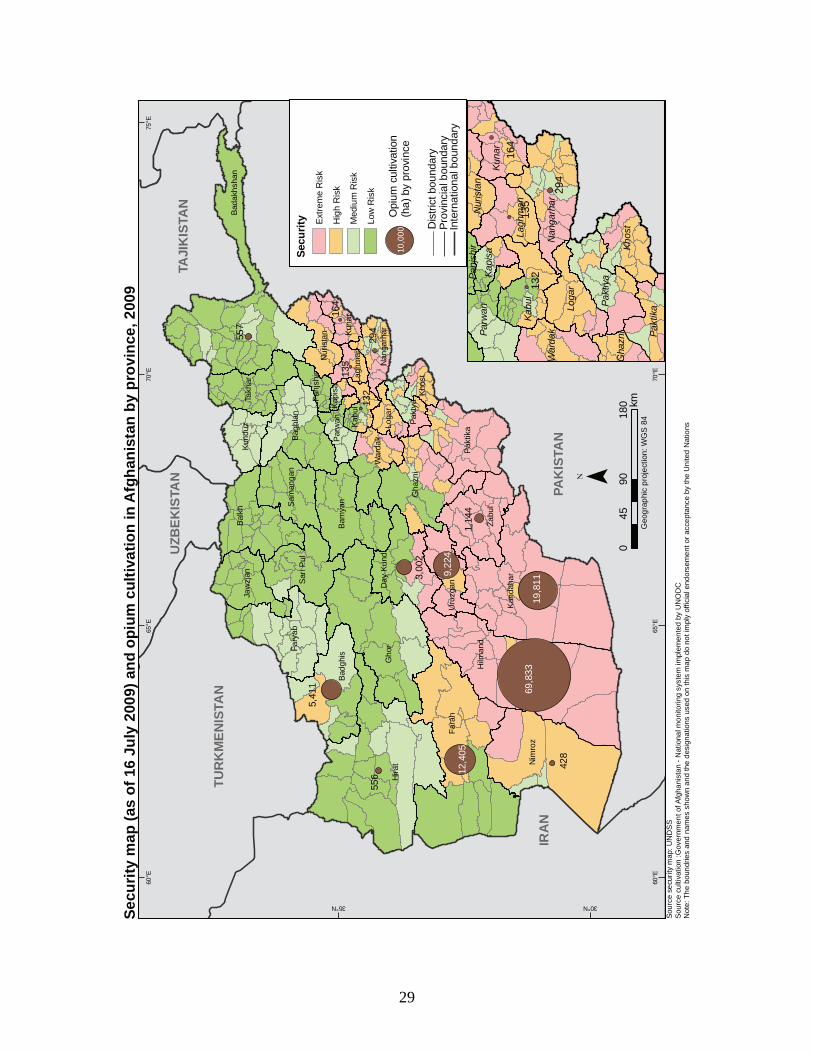
29
IRA
NPA
KIS
TAN
TUR
KM
ENIS
TAN
TAJI
KIS
TAN
UZB
EKIS
TAN
Hira
t
Fara
h
Gho
r
Hilm
and
Nim
roz
Kand
ahar
Bada
khsh
anBa
lkh
Gha
zni
Zabu
l
Fary
ab
Pakt
ika
Badg
his
Bagh
lan
Bam
yan
Sari
Pul
Takh
ar
Day
Kund
i
Jaw
zjan
Uru
zgan
War
dak
Nur
ista
n
Kund
uz
Sam
anga
n
Kuna
r
Loga
r
Pakt
ya
Kabu
l
Parw
an
Khos
t
Nan
garh
ar
Panj
shir
Lagh
man
Kapi
sa
75°E
75°E
70°E
70°E
65°E
65°E
60°E
60°E
35°N
35°N
30°N
30°N
Kabu
l
Loga
r
Khos
t
Pakt
iya
Kuna
r
Nan
garh
ar
Parw
an
War
dak Pa
ktik
a
Lagh
manNur
ista
nKa
pisa
Gha
zni
Panj
shir
Sour
cese
curit
ym
ap:U
ND
SS
Sour
cecu
ltiva
tion
:Gov
ernm
ento
fAfg
hani
stan
-Nat
iona
lmon
itorin
gsy
stem
impl
emen
ted
byU
NO
DC
Not
e:Th
ebo
undr
ies
and
nam
essh
own
and
the
desi
gnat
ions
used
onth
ism
apdo
noti
mpl
yof
ficia
lend
orse
men
tora
ccep
tanc
eby
the
Uni
ted
Nat
ions
Secu
rity
map
(as
of 1
6 Ju
ly 2
009)
and
opi
um c
ultiv
atio
n in
Afg
hani
stan
by
prov
ince
, 200
9
090
180
45km
Geo
grap
hic
proj
ectio
n:W
GS
84
69,8
33
12,4
05
556
5,41
1
9,22
4
3,00
2
1,14
4
132
135
164
557
294
428
Secu
rity O
pium
culti
vatio
n(h
a)by
prov
ince
294
135
132
164
10,0
00
19,8
11
Extre
me
Ris
k
Hig
hR
isk
Med
ium
Ris
k
Low
Ris
k
Dis
trict
boun
dary
Prov
inci
albo
unda
ryIn
tern
atio
nalb
ound
ary
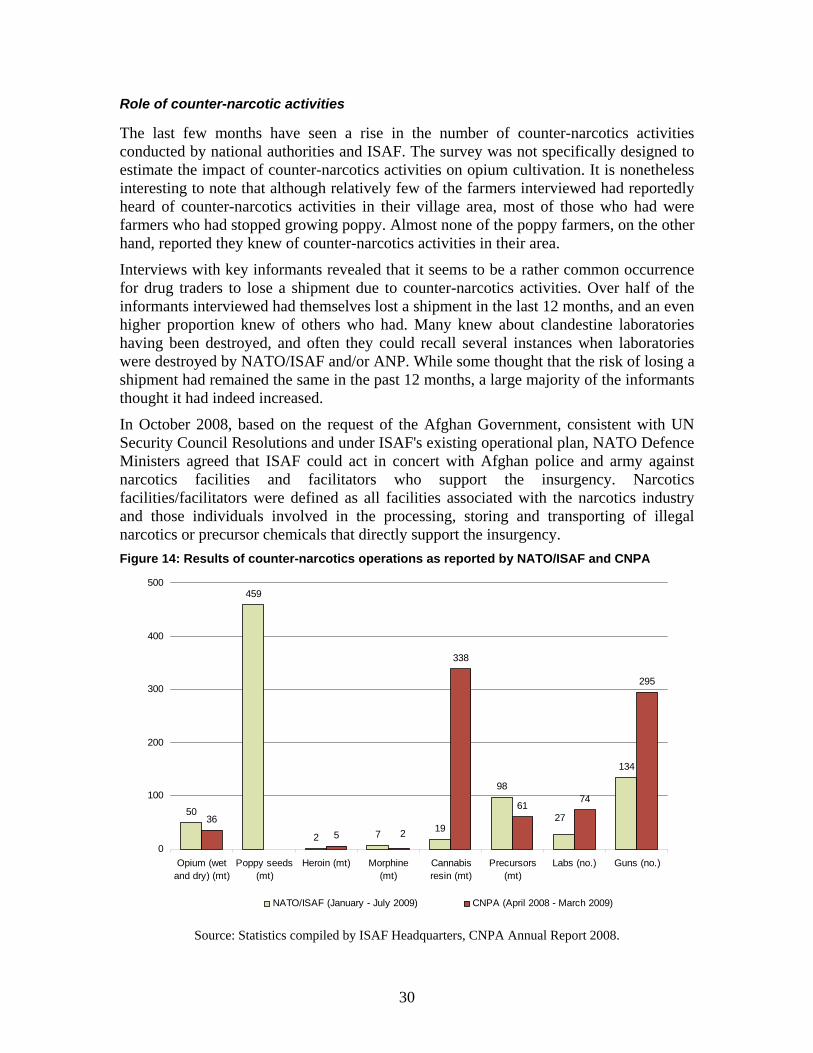
30
Role of counter-narcotic activities
The last few months have seen a rise in the number of counter-narcotics activities conducted by national authorities and ISAF. The survey was not specifically designed to estimate the impact of counter-narcotics activities on opium cultivation. It is nonetheless interesting to note that although relatively few of the farmers interviewed had reportedly heard of counter-narcotics activities in their village area, most of those who had were farmers who had stopped growing poppy. Almost none of the poppy farmers, on the other hand, reported they knew of counter-narcotics activities in their area.
Interviews with key informants revealed that it seems to be a rather common occurrence for drug traders to lose a shipment due to counter-narcotics activities. Over half of the informants interviewed had themselves lost a shipment in the last 12 months, and an even higher proportion knew of others who had. Many knew about clandestine laboratories having been destroyed, and often they could recall several instances when laboratories were destroyed by NATO/ISAF and/or ANP. While some thought that the risk of losing a shipment had remained the same in the past 12 months, a large majority of the informants thought it had indeed increased.
In October 2008, based on the request of the Afghan Government, consistent with UN Security Council Resolutions and under ISAF's existing operational plan, NATO Defence Ministers agreed that ISAF could act in concert with Afghan police and army against narcotics facilities and facilitators who support the insurgency. Narcotics facilities/facilitators were defined as all facilities associated with the narcotics industry and those individuals involved in the processing, storing and transporting of illegal narcotics or precursor chemicals that directly support the insurgency. Figure 14: Results of counter-narcotics operations as reported by NATO/ISAF and CNPA
50
459
2 7 19
98
134
365
338
6174
295
272
0
100
200
300
400
500
Opium (wetand dry) (mt)
Poppy seeds(mt)
Heroin (mt) Morphine(mt)
Cannabisresin (mt)
Precursors(mt)
Labs (no.) Guns (no.)
NATO/ISAF (January - July 2009) CNPA (April 2008 - March 2009)
Source: Statistics compiled by ISAF Headquarters, CNPA Annual Report 2008.
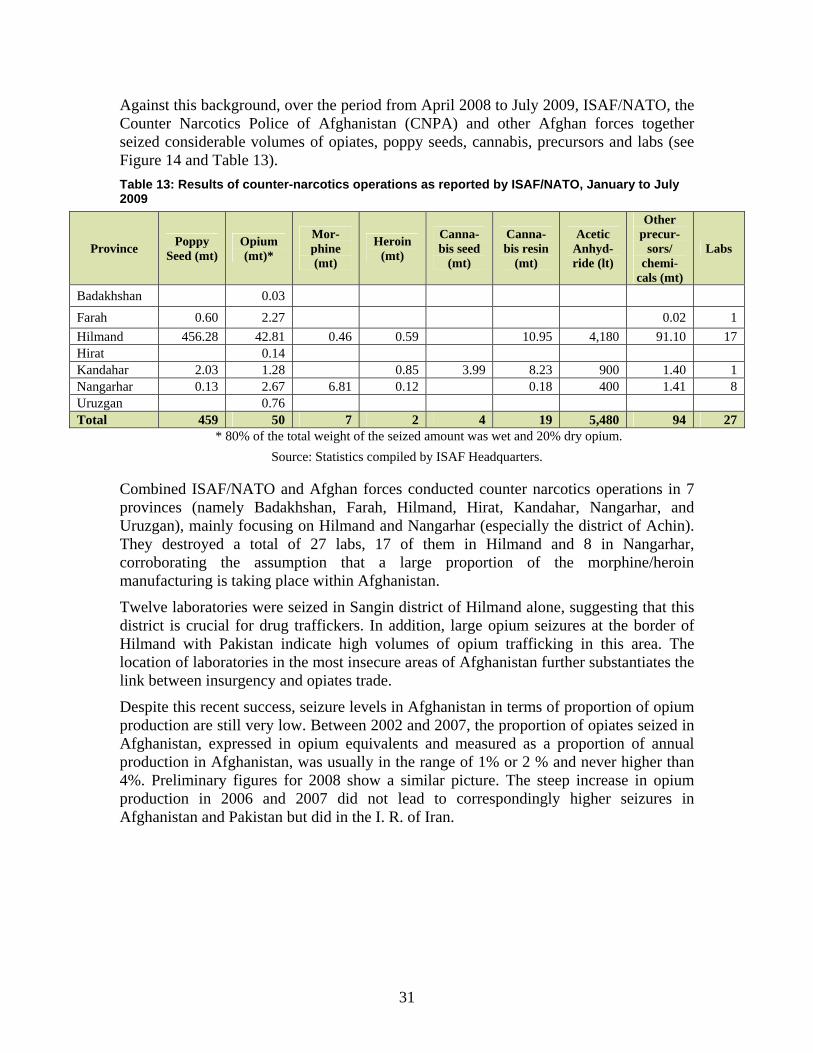
31
Against this background, over the period from April 2008 to July 2009, ISAF/NATO, the Counter Narcotics Police of Afghanistan (CNPA) and other Afghan forces together seized considerable volumes of opiates, poppy seeds, cannabis, precursors and labs (see Figure 14 and Table 13). Table 13: Results of counter-narcotics operations as reported by ISAF/NATO, January to July 2009
Province Poppy Seed (mt)
Opium (mt)*
Mor-phine (mt)
Heroin (mt)
Canna-bis seed
(mt)
Canna-bis resin
(mt)
Acetic Anhyd-ride (lt)
Other precur-
sors/ chemi-
cals (mt)
Labs
Badakhshan 0.03 Farah 0.60 2.27 0.02 1 Hilmand 456.28 42.81 0.46 0.59 10.95 4,180 91.10 17 Hirat 0.14 Kandahar 2.03 1.28 0.85 3.99 8.23 900 1.40 1 Nangarhar 0.13 2.67 6.81 0.12 0.18 400 1.41 8 Uruzgan 0.76 Total 459 50 7 2 4 19 5,480 94 27
* 80% of the total weight of the seized amount was wet and 20% dry opium. Source: Statistics compiled by ISAF Headquarters.
Combined ISAF/NATO and Afghan forces conducted counter narcotics operations in 7 provinces (namely Badakhshan, Farah, Hilmand, Hirat, Kandahar, Nangarhar, and Uruzgan), mainly focusing on Hilmand and Nangarhar (especially the district of Achin). They destroyed a total of 27 labs, 17 of them in Hilmand and 8 in Nangarhar, corroborating the assumption that a large proportion of the morphine/heroin manufacturing is taking place within Afghanistan.
Twelve laboratories were seized in Sangin district of Hilmand alone, suggesting that this district is crucial for drug traffickers. In addition, large opium seizures at the border of Hilmand with Pakistan indicate high volumes of opium trafficking in this area. The location of laboratories in the most insecure areas of Afghanistan further substantiates the link between insurgency and opiates trade.
Despite this recent success, seizure levels in Afghanistan in terms of proportion of opium production are still very low. Between 2002 and 2007, the proportion of opiates seized in Afghanistan, expressed in opium equivalents and measured as a proportion of annual production in Afghanistan, was usually in the range of 1% or 2 % and never higher than 4%. Preliminary figures for 2008 show a similar picture. The steep increase in opium production in 2006 and 2007 did not lead to correspondingly higher seizures in Afghanistan and Pakistan but did in the I. R. of Iran.
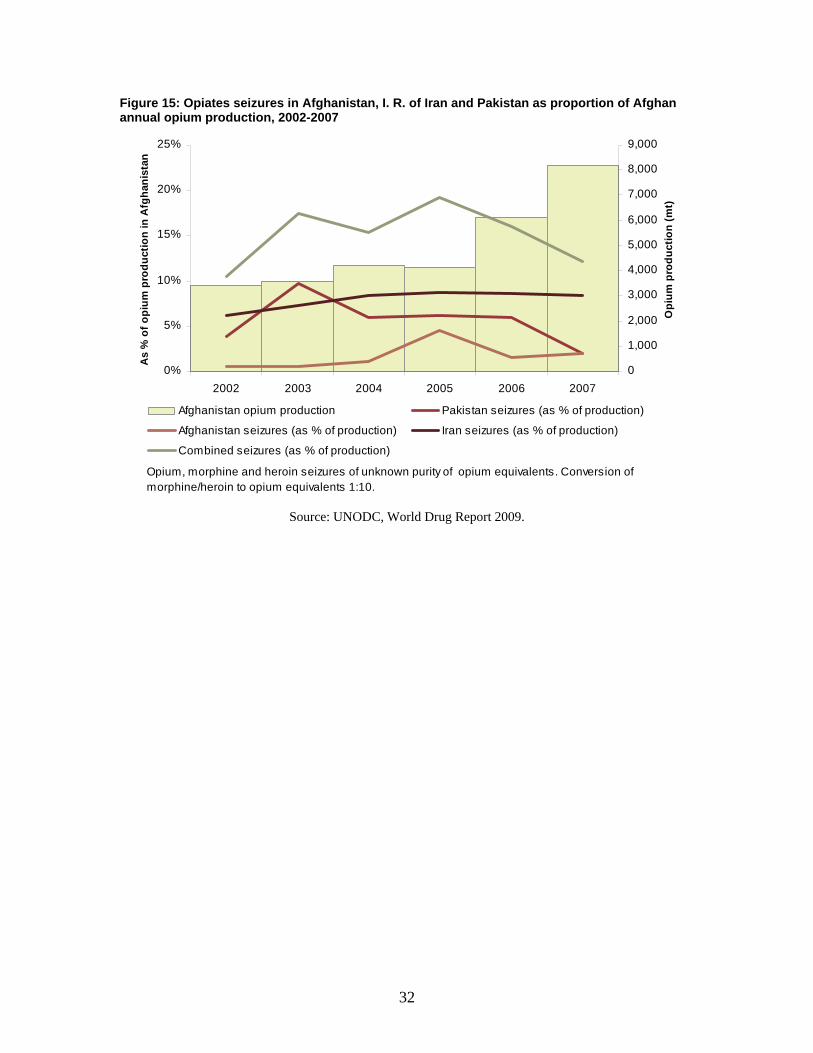
32
Figure 15: Opiates seizures in Afghanistan, I. R. of Iran and Pakistan as proportion of Afghan annual opium production, 2002-2007
0%
5%
10%
15%
20%
25%
2002 2003 2004 2005 2006 2007
As
% o
f opi
um p
rodu
ctio
n in
Afg
hani
stan
0
1,000
2,000
3,000
4,000
5,000
6,000
7,000
8,000
9,000
Opi
um p
rodu
ctio
n (m
t)
Afghanistan opium production Pakistan seizures (as % of production)
Afghanistan seizures (as % of production) Iran seizures (as % of production)
Combined seizures (as % of production)
Opium, morphine and heroin seizures of unknown purity of opium equivalents. Conversion of morphine/heroin to opium equivalents 1:10.
Source: UNODC, World Drug Report 2009.


