Joint United Nations Regional Commissions
Trade Facilitation and
Paperless Trade
Implementation Survey 2015
Africa Report
Institutional
arrangement and
cooperation
Transparency
Formalities
Paperless
trade
Cross-border
paperless trade

2
Disclaimers:
The designation employed and the presentation of the material in the Report do not imply the
expression of any opinion whatsoever on the part of the Secretariat of the United Nations concerning
the legal status of any country, territory, city or area or of its authorities, or concerning the delimitation
of its frontiers or boundaries. The United Nations bears no responsibility for the availability or
functioning of URLs.
Opinions, figures and estimates set forth in this publication are the responsibility of the authors, and
should not necessarily be considered as reflecting the views or carrying the endorsement of the United
Nations. Any errors are the responsibility of the authors. Mention of firm names and commercial
products does not imply the endorsement of the United Nations.
The report has been issued without formal editing.

3
Preface
In September 2014, the United Nations Regional Commissions (UNRCs) including ECA, ECE, ECLAC, ESCAP and ESCWA, initiated a global survey to collect data and information on trade facilitation and paperless trade implementation from their respective member states. Conducted in collaboration with UNCTAD, OECD, ITC, OCO and SELA, the results of the survey are expected to enable countries and their development partners to better understand and monitor progress in trade facilitation, support evidence-based policy-making, identify good practices and identify capacity building and technical assistance needs.
The global survey represents a key initiative under the framework of the Joint UNRC Approach to Trade Facilitation, which was agreed upon by the Executive Secretaries of the five UNRCs in Beirut (January 2010), to enable the UNRCs to present a joint (global) view on key trade facilitation issues. The questionnaire for the global survey was jointly prepared and finalized by UNRCs and OECD to ensure data could be shared and compared.
The global survey builds on an annual regional survey carried out by ESCAP since 2012. It covers not only implementation of some important measures included in the WTO Trade Facilitation Agreement (TFA), but also of measures aimed at enabling paperless trade, or the conduct of trade using electronic rather than paper-based data and documentation. Indeed, a recent ESCAP study found that “next generation” trade facilitation measures have just as much potential as more traditional measures to reduce trade costs and increase intra- and extra-regional trade, with full implementation of cross-border paperless trade expected to generate USD 257 billion of additional export potential annually for the Asia-Pacific region alone.
This regional report is part of this global survey effort. It is prepared by ECA’s African Trade Policy Centre, in collaboration with the Trade Facilitation Unit, Trade and Investment Division, ESCAP.
4
Contents
Preface ......................................................................................................................................................................3
Introduction ..............................................................................................................................................................7
1.1 Background and objective ..............................................................................................................................7
1.2 Survey Instrument and Methodology ............................................................................................................8
Trade facilitation implementation in Africa: Overview ......................................................................................... 12
2.1 Implementation in sub-regions and countries with special needs ............................................................. 14
2.2 Most and least implemented trade facilitation measures .......................................................................... 17
Implementation of trade facilitation measures: A closer look .............................................................................. 20
3.1 “Transparency” measures ........................................................................................................................... 20
3.2 “Formalities” facilitation measures ............................................................................................................. 21
3.3 “Institutional arrangement and cooperation” measures ............................................................................ 23
3.4 “Paperless trade” measures ........................................................................................................................ 25
3.5 “Cross-border paperless trade” measures .................................................................................................. 26
3.6 “Transit facilitation” measures .................................................................................................................... 29
3.7 Recent achievements and challenges for implementation ......................................................................... 31
Conclusions and Way Forward .............................................................................................................................. 33
References ............................................................................................................................................................. 37
Annex 1: Definition of the different stages of implementation ............................................................................ 38
List of Tables
Table 1: Grouping of trade facilitation measures included in the questionnaire ....................................................9
Table 2: Most and least implemented measures in Africa (within each group of trade facilitation measures) ... 18
Table 3: Key transit transport initiatives at REC level............................................................................................ 30
List of Figures
Figure 1: Overall implementation of trade facilitation and paperless trade measures ........................................ 12
Figure 2: Trade facilitation implementation and trade-related costs ................................................................... 13

5
Figure 3: Implementation of trade facilitation and paperless trade measures, by sub-region and by main
thematic area................................................................................................................................................. 15
Figure 4: Implementation of trade facilitation measures, in African LDCs and non-LDC countries ...................... 16
Figure 5: Implementation of trade facilitation measures, in African LLDCs and non-LLDC countries .................. 16
Figure 6: Implementation of different groups of trade facilitation measures: Africa average ............................. 18
Figure 7: State of implementation of “transparency” measures among African economies ............................... 21
Figure 8: State of implementation of trade “formalities” measures among African economies ......................... 22
Figure 9: State of implementation of “institutional arrangement and cooperation” measures among Africa
economies ..................................................................................................................................................... 24
Figure 10: State of implementation of “paperless trade” measures in African economies.................................. 27
Figure 11: State of implementation of “cross-border paperless trade” measures among African economies .... 28
Figure 12: State of implementation of “transit facilitation” measures in African economies .............................. 29
Figure 13: Three main challenges in implementing trade facilitation................................................................... 32
Figure 14: Trade facilitation implementation and Trade Costs of Global economies ........................................... 33
Figure 15: Moving up the trade facilitation ladder towards seamless international supply chains ..................... 36

6
Abbreviations
AAEC African Alliance for Electronic Commerce AEO Authorized economic operator
APoA Almaty Programme of Action
ASYCUDA Automated System for Customs Data
AUC African Union Commission CEMAC Communauté Economique et Monétaire de l'Afrique Centrale
COMESA Common Market for Eastern and Southern Africa EAC East Africa Community ECA United Nations Economic Commission for Africa
ECCAS Economic Community of Central African States
ECE United Nations Economic Commission for Europe
ECLAC United Nations Economic Commission for Latin America and the Caribbean
ECOWAS Economic Community of Western African Countries
ESCAP United Nations Economic and Social Commission for Asia and the Pacific
ESCWA United Nations Economic and Social Commission for Western Asia
GATT General Agreement on Tariffs and Trade
ICT Information and communications technology
IRU International Road Transport Union
ITC International Trade Centre
LDC Least developed country
LLDC Landlocked developing country NTFC National trade facilitation committee
OECD Organization for Economic Co-operation and Development PACCI Pan African Chamber of Commerce and Industry (PACCI) RADDEx Revenue Authorities Digital Data Exchange SADC Southern African Development Community SELA Latin American and Caribbean Economic System
SIDS Small island developing states
TF Trade facilitation
TFA Trade Facilitation Agreement UN/CEFACT United Nations Centre for Trade Facilitation and Electronic Business
UNCTAD United Nations Conference on Trade and Development UNNExT United Nations Network of Experts for Paperless Trade and Transport for Asia and
the Pacific
UNRC United Nations Regional Commission
USA United States of America
USD United States dollar WAEMU West African Economic and Monetary Union WTO World Trade Organization

7
Introduction
1.1 Background and objective
There is a unanimous consensus in the international trade literature on the fact that
disproportionately high trade-related costs constrain Africa’s participation to international trade,
acting as an obstacle to firms’ effective participation in regional and global value chains. Whether
looking at direct measures of trade costs, such as those drawn from the World Bank Doing Business
data base, or to indirect measures inferred from theoretical approaches – like the comprehensive
trade costs of the ESCAP-World Bank International Trade Cost Database – trade frictions appear to
create a competitiveness wedge that puts African traders at a disadvantaged position.
Recent studies suggest that much of the trade cost reductions achieved over the past decade
have been through elimination or lowering of tariffs. Further trade cost reduction therefore, will have
to come from tackling non-tariff sources of trade costs, such as inefficient transport and logistics
infrastructure and services, but also cumbersome regulatory procedures and documentation. In line
with this evidence, empirical research suggests that addressing lengthy and expensive custom
procedures and upgrading infrastructural provision could go a long way in unleashing the region’s
trade potential. Furthermore, research points to the fact that trade facilitation measures could
significantly boost the gains from regional integration initiatives, allowing a greater number of
countries to reap the benefits from the trade liberalization envisaged in the Tripartite Free Trade Area
- TFTA or the Continental Free Trade Area - CFTA (ECA, AUC and AfDB 2012, Mevel and Karingi 2013,
Valensisi et al 2014).
Against this background, African policy-makers have recognized the strategic importance of
trade facilitation for the development of their economies. As documented in ECA (2013), regardless of
the process of negotiation of the WTO Trade Facilitation Agreement (TFA), several trade facilitation
reforms have been undertaken on the continent at a national or sub-regional level, often in the
context of Regional Economic Communities (RECs) Trade facilitation has also been included as one of
the priority clusters of the African Union Action Plan for Boosting Intra-African Trade (BIAT) and the
international community has supported these efforts through increasing Aid for Trade flows (ECA,
2015a).
Notwithstanding the “buy-in” of the trade facilitation agenda by African countries, one of the
key challenges in assessing the degree of implementation of reforms, and their impact on the real
economy has traditionally been the lack of systematic and reliable information about what is
happening on the ground. The present report represents a key step in tackling this very issue; it

8
provides the basis for a more evidence-based discussion of trade facilitation in Africa, and for better
tailoring capacity building and technical support in designing and implementing trade facilitation
strategies. The report presents and analyses the findings of the Global Survey on Trade Facilitation
and Paperless Trade Implementation, a joint initiative of the five United Nations Regional
Commissions (UNRCs), in cooperation with other interested international organizations.
The report is structured as follows. The next session will briefly outline the survey instrument
and methodological issues, and is followed by a region-wide overview of implementation of trade
facilitation measures across countries, sub-regions and in countries with special needs. Section 4
focuses on the implementation levels of the various groups of trade facilitation measures, as well as a
review of the main trade facilitation achievements reported by African economies over the past year
and the key challenges faced. Finally section 5 concludes and draws some policy implications on the
way forward
1.2 Survey Instrument and Methodology
The Global Survey on Trade Facilitation and Paperless Trade Implementation has been
prepared in close consultation by the 5 UNRC, building on the annual regional exercise carried out by
un-ESCAP since 2012. The survey targeted a broad array of actors: namely government officials,
practitioners (like representatives of single windows or corridor management organizations), private
sector representatives and researchers. In terms of questions composing the survey, the latter
reflects the final list of provisions included in the WTO TFA, as well as measures on cross-border
paperless trade facilitation discussed in the context of the regional UN treaty under negotiation at
ESCAP.
Overall, the questionnaire covers 38 trade facilitation measures divided into four groups,
namely, General trade facilitation measures (sub-divided further into Transparency, Formalities,
Institutional arrangement and cooperation), Paperless trade, Cross-border paperless trade and Transit
facilitation, as per Table 1. In this respect, general trade facilitation measures and transit facilitation
measures represent essentially instruments that feature in the WTO TFA, unlike most paperless trade
and cross-border paperless trade, which fall outside the scope of the agreement even though their
implementation in many cases would support the better implementation of many of the General
trade facilitation measures. It is worth noting that, to ensure comparability of implementation levels
across countries, two of the measures classified under Institutional arrangement and cooperation (No
33, 34), one measure under Paperless trade (No 20), and one measure under Transit facilitation (No
35) are excluded from the computation of country’s and sub-regional implementation levels.

9
Table 1: Grouping of trade facilitation measures included in the questionnaire
Trade facilitation measure (and question No) in the questionnaire
General TF measures
Transparency
2 Publication of existing import-export regulations on the Internet 3 Stakeholder consultation on new draft regulations (prior to their finalization) 4 Advance publication/notification of new regulation before their implementation (eg, 30 days prior) 5 Advance ruling (on tariff classification) 9 Independent appeal mechanism (for traders to appeal Customs and other relevant trade control agencies’ rulings)
Formalities
6 Risk management (as a basis for deciding whether a shipment will be or not physically inspected) 7 Pre-arrival processing
8 Post-clearance audit 10 Separation of Release from final determination of customs duties, taxes, fees and charges
11 Establishment and publication of average release times
12 Trade facilitation measures for authorized operators
13 Expedited shipments
14 Acceptance of paper or electronic copies of supporting documents required for import, export or transit formalities
Institutional arrangement
and cooperation
1 Establishment of a national trade facilitation committee or similar body
31 Cooperation between agencies on the ground at the national level 32 Government agencies delegating controls to Customs authorities
33 Alignment of working days and hours with neighbouring countries at border crossings, and 34 Alignment of formalities and procedures with neighbouring countries at border crossings
Paperless trade
15 Electronic/automated Customs System established (eg, ASYCUDA) 16 Internet connection available to Customs and other trade control agencies at border-crossings
17 Electronic Single Window System
18 Electronic submission of Customs declarations
19 Electronic Application and Issuance of Trade Licenses
20 Electronic Submission of Sea Cargo Manifests
21 Electronic Submission of Air Cargo Manifests
22 Electronic Application and Issuance of Preferential Certificate of

10
Origin
23 E-Payment of Customs Duties and Fees
24 Electronic Application for Customs Refunds
Cross-border paperless trade
25 Laws and regulations for electronic transactions are in place (eg e-commerce law, e-transaction law) 26 Recognized certification authority issuing digital certificates to traders to conduct electronic transactions
27 Engagement of the country in trade-related cross-border electronic data exchange with other countries
28 Certificate of Origin electronically exchanged between your country and other countries
29 Sanitary & Phyto-Sanitary Certificate electronically exchanged between your country and other countries
30 Banks and insurers in your country retrieving letters of credit electronically without lodging paper-based documents
Transit facilitation
35 Transit facilitation agreement(s) with neighbouring country(ies) 36 Customs Authorities limit the physical inspections of transit goods and use risk assessment 37 Supporting pre-arrival processing for transit facilitation
38 Cooperation between agencies of countries involved in transit
The dataset was developed as follows. First, the survey instrument was sent by the ECA
Secretariat to selected African experts – notably participants to various regional meetings related to
trade facilitation and integrated border management – and to relevant national authorities. The
questionnaire was also made publicly available online and disseminated with the support of the
African Union Commission (AUC), the African Alliance for Electronic Commerce (AAEC), the Pan
African Chamber of Commerce and Industry (PACCI), as well as OECD, ITC, and UNCTAD. This first step
took place essentially between September 2014 and March 2015.
Secondly, ECA Secretariat validated responses received through desk research and in some
cases through telephone interviews with key informants. Validation was carried out to the extent
possible by crosschecking questionnaire responses (in many cases several responses were received
for the same country) and “triangulating” various other sources of information; data sharing among
UNRCs and survey partners were carried out to further check the accuracy of data. This step took
place essentially between March and May 2015, and allowed to obtain a consistent dataset covering
28 African countries; that is more than half the number of African nations.1 Preliminary results were
finally validated with government officials at a joint ECA-WTO regional seminar on Aid for Trade,
which took place in Addis Ababa in June 2015.
1 ECA directly collected and validated responses from 26 African countries, in each case having at least one reply from a
government official or a representative of the single window. For the two remaining countries (Egypt and Sudan) data was kindly made available by ESCWA.

11
For the purpose of analysis and presentation of the results, General trade facilitation measures
have been further divided into three sub-groups, namely, Transparency, Formalities, Institutional
arrangement and cooperation, as shown in Table 1. Based on the data collected, each of the trade
facilitation measures included in the survey and for which enough information was available was
rated either as “fully implemented”, “partially implemented”, “on a pilot basis”, or “not
implemented”. Definitions for each stage are provided in Annex 1 A score (weight) of 3, 2, 1 and 0 was
assigned to each of the 4 implementation stages in order to calculate implementation scores for
individual measures across countries, regions or categories. Whenever respondents were not able to
assess whether a measure had been implemented, a “Don’t know” answer was added. In this survey it
is assumed that any lack of knowledge about a measure is a consequence of its non-implementation.
As a result “Don’t know” answers were coded 0.
In light of the above, a few caveats are of order when interpreting the findings of the survey.
Responses to the questionnaire should not be intended as assessing the compliance with the legal
obligations arising from WTO’s TFA, or as a substituted for the needs assessment. Neither should they
be read as performance indicators, such as the World Bank’s Doing Business indicators or Logistic
Performance indices. In spite of validation efforts, survey findings ultimately remain qualitative data
drawn from the informed opinions of relevant government officials, practitioners and private sector
representatives. Nonetheless, they provide valuable information that complements more objective
assessments of countries’ developments on the trade facilitation front.
It is also worth noting that the incomplete coverage of the survey may potentially introduce
some distortions in the computation of regional and sub-regional averages, in so far as some sub-
regions (notably Central Africa) are considerably under-represented. Moreover, Least Developed
Countries (LDCs) – and to a smaller extent landlocked countries (LLDCs) – are under-represented in
the survey sample compared to the reality: the 28 countries for which data are available include 16
LDCs and 8 LLDCs, compared to a real number of 34 and 16 respectively, out of the total 54 countries
in Africa. This may suggest some potential sample selection bias, in so far as it proved challenging to
obtain responses for the most vulnerable African countries, particularly those in conflict or post-
conflict situation.

12
Trade facilitation implementation in Africa: Overview
Overall levels of implementation amongst the 28 African countries, for which data is available,
based on a common set of 31 trade facilitation and paperless trade measures included in the survey
are presented in Figure 1.2 According to questionnaire responses, the regional average
implementation of this comprehensive set of trade facilitation measures stands at 45 per cent; a
rather low level by international comparison, as can be gauged by the companion reports on the
Global Survey on Trade Facilitation and Paperless Trade Implementation conducted in other regions.
There is, however, some heterogeneity across countries. Economies like Benin, Kenya, Mauritius,
Morocco, and Uganda report implementation rates in excess of 55 per cent, while implementation in
other countries such as Comoros, Djibouti and Niger barely reaches 30 per cent.
Figure 1: Overall implementation of trade facilitation and paperless trade measures
Source: ECA, UNRCs TF Survey 2015
2 Among the 38 trade facilitation measures surveyed, three measures namely Electronic Submission of Sea Cargo
Manifests, Alignment of working days and hours with neighbouring countries at border crossings, and Alignment of formalities and procedures with neighbouring countries at border crossings are excluded for calculating the overall score as they are not relevant to all countries surveyed. Similarly, four transit facilitation measures are also excluded. The overall score of each country is simply a summation of the scores of implementation (3,2,1 or 0) it receives for each trade facilitation measure. The maximum possible score of a country is 93 and the average score across all 28 African countries is 42 (corresponding to 45 per cent).
0%
10%
20%
30%
40%
50%
60%
70%
80%
90%
100%
Be
nin
Bo
tsw
ana
Bu
rkin
a Fa
so
Cam
ero
on
Co
mo
ros
Co
ngo
Cô
te d
'Ivo
ire
Djib
ou
ti
Egyp
t
Gam
bia
Gh
ana
Ke
nya
Leso
tho
Mad
agas
car
Mal
awi
Mal
i
Mau
riti
us
Mo
rocc
o
Mo
zam
biq
ue
Nam
ibia
Nig
er
Nig
eri
a
Sen
egal
Sud
an
Tan
zan
ia
Togo
Uga
nd
a
Zim
bab
we
Transparency Formalities
Institutional arrangement and cooperation Paperless trade
Cross-border paperless trade Africa average

13
Broadly speaking, more advanced African economies tend to display higher levels of
implementation of trade facilitation measures, compared to less developed countries. There are
exceptions, however: Benin (a low income LDC country) records the third highest score in the sample,
whilst other LDCs such as Senegal Tanzania and Uganda also rank high. In general, as will be explained
in more detail later on, implementation rates tend to be fairly high for general trade facilitation
measures (55 per cent), in particular formalities (60 per cent). In countries where they are applicable,
transit facilitation measures also tend to display an encouraging level of implementation, mainly
thanks to initiatives at REC level. Conversely, measures related to paperless trade and cross-border
paperless trade typically appear to be weakly implemented in Africa (with average rates of
implementation of 42 per cent and 21 per cent respectively).
From the point of view of data reliability, it is reassuring to note that country scores obtained
through the survey correlate as expected with commonly used measures of trade frictions, such as
the World Bank’s Doing Business indicators related to Trading Across Borders. Higher survey scores
tend to be associated with shorter delays and lower costs for both import and export; as can be seen
in Figure 2, the negative correlation is particularly strong (-0.55) in the case of time to export.
Figure 2: Trade facilitation implementation and trade-related costs
Source: ECA, UNRCs TF Survey 2015 and Doing Business 2015 data
0
10
20
30
40
50
60
25 30 35 40 45 50 55 60
Tim
r to
exp
ort
s, d
ays
(WB
20
15
)
Survey score

14
2.1 Implementation in sub-regions and countries with special needs
An overview of the implementation of trade facilitation measures (measured in percentages)
by main area and by the different African sub-regions is presented in Figure 33. Admittedly, the
meaningfulness of sub-regional comparisons is somewhat reduced by two data limitations: the small
number of observations in several sub-regions (notably Central and Northern Africa), and the
heightened variability of implementation rates, even within the same sub-regions (especially in the
case of Eastern and Southern Africa, which include some of the best and worst performers in the
region).
Despite this, a few considerations can be drawn from Figure 3. Different African sub-regions
rank close to each other in terms of implementation of trade facilitation measures related to
transparency and formalities, but when looking at other measures the situation becomes more
nuanced. Eastern Africa appears to lag behind in terms of implementation of trade facilitation reforms
related to institutional arrangements, but to be the lead for what attains to paperless trade and
transit facilitation issues, largely because of the good implementation rates of member countries of
the East African Community. Northern Africa, conversely, displays high implementation rates in terms
of institutional arrangements and cooperation, but appears to lag behind when it comes to transit
facilitation issues. 4 Levels of implementation in Southern Africa seem to follow rather closely the
overall regional average, with the exception of measures related to cross-border paperless trade,
where the sub-region seems to lag behind other African countries.
Notwithstanding the heterogeneity across different countries, it remains instructive to
contrast the levels of implementation across different categories of countries, highlighting the
challenges of countries with special needs. Comparing African Least Developed Countries (LDCs) with
non-LDC countries in the region, the former appear to be characterized on average by a lower level of
implementation (Figure 4). The gap between the two groups of countries is particularly significant for
what pertains to institutional arrangements and formalities, but emerges also with regards to other
groups of trade facilitation measures (though it should be kept in mind that the whole region displays
relatively lower levels of implementation with reference to paperless trade issues).
3 Measures pertaining to Electronic Submission of Sea Cargo Manifests, Alignment of working days and hours with
neighbouring countries at border crossings, and Alignment of formalities and procedures with neighbouring countries at border crossings, as well as Transit Facilitation are excluded for the computation of the percentages in Figure 3, since they do not apply to all countries surveyed. 4 The lack of interest in transit facilitation in Northern African countries could arguably reflect the low levels of trade
amongst themselves, and between them and Sahelian countries, with the Sahara hampering in any case large trade flows by land.

15
Figure 3: Implementation of trade facilitation and paperless trade measures, by sub-region and by main thematic area
Source: ECA, UNRCs TF Survey 2015
Taking into account also the narrative information provided by respondents on the various
measures, as well as on the challenges faced in implementing trade facilitation reforms, one possible
explanation for this pattern seems to be the fact that LDCs are confronted with greater institutional
challenges. Coordination issues and difficulties in addressing the political economy challenges related
to trade facilitation reforms are indeed often cited by LDC respondents as key impediments in the
implementation of the said reforms. A case in point could be the lack of formal cooperation
arrangements amongst border agencies in most LDCs. Another telling example, with respect to
formalities, comes from the incomplete implementation of risk management practices in numerous
LDCs, with several respondents reporting that different border agencies use distinct risk management
approaches.
The juxtaposition is less clear-cut in the case of landlocked countries (LLDCs) as opposed to
coastal countries (Figure 5). Landlocked countries tend to perform not significantly different from
non-LLDCs in general trade facilitation measures, but display a lower level of implementation than
coastal countries in terms of paperless trade, and cross-border paperless trade measures. As for the
region more generally, a possible interpretation of this finding is that LLDCs have tended to prioritize
general trade facilitation measures, which represent the most binding constraint on their trade
capacities, thereby exacerbating their geographical disadvantage.
0%
10%
20%
30%
40%
50%
60%
70%
80%
90%
100%
Transparency Formalities Institutionalarrangement and
cooperation
Paperless trade Cross-borderpaperless trade
Central Africa (2 countries) Eastern Africa (6 countries) Northern Africa (3 countries)
Southern Africa (7 countries) Western Africa (10 countries) Regional Average

16
Figure 4: Implementation of trade facilitation measures, in African LDCs and non-LDC countries
Source: ECA, UNRCs TF Survey 2015
Figure 5: Implementation of trade facilitation measures, in African LLDCs and non-LLDC countries
Source: ECA, UNRCs TF Survey 2015
0%
20%
40%
60%
80%
100%Transparency
Formalities
Institutionalarrangement
& cooperation
Paperlesstrade
facilitation
Cross-borderpaperless
trade
Average LDCs (16countries)Average Non-LDCs
Regional Average
Maximum possiblescore
0%
20%
40%
60%
80%
100%Transparency
Formalities
Institutionalarrangement
& cooperation
Paperlesstrade
facilitation
Cross-borderpaperless
trade
Average LLDCs(7 countries)
Average Non-LLDCs
RegionalAverage
Maximumpossible score

17
Coming finally to SIDS, the survey allowed collecting data covering only two of them, namely
Comoros and Mauritius, with huge heterogeneity amongst them in terms of implementation of the
trade facilitation agenda. The experience of these two countries would hardly be informative of the
generalized situation of SIDS, and for this reason the related comparisons vis-à-vis non-SIDS countries
is not treated here.
2.2 Most and least implemented trade facilitation measures
Confirming earlier ECA research (for instance ECA, 2013), survey responses suggest that all
African countries are engaged in various trade facilitation reforms, yet the pace of such reforms is
uneven. In this respect, differences in overall implementation scores across countries are
compounded with wide differences in the level of implementation across the different measures,
even within the same thematic area. Overall, as shown in Figure 6 and Table 3, “Transit” measures,
have been the best implemented (regional average implementation 62 per cent), followed by
“formalities” measures such as Post-clearance audit and Acceptance of paper or electronic copies of
supporting documents required for import, export or transit formalities (61 per cent). Measures
aimed at ensuring “Institutional arrangement and inter-agency cooperation”, in particular
implementation of Cooperation between agencies on the ground at the national level and
Establishment of National Trade Facilitation Committee, have also been given serious attention in
many African economies, with the regional average implementation rate exceeding 50 per cent in
that category. The average implementation rate reaches approximately 50 per cent also for measures
related to “transparency”, in particular as many countries are working on Publication of existing
import-export regulation on the internet.
Conversely, the regional average level of implementation of “paperless trade” measures stand
at less than 44 per cent; moreover, implementation varies greatly depending on the individual
measures considered. For example, while Internet connections available to Customs and other trade
control agencies at border-crossings and Electronic/automated Customs System are partially or fully
implemented in nearly all countries, facilities enabling the Electronic exchange of sanitary and phyto-
sanitary certifications have yet to be considered for implementation in many economies. Similarly,
while many economies have developed legal frameworks to enable paperless trade, implementation
of “cross-border paperless trade” has yet to begin in many countries.
The next section reviews regional implementation of the 6 groups of measures featured in
Figure 6 and Table 3 in more details.

18
Figure 6: Implementation of different groups of trade facilitation measures: Africa average
Note: Blue dots show regional average implementation level of individual measures within each
thematic area; conversely, red lines indicate regional average implementation level by thematic area
Source: ECA, UNRCs TF Survey 2015
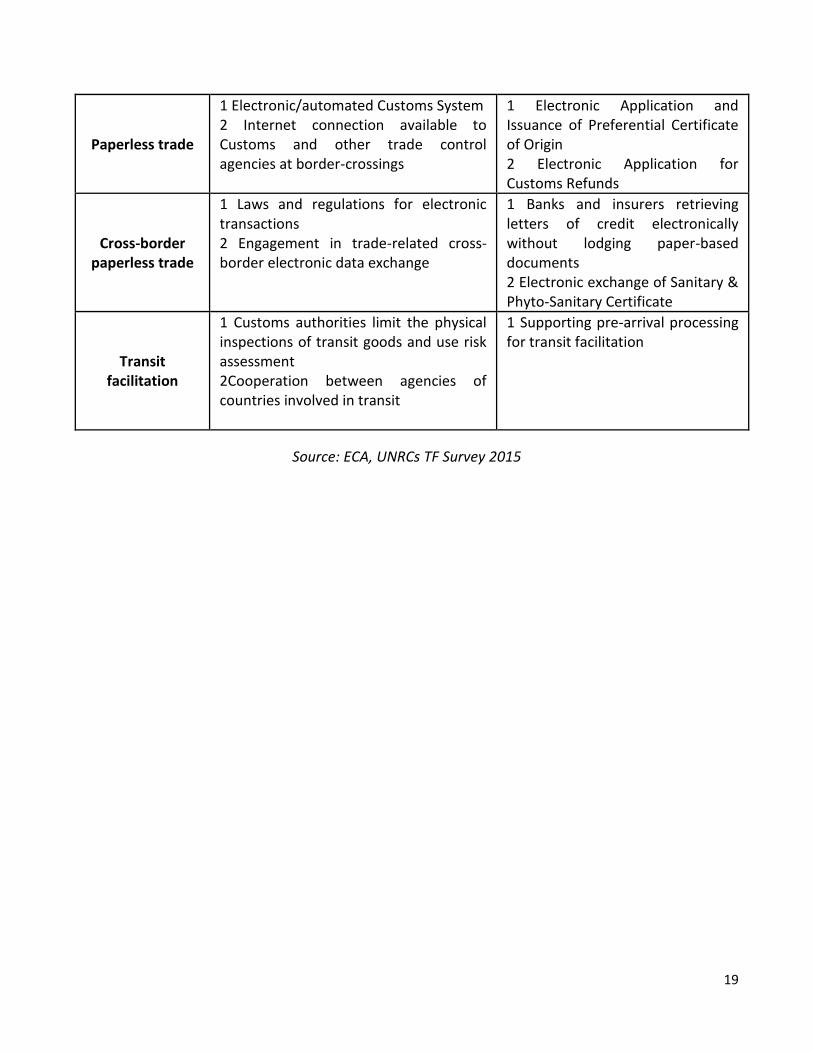
Table 2: Most and least implemented measures in Africa (within each group of trade facilitation measures)
Most implemented Least implemented
Transparency
1 Publication of existing import-export regulations on the internet 2 Stakeholder consultation on new draft regulations (prior to their implementation)
1 Advance ruling (on tariff classification) 2 Advance publication/notification of new regulation before their implementation
Formalities
1 Post-clearance audit 2 Acceptance of paper or electronic copies of supporting documents required for import, export or transit formalities
1 Establishment and publication of average release times
2 Trade facilitation measures for authorized operators
Institutional arrangement
and cooperation
1 Cooperation between agencies on the ground at the national level 2 Establishment of National Trade Facilitation Committee
1 Government agencies delegating controls to Customs authorities
0%
10%
20%
30%
40%
50%
60%
70%
80%
90%
100%
Transparency Formalities InstitutionalArrangement and
Cooperation
Paperless Trade Cross-borderPaperless Trade
Transit
19
Paperless trade
1 Electronic/automated Customs System
2 Internet connection available to Customs and other trade control agencies at border-crossings
1 Electronic Application and Issuance of Preferential Certificate of Origin
2 Electronic Application for Customs Refunds
Cross-border paperless trade
1 Laws and regulations for electronic transactions
2 Engagement in trade-related cross-border electronic data exchange
1 Banks and insurers retrieving letters of credit electronically without lodging paper-based documents
2 Electronic exchange of Sanitary & Phyto-Sanitary Certificate
Transit facilitation
1 Customs authorities limit the physical inspections of transit goods and use risk assessment 2Cooperation between agencies of countries involved in transit
1 Supporting pre-arrival processing for transit facilitation
Source: ECA, UNRCs TF Survey 2015

20
Implementation of trade facilitation measures: A closer look
3.1 “Transparency” measures
As shown in Table 1, amongst the general trade facilitation measures, five can be categorized
as “transparency” measures. They relate to Articles 1-5 of the WTO TFA and GATT Article X on
Publication and Administration of Trade Regulations. On average, the level of implementation of
transparency measures in Africa stands at 50 per cent; slightly higher compared to the overall regional
implementation level (45 per cent), but still the lowest amongst the three thematic areas pertaining
to general trade facilitation measures.
Figure 7 lists the percentage (number) of countries that have fully and partially implemented
each “transparency” measure in descending order, taking into account the sum of partly and fully
implemented responses. The chart documents an encouraging progress, notably in the case of the
three most implemented transparency measures; nonetheless, it is sobering to note that many
African countries report transparency measures as being only partly implemented. Publication of
existing import-export regulations, and stakeholders’ consultation on new draft regulation appear to
be the two “most implemented measures”, with over two thirds of the countries covered reporting
full or partial implementation. Several respondents pointed out, however, that published regulation
are not routinely updated nor easily accessible in the internet, whilst consultation often takes place
on an ad hoc basis. In the same vein, less than 15 per cent of the countries have fully established an
independent appeal mechanism, with another 42 per cent having partly implemented the
corresponding measure.
Conversely, implementation of advance rulings and advance publication of new regulations is
found to be relatively weak, with less than one third of countries surveyed reporting either full or
partial implementation. The feeble implementation of these two is driven especially by LDC countries,
pointing once again to institutional challenges, notably in providing advance rulings with legal validity,
rather than of a merely non-binding nature.
The overall implementation level (50 per cent), as well as the relatively low number of
countries reporting full implementation, suggests ample scope for enhancing the transparency of
custom procedures. Interestingly, though, African countries appear to display strong willingness to
move in that direction, as it is suggested by the widespread shifts towards implementation, even at
the pilot stage Indeed non-implementation is limited to less than 25 per cent, even for the least
implemented measures.

21
Figure 7: State of implementation of “transparency” measures among African economies5
Source: ECA, UNRCs TF Survey 2015
3.2 “Formalities” facilitation measures
Eight of the general trade facilitation measures included in the survey are categorized as
“formalities” (see Table 2), and are essentially aimed at streamlining and/or expediting custom
procedures. They relate to Articles 6-10 of the WTO TFA and GATT Article VIII on “Fees and
Formalities connected with Importation and Exportation”. The level of implementation across Africa is
found to be relatively high (61 per cent), turning formalities into the area of trade facilitation whereby
African countries report the second-highest average implementation rate (Figure 6). Moreover, the
level of implementation appears to be broadly homogeneous across formalities (exceeding 50 per
cent in all but the least implemented measure) even though with significant variations across
countries.
As before, Figure 8 lists, in descending order, the percentage (number) of countries that have
implemented each “formality” measure. Post-clearance audit and separation of release from final
determination of duties turn out to be the most implemented measures, with over 90 per cent of
5 The figures reported in the middle of the bar-charts, here and in the following six graphs, represent the number of
African countries at each level of implementation, whereas the axis translate the same values in terms of percentage of respondents.
3
6
4
6
2
17
13
12
4
3
8
7
9
11
16
0
2
3
7
7
0% 10% 20% 30% 40% 50% 60% 70% 80% 90% 100%
Publication of existing import-export regulations onthe internet
Stakeholder consultation on new draft regulations(prior to their finalization)
Independent appeal mechanism
Advance publication/notification of new regulationbefore their implementation
Advance ruling (on tariff classification)
Fully implemented Partially implemented
Pilot stage of implementation Not Implemented

22
African countries covered in the survey reporting some degree of implementation (full, partial or
pilot). At the other end of the spectrum, measures for authorized operators and establishment and
publication of average release times are the measures with the lowest implementation rates, broadly
in line with the findings in other world regions.
In general, notwithstanding the encouraging progress reported above, several narrative
examples provided by respondents point to some gaps in the effectiveness of trade facilitation
measures related to formalities. For instance, various respondents reported the limited utilization, on
the parts of the private sector, of measures intrinsically aimed at reducing trade-related costs, such as
the separation of release from final determination of duties, post-clearance audit, and authorized
operators. This suggests that, in spite of some obvious potential gains, the specific design and
incentive structure of each trade facilitation measure is critical in ensuring the effectiveness of
reforms aimed at streamlining custom procedures.
Figure 8: State of implementation of trade “formalities” measures among African economies
Source: ECA, UNRCs TF Survey 2015
17
8
6
13
6
2
5
5
7
13
14
7
13
13
8
8
2
6
5
6
6
11
11
9
2
1
3
2
3
2
4
6
0% 10% 20% 30% 40% 50% 60% 70% 80% 90% 100%
Post-clearance audit
Separation of Release from final determination ofcustoms duties, taxes, fees and charges
Expedited shipments
Acceptance of paper or electronic copies ofsupporting documents for import, export or transit…
Pre-arrival processing
Risk management
Trade facilitation measures for authorized operators
Establishment and publication of average releasetimes
Fully implemented Partially implemented
Pilot stage of implementation Not Implemented

23
Whilst risk management represent the third least implemented formality measure, it is
noteworthy to observe that its implementation appears to pose some challenges to African countries.
This is evident from the fact that 24 of them (out of 28) are implementing risk management partially
or in pilot stage, but only 2 countries are implementing them fully. Anecdotal evidence suggests that
in most cases the difficulty lies in the fact that different border agencies utilize different risk
management approaches, thereby partly dampening the positive effect of the measure. Another
binding constraint is rather of infrastructural nature, and stems from the fact that a large number of
countries does not have cold storage facilities for perishable goods at land-border crossing.
With reference to authorized operators, it is worth noting that, although much still remains to
be done, things are starting to move, for example with the adoption of regimes such as the “Gold-
Card scheme” in Ghana, or the “Contrat de performance” in Cameroun. WAEMU and ECOWAS have
also piloted interventions to set-up authorized operator schemes at Western Africa level.
Interestingly, if measures for authorized operator typically lend themselves to be exploited mainly by
large firms, it is worth mentioning that similar schemes have also been adopted with the aim of
“formalizing” informal cross-border trade. A noteworthy example in this respect is COMESA’s
Simplified Trade Regime, which streamlines procedures for SMEs and traders of specified goods under
a certain value threshold.
Concluding with formalities, it is important to underscore the value of establishment of
publication of average release times, which represents the least implemented formality in the region.
This measure plays a fundamental role in enabling a regular monitoring of terminals’ and customs’
performance, and in assessing the actual impact of other trade facilitation measures on time-costs. In
light of this, policymakers should pay due attention to the implementation of this measure, as it could
be potentially conducive to other trade facilitation reforms, as well as enabling a closer monitoring of
their impacts.
3.3 “Institutional arrangement and cooperation” measures
The next group of trade facilitation measures featured in the survey are grouped under
“Institutional arrangements and cooperation” measures. They essentially address the complex
political economy dimension of trade facilitation reforms, and relate to the long-standing
recommendation that a national trade facilitation body be established, and other measures be
implemented to ensure coordination and cooperation among the various agencies and stakeholders
involved in facilitating trade. These measures are also specified in various Articles of the WTO TFA,
with the establishment of the Trade Facilitation Committee being mandatory under article 132 of the
agreement.
Somewhat surprisingly, even though these measures refer essentially to institutional reforms
that entail very limited costs, their rate of implementation is generally not different from that of other

24
measures under “General trade facilitation”, and actually lower than that of “Formalities” (Figure 6).
The low level of implementation is particularly pronounced in the case of African LDCs, pointing to
some outstanding institutional challenges in ensuring an adequate degree of coordination across all
stakeholders involved in trade facilitation activities. Moreover, such coordination problems are often
compounded with capacity development challenges, and weak participation of the domestic private
sector in shaping the reform agenda.
As shown in Figure 9, while Cooperation between agencies is rather widespread in the region,
the results show that implementation has been essentially partial. In fact, only 4 countries have fully
implemented that measure, highlighting the fact that strengthening cooperation among agencies is an
on-going process. Arguably, the ultimate form of inter-agency collaboration is the delegation of
authority by one or more agencies to another, as suggested by the measure Government agencies
delegating controls to Customs authorities. Not surprisingly, this latter measure has only been either
fully or partially implemented in few countries (less than 50 per cent) whilst it is in the pilot stage in
approximately 20 per cent of the economies.
Figure 9: State of implementation of “institutional arrangement and cooperation” measures among Africa economies
Source: ECA, UNRCs TF Survey 2015
Ample improvements are possible also in relation to the Establishment of National Trade
Facilitation Committee, whose set-up is mandatory under the WTO TFA. Indeed, only 20 per cent of
4
7
6
16
10
7
4 4
4
7 2
0% 10% 20% 30% 40% 50% 60% 70% 80% 90% 100%
Cooperation between agencies on the ground atthe national level
National Trade Facilitation Committee
Government agencies delegating controls toCustoms authorities
Fully implemented Partially implemented
Pilot stage of implementation Not Implemented
Don't know / Missing

25
African countries have established a fully operational committee, whilst the implementation for the
majority of the economies have been partial and it is not thus clear to what extent the committee
may impact on policies towards trade facilitation.
Whilst this is not applicable to all countries (for instance not to islands) – and for this reason
the corresponding measures have not been included in the chart, nor in the computation of country’s
scores – “Institutional arrangements and cooperation” measures also include alignment of formalities
and working hours at border crossings (see measures 33 and 34 in Table 1). In this respect, it is worth
mentioning that several African countries have aligned, at least party, their formalities and working
hours. Typically, this has happened along the most important trading corridors, often in the context of
the establishment of One Stop Border Posts.
3.4 “Paperless trade” measures
The following group of trade facilitation measures covered in the survey is related to
“paperless trade”; that is to measures that involve the use and application of modern information and
communications technologies (ICT) to trade “formalities”, starting from the availability of internet
connections at border-crossings and customs automation to full-fledge electronic single window
facilities. Many of the measures featured below are closely related to those specified in the WTO TFA,
although in the agreement they typically feature as part of “best endeavour clauses”, rather than as
part of a binding legal requirement.
The degree of implementation of paperless trade measures in Africa varies widely across
instruments, but generally speaking it is significantly lower than the one for general trade facilitation
measures. Moreover, even when some efforts have been made, most African countries have taken
only partial steps towards implementation (Figure 10). The adoption of automated custom systems
represents a notable exception to this broad statement, with over 90 per cent of African countries
responding to the survey stating that they have fully or partly implemented the above measure. Such
a high rate of implementation (the second-highest across all 38 measures covered by the survey), is
largely a reflection of the fact that as many as 41 African countries have deployed different versions
of the ASYCUDA (a computerised customs management system developed by UNCTAD).6 Nearly 90
per cent of African countries responding to the questionnaire also report to have at least partially
made available Internet connection at border-crossings. Similarly, Electronic submission of Customs
Declaration has been fully or partially implemented by 4 and 14 countries, respectively (above 60 per
cent of the countries surveyed). Electronic payment of Customs duties, and Electronic submission of
air cargo manifests are also at least partially available in roughly two thirds of the countries surveyed,
although full implementation is limited to approximately 20 per cent of them. Implementation rates
6 For more detail, refer to http://wwwasycudaorg

26
for the electronic submission of Sea Cargo manifest (reported separately because it is not applicable
to all countries) are only slightly lower.
Beyond the above-mentioned “paperless trade measures” the deployment of trade-related
electronic services appears, however, to be only incipient. Often regarded as one of the most
expensive but also efficiency-enhancing trade facilitation measure, the roll out of electronic Single
Windows has attracted growing interest on the continent, largely thanks to the leading examples of
the Ghana’s GCNET and Senegal’s GAINDE. Yet, for the time being African countries engaged in this
complex reform are still in the process of piloting or rolling out the Single Window system to all
concerned agencies and stakeholders.7 It is interesting to mention, however, that discussions are
already ongoing, within the WAEMU and the EAC, on the possibility of inter-face national Single
Windows into a regional one.
Interestingly, relatively simpler measures such as Electronic application and Issuance of Trade
Licenses and Electronic application and Issuance of Preferential Certificate of Origin are even less
implemented than Single Window. Indeed, no African country reported full roll out of Electronic
Application and Issuance of Trade Licenses, Electronic Application for Custom Refunds, and only one
country fully implemented Electronic Application and Issuance of Preferential Rules of Origin (Figure
10). This may be explained in part because such agency-specific systems may become redundant as
single window systems are implemented. However, this also highlights the fact that Customs in most
countries are indeed more advanced than other trade-related agencies in developing and using
electronic and automation system for trade facilitation and compliance. Analogously, there is wide
scope for improvement when it comes to Electronic application for Customs refund, a measure which
provides benefits to stakeholder by reducing the costs stemming from the negative consequences of
information asymmetry issues and poor quality of products.
3.5 “Cross-border paperless trade” measures
Remaining in the realm of the “next generation” of trade facilitation instruments, the
following six measures included in the survey are categorized as “cross-border paperless trade”
measures. Two of them, Laws and regulations for electronic transactions and Recognized certification
authority, are basic building blocks towards enabling the exchange and legal recognition of trade-
related data and documents not only among stakeholders within a country, but ultimately along the
entire international supply chain. The other four measures relate to the implementation of systems
enabling the actual exchange of trade-related data and documents across borders to remove the
need for sending paper documents.
7 Typically the piloting of the Single Window starts within a port community, as has been the case, among others, for
Benin’s Guichet Unique Portuaire, Morocco’s Portnet, or Tanzania’s TeSWS.

27
Overall, the level of implementation of “cross-border paperless trade” measures is extremely
low amongst Africa countries (below 25 per cent), reflecting a plausible sequencing in the trade
facilitation priorities of the continent. If roughly 60 per cent of African nations have made some
progress in adopting laws and regulations for electronic transactions, and – to a lower extent – in
pioneering trade-related cross-border electronic data exchange, it remains clear from Figure 11 that
much remains to be done towards enabling cross-border paperless trade.
Figure 10: State of implementation of “paperless trade” measures in African economies
Source: ECA, UNRCs TF Survey 2015
For instance, recognized certification authorities, electronic exchange of certificate of origins
and Sanitary and Phyto-sanitary certificates have yet to be established in the overwhelming majority
13
11
4
5
6
0
0
0
1
13
13
14
13
11
7
7
4
2
1
7
2
3
11
6
3
4
1
2
3
8
8
10
15
18
20
1
3
1
0% 10% 20% 30% 40% 50% 60% 70% 80% 90% 100%
Electronic/automated Customs System
Internet connection available to Customs andother trade control agencies at border-…
Electronic submission of Customs declarations
E-Payment of Customs Duties and Fees
Electronic Submission of Air Cargo Manifests
Electronic Single Window System
Electronic Application and Issuance of TradeLicenses
Electronic Application for Customs Refunds
Electronic Application and Issuance ofPreferential Certificate of Origin
Fully implemented Partially implemented
Pilot stage of implementation Not Implemented
Don't know / Missing

28
of the countries surveyed, being at best implemented only partially or at the pilot stage. Finally, in all
but 3 African countries included in the survey, it is not yet feasible for banks and insurers to retrieve
letters of credit electronically without lodging paper-based documents.
In this respect, it is also worth noting that a significant number of respondents were not able
to assess the degree of implementation of measures such as Electronic exchange of Sanitary and
Phyto-Sanitary certificates and Bank and Insurers retrieving letter of credit electronically without
lodging paper-based documents. Such a result is comparable to similar outcomes from other regional
TF surveys and it is thus a symptom of a widespread lack of specific knowledge about this “next
generation” of trade facilitation measures.
Interestingly, the stimulus to embark in cross-border paperless trade facilitation measures is
often finding its origin in the intensification of intra-African trade relationships. For instance, the EAC
leads the way in terms of implementation of trade-related cross-border electronic data exchange,
with the establishment of the Revenue Authorities Digital Data Exchange (RADDEx). In the same vein,
Mozambique engages in electronic exchange of trade-related documents with Malawi and South
Africa; or again Djibouti exchanges electronic transit declaration with Ethiopia.
Figure 11: State of implementation of “cross-border paperless trade” measures among African economies
Source: ECA, UNRCs TF Survey 2015
4
4
2
0
0
12
5
4
4
3
3
4
1
3
2
2
9
14
18
18
18
13
1
1
3
3
5
10
0% 10% 20% 30% 40% 50% 60% 70% 80% 90% 100%
Laws and regulations for electronic transactions
Engagement in trade-related cross-borderelectronic data exchange
Recognised certification authority
Electronic exchange of Certificate of Origin
Electronic exchange of Sanitary & Phyto-SanitaryCertificate
Banks and insurers retrieving letters of creditelectronically without lodging paper-based…
Fully implemented Partially implemented
Pilot stage of implementation Not Implemented
Don't know / Missing

29
3.6 “Transit facilitation” measures
The last set of measures covered by the survey relates to transit facilitation measures, and is
mainly linked to the WTO TFA Article 11 on Freedom of Transit. 8 The intent of these measures is to
reduce as much as possible all the formalities associated with traffic in transit, allowing goods from
one country and destined to another country to be seamlessly transported through one or more other
transit countries. Transit procedures are paid considerable emphasis in the region, in line with the
presence of several LLDCs (16 out of 54 African countries), and with the interests of various RECs,
which often spearheaded work on transit facilitation. This explains why the implementation rate for
transit facilitation measures is the highest across all thematic areas (on average over 62 per cent), and
broadly uniform across measures (Figure 12)
Figure 12: State of implementation of “transit facilitation” measures in African economies
Source: ECA, UNRCs TF Survey 2015
8 These measures are not directly applicable to all countries in the region, since some of them are unlikely to see any
traffic in transit in their territory; amongst respondents to the questionnaire this is reportedly the case of the three islands (Comoros, Madagascar and Mauritius), but in the case of pre-arrival processing also of Lesotho.
12
9
6
8
11
9
12
9
1
4
5
1
3
2
7
0% 10% 20% 30% 40% 50% 60% 70% 80% 90% 100%
Transit facilitation agreement(s) with neighbouringcountry(ies)
Customs Authorities limit the physical inspections oftransit goods and use risk assessment
Cooperation between agencies of countriesinvolved in transit
Supporting pre-arrival processing for transitfacilitation
Fully implemented Partially implemented
Pilot stage of implementation Not Implemented

30
A relatively large number of African countries have signed transit agreements with
neighbouring countries, or in the context of RECs; accordingly the corresponding measure appears as
the most implemented (once taking into account both full and partial implementation). Provisions to
limit physical inspections of transit goods (including use of container seals and GPS tracking systems),
and to some extent cooperation between agencies of countries involved in transit are also relatively
widespread according to questionnaire respondents. Conversely, the support to pre-arrival processing
for goods in transit appears to be the transit facilitation measure with the weakest implementation.
It is worth recalling that African RECs have been particularly active with respect to transport
and transit facilitation. Not only they have supported the construction of several One Stop Border
Posts, especially in the Western, Eastern and Southern Africa9, but also they have taken various
initiatives aimed at developing regulatory instruments to harmonize the legal framework for transit
facilitation. As noted in ECA 2013, although not many African countries have signed and ratified
international conventions, most of the legal instruments developed by RECs are indeed based on
relevant international conventions, including notably the TIR Convention.
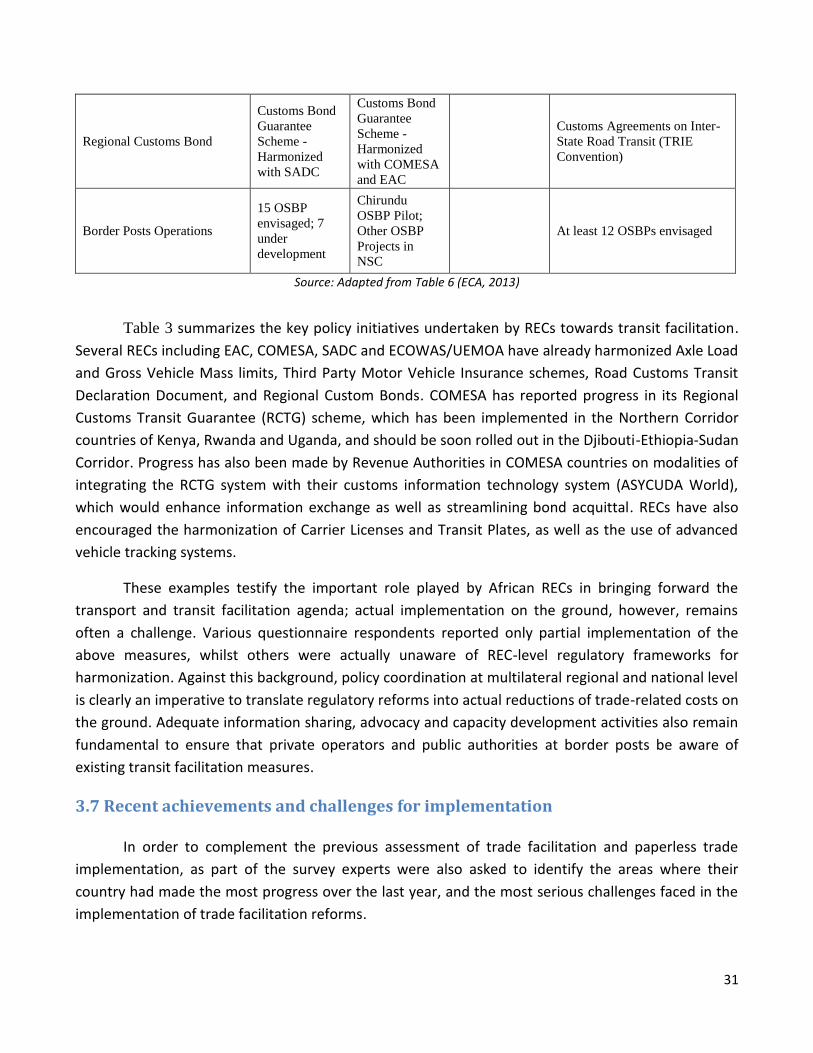
Table 3: Key transit transport initiatives at REC level
Issue for Harmonization
East Africa
EAC
COMESA
Southern
Africa
SADC
Central Africa
ECCAS
CEMAC
West Africa
ECOWAS
WAEMU
Vehicle Load and
Dimensions Control (Axle
load and Gross Vehicle Mass
limits)
Yes
Axle Load
GVM
Weighbridges
installed
Yes
Axle Load
GVM
Weighbridges
installed
Yes – Inter-State Road
Transport (TIE)
Axle Load
GVM
Road Transit Charges Harmonized
with SADC
Harmonized
with COMESA
and EAC
Third Party Motor Vehicle
Insurance Schemes Yellow Card
Yellow Card
(of COMESA) Orange Card
ECOWAS Brown Card
insurance scheme (Convention
A/P1/5/82) -ECOWAS "Carte
Brune" (Brown Card) and
CIMA Code
Road Customs Transit
Declaration Document
COMESA
Customs
Declaration
Document
(CD-COM)
Single
Administrative
Document
(SAD)
ECOWAS’ Interstate Road Transit Scheme (ISRT) – Convention A/P4/5/82 and Supplementary Convention A/SP1/5/90
Road check points Significant
reduction
ECOWAS Interstate Road
Transport (IST) – Convention
A/P2/5/82
9 Well-known examples of One Stop Border Posts in Africa include, among others: Chirundu (between Zambia and
Zimbabwe), Malaba (Kenya- Uganda), Malanville (Benin-Niger), and Cinkansé (Togo-Burkina Faso). As an example of the continuing appeal of One Stop Border Posts in the region, it is worth recalling that the PIDA Vision 2040 recommended the construction and opening of 13 One Stop Border Posts in West Africa.
31
Regional Customs Bond
Customs Bond
Guarantee
Scheme -
Harmonized
with SADC
Customs Bond
Guarantee
Scheme -
Harmonized
with COMESA
and EAC
Customs Agreements on Inter-
State Road Transit (TRIE
Convention)
Border Posts Operations
15 OSBP
envisaged; 7
under
development
Chirundu
OSBP Pilot;
Other OSBP
Projects in
NSC
At least 12 OSBPs envisaged
Source: Adapted from Table 6 (ECA, 2013)
Table 3 summarizes the key policy initiatives undertaken by RECs towards transit facilitation.
Several RECs including EAC, COMESA, SADC and ECOWAS/UEMOA have already harmonized Axle Load
and Gross Vehicle Mass limits, Third Party Motor Vehicle Insurance schemes, Road Customs Transit
Declaration Document, and Regional Custom Bonds. COMESA has reported progress in its Regional
Customs Transit Guarantee (RCTG) scheme, which has been implemented in the Northern Corridor
countries of Kenya, Rwanda and Uganda, and should be soon rolled out in the Djibouti-Ethiopia-Sudan
Corridor. Progress has also been made by Revenue Authorities in COMESA countries on modalities of
integrating the RCTG system with their customs information technology system (ASYCUDA World),
which would enhance information exchange as well as streamlining bond acquittal. RECs have also
encouraged the harmonization of Carrier Licenses and Transit Plates, as well as the use of advanced
vehicle tracking systems.
These examples testify the important role played by African RECs in bringing forward the
transport and transit facilitation agenda; actual implementation on the ground, however, remains
often a challenge. Various questionnaire respondents reported only partial implementation of the
above measures, whilst others were actually unaware of REC-level regulatory frameworks for
harmonization. Against this background, policy coordination at multilateral regional and national level
is clearly an imperative to translate regulatory reforms into actual reductions of trade-related costs on
the ground. Adequate information sharing, advocacy and capacity development activities also remain
fundamental to ensure that private operators and public authorities at border posts be aware of
existing transit facilitation measures.
3.7 Recent achievements and challenges for implementation
In order to complement the previous assessment of trade facilitation and paperless trade
implementation, as part of the survey experts were also asked to identify the areas where their
country had made the most progress over the last year, and the most serious challenges faced in the
implementation of trade facilitation reforms.

32
In terms of measures where most progress had been achieved in past year, replies were quite
varied from one country to another, depending largely on their progress in terms of trade facilitation
agenda. A number of experts cited custom automation – and to a lesser extent risk management –
amongst the most important areas of progress; this was the case for instance of the questionnaire
response from Djibouti, Gambia, Lesotho, Niger and Zimbabwe. Conversely, in other countries such as
Benin, Cameroon, Kenya, and Morocco the main achievements involved more sophisticated measures
such as the rolling out of Single Window Systems, or the setting up of platforms for electronic
document submissions. Another set of replies pointed to institutional reforms, like the establishment
of the Trade Facilitation Committee, the publication of regulation, or the harmonization of procedures
with neighbouring countries. In general, however, the list confirmed the predominant emphasis on
general trade facilitation measures, and in some cases transit and paperless trade measures.
With reference to the main challenges in the implementation of trade facilitation reforms,
responses are summarized in Figure 13, where the score is obtained by assigning 3, 2, and 1 point to
the top, second and third main challenge respectively. Interestingly, whilst the importance of financial
constraints stands out clearly, African responses also point to the problems related to the “political
economy of trade facilitation”. Lack of political will is perceived to be the second most important
challenge, followed by lack of coordination between different government entities, and unclear
designation of the lead agency. Somewhat unexpectedly, limited human resource capacity does not
appear to be a top concern amongst those proposed in the questionnaire. However, if one interprets
this finding in conjunction with the presence of several missing replies (particularly for what attains to
paperless trade measures), it becomes clear that capacity development issues are set to become
more and more relevant, in so far as African countries move to more sophisticated reforms related to
the use of ICT platforms.
Figure 13: Three main challenges in implementing trade facilitation
Source: ECA, UNRCs TF Survey 2015
05
1015202530354045
Financialcontraints
Lack ofpolitical will
Lack ofcoordination
betweengovernment
agencies
Uncleardesignation of
lead agency
Limitedhuman
resourcecapacity
Resistance tochange
Lowutilization of
ICT
Sco
re

33
Conclusions and Way Forward
This report presented data on trade facilitation and paperless trade implementation collected
from 28 African Economies and covering 5 different sub-regions. The survey covered not only
implementation of general trade facilitation measures, including most of those featured in the WTO
TFA, but also more advanced ICT-based measures aimed at making data and documents needed to
support trade transactions flow seamlessly among stakeholders. Figure 19 confirms, at the global
level, the strong negative relationship between countries level of trade facilitation implementation –
as revealed by the Global Survey – and their trade costs, measured by the non-tariff component of
their comprehensive trade costs.
Figure 14: Trade facilitation implementation and Trade Costs of Global economies
Notes: Countries’ trade costs are based on average comprehensive bilateral trade costs with Germany, China and the USA (2008-13) and expressed as ad valorem equivalents (per cent) Source: ESCAP-World Bank International Trade Cost Database and ESCAP, UNRCs TF Survey 2015
Notwithstanding its intrinsically qualitative nature, the information collected through the
questionnaire allows a more precise knowledge of the status of implementation of the various trade
facilitation measures in the region, and hence provides the basis for a more evidence-based policy-

34
making. Leaving aside the technicalities of the data collected, several key messages can be drawn
from this monitoring exercise.
First, survey responses confirmed what had been argued in other ECA studies: even before the
TFA, African countries have been engaged in trade facilitation reforms – typically at the national or
regional level – and this explains some progress in terms of implementation of the various trade
facilitation measures. Notwithstanding some encouraging progress, the overall level of
implementation of trade facilitation measures considered in the survey stands at 45 per cent,
suggesting that ample margins for improvements remain still unexploited. With a view to support
structural transformation, it is imperative for Africa to cut disproportionately high trade-related costs,
thereby unleashing its productive and trade potential. In this respect, one issue that warrants due
consideration is the relationship between trade facilitation and infrastructural provision. Even
thought the TFA is solely focusing on custom procedures and soft-infrastructural issues, it remains a
fact that the effectiveness of many trade facilitation measures cannot but hinge on the quality of
infrastructural provision (notably the availability of electricity and connectivity at border posts).
Second, in line with their “initial conditions” in terms of disproportionately high trade costs,
inadequate infrastructural provision, and productive structure characterized by the presence of a few
large firms and a myriad of small (often informal) businesses, African countries typically tend to
prioritize general trade facilitation measures, and transit facilitation issues. With the exception of a
few pioneer countries, measures related to paperless trade have generally been paid far less
attention, not least owing to inadequate (albeit rapidly improving) connectivity and capacity
development needs. In that regard, given the large potential benefits associated with the
implementation of these “next generation” trade facilitation measures, it is in the interest of
countries from all groups to work together and develop the legal and technical protocols needed for
the seamless exchange of regulatory and commercial data and documents along the international
supply chain. Although some work has already been done bilaterally, further efforts should be made
towards adopting and implementing intergovernmental agreements for the facilitation of cross-
border paperless trade.
Third, custom automation deserves a separate mention, being after post-clearance audit the
second most implemented measure in Africa, and one in which a number of countries have reported
most progress in recent times. Custom automation and cooperation are perhaps the best examples to
show that trade facilitation measures aimed at streamlining customs procedures need not – and
should not – undermine the effectiveness of customs controls. UNCTAD 2009 cites for instance the
case of Angola, Ghana, and Mozambique, where custom automation not only cut processing time, but
actually led to an increase in revenue generation, by enhancing the efficiency of control systems and
reducing the scope for corruption. As convincingly explained in the report of the High Level Panel on
Illicit Financial Flows from Africa, the latter objective is indeed a policy priority for African countries,
with a view to curb illicit financial flows through trade mispricing (ECA, 2015b).

35
Fourth, the findings of the monitoring exercise also point to the need to strengthen the
institutional framework that drives the trade facilitation agenda, particularly in LDCs. A large number
of African countries cited, amongst the key challenges in the implementation of trade facilitation
activities, problems related to the coordination of several government entities, and the unclear
identification of the lead agency. Adequately addressing these institutional issues, taking into due
account the “political economy dimension” of trade facilitation is not only imperative to enhance the
impact of reforms implemented at a national level; it will become a strategic priority in the context of
the multilateral process. Put differently, for African countries to harness the TFA and effectively
integrate their continental market, reaping the benefits promised by the CFTA, a well-functioning
institutional framework will be required, in order to strategically define, execute and monitor the
process of implementation of the agreement.
Fifth, survey responses suggest that in most African countries consultation with private sector
takes place on a rather ad hoc basis, and not very effectively. Similarly, the flow of information to the
various stakeholders about the practical details of the trade facilitation measures being implemented
could be significantly improved. Several respondents noted for instance that, whilst certain measures
(for instance authorised operators or pre-arrival processing) are indeed adopted on paper, their rate
of utilization remains rather disappointing, either because the private sector is not aware of them, or
because of concerns regarding the way in which the measures are applied in practice. Against this
background, consultation with all stakeholders involved – including notably the domestic private
sector – should be enhanced, since it plays a fundamental role in ensuring that the trade facilitation
agenda responds to the genuine needs of African firms.
Sixth, survey responses highlighted the essential role played by several African RECs in forging
concrete strategies for trade facilitation, and in some cases directly driving the development of
specific trade and transit facilitation instruments. Coordination at regional and sub-regional level
significantly improves trade facilitation outcomes, and will be even more imperative in the context of
the BIAT and CFTA process. Accordingly, trade facilitation initiatives at REC level should be stepped
up, and it is encouraging to notice, as documented earlier in the report, that donors have also realized
this aspect, and are providing significant Aid for Trade funds to regional trade facilitation programmes
(ECA, 2015a).
In conclusion, trade facilitation can be thought of as a step-by step process, based on the
groups of measures included in this survey and depicted in Figure 15. It begins with the setting up of
an appropriate institutional framework; the next step is to make the trade processes more
transparent by sharing information on existing laws, regulations and procedures as widely as possible
and consulting with stakeholders when developing new ones. The designing of more streamlined and
efficient trade formalities comes next, and is typically implemented first on the basis of paper
documents, and then through the increasing use of ICT and the development of Paperless trade
systems. The ultimate step is to enable the electronic trade data and documents exchange by traders,

36
government and service providers within national (single window and other) systems to be used and
re-used to provide stakeholders in partner countries with the information they need to speed up the
movement of goods and reduce the overall costs of trade. All along this process, the data collected by
this survey suggest that all sub-regions still have significant room to make progress.
Figure 15: Moving up the trade facilitation ladder towards seamless international supply chains
Note: the figure shows cumulative trade facilitation implementation scores of Asia-Pacific sub-regions for five groups of trade facilitation measures included in the survey Full implementation of all measures = 100
Source: ECA, UNRCs TF Survey 2015
Looking ahead, it is also worth underscoring the importance of systematic data collection of
trade facilitation issues. As noted earlier, the lack of systematic data has limited the scope of the
debate on trade facilitation, hampering a proper assessment not only of the degree of
implementation of reforms, but more fundamentally of their economic impact This situation is a
rather generalized and touches all world regions, but is particularly pronounced in the case Africa. The
conduct of this survey represents an important step towards building a knowledge base, to allow a
more evidence-based policy discussion. However more will need to be done in the future, to broaden
the country coverage, ensure systematic data collection, and involve more stakeholders in the
assessment.
0
10
20
30
40
50
60
70
80
90
100
Performance area
Frontier (full implementation)
Africa
South Africa Average
West Africa Average
Central Africa Average
East Africa Average
Cross-border
Paperless
Formalities
Transparency
Institutional arrangement and

37
References
ECA. (2013). “Trade Facilitation from an African Perspective”. United Nations Economic
Commission for Africa: Addis Ababa.
ECA. (2015a). “Reducing Trade Costs to support Africa’s Transformation: the role of Aid for
Trade”. United Nations Economic Commission for Africa: Addis Ababa.
ECA. (2015b). “Report of the High Level Panel on Illicit Financial Flows from Africa – Track it! Stop
it! Get it!”. United Nations Economic Commission for Africa: Addis Ababa.
ECA, AUC and AfDB (2012). Assessing Regional Integration in Africa V: Towards an African
Continental Free Trade Area. United Nations Economic Commission for Africa: Addis Ababa.
Mevel, S. and Karingi, S. (2013). “Towards a Continental Free Trade Area in Africa: a CGE
Modelling Assessment with a Focus on Agriculture.” In “Shared harvests: Agriculture trade and
employment”. Cheong, Jansen and Peters (eds). ILO and UNCTAD: Geneva.
UNCTAD. (2009). “Enhancing the Role of Domestic Financial Resources in Africa’s Development”.
United Nations Conference on Trade and Development : New York and Geneva.
Valensisi, G. Lisinge, R. and Karingi, S. (2014); “Towards an Assessment of the Dividends and
Economic Benefits of successfully Implementing Trade Facilitation Measures at the Level of
African RECs’’. Selected paper presented at the 9th TRAPCA Conference, 21-23 November 2014,
Arusha.

38
Annex 1: Definition of the different stages of implementation
Definition of stage of implementation Coding/ Scoring
Full implementation: the trade facilitation measure implemented is in full compliance with commonly accepted international standards, recommendations and conventions (such as the Revised Kyoto Convention, UN/CEFACT Recommendations, or the WTO Trade Facilitation Agreement); it is implemented in law and in practice; it is available to essentially all relevant stakeholders nationwide, supported by adequate legal and institutional framework, as well as adequate infrastructure and financial and human resources
3
Partial implementation: a measure is considered to be partially implemented if at least one of the following is true: (1) the trade facilitation measure is not in full compliance with commonly accepted international standards, recommendations and conventions; (2) the country is still in the process of rolling out the implementation of measure; (3) the measure is practiced on an unsustainable, short-term or ad-hoc basis; (4) the measure is not implemented in all targeted locations (such as key border crossing stations); or (5) not all targeted stakeholders are fully involved
2
Pilot stage of implementation: A measure is considered to be at the pilot stage of implementation if, in addition to meeting the general attributes of partial implementation, it is available only to (or at) a very small portion of the intended stakeholder group (location) and/or is being implemented on a trial basis When a new trade facilitation measure is under pilot stage of implementation, the old measure is often continuously used in parallel to ensure the service is provided in case of disruption of new measure This stage of implementation also includes relevant rehearsals and preparation for the full-fledged implementation
1
Not implemented: simply means a trade facilitation measure has not been implemented However, this stage does not rule out initiatives or efforts towards implementation of the measure For example, under this stage, (pre)feasibility or planning of implementation can be carried out; and consultation with stakeholders on the implementation may be arranged
0
Don’t know: It means that the respondents were not able to assess whether a trade facilitation measure had been implemented
0


