MURCHISON REGIONAL VERMIN COUNCIL
AGENDA
ORDINARY MEETING OF COUNCIL
12 MARCH 2013
MURCHISON REGIONAL VERMIN COUNCIL
MURCHISON REGIONAL VERMIN COUNCIL
AGENDA
ORDINARY MEETING OF COUNCIL
12 MARCH 2013
NOTICE OF MEETING
Dear Elected Member, The next Ordinary Meeting of the Murchison Regional Vermin Council will be held on 12 March 2013 in the Shire of Mount Magnet Council Chambers, Lot 163 Hepburn St, Mount Magnet commencing at 1:00pm. Geoff Brooks CHIEF EXECUTIVE OFFICER 07 March 2013
DISCLAIMER
No responsibility whatsoever is implied or accepted by the MRVC for any act, omission, statement or intimation occurring during this meeting. It is strongly advised that persons do not act on what is heard at this meeting and should only rely on written confirmation of Council’s decision, which will be provided within fourteen (14) days of this meeting.
MRVC Ordinary Meeting of Council 12 March 2013 2 of 84
MURCHISON REGIONAL VERMIN COUNCIL Agenda for Ordinary Meeting of Council at Shire of Mount Magnet
Council Chambers, Lot 163 Hepburn St, Mount Magnet, 12 March 2013
TABLE OF CONTENTS
1. DECLARATION OF OPENING / ANNOUNCEMENT OF VISITORS ................................... 4
2. RECORD OF ATTENDANCE / APOLOGIES / LEAVE OF ABSENCE ................................ 4
3. RESPONSE TO PREVIOUS PUBLIC QUESTIONS TAKEN ON NOTICE .......................... 4
4. PUBLIC QUESTION TIME AND ADDRESS BY MEMBERS OF THE PUBLIC.................... 4 4.1 Public Question Time ............................................................................................ 4 4.2 Address by Members of the Public ........................................................................ 4
5. APPLICATIONS FOR LEAVE OF ABSENCE ..................................................................... 4
6. DEPUTATIONS / PRESENTATIONS / SUBMISSIONS ...................................................... 4
7. CONFIRMATION OF COUNCIL MINUTES OF PREVIOUS MEETING ............................... 4 7.1 Minutes of the Ordinary Meeting of Council held on 4 December 2012 ................. 4
8. ANNOUNCEMENTS BY PRESIDING PERSON WITHOUT DISCUSSION ......................... 5
9. PETITIONS ......................................................................................................................... 5
10. DECLARATIONS OF INTEREST ........................................................................................ 5
11. BUSINESS DEFERRED FROM PREVIOUS MEETING ...................................................... 5
12. REPORTS ........................................................................................................................... 6 12.1 Cash Position Statement ....................................................................................... 6 12.2 Accounts for Payment ........................................................................................... 7 12.3 Debtors .................................................................................................................. 9 12.4 Investment Register ............................................................................................. 10 12.5 Fence Maintenance and Repair ........................................................................... 12 12.6 2012/2013 Annual Budget Review/Statement of Financial Activity ...................... 16 12.7 Compliance Audit Return ..................................................................................... 41 12.8 Tender MRVC09 – Removal and Replacement of 41.0 kilometres of the No.2
Vermin (Dog) Fence. ........................................................................................... 51 12.9 Strategic Community Plan ................................................................................... 53 12.10 Draft Long Term Financial Plan and Capital Works Program .............................. 72
13. MOTIONS OF WHICH PREVIOUS NOTICE HAS BEEN GIVEN ...................................... 84
14. NOTICE OF MOTIONS FOR THE NEXT MEETING ......................................................... 84
15. CONFIDENTIAL BUSINESS ............................................................................................. 84
16. LATE AGENDA ITEMS ..................................................................................................... 84
17. ELECTED MEMBER MATTERS ....................................................................................... 84
18. NEXT MEETING ............................................................................................................... 84
19. CLOSURE OF MEETING .................................................................................................. 84
MRVC Ordinary Meeting of Council 12 March 2013 3 of 84

MURCHISON REGIONAL VERMIN COUNCIL
Agenda for Ordinary Meeting of Council at Shire of Mount Magnet Council Chambers, Lot 163 Hepburn St, Mount Magnet, 12 March 2013
1. DECLARATION OF OPENING / ANNOUNCEMENT OF VISITORS
2. RECORD OF ATTENDANCE / APOLOGIES / LEAVE OF ABSENCE
3. RESPONSE TO PREVIOUS PUBLIC QUESTIONS TAKEN ON NOTICE
4. PUBLIC QUESTION TIME AND ADDRESS BY MEMBERS OF THE PUBLIC 4.1 Public Question Time 4.2 Address by Members of the Public
5. APPLICATIONS FOR LEAVE OF ABSENCE
6. DEPUTATIONS / PRESENTATIONS / SUBMISSIONS
7. CONFIRMATION OF COUNCIL MINUTES OF PREVIOUS MEETING 7.1 Minutes of the Ordinary Meeting of Council held on 4 December 2012
OFFICER RECOMMENDATION Moved: Seconded: That the minutes of the Ordinary Meeting of Council held on 4 December 2012 be confirmed as a true and correct record of proceedings. CARRIED/LOST
MRVC Ordinary Meeting of Council 12 March 2013 4 of 84
8. ANNOUNCEMENTS BY PRESIDING PERSON WITHOUT DISCUSSION
9. PETITIONS
10. DECLARATIONS OF INTEREST
11. BUSINESS DEFERRED FROM PREVIOUS MEETING
MRVC Ordinary Meeting of Council 12 March 2013 5 of 84
12. REPORTS
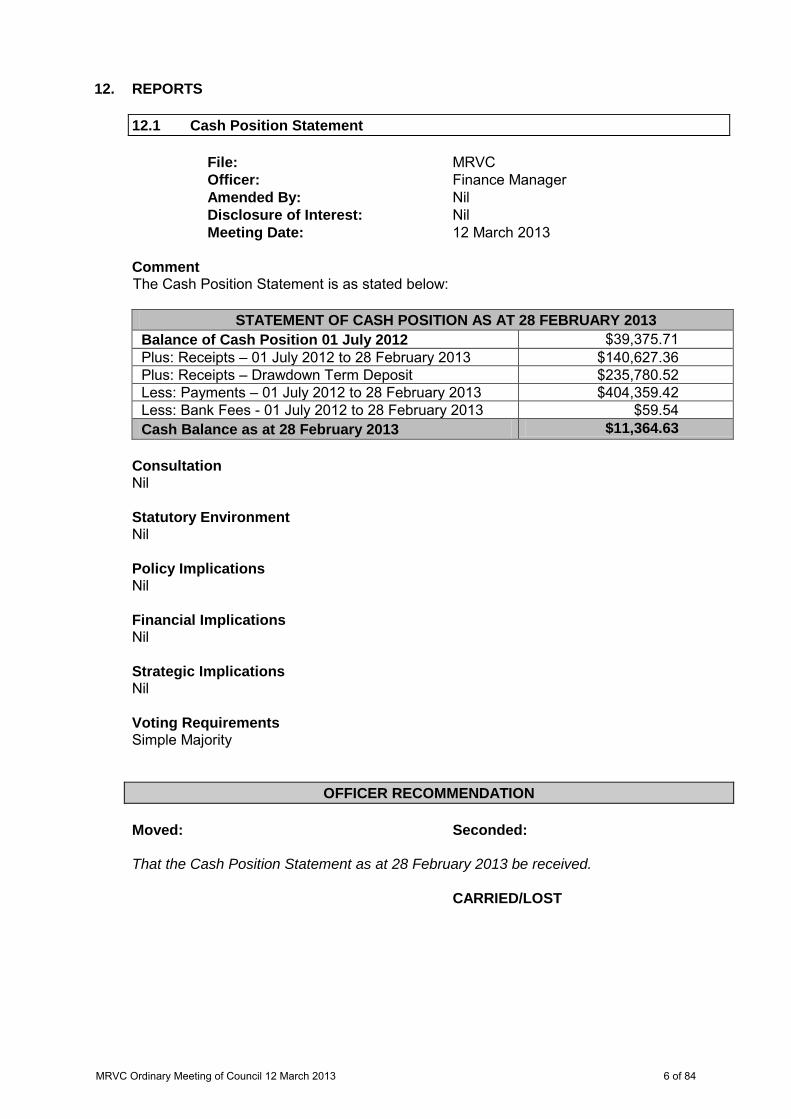
12.1 Cash Position Statement File: MRVC Officer: Finance Manager Amended By: Nil Disclosure of Interest: Nil Meeting Date: 12 March 2013 Comment The Cash Position Statement is as stated below:
STATEMENT OF CASH POSITION AS AT 28 FEBRUARY 2013 Balance of Cash Position 01 July 2012 $39,375.71 Plus: Receipts – 01 July 2012 to 28 February 2013 $140,627.36 Plus: Receipts – Drawdown Term Deposit $235,780.52 Less: Payments – 01 July 2012 to 28 February 2013 $404,359.42 Less: Bank Fees - 01 July 2012 to 28 February 2013 $59.54 Cash Balance as at 28 February 2013 $11,364.63
Consultation Nil Statutory Environment Nil Policy Implications Nil Financial Implications Nil Strategic Implications Nil Voting Requirements Simple Majority
OFFICER RECOMMENDATION Moved: Seconded: That the Cash Position Statement as at 28 February 2013 be received. CARRIED/LOST
MRVC Ordinary Meeting of Council 12 March 2013 6 of 84
12.2 Accounts for Payment File: MRVC Officer: Finance Manager Amended By: Nil Disclosure of Interest: Nil Meeting Date: 12 March 2013 Comment The accounts for payment list for 01 December 2012 to 28 February 2013 is attached for notation. Consultation Nil Statutory Environment Nil Policy Implications Nil Financial Implications Nil Strategic Implications Nil Voting Requirements Simple Majority
OFFICER RECOMMENDATION Moved: Seconded: That payments of accounts for 01 December 2012 to 28 February 2013 be noted. CARRIED/LOST
MRVC Ordinary Meeting of Council 12 March 2013 7 of 84
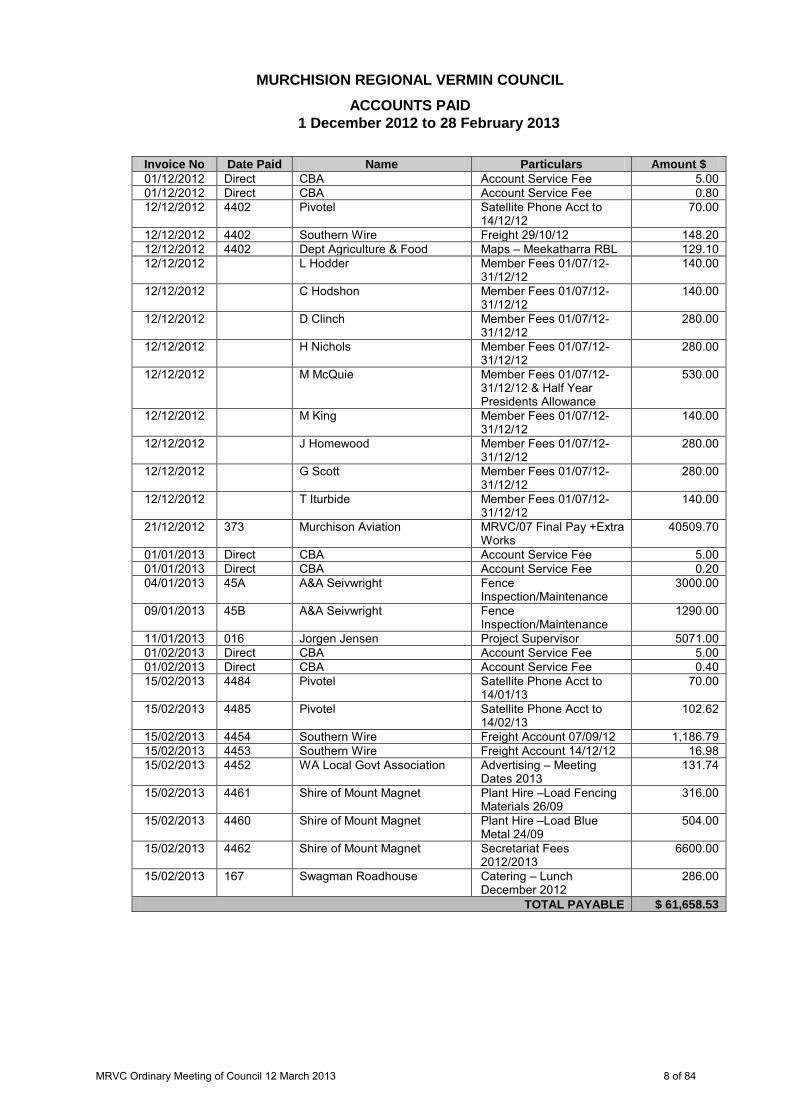
MURCHISION REGIONAL VERMIN COUNCIL ACCOUNTS PAID
1 December 2012 to 28 February 2013
Invoice No Date Paid Name Particulars Amount $ 01/12/2012 Direct CBA Account Service Fee 5.00 01/12/2012 Direct CBA Account Service Fee 0.80 12/12/2012 4402 Pivotel Satellite Phone Acct to
14/12/12 70.00
12/12/2012 4402 Southern Wire Freight 29/10/12 148.20 12/12/2012 4402 Dept Agriculture & Food Maps – Meekatharra RBL 129.10 12/12/2012 L Hodder Member Fees 01/07/12-
31/12/12 140.00
12/12/2012 C Hodshon Member Fees 01/07/12-31/12/12
140.00
12/12/2012 D Clinch Member Fees 01/07/12-31/12/12
280.00
12/12/2012 H Nichols Member Fees 01/07/12-31/12/12
280.00
12/12/2012 M McQuie Member Fees 01/07/12-31/12/12 & Half Year Presidents Allowance
530.00
12/12/2012 M King Member Fees 01/07/12-31/12/12
140.00
12/12/2012 J Homewood Member Fees 01/07/12-31/12/12
280.00
12/12/2012 G Scott Member Fees 01/07/12-31/12/12
280.00
12/12/2012 T Iturbide Member Fees 01/07/12-31/12/12
140.00
21/12/2012 373 Murchison Aviation MRVC/07 Final Pay +Extra Works
40509.70
01/01/2013 Direct CBA Account Service Fee 5.00 01/01/2013 Direct CBA Account Service Fee 0.20 04/01/2013 45A A&A Seivwright Fence
Inspection/Maintenance 3000.00
09/01/2013 45B A&A Seivwright Fence Inspection/Maintenance
1290.00
11/01/2013 016 Jorgen Jensen Project Supervisor 5071.00 01/02/2013 Direct CBA Account Service Fee 5.00 01/02/2013 Direct CBA Account Service Fee 0.40 15/02/2013 4484 Pivotel Satellite Phone Acct to
14/01/13 70.00
15/02/2013 4485 Pivotel Satellite Phone Acct to 14/02/13
102.62
15/02/2013 4454 Southern Wire Freight Account 07/09/12 1,186.79 15/02/2013 4453 Southern Wire Freight Account 14/12/12 16.98 15/02/2013 4452 WA Local Govt Association Advertising – Meeting
Dates 2013 131.74
15/02/2013 4461 Shire of Mount Magnet Plant Hire –Load Fencing Materials 26/09
316.00
15/02/2013 4460 Shire of Mount Magnet Plant Hire –Load Blue Metal 24/09
504.00
15/02/2013 4462 Shire of Mount Magnet Secretariat Fees 2012/2013
6600.00
15/02/2013 167 Swagman Roadhouse Catering – Lunch December 2012
286.00
TOTAL PAYABLE $ 61,658.53
MRVC Ordinary Meeting of Council 12 March 2013 8 of 84
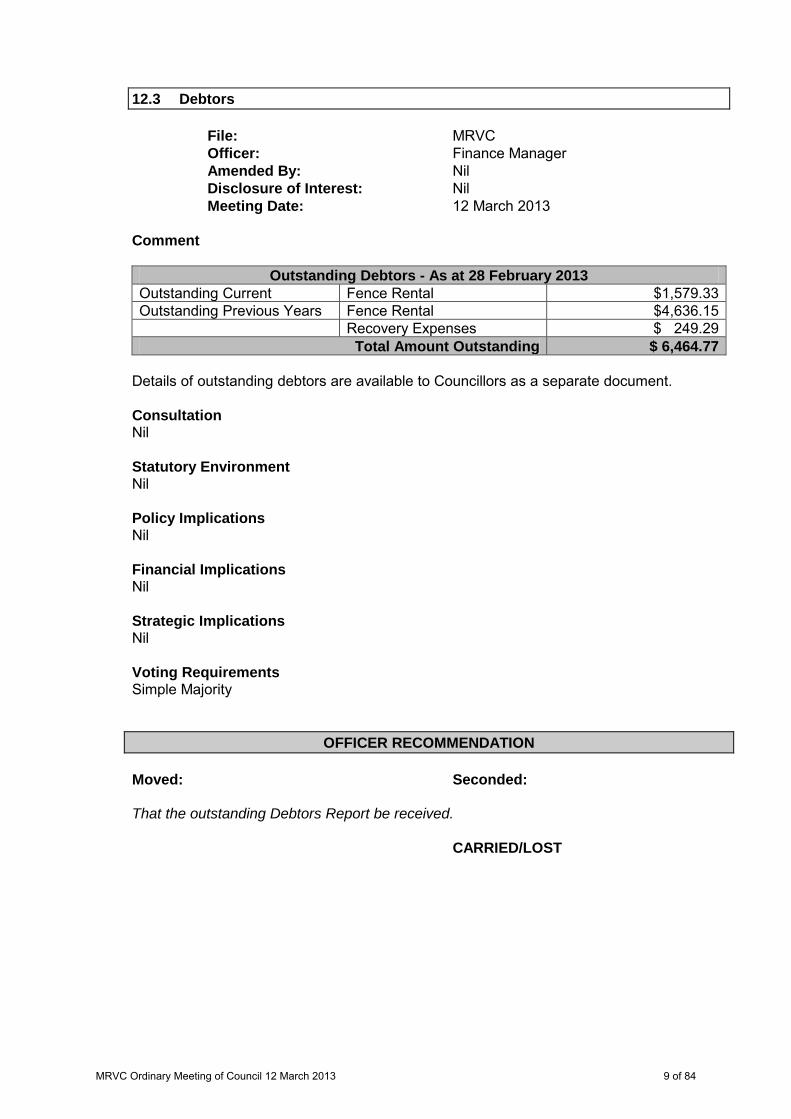
12.3 Debtors File: MRVC Officer: Finance Manager Amended By: Nil Disclosure of Interest: Nil Meeting Date: 12 March 2013 Comment
Outstanding Debtors - As at 28 February 2013 Outstanding Current Fence Rental $1,579.33 Outstanding Previous Years Fence Rental $4,636.15 Recovery Expenses $ 249.29
Total Amount Outstanding $ 6,464.77 Details of outstanding debtors are available to Councillors as a separate document. Consultation Nil Statutory Environment Nil Policy Implications Nil Financial Implications Nil Strategic Implications Nil Voting Requirements Simple Majority
OFFICER RECOMMENDATION Moved: Seconded: That the outstanding Debtors Report be received. CARRIED/LOST
MRVC Ordinary Meeting of Council 12 March 2013 9 of 84

12.4 Investment Register File: MRVC Officer: Finance Manager Amended By: Nil Disclosure of Interest: Nil Meeting Date: 12 March 2013 Comment
Commonwealth Bank Term Deposit 36558508 Funds Invested 01 July 2012 $721,144.06 Interest Earnt $17,193.63 Transfer from Investment $235,780.52 Balance as at 30 November 2012 $ 502,557.17
Consultation Geoff Brooks - Chief Executive Officer Statutory Environment Nil Policy Implications Nil Financial Implications Nil Strategic Implications Nil Voting Requirements Simple Majority
OFFICER RECOMMENDATION Moved: Seconded: That the Investment Register be received. CARRIED/LOST
MRVC Ordinary Meeting of Council 12 March 2013 10 of 84
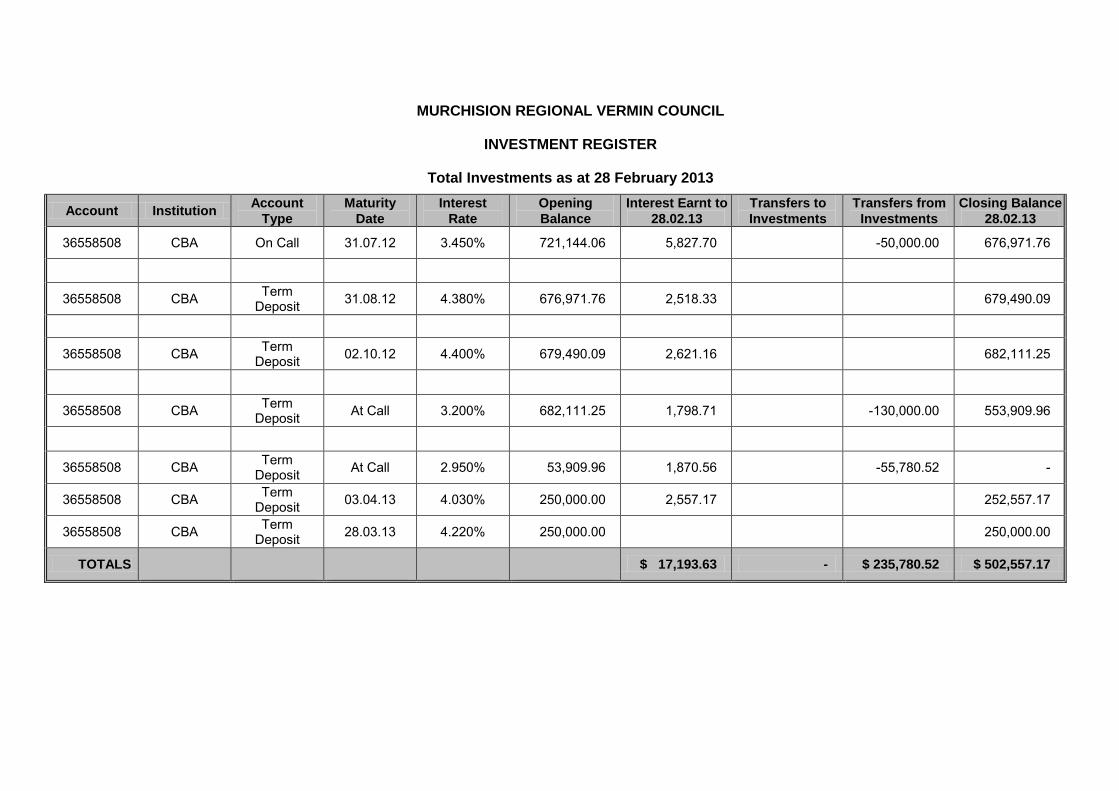
MURCHISION REGIONAL VERMIN COUNCIL
INVESTMENT REGISTER
Total Investments as at 28 February 2013
Account Institution Account Type
Maturity Date
Interest Rate
Opening Balance
Interest Earnt to 28.02.13
Transfers to Investments
Transfers from Investments
Closing Balance 28.02.13
36558508 CBA On Call 31.07.12 3.450% 721,144.06 5,827.70 -50,000.00 676,971.76
36558508 CBA Term
Deposit 31.08.12 4.380% 676,971.76 2,518.33 679,490.09
36558508 CBA Term
Deposit 02.10.12 4.400% 679,490.09 2,621.16 682,111.25
36558508 CBA Term
Deposit At Call 3.200% 682,111.25 1,798.71 -130,000.00 553,909.96
36558508 CBA Term
Deposit At Call 2.950% 53,909.96 1,870.56 -55,780.52 -
36558508 CBA Term Deposit 03.04.13 4.030% 250,000.00 2,557.17 252,557.17
36558508 CBA Term Deposit 28.03.13 4.220% 250,000.00 250,000.00
TOTALS $ 17,193.63 - $ 235,780.52 $ 502,557.17

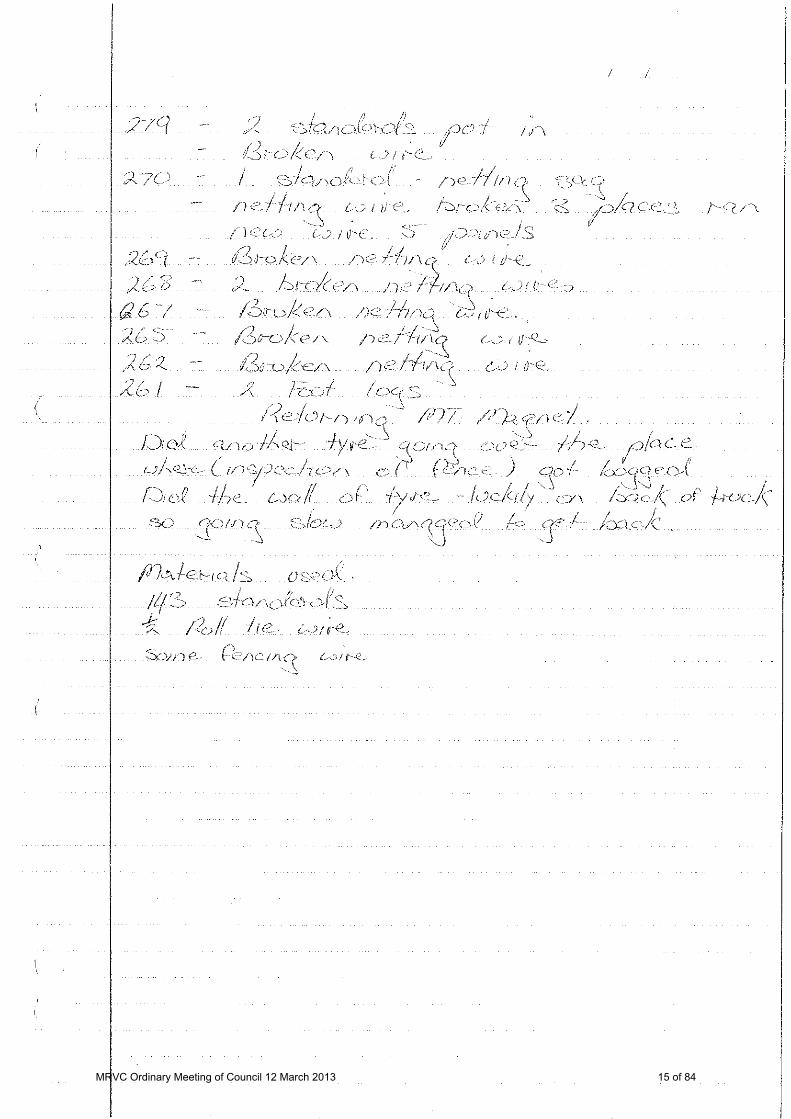
12.5 Fence Maintenance and Repair File: MRVC Officer: Geoff Brooks - CEO Amended By: Nil Disclosure of Interest: Nil Meeting Date: 12 March 2013 Application To note repair work carried out on the No. 1 Vermin Fence by Council's fencing contractor A&A Seivwright and note progress on fence reconstruction works. Maintenance and Repair The attached reports detail work carried out over a period of five (5) days starting from Pegs 261 to 311 by the contractor at a rate of $715 per day. Upgrade Works The status of Tenders awarded for fence upgrade works is summarised as follows: TENDER NO. DESCRIPTION STATUS MRVC/01 Clearing and Grading of No.1 Vermin Fence from
the 80 Mile Peg to the Paynes Find/Sandstone Road Intersection
Complete
MRVC/02 Remove and Replace 16 Kilometres of the No.1 Vermin Fence
Complete
MRVC/03 Clearing and Grading of No.1 Vermin Fence, from the Paynes Find/Sandstone Road to the No.2 Spur Line
Complete
MRVC/04 Clearing and Grading the northern section of the No.1 Vermin Fence and the No.2 Spur Line
Complete
MRVC/05 Supply of 140 Kilometres of Fencing Materials Complete MRVC/06 Removal and replacement of 30.2 Kilometres of the
No. 1 Vermin Fence Complete
MRVC/07 Remove and Replace 38-5 kms - Starting at Camel Camp
Complete
MRVC/08 Remove & Replace 40kms - Ending at Cunyu In Progress Consultation Mr Jorgen Jensen – MRVC Project Officer Statutory Environment Nil Policy Implications Nil Financial Implications Nil Strategic Implications Nil
MRVC Ordinary Meeting of Council 12 March 2013 12 of 84

Voting Requirements Simple Majority
OFFICER RECOMMENDATION Moved: Seconded: That Council notes the maintenance and repairs carried out to the No 1 Vermin Fence and the status of the fence upgrade works. CARRIED/LOST
MRVC Ordinary Meeting of Council 12 March 2013 13 of 84

MRVC Ordinary Meeting of Council 12 March 2013 14 of 84
MRVC Ordinary Meeting of Council 12 March 2013 15 of 84
12.6 2012/2013 Annual Budget Review/Statement of Financial Activity File: MRVC Officer: Geoff Brooks - CEO Amended by: Nil Disclosure of Interest: Nil Meeting Date: 12 March 2013 Application To review the 2012/2013 Annual Budget and Statement of Financial Activity to 28 February 2013 and confirm that no alterations to the Budget are required. Background The attached Statement of Financial Activity to 28 February 2013 has been prepared by Council’s financial advisor Mr Jim Dillon. Mr Dillon has reviewed the 2012/2013 Annual Budget in the context of the attachment and advises that no alterations are required. Comment As required under Regulation 33A (4) the Annual Budget Review once adopted by Council will be forwarded to the Department of Local Government. Consultation Mr Jim Dillon – Midwest Financial Services Statutory Environment Local Government Financial Management Regulations 1996 – Regulation 33A Policy Implications Nil Financial Implications Nil Strategic Implications Nil Voting Requirements Absolute Majority
OFFICER RECOMMENDATION Moved: Seconded: That Council notes the Statement of Financial Activity to 28 February 2013 and adopts the recommendation from Council’s financial advisor that on review alterations are not required to the 2012/2013 Annual Budget. CARRIED/LOST
MRVC Ordinary Meeting of Council 12 March 2013 16 of 84
MURCHISON REGIONAL VERMIN COUNCIL
STATEMENT OF FINANCIAL ACTIVITYFOR THE PERIOD 1 JULY 2012 TO 28 FEBRUARY 2013
MRVC Ordinary Meeting of Council 12 March 2013 17 of 84
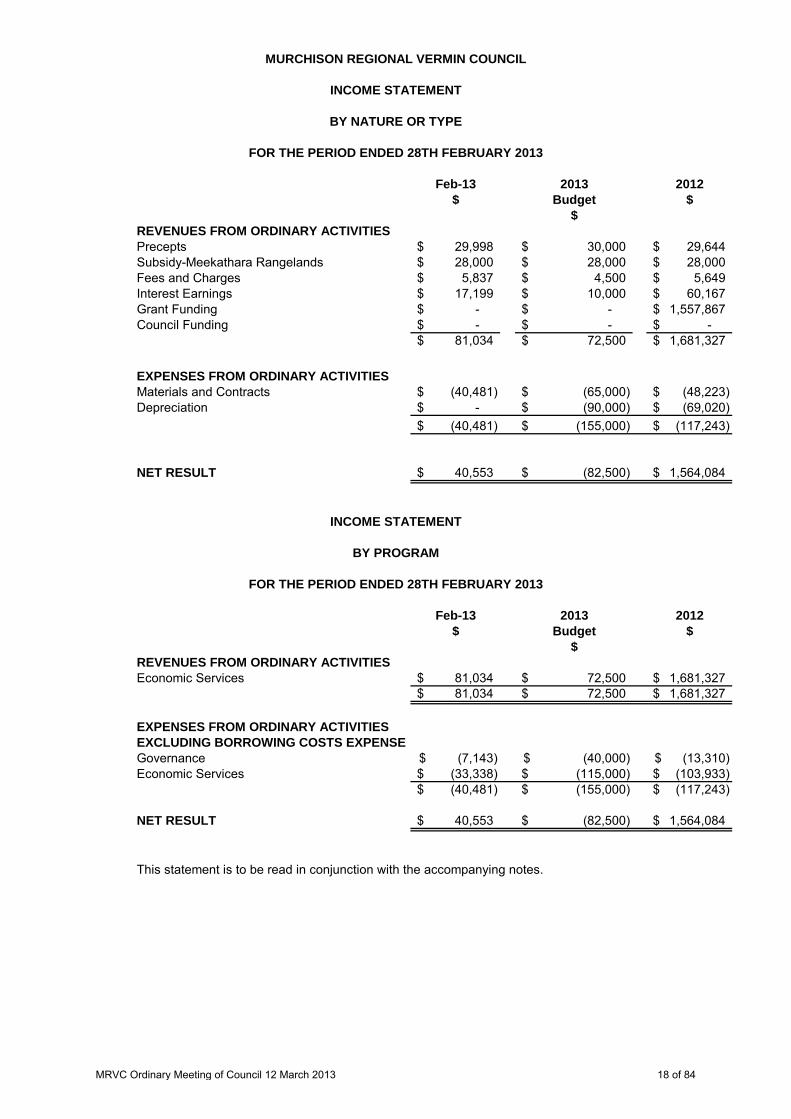
Feb-13 2013 2012$ Budget $
$REVENUES FROM ORDINARY ACTIVITIESPrecepts 29,998$ 30,000$ 29,644$ Subsidy-Meekathara Rangelands 28,000$ 28,000$ 28,000$ Fees and Charges 5,837$ 4,500$ 5,649$ Interest Earnings 17,199$ 10,000$ 60,167$ Grant Funding -$ -$ 1,557,867$ Council Funding -$ -$ -$
81,034$ 72,500$ 1,681,327$
EXPENSES FROM ORDINARY ACTIVITIESMaterials and Contracts (40,481)$ (65,000)$ (48,223)$ Depreciation -$ (90,000)$ (69,020)$
(40,481)$ (155,000)$ (117,243)$
NET RESULT 40,553$ (82,500)$ 1,564,084$
Feb-13 2013 2012$ Budget $
$REVENUES FROM ORDINARY ACTIVITIESEconomic Services 81,034$ 72,500$ 1,681,327$
81,034$ 72,500$ 1,681,327$
EXPENSES FROM ORDINARY ACTIVITIESEXCLUDING BORROWING COSTS EXPENSEGovernance (7,143)$ (40,000)$ (13,310)$ Economic Services (33,338)$ (115,000)$ (103,933)$
(40,481)$ (155,000)$ (117,243)$
NET RESULT 40,553$ (82,500)$ 1,564,084$
This statement is to be read in conjunction with the accompanying notes.
MURCHISON REGIONAL VERMIN COUNCIL
INCOME STATEMENT
BY NATURE OR TYPE
FOR THE PERIOD ENDED 28TH FEBRUARY 2013
INCOME STATEMENT
BY PROGRAM
FOR THE PERIOD ENDED 28TH FEBRUARY 2013
MRVC Ordinary Meeting of Council 12 March 2013 18 of 84
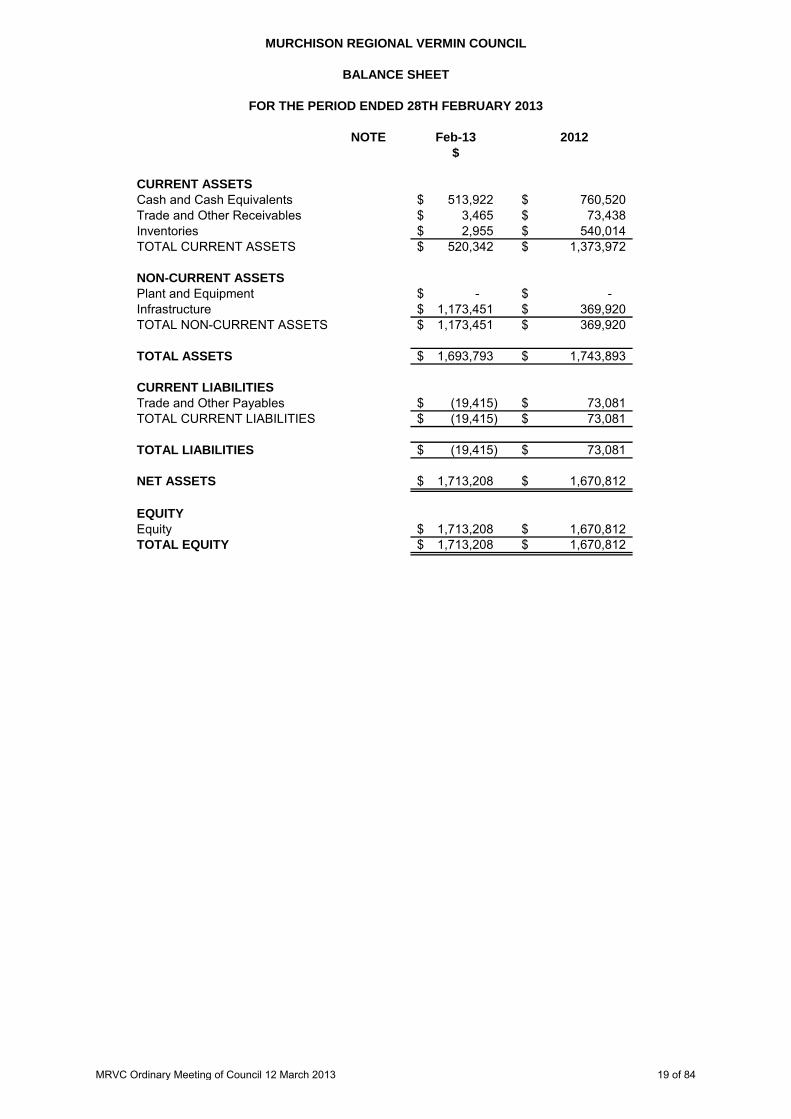
NOTE Feb-13 2012$
CURRENT ASSETSCash and Cash Equivalents 513,922$ 760,520$ Trade and Other Receivables 3,465$ 73,438$ Inventories 2,955$ 540,014$ TOTAL CURRENT ASSETS 520,342$ 1,373,972$
NON-CURRENT ASSETSPlant and Equipment -$ -$ Infrastructure 1,173,451$ 369,920$ TOTAL NON-CURRENT ASSETS 1,173,451$ 369,920$
TOTAL ASSETS 1,693,793$ 1,743,893$
CURRENT LIABILITIESTrade and Other Payables (19,415)$ 73,081$ TOTAL CURRENT LIABILITIES (19,415)$ 73,081$
TOTAL LIABILITIES (19,415)$ 73,081$
NET ASSETS 1,713,208$ 1,670,812$
EQUITYEquity 1,713,208$ 1,670,812$ TOTAL EQUITY 1,713,208$ 1,670,812$
BALANCE SHEET
FOR THE PERIOD ENDED 28TH FEBRUARY 2013
MURCHISON REGIONAL VERMIN COUNCIL
MRVC Ordinary Meeting of Council 12 March 2013 19 of 84
NOTES TO AND FORMING PART OF THE FINANCIAL REPORT
1. SIGNIFICANT ACCOUNTING POLICIESThe significant accounting policies which have been adopted in the preparation of this financialreport are:
(a) Basis of Preparation
The report has also been prepared on the accrual basis and is based on historical costs, modified, whereapplicable, by the measurement at fair value of the selected non-current assets, financial assetsand liabilities.
Critical Accounting Estimates
(b) The Local Government Reporting EntityAll Funds through which the Council controls resources to carry on its functions have beenincluded in the financial statements forming part of this financial report.
In the process of reporting on the local government as a single unit, all transactions and balancesbetween those funds (for example, loans and transfers between Funds) have been eliminated.
(c) Goods and Services TaxIn accordance with recommended practice, revenues, expenses and assets capitalised are stated netof any GST recoverable. Receivables and payables in the statement of financial position are statedinclusive of applicable GST.
(d) Cash and Cash Equivalents
(e) Trade and Other Receivables
MURCHISON REGIONAL VERMIN COUNCIL
Bank overdrafts are shown as short term borrowings in current liabilities on the statement of financial position.
Collectability of trade and other receivables is reviewed on an ongoing basis. Debts that are known to be uncollectible are written off when identified. An allowance for doubtful debts is raised when there is objective evidence that they will not be collectible.
FOR THE PERIOD ENDED 28TH FEBRUARY 2013
Cash and cash equivalents include cash on hand, cash at bank, deposits held at call with banks, other short term highly liquid investments with original maturities of three months or less that are readily convertible to known amounts of cash and which are subject to an insignificant risk of changes in value and bank overdrafts.
The financial report is a general purpose financial statement which has been prepared in accordance with Australian Accounting Standards (as they apply to local governments and not-for-profit entities), Australian Accounting Interpretations, other authoritative pronouncements of the Australian Accounting Standards Board, the local Government Act 1995 and accompanying regulations.
The preparation of a financial report in conformity with Australian Accounting Standards requires management to make judgements, estimates and assumptions that effect the application of policies and reported amounts of assets and liabilities, income and expenses.
The estimates and associated assumptions are based on historical experience and various other factors that are believed to be reasonable under the circumstances; the results of which form the basis of making the judgements about carrying values of assets and liabilities that are not readily apparent from other sources. Actual results may differ from these estimates.
MRVC Ordinary Meeting of Council 12 March 2013 20 of 84
NOTES TO AND FORMING PART OF THE FINANCIAL REPORTFOR THE PERIOD ENDED 28TH FEBRUARY 2013
1. SIGNIFICANT ACCOUNTING POLICIES (Continued)
(f) Inventories
General
Land Held for ResaleLand purchased for development and/or resale is valued at the lower of cost and net realisablevalue. Cost includes the cost of acquisition, development, borrowing costs and holding costsuntil Finance costs and holding charges incurred after development is completed are expensed.
Revenue arising from the sale of property is recognised in the statement of comprehensive incomeas at the time of signing an unconditional contract of sale.
Land held for resale is classified as current except where it is held as non-current based on Council'sintention to release for sale.
(g) Fixed Assets
Initial Recognition
RevaluationCertain asset classes may be revalued on a regular basis such that the carrying values are not materiallydifferent from fair value. For infrastructure and other asset classes where no active market exists, fairvalue is determined to be the current replacement cost of an asset less, where applicable, accumulateddepreciation calculated on the basis of such cost to reflect the already consumed or expired futureeconomic benefits of the asset.
Those assets carried at a revalued amount, being their fair value at the date of revaluation less anysubsequent accumulated depreciation and accumulated impairment losses, are to be revalued withsufficient regularity to ensure the carrying amount does not differ materially from that determined usingfair value at reporting date.
Any accumulated depreciation at the date of revaluation is eliminated against the gross
Each class of fixed assets is carried at cost or fair value as indicated less, where applicable, any accumulated depreciation or impairment losses.
All assets are initially recognised at cost. Cost is determined as the fair value of the assets given as consideration plus costs incidental to the acquisition. For assets acquired at no cost or for nominal consideration, cost is determined as fair value at the date of acquisition. The cost of non-current assets constructed by the Council includes the cost of all materials used in construction, direct labour on the project and an appropriate proportion of variable and fixed overhead.
Net realisable value is the estimated selling price in the ordinary course of business less the estimated costs of completion and the estimated costs necessary to make the sale.
MURCHISON REGIONAL VERMIN COUNCIL
Inventories are measured at the lower of cost and net realisable value.
Increases in the carrying amount arising on revaluation of assets are credited to a
MRVC Ordinary Meeting of Council 12 March 2013 21 of 84

NOTES TO AND FORMING PART OF THE FINANCIAL REPORTFOR THE PERIOD ENDED 28TH FEBRUARY 2013
1. SIGNIFICANT ACCOUNTING POLICIES (Continued)
(g) Fixed Assets (Continued)
Depreciation of Non-Current Assets (Continued)
Depreciation is recognised on a straight-line basis, using rates which are reviewed each reportingperiod. Major depreciation periods are:
Fencing 50 yearsPlant and Equipment 10 years
Capitalisation Threshold
(h) Financial Instruments
Initial Recognition and Measurement
Classification and Subsequent Measurement
techniques are adopted.
Gains and losses on disposals are determined by comparing proceeds with the carrying amount. These gains and losses are included in the statement of comprehensive income. When revalued assets are sold, amounts included in the revaluation surplus relating to that asset are transferred to retained earnings.
Expenditure on items of equipment under $2,000 is not capitalised. Rather, it is recorded on an asset inventory listing.
Financial assets and financial liabilities are recognised when the Council becomes a party to the contractual provisions to the instrument. For financial assets, this is equivalent to the date that the Council commits itself to either the purchase or sale of the asset (i.e. trade date accounting is adopted).
Financial instruments are initially measured at fair value plus transaction costs, except where the instrument is classified 'at fair value through profit or loss', in which case transaction costs are expensed to profit or loss immediately.
An asset's carrying amount is written down immediately to its recoverable amount if the asset's carrying amount is greater than its estimated recoverable amount.
MURCHISON REGIONAL VERMIN COUNCIL
Financial instruments are subsequently measured at fair value, amortised cost using the effective interest rate method or at cost.
Fair value represents the amount for which an asset could be exchanged or a liability settled, between knowledgeable, willing parties. Where available, quoted prices in an active market are used to determine fair value. In other circumstances, valuation
MRVC Ordinary Meeting of Council 12 March 2013 22 of 84
NOTES TO AND FORMING PART OF THE FINANCIAL REPORTFOR THE PERIOD ENDED 28TH FEBRUARY 2013
1. SIGNIFICANT ACCOUNTING POLICIES (Continued)
(h) Financial Instruments (Continued)
Classification and Subsequent Measurement (Continued)
(i) Financial assets at fair value through profit and loss
(ii) Loans and receivables
(iii) Held-to-maturity investments
Loans and receivables are included in current assets, except for those which are not expected to mature within 12 months after the end of the reporting period (classified as
Held-to-maturity investments are non-derivative financial assets with fixed maturities and fixed or determinable payments and fixed maturities that the Council’s management has the positive intention and ability to hold to maturity.
(b) less principal repayments;
(c) plus or minus the cumulative amortisation of the difference, if any, between the
(b) less any reduction for impairment.
The effective interest rate method is used to allocate interest income or interest expense over the relevant period and is equivalent to the rate that exactly discounts estimated future cash payments or receipts (including fees, transaction costs and other premiums or discounts) through the expected life (or when this cannot be reliably predicted, the contractual term) of the financial instrument to the net carrying amount of the financial asset or financial liability. Revisions to expected future net cash flows will necessitate an adjustment to the carrying value with a consequential recognition of an income or
Financial assets at fair value through profit or loss are financial assets held for trading. A financial asset is classified in this category if acquired principally for the purpose of selling in the short term. Derivatives are classified as held for trading unless they are designated as hedges. Assets in this category are classified as current assets.
Loans and receivables are non-derivative financial assets with fixed or determinable payments that are not quoted in an active market and are subsequently measured at
Amortised cost is calculated as:
MURCHISON REGIONAL VERMIN COUNCIL
Held-to-maturity financial assets are included in non-current assets, except for those which are expected to mature within 12 months after the end of the reporting period (classified as current assets).
the amount in which the financial asset or financial liability is measured at initial recognit
If the Council were to sell other than an insignificant amount of held-to-maturity financial assets, the whole category would be tainted and reclassified as available-for-sale.
MRVC Ordinary Meeting of Council 12 March 2013 23 of 84

NOTES TO AND FORMING PART OF THE FINANCIAL REPORTFOR THE PERIOD ENDED 28TH FEBRUARY 2013
1. SIGNIFICANT ACCOUNTING POLICIES (Continued)
(h) Financial Instruments (Continued)
Classification and Subsequent Measurement (Continued)(iv) Available-for-sale financial assets
(v) Financial liabilities
Impairment
(i) Estimation of Fair Value
Quoted market prices or dealer quotes for similar instruments are used for long-term debt instruments held. Other techniques, such as estimated discounted cash flows, are used to determine fair value for the remaining financial instruments.
The nominal value less estimated credit adjustments of trade receivables and payables are assumed to approximate their fair values. The fair value of financial liabilities for disclosure purposes is estimated by discounting the future contractual cash flows at the current market interest rate that is available to the Council for similar financial instruments.
MURCHISON REGIONAL VERMIN COUNCIL
The fair value of financial assets and financial liabilities must be estimated for recognition and measurement or for disclosure purposes.
The fair value of financial instruments traded in active markets is based on quoted market prices at the reporting date.
The fair value of financial instruments that are not traded in an active market is determined using valuation techniques. The Council uses a variety of methods and makes assumptions that are based on market conditions existing at each reporting date. These include the use of recent arm’s length transactions, reference to other instruments that are substantially the same, discounted cash flow analysis, and option pricing models making maximum use of market inputs and relying as little as possible on entity-specific inputs.
Available-for-sale financial assets, are non-derivative financial assets that are either not suitable to be classified into other categories of financial assets due to their nature, or they are designated as such by management. They comprise investments in the equity of other entities where there is neither a fixed maturity nor fixed or determinable.
Non-derivative financial liabilities (excluding financial guarantees) are subsequently measured at amortised cost.
At the end of each reporting period, the Council assesses whether there is objective evidence that a financial instrument has been impaired. In the case of available-for-sale financial instruments, a prolonged decline in the value of the instrument is considered to determine whether impairment has arisen. Impairment losses are recognised in the
Available-for-sale financial assets are included in non-current assets, except for those which are expected to mature within 12 months after the end of the reporting period (classified as current assets).
MRVC Ordinary Meeting of Council 12 March 2013 24 of 84
NOTES TO AND FORMING PART OF THE FINANCIAL REPORTFOR THE PERIOD ENDED 28TH FEBRUARY 2013
1. SIGNIFICANT ACCOUNTING POLICIES (Continued)
(j) ImpairmentIn accordance with Australian Accounting Standards the Council's assets, other than inventories,are assessed at each reporting date to determine whether there is any indication they may be impaired.
Where such an indication exists, an estimate of the recoverable amount of the asset is madein accordance with AASB 136 'Impairment of Assets' and appropriate adjustments made.
An impairment loss is recognised whenever the carrying amount of an asset or its cash-generating unitexceeds its recoverable amount. Impairment losses are recognised in the statement of comprehensiveincome.
For non-cash generating assets such as roads, drains, public buildings and the like, value in use isrepresented by the depreciated replacement cost of the asset.
(k) Trade and Other PayablesTrade and other payables represent liabilities for goods and services provided to the Councilprior to the end of the financial year that are unpaid and arise when the Council becomesobliged to make future payments in respect of the purchase of these goods and services.The amounts are unsecured and are usually paid within 30 days of recognition.
(l) Employee BenefitsThe provisions for employee benefits relates to amounts expected to be paid for long serviceleave, annual leave, wages and salaries and are calculated as follows:
(i) Wages, Salaries, Annual Leave and Long Service Leave (Short-term Benefits)The provision for employees’ benefits to wages, salaries, annual leave and long service leaveexpected to be settled within 12 months represents the amount the Council has a presentobligation to pay resulting from employees services provided to reporting date. The provision hasbeen calculated at nominal amounts based on remuneration rates the Council expects to payand includes related on-costs.
(ii) Long Service Leave (Long-term Benefits)
(m) Borrowing CostsBorrowing costs are recognised as an expense when incurred except where they are directlyattributable to the acquisition, construction or production of a qualifying asset. Where this isthe case, they are capitalised as part of the cost of the particular asset.
MURCHISON REGIONAL VERMIN COUNCIL
The liability for long service leave is recognised in the provision for employee benefits and measured as the present value of expected future payments to be made in respect of services provided by employees up to the reporting date using the projected unit credit method. Consideration is given to expected future wage and salary levels, experience of employee departures and periods of service. Expected future payments are discounted using market yields at the reporting date on national government bonds with terms to maturity and currency that match as closely as possible, the estimated future cash outflows. Where the Council does not have the unconditional right to defer settlement beyond 12 months, the liability is recognised as a current liability.
MRVC Ordinary Meeting of Council 12 March 2013 25 of 84
NOTES TO AND FORMING PART OF THE FINANCIAL REPORTFOR THE PERIOD ENDED 28TH FEBRUARY 2013
1. SIGNIFICANT ACCOUNTING POLICIES (Continued)
(n) ProvisionsProvisions are recognised when:
a) the Council has a present legal or constructive obligation as a result of past events; b) for which it is probable that an outflow of economic benefits will result to settle the obligation; and c) that outflow can be reliably measured.
Provisions are not recognised for future operating losses.
(o) LeasesLeases of fixed assets, where substantially all the risks and benefits incidental to the ownershipof the asset, but not legal ownership, are transferred to the Council, are classified as financeleases. Finance leases are capitalised recording an asset and a liability equal to the present
Finance leases are capitalised recording an asset and a liability at the lower amounts equal to thefair value of the leased property or the present value of the minimum lease payments, including anyguaranteed residual values. Lease payments are allocated between the reduction of the lease liabilityand the lease interest expense for the period.
Leased assets are depreciated on a straight line basis over the shorter of their estimated useful livesor the lease term.
Lease payments for operating leases, where substantially all the risks and benefits remain with thelessor, are charged as expenses in the periods in which they are incurred.
Lease incentives under operating leases are recognised as a liability and amortised on a straight linebasis over the life of the lease term.
(p) Joint VentureThe Council does not have any interest in a joint venture.
(q) Rates, Grants, Donations and Other ContributionsRates, grants, donations and other contributions are recognised as revenues when the localgovernment obtains control over the assets comprising the contributions. Control over assetsacquired from rates is obtained at the commencement of the rating period or, where earlier, uponreceipt of the rates.
Where contributions recognised as revenues during the reporting period were obtained on thecondition that they be expended in a particular manner or used over a particular period, and thoseconditions were undischarged as at the reporting date, the nature of and amounts pertaining tothose undischarged conditions are disclosed in Note 2(c). That note also discloses the amountof contributions recognised as revenues in a previous reporting period which were obtained inrespect of the local government's operation for the current reporting period.
Provisions are measured using the best estimate of the amounts required to settle the obligation at the end of the reporting period.
MURCHISON REGIONAL VERMIN COUNCIL
MRVC Ordinary Meeting of Council 12 March 2013 26 of 84

NOTES TO AND FORMING PART OF THE FINANCIAL REPORTFOR THE PERIOD ENDED 28TH FEBRUARY 2013
1. SIGNIFICANT ACCOUNTING POLICIES (Continued)
(r) Superannuation
(s) Current and Non-Current Classification
(t) Rounding Off FiguresAll figures shown in this annual financial report, other than a rate in the dollar, are rounded to thenearest dollar.
(u) Comparative FiguresWhere required, comparative figures have been adjusted to conform with changes in presentationfor the current financial year.
(v) Budget Comparative FiguresUnless otherwise stated, the budget comparative figures shown in this annual financial report relate tothe original budget estimate for the relevant item of disclosure.
The Council contributes to a number of superannuation funds on behalf of employees.
In the determination of whether an asset or liability is current or non-current, consideration is given to the time when each asset or liability is expected to be settled. The asset or liability is classified as current if it is expected to be settled within the next 12 months, being the Council’s operational cycle. In the case of liabilities where the Council does not have the unconditional right to defer settlement beyond 12 months, such as vested long service leave, the liability is classified as current even if not expected to be settled within the next 12 months. Inventories held for trading are classified as current even if not expected to be realised in the next 12 months except for land held for resale where it is held as non-current based on Council’s intentions to release for sale.
MURCHISON REGIONAL VERMIN COUNCIL
MRVC Ordinary Meeting of Council 12 March 2013 27 of 84
NOTES TO AND FORMING PART OF THE FINANCIAL REPORTFOR THE PERIOD ENDED 28TH FEBRUARY 2013
1. SIGNIFICANT ACCOUNTING POLICIES (Continued)
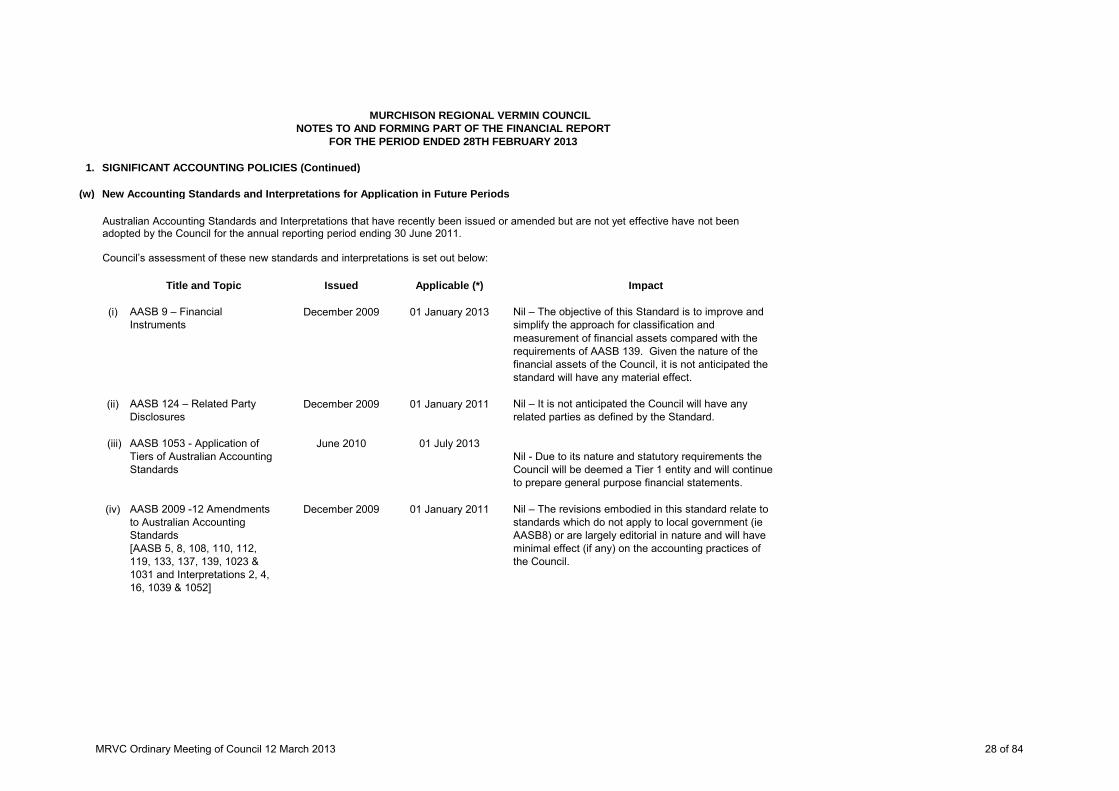
(w) New Accounting Standards and Interpretations for Application in Future Periods
Title and Topic Issued Applicable (*) Impact
(i) AASB 9 – Financial Instruments
December 2009 01 January 2013 Nil – The objective of this Standard is to improve and simplify the approach for classification andmeasurement of financial assets compared with the requirements of AASB 139. Given the nature of the financial assets of the Council, it is not anticipated the standard will have any material effect.
(ii) AASB 124 – Related Party Disclosures
December 2009 01 January 2011 Nil – It is not anticipated the Council will have any related parties as defined by the Standard.
(iii) AASB 1053 - Application of Tiers of Australian Accounting Standards
June 2010 01 July 2013Nil - Due to its nature and statutory requirements the Council will be deemed a Tier 1 entity and will continue to prepare general purpose financial statements.
(iv) AASB 2009 -12 Amendments to Australian Accounting Standards [AASB 5, 8, 108, 110, 112, 119, 133, 137, 139, 1023 & 1031 and Interpretations 2, 4, 16, 1039 & 1052]
December 2009 01 January 2011 Nil – The revisions embodied in this standard relate to standards which do not apply to local government (ie AASB8) or are largely editorial in nature and will have minimal effect (if any) on the accounting practices of the Council.
MURCHISON REGIONAL VERMIN COUNCIL
Australian Accounting Standards and Interpretations that have recently been issued or amended but are not yet effective have not been adopted by the Council for the annual reporting period ending 30 June 2011. Council’s assessment of these new standards and interpretations is set out below:
MRVC Ordinary Meeting of Council 12 March 2013 28 of 84

NOTES TO AND FORMING PART OF THE FINANCIAL REPORTFOR THE PERIOD ENDED 28TH FEBRUARY 2013
1. SIGNIFICANT ACCOUNTING POLICIES (Continued)
(w) New Accounting Standards and Interpretations for Application in Future Periods (Continued)
Title and Topic Issued Applicable (*) Impact
(v) AASB 2009– 11 Amendments to Australian Accounting Standards arising from AASB 9
December 2009 01 January 2013 Nil – The revisions embodied in this standard give effect to the consequential changes arising from the issuance of AASB 9 which is not anticipated to have any material effect on the Council (refer (i) above).
[AASB 1, 3, 4, 5, 7, 101, 102, 108, 112, 118, 121, 127, 128, 131, 132, 136, 139, 1023 & 1038 and Interpretations 10 & 12)
(vi) AASB 2010 - 2 Amendments to Australian Accounting Standards arising from Reduced Disclosure Requirements [AASB 1, 2, 3, 5, 7, 8, 101, 102, 107, 108, 110, 111, 112, 116, 117, 119, 121, 123, 124, 127, 128, 131, 133, 134, 136, 137, 138, 140, 141, 1050, & 1052 and Interpretations 2, 4, 5, 15, 17, 127, 129 & 1052]
June 2010 01 July 2013 Nil - None of these amendments will have any effect on the financial report as the standard does not apply in the case of general purpose financial statements.
(vii) AASB 2010 - 4 Further Amendments to Australian Accounting Standards arising from the Annual Improvements Project [AASB 1, 7, 101, 134, and Interpretation 13]
June 2010 01 January 2011 Nil - The revisions are part of the AASB's annual improvement project to help ensure consistency with presentation, recognition and measurement criteria of IFRSs. It is not anticipated these will have any effect on the Council.
MURCHISON REGIONAL VERMIN COUNCIL
MRVC Ordinary Meeting of Council 12 March 2013 29 of 84
NOTES TO AND FORMING PART OF THE FINANCIAL REPORTFOR THE PERIOD ENDED 28TH FEBRUARY 2013
1. SIGNIFICANT ACCOUNTING POLICIES (Continued)
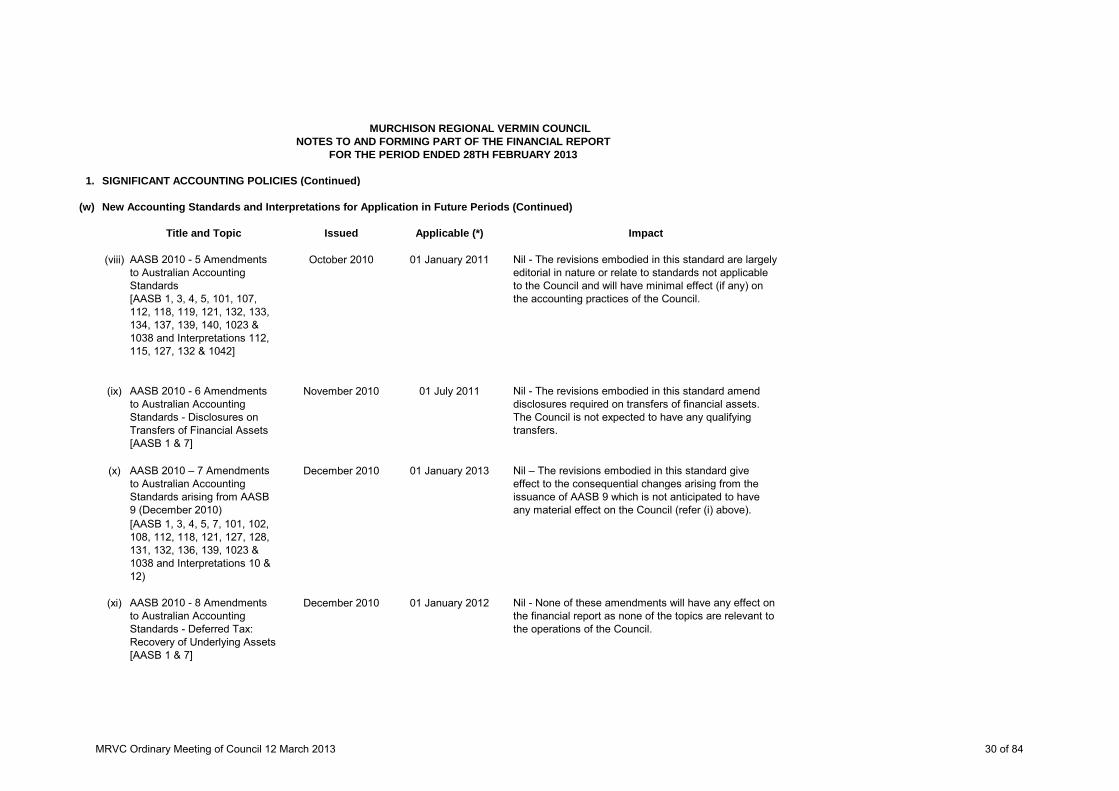
(w) New Accounting Standards and Interpretations for Application in Future Periods (Continued)
Title and Topic Issued Applicable (*) Impact
(viii) AASB 2010 - 5 Amendments to Australian Accounting Standards [AASB 1, 3, 4, 5, 101, 107, 112, 118, 119, 121, 132, 133, 134, 137, 139, 140, 1023 & 1038 and Interpretations 112, 115, 127, 132 & 1042]
October 2010 01 January 2011 Nil - The revisions embodied in this standard are largely editorial in nature or relate to standards not applicable to the Council and will have minimal effect (if any) on the accounting practices of the Council.
(ix) AASB 2010 - 6 Amendments to Australian Accounting Standards - Disclosures on Transfers of Financial Assets [AASB 1 & 7]
November 2010 01 July 2011 Nil - The revisions embodied in this standard amend disclosures required on transfers of financial assets. The Council is not expected to have any qualifying transfers.
(x) AASB 2010 – 7 Amendments to Australian Accounting Standards arising from AASB 9 (December 2010)
December 2010 01 January 2013 Nil – The revisions embodied in this standard give effect to the consequential changes arising from the issuance of AASB 9 which is not anticipated to have any material effect on the Council (refer (i) above).
[AASB 1, 3, 4, 5, 7, 101, 102, 108, 112, 118, 121, 127, 128, 131, 132, 136, 139, 1023 & 1038 and Interpretations 10 & 12)
(xi) AASB 2010 - 8 Amendments to Australian Accounting Standards - Deferred Tax: Recovery of Underlying Assets [AASB 1 & 7]
December 2010 01 January 2012 Nil - None of these amendments will have any effect on the financial report as none of the topics are relevant to the operations of the Council.
MURCHISON REGIONAL VERMIN COUNCIL
MRVC Ordinary Meeting of Council 12 March 2013 30 of 84
NOTES TO AND FORMING PART OF THE FINANCIAL REPORTFOR THE PERIOD ENDED 28TH FEBRUARY 2013
1. SIGNIFICANT ACCOUNTING POLICIES (Continued)
(w) New Accounting Standards and Interpretations for Application in Future Periods (Continued)
Title and Topic Issued Applicable (*) Impact
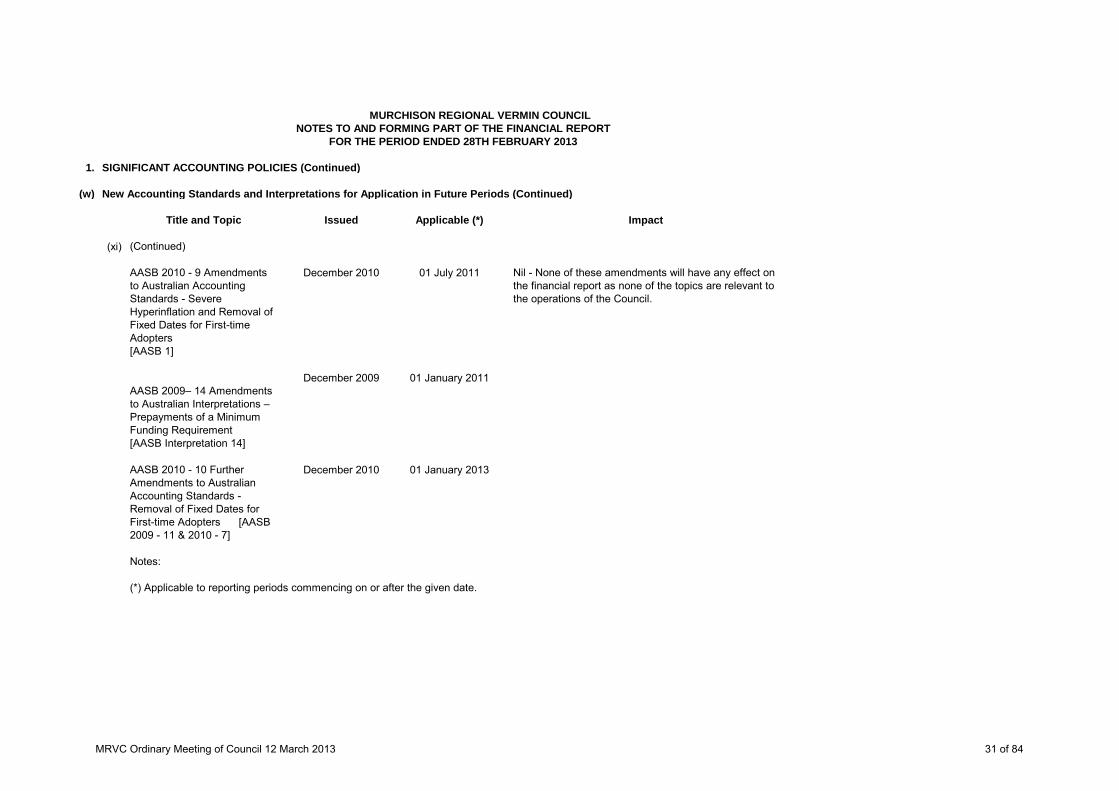
(xi) (Continued)
AASB 2010 - 9 Amendments to Australian Accounting Standards - Severe Hyperinflation and Removal of Fixed Dates for First-time Adopters [AASB 1]
December 2010 01 July 2011 Nil - None of these amendments will have any effect on the financial report as none of the topics are relevant to the operations of the Council.
AASB 2009– 14 Amendments to Australian Interpretations – Prepayments of a Minimum Funding Requirement [AASB Interpretation 14]
December 2009 01 January 2011
AASB 2010 - 10 Further Amendments to Australian Accounting Standards - Removal of Fixed Dates for First-time Adopters [AASB 2009 - 11 & 2010 - 7]
December 2010 01 January 2013
Notes:
(*) Applicable to reporting periods commencing on or after the given date.
MURCHISON REGIONAL VERMIN COUNCIL
MRVC Ordinary Meeting of Council 12 March 2013 31 of 84

NOTES TO AND FORMING PART OF THE FINANCIAL REPORTFOR THE PERIOD ENDED 28TH FEBRUARY 2013
1. SIGNIFICANT ACCOUNTING POLICIES (Continued)
(x) Adoption of New and Revised Accounting Standards
AASB 2009 - 5AASB 2009 - 8AASB 2009 - 10AASB 2009 - 13AASB 2010 - 1AASB 2010 - 3
Interpretation 19
During the current year, the Council adopted all of the new and revised Australian Accounting Standards and Interpretations which became mandatory and which were applicable to its operations.
These new and revised standards were:
The standards adopted had a minimal effect on the accounting and reporting practices of the Council as they were either largely editorial in nature, were revisions to help ensure consistency with presentation, recognition and measurement criteria of IFRSs or related to topics not relevant to operations.
MURCHISON REGIONAL VERMIN COUNCIL
MRVC Ordinary Meeting of Council 12 March 2013 32 of 84

Murchison Regional Vermin CouncilPO BOX 62
MOUNT MAGNET WA6638
Profit & Loss StatementJuly 2012 through February 2013
IncomeGeneral Purpose Funds $28,000.00 Precepts $29,997.94 Rental Fences $5,836.97 Total Income $63,834.91
ExpensesBank Fees $119.54 Depreciation $0.00 Administration $6,976.59 Legal Accounting Audit $4,029.00 Fence Maintenance $25,662.91 Meeting Fees $1,680.00 Meeting Expenses $903.70 Presidents Allowance $530.00 Telephone $579.22 Total Expenses $40,480.96
Operating Profit $23,353.95
Other IncomeInterest Income $17,199.01 Total Other Income $17,199.01
Net Surplus / (Deficit) $40,552.96
MRVC Ordinary Meeting of Council 12 March 2013 33 of 84

Murchison Regional Vermin CouncilPO BOX 62
MOUNT MAGNET WA6638
Balance SheetAs of February 2013
AssetsCurrent AssetsCheque Account $11,364.63 Cash Deposit Account $502,557.17 Receivables $6,464.76 Provision for Doubtful Debts ($3,000.00)Inventory $2,955.08 RFR Stock on Hand $0.00 Total Current Assets $520,341.64 Plant and Equipment at Cost $9,119.00 Plant and Equipment Accum Dep ($9,119.00)Total Plant and Equipment $0.00 Fence InfrastructureInfrastructure Assets at Cost $3,127,393.00 Infrastructure Asset Accum Dep ($3,077,854.06)Total Fence Infrastructure $49,538.94 Fence WorksFence Works at Cost $1,127,148.44 Fence Works Acumm Dep ($3,236.00)Total Property & Equipment $1,173,451.38 Total Assets $1,693,793.02
LiabilitiesCurrent LiabilitiesTrade Creditors $0.00 Other Current Liabilities $0.00 Accrued Payments $4,000.00 Tax LiabilitiesGST Collected $183,561.86 GST Paid ($206,976.79)Total Tax Liabilities ($23,414.93)Total Current Liabilities ($19,414.93)Non Current LiabilitiesOther Long-Term Liabilities $0.00 Total Non Current Liabilities $0.00 Total Liabilities ($19,414.93)
Net Assets $1,713,207.95
EquityRetained Earnings $1,672,654.99 Current Year Surplus/Deficit $40,552.96 Historical Balancing $0.00 Total Equity $1,713,207.95
MRVC Ordinary Meeting of Council 12 March 2013 34 of 84
Murchison Regional Vermin CouncilPO BOX 62
MOUNT MAGNET WA6638
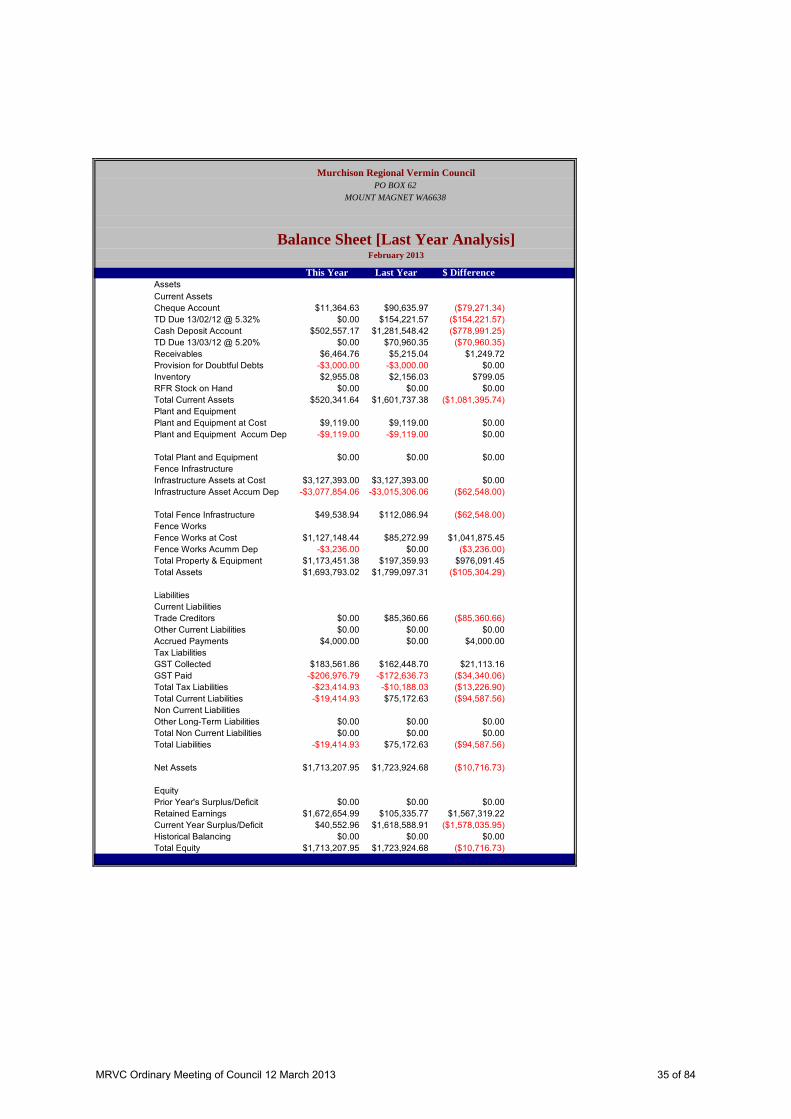
Balance Sheet [Last Year Analysis]February 2013
This Year Last Year $ DifferenceAssetsCurrent AssetsCheque Account $11,364.63 $90,635.97 ($79,271.34)TD Due 13/02/12 @ 5.32% $0.00 $154,221.57 ($154,221.57)Cash Deposit Account $502,557.17 $1,281,548.42 ($778,991.25)TD Due 13/03/12 @ 5.20% $0.00 $70,960.35 ($70,960.35)Receivables $6,464.76 $5,215.04 $1,249.72 Provision for Doubtful Debts -$3,000.00 -$3,000.00 $0.00 Inventory $2,955.08 $2,156.03 $799.05 RFR Stock on Hand $0.00 $0.00 $0.00 Total Current Assets $520,341.64 $1,601,737.38 ($1,081,395.74)Plant and EquipmentPlant and Equipment at Cost $9,119.00 $9,119.00 $0.00 Plant and Equipment Accum Dep -$9,119.00 -$9,119.00 $0.00
Total Plant and Equipment $0.00 $0.00 $0.00 Fence InfrastructureInfrastructure Assets at Cost $3,127,393.00 $3,127,393.00 $0.00 Infrastructure Asset Accum Dep -$3,077,854.06 -$3,015,306.06 ($62,548.00)
Total Fence Infrastructure $49,538.94 $112,086.94 ($62,548.00)Fence WorksFence Works at Cost $1,127,148.44 $85,272.99 $1,041,875.45 Fence Works Acumm Dep -$3,236.00 $0.00 ($3,236.00)Total Property & Equipment $1,173,451.38 $197,359.93 $976,091.45 Total Assets $1,693,793.02 $1,799,097.31 ($105,304.29)
LiabilitiesCurrent LiabilitiesTrade Creditors $0.00 $85,360.66 ($85,360.66)Other Current Liabilities $0.00 $0.00 $0.00 Accrued Payments $4,000.00 $0.00 $4,000.00 Tax LiabilitiesGST Collected $183,561.86 $162,448.70 $21,113.16 GST Paid -$206,976.79 -$172,636.73 ($34,340.06)Total Tax Liabilities -$23,414.93 -$10,188.03 ($13,226.90)Total Current Liabilities -$19,414.93 $75,172.63 ($94,587.56)Non Current LiabilitiesOther Long-Term Liabilities $0.00 $0.00 $0.00 Total Non Current Liabilities $0.00 $0.00 $0.00 Total Liabilities -$19,414.93 $75,172.63 ($94,587.56)
Net Assets $1,713,207.95 $1,723,924.68 ($10,716.73)
EquityPrior Year's Surplus/Deficit $0.00 $0.00 $0.00 Retained Earnings $1,672,654.99 $105,335.77 $1,567,319.22 Current Year Surplus/Deficit $40,552.96 $1,618,588.91 ($1,578,035.95)Historical Balancing $0.00 $0.00 $0.00 Total Equity $1,713,207.95 $1,723,924.68 ($10,716.73)
MRVC Ordinary Meeting of Council 12 March 2013 35 of 84
Murchison Regional Vermin CouncilPO BOX 62
MOUNT MAGNET WA6638
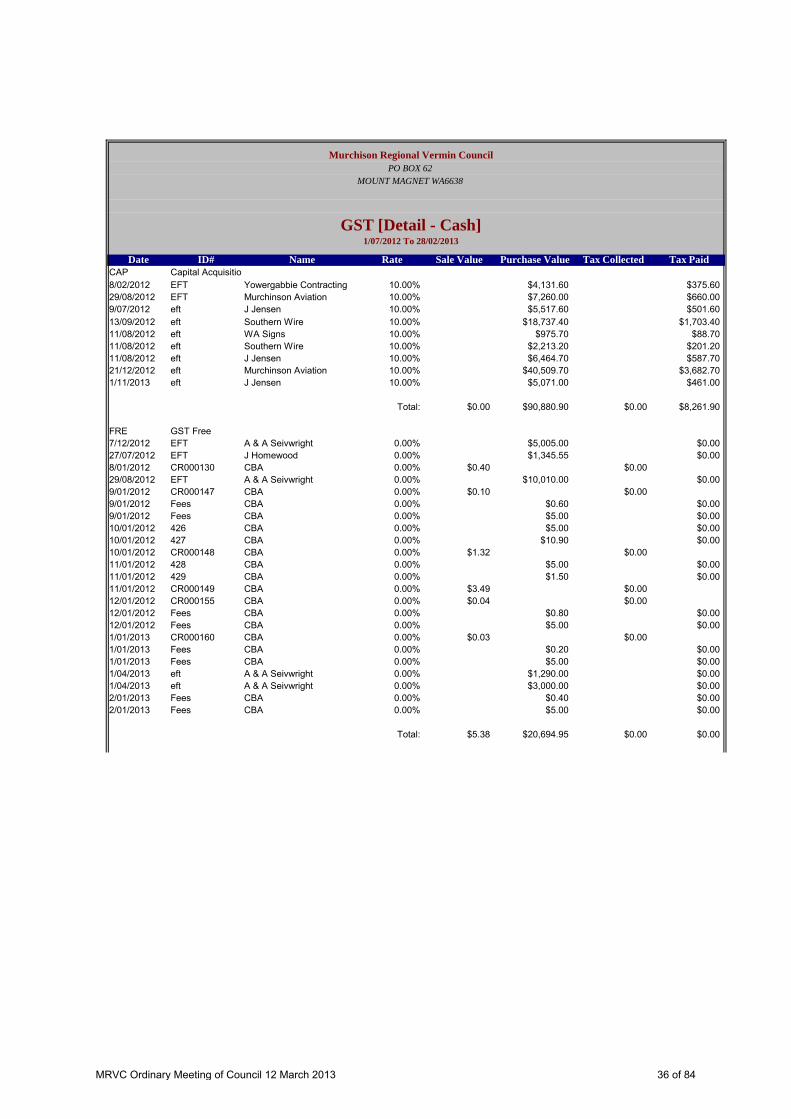
GST [Detail - Cash]1/07/2012 To 28/02/2013
Date ID# Name Rate Sale Value Purchase Value Tax Collected Tax PaidCAP Capital Acquisitio8/02/2012 EFT Yowergabbie Contracting 10.00% $4,131.60 $375.6029/08/2012 EFT Murchinson Aviation 10.00% $7,260.00 $660.009/07/2012 eft J Jensen 10.00% $5,517.60 $501.6013/09/2012 eft Southern Wire 10.00% $18,737.40 $1,703.4011/08/2012 eft WA Signs 10.00% $975.70 $88.7011/08/2012 eft Southern Wire 10.00% $2,213.20 $201.2011/08/2012 eft J Jensen 10.00% $6,464.70 $587.7021/12/2012 eft Murchinson Aviation 10.00% $40,509.70 $3,682.701/11/2013 eft J Jensen 10.00% $5,071.00 $461.00
Total: $0.00 $90,880.90 $0.00 $8,261.90
FRE GST Free7/12/2012 EFT A & A Seivwright 0.00% $5,005.00 $0.0027/07/2012 EFT J Homewood 0.00% $1,345.55 $0.008/01/2012 CR000130 CBA 0.00% $0.40 $0.0029/08/2012 EFT A & A Seivwright 0.00% $10,010.00 $0.009/01/2012 CR000147 CBA 0.00% $0.10 $0.009/01/2012 Fees CBA 0.00% $0.60 $0.009/01/2012 Fees CBA 0.00% $5.00 $0.0010/01/2012 426 CBA 0.00% $5.00 $0.0010/01/2012 427 CBA 0.00% $10.90 $0.0010/01/2012 CR000148 CBA 0.00% $1.32 $0.0011/01/2012 428 CBA 0.00% $5.00 $0.0011/01/2012 429 CBA 0.00% $1.50 $0.0011/01/2012 CR000149 CBA 0.00% $3.49 $0.0012/01/2012 CR000155 CBA 0.00% $0.04 $0.0012/01/2012 Fees CBA 0.00% $0.80 $0.0012/01/2012 Fees CBA 0.00% $5.00 $0.001/01/2013 CR000160 CBA 0.00% $0.03 $0.001/01/2013 Fees CBA 0.00% $0.20 $0.001/01/2013 Fees CBA 0.00% $5.00 $0.001/04/2013 eft A & A Seivwright 0.00% $1,290.00 $0.001/04/2013 eft A & A Seivwright 0.00% $3,000.00 $0.002/01/2013 Fees CBA 0.00% $0.40 $0.002/01/2013 Fees CBA 0.00% $5.00 $0.00
Total: $5.38 $20,694.95 $0.00 $0.00
MRVC Ordinary Meeting of Council 12 March 2013 36 of 84
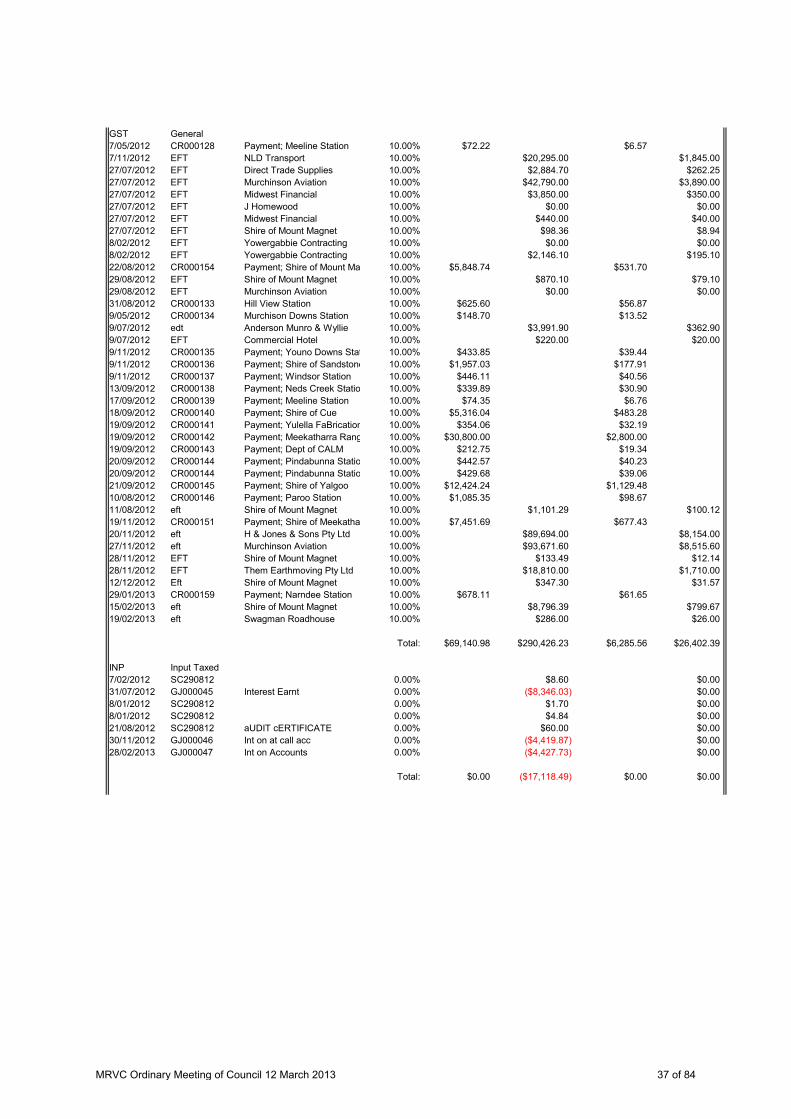
GST General7/05/2012 CR000128 Payment; Meeline Station 10.00% $72.22 $6.577/11/2012 EFT NLD Transport 10.00% $20,295.00 $1,845.0027/07/2012 EFT Direct Trade Supplies 10.00% $2,884.70 $262.2527/07/2012 EFT Murchinson Aviation 10.00% $42,790.00 $3,890.0027/07/2012 EFT Midwest Financial 10.00% $3,850.00 $350.0027/07/2012 EFT J Homewood 10.00% $0.00 $0.0027/07/2012 EFT Midwest Financial 10.00% $440.00 $40.0027/07/2012 EFT Shire of Mount Magnet 10.00% $98.36 $8.948/02/2012 EFT Yowergabbie Contracting 10.00% $0.00 $0.008/02/2012 EFT Yowergabbie Contracting 10.00% $2,146.10 $195.1022/08/2012 CR000154 Payment; Shire of Mount Ma 10.00% $5,848.74 $531.7029/08/2012 EFT Shire of Mount Magnet 10.00% $870.10 $79.1029/08/2012 EFT Murchinson Aviation 10.00% $0.00 $0.0031/08/2012 CR000133 Hill View Station 10.00% $625.60 $56.879/05/2012 CR000134 Murchison Downs Station 10.00% $148.70 $13.529/07/2012 edt Anderson Munro & Wyllie 10.00% $3,991.90 $362.909/07/2012 EFT Commercial Hotel 10.00% $220.00 $20.009/11/2012 CR000135 Payment; Youno Downs Stat 10.00% $433.85 $39.449/11/2012 CR000136 Payment; Shire of Sandstone 10.00% $1,957.03 $177.919/11/2012 CR000137 Payment; Windsor Station 10.00% $446.11 $40.5613/09/2012 CR000138 Payment; Neds Creek Statio 10.00% $339.89 $30.9017/09/2012 CR000139 Payment; Meeline Station 10.00% $74.35 $6.7618/09/2012 CR000140 Payment; Shire of Cue 10.00% $5,316.04 $483.2819/09/2012 CR000141 Payment; Yulella FaBrication 10.00% $354.06 $32.1919/09/2012 CR000142 Payment; Meekatharra Rang 10.00% $30,800.00 $2,800.0019/09/2012 CR000143 Payment; Dept of CALM 10.00% $212.75 $19.3420/09/2012 CR000144 Payment; Pindabunna Statio 10.00% $442.57 $40.2320/09/2012 CR000144 Payment; Pindabunna Statio 10.00% $429.68 $39.0621/09/2012 CR000145 Payment; Shire of Yalgoo 10.00% $12,424.24 $1,129.4810/08/2012 CR000146 Payment; Paroo Station 10.00% $1,085.35 $98.6711/08/2012 eft Shire of Mount Magnet 10.00% $1,101.29 $100.1219/11/2012 CR000151 Payment; Shire of Meekatha 10.00% $7,451.69 $677.4320/11/2012 eft H & Jones & Sons Pty Ltd 10.00% $89,694.00 $8,154.0027/11/2012 eft Murchinson Aviation 10.00% $93,671.60 $8,515.6028/11/2012 EFT Shire of Mount Magnet 10.00% $133.49 $12.1428/11/2012 EFT Them Earthmoving Pty Ltd 10.00% $18,810.00 $1,710.0012/12/2012 Eft Shire of Mount Magnet 10.00% $347.30 $31.5729/01/2013 CR000159 Payment; Narndee Station 10.00% $678.11 $61.6515/02/2013 eft Shire of Mount Magnet 10.00% $8,796.39 $799.6719/02/2013 eft Swagman Roadhouse 10.00% $286.00 $26.00
Total: $69,140.98 $290,426.23 $6,285.56 $26,402.39
INP Input Taxed7/02/2012 SC290812 0.00% $8.60 $0.0031/07/2012 GJ000045 Interest Earnt 0.00% ($8,346.03) $0.008/01/2012 SC290812 0.00% $1.70 $0.008/01/2012 SC290812 0.00% $4.84 $0.0021/08/2012 SC290812 aUDIT cERTIFICATE 0.00% $60.00 $0.0030/11/2012 GJ000046 Int on at call acc 0.00% ($4,419.87) $0.0028/02/2013 GJ000047 Int on Accounts 0.00% ($4,427.73) $0.00
Total: $0.00 ($17,118.49) $0.00 $0.00
MRVC Ordinary Meeting of Council 12 March 2013 37 of 84
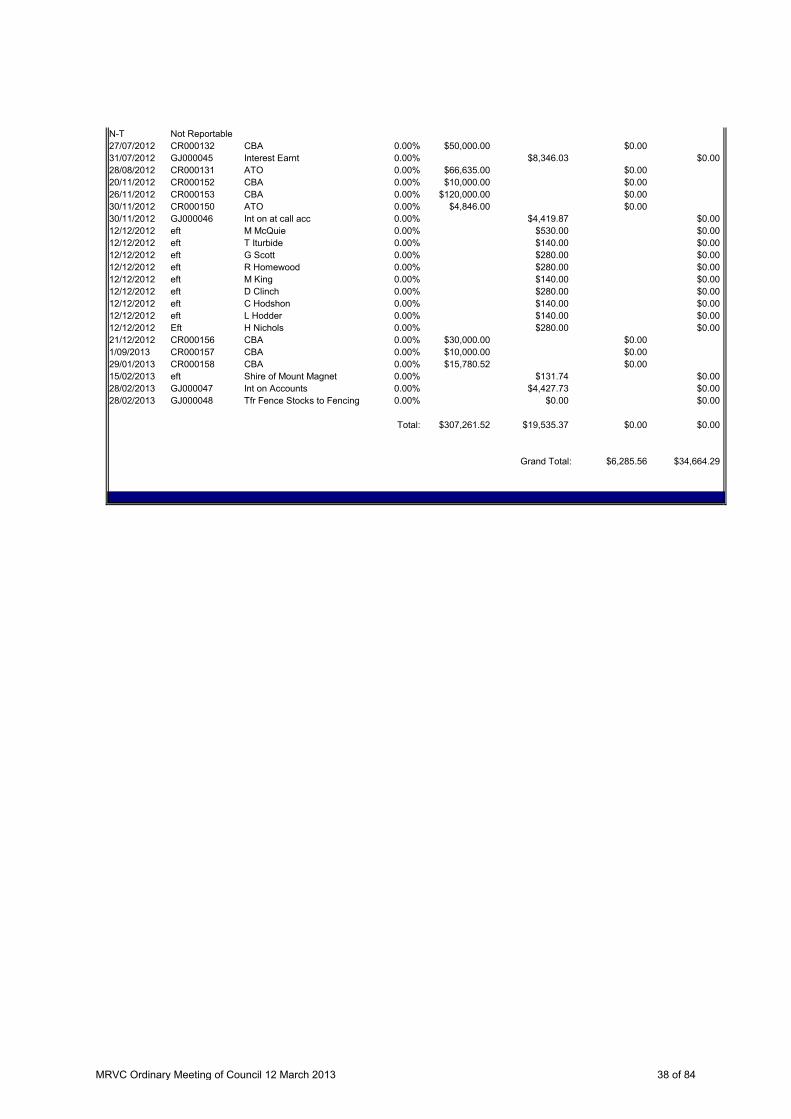
N-T Not Reportable27/07/2012 CR000132 CBA 0.00% $50,000.00 $0.0031/07/2012 GJ000045 Interest Earnt 0.00% $8,346.03 $0.0028/08/2012 CR000131 ATO 0.00% $66,635.00 $0.0020/11/2012 CR000152 CBA 0.00% $10,000.00 $0.0026/11/2012 CR000153 CBA 0.00% $120,000.00 $0.0030/11/2012 CR000150 ATO 0.00% $4,846.00 $0.0030/11/2012 GJ000046 Int on at call acc 0.00% $4,419.87 $0.0012/12/2012 eft M McQuie 0.00% $530.00 $0.0012/12/2012 eft T Iturbide 0.00% $140.00 $0.0012/12/2012 eft G Scott 0.00% $280.00 $0.0012/12/2012 eft R Homewood 0.00% $280.00 $0.0012/12/2012 eft M King 0.00% $140.00 $0.0012/12/2012 eft D Clinch 0.00% $280.00 $0.0012/12/2012 eft C Hodshon 0.00% $140.00 $0.0012/12/2012 eft L Hodder 0.00% $140.00 $0.0012/12/2012 Eft H Nichols 0.00% $280.00 $0.0021/12/2012 CR000156 CBA 0.00% $30,000.00 $0.001/09/2013 CR000157 CBA 0.00% $10,000.00 $0.0029/01/2013 CR000158 CBA 0.00% $15,780.52 $0.0015/02/2013 eft Shire of Mount Magnet 0.00% $131.74 $0.0028/02/2013 GJ000047 Int on Accounts 0.00% $4,427.73 $0.0028/02/2013 GJ000048 Tfr Fence Stocks to Fencing 0.00% $0.00 $0.00
Total: $307,261.52 $19,535.37 $0.00 $0.00
Grand Total: $6,285.56 $34,664.29
MRVC Ordinary Meeting of Council 12 March 2013 38 of 84
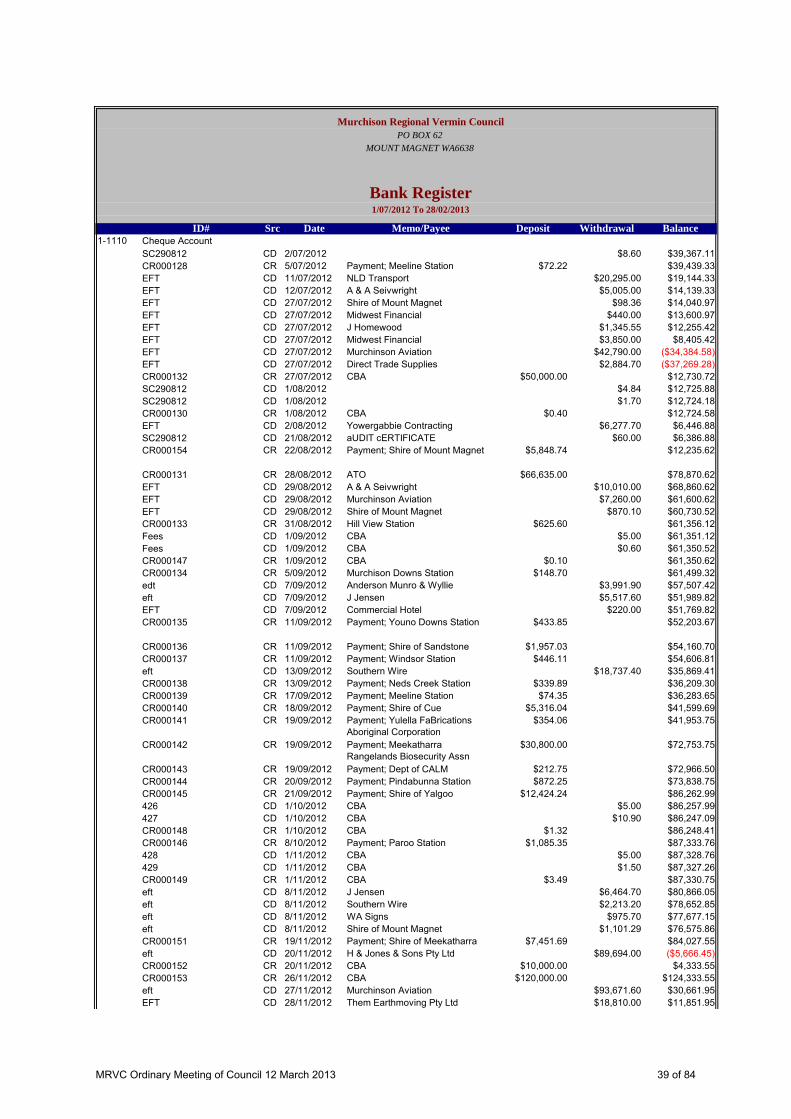
Murchison Regional Vermin CouncilPO BOX 62
MOUNT MAGNET WA6638
Bank Register1/07/2012 To 28/02/2013
ID# Src Date Memo/Payee Deposit Withdrawal Balance1-1110 Cheque Account
SC290812 CD 2/07/2012 $8.60 $39,367.11 CR000128 CR 5/07/2012 Payment; Meeline Station $72.22 $39,439.33 EFT CD 11/07/2012 NLD Transport $20,295.00 $19,144.33 EFT CD 12/07/2012 A & A Seivwright $5,005.00 $14,139.33 EFT CD 27/07/2012 Shire of Mount Magnet $98.36 $14,040.97 EFT CD 27/07/2012 Midwest Financial $440.00 $13,600.97 EFT CD 27/07/2012 J Homewood $1,345.55 $12,255.42 EFT CD 27/07/2012 Midwest Financial $3,850.00 $8,405.42 EFT CD 27/07/2012 Murchinson Aviation $42,790.00 ($34,384.58)EFT CD 27/07/2012 Direct Trade Supplies $2,884.70 ($37,269.28)CR000132 CR 27/07/2012 CBA $50,000.00 $12,730.72 SC290812 CD 1/08/2012 $4.84 $12,725.88 SC290812 CD 1/08/2012 $1.70 $12,724.18 CR000130 CR 1/08/2012 CBA $0.40 $12,724.58 EFT CD 2/08/2012 Yowergabbie Contracting $6,277.70 $6,446.88 SC290812 CD 21/08/2012 aUDIT cERTIFICATE $60.00 $6,386.88 CR000154 CR 22/08/2012 Payment; Shire of Mount Magnet $5,848.74 $12,235.62
CR000131 CR 28/08/2012 ATO $66,635.00 $78,870.62 EFT CD 29/08/2012 A & A Seivwright $10,010.00 $68,860.62 EFT CD 29/08/2012 Murchinson Aviation $7,260.00 $61,600.62 EFT CD 29/08/2012 Shire of Mount Magnet $870.10 $60,730.52 CR000133 CR 31/08/2012 Hill View Station $625.60 $61,356.12 Fees CD 1/09/2012 CBA $5.00 $61,351.12 Fees CD 1/09/2012 CBA $0.60 $61,350.52 CR000147 CR 1/09/2012 CBA $0.10 $61,350.62 CR000134 CR 5/09/2012 Murchison Downs Station $148.70 $61,499.32 edt CD 7/09/2012 Anderson Munro & Wyllie $3,991.90 $57,507.42 eft CD 7/09/2012 J Jensen $5,517.60 $51,989.82 EFT CD 7/09/2012 Commercial Hotel $220.00 $51,769.82 CR000135 CR 11/09/2012 Payment; Youno Downs Station $433.85 $52,203.67
CR000136 CR 11/09/2012 Payment; Shire of Sandstone $1,957.03 $54,160.70 CR000137 CR 11/09/2012 Payment; Windsor Station $446.11 $54,606.81 eft CD 13/09/2012 Southern Wire $18,737.40 $35,869.41 CR000138 CR 13/09/2012 Payment; Neds Creek Station $339.89 $36,209.30 CR000139 CR 17/09/2012 Payment; Meeline Station $74.35 $36,283.65 CR000140 CR 18/09/2012 Payment; Shire of Cue $5,316.04 $41,599.69 CR000141 CR 19/09/2012 Payment; Yulella FaBrications
Aboriginal Corporation$354.06 $41,953.75
CR000142 CR 19/09/2012 Payment; Meekatharra Rangelands Biosecurity Assn
$30,800.00 $72,753.75
CR000143 CR 19/09/2012 Payment; Dept of CALM $212.75 $72,966.50 CR000144 CR 20/09/2012 Payment; Pindabunna Station $872.25 $73,838.75 CR000145 CR 21/09/2012 Payment; Shire of Yalgoo $12,424.24 $86,262.99 426 CD 1/10/2012 CBA $5.00 $86,257.99 427 CD 1/10/2012 CBA $10.90 $86,247.09 CR000148 CR 1/10/2012 CBA $1.32 $86,248.41 CR000146 CR 8/10/2012 Payment; Paroo Station $1,085.35 $87,333.76 428 CD 1/11/2012 CBA $5.00 $87,328.76 429 CD 1/11/2012 CBA $1.50 $87,327.26 CR000149 CR 1/11/2012 CBA $3.49 $87,330.75 eft CD 8/11/2012 J Jensen $6,464.70 $80,866.05 eft CD 8/11/2012 Southern Wire $2,213.20 $78,652.85 eft CD 8/11/2012 WA Signs $975.70 $77,677.15 eft CD 8/11/2012 Shire of Mount Magnet $1,101.29 $76,575.86 CR000151 CR 19/11/2012 Payment; Shire of Meekatharra $7,451.69 $84,027.55 eft CD 20/11/2012 H & Jones & Sons Pty Ltd $89,694.00 ($5,666.45)CR000152 CR 20/11/2012 CBA $10,000.00 $4,333.55 CR000153 CR 26/11/2012 CBA $120,000.00 $124,333.55 eft CD 27/11/2012 Murchinson Aviation $93,671.60 $30,661.95 EFT CD 28/11/2012 Them Earthmoving Pty Ltd $18,810.00 $11,851.95
MRVC Ordinary Meeting of Council 12 March 2013 39 of 84
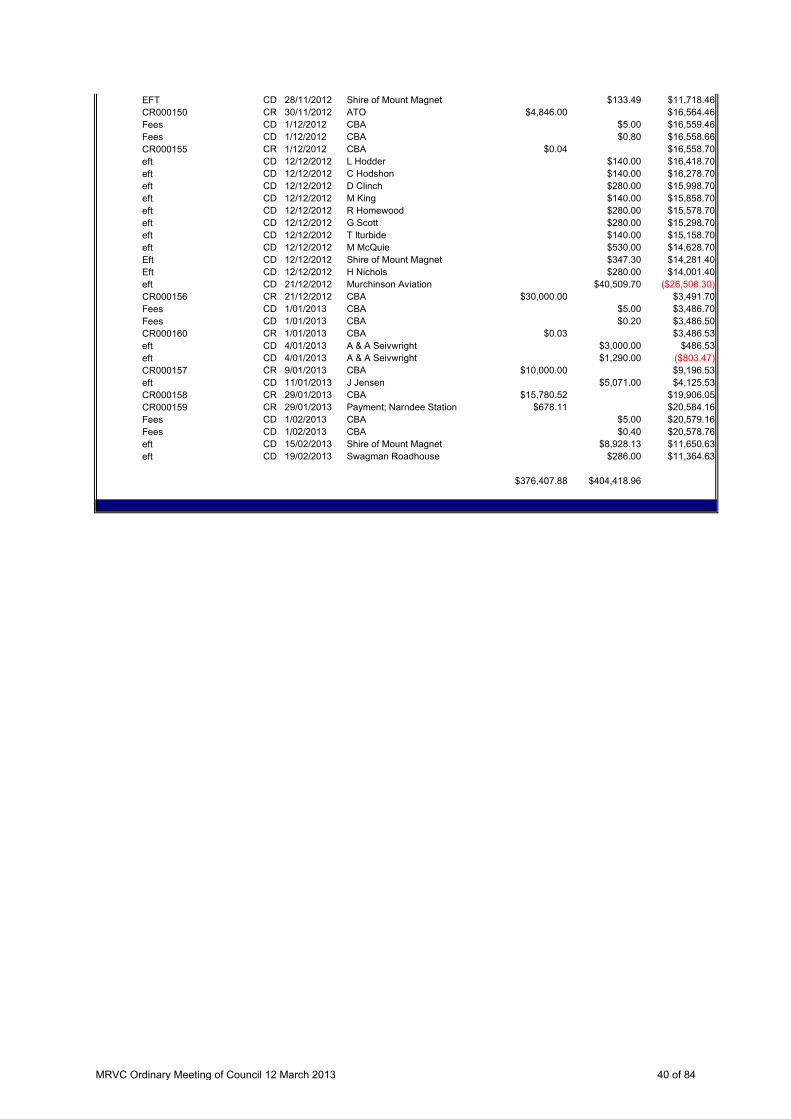
EFT CD 28/11/2012 Shire of Mount Magnet $133.49 $11,718.46 CR000150 CR 30/11/2012 ATO $4,846.00 $16,564.46 Fees CD 1/12/2012 CBA $5.00 $16,559.46 Fees CD 1/12/2012 CBA $0.80 $16,558.66 CR000155 CR 1/12/2012 CBA $0.04 $16,558.70 eft CD 12/12/2012 L Hodder $140.00 $16,418.70 eft CD 12/12/2012 C Hodshon $140.00 $16,278.70 eft CD 12/12/2012 D Clinch $280.00 $15,998.70 eft CD 12/12/2012 M King $140.00 $15,858.70 eft CD 12/12/2012 R Homewood $280.00 $15,578.70 eft CD 12/12/2012 G Scott $280.00 $15,298.70 eft CD 12/12/2012 T Iturbide $140.00 $15,158.70 eft CD 12/12/2012 M McQuie $530.00 $14,628.70 Eft CD 12/12/2012 Shire of Mount Magnet $347.30 $14,281.40 Eft CD 12/12/2012 H Nichols $280.00 $14,001.40 eft CD 21/12/2012 Murchinson Aviation $40,509.70 ($26,508.30)CR000156 CR 21/12/2012 CBA $30,000.00 $3,491.70 Fees CD 1/01/2013 CBA $5.00 $3,486.70 Fees CD 1/01/2013 CBA $0.20 $3,486.50 CR000160 CR 1/01/2013 CBA $0.03 $3,486.53 eft CD 4/01/2013 A & A Seivwright $3,000.00 $486.53 eft CD 4/01/2013 A & A Seivwright $1,290.00 ($803.47)CR000157 CR 9/01/2013 CBA $10,000.00 $9,196.53 eft CD 11/01/2013 J Jensen $5,071.00 $4,125.53 CR000158 CR 29/01/2013 CBA $15,780.52 $19,906.05 CR000159 CR 29/01/2013 Payment; Narndee Station $678.11 $20,584.16 Fees CD 1/02/2013 CBA $5.00 $20,579.16 Fees CD 1/02/2013 CBA $0.40 $20,578.76 eft CD 15/02/2013 Shire of Mount Magnet $8,928.13 $11,650.63 eft CD 19/02/2013 Swagman Roadhouse $286.00 $11,364.63
$376,407.88 $404,418.96
MRVC Ordinary Meeting of Council 12 March 2013 40 of 84
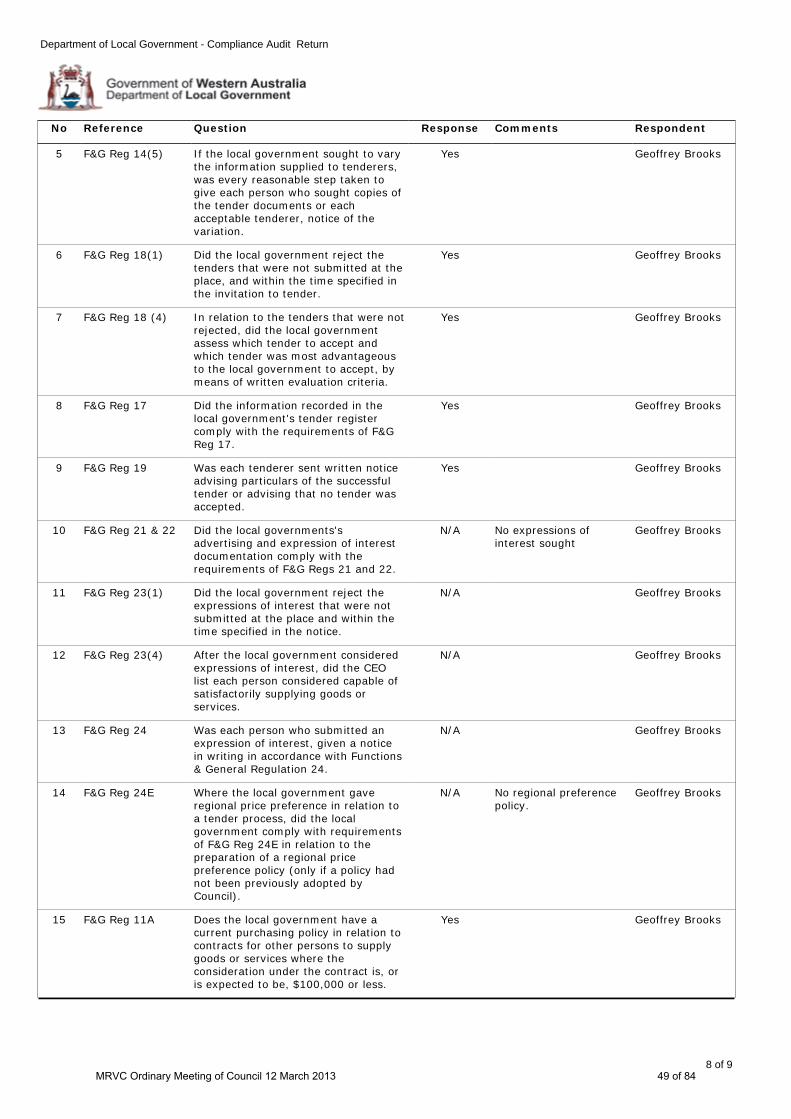
12.7 Compliance Audit Return File: MRVC Officer: Geoff Brooks - CEO Amended By: Nil Disclosure of Interest: Nil Date: 12 March 2013 Application To adopt the Compliance Audit Return for the 2012 calendar year. Background The attached Compliance Audit Return has been completed as required under the Local Government (Audit) Regulations. Comment The Annual Compliance Return must be completed each year and lodged with the Department of Local Government prior to the end March of the following year. Consultation Nil Statutory Environment Local Government (Audit) – Regulations 14 and 15 Policy Implications Nil Financial Implications Nil Strategic Implications Nil Voting Requirements Simple Majority
OFFICER RECOMMENDATION Moved: Seconded: That Council adopts the Compliance Audit Return for the 2012 calendar year. CARRIED/LOST
MRVC Ordinary Meeting of Council 12 March 2013 41 of 84
Department of Local Government - Compliance Audit Return
1 of 9
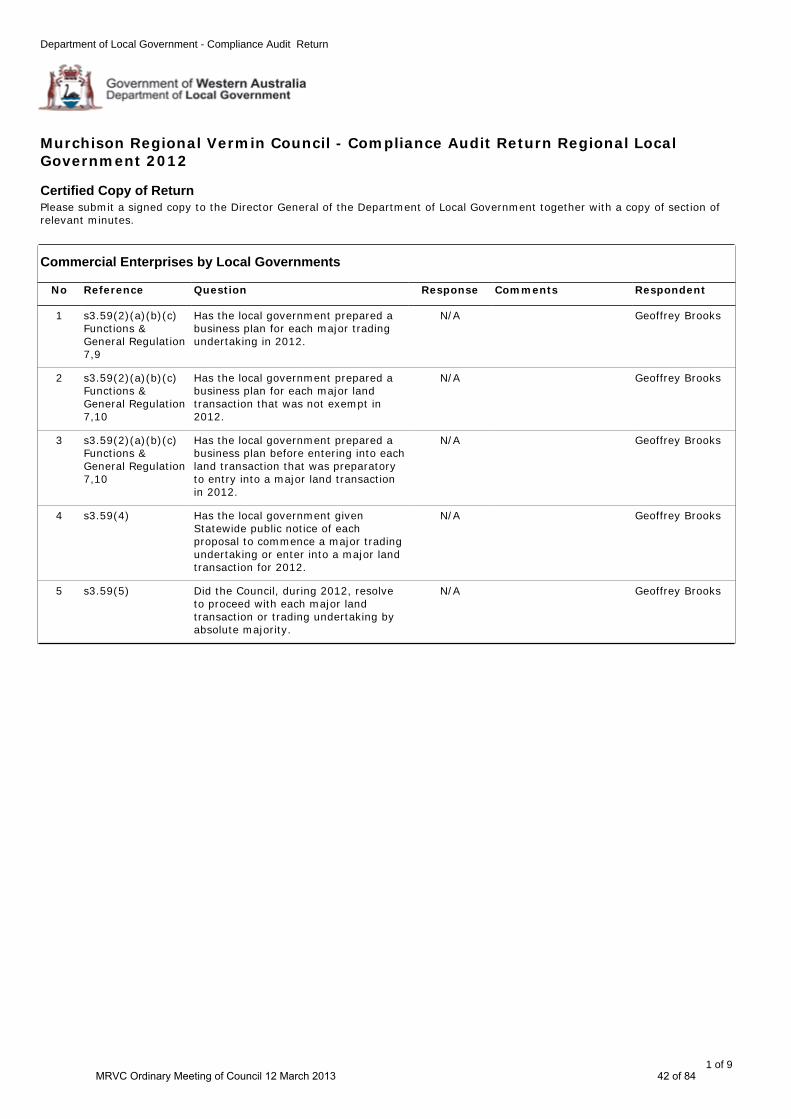
Murchison Regional Vermin Council - Compliance Audit Return Regional Local Government 2012
3 s3.59(2)(a)(b)(c) Functions & General Regulation 7,10
Has the local government prepared a business plan before entering into each land transaction that was preparatory to entry into a major land transaction in 2012.
N/A Geoffrey Brooks
4 s3.59(4) Has the local government given Statewide public notice of each proposal to commence a major trading undertaking or enter into a major land transaction for 2012.
N/A Geoffrey Brooks
5 s3.59(5) Did the Council, during 2012, resolve to proceed with each major land transaction or trading undertaking by absolute majority.
N/A Geoffrey Brooks
1 s3.59(2)(a)(b)(c) Functions & General Regulation 7,9
Has the local government prepared a business plan for each major trading undertaking in 2012.
N/A Geoffrey Brooks
2 s3.59(2)(a)(b)(c) Functions & General Regulation 7,10
Has the local government prepared a business plan for each major land transaction that was not exempt in 2012.
N/A Geoffrey Brooks
No Reference Question Response Comments Respondent
Commercial Enterprises by Local Governments
Certified Copy of ReturnPlease submit a signed copy to the Director General of the Department of Local Government together with a copy of section of relevant minutes.
MRVC Ordinary Meeting of Council 12 March 2013 42 of 84
Department of Local Government - Compliance Audit Return
2 of 9
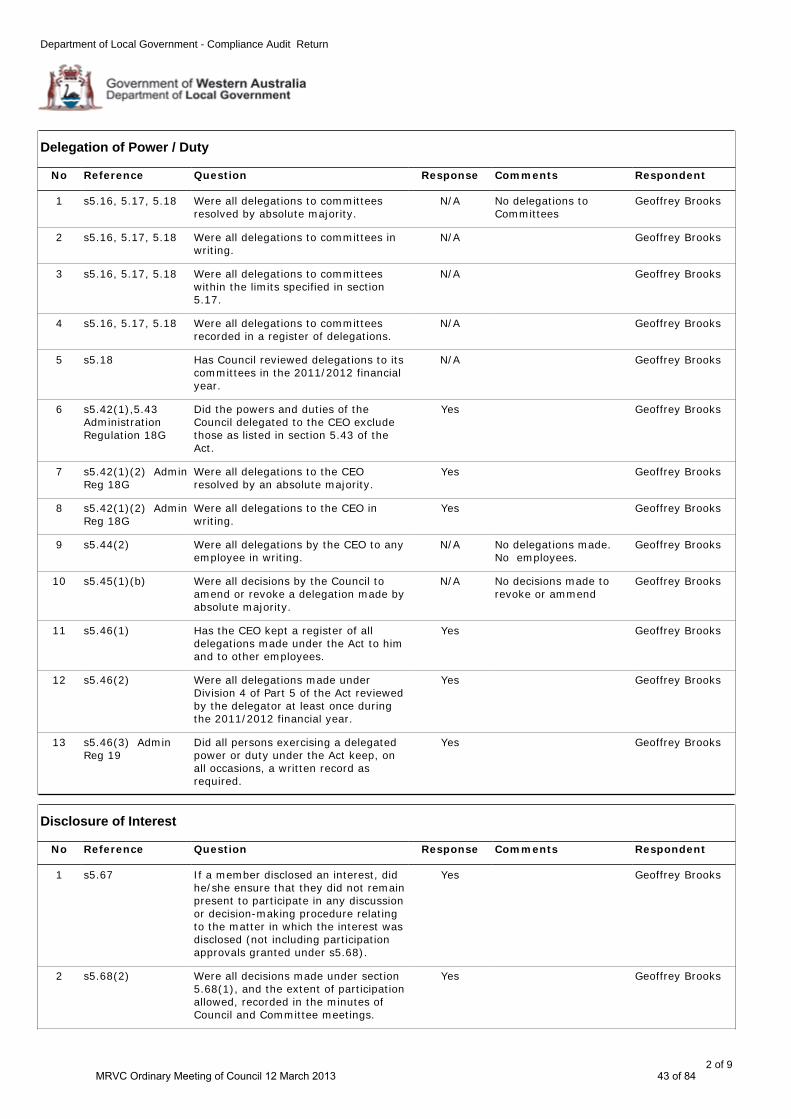
9 s5.44(2) Were all delegations by the CEO to any employee in writing.
N/A No delegations made. No employees.
Geoffrey Brooks
8 s5.42(1)(2) Admin Reg 18G
Were all delegations to the CEO in writing.
Yes Geoffrey Brooks
7 s5.42(1)(2) Admin Reg 18G
Were all delegations to the CEO resolved by an absolute majority.
Yes Geoffrey Brooks
10 s5.45(1)(b) Were all decisions by the Council to amend or revoke a delegation made by absolute majority.
N/A No decisions made to revoke or ammend
Geoffrey Brooks
13 s5.46(3) Admin Reg 19
Did all persons exercising a delegated power or duty under the Act keep, on all occasions, a written record as required.
Yes Geoffrey Brooks
12 s5.46(2) Were all delegations made under Division 4 of Part 5 of the Act reviewed by the delegator at least once during the 2011/2012 financial year.
Yes Geoffrey Brooks
11 s5.46(1) Has the CEO kept a register of all delegations made under the Act to him and to other employees.
Yes Geoffrey Brooks
3 s5.16, 5.17, 5.18 Were all delegations to committees within the limits specified in section 5.17.
N/A Geoffrey Brooks
2 s5.16, 5.17, 5.18 Were all delegations to committees in writing.
N/A Geoffrey Brooks
1 s5.16, 5.17, 5.18 Were all delegations to committees resolved by absolute majority.
N/A No delegations to Committees
Geoffrey Brooks
6 s5.42(1),5.43 Administration Regulation 18G
Did the powers and duties of the Council delegated to the CEO exclude those as listed in section 5.43 of the Act.
Yes Geoffrey Brooks
5 s5.18 Has Council reviewed delegations to its committees in the 2011/2012 financial year.
N/A Geoffrey Brooks
4 s5.16, 5.17, 5.18 Were all delegations to committees recorded in a register of delegations.
N/A Geoffrey Brooks
No Reference Question Response Comments Respondent
Delegation of Power / Duty
2 s5.68(2) Were all decisions made under section 5.68(1), and the extent of participation allowed, recorded in the minutes of Council and Committee meetings.
Yes Geoffrey Brooks
1 s5.67 If a member disclosed an interest, did he/she ensure that they did not remain present to participate in any discussion or decision-making procedure relating to the matter in which the interest was disclosed (not including participation approvals granted under s5.68).
Yes Geoffrey Brooks
No Reference Question Response Comments Respondent
Disclosure of Interest
MRVC Ordinary Meeting of Council 12 March 2013 43 of 84
Department of Local Government - Compliance Audit Return
3 of 9
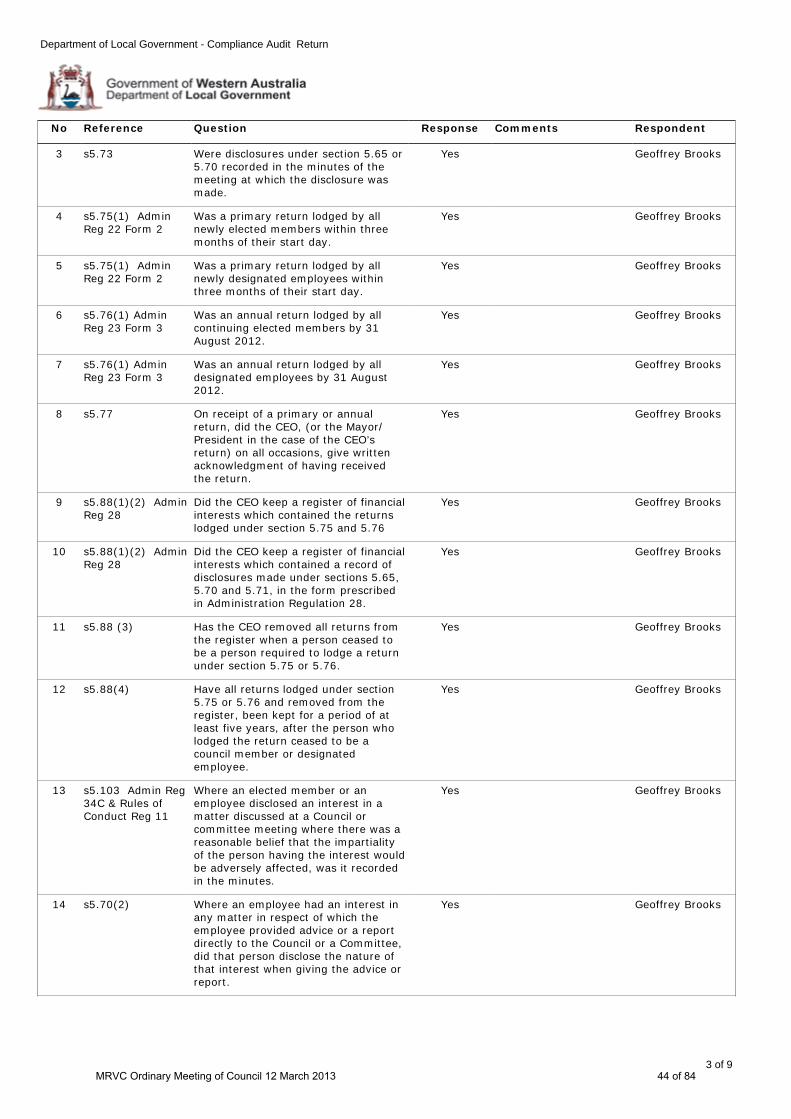
12 s5.88(4) Have all returns lodged under section 5.75 or 5.76 and removed from the register, been kept for a period of at least five years, after the person who lodged the return ceased to be a council member or designated employee.
Yes Geoffrey Brooks
11 s5.88 (3) Has the CEO removed all returns from the register when a person ceased to be a person required to lodge a return under section 5.75 or 5.76.
Yes Geoffrey Brooks
10 s5.88(1)(2) Admin Reg 28
Did the CEO keep a register of financial interests which contained a record of disclosures made under sections 5.65, 5.70 and 5.71, in the form prescribed in Administration Regulation 28.
Yes Geoffrey Brooks
13 s5.103 Admin Reg 34C & Rules of Conduct Reg 11
Where an elected member or an employee disclosed an interest in a matter discussed at a Council or committee meeting where there was a reasonable belief that the impartiality of the person having the interest would be adversely affected, was it recorded in the minutes.
Yes Geoffrey Brooks
14 s5.70(2) Where an employee had an interest in any matter in respect of which the employee provided advice or a report directly to the Council or a Committee, did that person disclose the nature of that interest when giving the advice or report.
Yes Geoffrey Brooks
9 s5.88(1)(2) Admin Reg 28
Did the CEO keep a register of financial interests which contained the returns lodged under section 5.75 and 5.76
Yes Geoffrey Brooks
5 s5.75(1) Admin Reg 22 Form 2
Was a primary return lodged by all newly designated employees within three months of their start day.
Yes Geoffrey Brooks
4 s5.75(1) Admin Reg 22 Form 2
Was a primary return lodged by all newly elected members within three months of their start day.
Yes Geoffrey Brooks
3 s5.73 Were disclosures under section 5.65 or 5.70 recorded in the minutes of the meeting at which the disclosure was made.
Yes Geoffrey Brooks
8 s5.77 On receipt of a primary or annual return, did the CEO, (or the Mayor/ President in the case of the CEO’s return) on all occasions, give written acknowledgment of having received the return.
Yes Geoffrey Brooks
7 s5.76(1) Admin Reg 23 Form 3
Was an annual return lodged by all designated employees by 31 August 2012.
Yes Geoffrey Brooks
6 s5.76(1) Admin Reg 23 Form 3
Was an annual return lodged by all continuing elected members by 31 August 2012.
Yes Geoffrey Brooks
No Reference Question Response Comments Respondent
MRVC Ordinary Meeting of Council 12 March 2013 44 of 84
Department of Local Government - Compliance Audit Return
4 of 9
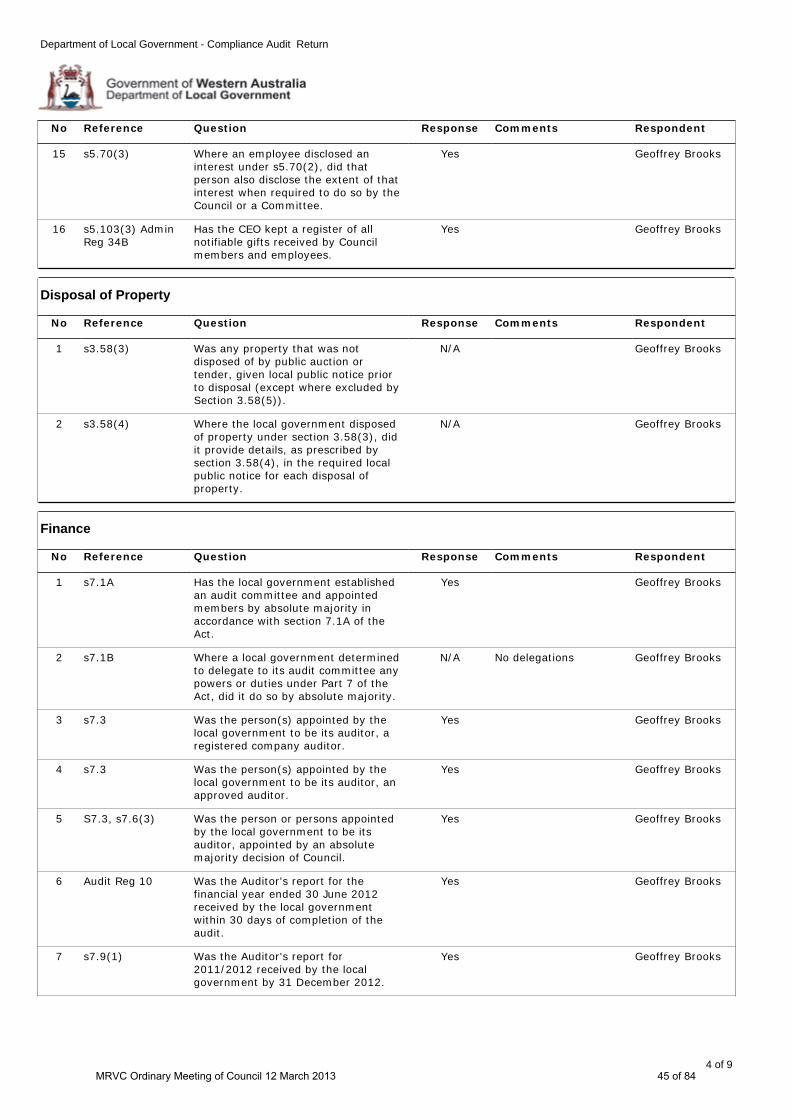
16 s5.103(3) Admin Reg 34B
Has the CEO kept a register of all notifiable gifts received by Council members and employees.
Yes Geoffrey Brooks
15 s5.70(3) Where an employee disclosed an interest under s5.70(2), did that person also disclose the extent of that interest when required to do so by the Council or a Committee.
Yes Geoffrey Brooks
No Reference Question Response Comments Respondent
2 s3.58(4) Where the local government disposed of property under section 3.58(3), did it provide details, as prescribed by section 3.58(4), in the required local public notice for each disposal of property.
N/A Geoffrey Brooks
1 s3.58(3) Was any property that was not disposed of by public auction or tender, given local public notice prior to disposal (except where excluded by Section 3.58(5)).
N/A Geoffrey Brooks
No Reference Question Response Comments Respondent
Disposal of Property
3 s7.3 Was the person(s) appointed by the local government to be its auditor, a registered company auditor.
Yes Geoffrey Brooks
2 s7.1B Where a local government determined to delegate to its audit committee any powers or duties under Part 7 of the Act, did it do so by absolute majority.
N/A No delegations Geoffrey Brooks
1 s7.1A Has the local government established an audit committee and appointed members by absolute majority in accordance with section 7.1A of the Act.
Yes Geoffrey Brooks
4 s7.3 Was the person(s) appointed by the local government to be its auditor, an approved auditor.
Yes Geoffrey Brooks
7 s7.9(1) Was the Auditor's report for 2011/2012 received by the local government by 31 December 2012.
Yes Geoffrey Brooks
6 Audit Reg 10 Was the Auditor's report for the financial year ended 30 June 2012 received by the local government within 30 days of completion of the audit.
Yes Geoffrey Brooks
5 S7.3, s7.6(3) Was the person or persons appointed by the local government to be its auditor, appointed by an absolute majority decision of Council.
Yes Geoffrey Brooks
No Reference Question Response Comments Respondent
Finance
MRVC Ordinary Meeting of Council 12 March 2013 45 of 84
Department of Local Government - Compliance Audit Return
5 of 9
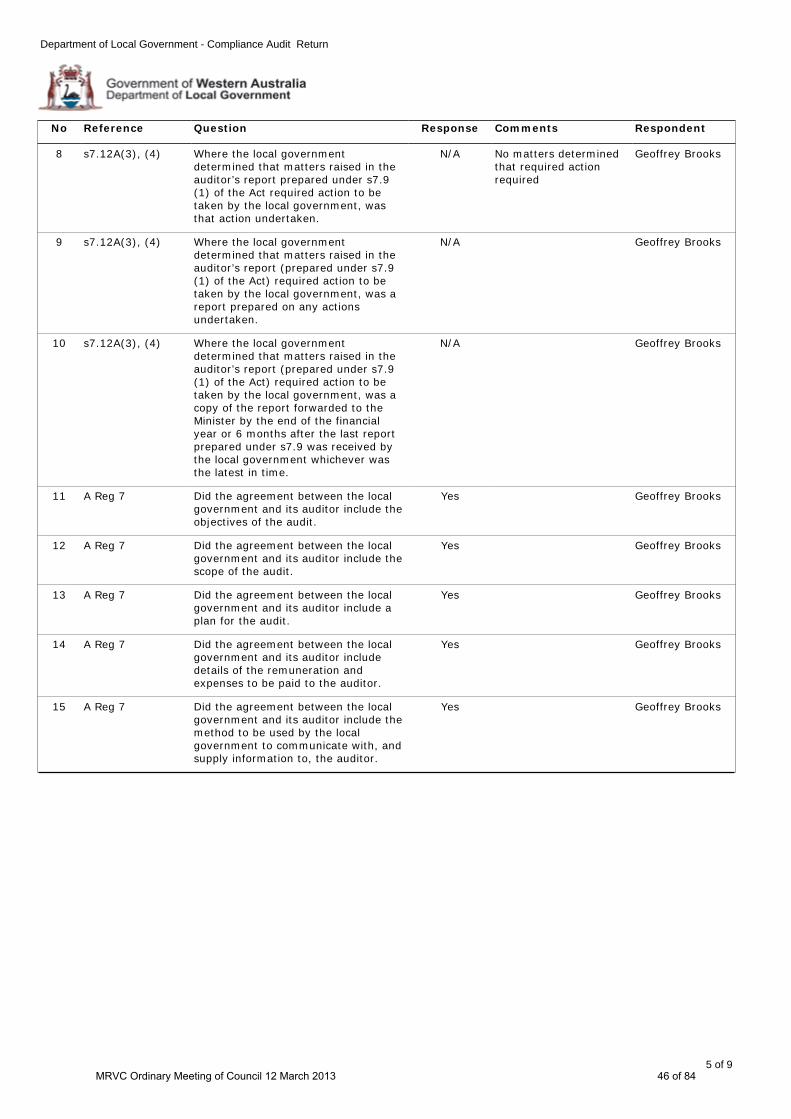
13 A Reg 7 Did the agreement between the local government and its auditor include a plan for the audit.
Yes Geoffrey Brooks
12 A Reg 7 Did the agreement between the local government and its auditor include the scope of the audit.
Yes Geoffrey Brooks
15 A Reg 7 Did the agreement between the local government and its auditor include the method to be used by the local government to communicate with, and supply information to, the auditor.
Yes Geoffrey Brooks
14 A Reg 7 Did the agreement between the local government and its auditor include details of the remuneration and expenses to be paid to the auditor.
Yes Geoffrey Brooks
11 A Reg 7 Did the agreement between the local government and its auditor include the objectives of the audit.
Yes Geoffrey Brooks
8 s7.12A(3), (4) Where the local government determined that matters raised in the auditor’s report prepared under s7.9(1) of the Act required action to be taken by the local government, was that action undertaken.
N/A No matters determined that required action required
Geoffrey Brooks
9 s7.12A(3), (4) Where the local government determined that matters raised in the auditor’s report (prepared under s7.9(1) of the Act) required action to be taken by the local government, was a report prepared on any actions undertaken.
N/A Geoffrey Brooks
10 s7.12A(3), (4) Where the local government determined that matters raised in the auditor’s report (prepared under s7.9(1) of the Act) required action to be taken by the local government, was a copy of the report forwarded to the Minister by the end of the financial year or 6 months after the last report prepared under s7.9 was received by the local government whichever was the latest in time.
N/A Geoffrey Brooks
No Reference Question Response Comments Respondent
MRVC Ordinary Meeting of Council 12 March 2013 46 of 84
Department of Local Government - Compliance Audit Return
6 of 9
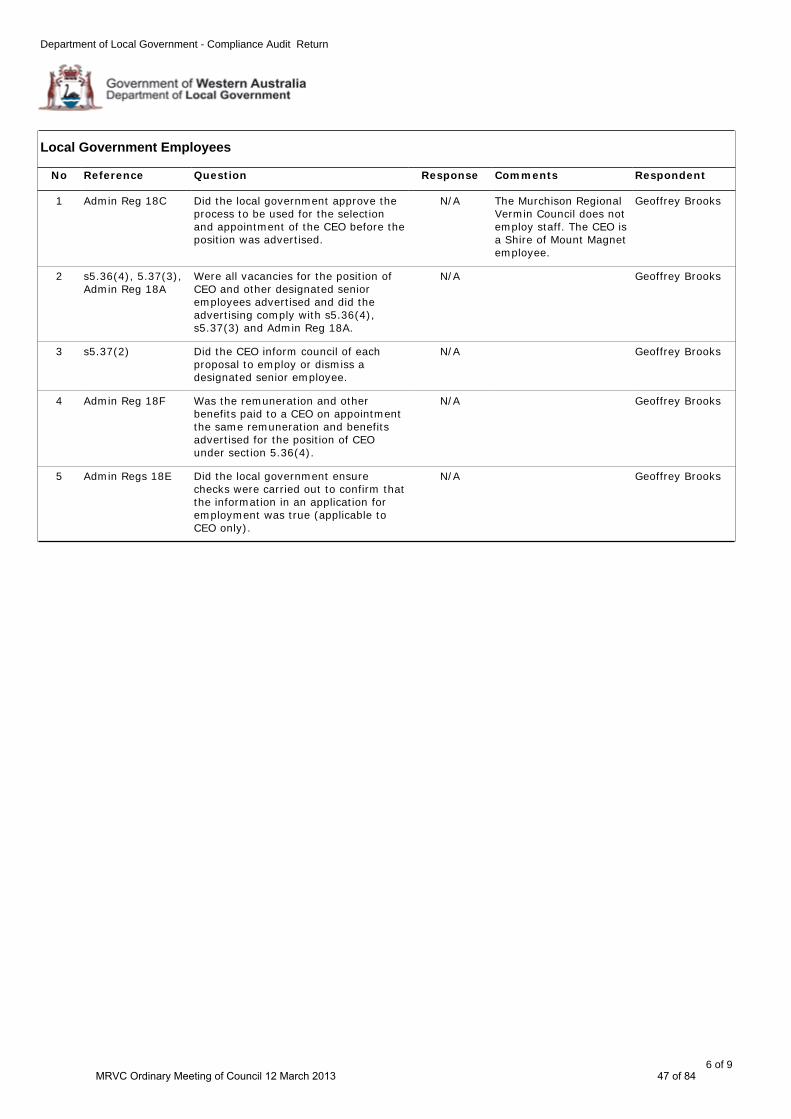
3 s5.37(2) Did the CEO inform council of each proposal to employ or dismiss a designated senior employee.
N/A Geoffrey Brooks
4 Admin Reg 18F Was the remuneration and other benefits paid to a CEO on appointment the same remuneration and benefits advertised for the position of CEO under section 5.36(4).
N/A Geoffrey Brooks
5 Admin Regs 18E Did the local government ensure checks were carried out to confirm that the information in an application for employment was true (applicable to CEO only).
N/A Geoffrey Brooks
1 Admin Reg 18C Did the local government approve the process to be used for the selection and appointment of the CEO before the position was advertised.
N/A The Murchison Regional Vermin Council does not employ staff. The CEO is a Shire of Mount Magnet employee.
Geoffrey Brooks
2 s5.36(4), 5.37(3), Admin Reg 18A
Were all vacancies for the position of CEO and other designated senior employees advertised and did the advertising comply with s5.36(4), s5.37(3) and Admin Reg 18A.
N/A Geoffrey Brooks
No Reference Question Response Comments Respondent
Local Government Employees
MRVC Ordinary Meeting of Council 12 March 2013 47 of 84
Department of Local Government - Compliance Audit Return
7 of 9
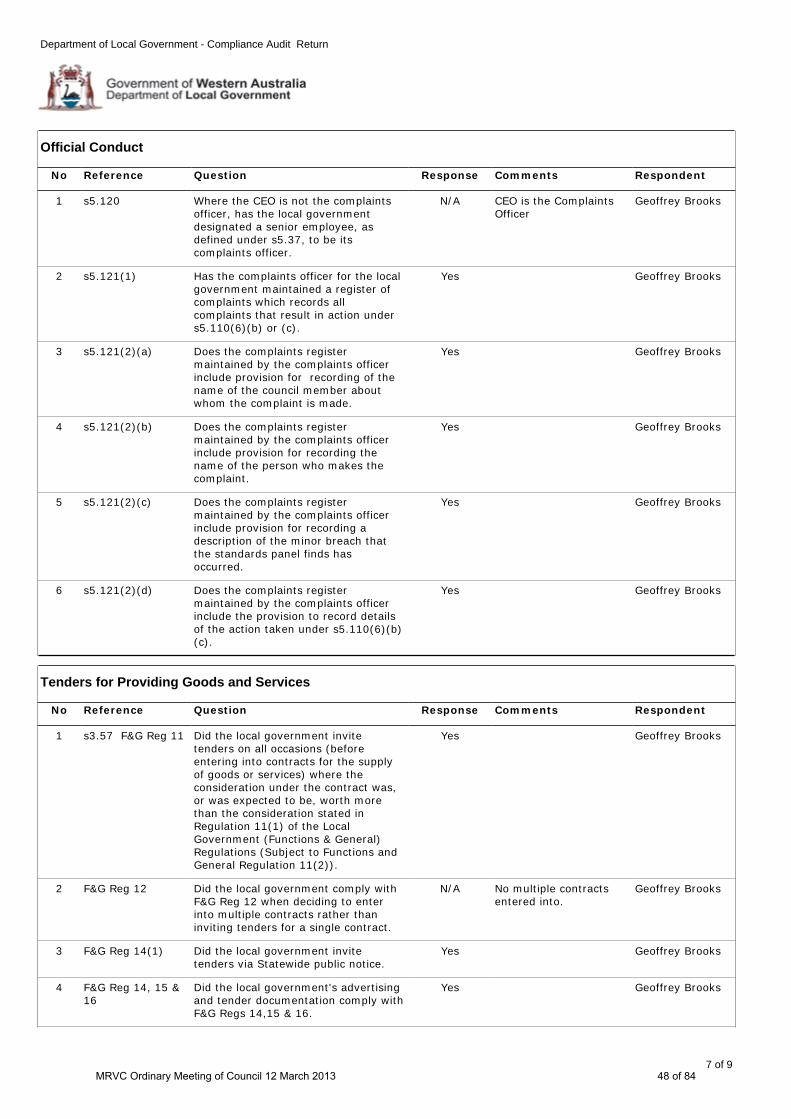
3 F&G Reg 14(1) Did the local government invite tenders via Statewide public notice.
Yes Geoffrey Brooks
2 F&G Reg 12 Did the local government comply with F&G Reg 12 when deciding to enter into multiple contracts rather than inviting tenders for a single contract.
N/A No multiple contracts entered into.
Geoffrey Brooks
1 s3.57 F&G Reg 11 Did the local government invite tenders on all occasions (before entering into contracts for the supply of goods or services) where the consideration under the contract was, or was expected to be, worth more than the consideration stated in Regulation 11(1) of the Local Government (Functions & General) Regulations (Subject to Functions and General Regulation 11(2)).
Yes Geoffrey Brooks
4 F&G Reg 14, 15 & 16
Did the local government's advertising and tender documentation comply with F&G Regs 14,15 & 16.
Yes Geoffrey Brooks
No Reference Question Response Comments Respondent
Tenders for Providing Goods and Services
4 s5.121(2)(b) Does the complaints register maintained by the complaints officer include provision for recording the name of the person who makes the complaint.
Yes Geoffrey Brooks
5 s5.121(2)(c) Does the complaints register maintained by the complaints officer include provision for recording a description of the minor breach that the standards panel finds has occurred.
Yes Geoffrey Brooks
6 s5.121(2)(d) Does the complaints register maintained by the complaints officer include the provision to record details of the action taken under s5.110(6)(b)(c).
Yes Geoffrey Brooks
3 s5.121(2)(a) Does the complaints register maintained by the complaints officer include provision for recording of the name of the council member about whom the complaint is made.
Yes Geoffrey Brooks
1 s5.120 Where the CEO is not the complaints officer, has the local government designated a senior employee, as defined under s5.37, to be its complaints officer.
N/A CEO is the Complaints Officer
Geoffrey Brooks
2 s5.121(1) Has the complaints officer for the local government maintained a register of complaints which records all complaints that result in action under s5.110(6)(b) or (c).
Yes Geoffrey Brooks
No Reference Question Response Comments Respondent
Official Conduct
MRVC Ordinary Meeting of Council 12 March 2013 48 of 84
Department of Local Government - Compliance Audit Return
8 of 9
12 F&G Reg 23(4) After the local government considered expressions of interest, did the CEO list each person considered capable of satisfactorily supplying goods or services.
N/A Geoffrey Brooks
11 F&G Reg 23(1) Did the local government reject the expressions of interest that were not submitted at the place and within the time specified in the notice.
N/A Geoffrey Brooks
10 F&G Reg 21 & 22 Did the local governments's advertising and expression of interest documentation comply with the requirements of F&G Regs 21 and 22.
N/A No expressions of interest sought
Geoffrey Brooks
15 F&G Reg 11A Does the local government have a current purchasing policy in relation to contracts for other persons to supply goods or services where the consideration under the contract is, or is expected to be, $100,000 or less.
Yes Geoffrey Brooks
14 F&G Reg 24E Where the local government gave regional price preference in relation to a tender process, did the local government comply with requirements of F&G Reg 24E in relation to the preparation of a regional price preference policy (only if a policy had not been previously adopted by Council).
N/A No regional preference policy.
Geoffrey Brooks
13 F&G Reg 24 Was each person who submitted an expression of interest, given a notice in writing in accordance with Functions & General Regulation 24.
N/A Geoffrey Brooks
6 F&G Reg 18(1) Did the local government reject the tenders that were not submitted at the place, and within the time specified in the invitation to tender.
Yes Geoffrey Brooks
5 F&G Reg 14(5) If the local government sought to vary the information supplied to tenderers, was every reasonable step taken to give each person who sought copies of the tender documents or each acceptable tenderer, notice of the variation.
Yes Geoffrey Brooks
7 F&G Reg 18 (4) In relation to the tenders that were not rejected, did the local government assess which tender to accept and which tender was most advantageous to the local government to accept, by means of written evaluation criteria.
Yes Geoffrey Brooks
9 F&G Reg 19 Was each tenderer sent written notice advising particulars of the successful tender or advising that no tender was accepted.
Yes Geoffrey Brooks
8 F&G Reg 17 Did the information recorded in the local government's tender register comply with the requirements of F&G Reg 17.
Yes Geoffrey Brooks
No Reference Question Response Comments Respondent
MRVC Ordinary Meeting of Council 12 March 2013 49 of 84
Department of Local Government - Compliance Audit Return
9 of 9
I certify this Compliance Audit return has been adopted by Council at its meeting on
Signed Mayor / President, Murchison Regional Vermin Council
Signed CEO, Murchison Regional Vermin Council
MRVC Ordinary Meeting of Council 12 March 2013 50 of 84

12.8 Tender MRVC09 – Removal and Replacement of 41.0 kilometres of the No.2 Vermin (Dog) Fence.
File: MRVC Officer: Geoff Brooks - CEO Amended By: Nil Disclosure of Interest: Nil Meeting/Date: Ordinary Meeting – 12 March 2013 Application To consider tenders for the removal and replacement of 41.0 kilometres of the No 1 Vermin (Dog) Fence. Background On 26 January 2013 tenders were advertised in the Western Australian for removal and replacement of 41.0 kilometres of the No 2 Vermin (Dog) Fence. The following two sections were specified: • Section 1 - Eastern End - 18 kilometres • Section 2 - Western End - 23 kilometres Conditions of tender included supply of fencing materials by the MRVC and a completion date of 31 May 2013 or as negotiated with the Project Officer. At the time of closing on 15 February 2013 the following tenders were received:
TENDERER Price (excluding GST) $ J S B Fencing - Bullsbrook $322,260.00 D B S Fencing - Wangara $295,125.00 H & J Jones & Sons – Mount Magnet $149,700.00
Tender Selection Criteria As indicated in the tender documents the following selection criteria applies: • Best value for money • Compliance Criteria – compliance with conditions of tender, specifications and
delivery date. • Qualitative Criteria – relevant experience (30%), key personnel skills and experience
(15%), tenderers resources (35%), and demonstrated understanding (20%). Assessment of Tenders Opening and assessment of the tenders has been conducted by the Project Officer Jorgen Jensen and CEO Geoff Brooks. As indicated the lowest tender price was submitted by H & J Jones & Sons for an amount of $149,700.00 excluding GST or $3,651.22 per kilometre. Reduced Length On the basis of expenditure to date and after allowing for purchase of fencing materials (20 km) required for this tender, freight, supervision and contingency it is estimated that some $117,000 is available for MRVC09. This equates to a reduced length of 33 km which, as the tender specifically allows for variation in total quantity, has been agreed to by the contractor H & J Jones & Sons. This estimate of 33 kilometres is considered to be conservative and once issues such contingency requirements are known it is expected that construction of additional fencing may be achievable.
MRVC Ordinary Meeting of Council 12 March 2013 51 of 84
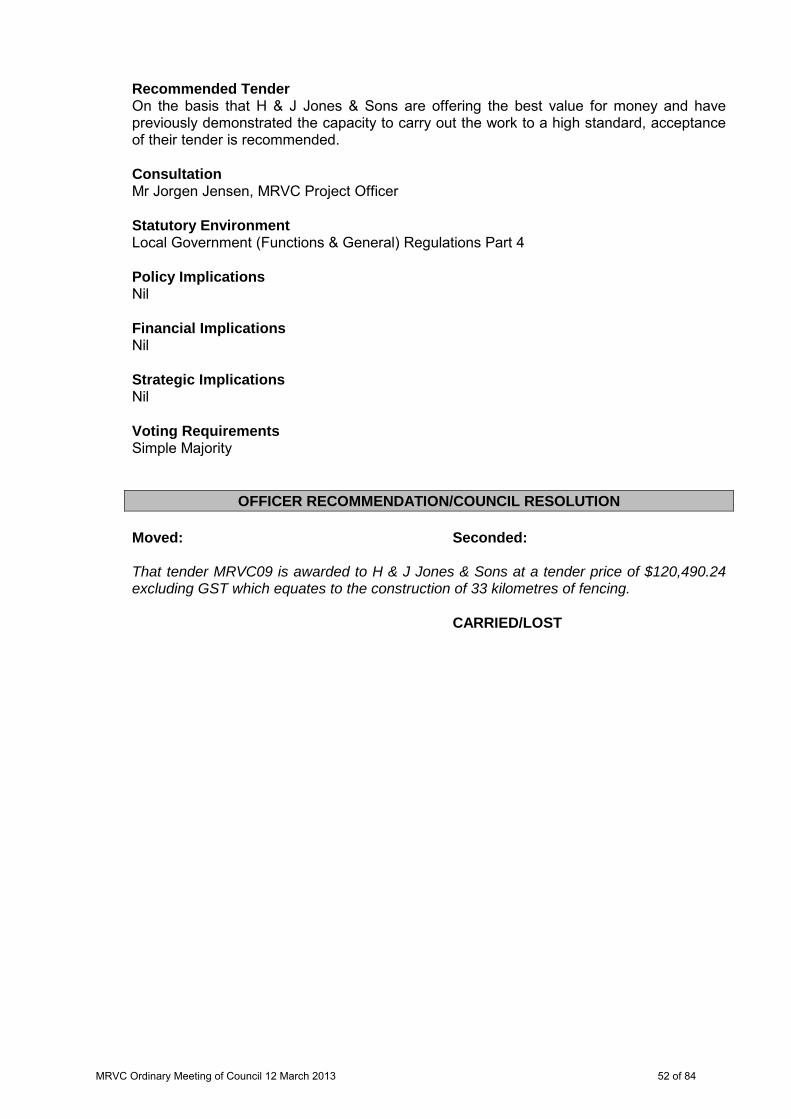
Recommended Tender On the basis that H & J Jones & Sons are offering the best value for money and have previously demonstrated the capacity to carry out the work to a high standard, acceptance of their tender is recommended. Consultation Mr Jorgen Jensen, MRVC Project Officer Statutory Environment Local Government (Functions & General) Regulations Part 4 Policy Implications Nil Financial Implications Nil Strategic Implications Nil Voting Requirements Simple Majority
OFFICER RECOMMENDATION/COUNCIL RESOLUTION Moved: Seconded: That tender MRVC09 is awarded to H & J Jones & Sons at a tender price of $120,490.24 excluding GST which equates to the construction of 33 kilometres of fencing. CARRIED/LOST
MRVC Ordinary Meeting of Council 12 March 2013 52 of 84

12.9 Strategic Community Plan File: MRVC Officer: Geoff Brooks – CEO Amended by: Nil Disclosure of Interest: Nil Meeting Date: 12 March 2013 Application To consider and note the Draft ten year Strategic Community Plan. Background Under the Integrated Planning and Reporting Framework it is expected that local governments will meet new Plan for the Future requirements by 30 June 2013. As councillors are aware a major component of Plan for the Future requirements under Section 55.56 of the Local Government Act is the Strategic Community Plan. The attached draft Strategic Community Plan has been prepared for consideration of Council. Current Position It is proposed to advertise the Draft Strategic Community Plan for public comment once the Draft Corporate Business and Four Year Budget are finalised and also ready for advertising. Consultation Nil Statutory Environment Section 5.56 – Local Government Act 1995 Regulations 19BA to 19D Local Government (Administration) Regulations 1996 Policy Implications Nil Financial Implications Nil Strategic Implications Nil Voting Requirements Simple Majority
OFFICER RECOMMENDATION Moved: Seconded: That Councillors note the Draft Strategic Community Plan and proposal to seek public comment. CARRIED/LOST
MRVC Ordinary Meeting of Council 12 March 2013 53 of 84
STRATEGIC COMMUNITY PLAN
2012-2022
WRITTEN SUBMISSIONS INVITED CLOSING DATE 29 MARCH 2012
MRVC Ordinary Meeting of Council 12 March 2013 54 of 84
TABLE OF CONTENTS
1. INTRODUCTION ........................................................................................................... 3
1.1 Community Engagement Strategy ................................................................................. 3 1.2 General Information ....................................................................................................... 3
2. VISION .......................................................................................................................... 5
3. MISSION ....................................................................................................................... 5
4. VALUES ........................................................................................................................ 5
4.1 Service .......................................................................................................................... 5 4.2 Responsiveness ............................................................................................................ 5 4.3 Responsibility ................................................................................................................ 5 4.4 Equity ............................................................................................................................ 5 4.5 Accountability ................................................................................................................ 5
5. GOALS .......................................................................................................................... 6
5.1 Infrastructure – No 1 and No 2 Vermin Fences .............................................................. 6 5.2 Environment .................................................................................................................. 6 5.3 Governance ................................................................................................................... 6
6. PRINCIPAL ACTIVITIES ............................................................................................... 7
6.1 General Public Services & Governance – Provided by the Shire of Mount Magnet........ 7 6.2 Law, Order & Public Safety ........................................................................................... 7 6.3 Environment and Health ................................................................................................ 7 6.6 Property and Services ................................................................................................... 7
7. ARRANGEMENTS FOR MONITORING AND UPDATING ........................................... 7
MRVC Ordinary Meeting of Council 12 March 2013 55 of 84
1. INTRODUCTION
This plan is prepared as required under Section 5.56 of the Local Government Act 1995 and
in accordance with the Integrated Planning and Reporting Guidelines prepared by the
Department of Local Government. Key objectives of this Strategic Community Plan are, on
the basis of a ten year outlook, to identify for the Shire of Mount Magnet:
• Vision and Mission
• Statement of Values
• Goals
Infrastructure
Community Development
Environment
Economic Development
Governance
• Principal Activities
• Arrangements for Monitoring and Updating
1.1 Community Engagement Strategy
Following adoption by Council of this Draft Community Strategic Plan it is proposed to invite
written submissions from pastoralists and others affected by the No1 and No2 Vermin
Fences. Submissions will be sought by way of advertising in the West Australian and
Geraldton Guardian.
1.2 General Information
Administration Office Shire of Mount Magnet Telephone: 08 9963 3000
PO Box 62 Facsimile: 08 9963 4133
Lot 163 Hepburn Street Email: [email protected]
MOUNT MAGNET WA 6638 Website: www.mtmagnet.wa.gov.au
MRVC Ordinary Meeting of Council 12 March 2013 56 of 84
Other
The Murchison Regional Vermin Council (MRVC) is a statutory organisation which operates
under the provisions of the Local Government Act 1995. The MRVC was established in 1963
for the purpose of rehabilitation and maintenance of the No.1 Vermin Fence.
The No.1 Vermin Fence was completed in 1907 and at the time was the longest unbroken
line of vermin fence in the world. The No.1 Fence runs from Starvation Boat Harbour on the
South Coast of Western Australia to a point near Cape Keraudren on the North West Coast.
The fence was built in an endeavour to stem the rabbit hordes from eating their way west
across from the other side of Australia. Today the fence remains as an important barrier for
the pastoralists in the region.
Collaborating Councils: Shires of Cue, Sandstone, Meekatharra, Yalgoo and
Mount Magnet.
Fence Area: From the 80 mile peg in the South (Lake Moore), to the
426 mile peg in the North Wiluna/Neds Creek Road.
Members: Two (2) delegates from each of the five (5) councils; total
number of members ten (10).
DELEGATES
President Murray McQuie Shire of Sandstone
Delegates Carol Hodshon Shire of Sandstone
Greg Scott Shire of Mount Magnet
Jorgen Jensen Shire of Mount Magnet
Terry Iturbide Shire of Yalgoo
Laurence Hodder Shire of Yalgoo
Michael Clinch Shire of Cue
Martin King Shire of Cue
Harvey Nichols Shire of Meekatharra
Operating Revenue: $62,000
Number of Employees: Nil
MRVC Ordinary Meeting of Council 12 March 2013 57 of 84
2. VISION
For the No 1 and No 2 Vermin Fence to form an effective barrier to the movement of wild
dogs.
3. MISSION
To maintain and upgrade the No1 and No 2 Vermin Fences on a sustainable basis.
4. VALUES
4.1 Service
Council will strive to achieve excellence, quality and pride of service in a cost effective,
commonsense and courteous way.
4.2 Responsiveness
Council will be responsive to the needs of pastoralists and other affected by the No 1 and No
2 Vermin Fences.
4.3 Responsibility
Council will act with integrity and in a financially responsible, sustainable manner.
4.4 Equity
Council will manage and maintain the No 1 and No 2 Vermin Fences in an equitable manner.
4.5 Accountability
Council will make decisions in an open and accountable way.
MRVC Ordinary Meeting of Council 12 March 2013 58 of 84

5. GOALS
The following goals were identified by delegates appointed by member Councils:
5.1 Infrastructure – No 1 and No 2 Vermin Fences
To ensure that Council has well planned, constructed and maintained infrastructure that is
managed on a sustainable basis and meets present and future needs.
5.2 Environment
To protect the environment through which the No 1 and No 2 Vermin Fences and access
roads travel by minimising the impact of erosion and controlling vehicle access.
5.3 Governance
To ensure that Council demonstrates effective, open and responsible governance.
MRVC Ordinary Meeting of Council 12 March 2013 59 of 84
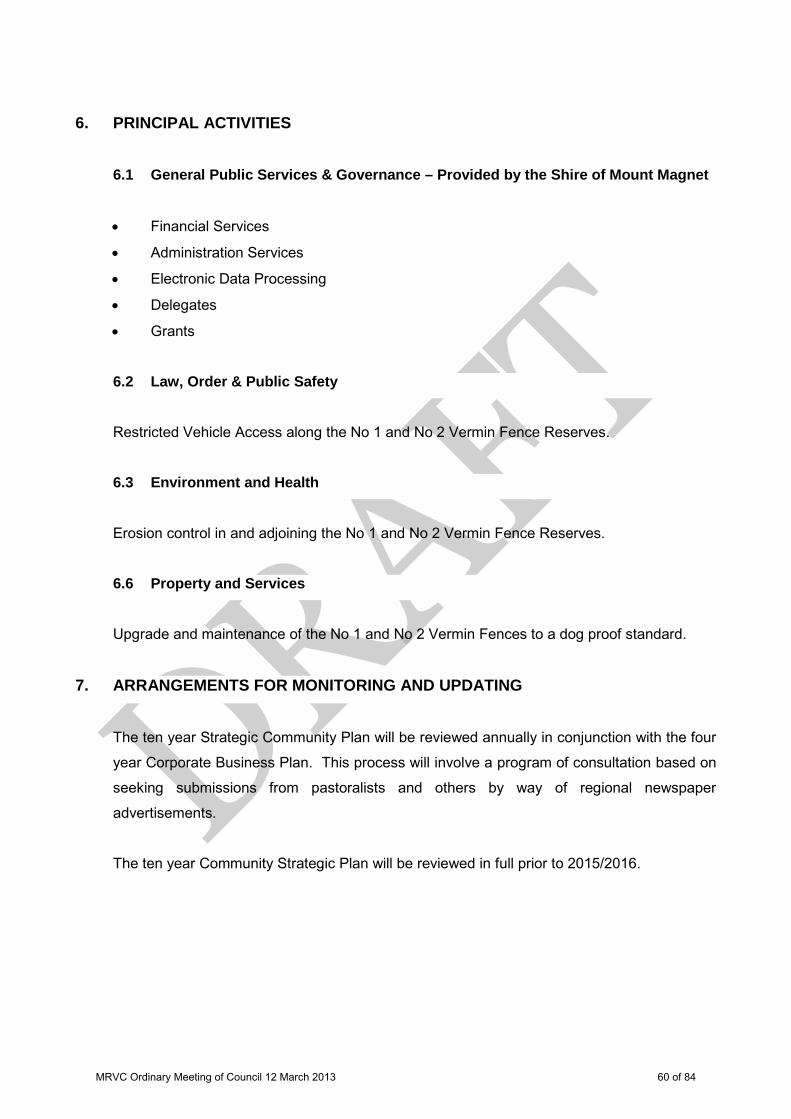
6. PRINCIPAL ACTIVITIES
6.1 General Public Services & Governance – Provided by the Shire of Mount Magnet
• Financial Services
• Administration Services
• Electronic Data Processing
• Delegates
• Grants
6.2 Law, Order & Public Safety
Restricted Vehicle Access along the No 1 and No 2 Vermin Fence Reserves.
6.3 Environment and Health
Erosion control in and adjoining the No 1 and No 2 Vermin Fence Reserves.
6.6 Property and Services
Upgrade and maintenance of the No 1 and No 2 Vermin Fences to a dog proof standard.
7. ARRANGEMENTS FOR MONITORING AND UPDATING
The ten year Strategic Community Plan will be reviewed annually in conjunction with the four
year Corporate Business Plan. This process will involve a program of consultation based on
seeking submissions from pastoralists and others by way of regional newspaper
advertisements.
The ten year Community Strategic Plan will be reviewed in full prior to 2015/2016.
MRVC Ordinary Meeting of Council 12 March 2013 60 of 84

TEN YEAR BUDGET
2013-2023
MRVC Ordinary Meeting of Council 12 March 2013 61 of 84
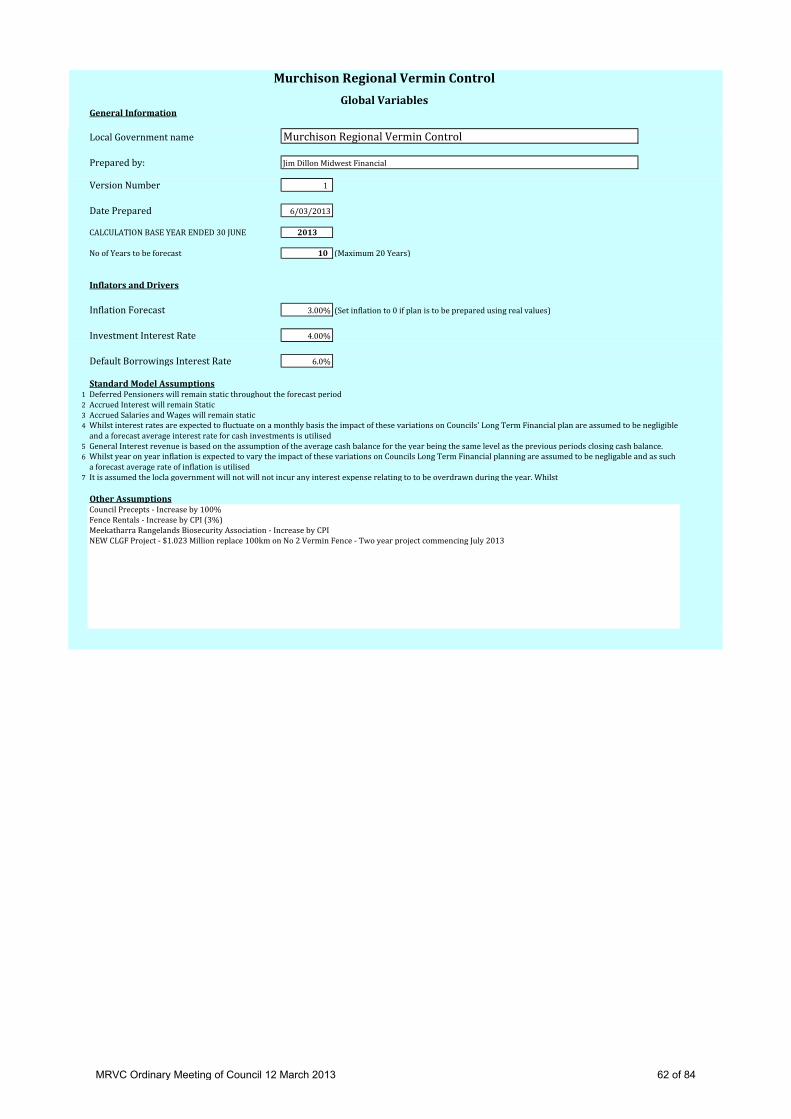
General Information
Local Government name
Prepared by:
Version Number 1
Date Prepared 6/03/2013
CALCULATION BASE YEAR ENDED 30 JUNE 2013
No of Years to be forecast 10 (Maximum 20 Years)
Inflators and Drivers
Inflation Forecast 3.00% (Set inflation to 0 if plan is to be prepared using real values)
Investment Interest Rate 4.00%
Default Borrowings Interest Rate 6.0%
Standard Model Assumptions1 Deferred Pensioners will remain static throughout the forecast period2 Accrued Interest will remain Static3 Accrued Salaries and Wages will remain static4
5 General Interest revenue is based on the assumption of the average cash balance for the year being the same level as the previous periods closing cash balance. 6
7 It is assumed the locla government will not will not incur any interest expense relating to to be overdrawn during the year. Whilst
Other Assumptions
Murchison Regional Vermin ControlGlobal Variables
Whilst interest rates are expected to fluctuate on a monthly basis the impact of these variations on Councils' Long Term Financial plan are assumed to be negligible and a forecast average interest rate for cash investments is utilised
Whilst year on year inflation is expected to vary the impact of these variations on Councils Long Term Financial planning are assumed to be negligable and as such a forecast average rate of inflation is utilised
Murchison Regional Vermin Control
Jim Dillon Midwest Financial
Council Precepts - Increase by 100%Fence Rentals - Increase by CPI (3%)Meekatharra Rangelands Biosecurity Association - Increase by CPINEW CLGF Project - $1.023 Million replace 100km on No 2 Vermin Fence - Two year project commencing July 2013
MRVC Ordinary Meeting of Council 12 March 2013 62 of 84
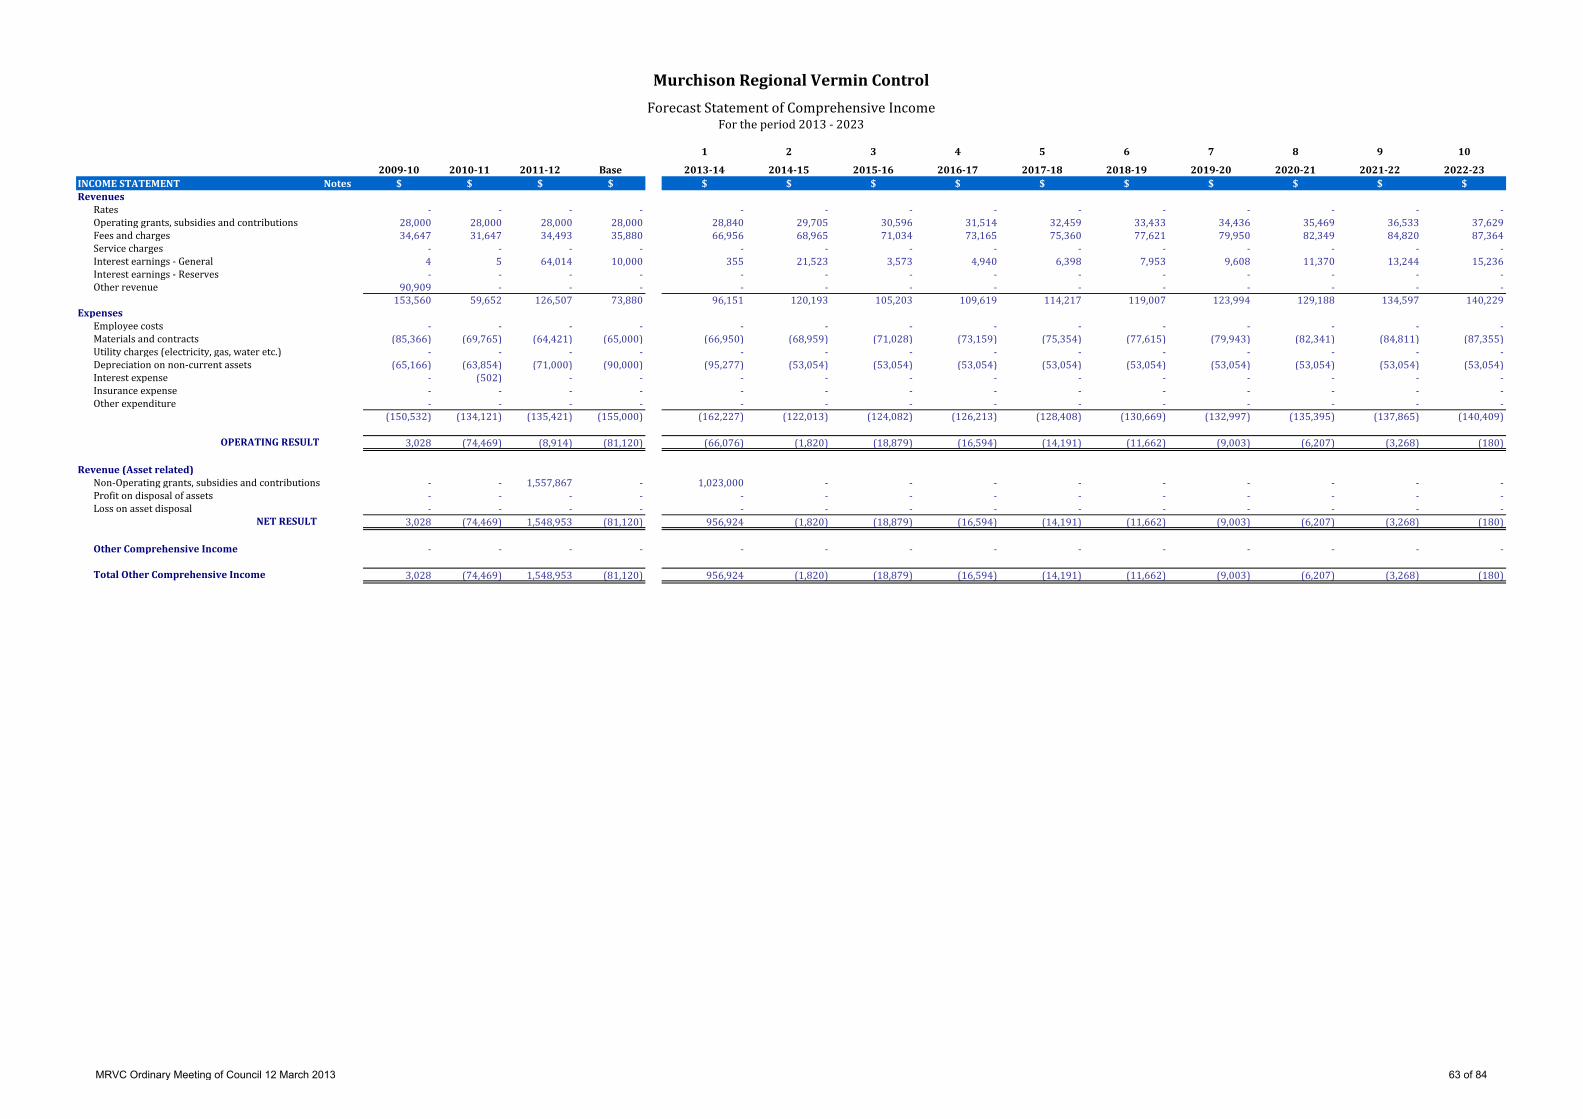
1 2 3 4 5 6 7 8 9 10
2009-10 2010-11 2011-12 Base 2013-14 2014-15 2015-16 2016-17 2017-18 2018-19 2019-20 2020-21 2021-22 2022-23INCOME STATEMENT Notes $ $ $ $ $ $ $ $ $ $ $ $ $ $Revenues
Rates - - - - - - - - - - - - - -Operating grants, subsidies and contributions 28,000 28,000 28,000 28,000 28,840 29,705 30,596 31,514 32,459 33,433 34,436 35,469 36,533 37,629Fees and charges 34,647 31,647 34,493 35,880 66,956 68,965 71,034 73,165 75,360 77,621 79,950 82,349 84,820 87,364Service charges - - - - - - - - - - - - - -Interest earnings - General 4 5 64,014 10,000 355 21,523 3,573 4,940 6,398 7,953 9,608 11,370 13,244 15,236Interest earnings - Reserves - - - - - - - - - - - - - -Other revenue 90,909 - - - - - - - - - - - - -
153,560 59,652 126,507 73,880 96,151 120,193 105,203 109,619 114,217 119,007 123,994 129,188 134,597 140,229Expenses
Employee costs - - - - - - - - - - - - - -Materials and contracts (85,366) (69,765) (64,421) (65,000) (66,950) (68,959) (71,028) (73,159) (75,354) (77,615) (79,943) (82,341) (84,811) (87,355)Utility charges (electricity, gas, water etc.) - - - - - - - - - - - - - -Depreciation on non-current assets (65,166) (63,854) (71,000) (90,000) (95,277) (53,054) (53,054) (53,054) (53,054) (53,054) (53,054) (53,054) (53,054) (53,054)Interest expense - (502) - - - - - - - - - - - -Insurance expense - - - - - - - - - - - - - -Other expenditure - - - - - - - - - - - - - -
(150,532) (134,121) (135,421) (155,000) (162,227) (122,013) (124,082) (126,213) (128,408) (130,669) (132,997) (135,395) (137,865) (140,409)
OPERATING RESULT 3,028 (74,469) (8,914) (81,120) (66,076) (1,820) (18,879) (16,594) (14,191) (11,662) (9,003) (6,207) (3,268) (180)
Revenue (Asset related)Non-Operating grants, subsidies and contributions - - 1,557,867 - 1,023,000 - - - - - - - - -Profit on disposal of assets - - - - - - - - - - - - - -Loss on asset disposal - - - - - - - - - - - - - -
NET RESULT 3,028 (74,469) 1,548,953 (81,120) 956,924 (1,820) (18,879) (16,594) (14,191) (11,662) (9,003) (6,207) (3,268) (180)
Other Comprehensive Income - - - - - - - - - - - - - -
Total Other Comprehensive Income 3,028 (74,469) 1,548,953 (81,120) 956,924 (1,820) (18,879) (16,594) (14,191) (11,662) (9,003) (6,207) (3,268) (180)
Murchison Regional Vermin ControlForecast Statement of Comprehensive Income
For the period 2013 - 2023
MRVC Ordinary Meeting of Council 12 March 2013 63 of 84

1 2 3 4 5 6 7 8 9 10BALANCE SHEET 2009-10 2010-11 2011-12 Base 2013-14 2014-15 2015-16 2016-17 2017-18 2018-19 2019-20 2020-21 2021-22 2022-23CURRENT ASSETS $ $ $ $ $ $ $ $ $ $ $ $ $ $
Unrestricted Cash and Equivalents 3,060 2,120 760,520 8,880 538,081 89,315 123,490 159,950 198,813 240,205 284,256 331,103 380,889 433,763Restricted Cash and Cash Equivalent - - - - - - - - - - - - - -Non-Cash Investments - - - - - - - - - - - - - -Trade and Other Receivables 14,320 1,699 73,437 - - - - - - - - - - -Inventories 5,076 2,156 541,859 - - - - - - - - - - -
TOTAL CURRENT ASSETS 22,456 5,975 1,375,816 8,880 538,081 89,315 123,490 159,950 198,813 240,205 284,256 331,103 380,889 433,763
NON-CURRENT ASSETSOther Receivables - - - - - - - - - - - - - -Inventories - - - - - - - - - - - - - -Property Plant and Equipment 1,306 - - - - - - - - - - - - -Infrastructure 174,635 112,087 366,684 2,435,594 2,083,317 2,530,263 2,477,209 2,424,155 2,371,101 2,318,047 2,264,993 2,211,939 2,158,885 2,105,831
TOTAL NON-CURRENT ASSETS 175,941 112,087 366,684 2,435,594 2,083,317 2,530,263 2,477,209 2,424,155 2,371,101 2,318,047 2,264,993 2,211,939 2,158,885 2,105,831
TOTAL ASSETS 198,397 118,062 1,742,500 2,444,474 2,621,398 2,619,578 2,600,699 2,584,105 2,569,914 2,558,252 2,549,249 2,543,042 2,539,774 2,539,594
CURRENT LIABILITIESTrade and Other Payables 18,592 12,726 73,081 - - - - - - - - - - -Current Portion of Long-term Liabilities - - - - - - - - - - - - - -Provisions - - - - - - - - - - - - - -
TOTAL CURRENT LIABILITIES 18,592 12,726 73,081 - - - - - - - - - - -
NON-CURRENT LIABILITIESLong-term Borrowings - - - - - - - - - - - - - -Provisions - - - - - - - - - - - - - -
TOTAL NON-CURRENT LIABILITIES - - - - - - - - - - - - - -
TOTAL LIABILITIES 18,592 12,726 73,081 - - - - - - - - - - -
NET ASSETS 179,805 105,336 1,669,419 2,444,474 2,621,398 2,619,578 2,600,699 2,584,105 2,569,914 2,558,252 2,549,249 2,543,042 2,539,774 2,539,594
EQUITYRetained Surplus 179,805 105,336 1,669,419 264,289 1,221,213 1,219,393 1,200,514 1,183,920 1,169,729 1,158,067 1,149,064 1,142,857 1,139,589 1,139,409Reserves - Cash Backed - - - - - - - - - - - - - -Reserves - Revaluation - - - - - - - - - - - - - -
TOTAL EQUITY 179,805 105,336 1,669,419 264,289 1,221,213 1,219,393 1,200,514 1,183,920 1,169,729 1,158,067 1,149,064 1,142,857 1,139,589 1,139,409
Murchison Regional Vermin ControlForecast Statement of Financial Position
For the period 2013 - 2023
MRVC Ordinary Meeting of Council 12 March 2013 64 of 84

1 2 3 4 5 6 7 8 9 102009-10 2010-11 2011-12 Base 2013-14 2014-15 2015-16 2016-17 2017-18 2018-19 2019-20 2020-21 2021-22 2022-23
RETAINED SURPLUS $ $ $ $ $ $ $ $ $ $ $ $ $ $Opening Balance 176,777 179,805 105,336 345,409 264,289 1,221,213 1,219,393 1,200,514 1,183,920 1,169,729 1,158,067 1,149,064 1,142,857 1,139,589Net Result 3,028 (74,469) 1,548,953 (81,120) 956,924 (1,820) (18,879) (16,594) (14,191) (11,662) (9,003) (6,207) (3,268) (180)Total Other Comprehensive Income - - - - - - - - - - - - - -Amount transferred (to)/from Reserves - - - - - - - - - - - - -Closing Balance 179,805 105,336 1,654,289 264,289 1,221,213 1,219,393 1,200,514 1,183,920 1,169,729 1,158,067 1,149,064 1,142,857 1,139,589 1,139,409
RESERVES - CASH/INVESTMENT BACKEDOpening Balance - - - - - - - - - - - - - -Amount transferred to/(from) Retained Surplus - - - - - - - - - - - - - -Closing Balance - - - - - - - - - - - - - -
Asset Revaluation ReservesOpening Balance - - - - - - - - - - - - - -Total Other Comprehensive Income - - - - - - - - - - - - - -Closing Balance - - - - - - - - - - - - - -
TOTAL EQUITY 179,805 105,336 1,654,289 264,289 1,221,213 1,219,393 1,200,514 1,183,920 1,169,729 1,158,067 1,149,064 1,142,857 1,139,589 1,139,409
Murchison Regional Vermin ControlForecast Statement of Changes in Equity
For the period 2013 - 2023
MRVC Ordinary Meeting of Council 12 March 2013 65 of 84

1 2 3 4 5 6 7 8 9 102010-11 2011-12 Base 2013-14 2014-15 2015-16 2016-17 2017-18 2018-19 2019-20 2020-21 2021-22 2022-23
$ $ $ $ $ $ $ $ $ $ $ $ $
Cash Flows From Operating ActivitiesReceiptsRates - - - - - - - - - - - - -Operating grants, subsidies and contributions 28,000 28,000 28,000 28,840 29,705 30,596 31,514 32,459 33,433 34,436 35,469 36,533 37,629Fees and Charges 44,268 (37,245) 109,317 66,956 68,965 71,034 73,165 75,360 77,621 79,950 82,349 84,820 87,364Service Charges - - - - - - - - - - - - -Interest Earnings 5 64,014 10,000 355 21,523 3,573 4,940 6,398 7,953 9,608 11,370 13,244 15,236Other Revenue 2,920 (539,703) 541,859 - - - - - - - - - -
75,193 (484,934) 689,176 96,151 120,193 105,203 109,619 114,217 119,007 123,994 129,188 134,597 140,229PaymentsEmployee Costs - - - - - - - - - - - - -Materials and Contracts (75,631) (4,066) (138,081) (66,950) (68,959) (71,028) (73,159) (75,354) (77,615) (79,943) (82,341) (84,811) (87,355)Utility Charges - - - - - - - - - - - - -Insurance Expenses (502) - - - - - - - - - - - -Interest expenses - - - - - - - - - - - - -Other Expenditure - - - - - - - - - - - - -
(76,133) (4,066) (138,081) (66,950) (68,959) (71,028) (73,159) (75,354) (77,615) (79,943) (82,341) (84,811) (87,355)
Net Cash Provided By (Used In) Operating Activities (940) (489,000) 551,095 29,201 51,234 34,175 36,460 38,863 41,392 44,051 46,847 49,786 52,874
Cash Flows from Investing ActivitiesPayments for Development of Land Held for Resale - - - - - - - - - - - - -Payments for Purchase of Property, Plant & Equipment - - - - - - - - - - - - -Payments for Construction of Infrastructure - (323,617) (780,000) (523,000) (500,000) - - - - - - - -Advances to Community Groups - - - - - - - - - - - - -Non-Operating Grants, Subsidies and Contributions - 1,557,867 - 1,023,000 - - - - - - - - -Proceeds from Sale of Plant & Equipment - - - - - - - - - - - - -Proceeds from Sale of Land Held for Resale - - - - - - - - - -Transfers (to)/from Investments - - - - - - - - - - - - -Net Cash Provided By (Used In) Investing Activities - 1,234,250 (780,000) 500,000 (500,000) - - - - - - - -
Cash Flows from Financing ActivitiesRepayment of Debentures - - - - - - - - - - - - -Proceeds from Self Supporting Loans - - - - - - - - - - - - -Proceeds from New Debentures - - - - - - - - - - - - -Net Cash Provided By (Used In) Financing Activities - - - - - - - - - - - - -
Net Increase (Decrease) in Cash Held (940) 745,250 (228,905) 529,201 (448,766) 34,175 36,460 38,863 41,392 44,051 46,847 49,786 52,874Cash at Beginning of Year 3,060 2,120 760,520 8,880 538,081 89,315 123,490 159,950 198,813 240,205 284,256 331,103 380,889Cash and Cash Equivalents at the End of the Year 2,120 747,370 531,615 538,081 89,315 123,490 159,950 198,813 240,205 284,256 331,103 380,889 433,763
Reconciliation of Net Cash Provided By Operating Activities to Net Result
Net Result (74,469) 1,548,953 (81,120) 956,924 (1,820) (18,879) (16,594) (14,191) (11,662) (9,003) (6,207) (3,268) (180)
Depreciation 63,854 71,000 90,000 95,277 53,054 53,054 53,054 53,054 53,054 53,054 53,054 53,054 53,054Write off of Assets - - - - - - - - - -(Profit)/Loss on Sale of Asset - - - - - - - - - - - - -(Increase)/Decrease in Receivables 12,621 (71,738) 73,437 - - - - - - - - - -(Increase)/Decrease in Inventories 2,920 (539,703) 541,859 - - - - - - - - - -Increase/(Decrease) in Payables (5,866) 60,355 (73,081) - - - - - - - - - -Increase/(Decrease) in Employee Provisions - - - - - - - - - - - - -Grants/Contributions for the Development of Assets - (1,557,867) - (1,023,000) - - - - - - - - -Net Cash from Operating Activities (940) (489,000) 551,095 29,201 51,234 34,175 36,460 38,863 41,392 44,051 46,847 49,786 52,874
Murchison Regional Vermin ControlForecast Statement of Cashflows
For the period 2013 - 2023
MRVC Ordinary Meeting of Council 12 March 2013 66 of 84
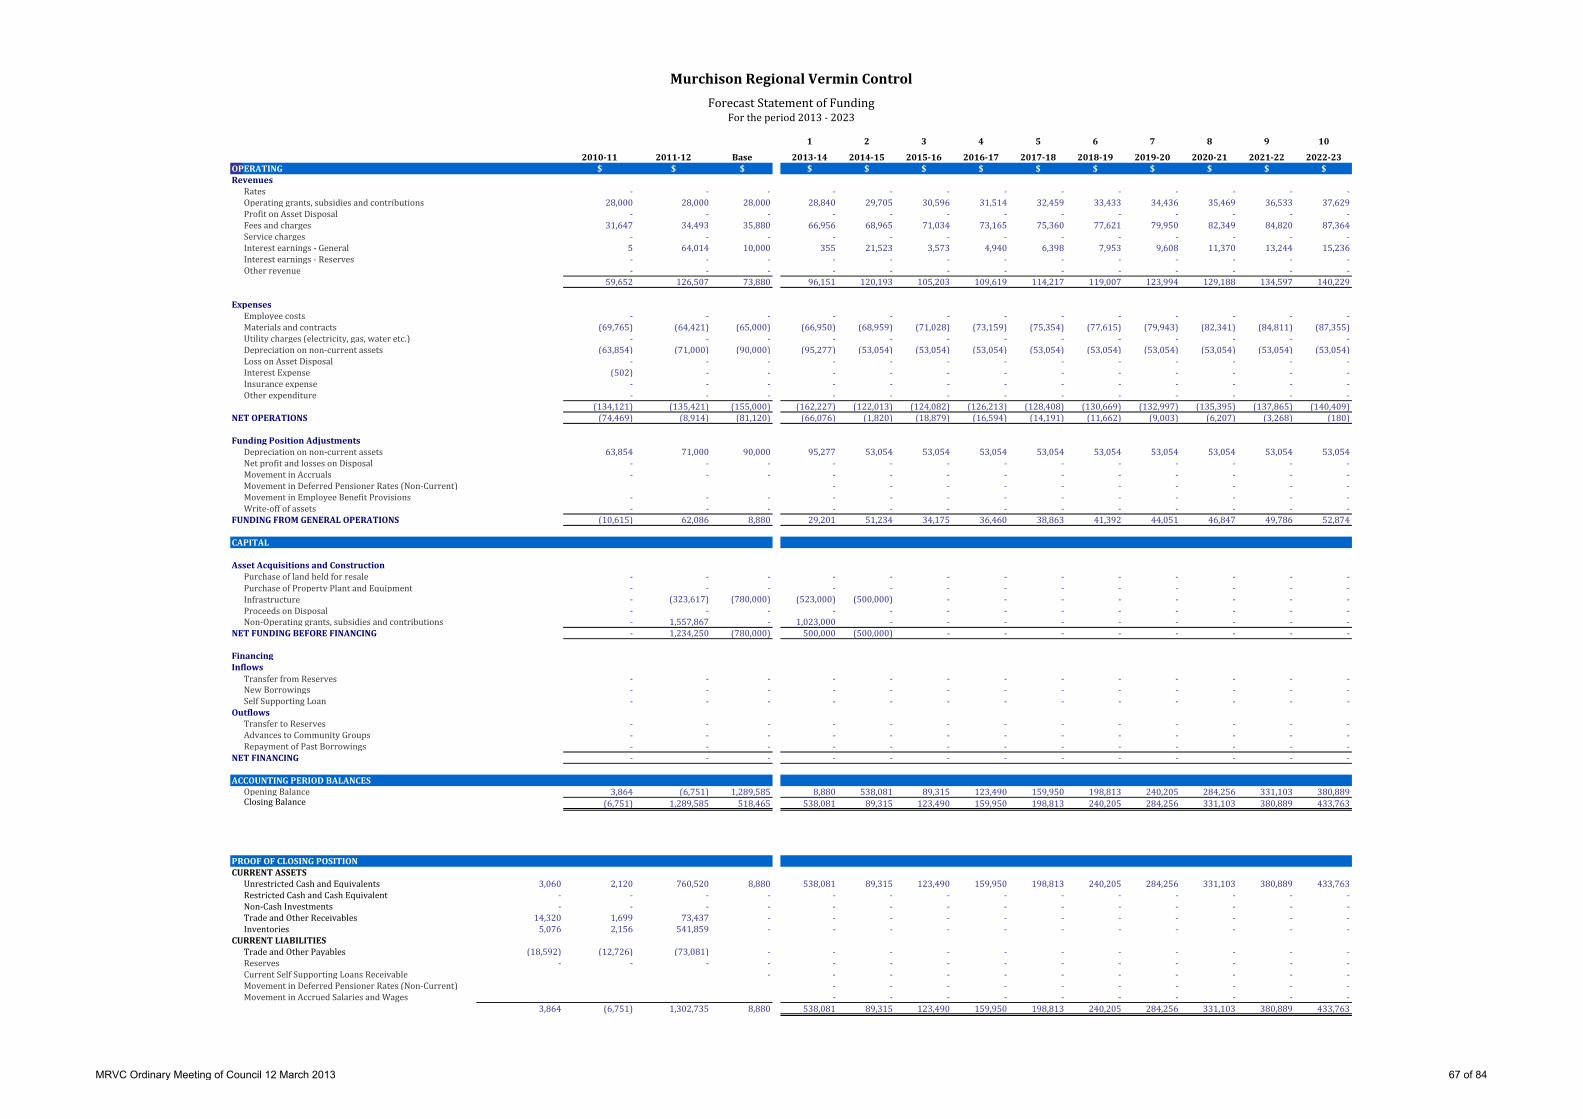
1 2 3 4 5 6 7 8 9 10
2010-11 2011-12 Base 2013-14 2014-15 2015-16 2016-17 2017-18 2018-19 2019-20 2020-21 2021-22 2022-23OPERATING $ $ $ $ $ $ $ $ $ $ $ $ $Revenues
Rates - - - - - - - - - - - - -Operating grants, subsidies and contributions 28,000 28,000 28,000 28,840 29,705 30,596 31,514 32,459 33,433 34,436 35,469 36,533 37,629Profit on Asset Disposal - - - - - - - - - - - - -Fees and charges 31,647 34,493 35,880 66,956 68,965 71,034 73,165 75,360 77,621 79,950 82,349 84,820 87,364Service charges - - - - - - - - - - - - -Interest earnings - General 5 64,014 10,000 355 21,523 3,573 4,940 6,398 7,953 9,608 11,370 13,244 15,236Interest earnings - Reserves - - - - - - - - - - - - -Other revenue - - - - - - - - - - - - -
59,652 126,507 73,880 96,151 120,193 105,203 109,619 114,217 119,007 123,994 129,188 134,597 140,229
ExpensesEmployee costs - - - - - - - - - - - - -Materials and contracts (69,765) (64,421) (65,000) (66,950) (68,959) (71,028) (73,159) (75,354) (77,615) (79,943) (82,341) (84,811) (87,355)Utility charges (electricity, gas, water etc.) - - - - - - - - - - - - -Depreciation on non-current assets (63,854) (71,000) (90,000) (95,277) (53,054) (53,054) (53,054) (53,054) (53,054) (53,054) (53,054) (53,054) (53,054)Loss on Asset Disposal - - - - - - - - - - - - -Interest Expense (502) - - - - - - - - - - - -Insurance expense - - - - - - - - - - - - -Other expenditure - - - - - - - - - - - - -
(134,121) (135,421) (155,000) (162,227) (122,013) (124,082) (126,213) (128,408) (130,669) (132,997) (135,395) (137,865) (140,409)NET OPERATIONS (74,469) (8,914) (81,120) (66,076) (1,820) (18,879) (16,594) (14,191) (11,662) (9,003) (6,207) (3,268) (180)
Funding Position AdjustmentsDepreciation on non-current assets 63,854 71,000 90,000 95,277 53,054 53,054 53,054 53,054 53,054 53,054 53,054 53,054 53,054Net profit and losses on Disposal - - - - - - - - - - - - -Movement in Accruals - - - - - - - - - - - - -Movement in Deferred Pensioner Rates (Non-Current) - - - - - - - - - -Movement in Employee Benefit Provisions - - - - - - - - - - - - -Write-off of assets - - - - - - - - - - - - -
FUNDING FROM GENERAL OPERATIONS (10,615) 62,086 8,880 29,201 51,234 34,175 36,460 38,863 41,392 44,051 46,847 49,786 52,874
CAPITAL
Asset Acquisitions and ConstructionPurchase of land held for resale - - - - - - - - - - - - -Purchase of Property Plant and Equipment - - - - - - - - - - - - -Infrastructure - (323,617) (780,000) (523,000) (500,000) - - - - - - - -Proceeds on Disposal - - - - - - - - - - - - -Non-Operating grants, subsidies and contributions - 1,557,867 - 1,023,000 - - - - - - - - -
NET FUNDING BEFORE FINANCING - 1,234,250 (780,000) 500,000 (500,000) - - - - - - - -
FinancingInflows
Transfer from Reserves - - - - - - - - - - - - -New Borrowings - - - - - - - - - - - - -Self Supporting Loan - - - - - - - - - - - - -
OutflowsTransfer to Reserves - - - - - - - - - - - - -Advances to Community Groups - - - - - - - - - - - - -Repayment of Past Borrowings - - - - - - - - - - - - -
NET FINANCING - - - - - - - - - - - - -
ACCOUNTING PERIOD BALANCESOpening Balance 3,864 (6,751) 1,289,585 8,880 538,081 89,315 123,490 159,950 198,813 240,205 284,256 331,103 380,889Closing Balance (6,751) 1,289,585 518,465 538,081 89,315 123,490 159,950 198,813 240,205 284,256 331,103 380,889 433,763
PROOF OF CLOSING POSITIONCURRENT ASSETS
Unrestricted Cash and Equivalents 3,060 2,120 760,520 8,880 538,081 89,315 123,490 159,950 198,813 240,205 284,256 331,103 380,889 433,763Restricted Cash and Cash Equivalent - - - - - - - - - - - - - -Non-Cash Investments - - - - - - - - - - - - - -Trade and Other Receivables 14,320 1,699 73,437 - - - - - - - - - - -Inventories 5,076 2,156 541,859 - - - - - - - - - - -
CURRENT LIABILITIESTrade and Other Payables (18,592) (12,726) (73,081) - - - - - - - - - - -Reserves - - - - - - - - - - - - - -Current Self Supporting Loans Receivable - - - - - - - - - - -Movement in Deferred Pensioner Rates (Non-Current) - - - - - - - - - -Movement in Accrued Salaries and Wages - - - - - - - - - -
3,864 (6,751) 1,302,735 8,880 538,081 89,315 123,490 159,950 198,813 240,205 284,256 331,103 380,889 433,763
Murchison Regional Vermin ControlForecast Statement of Funding
For the period 2013 - 2023
MRVC Ordinary Meeting of Council 12 March 2013 67 of 84
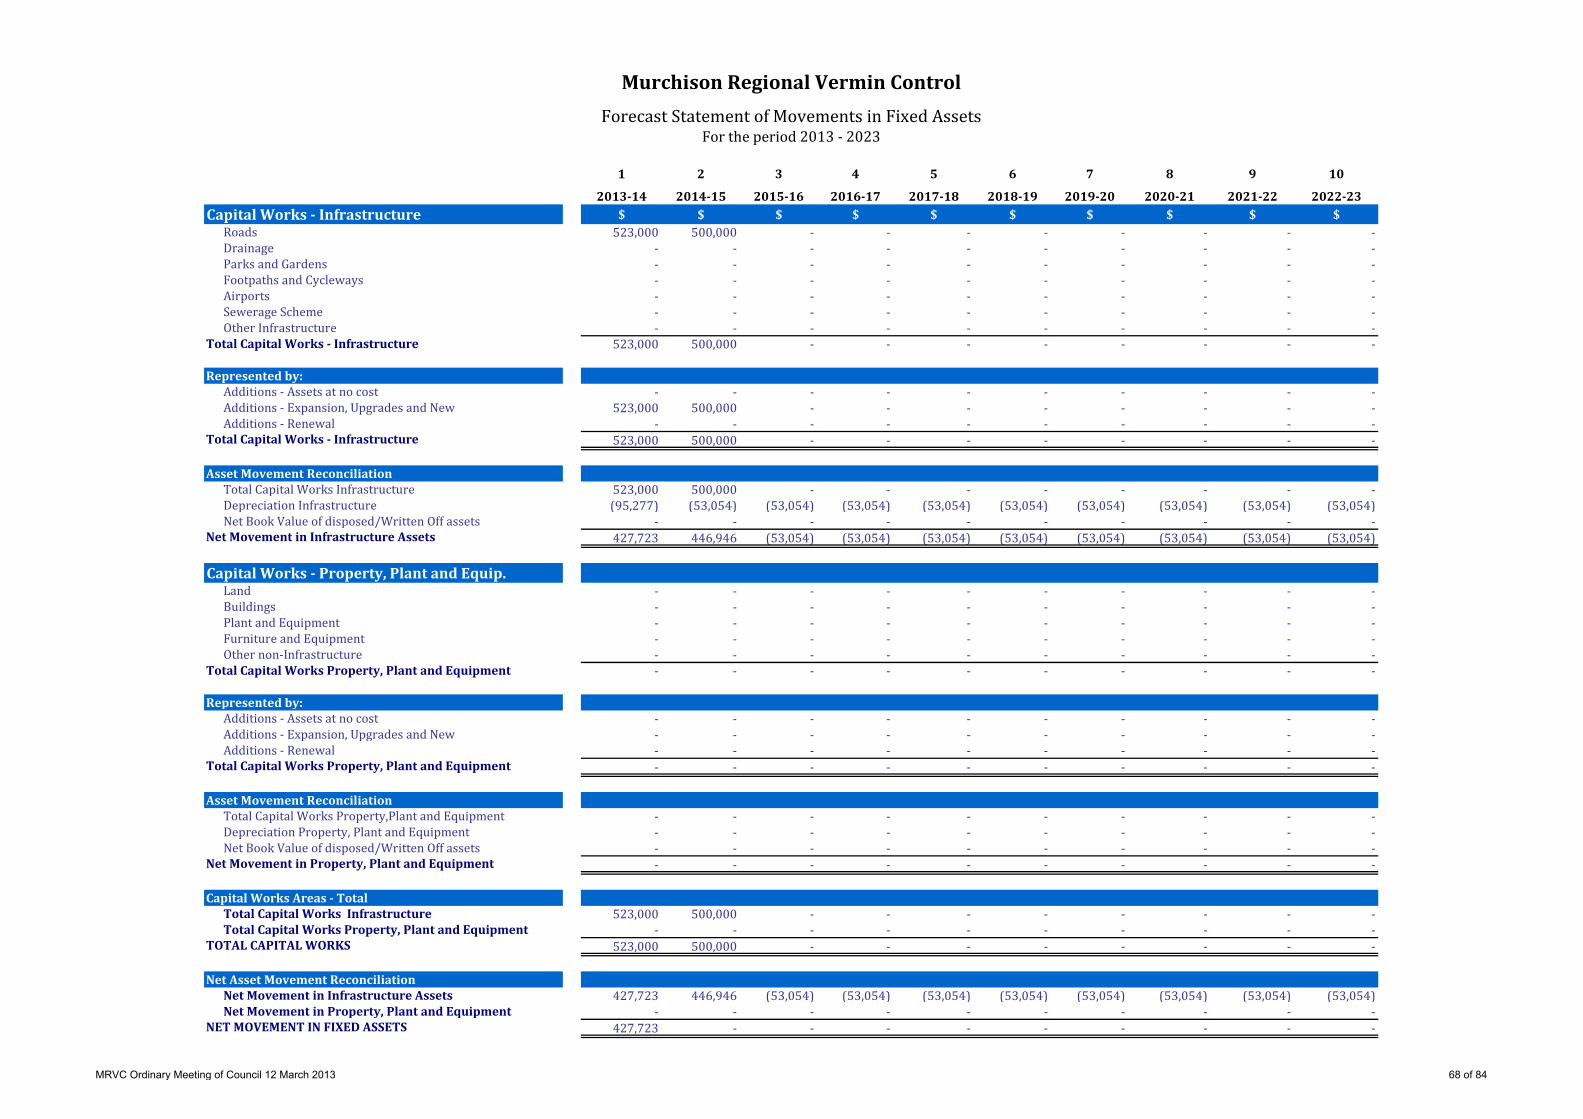
1 2 3 4 5 6 7 8 9 10
2013-14 2014-15 2015-16 2016-17 2017-18 2018-19 2019-20 2020-21 2021-22 2022-23Capital Works - Infrastructure $ $ $ $ $ $ $ $ $ $
Roads 523,000 500,000 - - - - - - - -Drainage - - - - - - - - - -Parks and Gardens - - - - - - - - - -Footpaths and Cycleways - - - - - - - - - -Airports - - - - - - - - - -Sewerage Scheme - - - - - - - - - -Other Infrastructure - - - - - - - - - -
Total Capital Works - Infrastructure 523,000 500,000 - - - - - - - -
Represented by:Additions - Assets at no cost - - - - - - - - - -Additions - Expansion, Upgrades and New 523,000 500,000 - - - - - - - -Additions - Renewal - - - - - - - - - -
Total Capital Works - Infrastructure 523,000 500,000 - - - - - - - -
Asset Movement Reconciliation Total Capital Works Infrastructure 523,000 500,000 - - - - - - - -Depreciation Infrastructure (95,277) (53,054) (53,054) (53,054) (53,054) (53,054) (53,054) (53,054) (53,054) (53,054)Net Book Value of disposed/Written Off assets - - - - - - - - - -
Net Movement in Infrastructure Assets 427,723 446,946 (53,054) (53,054) (53,054) (53,054) (53,054) (53,054) (53,054) (53,054)
Capital Works - Property, Plant and Equip.Land - - - - - - - - - -Buildings - - - - - - - - - -Plant and Equipment - - - - - - - - - -Furniture and Equipment - - - - - - - - - -Other non-Infrastructure - - - - - - - - - -
Total Capital Works Property, Plant and Equipment - - - - - - - - - -
Represented by:Additions - Assets at no cost - - - - - - - - - -Additions - Expansion, Upgrades and New - - - - - - - - - -Additions - Renewal - - - - - - - - - -
Total Capital Works Property, Plant and Equipment - - - - - - - - - -
Asset Movement ReconciliationTotal Capital Works Property,Plant and Equipment - - - - - - - - - -Depreciation Property, Plant and Equipment - - - - - - - - - -Net Book Value of disposed/Written Off assets - - - - - - - - - -
Net Movement in Property, Plant and Equipment - - - - - - - - - -
Capital Works Areas - TotalTotal Capital Works Infrastructure 523,000 500,000 - - - - - - - -Total Capital Works Property, Plant and Equipment - - - - - - - - - -
TOTAL CAPITAL WORKS 523,000 500,000 - - - - - - - -
Net Asset Movement Reconciliation Net Movement in Infrastructure Assets 427,723 446,946 (53,054) (53,054) (53,054) (53,054) (53,054) (53,054) (53,054) (53,054)Net Movement in Property, Plant and Equipment - - - - - - - - - -
NET MOVEMENT IN FIXED ASSETS 427,723 - - - - - - - - -
Murchison Regional Vermin ControlForecast Statement of Movements in Fixed Assets
For the period 2013 - 2023
MRVC Ordinary Meeting of Council 12 March 2013 68 of 84
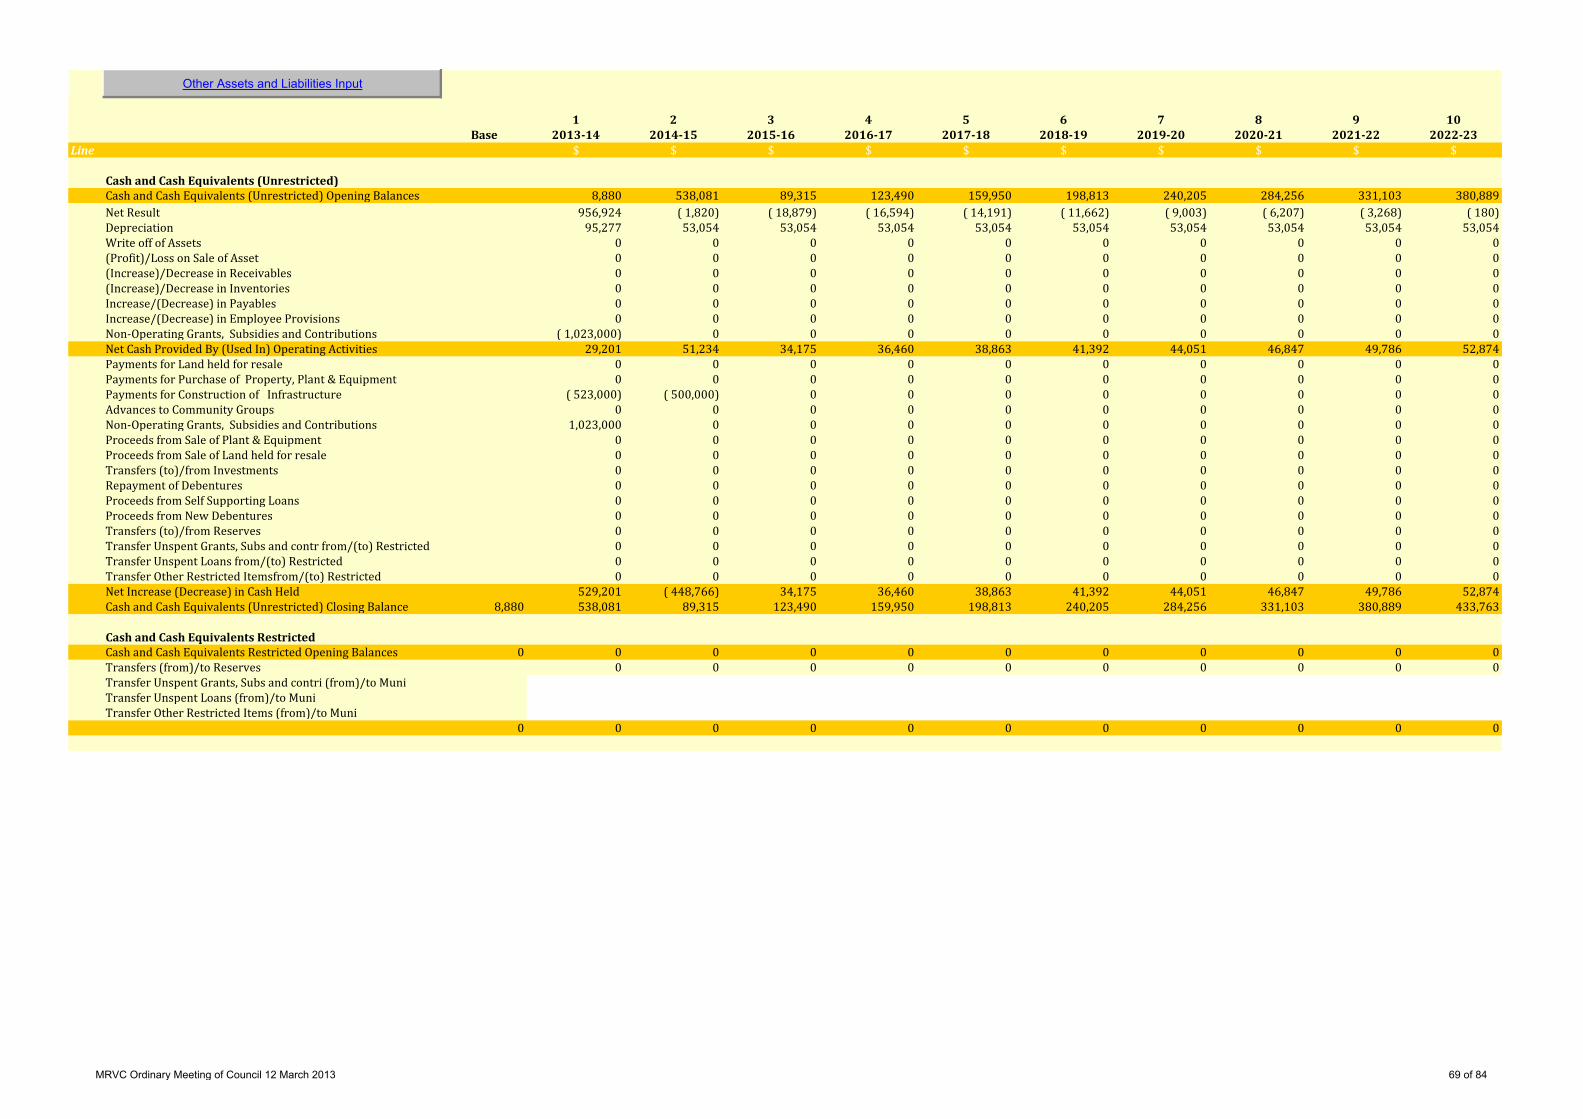
Other Assets and Liabilities Input
1 2 3 4 5 6 7 8 9 10Base 2013-14 2014-15 2015-16 2016-17 2017-18 2018-19 2019-20 2020-21 2021-22 2022-23
Line $ $ $ $ $ $ $ $ $ $
Cash and Cash Equivalents (Unrestricted) Cash and Cash Equivalents (Unrestricted) Opening Balances 8,880 538,081 89,315 123,490 159,950 198,813 240,205 284,256 331,103 380,889Net Result 956,924 ( 1,820) ( 18,879) ( 16,594) ( 14,191) ( 11,662) ( 9,003) ( 6,207) ( 3,268) ( 180)Depreciation 95,277 53,054 53,054 53,054 53,054 53,054 53,054 53,054 53,054 53,054Write off of Assets 0 0 0 0 0 0 0 0 0 0(Profit)/Loss on Sale of Asset 0 0 0 0 0 0 0 0 0 0(Increase)/Decrease in Receivables 0 0 0 0 0 0 0 0 0 0(Increase)/Decrease in Inventories 0 0 0 0 0 0 0 0 0 0Increase/(Decrease) in Payables 0 0 0 0 0 0 0 0 0 0Increase/(Decrease) in Employee Provisions 0 0 0 0 0 0 0 0 0 0Non-Operating Grants, Subsidies and Contributions ( 1,023,000) 0 0 0 0 0 0 0 0 0Net Cash Provided By (Used In) Operating Activities 29,201 51,234 34,175 36,460 38,863 41,392 44,051 46,847 49,786 52,874Payments for Land held for resale 0 0 0 0 0 0 0 0 0 0Payments for Purchase of Property, Plant & Equipment 0 0 0 0 0 0 0 0 0 0Payments for Construction of Infrastructure ( 523,000) ( 500,000) 0 0 0 0 0 0 0 0Advances to Community Groups 0 0 0 0 0 0 0 0 0 0Non-Operating Grants, Subsidies and Contributions 1,023,000 0 0 0 0 0 0 0 0 0Proceeds from Sale of Plant & Equipment 0 0 0 0 0 0 0 0 0 0Proceeds from Sale of Land held for resale 0 0 0 0 0 0 0 0 0 0Transfers (to)/from Investments 0 0 0 0 0 0 0 0 0 0Repayment of Debentures 0 0 0 0 0 0 0 0 0 0Proceeds from Self Supporting Loans 0 0 0 0 0 0 0 0 0 0Proceeds from New Debentures 0 0 0 0 0 0 0 0 0 0Transfers (to)/from Reserves 0 0 0 0 0 0 0 0 0 0Transfer Unspent Grants, Subs and contr from/(to) Restricted 0 0 0 0 0 0 0 0 0 0Transfer Unspent Loans from/(to) Restricted 0 0 0 0 0 0 0 0 0 0Transfer Other Restricted Itemsfrom/(to) Restricted 0 0 0 0 0 0 0 0 0 0Net Increase (Decrease) in Cash Held 529,201 ( 448,766) 34,175 36,460 38,863 41,392 44,051 46,847 49,786 52,874Cash and Cash Equivalents (Unrestricted) Closing Balance 8,880 538,081 89,315 123,490 159,950 198,813 240,205 284,256 331,103 380,889 433,763
Cash and Cash Equivalents Restricted Cash and Cash Equivalents Restricted Opening Balances 0 0 0 0 0 0 0 0 0 0 0Transfers (from)/to Reserves 0 0 0 0 0 0 0 0 0 0Transfer Unspent Grants, Subs and contri (from)/to MuniTransfer Unspent Loans (from)/to MuniTransfer Other Restricted Items (from)/to Muni
0 0 0 0 0 0 0 0 0 0 0
MRVC Ordinary Meeting of Council 12 March 2013 69 of 84

1 2 3 4 5 6 7 8 9 10Base 2013-14 2014-15 2015-16 2016-17 2017-18 2018-19 2019-20 2020-21 2021-22 2022-23
Line Total - Fixed Asset adjustments $ $ $ $ $ $ $ $ $ $Total - Property Plant and Equipment 0 0 0 0 0 0 0 0 0 0 0Total - Infrastructure 1,655,594 2,083,317 2,530,263 2,477,209 2,424,155 2,371,101 2,318,047 2,264,993 2,211,939 2,158,885 2,105,831
Total - Fixed Asset a 1,655,594 2,083,317 2,530,263 2,477,209 2,424,155 2,371,101 2,318,047 2,264,993 2,211,939 2,158,885 2,105,831
AdditionsTotal - Property Plant and Equipment 0 0 0 0 0 0 0 0 0 0 0Total - Infrastructure 0 523,000 500,000 0 0 0 0 0 0 0 0
Total - 0 523,000 500,000 0 0 0 0 0 0 0 0
DisposalsTotal - Property Plant and Equipment 0 0 0 0 0 0 0 0 0 0 0Total - Infrastructure 0 0 0 0 0 0 0 0 0 0 0
Total - 0 0 0 0 0 0 0 0 0 0 0
DepreciationTotal - Property Plant and Equipment 0 0 0 0 0 0 0 0 0 0 0Total - Infrastructure 0 ( 95,277) ( 53,054) ( 53,054) ( 53,054) ( 53,054) ( 53,054) ( 53,054) ( 53,054) ( 53,054) ( 53,054)
Total - 0 ( 95,277) ( 53,054) ( 53,054) ( 53,054) ( 53,054) ( 53,054) ( 53,054) ( 53,054) ( 53,054) ( 53,054)
Murchison Regional Vermin ControlFixed Asset Forecast Summary
For the period 2013 - 2023
MRVC Ordinary Meeting of Council 12 March 2013 70 of 84
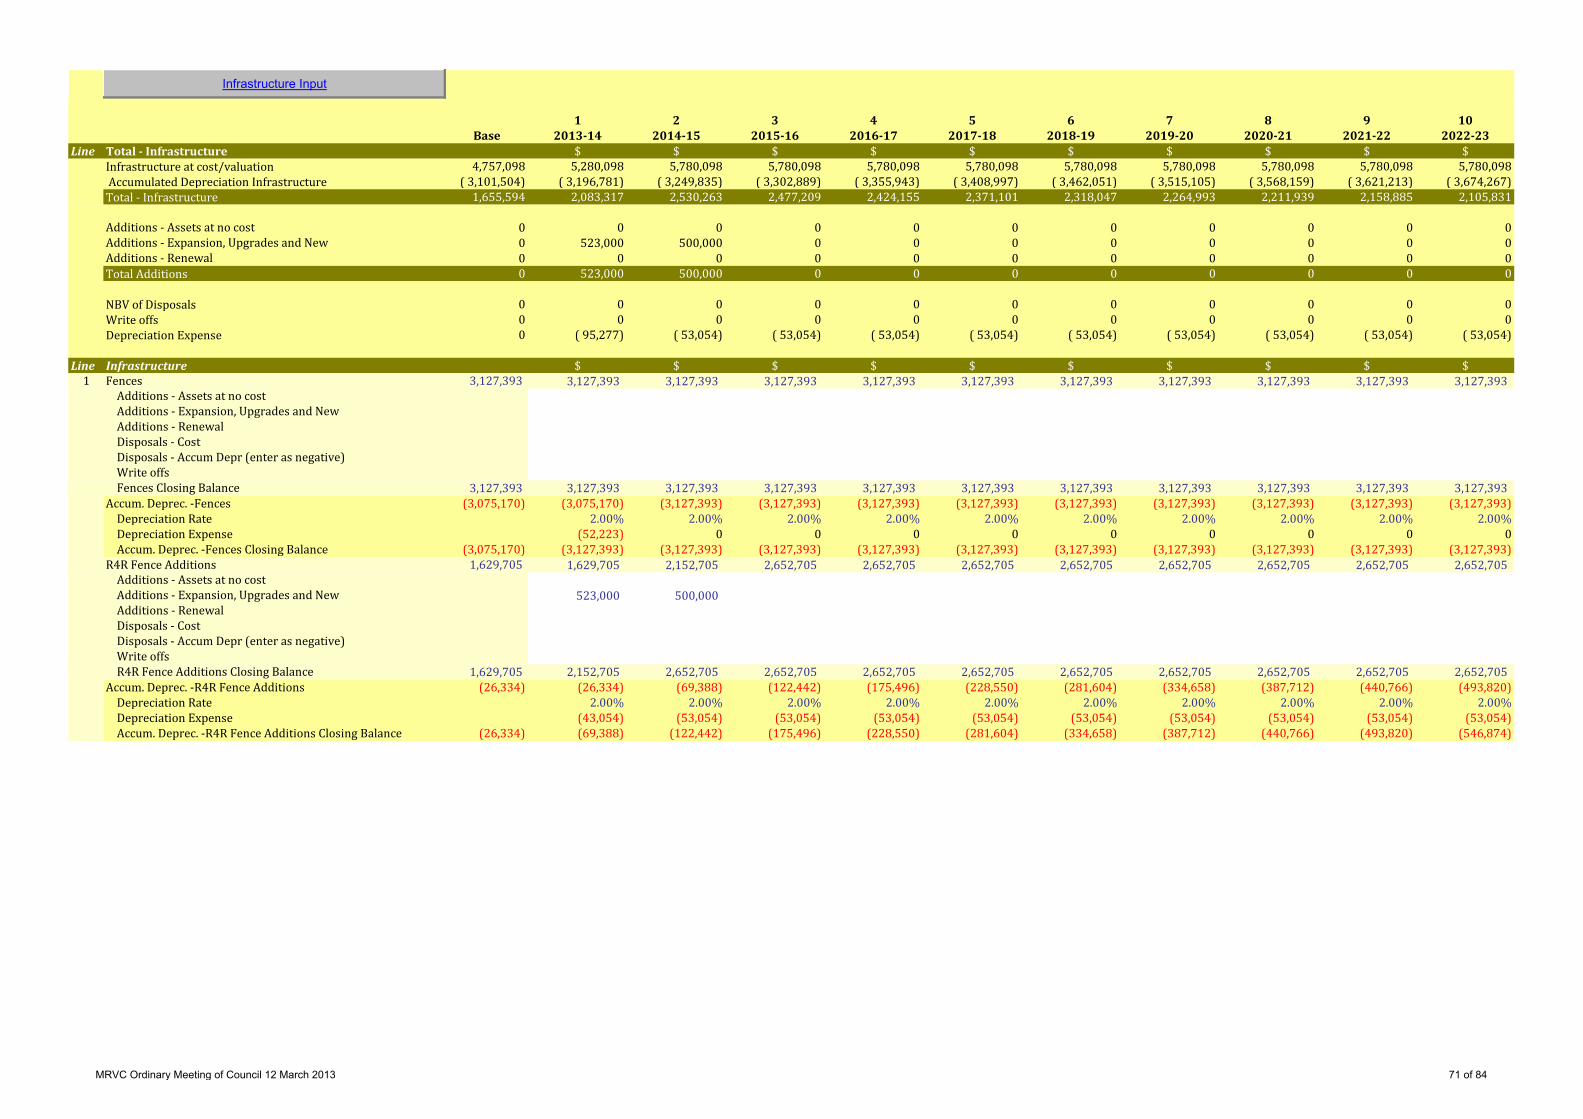
Infrastructure Input
1 2 3 4 5 6 7 8 9 10Base 2013-14 2014-15 2015-16 2016-17 2017-18 2018-19 2019-20 2020-21 2021-22 2022-23
Line Total - Infrastructure $ $ $ $ $ $ $ $ $ $Infrastructure at cost/valuation 4,757,098 5,280,098 5,780,098 5,780,098 5,780,098 5,780,098 5,780,098 5,780,098 5,780,098 5,780,098 5,780,098 Accumulated Depreciation Infrastructure ( 3,101,504) ( 3,196,781) ( 3,249,835) ( 3,302,889) ( 3,355,943) ( 3,408,997) ( 3,462,051) ( 3,515,105) ( 3,568,159) ( 3,621,213) ( 3,674,267)Total - Infrastructure 1,655,594 2,083,317 2,530,263 2,477,209 2,424,155 2,371,101 2,318,047 2,264,993 2,211,939 2,158,885 2,105,831
Additions - Assets at no cost 0 0 0 0 0 0 0 0 0 0 0Additions - Expansion, Upgrades and New 0 523,000 500,000 0 0 0 0 0 0 0 0Additions - Renewal 0 0 0 0 0 0 0 0 0 0 0Total Additions 0 523,000 500,000 0 0 0 0 0 0 0 0
NBV of Disposals 0 0 0 0 0 0 0 0 0 0 0Write offs 0 0 0 0 0 0 0 0 0 0 0Depreciation Expense 0 ( 95,277) ( 53,054) ( 53,054) ( 53,054) ( 53,054) ( 53,054) ( 53,054) ( 53,054) ( 53,054) ( 53,054)
Line Infrastructure $ $ $ $ $ $ $ $ $ $1 Fences 3,127,393 3,127,393 3,127,393 3,127,393 3,127,393 3,127,393 3,127,393 3,127,393 3,127,393 3,127,393 3,127,393
Additions - Assets at no costAdditions - Expansion, Upgrades and NewAdditions - RenewalDisposals - CostDisposals - Accum Depr (enter as negative)Write offsFences Closing Balance 3,127,393 3,127,393 3,127,393 3,127,393 3,127,393 3,127,393 3,127,393 3,127,393 3,127,393 3,127,393 3,127,393
Accum. Deprec. -Fences (3,075,170) (3,075,170) (3,127,393) (3,127,393) (3,127,393) (3,127,393) (3,127,393) (3,127,393) (3,127,393) (3,127,393) (3,127,393)Depreciation Rate 2.00% 2.00% 2.00% 2.00% 2.00% 2.00% 2.00% 2.00% 2.00% 2.00%Depreciation Expense (52,223) 0 0 0 0 0 0 0 0 0Accum. Deprec. -Fences Closing Balance (3,075,170) (3,127,393) (3,127,393) (3,127,393) (3,127,393) (3,127,393) (3,127,393) (3,127,393) (3,127,393) (3,127,393) (3,127,393)
R4R Fence Additions 1,629,705 1,629,705 2,152,705 2,652,705 2,652,705 2,652,705 2,652,705 2,652,705 2,652,705 2,652,705 2,652,705 Additions - Assets at no costAdditions - Expansion, Upgrades and New 523,000 500,000 Additions - RenewalDisposals - CostDisposals - Accum Depr (enter as negative)Write offsR4R Fence Additions Closing Balance 1,629,705 2,152,705 2,652,705 2,652,705 2,652,705 2,652,705 2,652,705 2,652,705 2,652,705 2,652,705 2,652,705
Accum. Deprec. -R4R Fence Additions (26,334) (26,334) (69,388) (122,442) (175,496) (228,550) (281,604) (334,658) (387,712) (440,766) (493,820)Depreciation Rate 2.00% 2.00% 2.00% 2.00% 2.00% 2.00% 2.00% 2.00% 2.00% 2.00%Depreciation Expense (43,054) (53,054) (53,054) (53,054) (53,054) (53,054) (53,054) (53,054) (53,054) (53,054)Accum. Deprec. -R4R Fence Additions Closing Balance (26,334) (69,388) (122,442) (175,496) (228,550) (281,604) (334,658) (387,712) (440,766) (493,820) (546,874)
MRVC Ordinary Meeting of Council 12 March 2013 71 of 84
12.10 Draft Long Term Financial Plan and Capital Works Program File: MRVC Officer: Geoff Brooks – CEO Amended by: Nil Disclosure of Interest: Nil Meeting Date: 12 March 2013 Application To consider and discuss the Draft MRVC Long Term Financial Plan and Capital Works Program. Background The Department of Local Government Integrated Planning and Reporting guidelines require the preparation of a Long Term Financial Plan. As per Strategic Community Plan the Long Term Financial Plan covers a ten year period. The Long Term Financial Plan is an extension of the Four Year Budget with a reduction in the level of detail shown. Current Position The Draft Long Term Financial Plan and Capital Works Program are attached for the purpose of discussion and input. Consultation Midwest Financial Statutory Environment Section 5.56 – Local Government Act 1995 Regulations 19BA to 19D Local Government (Administration) Regulations 1996 Policy Implications Nil Financial Implications Nil Strategic Implications Nil Voting Requirements Simple Majority
OFFICER RECOMMENDATION Moved: Seconded: That Council considers the Draft Long Term Financial Plan and Capital Works Program. CARRIED/LOST
MRVC Ordinary Meeting of Council 12 March 2013 72 of 84
FOUR YEAR BUDGET
2013-2017
MRVC Ordinary Meeting of Council 12 March 2013 73 of 84

General Information
Local Government name
Prepared by:
Version Number 1
Date Prepared 6/03/2013
CALCULATION BASE YEAR ENDED 30 JUNE 2013
No of Years to be forecast 4 (Maximum 20 Years)
Inflators and Drivers
Inflation Forecast 3.00% (Set inflation to 0 if plan is to be prepared using real values)
Investment Interest Rate 4.00%
Default Borrowings Interest Rate 6.0%
Standard Model Assumptions1 Deferred Pensioners will remain static throughout the forecast period2 Accrued Interest will remain Static3 Accrued Salaries and Wages will remain static4
5 General Interest revenue is based on the assumption of the average cash balance for the year being the same level as the previous periods closing cash balance. 6
7 It is assumed the locla government will not will not incur any interest expense relating to to be overdrawn during the year. Whilst
Other Assumptions
NEW CLGF Project - $1.023 Million replace 100km on No 2 Vermin Fence - Two year project commencing July 2013
Murchison Regional Vermin ControlGlobal Variables
Whilst interest rates are expected to fluctuate on a monthly basis the impact of these variations on Councils' Long Term Financial plan are assumed to be negligible and a forecast average interest rate for cash investments is utilised
Whilst year on year inflation is expected to vary the impact of these variations on Councils Long Term Financial planning are assumed to be negligable and as such a forecast average rate of inflation is utilised
Murchison Regional Vermin Control
Jim Dillon Midwest Financial
Council Precepts - Increase by 100%Fence Rentals - Increase by CPI (3%)Meekatharra Rangelands Biosecurity Association - Increase by CPI
MRVC Ordinary Meeting of Council 12 March 2013 74 of 84
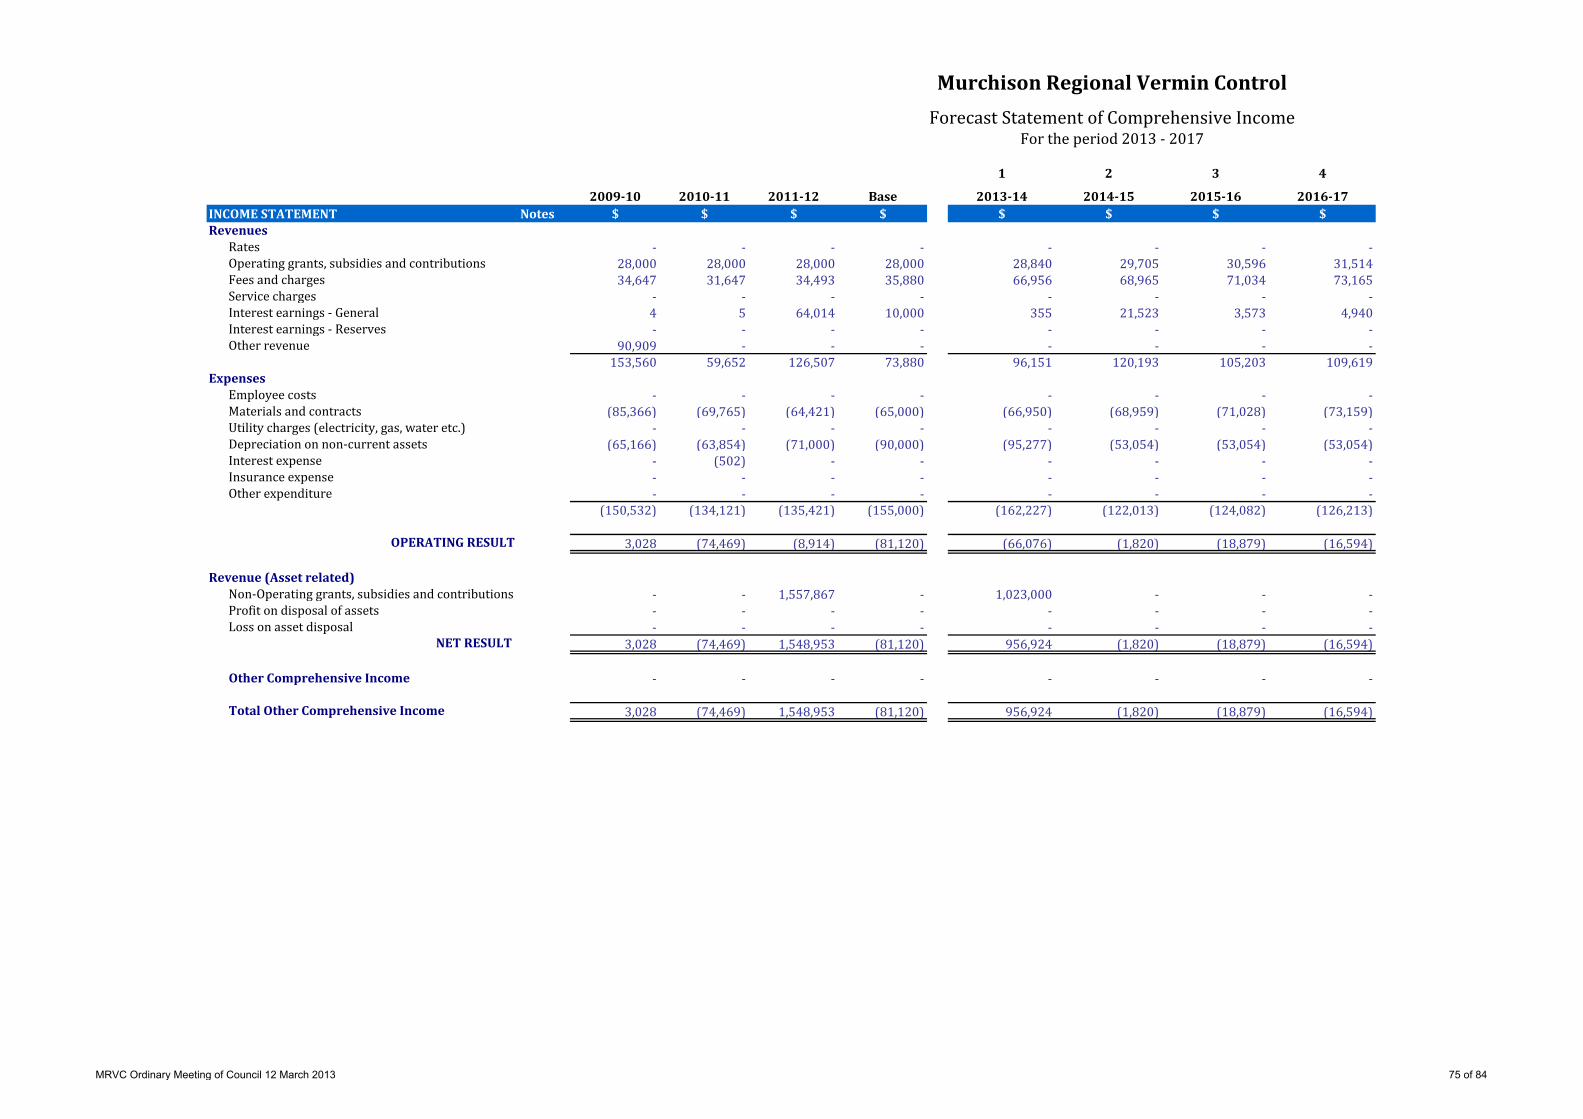
1 2 3 4
2009-10 2010-11 2011-12 Base 2013-14 2014-15 2015-16 2016-17INCOME STATEMENT Notes $ $ $ $ $ $ $ $Revenues
Rates - - - - - - - -Operating grants, subsidies and contributions 28,000 28,000 28,000 28,000 28,840 29,705 30,596 31,514Fees and charges 34,647 31,647 34,493 35,880 66,956 68,965 71,034 73,165Service charges - - - - - - - -Interest earnings - General 4 5 64,014 10,000 355 21,523 3,573 4,940Interest earnings - Reserves - - - - - - - -Other revenue 90,909 - - - - - - -
153,560 59,652 126,507 73,880 96,151 120,193 105,203 109,619Expenses
Employee costs - - - - - - - -Materials and contracts (85,366) (69,765) (64,421) (65,000) (66,950) (68,959) (71,028) (73,159)Utility charges (electricity, gas, water etc.) - - - - - - - -Depreciation on non-current assets (65,166) (63,854) (71,000) (90,000) (95,277) (53,054) (53,054) (53,054)Interest expense - (502) - - - - - -Insurance expense - - - - - - - -Other expenditure - - - - - - - -
(150,532) (134,121) (135,421) (155,000) (162,227) (122,013) (124,082) (126,213)
OPERATING RESULT 3,028 (74,469) (8,914) (81,120) (66,076) (1,820) (18,879) (16,594)
Revenue (Asset related)Non-Operating grants, subsidies and contributions - - 1,557,867 - 1,023,000 - - -Profit on disposal of assets - - - - - - - -Loss on asset disposal - - - - - - - -
NET RESULT 3,028 (74,469) 1,548,953 (81,120) 956,924 (1,820) (18,879) (16,594)
Other Comprehensive Income - - - - - - - -
Total Other Comprehensive Income 3,028 (74,469) 1,548,953 (81,120) 956,924 (1,820) (18,879) (16,594)
Murchison Regional Vermin ControlForecast Statement of Comprehensive Income
For the period 2013 - 2017
MRVC Ordinary Meeting of Council 12 March 2013 75 of 84
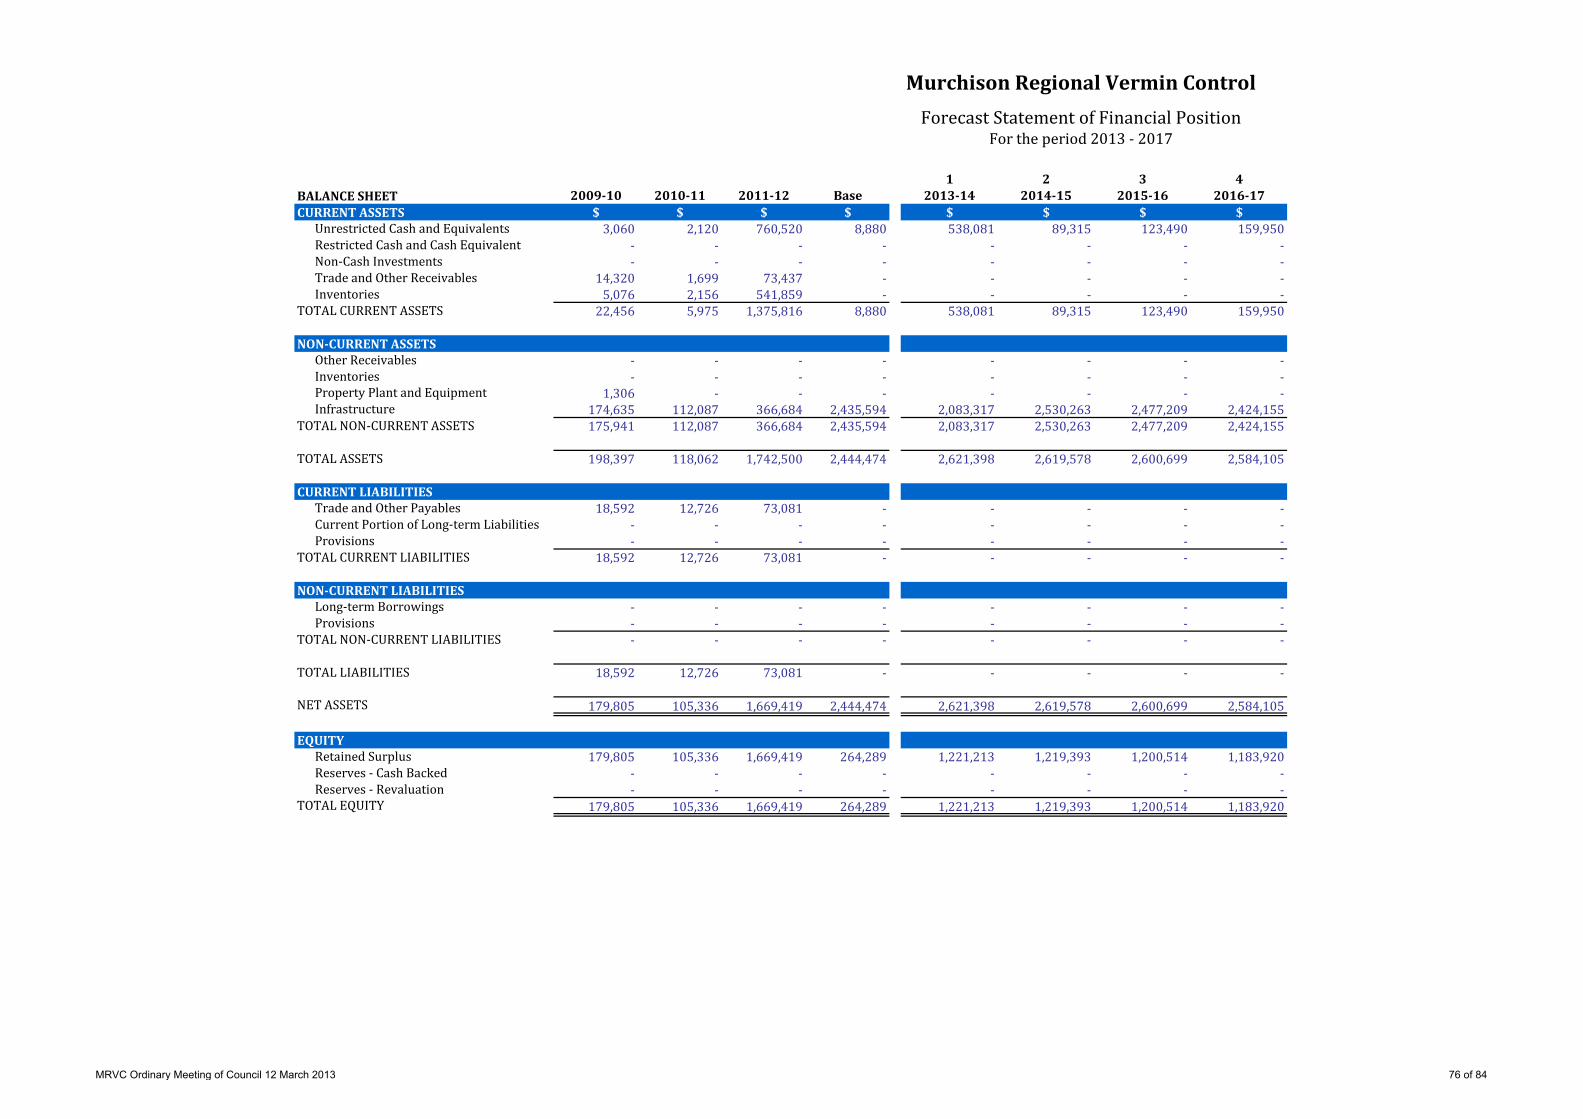
1 2 3 4BALANCE SHEET 2009-10 2010-11 2011-12 Base 2013-14 2014-15 2015-16 2016-17CURRENT ASSETS $ $ $ $ $ $ $ $
Unrestricted Cash and Equivalents 3,060 2,120 760,520 8,880 538,081 89,315 123,490 159,950Restricted Cash and Cash Equivalent - - - - - - - -Non-Cash Investments - - - - - - - -Trade and Other Receivables 14,320 1,699 73,437 - - - - -Inventories 5,076 2,156 541,859 - - - - -
TOTAL CURRENT ASSETS 22,456 5,975 1,375,816 8,880 538,081 89,315 123,490 159,950
NON-CURRENT ASSETSOther Receivables - - - - - - - -Inventories - - - - - - - -Property Plant and Equipment 1,306 - - - - - - -Infrastructure 174,635 112,087 366,684 2,435,594 2,083,317 2,530,263 2,477,209 2,424,155
TOTAL NON-CURRENT ASSETS 175,941 112,087 366,684 2,435,594 2,083,317 2,530,263 2,477,209 2,424,155
TOTAL ASSETS 198,397 118,062 1,742,500 2,444,474 2,621,398 2,619,578 2,600,699 2,584,105
CURRENT LIABILITIESTrade and Other Payables 18,592 12,726 73,081 - - - - -Current Portion of Long-term Liabilities - - - - - - - -Provisions - - - - - - - -
TOTAL CURRENT LIABILITIES 18,592 12,726 73,081 - - - - -
NON-CURRENT LIABILITIESLong-term Borrowings - - - - - - - -Provisions - - - - - - - -
TOTAL NON-CURRENT LIABILITIES - - - - - - - -
TOTAL LIABILITIES 18,592 12,726 73,081 - - - - -
NET ASSETS 179,805 105,336 1,669,419 2,444,474 2,621,398 2,619,578 2,600,699 2,584,105
EQUITYRetained Surplus 179,805 105,336 1,669,419 264,289 1,221,213 1,219,393 1,200,514 1,183,920Reserves - Cash Backed - - - - - - - -Reserves - Revaluation - - - - - - - -
TOTAL EQUITY 179,805 105,336 1,669,419 264,289 1,221,213 1,219,393 1,200,514 1,183,920
Murchison Regional Vermin ControlForecast Statement of Financial Position
For the period 2013 - 2017
MRVC Ordinary Meeting of Council 12 March 2013 76 of 84
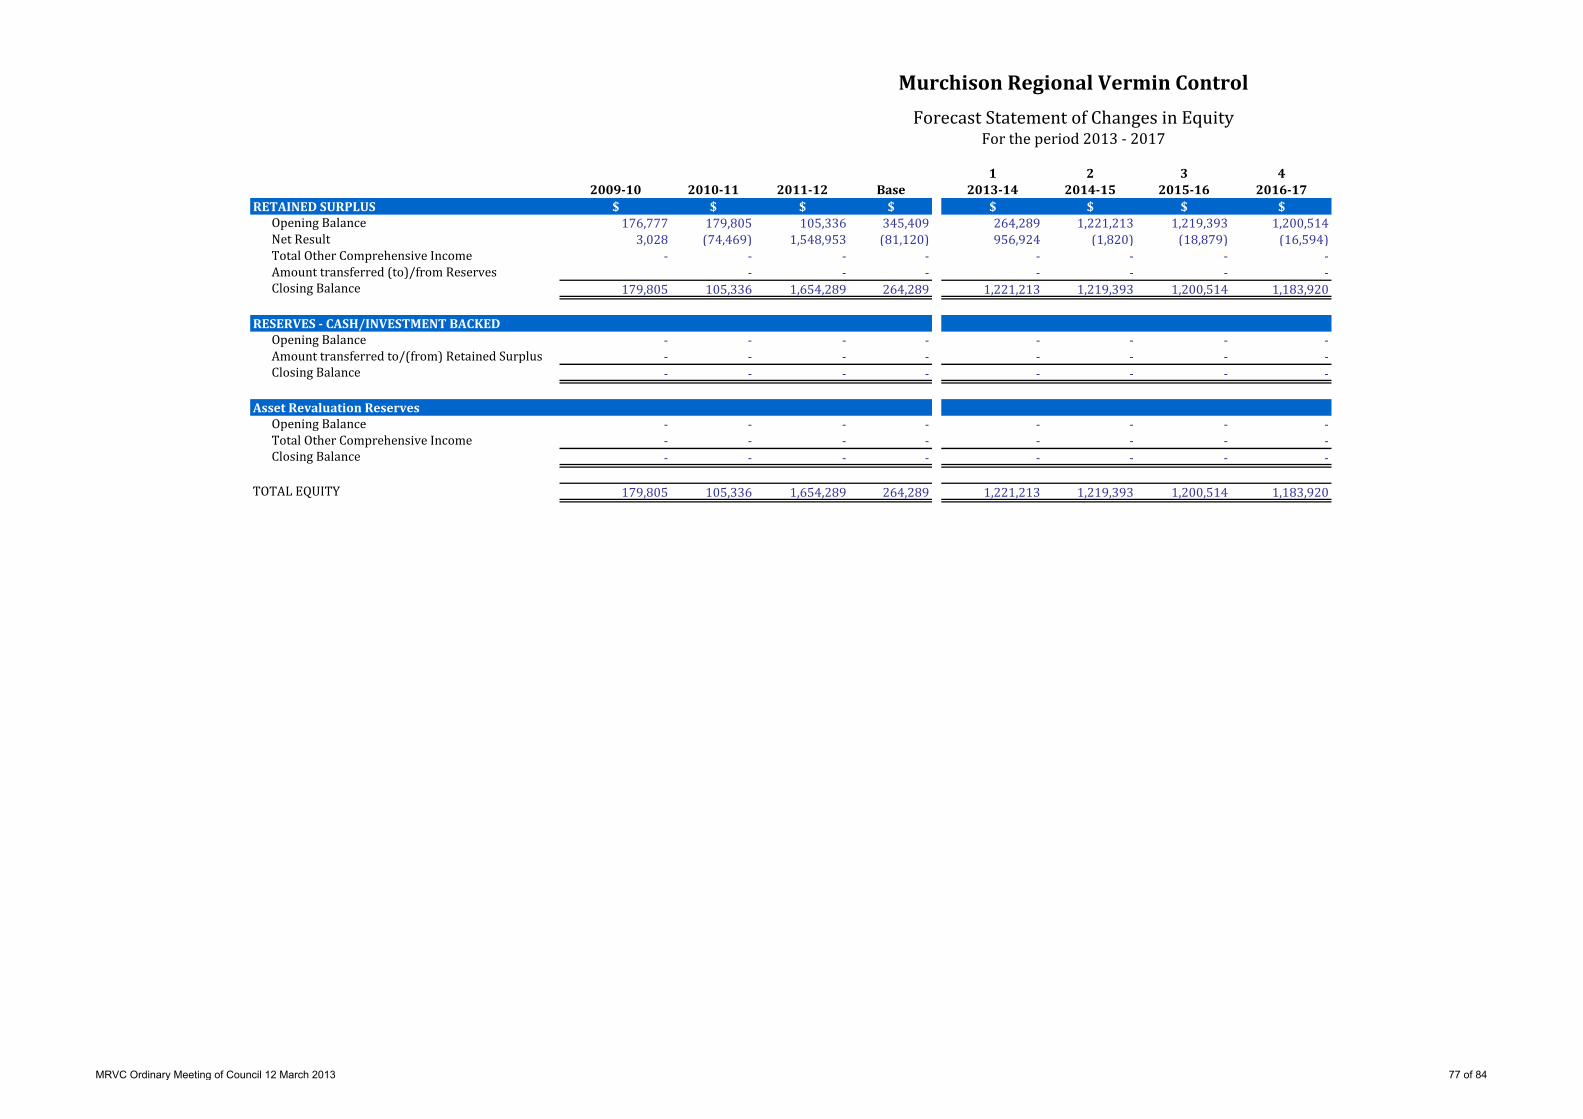
1 2 3 42009-10 2010-11 2011-12 Base 2013-14 2014-15 2015-16 2016-17
RETAINED SURPLUS $ $ $ $ $ $ $ $Opening Balance 176,777 179,805 105,336 345,409 264,289 1,221,213 1,219,393 1,200,514Net Result 3,028 (74,469) 1,548,953 (81,120) 956,924 (1,820) (18,879) (16,594)Total Other Comprehensive Income - - - - - - - -Amount transferred (to)/from Reserves - - - - - - -Closing Balance 179,805 105,336 1,654,289 264,289 1,221,213 1,219,393 1,200,514 1,183,920
RESERVES - CASH/INVESTMENT BACKEDOpening Balance - - - - - - - -Amount transferred to/(from) Retained Surplus - - - - - - - -Closing Balance - - - - - - - -
Asset Revaluation ReservesOpening Balance - - - - - - - -Total Other Comprehensive Income - - - - - - - -Closing Balance - - - - - - - -
TOTAL EQUITY 179,805 105,336 1,654,289 264,289 1,221,213 1,219,393 1,200,514 1,183,920
Murchison Regional Vermin ControlForecast Statement of Changes in Equity
For the period 2013 - 2017
MRVC Ordinary Meeting of Council 12 March 2013 77 of 84
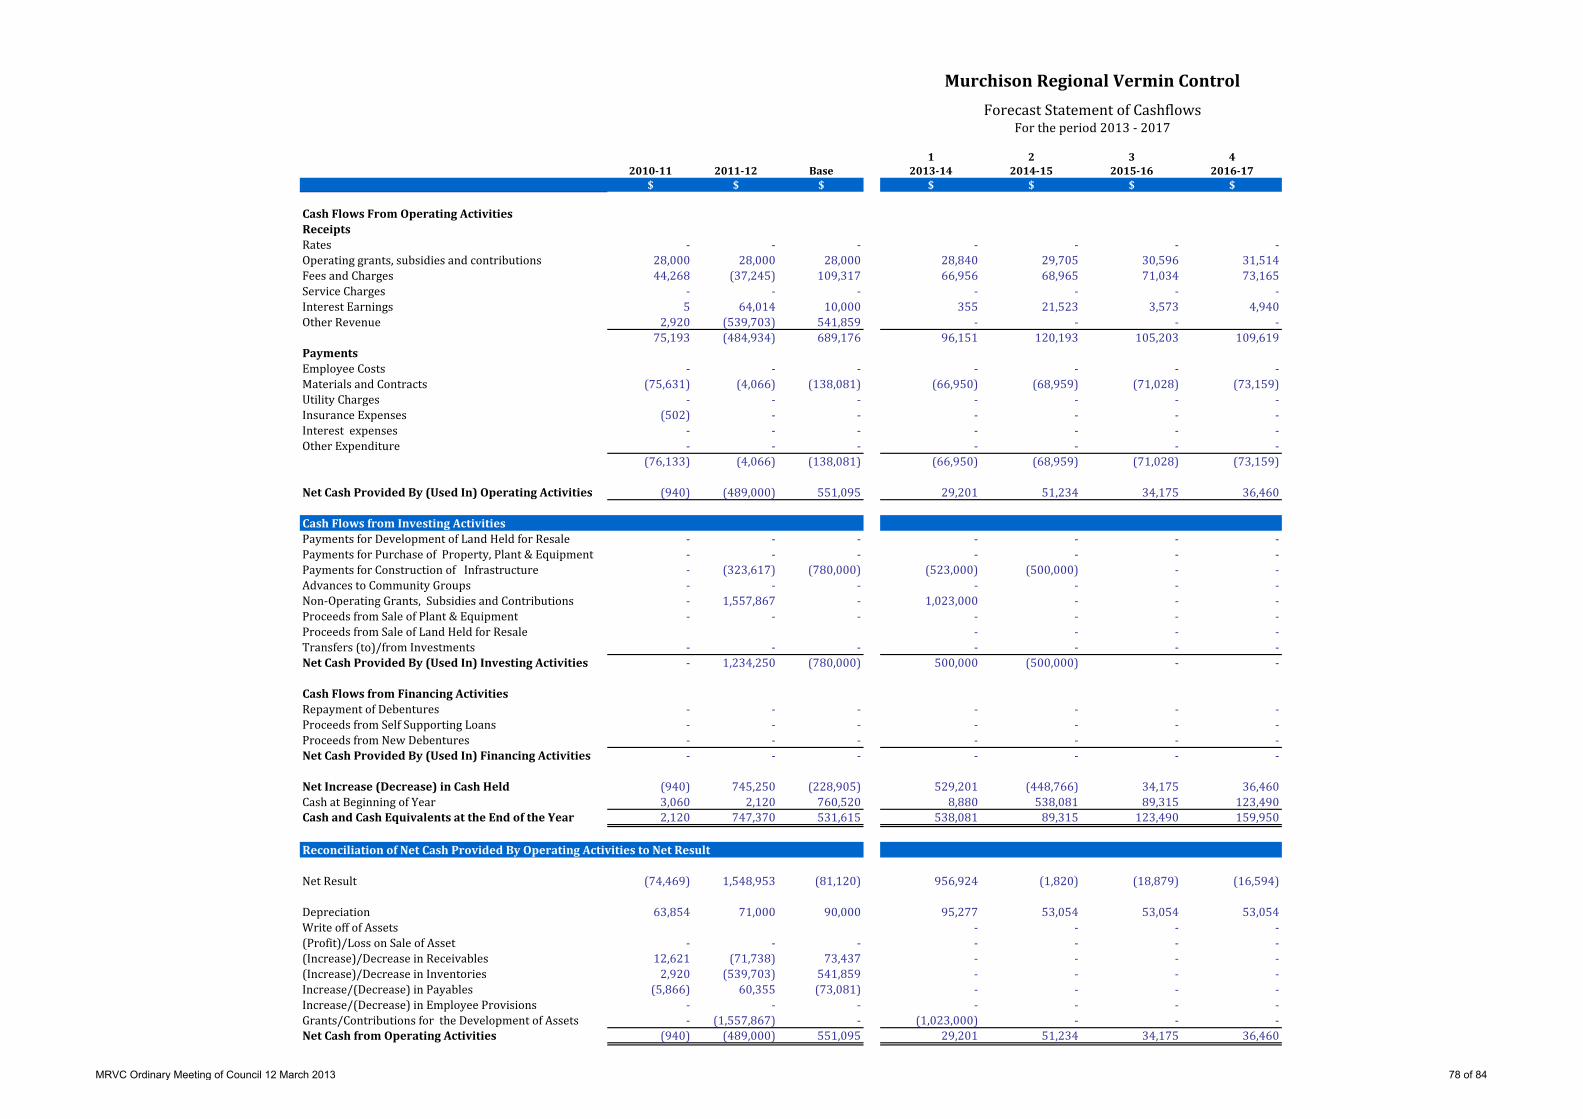
1 2 3 42010-11 2011-12 Base 2013-14 2014-15 2015-16 2016-17
$ $ $ $ $ $ $
Cash Flows From Operating ActivitiesReceiptsRates - - - - - - -Operating grants, subsidies and contributions 28,000 28,000 28,000 28,840 29,705 30,596 31,514Fees and Charges 44,268 (37,245) 109,317 66,956 68,965 71,034 73,165Service Charges - - - - - - -Interest Earnings 5 64,014 10,000 355 21,523 3,573 4,940Other Revenue 2,920 (539,703) 541,859 - - - -
75,193 (484,934) 689,176 96,151 120,193 105,203 109,619PaymentsEmployee Costs - - - - - - -Materials and Contracts (75,631) (4,066) (138,081) (66,950) (68,959) (71,028) (73,159)Utility Charges - - - - - - -Insurance Expenses (502) - - - - - -Interest expenses - - - - - - -Other Expenditure - - - - - - -
(76,133) (4,066) (138,081) (66,950) (68,959) (71,028) (73,159)
Net Cash Provided By (Used In) Operating Activities (940) (489,000) 551,095 29,201 51,234 34,175 36,460
Cash Flows from Investing ActivitiesPayments for Development of Land Held for Resale - - - - - - -Payments for Purchase of Property, Plant & Equipment - - - - - - -Payments for Construction of Infrastructure - (323,617) (780,000) (523,000) (500,000) - -Advances to Community Groups - - - - - - -Non-Operating Grants, Subsidies and Contributions - 1,557,867 - 1,023,000 - - -Proceeds from Sale of Plant & Equipment - - - - - - -Proceeds from Sale of Land Held for Resale - - - -Transfers (to)/from Investments - - - - - - -Net Cash Provided By (Used In) Investing Activities - 1,234,250 (780,000) 500,000 (500,000) - -
Cash Flows from Financing ActivitiesRepayment of Debentures - - - - - - -Proceeds from Self Supporting Loans - - - - - - -Proceeds from New Debentures - - - - - - -Net Cash Provided By (Used In) Financing Activities - - - - - - -
Net Increase (Decrease) in Cash Held (940) 745,250 (228,905) 529,201 (448,766) 34,175 36,460Cash at Beginning of Year 3,060 2,120 760,520 8,880 538,081 89,315 123,490Cash and Cash Equivalents at the End of the Year 2,120 747,370 531,615 538,081 89,315 123,490 159,950
Reconciliation of Net Cash Provided By Operating Activities to Net Result
Net Result (74,469) 1,548,953 (81,120) 956,924 (1,820) (18,879) (16,594)
Depreciation 63,854 71,000 90,000 95,277 53,054 53,054 53,054Write off of Assets - - - -(Profit)/Loss on Sale of Asset - - - - - - -(Increase)/Decrease in Receivables 12,621 (71,738) 73,437 - - - -(Increase)/Decrease in Inventories 2,920 (539,703) 541,859 - - - -Increase/(Decrease) in Payables (5,866) 60,355 (73,081) - - - -Increase/(Decrease) in Employee Provisions - - - - - - -Grants/Contributions for the Development of Assets - (1,557,867) - (1,023,000) - - -Net Cash from Operating Activities (940) (489,000) 551,095 29,201 51,234 34,175 36,460
Murchison Regional Vermin ControlForecast Statement of Cashflows
For the period 2013 - 2017
MRVC Ordinary Meeting of Council 12 March 2013 78 of 84

1 2 3 4
2010-11 2011-12 Base 2013-14 2014-15 2015-16 2016-17OPERATING $ $ $ $ $ $ $Revenues
Rates - - - - - - -Operating grants, subsidies and contributions 28,000 28,000 28,000 28,840 29,705 30,596 31,514Profit on Asset Disposal - - - - - - -Fees and charges 31,647 34,493 35,880 66,956 68,965 71,034 73,165Service charges - - - - - - -Interest earnings - General 5 64,014 10,000 355 21,523 3,573 4,940Interest earnings - Reserves - - - - - - -Other revenue - - - - - - -
59,652 126,507 73,880 96,151 120,193 105,203 109,619
ExpensesEmployee costs - - - - - - -Materials and contracts (69,765) (64,421) (65,000) (66,950) (68,959) (71,028) (73,159)Utility charges (electricity, gas, water etc.) - - - - - - -Depreciation on non-current assets (63,854) (71,000) (90,000) (95,277) (53,054) (53,054) (53,054)Loss on Asset Disposal - - - - - - -Interest Expense (502) - - - - - -Insurance expense - - - - - - -Other expenditure - - - - - - -
(134,121) (135,421) (155,000) (162,227) (122,013) (124,082) (126,213)NET OPERATIONS (74,469) (8,914) (81,120) (66,076) (1,820) (18,879) (16,594)
Funding Position AdjustmentsDepreciation on non-current assets 63,854 71,000 90,000 95,277 53,054 53,054 53,054Net profit and losses on Disposal - - - - - - -Movement in Accruals - - - - - - -Movement in Deferred Pensioner Rates (Non-Current) - - - -Movement in Employee Benefit Provisions - - - - - - -Write-off of assets - - - - - - -
FUNDING FROM GENERAL OPERATIONS (10,615) 62,086 8,880 29,201 51,234 34,175 36,460
CAPITAL
Asset Acquisitions and ConstructionPurchase of land held for resale - - - - - - -Purchase of Property Plant and Equipment - - - - - - -Infrastructure - (323,617) (780,000) (523,000) (500,000) - -Proceeds on Disposal - - - - - - -Non-Operating grants, subsidies and contributions - 1,557,867 - 1,023,000 - - -
NET FUNDING BEFORE FINANCING - 1,234,250 (780,000) 500,000 (500,000) - -
FinancingInflows
Transfer from Reserves - - - - - - -New Borrowings - - - - - - -Self Supporting Loan - - - - - - -
OutflowsTransfer to Reserves - - - - - - -Advances to Community Groups - - - - - - -Repayment of Past Borrowings - - - - - - -
NET FINANCING - - - - - - -
ACCOUNTING PERIOD BALANCESOpening Balance 3,864 (6,751) 1,289,585 8,880 538,081 89,315 123,490Closing Balance (6,751) 1,289,585 518,465 538,081 89,315 123,490 159,950
PROOF OF CLOSING POSITIONCURRENT ASSETS
Unrestricted Cash and Equivalents 3,060 2,120 760,520 8,880 538,081 89,315 123,490 159,950Restricted Cash and Cash Equivalent - - - - - - - -Non-Cash Investments - - - - - - - -Trade and Other Receivables 14,320 1,699 73,437 - - - - -Inventories 5,076 2,156 541,859 - - - - -
CURRENT LIABILITIESTrade and Other Payables (18,592) (12,726) (73,081) - - - - -Reserves - - - - - - - -Current Self Supporting Loans Receivable - - - - -Movement in Deferred Pensioner Rates (Non-Current) - - - -Movement in Accrued Salaries and Wages - - - -
3,864 (6,751) 1,302,735 8,880 538,081 89,315 123,490 159,950
Murchison Regional Vermin ControlForecast Statement of Funding
For the period 2013 - 2017
MRVC Ordinary Meeting of Council 12 March 2013 79 of 84
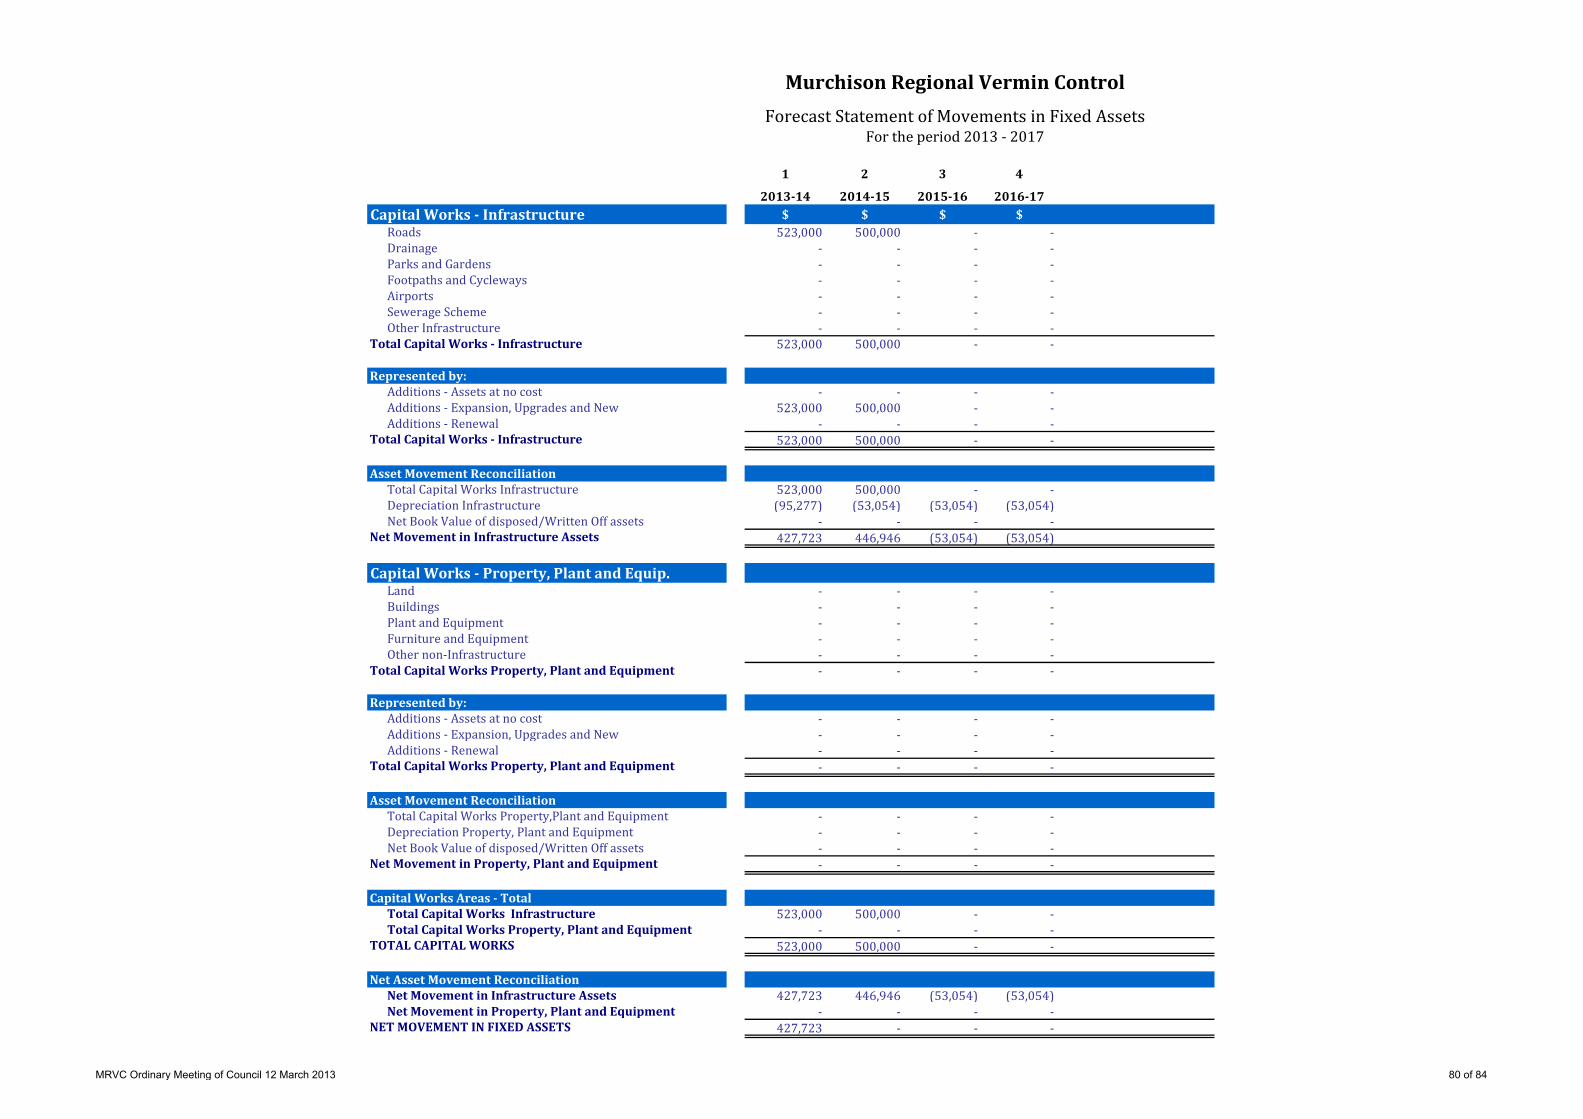
1 2 3 4
2013-14 2014-15 2015-16 2016-17Capital Works - Infrastructure $ $ $ $
Roads 523,000 500,000 - -Drainage - - - -Parks and Gardens - - - -Footpaths and Cycleways - - - -Airports - - - -Sewerage Scheme - - - -Other Infrastructure - - - -
Total Capital Works - Infrastructure 523,000 500,000 - -
Represented by:Additions - Assets at no cost - - - -Additions - Expansion, Upgrades and New 523,000 500,000 - -Additions - Renewal - - - -
Total Capital Works - Infrastructure 523,000 500,000 - -
Asset Movement Reconciliation Total Capital Works Infrastructure 523,000 500,000 - -Depreciation Infrastructure (95,277) (53,054) (53,054) (53,054)Net Book Value of disposed/Written Off assets - - - -
Net Movement in Infrastructure Assets 427,723 446,946 (53,054) (53,054)
Capital Works - Property, Plant and Equip.Land - - - -Buildings - - - -Plant and Equipment - - - -Furniture and Equipment - - - -Other non-Infrastructure - - - -
Total Capital Works Property, Plant and Equipment - - - -
Represented by:Additions - Assets at no cost - - - -Additions - Expansion, Upgrades and New - - - -Additions - Renewal - - - -
Total Capital Works Property, Plant and Equipment - - - -
Asset Movement ReconciliationTotal Capital Works Property,Plant and Equipment - - - -Depreciation Property, Plant and Equipment - - - -Net Book Value of disposed/Written Off assets - - - -
Net Movement in Property, Plant and Equipment - - - -
Capital Works Areas - TotalTotal Capital Works Infrastructure 523,000 500,000 - -Total Capital Works Property, Plant and Equipment - - - -
TOTAL CAPITAL WORKS 523,000 500,000 - -
Net Asset Movement Reconciliation Net Movement in Infrastructure Assets 427,723 446,946 (53,054) (53,054)Net Movement in Property, Plant and Equipment - - - -
NET MOVEMENT IN FIXED ASSETS 427,723 - - -
Murchison Regional Vermin ControlForecast Statement of Movements in Fixed Assets
For the period 2013 - 2017
MRVC Ordinary Meeting of Council 12 March 2013 80 of 84
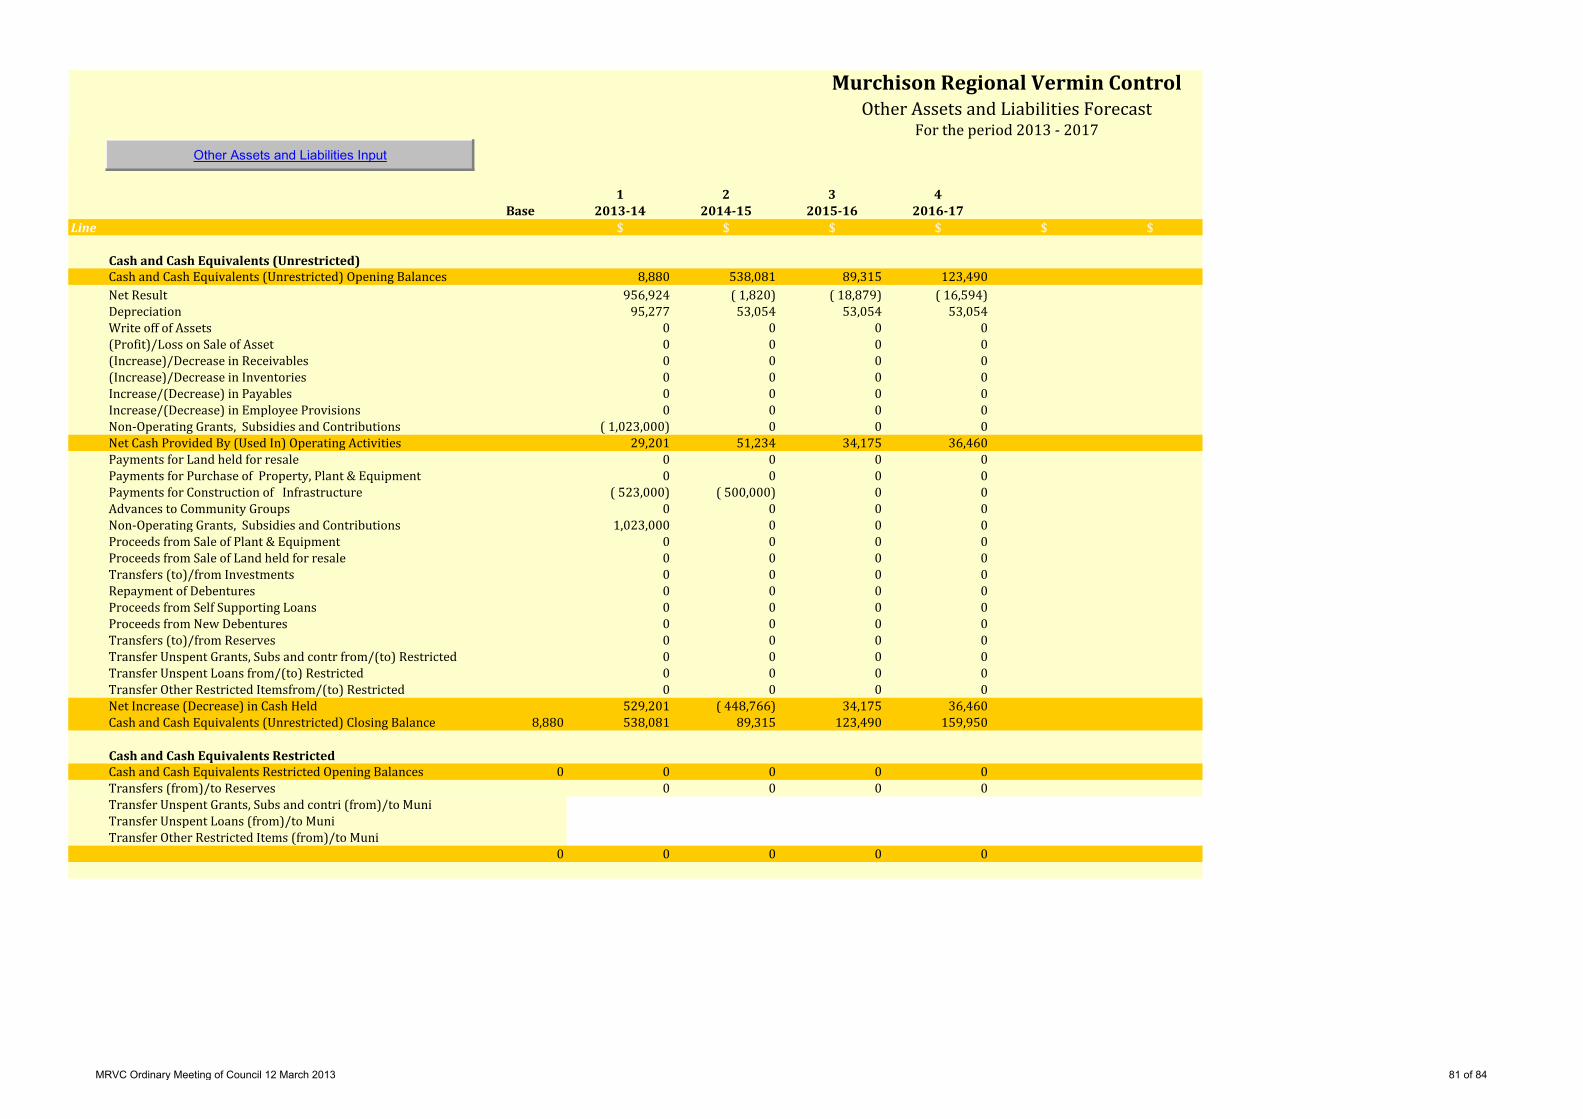
Other Assets and Liabilities Input
1 2 3 4Base 2013-14 2014-15 2015-16 2016-17
Line $ $ $ $ $ $
Cash and Cash Equivalents (Unrestricted) Cash and Cash Equivalents (Unrestricted) Opening Balances 8,880 538,081 89,315 123,490Net Result 956,924 ( 1,820) ( 18,879) ( 16,594)Depreciation 95,277 53,054 53,054 53,054Write off of Assets 0 0 0 0(Profit)/Loss on Sale of Asset 0 0 0 0(Increase)/Decrease in Receivables 0 0 0 0(Increase)/Decrease in Inventories 0 0 0 0Increase/(Decrease) in Payables 0 0 0 0Increase/(Decrease) in Employee Provisions 0 0 0 0Non-Operating Grants, Subsidies and Contributions ( 1,023,000) 0 0 0Net Cash Provided By (Used In) Operating Activities 29,201 51,234 34,175 36,460Payments for Land held for resale 0 0 0 0Payments for Purchase of Property, Plant & Equipment 0 0 0 0Payments for Construction of Infrastructure ( 523,000) ( 500,000) 0 0Advances to Community Groups 0 0 0 0Non-Operating Grants, Subsidies and Contributions 1,023,000 0 0 0Proceeds from Sale of Plant & Equipment 0 0 0 0Proceeds from Sale of Land held for resale 0 0 0 0Transfers (to)/from Investments 0 0 0 0Repayment of Debentures 0 0 0 0Proceeds from Self Supporting Loans 0 0 0 0Proceeds from New Debentures 0 0 0 0Transfers (to)/from Reserves 0 0 0 0Transfer Unspent Grants, Subs and contr from/(to) Restricted 0 0 0 0Transfer Unspent Loans from/(to) Restricted 0 0 0 0Transfer Other Restricted Itemsfrom/(to) Restricted 0 0 0 0Net Increase (Decrease) in Cash Held 529,201 ( 448,766) 34,175 36,460Cash and Cash Equivalents (Unrestricted) Closing Balance 8,880 538,081 89,315 123,490 159,950
Cash and Cash Equivalents Restricted Cash and Cash Equivalents Restricted Opening Balances 0 0 0 0 0Transfers (from)/to Reserves 0 0 0 0Transfer Unspent Grants, Subs and contri (from)/to MuniTransfer Unspent Loans (from)/to MuniTransfer Other Restricted Items (from)/to Muni
0 0 0 0 0
Murchison Regional Vermin ControlOther Assets and Liabilities Forecast
For the period 2013 - 2017
MRVC Ordinary Meeting of Council 12 March 2013 81 of 84
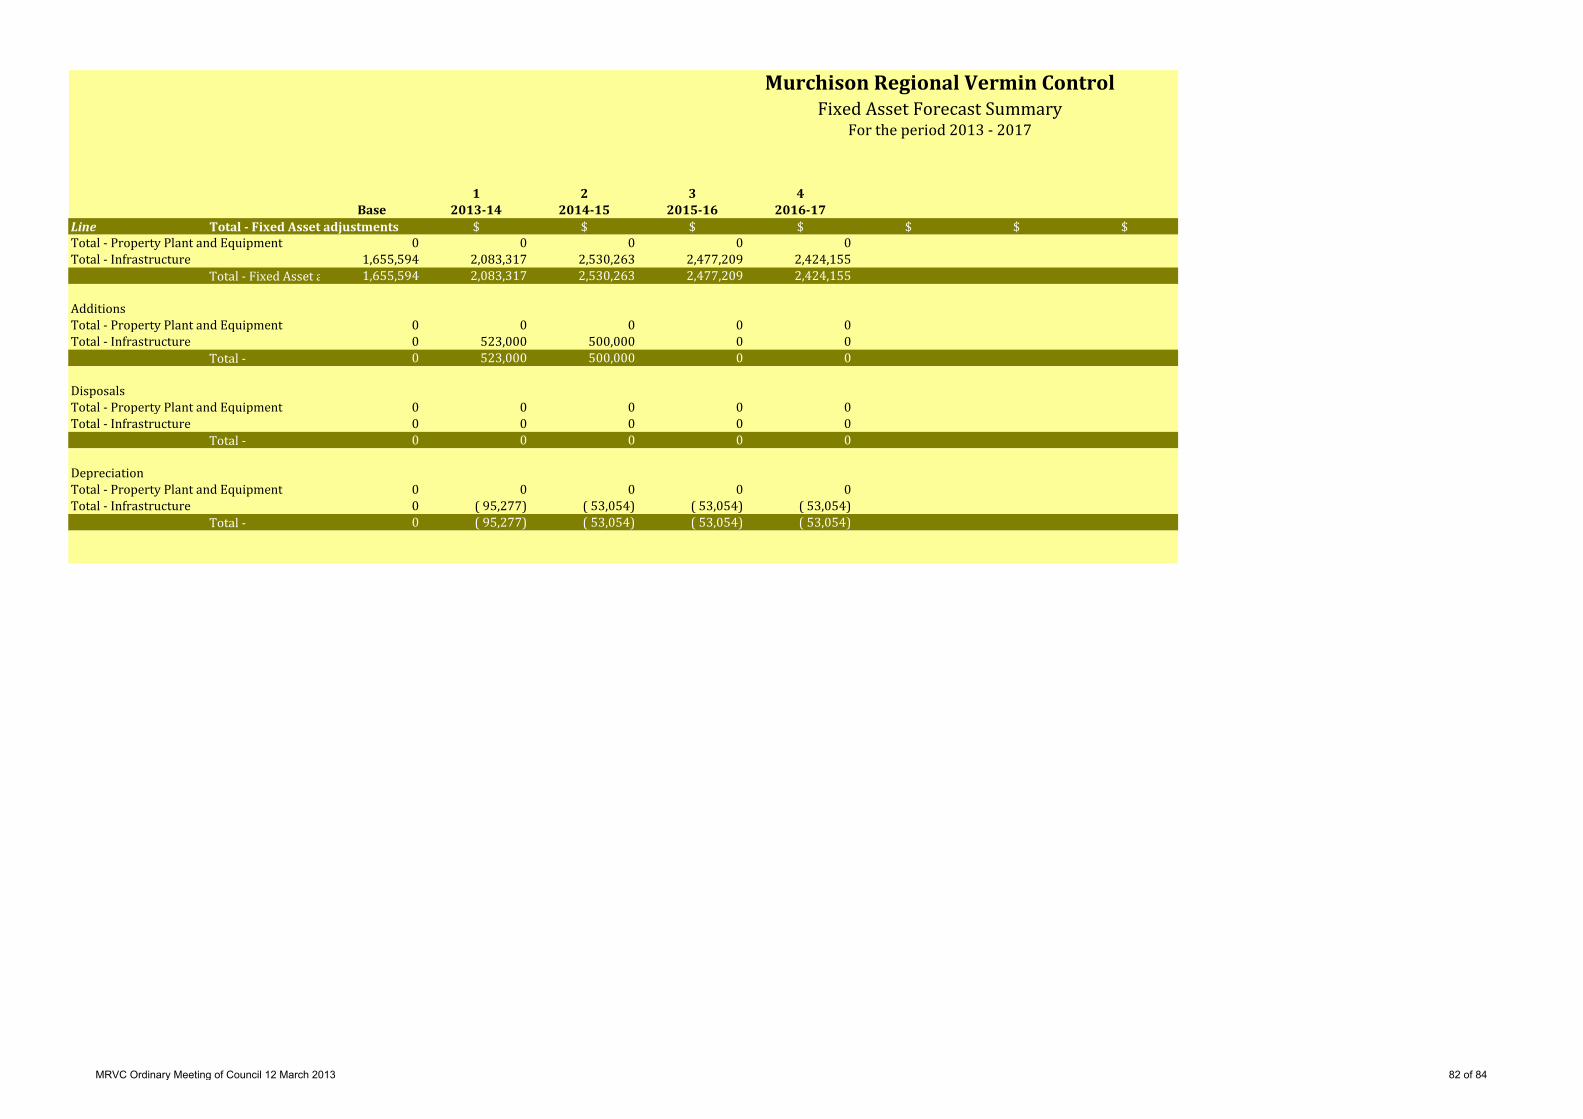
1 2 3 4Base 2013-14 2014-15 2015-16 2016-17
Line Total - Fixed Asset adjustments $ $ $ $ $ $ $Total - Property Plant and Equipment 0 0 0 0 0Total - Infrastructure 1,655,594 2,083,317 2,530,263 2,477,209 2,424,155
Total - Fixed Asset a 1,655,594 2,083,317 2,530,263 2,477,209 2,424,155
AdditionsTotal - Property Plant and Equipment 0 0 0 0 0Total - Infrastructure 0 523,000 500,000 0 0
Total - 0 523,000 500,000 0 0
DisposalsTotal - Property Plant and Equipment 0 0 0 0 0Total - Infrastructure 0 0 0 0 0
Total - 0 0 0 0 0
DepreciationTotal - Property Plant and Equipment 0 0 0 0 0Total - Infrastructure 0 ( 95,277) ( 53,054) ( 53,054) ( 53,054)
Total - 0 ( 95,277) ( 53,054) ( 53,054) ( 53,054)
Murchison Regional Vermin ControlFixed Asset Forecast Summary
For the period 2013 - 2017
MRVC Ordinary Meeting of Council 12 March 2013 82 of 84

Infrastructure Input
1 2 3 4Base 2013-14 2014-15 2015-16 2016-17
Line Total - Infrastructure $ $ $ $ $ $Infrastructure at cost/valuation 4,757,098 5,280,098 5,780,098 5,780,098 5,780,098 Accumulated Depreciation Infrastructure ( 3,101,504) ( 3,196,781) ( 3,249,835) ( 3,302,889) ( 3,355,943)Total - Infrastructure 1,655,594 2,083,317 2,530,263 2,477,209 2,424,155
Additions - Assets at no cost 0 0 0 0 0Additions - Expansion, Upgrades and New 0 523,000 500,000 0 0Additions - Renewal 0 0 0 0 0Total Additions 0 523,000 500,000 0 0
NBV of Disposals 0 0 0 0 0Write offs 0 0 0 0 0Depreciation Expense 0 ( 95,277) ( 53,054) ( 53,054) ( 53,054)
Line Infrastructure $ $ $ $ $ $1 Fences 3,127,393 3,127,393 3,127,393 3,127,393 3,127,393
Additions - Assets at no costAdditions - Expansion, Upgrades and NewAdditions - RenewalDisposals - CostDisposals - Accum Depr (enter as negative)Write offsFences Closing Balance 3,127,393 3,127,393 3,127,393 3,127,393 3,127,393
Accum. Deprec. -Fences (3,075,170) (3,075,170) (3,127,393) (3,127,393) (3,127,393)Depreciation Rate 2.00% 2.00% 2.00% 2.00%Depreciation Expense (52,223) 0 0 0Accum. Deprec. -Fences Closing Balance (3,075,170) (3,127,393) (3,127,393) (3,127,393) (3,127,393)
R4R Fence Additions 1,629,705 1,629,705 2,152,705 2,652,705 2,652,705 Additions - Assets at no costAdditions - Expansion, Upgrades and New 523,000 500,000 Additions - RenewalDisposals - CostDisposals - Accum Depr (enter as negative)Write offsR4R Fence Additions Closing Balance 1,629,705 2,152,705 2,652,705 2,652,705 2,652,705
Accum. Deprec. -R4R Fence Additions (26,334) (26,334) (69,388) (122,442) (175,496)Depreciation Rate 2.00% 2.00% 2.00% 2.00%Depreciation Expense (43,054) (53,054) (53,054) (53,054)Accum. Deprec. -R4R Fence Additions Closing Balance (26,334) (69,388) (122,442) (175,496) (228,550)
Murchison Regional Vermin ControlInfrastructure ForecastFor the period 2013 - 2017
MRVC Ordinary Meeting of Council 12 March 2013 83 of 84
13. MOTIONS OF WHICH PREVIOUS NOTICE HAS BEEN GIVEN
14. NOTICE OF MOTIONS FOR THE NEXT MEETING
15. CONFIDENTIAL BUSINESS
16. LATE AGENDA ITEMS
17. ELECTED MEMBER MATTERS
18. NEXT MEETING
19. CLOSURE OF MEETING
MRVC Ordinary Meeting of Council 12 March 2013 84 of 84


