Ahlstrom Financial Statements 2016 &
Interim report Q4/2016
Sakari Ahdekivi
Interim President & CEO
January 27, 2017
Agenda
- Full-year 2016 & Q4/2016 in brief
- Quarterly business area reviews
- Financials
2
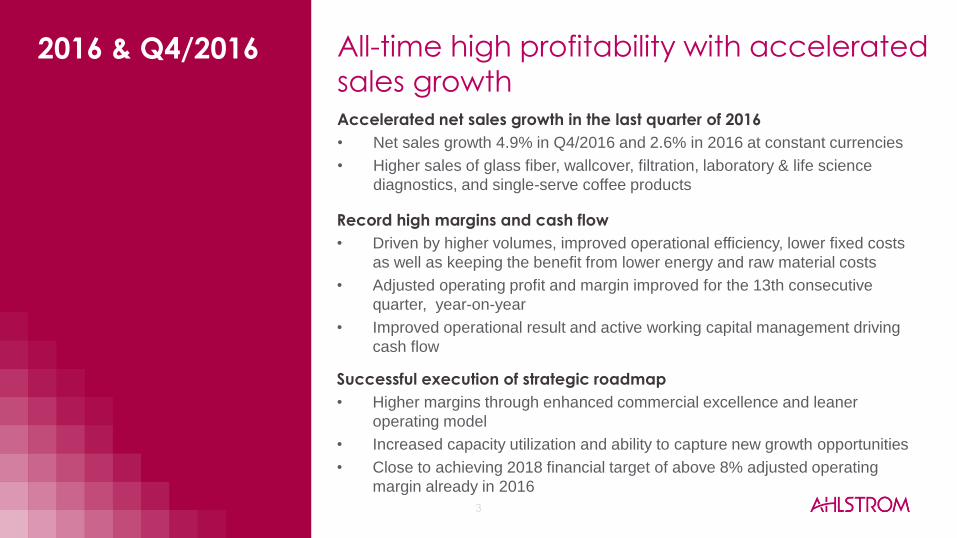
All-time high profitability with accelerated
sales growth
3
Record high margins and cash flow
• Driven by higher volumes, improved operational efficiency, lower fixed costs
as well as keeping the benefit from lower energy and raw material costs
• Adjusted operating profit and margin improved for the 13th consecutive
quarter, year-on-year
• Improved operational result and active working capital management driving
cash flow
Accelerated net sales growth in the last quarter of 2016
• Net sales growth 4.9% in Q4/2016 and 2.6% in 2016 at constant currencies
• Higher sales of glass fiber, wallcover, filtration, laboratory & life science
diagnostics, and single-serve coffee products
Successful execution of strategic roadmap
• Higher margins through enhanced commercial excellence and leaner
operating model
• Increased capacity utilization and ability to capture new growth opportunities
• Close to achieving 2018 financial target of above 8% adjusted operating
margin already in 2016
2016 & Q4/2016
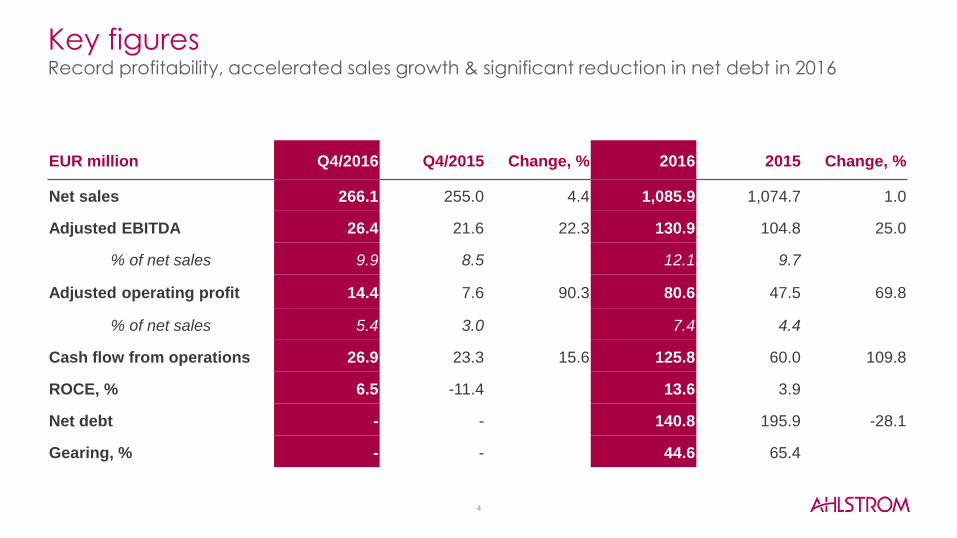
Key figures Record profitability, accelerated sales growth & significant reduction in net debt in 2016
EUR million Q4/2016 Q4/2015 Change, % 2016 2015 Change, %
Net sales 266.1 255.0 4.4 1,085.9 1,074.7 1.0
Adjusted EBITDA 26.4 21.6 22.3 130.9 104.8 25.0
% of net sales 9.9 8.5 12.1 9.7
Adjusted operating profit 14.4 7.6 90.3 80.6 47.5 69.8
% of net sales 5.4 3.0 7.4 4.4
Cash flow from operations 26.9 23.3 15.6 125.8 60.0 109.8
ROCE, % 6.5 -11.4 13.6 3.9
Net debt - - 140.8 195.9 -28.1
Gearing, % - - 44.6 65.4
4
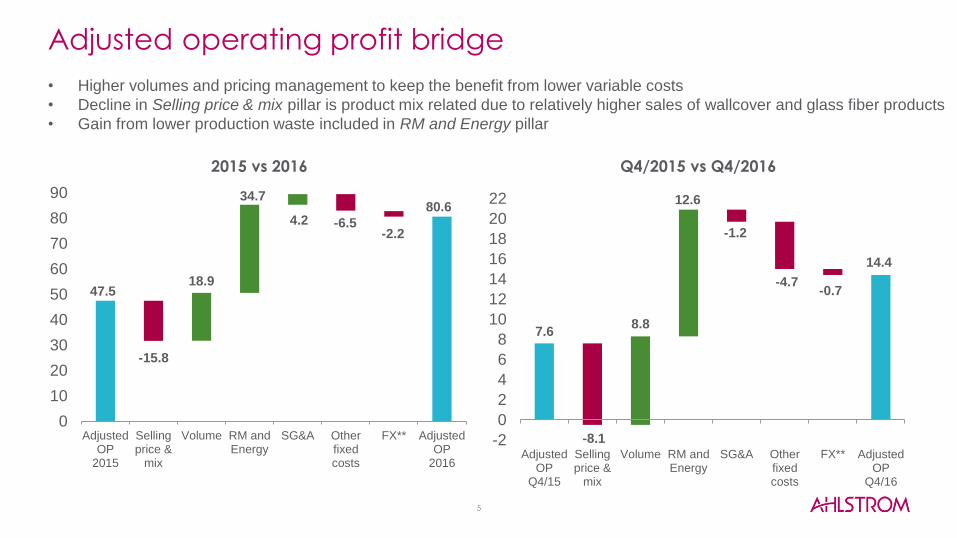
Adjusted operating profit bridge
Q4/2015 vs Q4/2016 2015 vs 2016
5
7.6
14.4
-8.1
8.8
12.6
-1.2
-4.7 -0.7
-2
0
2
4
6
8
10
12
14
16
18
20
22
AdjustedOP
Q4/15
Sellingprice &
mix
Volume RM andEnergy
SG&A Otherfixedcosts
FX** AdjustedOP
Q4/16
47.5
80.6
-15.8
18.9
34.7
4.2 -6.5 -2.2
0
10
20
30
40
50
60
70
80
90
AdjustedOP
2015
Sellingprice &
mix
Volume RM andEnergy
SG&A Otherfixedcosts
FX** AdjustedOP
2016
• Higher volumes and pricing management to keep the benefit from lower variable costs
• Decline in Selling price & mix pillar is product mix related due to relatively higher sales of wallcover and glass fiber products
• Gain from lower production waste included in RM and Energy pillar
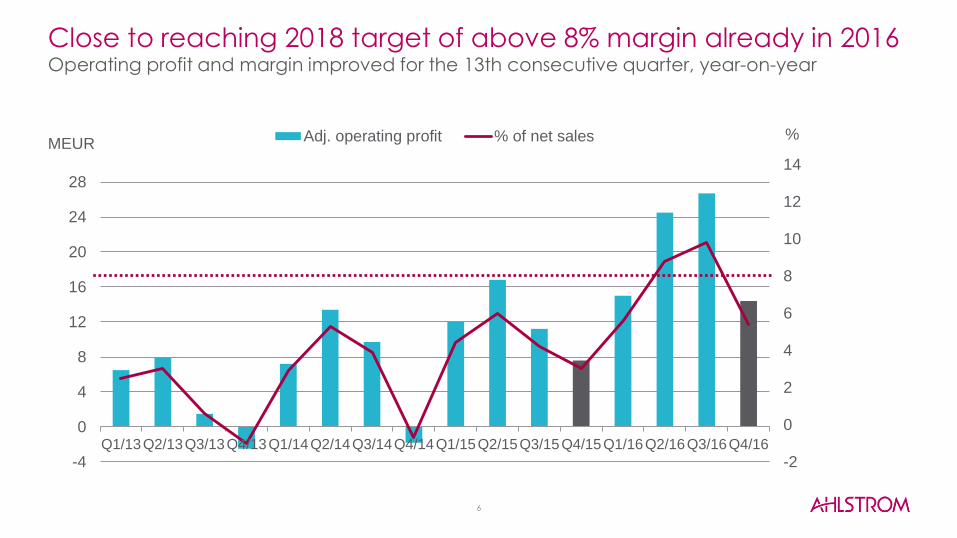
Close to reaching 2018 target of above 8% margin already in 2016 Operating profit and margin improved for the 13th consecutive quarter, year-on-year
6
-2
0
2
4
6
8
10
12
14
-4
0
4
8
12
16
20
24
28
Q1/13Q2/13Q3/13Q4/13Q1/14Q2/14Q3/14Q4/14Q1/15Q2/15Q3/15Q4/15Q1/16Q2/16Q3/16Q4/16
Adj. operating profit % of net salesMEUR
%
7
QUARTERLY BUSINESS AREA REVIEWS
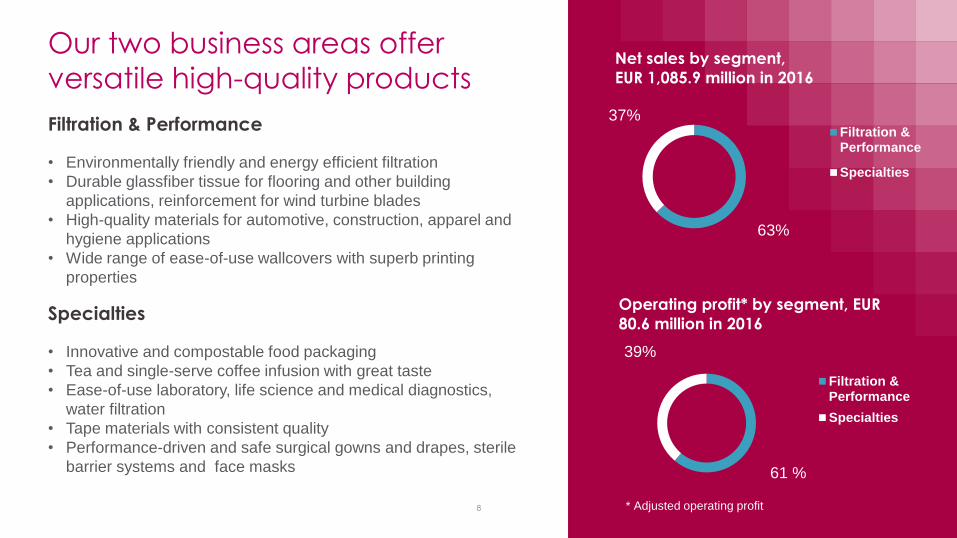
Our two business areas offer
versatile high-quality products
8
63%
37%
Net sales by segment,
EUR 1,085.9 million in 2016
Filtration &Performance
Specialties
61 %
39%
Operating profit* by segment, EUR
80.6 million in 2016
Filtration &Performance
Specialties
* Adjusted operating profit
Specialties
• Innovative and compostable food packaging
• Tea and single-serve coffee infusion with great taste
• Ease-of-use laboratory, life science and medical diagnostics,
water filtration
• Tape materials with consistent quality
• Performance-driven and safe surgical gowns and drapes, sterile
barrier systems and face masks
Filtration & Performance
• Environmentally friendly and energy efficient filtration
• Durable glassfiber tissue for flooring and other building
applications, reinforcement for wind turbine blades
• High-quality materials for automotive, construction, apparel and
hygiene applications
• Wide range of ease-of-use wallcovers with superb printing
properties
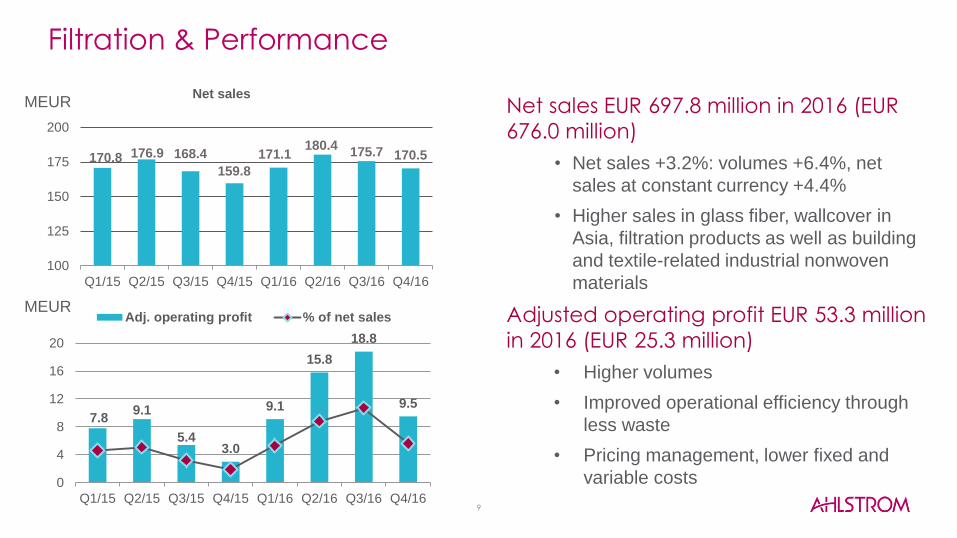
Filtration & Performance
Net sales EUR 697.8 million in 2016 (EUR
676.0 million)
• Net sales +3.2%: volumes +6.4%, net
sales at constant currency +4.4%
• Higher sales in glass fiber, wallcover in
Asia, filtration products as well as building
and textile-related industrial nonwoven
materials
Adjusted operating profit EUR 53.3 million
in 2016 (EUR 25.3 million)
• Higher volumes
• Improved operational efficiency through
less waste
• Pricing management, lower fixed and
variable costs
MEUR
MEUR
170.8 176.9 168.4
159.8
171.1 180.4
175.7 170.5
100
125
150
175
200
Q1/15 Q2/15 Q3/15 Q4/15 Q1/16 Q2/16 Q3/16 Q4/16
Net sales
7.8 9.1
5.4 3.0
9.1
15.8
18.8
9.5
0
4
8
12
16
20
Q1/15 Q2/15 Q3/15 Q4/15 Q1/16 Q2/16 Q3/16 Q4/16
Adj. operating profit % of net sales
9
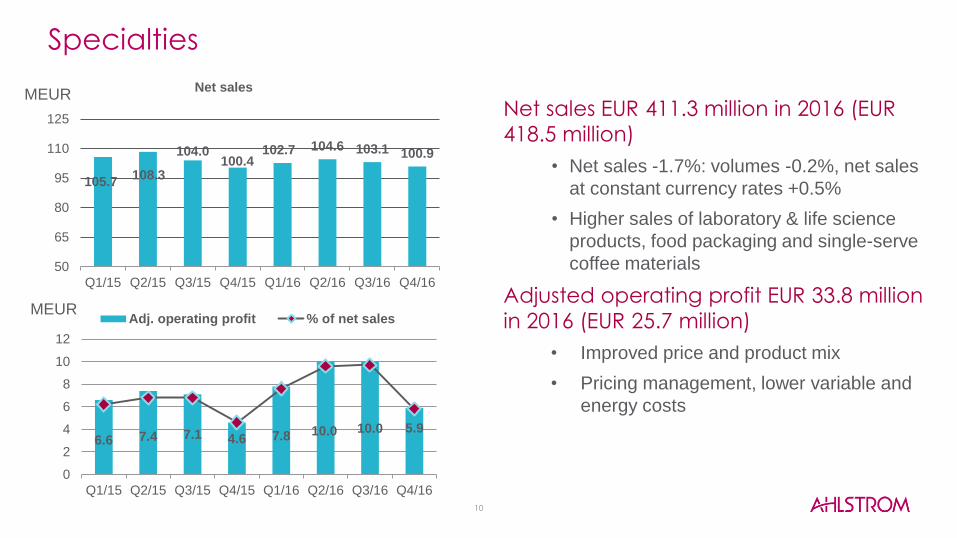
Specialties
Net sales EUR 411.3 million in 2016 (EUR
418.5 million)
• Net sales -1.7%: volumes -0.2%, net sales
at constant currency rates +0.5%
• Higher sales of laboratory & life science
products, food packaging and single-serve
coffee materials
Adjusted operating profit EUR 33.8 million
in 2016 (EUR 25.7 million)
• Improved price and product mix
• Pricing management, lower variable and
energy costs
MEUR
MEUR
105.7 108.3
104.0 100.4
102.7 104.6 103.1 100.9
50
65
80
95
110
125
Q1/15 Q2/15 Q3/15 Q4/15 Q1/16 Q2/16 Q3/16 Q4/16
Net sales
6.6 7.4 7.1 4.6 7.8 10.0 10.0 5.9
0
2
4
6
8
10
12
Q1/15 Q2/15 Q3/15 Q4/15 Q1/16 Q2/16 Q3/16 Q4/16
Adj. operating profit % of net sales
10

FINANCIALS
11
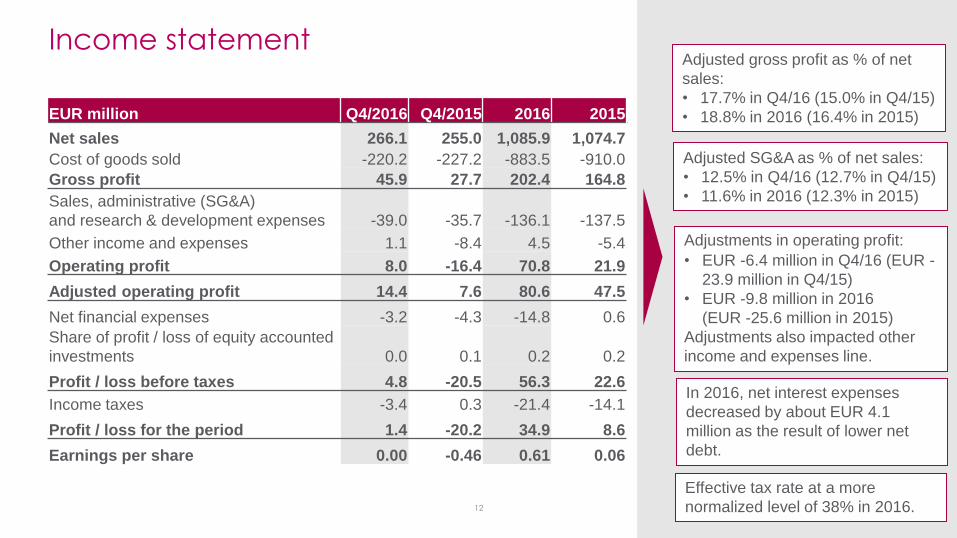
Income statement
EUR million Q4/2016 Q4/2015 2016 2015
Net sales 266.1 255.0 1,085.9 1,074.7
Cost of goods sold -220.2 -227.2 -883.5 -910.0
Gross profit 45.9 27.7 202.4 164.8
Sales, administrative (SG&A)
and research & development expenses -39.0 -35.7 -136.1 -137.5
Other income and expenses 1.1 -8.4 4.5 -5.4
Operating profit 8.0 -16.4 70.8 21.9
Adjusted operating profit 14.4 7.6 80.6 47.5
Net financial expenses -3.2 -4.3 -14.8 0.6
Share of profit / loss of equity accounted
investments 0.0 0.1 0.2 0.2
Profit / loss before taxes 4.8 -20.5 56.3 22.6
Income taxes -3.4 0.3 -21.4 -14.1
Profit / loss for the period 1.4 -20.2 34.9 8.6
Earnings per share 0.00 -0.46 0.61 0.06
Adjustments in operating profit:
• EUR -6.4 million in Q4/16 (EUR -
23.9 million in Q4/15)
• EUR -9.8 million in 2016
(EUR -25.6 million in 2015)
Adjustments also impacted other
income and expenses line.
Adjusted SG&A as % of net sales:
• 12.5% in Q4/16 (12.7% in Q4/15)
• 11.6% in 2016 (12.3% in 2015)
In 2016, net interest expenses
decreased by about EUR 4.1
million as the result of lower net
debt.
Adjusted gross profit as % of net
sales:
• 17.7% in Q4/16 (15.0% in Q4/15)
• 18.8% in 2016 (16.4% in 2015)
12
Effective tax rate at a more
normalized level of 38% in 2016.
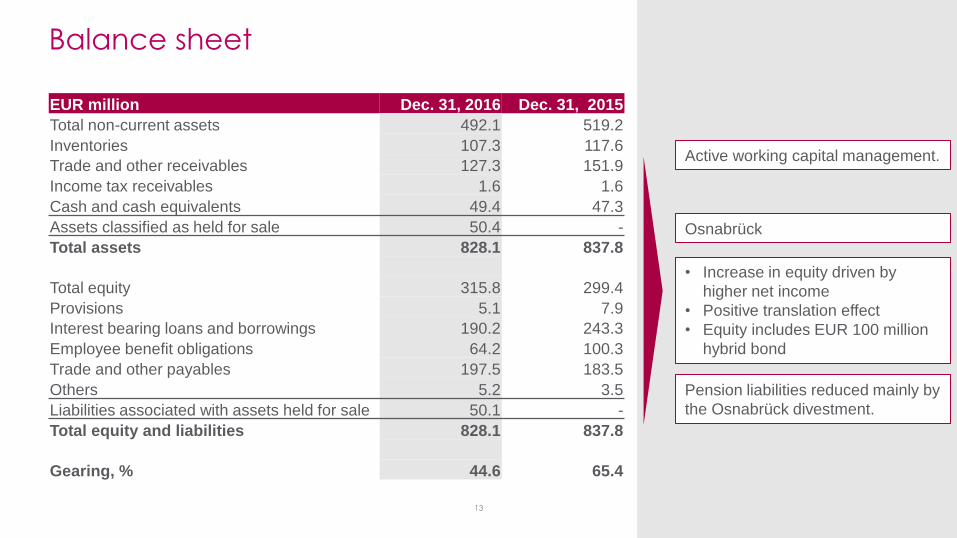
EUR million Dec. 31, 2016 Dec. 31, 2015
Total non-current assets 492.1 519.2
Inventories 107.3 117.6
Trade and other receivables 127.3 151.9
Income tax receivables 1.6 1.6
Cash and cash equivalents 49.4 47.3
Assets classified as held for sale 50.4 -
Total assets 828.1 837.8
Total equity 315.8 299.4
Provisions 5.1 7.9
Interest bearing loans and borrowings 190.2 243.3
Employee benefit obligations 64.2 100.3
Trade and other payables 197.5 183.5
Others 5.2 3.5
Liabilities associated with assets held for sale 50.1 -
Total equity and liabilities 828.1 837.8
Gearing, % 44.6 65.4
Balance sheet
• Increase in equity driven by
higher net income
• Positive translation effect
• Equity includes EUR 100 million
hybrid bond
13
Active working capital management.
Osnabrück
Pension liabilities reduced mainly by
the Osnabrück divestment.

Active management of operating working
capital
• 12-month rolling turnover rate
fell by eight days to 37 days
from Q4/2015
• The divestment of Osnabrück
reduced operating working
capital by about EUR 7.3
million
120.5 125.6 129.0
108.9
126.4 135.4
124.7 113.8 115.0
100.4 99.4
89.8
15
20
25
30
35
40
45
50
0
25
50
75
100
125
150
175
Q1/14 Q2/14 Q3/14 Q4/14 Q1/15 Q2/15 Q3/15 Q4/15 Q1/15 Q2/16 Q3/16 Q4/16
Days MEUR
Operating working capital* Turnover rate in days * Operating working capital = Accounts
receivables + inventories – accounts payable
14
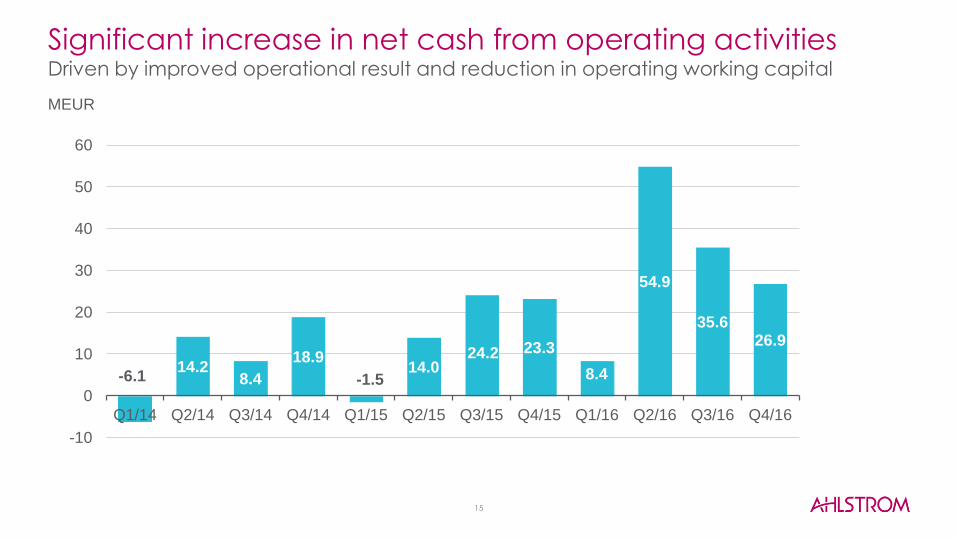
Significant increase in net cash from operating activities Driven by improved operational result and reduction in operating working capital
-6.1 14.2
8.4
18.9
-1.5 14.0
24.2 23.3
8.4
54.9
35.6 26.9
-10
0
10
20
30
40
50
60
Q1/14 Q2/14 Q3/14 Q4/14 Q1/15 Q2/15 Q3/15 Q4/15 Q1/16 Q2/16 Q3/16 Q4/16
15
MEUR
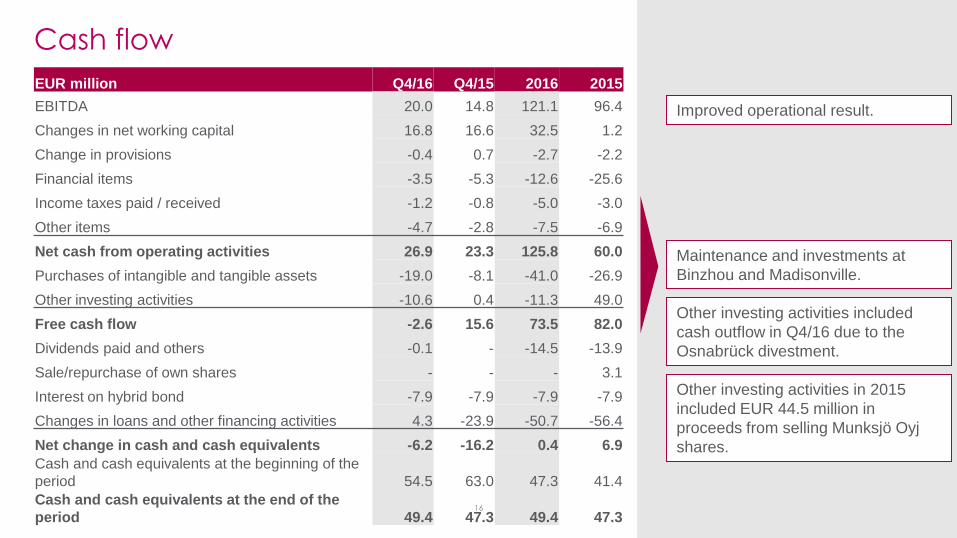
EUR million Q4/16 Q4/15 2016 2015
EBITDA 20.0 14.8 121.1 96.4
Changes in net working capital 16.8 16.6 32.5 1.2
Change in provisions -0.4 0.7 -2.7 -2.2
Financial items -3.5 -5.3 -12.6 -25.6
Income taxes paid / received -1.2 -0.8 -5.0 -3.0
Other items -4.7 -2.8 -7.5 -6.9
Net cash from operating activities 26.9 23.3 125.8 60.0
Purchases of intangible and tangible assets -19.0 -8.1 -41.0 -26.9
Other investing activities -10.6 0.4 -11.3 49.0
Free cash flow -2.6 15.6 73.5 82.0
Dividends paid and others -0.1 - -14.5 -13.9
Sale/repurchase of own shares - - - 3.1
Interest on hybrid bond -7.9 -7.9 -7.9 -7.9
Changes in loans and other financing activities 4.3 -23.9 -50.7 -56.4
Net change in cash and cash equivalents -6.2 -16.2 0.4 6.9
Cash and cash equivalents at the beginning of the
period 54.5 63.0 47.3 41.4
Cash and cash equivalents at the end of the
period 49.4 47.3 49.4 47.3
Cash flow
Maintenance and investments at
Binzhou and Madisonville.
Other investing activities in 2015
included EUR 44.5 million in
proceeds from selling Munksjö Oyj
shares.
16
Improved operational result.
Other investing activities included
cash outflow in Q4/16 due to the
Osnabrück divestment.
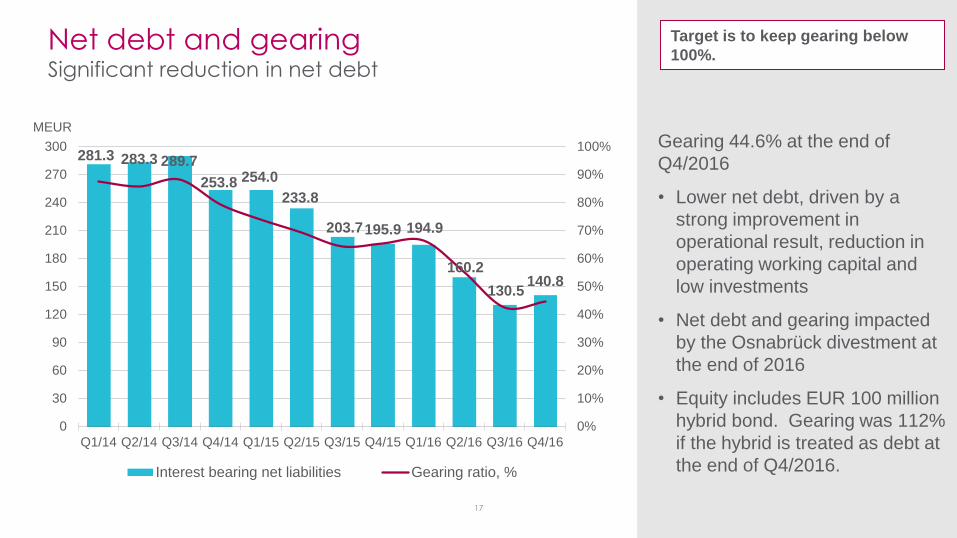
Net debt and gearing Significant reduction in net debt
281.3 283.3 289.7
253.8 254.0
233.8
203.7 195.9 194.9
160.2
130.5 140.8
0%
10%
20%
30%
40%
50%
60%
70%
80%
90%
100%
0
30
60
90
120
150
180
210
240
270
300
Q1/14 Q2/14 Q3/14 Q4/14 Q1/15 Q2/15 Q3/15 Q4/15 Q1/16 Q2/16 Q3/16 Q4/16
MEUR
Interest bearing net liabilities Gearing ratio, %
Gearing 44.6% at the end of
Q4/2016
• Lower net debt, driven by a
strong improvement in
operational result, reduction in
operating working capital and
low investments
• Net debt and gearing impacted
by the Osnabrück divestment at
the end of 2016
• Equity includes EUR 100 million
hybrid bond. Gearing was 112%
if the hybrid is treated as debt at
the end of Q4/2016.
17
Target is to keep gearing below
100%.
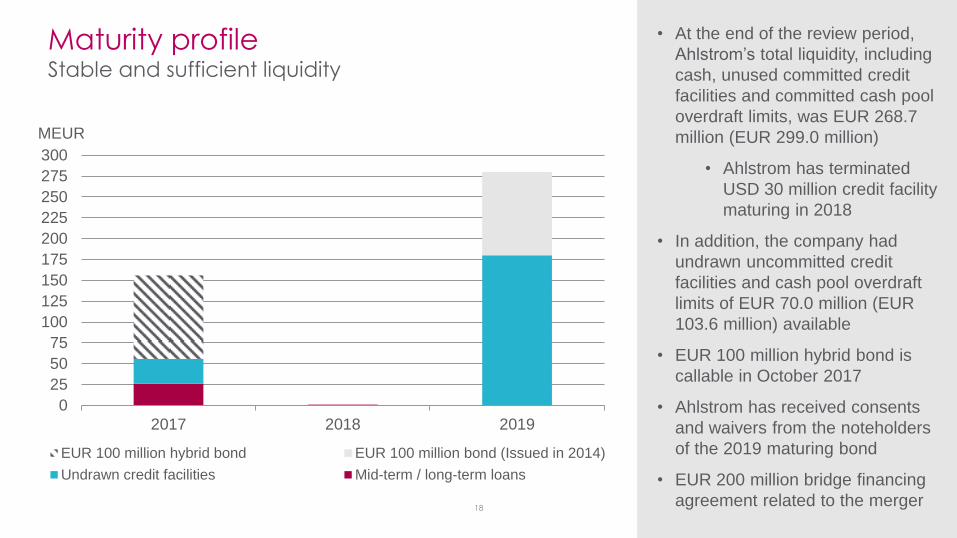
Maturity profile Stable and sufficient liquidity
• At the end of the review period,
Ahlstrom’s total liquidity, including
cash, unused committed credit
facilities and committed cash pool
overdraft limits, was EUR 268.7
million (EUR 299.0 million)
• Ahlstrom has terminated
USD 30 million credit facility
maturing in 2018
• In addition, the company had
undrawn uncommitted credit
facilities and cash pool overdraft
limits of EUR 70.0 million (EUR
103.6 million) available
• EUR 100 million hybrid bond is
callable in October 2017
• Ahlstrom has received consents
and waivers from the noteholders
of the 2019 maturing bond
• EUR 200 million bridge financing
agreement related to the merger
0
25
50
75
100
125
150
175
200
225
250
275
300
2017 2018 2019
EUR 100 million hybrid bond EUR 100 million bond (Issued in 2014)
Undrawn credit facilities Mid-term / long-term loans
MEUR
18
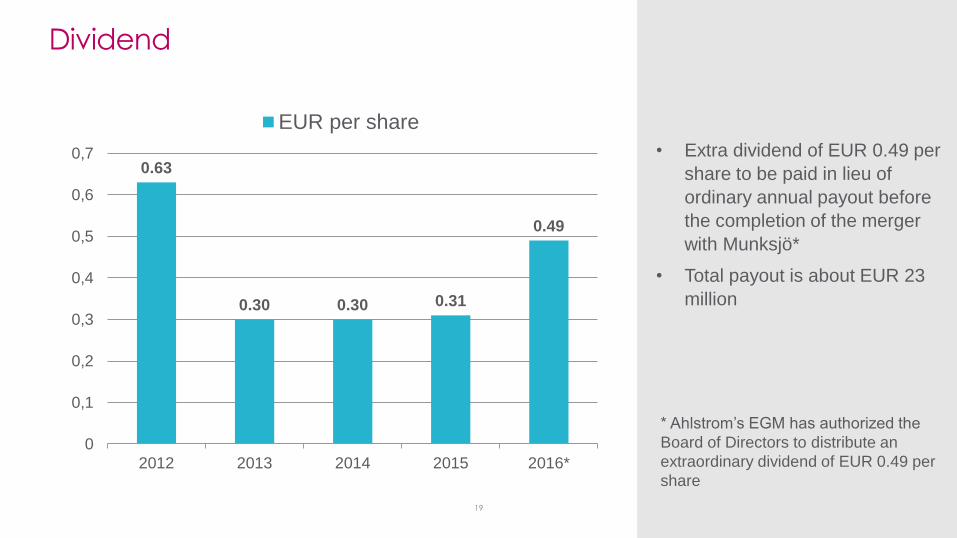
Dividend
• Extra dividend of EUR 0.49 per
share to be paid in lieu of
ordinary annual payout before
the completion of the merger
with Munksjö*
• Total payout is about EUR 23
million
19
0.63
0.30 0.30 0.31
0.49
0
0,1
0,2
0,3
0,4
0,5
0,6
0,7
2012 2013 2014 2015 2016*
EUR per share
* Ahlstrom’s EGM has authorized the
Board of Directors to distribute an
extraordinary dividend of EUR 0.49 per
share
Thank You!


