
AIRASIA X
FIRST QUARTER 2016 FINANCIAL RESULTS
24th May 2016
DISCLAIMER
2
Information contained in our presentation is intended solely for your reference. Such information is subject to change without notice, its accuracy is not guaranteed and it may not contain all material information concerning the Company. Neither we nor our advisors make any representation regarding, and assumes no responsibility or liability for, the accuracy or completeness of, any errors or omissions in, any information contained herein. In addition, the information may contain projections and forward-looking statements that reflect the company’s current views with respect to future events and financial performance. These views are based on current assumptions which are subject to various risk factors and which may change over time. No assurance can be given that future events will occur, that projections will be achieved, or that the company’s assumptions are correct. Actual results may differ materially from those projected. This presentation is strictly not to be distributed without the explicit consent of the Company’s management under any circumstances.
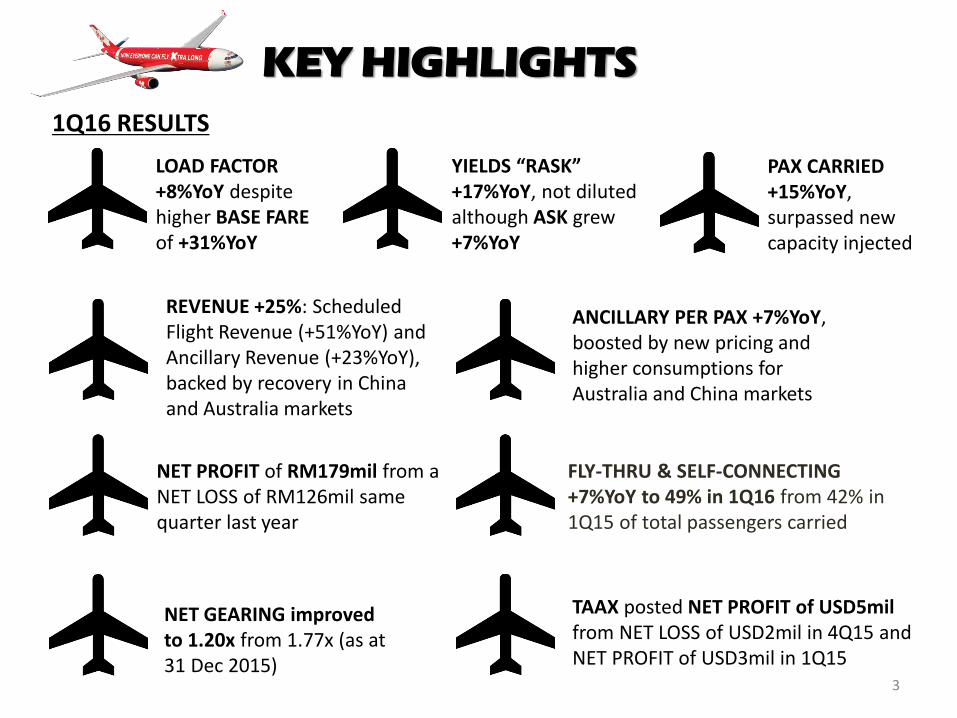
1Q16 RESULTS
KEY HIGHLIGHTS
ANCILLARY PER PAX +7%YoY, boosted by new pricing and higher consumptions for Australia and China markets
LOAD FACTOR +8%YoY despite higher BASE FARE of +31%YoY
PAX CARRIED +15%YoY, surpassed new capacity injected
YIELDS “RASK” +17%YoY, not diluted although ASK grew +7%YoY
NET GEARING improved to 1.20x from 1.77x (as at 31 Dec 2015)
REVENUE +25%: Scheduled Flight Revenue (+51%YoY) and Ancillary Revenue (+23%YoY), backed by recovery in China and Australia markets
NET PROFIT of RM179mil from a NET LOSS of RM126mil same quarter last year
TAAX posted NET PROFIT of USD5mil from NET LOSS of USD2mil in 4Q15 and NET PROFIT of USD3mil in 1Q15
3
FLY-THRU & SELF-CONNECTING +7%YoY to 49% in 1Q16 from 42% in 1Q15 of total passengers carried
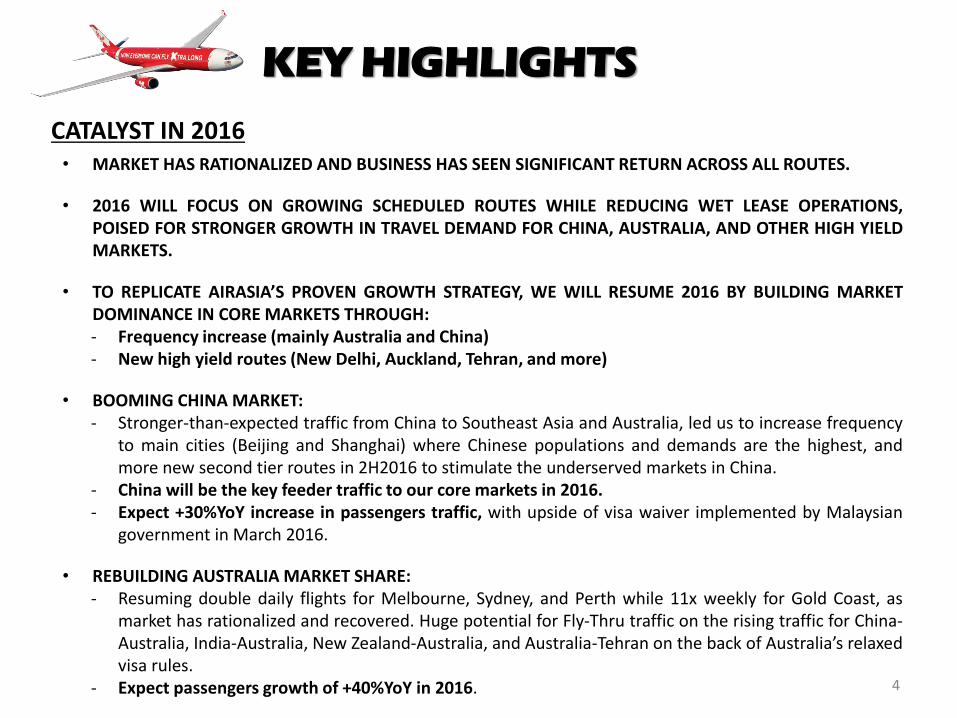
CATALYST IN 2016
4
• MARKET HAS RATIONALIZED AND BUSINESS HAS SEEN SIGNIFICANT RETURN ACROSS ALL ROUTES.
• 2016 WILL FOCUS ON GROWING SCHEDULED ROUTES WHILE REDUCING WET LEASE OPERATIONS, POISED FOR STRONGER GROWTH IN TRAVEL DEMAND FOR CHINA, AUSTRALIA, AND OTHER HIGH YIELD MARKETS.
• TO REPLICATE AIRASIA’S PROVEN GROWTH STRATEGY, WE WILL RESUME 2016 BY BUILDING MARKET DOMINANCE IN CORE MARKETS THROUGH: - Frequency increase (mainly Australia and China) - New high yield routes (New Delhi, Auckland, Tehran, and more)
• BOOMING CHINA MARKET: - Stronger-than-expected traffic from China to Southeast Asia and Australia, led us to increase frequency
to main cities (Beijing and Shanghai) where Chinese populations and demands are the highest, and more new second tier routes in 2H2016 to stimulate the underserved markets in China.
- China will be the key feeder traffic to our core markets in 2016. - Expect +30%YoY increase in passengers traffic, with upside of visa waiver implemented by Malaysian
government in March 2016.
• REBUILDING AUSTRALIA MARKET SHARE: - Resuming double daily flights for Melbourne, Sydney, and Perth while 11x weekly for Gold Coast, as
market has rationalized and recovered. Huge potential for Fly-Thru traffic on the rising traffic for China-Australia, India-Australia, New Zealand-Australia, and Australia-Tehran on the back of Australia’s relaxed visa rules.
- Expect passengers growth of +40%YoY in 2016.
KEY HIGHLIGHTS

5
• HIGH YIELD MARKET – NEW DELHI, INDIA: The entry to New Delhi has potential for massive growth, tapping on the (i) strong presence of AirAsia India, (ii) broader sales distribution (MakemyTrip, Expedia, and Yatra), (iii) opportunity to stimulate new market through Fly-Thru with AirAsia and AirAsia X Group wide network, and (iv) e-visa implemented by Indian government to encourage Malaysian tourist.
• HIGH YIELD MARKET - TEHRAN, IRAN & MORE:
- Historical (2010-2012) Performance: MAAX achieved average of 83% load factor with base fare of RM750 per annum.
- Massive Opportunities for MAAX and TAAX on this route as (i) Iran is one of the largest emerging and underserved market, (ii) we are the only low-cost carriers that operates direct flight from KUL and DMK and Southeast Asia airline’s expansion to Iran is minimal, (iii) AirAsia X Group operates 6x weekly (almost daily flights) into Tehran to build scale, (iv) the increase in business ties between Iran and our core markets such as Malaysia, Thailand, Australia, Korea, Japan will contribute to a surge in travel demand.
- Collections will be in USD - this will provide yields enhancement and help mitigate currency risk. • GROWING FLY-THRU TRAFFIC:
With the improved flight time for XIY, CTU, TPE, MEL and the activation of 36 new Fly-Thru city pairings in 1Q16, as well as the huge potential growth for China-Australia, India-Australia, and Australia-Tehran, we expect Fly-Thru traffic to grow at least +20%YoY in 2016.
KEY HIGHLIGHTS
CATALYST IN 2016
6
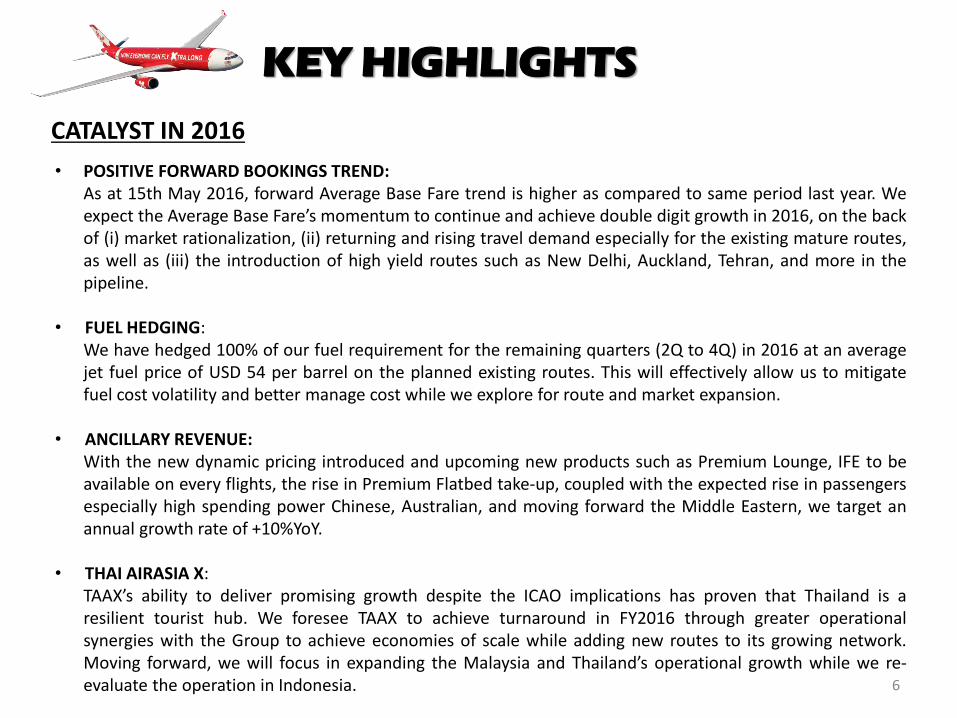
• POSITIVE FORWARD BOOKINGS TREND: As at 15th May 2016, forward Average Base Fare trend is higher as compared to same period last year. We expect the Average Base Fare’s momentum to continue and achieve double digit growth in 2016, on the back of (i) market rationalization, (ii) returning and rising travel demand especially for the existing mature routes, as well as (iii) the introduction of high yield routes such as New Delhi, Auckland, Tehran, and more in the pipeline.
• FUEL HEDGING: We have hedged 100% of our fuel requirement for the remaining quarters (2Q to 4Q) in 2016 at an average jet fuel price of USD 54 per barrel on the planned existing routes. This will effectively allow us to mitigate fuel cost volatility and better manage cost while we explore for route and market expansion.
• ANCILLARY REVENUE: With the new dynamic pricing introduced and upcoming new products such as Premium Lounge, IFE to be available on every flights, the rise in Premium Flatbed take-up, coupled with the expected rise in passengers especially high spending power Chinese, Australian, and moving forward the Middle Eastern, we target an annual growth rate of +10%YoY.
• THAI AIRASIA X:
TAAX’s ability to deliver promising growth despite the ICAO implications has proven that Thailand is a resilient tourist hub. We foresee TAAX to achieve turnaround in FY2016 through greater operational synergies with the Group to achieve economies of scale while adding new routes to its growing network. Moving forward, we will focus in expanding the Malaysia and Thailand’s operational growth while we re-evaluate the operation in Indonesia.
KEY HIGHLIGHTS
CATALYST IN 2016

73 82 84
1Q15 4Q15 1Q16
386 496
596
1Q15 4Q15 1Q16
180
139
202
1Q15 4Q15 1Q16
7
RECOVERY OF CHINA MARKET:
Chinese Passengers improved +12%YoY and +46%QoQ
Average Base Fare increased +54%YoY and +20%QoQ
Load Factor up +11%YoY and +2%QoQ
(‘000) (RM) (%)
CHINA OPPORTUNITIES:
CHINA MARKET
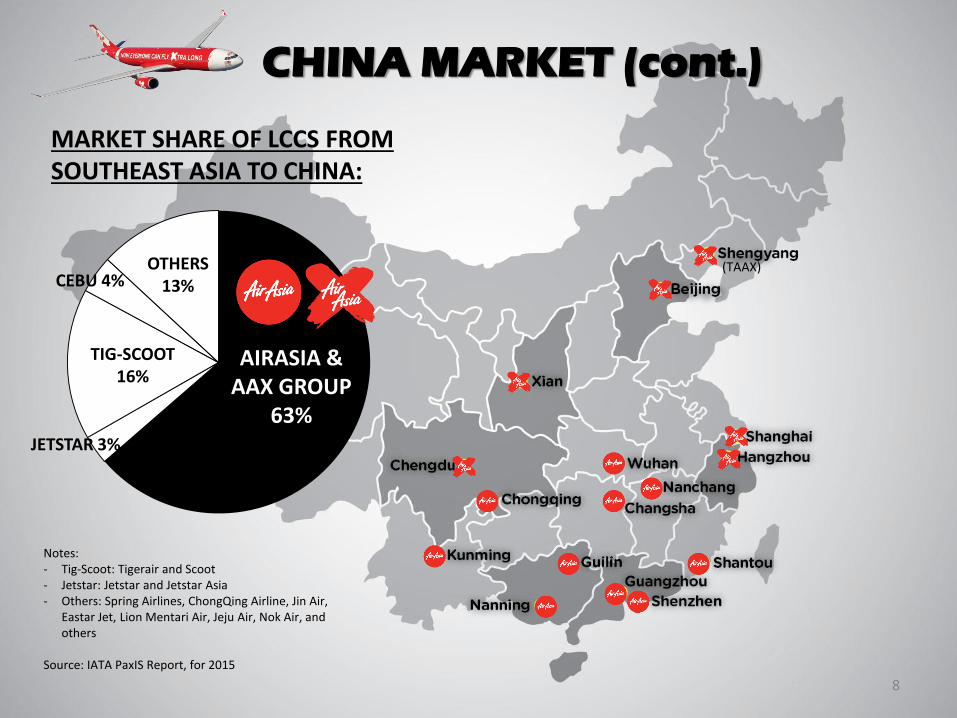
• China market continued to record significant return of business and revenue growth in 1Q16 (+49%YoY and +21%QoQ) accounted 19% of our total revenue, signifying strong recovery from the post aviation incidents in 2014 coupled with our aggressive sales and marketing push.
• We expect China traffic to grow +30%YoY in 2016 with (i) the visa waiver imposed for Chinese tourist by Malaysian Government effective 1st March 2016, and (ii) the Chinese’s growing per capita income, which are in line with Malaysia Tourism’s target of over 8mil tourists from China for the next 5 years.
• In 2015, Australia recorded ground breaking arrivals from China with more than 1mil visitors, placing Australia the second largest long-haul market for Chinese visitors after US. This represent huge upside for our China-Australia Fly-Thru on the back of our 63% and 48% market share in China and Australia respectively (together with AirAsia Group).
• To take advantage of the China opportunities, we are (i) increasing frequency to main cities (Beijing and Shanghai) where Chinese populations and demands are the highest, and (ii) introduce new second tier routes in 2H2016 to further stimulate the underserved markets in China while feeding traffic to our core markets.
8
CHINA MARKET (cont.)
MARKET SHARE OF LCCS FROM SOUTHEAST ASIA TO CHINA:
Notes: - Tig-Scoot: Tigerair and Scoot - Jetstar: Jetstar and Jetstar Asia - Others: Spring Airlines, ChongQing Airline, Jin Air,
Eastar Jet, Lion Mentari Air, Jeju Air, Nok Air, and others
Source: IATA PaxIS Report, for 2015
AIRASIA & AAX GROUP
63%
OTHERS 13%
TIG-SCOOT 16%
CEBU 4%
JETSTAR 3%
(TAAX)
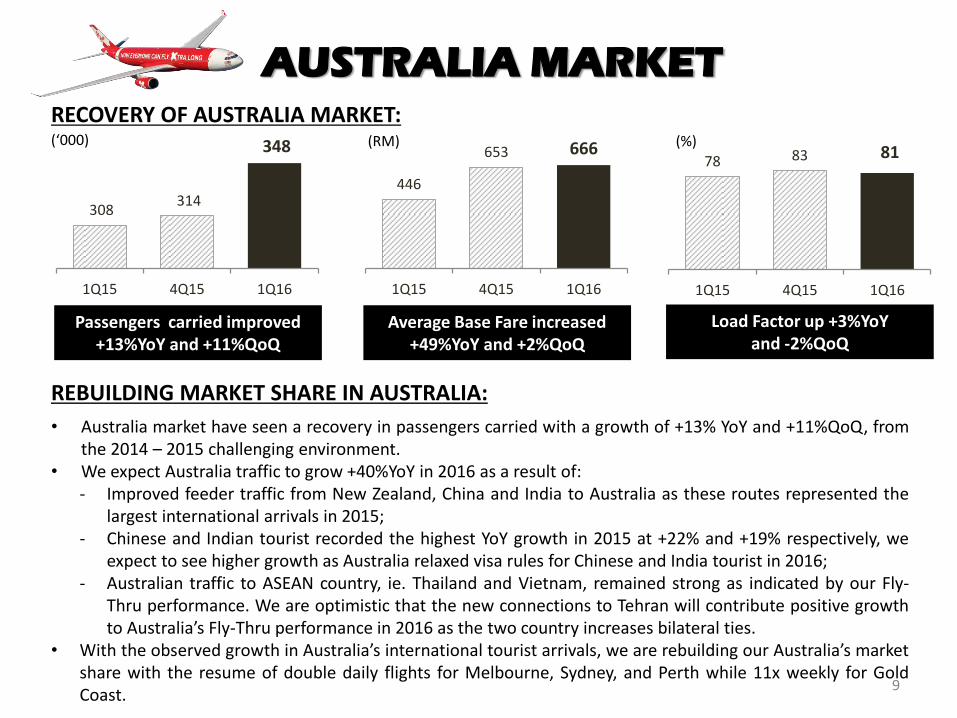
78 83 81
1Q15 4Q15 1Q16
446
653 666
1Q15 4Q15 1Q16
308 314
348
1Q15 4Q15 1Q16
9
• Australia market have seen a recovery in passengers carried with a growth of +13% YoY and +11%QoQ, from the 2014 – 2015 challenging environment.
• We expect Australia traffic to grow +40%YoY in 2016 as a result of: - Improved feeder traffic from New Zealand, China and India to Australia as these routes represented the
largest international arrivals in 2015; - Chinese and Indian tourist recorded the highest YoY growth in 2015 at +22% and +19% respectively, we
expect to see higher growth as Australia relaxed visa rules for Chinese and India tourist in 2016; - Australian traffic to ASEAN country, ie. Thailand and Vietnam, remained strong as indicated by our Fly-
Thru performance. We are optimistic that the new connections to Tehran will contribute positive growth to Australia’s Fly-Thru performance in 2016 as the two country increases bilateral ties.
• With the observed growth in Australia’s international tourist arrivals, we are rebuilding our Australia’s market share with the resume of double daily flights for Melbourne, Sydney, and Perth while 11x weekly for Gold Coast.
RECOVERY OF AUSTRALIA MARKET:
Passengers carried improved +13%YoY and +11%QoQ
Average Base Fare increased +49%YoY and +2%QoQ
Load Factor up +3%YoY and -2%QoQ
(‘000) (RM) (%)
REBUILDING MARKET SHARE IN AUSTRALIA:
AUSTRALIA MARKET
10
AUSTRALIA MARKET (cont.)
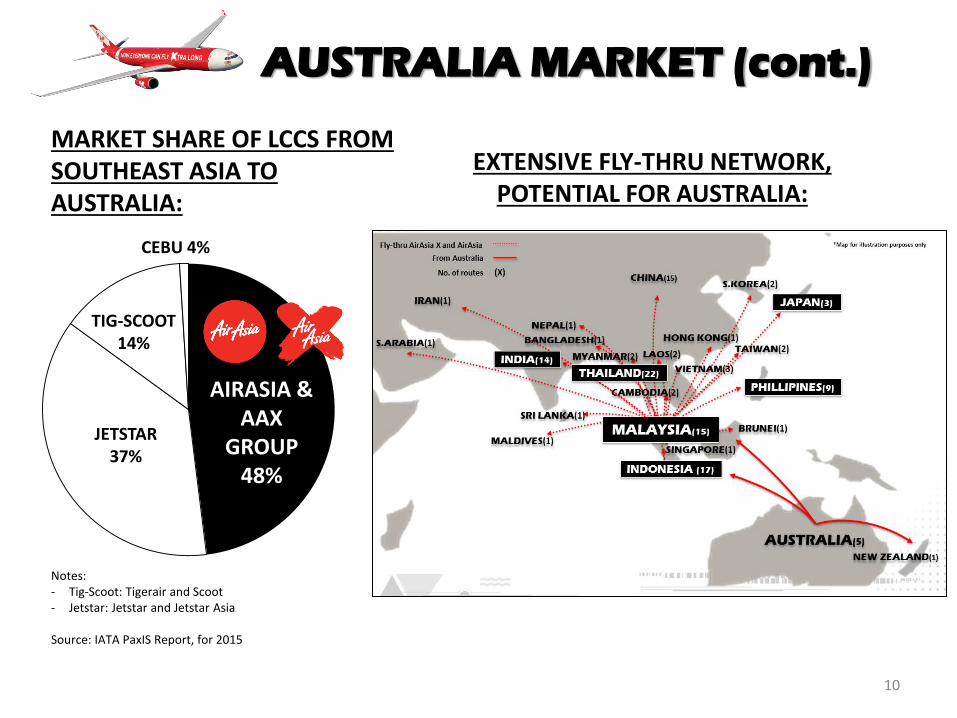
MARKET SHARE OF LCCS FROM SOUTHEAST ASIA TO AUSTRALIA:
Notes: - Tig-Scoot: Tigerair and Scoot - Jetstar: Jetstar and Jetstar Asia Source: IATA PaxIS Report, for 2015
AIRASIA & AAX
GROUP 48%
TIG-SCOOT 14%
CEBU 4%
JETSTAR 37%
EXTENSIVE FLY-THRU NETWORK, POTENTIAL FOR AUSTRALIA:
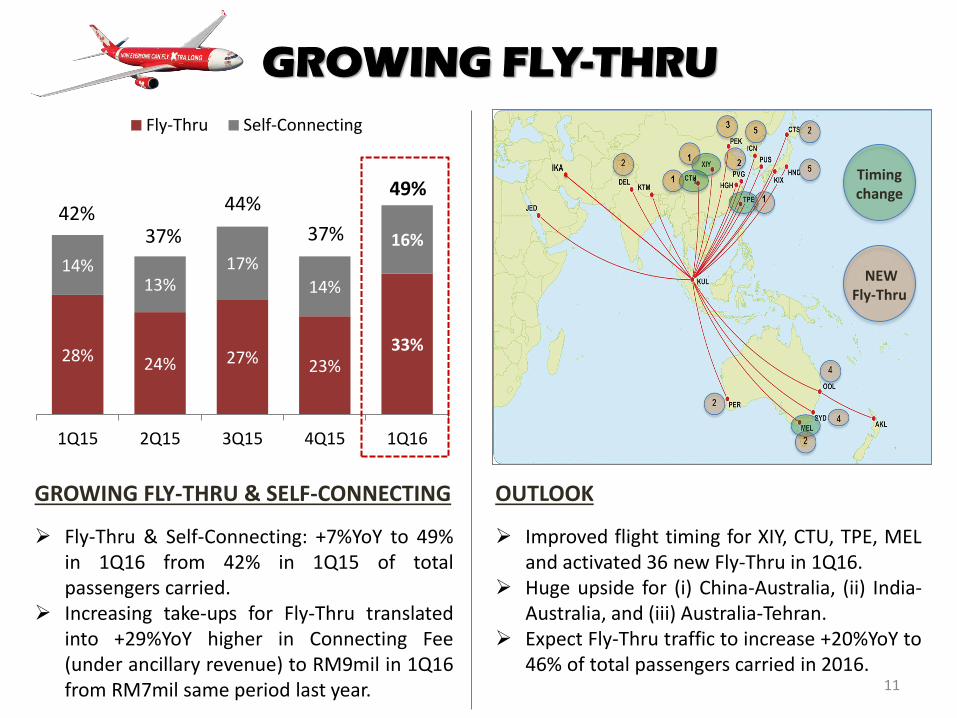
28% 24% 27% 23% 33%
14% 13%
17%
14%
16%
1Q15 2Q15 3Q15 4Q15 1Q16
Fly-Thru Self-Connecting
11
GROWING FLY-THRU & SELF-CONNECTING
Fly-Thru & Self-Connecting: +7%YoY to 49% in 1Q16 from 42% in 1Q15 of total passengers carried.
Increasing take-ups for Fly-Thru translated into +29%YoY higher in Connecting Fee (under ancillary revenue) to RM9mil in 1Q16 from RM7mil same period last year.
Timing change
NEW Fly-Thru
OUTLOOK
Improved flight timing for XIY, CTU, TPE, MEL and activated 36 new Fly-Thru in 1Q16.
Huge upside for (i) China-Australia, (ii) India-Australia, and (iii) Australia-Tehran.
Expect Fly-Thru traffic to increase +20%YoY to 46% of total passengers carried in 2016.
GROWING FLY-THRU
49%
37%
44%
37% 42%
12
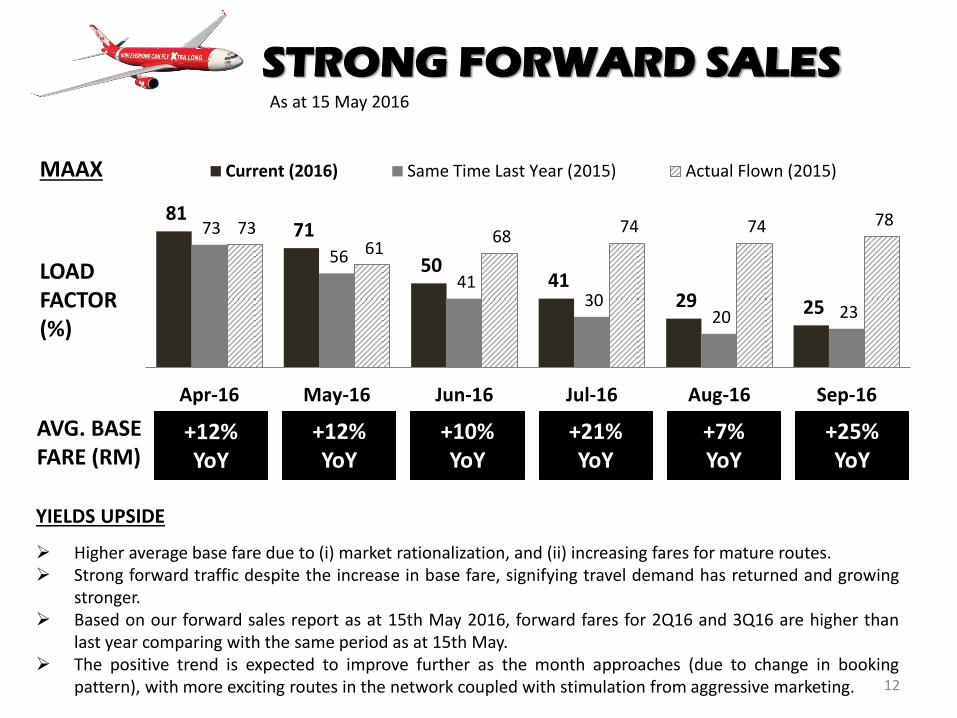
As at 15 May 2016
YIELDS UPSIDE
Higher average base fare due to (i) market rationalization, and (ii) increasing fares for mature routes. Strong forward traffic despite the increase in base fare, signifying travel demand has returned and growing
stronger. Based on our forward sales report as at 15th May 2016, forward fares for 2Q16 and 3Q16 are higher than
last year comparing with the same period as at 15th May. The positive trend is expected to improve further as the month approaches (due to change in booking
pattern), with more exciting routes in the network coupled with stimulation from aggressive marketing.
MAAX
LOAD FACTOR (%)
AVG. BASE FARE (RM)
+12% YoY
+12% YoY
+10% YoY
+21% YoY
+7% YoY
+25% YoY
STRONG FORWARD SALES
81 71
50 41
29 25
73
56
41 30
20 23
73 61
68 74 74 78
Apr-16 May-16 Jun-16 Jul-16 Aug-16 Sep-16
Current (2016) Same Time Last Year (2015) Actual Flown (2015)

• Dynamic pricing for baggage • Value Bundled Package • Introduce new meal selections with new pricing • Enhance duty free products & sales platform • Make In-flight Entertainment available in all
markets (currently only available on Australia flights)
• Endorsement of celebrity, David Foster, to further promote premium flatbed.
• Premium lounge & more • Target to achieve 10%YoY growth
DRIVE ANCILLARY:
ANCILLARY
32 43
47
1Q15 4Q15 1Q16
Premium Flatbed Revenue +46%YoY and +10%QoQ
Target Annual Ancillary Per Pax Growth
10%
(RM mil)
13

30 30 30 30 30 30 27 22 21 20
15
2 7
14 21 29 37
45 53 61
2016 2017 2018 2019 2020 2021 2022 2023 2024 2025 2026
A330-300ceo A330-900neo14
30 30 32 37
44
51 56
59
66
73 76
FLEET PLAN
Year End
29 aircraft as at April 2016; 2 new aircraft to be delivered and operate starting June 2016 while 1 (MSN54) is scheduled to return by end 2Q16.
No aircraft delivery from 2017 to 1H2018; the remaining 11 A330ceos have converted to A330neos, the most cost-efficient in its class. This model will effectively allow us to save 14% fuel consumption per seat and reduces maintenance costs.
A330ceo will gradually be replaced by A330neo.
15
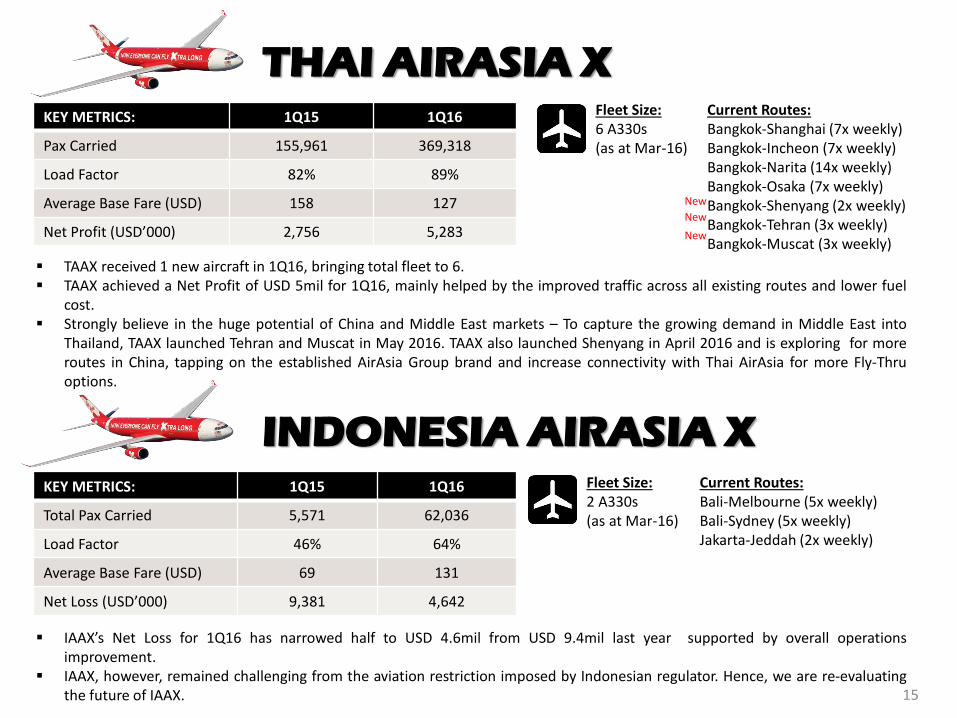
Fleet Size: 6 A330s (as at Mar-16)
Current Routes: Bangkok-Shanghai (7x weekly) Bangkok-Incheon (7x weekly) Bangkok-Narita (14x weekly) Bangkok-Osaka (7x weekly) Bangkok-Shenyang (2x weekly) Bangkok-Tehran (3x weekly) Bangkok-Muscat (3x weekly)
THAI AIRASIA X KEY METRICS: 1Q15 1Q16
Pax Carried 155,961 369,318
Load Factor 82% 89%
Average Base Fare (USD) 158 127
Net Profit (USD’000) 2,756 5,283
Fleet Size: 2 A330s (as at Mar-16)
Current Routes: Bali-Melbourne (5x weekly) Bali-Sydney (5x weekly) Jakarta-Jeddah (2x weekly)
IAAX’s Net Loss for 1Q16 has narrowed half to USD 4.6mil from USD 9.4mil last year supported by overall operations improvement.
IAAX, however, remained challenging from the aviation restriction imposed by Indonesian regulator. Hence, we are re-evaluating the future of IAAX.
INDONESIA AIRASIA X KEY METRICS: 1Q15 1Q16
Total Pax Carried 5,571 62,036
Load Factor 46% 64%
Average Base Fare (USD) 69 131
Net Loss (USD’000) 9,381 4,642
TAAX received 1 new aircraft in 1Q16, bringing total fleet to 6. TAAX achieved a Net Profit of USD 5mil for 1Q16, mainly helped by the improved traffic across all existing routes and lower fuel
cost. Strongly believe in the huge potential of China and Middle East markets – To capture the growing demand in Middle East into
Thailand, TAAX launched Tehran and Muscat in May 2016. TAAX also launched Shenyang in April 2016 and is exploring for more routes in China, tapping on the established AirAsia Group brand and increase connectivity with Thai AirAsia for more Fly-Thru options.
New
New
New
1Q2016 KEY FINANCIAL &
OPERATIONAL
HIGHLIGHTS
17
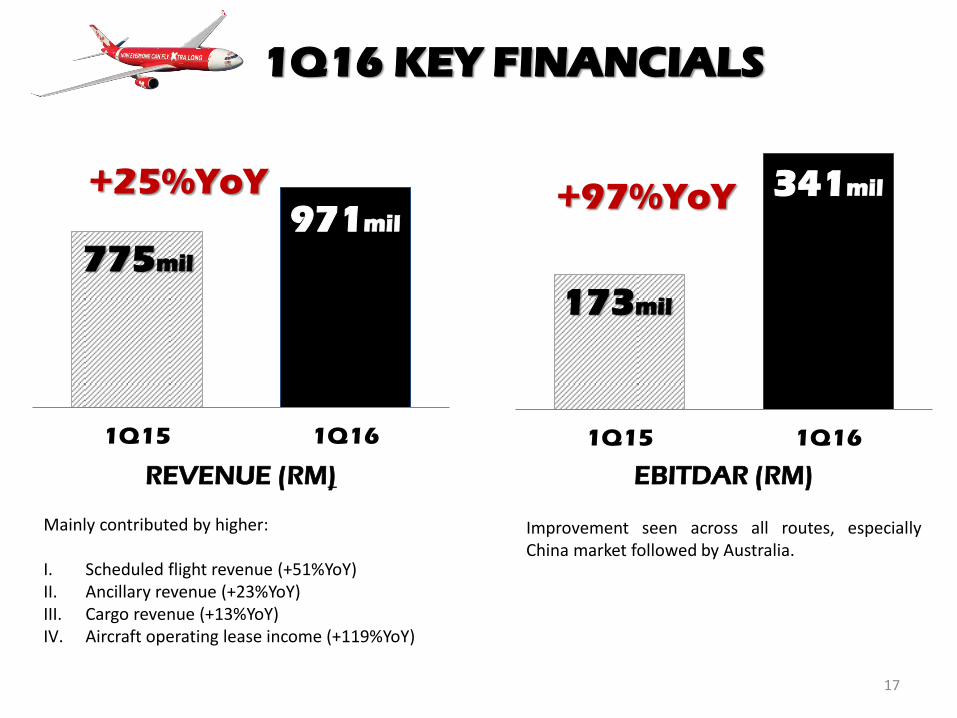
REVENUE (RM) Mainly contributed by higher: I. Scheduled flight revenue (+51%YoY) II. Ancillary revenue (+23%YoY) III. Cargo revenue (+13%YoY) IV. Aircraft operating lease income (+119%YoY)
1Q15 1Q16
+25%YoY
EBITDAR (RM) Improvement seen across all routes, especially China market followed by Australia.
1Q15 1Q16
+97%YoY
775mil
971mil
173mil
341mil
1Q16 KEY FINANCIALS

18
OPERATING PROFIT (RM) Mainly due to improvement in overall operating performance and the -11%YoY savings in aircraft fuel expenses. However, the savings was limited by the hedging of 57% at USD53/bbl for 1Q16.
1Q15 1Q16
+>100%YoY
NET (LOSS)/ PROFIT (RM) This was favored by FOREX Gain of RM122mil in 1Q16 as compared to a FOREX Loss of RM87mil in 1Q15.
1Q15 1Q16
+>100%YoY
6mil
105mil
-126mil
179mil
1Q16 KEY FINANCIALS
19
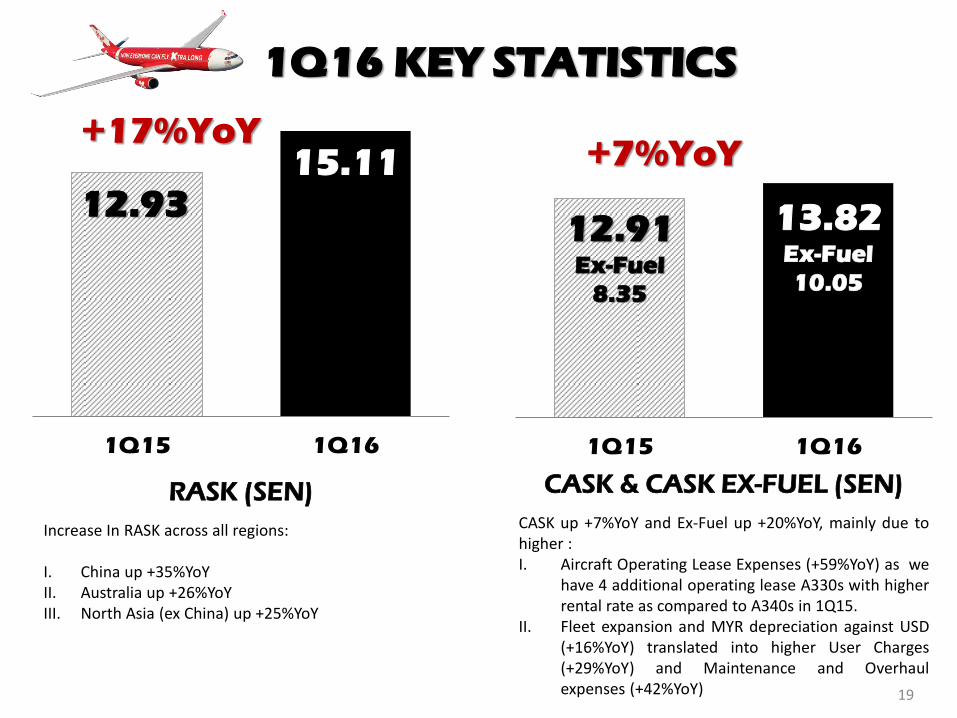
RASK (SEN)
Increase In RASK across all regions: I. China up +35%YoY II. Australia up +26%YoY III. North Asia (ex China) up +25%YoY
1Q15 1Q16
+17%YoY
1Q15 1Q16
+7%YoY
12.93 15.11
12.91 Ex-Fuel
8.35
13.82 Ex-Fuel
10.05
1Q16 KEY STATISTICS
CASK & CASK EX-FUEL (SEN)
CASK up +7%YoY and Ex-Fuel up +20%YoY, mainly due to higher : I. Aircraft Operating Lease Expenses (+59%YoY) as we
have 4 additional operating lease A330s with higher rental rate as compared to A340s in 1Q15.
II. Fleet expansion and MYR depreciation against USD (+16%YoY) translated into higher User Charges (+29%YoY) and Maintenance and Overhaul expenses (+42%YoY)
20
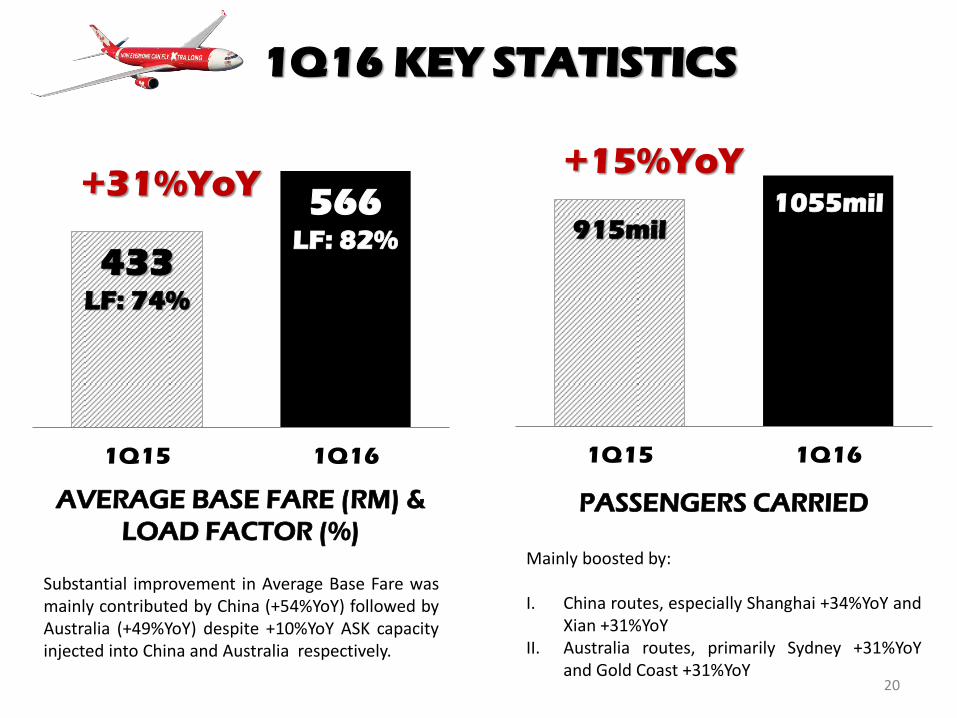
AVERAGE BASE FARE (RM) &
LOAD FACTOR (%) Substantial improvement in Average Base Fare was mainly contributed by China (+54%YoY) followed by Australia (+49%YoY) despite +10%YoY ASK capacity injected into China and Australia respectively.
1Q15 1Q16
+31%YoY
PASSENGERS CARRIED Mainly boosted by: I. China routes, especially Shanghai +34%YoY and
Xian +31%YoY II. Australia routes, primarily Sydney +31%YoY
and Gold Coast +31%YoY
1Q15 1Q16
+15%YoY
915mil 1055mil
433 LF: 74%
566 LF: 82%
1Q16 KEY STATISTICS
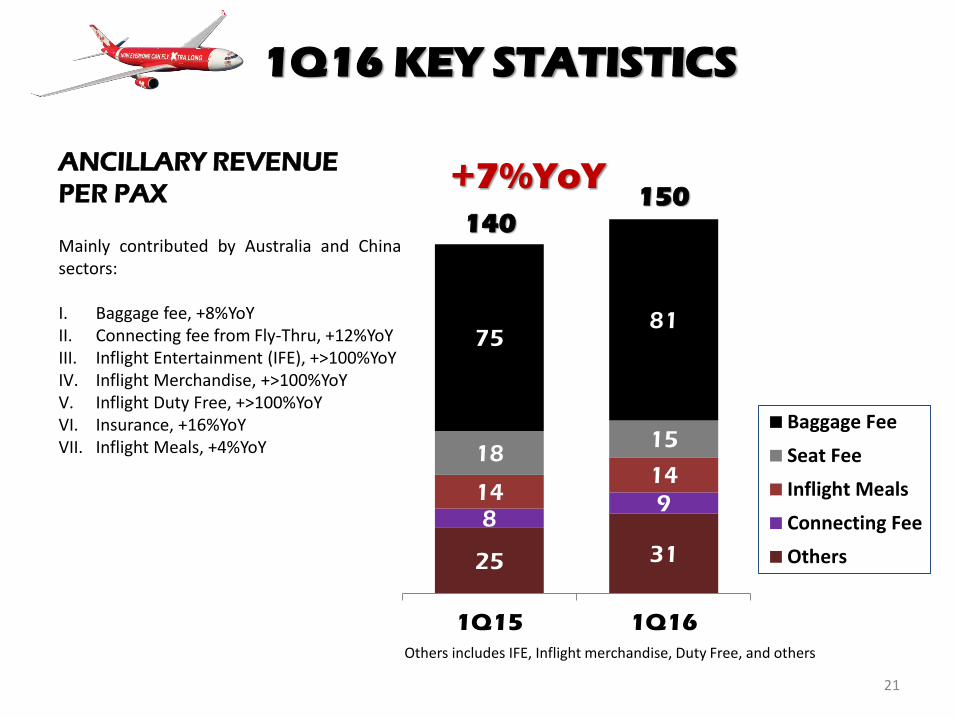
25 31
8 9
14 14
18 15
75 81
1Q15 1Q16
Baggage Fee
Seat Fee
Inflight Meals
Connecting Fee
Others
21
ANCILLARY REVENUE
PER PAX Mainly contributed by Australia and China sectors: I. Baggage fee, +8%YoY II. Connecting fee from Fly-Thru, +12%YoY III. Inflight Entertainment (IFE), +>100%YoY IV. Inflight Merchandise, +>100%YoY V. Inflight Duty Free, +>100%YoY VI. Insurance, +16%YoY VII. Inflight Meals, +4%YoY
+7%YoY
140 150
Others includes IFE, Inflight merchandise, Duty Free, and others
1Q16 KEY STATISTICS

THANK YOU


