
IEA EGRD The Role of Storage in Energy System Flexibility Flexibility Option of the Demand Side Matthias Stifter (AIT Energy Department, Austria)

Motivation for Demand Response
28.10.2014 3
Need for flexiblity of the demand
Demand - Optimzed
Power
Time
Time
Power
Demand
PV
PV
Increase of (local) distributed generation (e.g..: PV, CHP, Wind)
PV: „grid-parity“ Impact on network: curtailment
(Germany: since 2013: 60% Peak curtailment)
Higher dynamics in the power system
Higher unbalance due to forecast errors

DR as a possible alternative to energy storage Demand Response Resources Electro thermal - thermal storage
Warm water boilers Cooling / freezers Heating (HVAC)
Electric vehicles – electrical storage Controlled charging
Public services – load shifting Water pumps Waste water / sewage
Storages Buffer to meet energy constraint (comfort) Load shifting for network operation is already in place for many years (ripple control) Aggregation makes it more robust Virtual Power Plant
4 28.10.2014
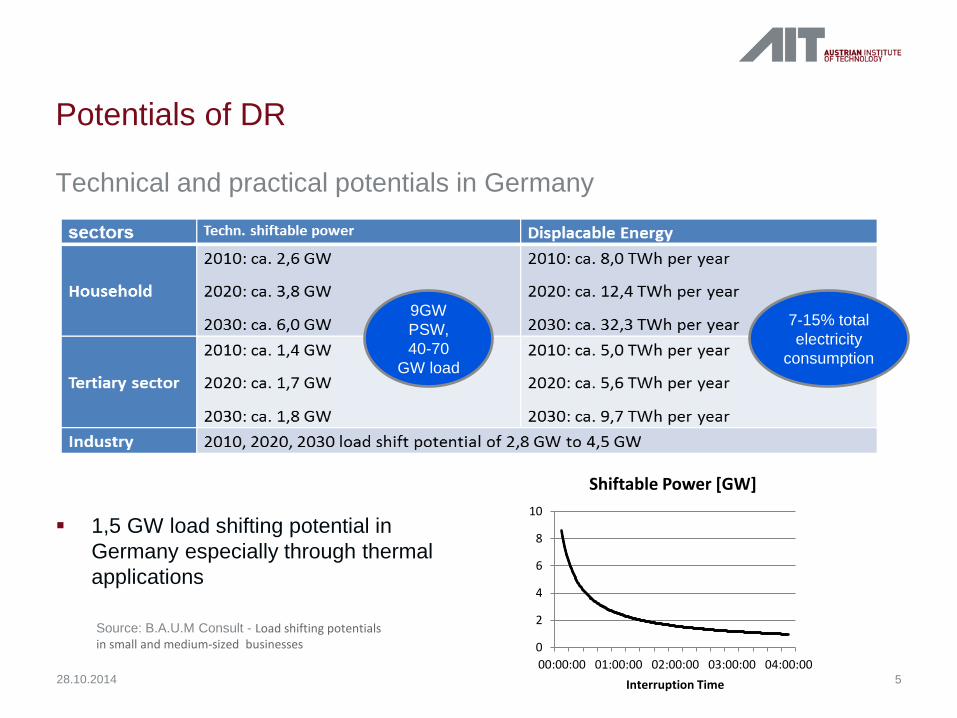
Potentials of DR
Technical and practical potentials in Germany
1,5 GW load shifting potential in Germany especially through thermal applications
5 28.10.2014
9GW PSW, 40-70
GW load
7-15% total electricity
consumption
0
2
4
6
8
10
00:00:00 01:00:00 02:00:00 03:00:00 04:00:00Interruption Time
Shiftable Power [GW]
Source: B.A.U.M Consult - Load shifting potentials in small and medium-sized businesses

Potentials of DR
Sectorial electricity end use in Austria (2012)
6 28.10.2014
Source: Statistik Austria, 2012
Public and privat services + End users

Potentials of DR
Categories of electricity use in households (2012)
7 28.10.2014
Source: Statistik Austria, 2012
Hot water and heating

Potentials of DR
Technical potentials in Austria Practical load shift demand at households in Austria
8 28.10.2014 Source: Energieinstitut an der JKU Linz – Project „LoadShift“
Load reduction
Load increase

Differences between DR and energy storage
Battery operation vs. Demand requirements
9 28.10.2014

Differences between DR and energy storage
Battery operation vs. Demand requirements
Battery Demand Response Operation charging / off / discharging (forced) charging / off
Self discharging losses losses = customer demand
SOC range depends on previous operation unknown free rest capacity
Rated power charging = discharging withdraw > charging
Storage time short to long term (short term) “shifting”
Availability dispatchable external factors (demand, T, …)
Purpose dedicated system part of demand side
Control energy management system simple control (e.g., thermostat)
Objective storage of electric energy shifting of energy
Scale large / utility settlement, building, households
10 28.10.2014

Examples from pilots and field tests Sharing best and bad practices and defining use cases

Project SGMS-HiT– Smart Grids Model Region Salzburg
12
Flyover Pictures
Design: thalmeier architektur
28.10.2014
Buildings as interative participants in the Smart Grids

Separate usage of energy from energy supply Buffering with thermal storages Use energy which is most efficient for the grid
PV - Heatpump Biogas (CHP) Grid District heating grid friendly building
Comfort must be preserved.
13
SGMS – HiT Utilizing HVAC-Systems (heating, hot water)
28.10.2014

14
SGMS – HiT Three heat sources feeding into one storage tank
28.10.2014
District heating
Combined heat and power plant (68 kW therm, 30 kW elec)
Heat pump (45 kW therm)
90m³ Hot water storage tank
62 ºC

Project: gridSMART® - Residential Real-time Pricing
15 28.10.2014
Overview – Transactive Grid Control

Project: gridSMART® RTPda Demo First real-time market at distribution feeder level
with a tariff approved by the PUC of Ohio Value streams
Energy purchase benefit Capacity benefits: e.g., peak shaving Ancillary services benefits
Uses market bidding mechanism to perform distributed optimization – transactive energy ~200 homes bidding on 4 feeders Separate market run on each feeder “Double auction” with 5 minute clearing
HVAC automated bidding Smart thermostat and home energy manager Homeowner sets comfort/economy preference Can view real-time and historical prices to make
personal choices
16

Electric Vehicles Electric storage as a flexible resource to integrate renewables

18 28.10.2014
EV Simulation Environment
Mobility Simulation
Power Grid Simulation
CP & EV Simulation
Scenario & Use-Case
Results
traffic data
trip data
power demand

Use-Case Description: Basic Data
19 28.10.2014
Data of District Lungau Population 2008 20835 Passenger vehicles Lungau 2008 10960
50% BEV/PHEV 5749
Vehicle Battery [kwh]
Charging Specifications Amperage[A] Voltage[V] phases
Range [km]
Consumption [kWh/km]
BEV 27,5 16 230 3 130 21,15
PHEV 10,5 16 230 1 60 17,50

21 28.10.2014
Impact of different maximum charging power (11kW)
0 kW
500 kW
1.000 kW
1.500 kW
2.000 kW
2.500 kW
3.000 kW
3.500 kW
0 kW
500 kW
1.000 kW
1.500 kW
2.000 kW
2.500 kW
3.000 kW
3.500 kW
00:0
0
01:0
0
02:0
0
03:0
0
04:0
0
05:0
0
06:0
0
07:0
0
08:0
0
09:0
0
10:0
0
11:0
0
12:0
0
13:0
0
14:0
0
15:0
0
16:0
0
17:0
0
18:0
0
19:0
0
20:0
0
21:0
0
22:0
0
23:0
0
5%-11kW 10%-11kW 25%-11kW
Charging power: 11 kW
Scenario Number of EVs
5% 574 10% 1149 25% 2873
Winter
Summer
Opportunity Charging – Summary (Summer & Winter)

22 28.10.2014
Impact of different maximum charging power (43kW)
0 kW
500 kW
1.000 kW
1.500 kW
2.000 kW
2.500 kW
3.000 kW
3.500 kW
0 kW
500 kW
1.000 kW
1.500 kW
2.000 kW
2.500 kW
3.000 kW
3.500 kW
00:0
0
01:0
0
02:0
0
03:0
0
04:0
0
05:0
0
06:0
0
07:0
0
08:0
0
09:0
0
10:0
0
11:0
0
12:0
0
13:0
0
14:0
0
15:0
0
16:0
0
17:0
0
18:0
0
19:0
0
20:0
0
21:0
0
22:0
0
23:0
0
5%-11kW 10%-11kW 25%-11kW5%-43kW 10%-43kW 25%-43kW
Charging power: 11 kW 43 kW
Scenario Number of EVs
5% 574 10% 1149 25% 2873
Opportunity Charging – Summary (Summer & Winter)

Power demand in a car park (Park & Ride)
Distribution of parking duration and the zone of attraction
23 28.10.2014
0
10
20
30
40
50
60
1 2 3 4 5 6 7 8 9 10 11 12 13 14 15 16 17
Anza
hl d
er F
ahrz
euge
[1]
Parkdauer [h]
186 Fahrzeuge 147 Fahrzeuge
Distribution of parking duration of 147 electric vehicles (t=60min) Zone of attraction for the car park
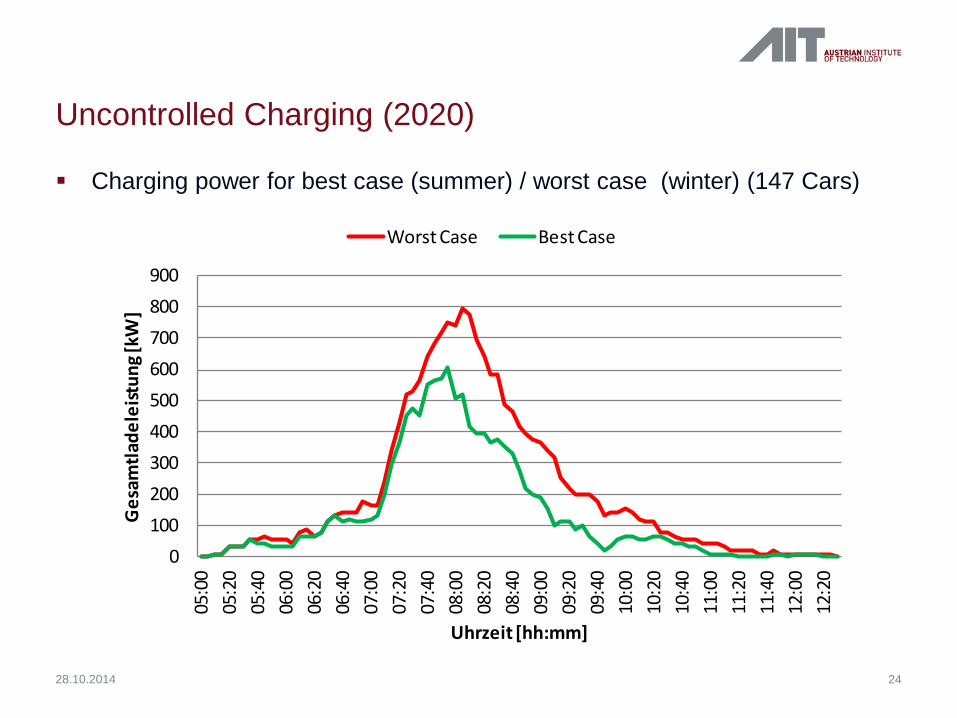
Uncontrolled Charging (2020)
Charging power for best case (summer) / worst case (winter) (147 Cars)
24 28.10.2014
0100200300400500600700800900
05:0
005
:20
05:4
006
:00
06:2
006
:40
07:0
007
:20
07:4
008
:00
08:2
008
:40
09:0
009
:20
09:4
010
:00
10:2
010
:40
11:0
011
:20
11:4
012
:00
12:2
0
Ges
amtla
dele
istun
g [kW
]
Uhrzeit [hh:mm]
Worst Case Best Case

Controlled Charging Worst Case - Winter (2020)
Charging power for worst case (147 Cars)
25 28.10.2014
0100200300400500600700800900
05:0
005
:35
06:1
006
:45
07:2
007
:55
08:3
009
:05
09:4
010
:15
10:5
011
:25
12:0
012
:35
13:1
013
:45
14:2
014
:55
15:3
016
:05
16:4
017
:15
17:5
0
Ges
amtla
dele
istun
g [kW
]
Uhrzeit [hh:mm]
Unkontrolliert Worst Case
Pmax=500kW Pmax=400kW
Pmax=300kW Pmax=200kW Pmax=100kW

Controlled and uncontrolled charging of BEVs (MV)
Local supply - demand match in medium voltage networks
26 28.10.2014
Number of BEVs Battery capacity BEV max. charging power Power limit PV Ppeak
306 23 kWh 11 kW 400kW 100kW

Integration of Renewable Energy
Local supply - demand match in medium voltage networks
27 28.10.2014
Uncontrolled and controlled charging of 306 EVs with 11 kW during two sumer days.
Note: wind is accumulated on top of PV generation
0
100
200
300
400
500
600
700
800
00:0
0
04:0
0
08:0
0
12:0
0
16:0
0
20:0
0
00:0
0
04:0
0
08:0
0
12:0
0
16:0
0
20:0
0
Pow
er [k
W]
time [hh:mm]
Generation from Wind
Generation from PV
Uncontrolled 11kW
Controlled 11kW; SOC-Level: 50%
Controlled 11kW; SOC-Level: 25%
Charging Mode
empty Evs
P-peak [kW]
Charged Energy [kWh]
DER Energy [kWh]
DER Coverage
[%]
uncontrolled 11kW 135 883 12613 3971 26%
controlled 11kW/SOC50 197 552 7267 3971 50%
controlled 11kW/SOC25 218 353 5051 3971 71%
Charging Mode
empty EVs
P-peak [kW]
Charged Energy [kWh]
DER Energy [kWh]
DER Coverage
[%]
uncontrolled 11kW 15 751 9964 8079 54%
controlled 11kW/SOC50 55 366 6832 8079 89%
controlled 11kW/SOC25 66 324 6229 8079 99%
Two days simulation in winter
Two days simulation in summer
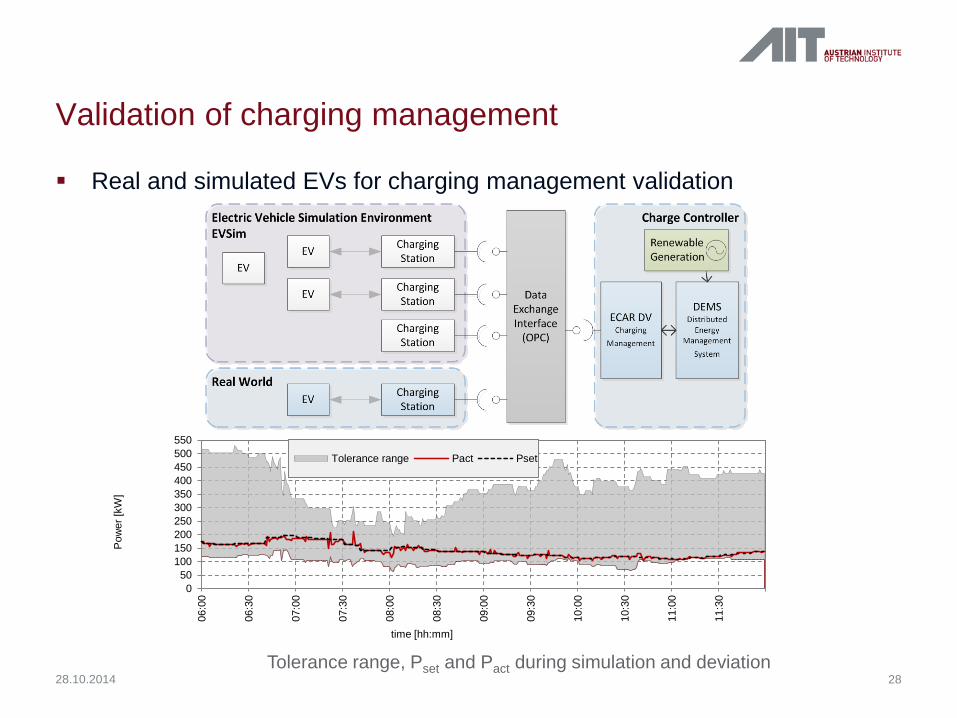
Validation of charging management
Real and simulated EVs for charging management validation
28 28.10.2014
050
100150200250300350400450500550
06:0
0
06:3
0
07:0
0
07:3
0
08:0
0
08:3
0
09:0
0
09:3
0
10:0
0
10:3
0
11:0
0
11:3
0
Pow
er [k
W]
time [hh:mm]
Tolerance range Pact Pset
Tolerance range, Pset and Pact during simulation and deviation

Markus Radauer, 2014
In a dedicated demo area supplied by a 250 kVA secondary substation: • PV system at every second
roof top
• Electric vehicle in every second garage
• Field test of an integrated
smart grid solution for low voltage grids
• “anticipating the future”
• funded by Austrian Climate and Energy Fund & Province of Salzburg
Smart Grids Model Community Köstendorf

Markus Radauer, 2014
Controlled e-car charging
source: Roman Schwalbe, AIT
12.May 00:00 12.May 12:00 13.May 00:00 13.May 12:00 14.May 00:00 14.May 12:00-4
-2
0
2
4
6
BE
A #
40 [k
W]
PVHouseholdE-CarTotal
12.May 00:00 12.May 12:00 13.May 00:00 13.May 12:00 14.May 00:00 14.May 12:00
220
230
240
BE
A #
40 [V
olt]
SmartMeter U L1SmartMeter U L2SmartMeter U L3Charging Station U
12.May 00:00 12.May 12:00 13.May 00:00 13.May 12:00 14.May 00:00 14.May 12:00-4
-2
0
2
4
6
BE
A #
27 [k
W]
PVE-Car
12.May 00:00 12.May 12:00 13.May 00:00 13.May 12:00 14.May 00:00 14.May 12:00
220
230
240
BE
A #
27 [V
olt]
SmartMeter U L1SmartMeter U L2SmartMeter U L3Charging Station U

IEA DSM Task 17 Objectives, Subtasks, Outcomes

Subtask of Phase 3 - Introduction
Systems view on enabling flexibility in the smart grid
Different views on the Smart Grid: Technology Customer Policy Market
Focus on the enabling of flexibility
and the impact of it on the stakeholders: What are the requirements? How do we manage it? How will it effect operation? What are the benefits?
32 28.10.2014

Summary Challenges and Outlook

Summary
Changes and impact on stakeholders operations
Mayor differences between battery and DR
Several studies have identified DR as a cost effective way to integrate Renewables
Processes with thermal or electric storage have high potentials
Large customers, but also medium and small customers could be targeted
Charging / positive power has more potential
DR for balancing forecast uncertainties of renewables
Dynamic of load is a challenge for the system operation. Research in understanding and developing tools (e.g. prediction) needed
38 28.10.2014

AIT Austrian Institute of Technology your ingenious partner Matthias Stifter Energy Department Complex Energy Systems AIT Austrian Institute of Technology Giefinggasse 2 | 1210 Vienna | Austria T +43(0) 50550-6673 | M +43(0) 664 81 57 944 | F +43(0) 50550-6613 [email protected] | http://www.ait.ac.at

Appendix Additional Information

Subtask of Phase 3 – Subtask 10
Role, and potentials of flexible prosumers (households, SMEs, buildings)
Controllability requirements (generation and consumption)
Opportunities, challenges and barriers for flexibility services (providers and technologies)
Energy and power balancing potentials
Smart technologies (SM and Customer Energy MS)
VPPs EV charging DG-RES integration and storage Integrating heat pumps and thermal storages
41 28.10.2014

Subtask of Phase 3 – Subtask 11
Changes and impact on stakeholders operations
Methodology development for assessing/quantifying impact
Grid, market and customers (prosumer/consumer) interaction
Sharing common benefits/losses
Optimization potential (eg. DR building audits and customer requirements)
Regulatory and legislative requirements
Comparison costs vs. delayed investments
42 28.10.2014

Subtask of Phase 3 – Subtask 12
Sharing experiences and finding best/worst practices
Collection of data Workshops
Lessons learned from existing pilots
EcoGrid-EU Bornholm, PowerMatchingCity I and II, Linear, Greenlys, Building2Grid, SmartCityGrid: CoOpt, eEnergy, …
Country specifics differences in the implementation applicability
Extrapolation of the results from previously collected projects on applicability
43 28.10.2014

Subtask of Phase 3 – Subtask 13
Conclusions and recommendations
Based on the experts’ opinion
Will provide a ranking based on Impacts Costs Future penetration of the technologies
44 28.10.2014

CEMS and Power Management System interfaces
Use cases and requirements for the interface between the power management system of the electrical grid and customer energy management systems for residential and commercial buildings and industry.
User stories use cases data model information content & structure
Examples:
The user wants to get the laundry done / EV charged by 8:00pm
Grid recognize stability issues CEM feeds own battery pack energy
into own network or into the grid Heat pump and Photovoltaic Operation
with Real-Time Tariff
45 28.10.2014
IEC 62746 Technical Report Objective


