
« UNDERSTANDING EMBEDDED LINUX BENCHMARKING USING KERNEL TRACE ANALYSIS »
ALEXIS MARTIN INRIA / LIG / UNIV. GRENOBLE, FRANCE

Understanding Embedded Linux Benchmarking Using Kernel Trace Analysis - Alexis Martin, ELC 2015
We do Need Benchmarking !• Benchmark : a standard or point of reference against which things may be
compared or assessed.(new Oxford American Dictionary)
• Benchmarking computer systems: • Assess performance in different execution settings • Compare computer systems
• Performance criteria: • speed, latency, bandwidth, power consumption, memory used, …
➜ Critical step in system design
2

Understanding Embedded Linux Benchmarking Using Kernel Trace Analysis - Alexis Martin, ELC 2015
Benchmarking is Challenging
• Benchmarking construction is difficult • There are many different benchmarks available
• 3D rendering, DBMS test, NAS… • In some cases benchmark is nonexistent• Major motivation for using a benchmark is popularity • The behavior of tests is not necessarily known
3

Understanding Embedded Linux Benchmarking Using Kernel Trace Analysis - Alexis Martin, ELC 2015
Understand What We Benchmark
• Identify what is measured and how • Interpret results • Draw a profile • Compare different benchmarks
➜ Help to chose the right benchmark
4

Understanding Embedded Linux Benchmarking Using Kernel Trace Analysis - Alexis Martin, ELC 2015
Work Summary
1. Execute benchmark application (UDOO+Phoronix)
2. Record a trace from this execution (LTTng)
3. Analyze the traces (Framesoc + TraceCompass)
4. Draw a profile and compare benchmarks
5
Understanding Embedded Linux Benchmarking Using Kernel Trace Analysis - Alexis Martin, ELC 2015
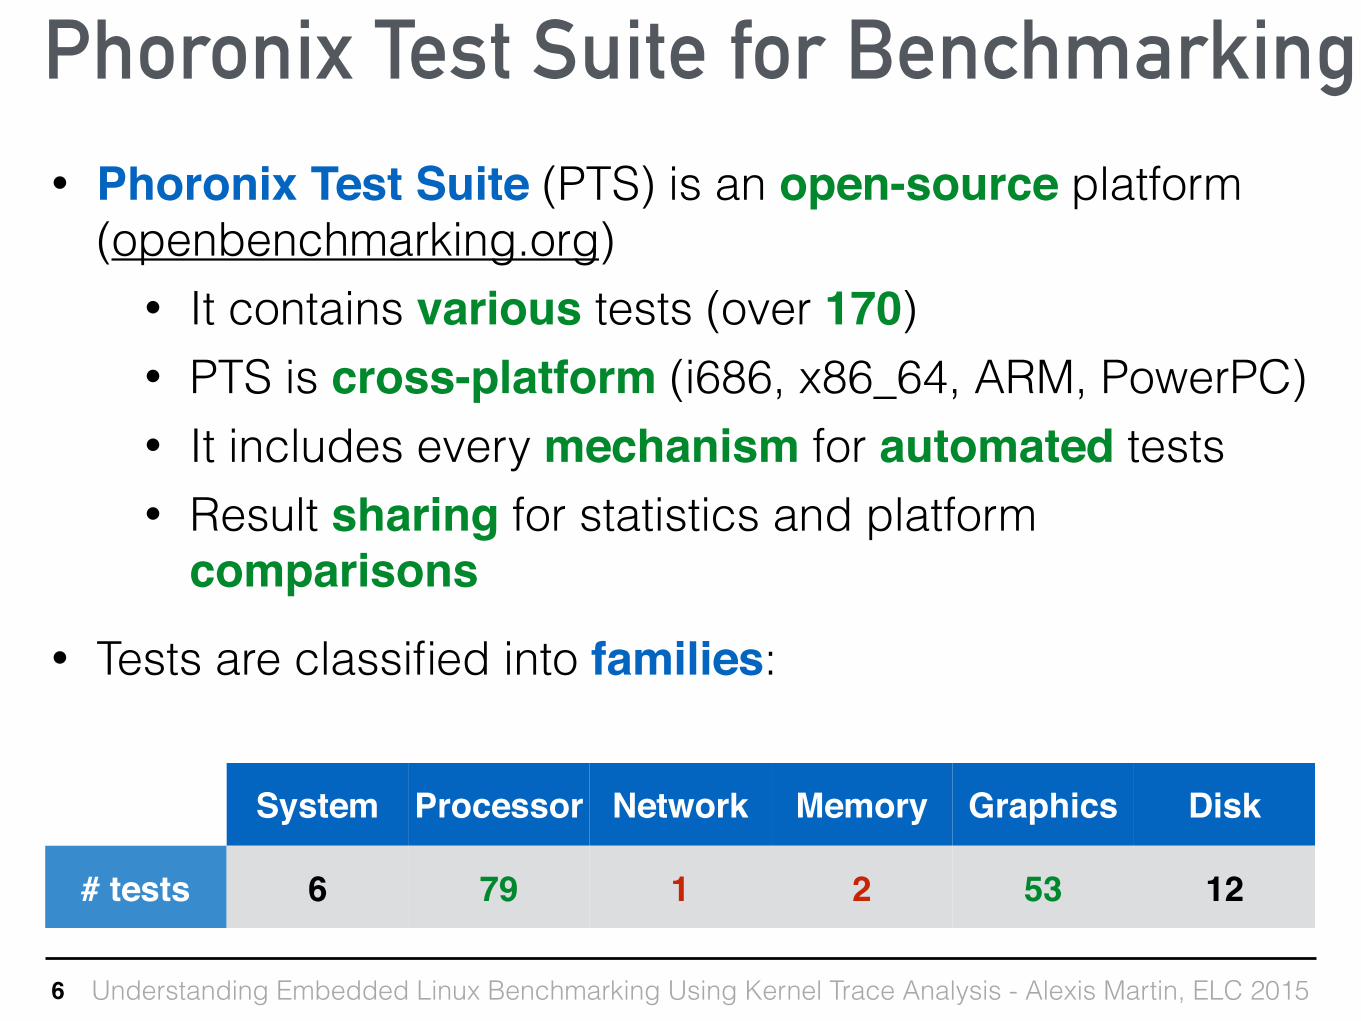
Phoronix Test Suite for Benchmarking• Phoronix Test Suite (PTS) is an open-source platform
(openbenchmarking.org) • It contains various tests (over 170) • PTS is cross-platform (i686, x86_64, ARM, PowerPC) • It includes every mechanism for automated tests• Result sharing for statistics and platform
comparisons
• Tests are classified into families:
6
System Processor Network Memory Graphics Disk
# tests 6 79 1 2 53 12
Understanding Embedded Linux Benchmarking Using Kernel Trace Analysis - Alexis Martin, ELC 2015
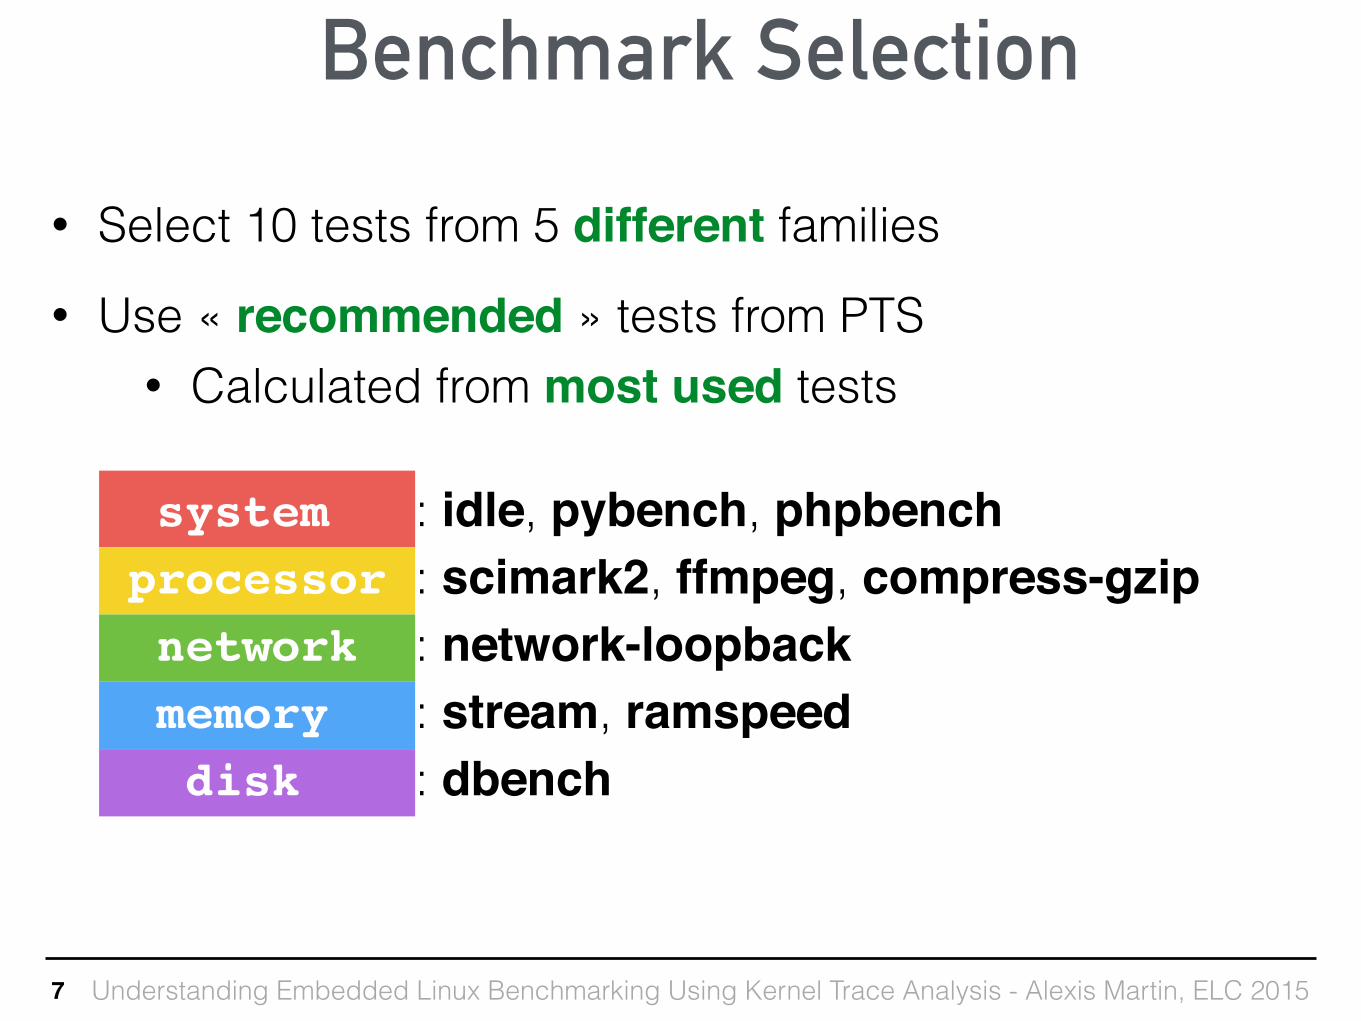
Benchmark Selection
• Select 10 tests from 5 different families • Use « recommended » tests from PTS
• Calculated from most used tests
system : idle, pybench, phpbench processor : scimark2, ffmpeg, compress-gzip network : network-loopback memory : stream, ramspeed disk : dbench
7

Understanding Embedded Linux Benchmarking Using Kernel Trace Analysis - Alexis Martin, ELC 2015
The Test Platform
• UDOO development board (udoo.org) • i.MX 6 Quad ARM CPU (A9) @1GHz + 1 coprocessor
(Cortex-M3) • 1GB RAM, WiFi, Gigabit ethernet, HDMI, microSD, SATA • Touchscreen, camera, GPIO • Debian ARM kernel (armmp 3.16)
8

Understanding Embedded Linux Benchmarking Using Kernel Trace Analysis - Alexis Martin, ELC 2015
Tracing With LTTng• LTTng (lttng.org) open-source tracing framework:
• Trace engine: • kernel-space: kprobes & kernel tracepoints• user-space: user implemented tracepoints
• Viewing and analyzing: Trace compass (eclipse)
• Trace only the kernel to avoid benchmark code modifications
9

Understanding Embedded Linux Benchmarking Using Kernel Trace Analysis - Alexis Martin, ELC 2015
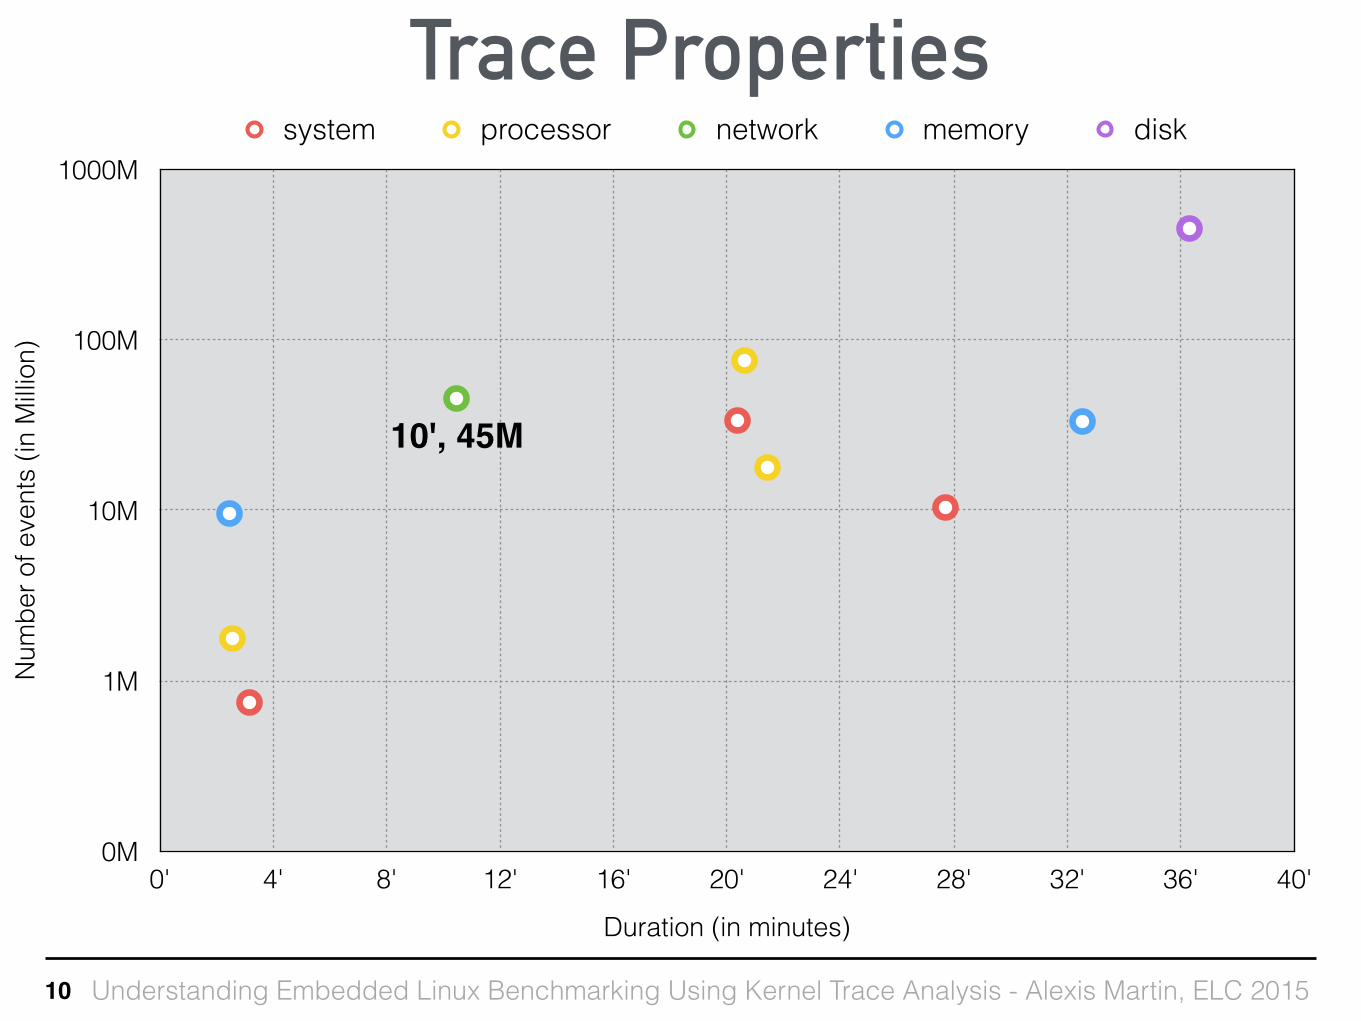
Trace Properties
10
Num
ber o
f eve
nts
(in M
illion
)
0M
1M
10M
100M
1000M
Duration (in minutes)
0' 4' 8' 12' 16' 20' 24' 28' 32' 36' 40'
system processor network memory disk
Understanding Embedded Linux Benchmarking Using Kernel Trace Analysis - Alexis Martin, ELC 2015
Trace Properties
10
Num
ber o
f eve
nts
(in M
illion
)
0M
1M
10M
100M
1000M
Duration (in minutes)
0' 4' 8' 12' 16' 20' 24' 28' 32' 36' 40'
system processor network memory disk
10', 45M

Understanding Embedded Linux Benchmarking Using Kernel Trace Analysis - Alexis Martin, ELC 2015
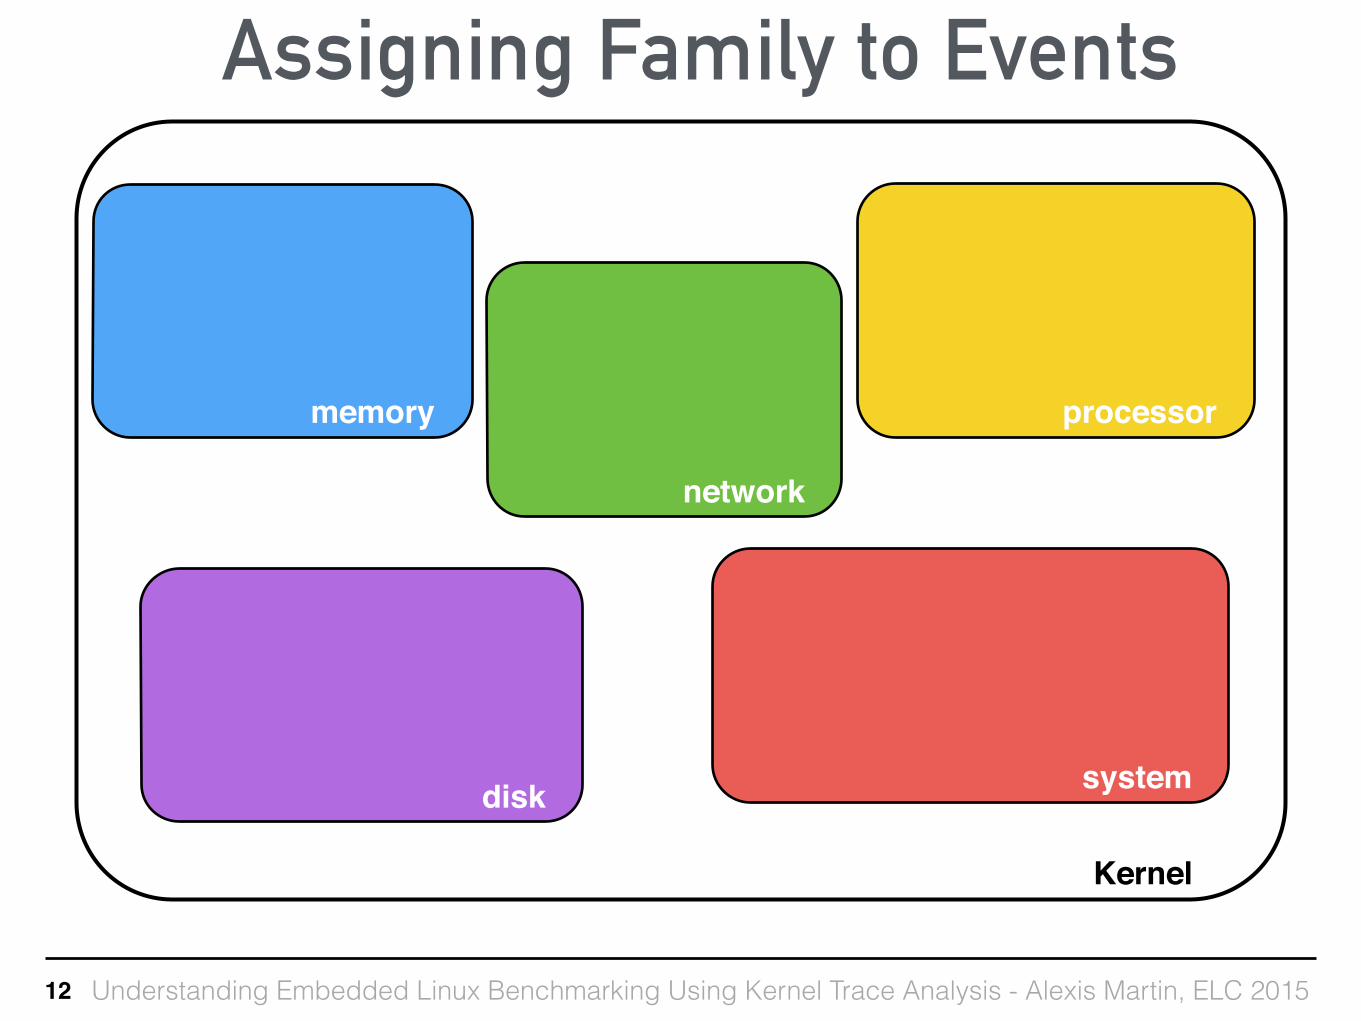
What does the Given Family Mean ?
• Phoronix gives us a family without explanations • Families are related to kernel functionalities • Compute family:
• Biggest number of events ?
➜ We want to check if the announced family corresponds to the computed one
11
Understanding Embedded Linux Benchmarking Using Kernel Trace Analysis - Alexis Martin, ELC 2015
Assigning Family to Events
12
Kernel
memory
systemdisk
processor
network

Understanding Embedded Linux Benchmarking Using Kernel Trace Analysis - Alexis Martin, ELC 2015
Assigning Family to Events
12
Kernel
memory
systemdisk
processor
network
mm_page_alloc mm_page_free kmem_cache_alloc …

Understanding Embedded Linux Benchmarking Using Kernel Trace Analysis - Alexis Martin, ELC 2015
Assigning Family to Events
12
Kernel
memory
systemdisk
processor
network
mm_page_alloc mm_page_free kmem_cache_alloc …
rpc_bind_status sock_rcvqueue_full net_dev_xmit …
scsi_eh_wakeup jbd2_commit_locking block_rq_insert …
workqueue_activate_work sched_switch rcu_utilization …
power_cpu_idle timer_init htimer_expire …

Understanding Embedded Linux Benchmarking Using Kernel Trace Analysis - Alexis Martin, ELC 2015
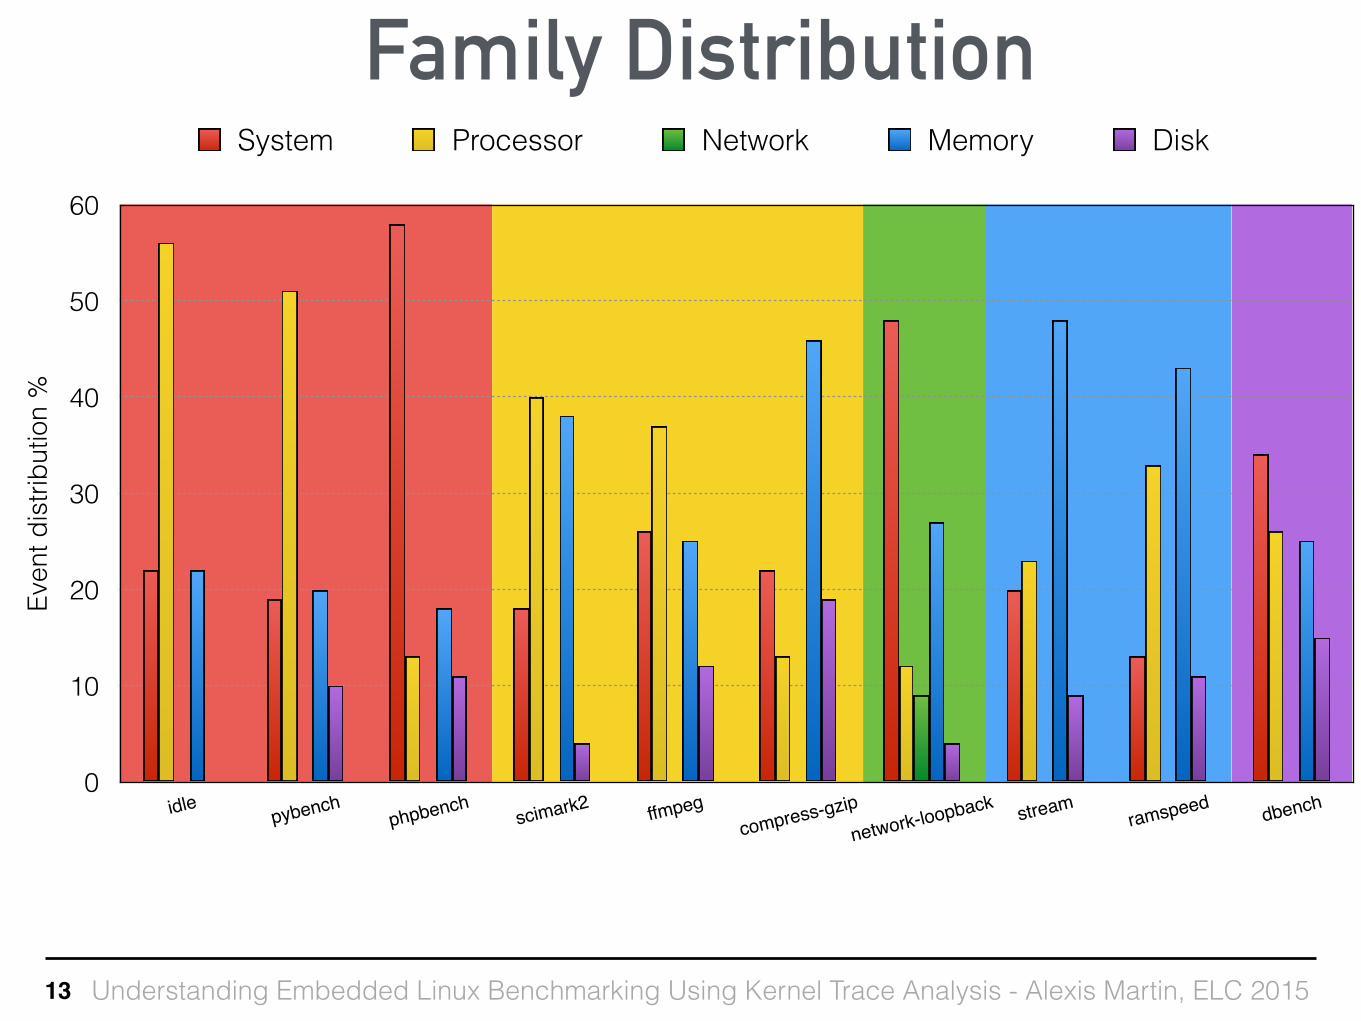
Family Distribution
13
Even
t dis
tribu
tion
%
0
10
20
30
40
50
60
idle pybench
phpbench scimark
2 ffmpegcompre
ss-gzipnetwork
-loopback stream ramspe
ed dbench
System Processor Network Memory Disk

Understanding Embedded Linux Benchmarking Using Kernel Trace Analysis - Alexis Martin, ELC 2015
Family Distribution
13
Even
t dis
tribu
tion
%
0
10
20
30
40
50
60
idle pybench
phpbench scimark
2 ffmpegcompre
ss-gzipnetwork
-loopback stream ramspe
ed dbench
System Processor Network Memory Disk

Understanding Embedded Linux Benchmarking Using Kernel Trace Analysis - Alexis Martin, ELC 2015
Family Distribution
13
Even
t dis
tribu
tion
%
0
10
20
30
40
50
60
idle pybench
phpbench scimark
2 ffmpegcompre
ss-gzipnetwork
-loopback stream ramspe
ed dbench
System Processor Network Memory Disk

Understanding Embedded Linux Benchmarking Using Kernel Trace Analysis - Alexis Martin, ELC 2015
Family Distribution
13
Even
t dis
tribu
tion
%
0
10
20
30
40
50
60
idle pybench
phpbench scimark
2 ffmpegcompre
ss-gzipnetwork
-loopback stream ramspe
ed dbench
System Processor Network Memory Disk
Understanding Embedded Linux Benchmarking Using Kernel Trace Analysis - Alexis Martin, ELC 2015
Even
t dis
tribu
tion
%
0
10
20
30
40
50
60
idle pybench
phpbench scimark
2 ffmpegcompre
ss-gzipnetwork
-loopback stream ramspe
ed dbench
System Processor Network Memory Disk
Family Distribution
13

Understanding Embedded Linux Benchmarking Using Kernel Trace Analysis - Alexis Martin, ELC 2015
Family Distribution
13
Even
t dis
tribu
tion
%
0
10
20
30
40
50
60
idle pybench
phpbench scimark
2 ffmpegcompre
ss-gzipnetwork
-loopback stream ramspe
ed dbench
System Processor Network Memory Disk

Understanding Embedded Linux Benchmarking Using Kernel Trace Analysis - Alexis Martin, ELC 2015
Family Distribution
13
Even
t dis
tribu
tion
%
0
10
20
30
40
50
60
idle pybench
phpbench scimark
2 ffmpegcompre
ss-gzipnetwork
-loopback stream ramspe
ed dbench
System Processor Network Memory Disk
✔ ✔ ✔ ✔ ✔

Understanding Embedded Linux Benchmarking Using Kernel Trace Analysis - Alexis Martin, ELC 2015
Family Distribution is not Enough
14
• Computed family = announced family ? • 5 matches over 10
• Kernel function is different from one to another benchmark
• No relation between announced and calculated families
• We trace only kernel part ➜ Check the distribution of time during which the
kernel is used

Understanding Embedded Linux Benchmarking Using Kernel Trace Analysis - Alexis Martin, ELC 2015
Kernel-time vs. User-time
15
✔ ✔ ✔ ✔ ✔
Time spent in kernel mode
Tim
e di
strib
utio
n %
0
25
50
75
100
idle pybench
phpbench scimark
2 ffmpegcompre
ss-gzipnetwork
-loopback stream ramspe
ed dbench

Understanding Embedded Linux Benchmarking Using Kernel Trace Analysis - Alexis Martin, ELC 2015
Kernel-time vs. User-time
15
✔ ✔ ✔ ✔ ✔
Time spent in kernel mode
Tim
e di
strib
utio
n %
0
25
50
75
100
idle pybench
phpbench scimark
2 ffmpegcompre
ss-gzipnetwork
-loopback stream ramspe
ed dbench
6578
63

Understanding Embedded Linux Benchmarking Using Kernel Trace Analysis - Alexis Martin, ELC 2015
Kernel-time vs. User-time
15
✔ ✔ ✔ ✔ ✔
Time spent in kernel mode
Tim
e di
strib
utio
n %
0
25
50
75
100
idle pybench
phpbench scimark
2 ffmpegcompre
ss-gzipnetwork
-loopback stream ramspe
ed dbench
7
6578
3129
63
2

Understanding Embedded Linux Benchmarking Using Kernel Trace Analysis - Alexis Martin, ELC 2015
Kernel-time vs. User-time
15
Long time spent in kernel mode ➜ Right computed family
Short time spent in kernel mode ➜ Wrong computed family
✔ ✔ ✔ ✔ ✔
Time spent in kernel mode
Tim
e di
strib
utio
n %
0
25
50
75
100
idle pybench
phpbench scimark
2 ffmpegcompre
ss-gzipnetwork
-loopback stream ramspe
ed dbench
7
6578
3129
63
474849
2

Understanding Embedded Linux Benchmarking Using Kernel Trace Analysis - Alexis Martin, ELC 2015
Do We Observe More Than the Benchmark ?
• Big stack of programs for running those benchmarks: ‣ ssh ‣ custom bash script ‣ LTTng ‣ Phoronix ‣ Benchmark
• Analyze overhead induced by those programs
➜ Observe events by processes
16

Understanding Embedded Linux Benchmarking Using Kernel Trace Analysis - Alexis Martin, ELC 2015
Time Spent by Processes
17
Tim
e di
strib
utio
n %
0
20
40
60
80
100
idlepybench
phpbenchscimark2 ffmpeg
compress-gzipnetwork-loopback stream
ramspeed dbench
Application Phoronix LTTng Swapper Other
✔ ✔ ✔ ✔ ✔

Understanding Embedded Linux Benchmarking Using Kernel Trace Analysis - Alexis Martin, ELC 2015
Time Spent by Processes
17
✔ ✔ ✔ ✔ ✔
Tim
e di
strib
utio
n %
0
20
40
60
80
100
idlepybench
phpbenchscimark2 ffmpeg
compress-gzipnetwork-loopback stream
ramspeed dbench
Application Phoronix LTTng Swapper Other

Understanding Embedded Linux Benchmarking Using Kernel Trace Analysis - Alexis Martin, ELC 2015
Time Spent by Processes
17
Swapper = idle Phoronix: low intrusion✔ ✔ ✔ ✔ ✔
Tim
e di
strib
utio
n %
0
20
40
60
80
100
idlepybench
phpbenchscimark2 ffmpeg
compress-gzipnetwork-loopback stream
ramspeed dbench
Application Phoronix LTTng Swapper Other

Understanding Embedded Linux Benchmarking Using Kernel Trace Analysis - Alexis Martin, ELC 2015
Event Distribution by Processes
18
✔ ✔ ✔ ✔ ✔
Even
t dis
tribu
tion
%
0
20
40
60
80
100
idlepybench
phpbenchscimark2 ffmpeg
compress-gzipnetwork-loopback stream
ramspeed dbench
Application Phoronix LTTng Swapper Other

Understanding Embedded Linux Benchmarking Using Kernel Trace Analysis - Alexis Martin, ELC 2015
Event Distribution by Processes
18
LTTng produces a huge number of events✔ ✔ ✔ ✔ ✔
Even
t dis
tribu
tion
%
0
20
40
60
80
100
idlepybench
phpbenchscimark2 ffmpeg
compress-gzipnetwork-loopback stream
ramspeed dbench
Application Phoronix LTTng Swapper Other

Understanding Embedded Linux Benchmarking Using Kernel Trace Analysis - Alexis Martin, ELC 2015
Analysis of LTTng Overhead
• Not easy to get only events from the benchmark • Names depend on benchmark • Some benchmarks are not only a single program
• several instances of the same program • network-loopback = cat + dd + netcat
• Overhead comes mainly from LTTng • LTTng overhead is easy to remove from trace
• Get events from process by name and extract it ➜ Overhead removed, we observe only the benchmark
19

Understanding Embedded Linux Benchmarking Using Kernel Trace Analysis - Alexis Martin, ELC 2015
LTTng Overhead Profile
20
Even
t dis
tribu
tion
%
0
20
40
60
80
100
idle pybench
phpbench scimark
2 ffmpegcompre
ss-gzipnetwork
-loopback stream ramspe
ed dbench
System Processor Network Memory Disk
✔ ✔ ✔ ✔ ✔

Understanding Embedded Linux Benchmarking Using Kernel Trace Analysis - Alexis Martin, ELC 2015
LTTng Overhead Profile
20
Even
t dis
tribu
tion
%
0
20
40
60
80
100
idle pybench
phpbench scimark
2 ffmpegcompre
ss-gzipnetwork
-loopback stream ramspe
ed dbench
System Processor Network Memory Disk
Stable using of kernel events✔ ✔ ✔ ✔ ✔

Understanding Embedded Linux Benchmarking Using Kernel Trace Analysis - Alexis Martin, ELC 2015
Real Benchmark Profile
21
Even
t dis
tribu
tion
%
0
20
40
60
80
100
idle pybench
phpbench scimark
2 ffmpegcompre
ss-gzipnetwork
-loopback stream ramspe
ed dbench
✔ ✔ ✔ ✔ ✔
Even
t dis
tribu
tion
%
0
20
40
60
80
100
idle pybench
phpbench scimark
2 ffmpegcompre
ss-gzipnetwork
-loopback stream ramspe
ed dbench
System Processor Network Memory Disk

Understanding Embedded Linux Benchmarking Using Kernel Trace Analysis - Alexis Martin, ELC 2015
Conclusion• Benchmark results:
• Better understanding of benchmarking programs • Profile the kernel use (families, duration) • What can impact the performance
• Most used benchmarks on phoronix are very different • Different profiles for similar tests
• Intrusiveness of used tools: • Phoronix is not intrusive • LTTng produces many kernel events
• Constant profile (memory + disk) • We know how to remove this overhead for the
analysis ➜ Generic way to analyze benchmarks
22

Understanding Embedded Linux Benchmarking Using Kernel Trace Analysis - Alexis Martin, ELC 2015
Acknowledgment• This work was done and funded within the SoC-TRACE project (link)
• French ministry of industry • Inria, UJF, STMicroelectronics, ProbaYes
• Framesoc tool is an outcome of this project(soctrace-inria.github.io/framesoc/)
• Framework for the management and analysis of traces
23
Understanding Embedded Linux Benchmarking Using Kernel Trace Analysis - Alexis Martin, ELC 2015
Thank You !
24


