Download - Alpine ML Talk: Vtreat: A Package for Automating Variable Treatment in R By Nina Zumel (Win-Vector)
vtreat: A Package for Automating Variable
Treatment in RNina Zumel & John Mount
Win-Vector, LLC
Outline
Typical data problems & Possible solutions
vtreat: Automating variable treatment in R

Data Cleaning: Typical problems
“Bad” numerical values (NA, NaN, sentinel values)
Categorical variables: missing values, missing levels
Categorical variables: too many levels
Invalid values
Out of range numerical values
Invalid category levels
We won’t discuss the last issue !Of course, we need to get our hands in the data, but the procedure for treating the first three problems will be the same in most situations. Might as well automate it
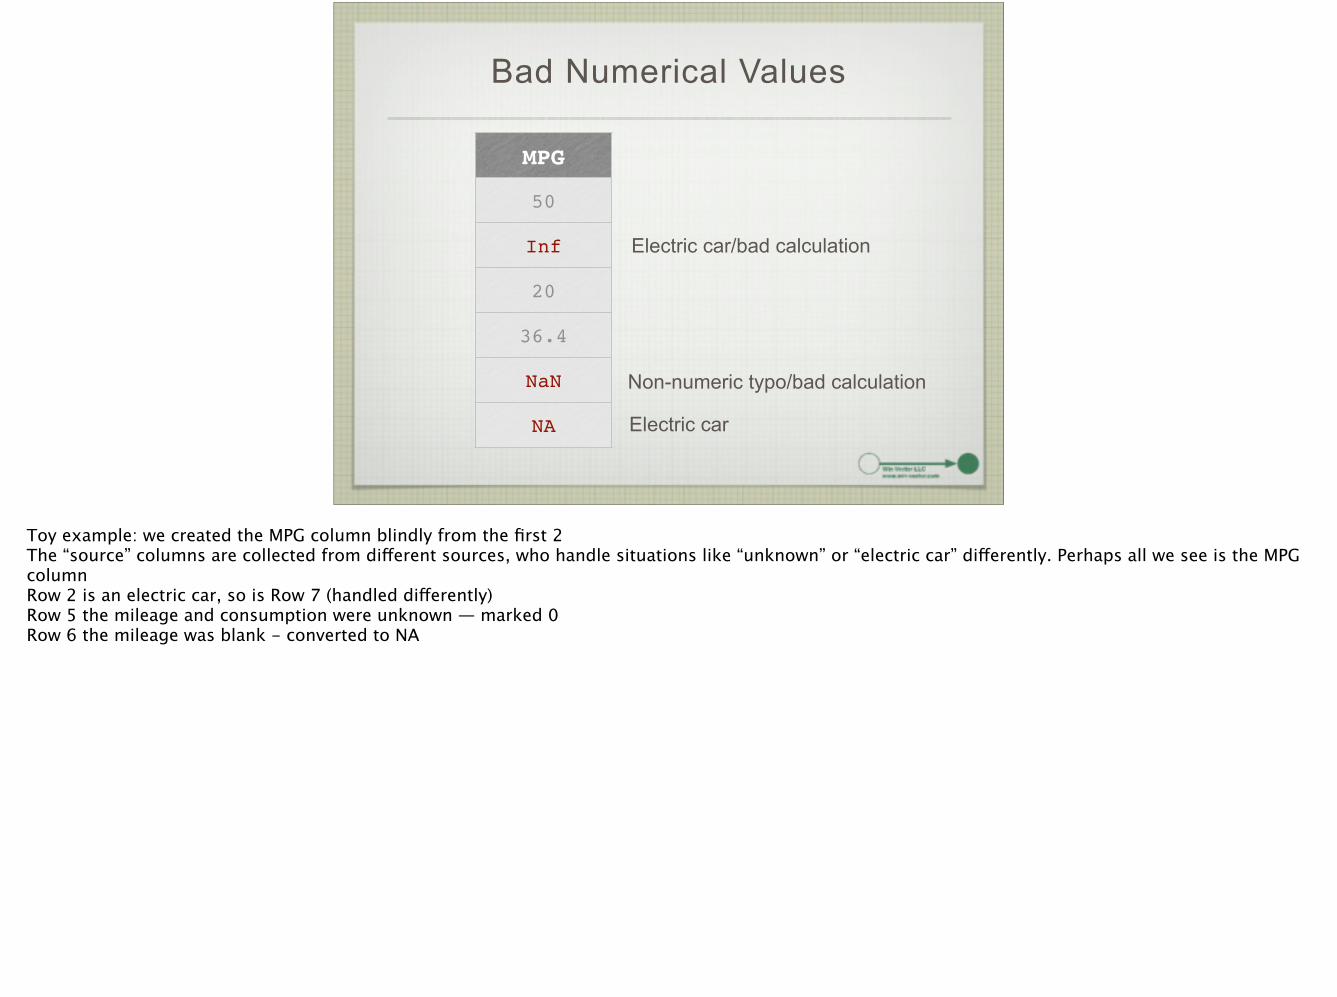
Bad Numerical Values
MPG
50
Inf
20
36.4
NaN
NA
Electric car/bad calculation
Electric car
Non-numeric typo/bad calculation
Toy example: we created the MPG column blindly from the first 2 The “source” columns are collected from different sources, who handle situations like “unknown” or “electric car” differently. Perhaps all we see is the MPG column Row 2 is an electric car, so is Row 7 (handled differently) Row 5 the mileage and consumption were unknown — marked 0 Row 6 the mileage was blank - converted to NA

Whither Bad Values?
“Faulty Sensor” — values are missing at random
Assume they come from the same distribution as the other values
The mean of the “good” values is a reasonable stand-in
Systematically missing
Electric cars
They WILL behave differently from gas or hybrid cars
The mean of the good values is not a valid stand-in
The “right” fix depends on why you have bad values. !Faulty Sensor — will usually be all NAs (not NaNs, Infs)

One Possible Solution
MPG
50
Inf
20
36.4
NaN
NA
MPG MPG_isBad
50 FALSE
35.5 TRUE
20 FALSE
36.4 FALSE
35.5 TRUE
35.5 TRUE
This solution - replace bad values with the mean of the non-bad values, use an additional column to mark the bad values !35.5 is the average mileage of the “good” values !If we have a faulty sensor, then the second column is uninformative. If we have systematic missingness, then the second column can help compensate for the poor estimate we are using (the mean). Let the machine learning algorithm figure it out.
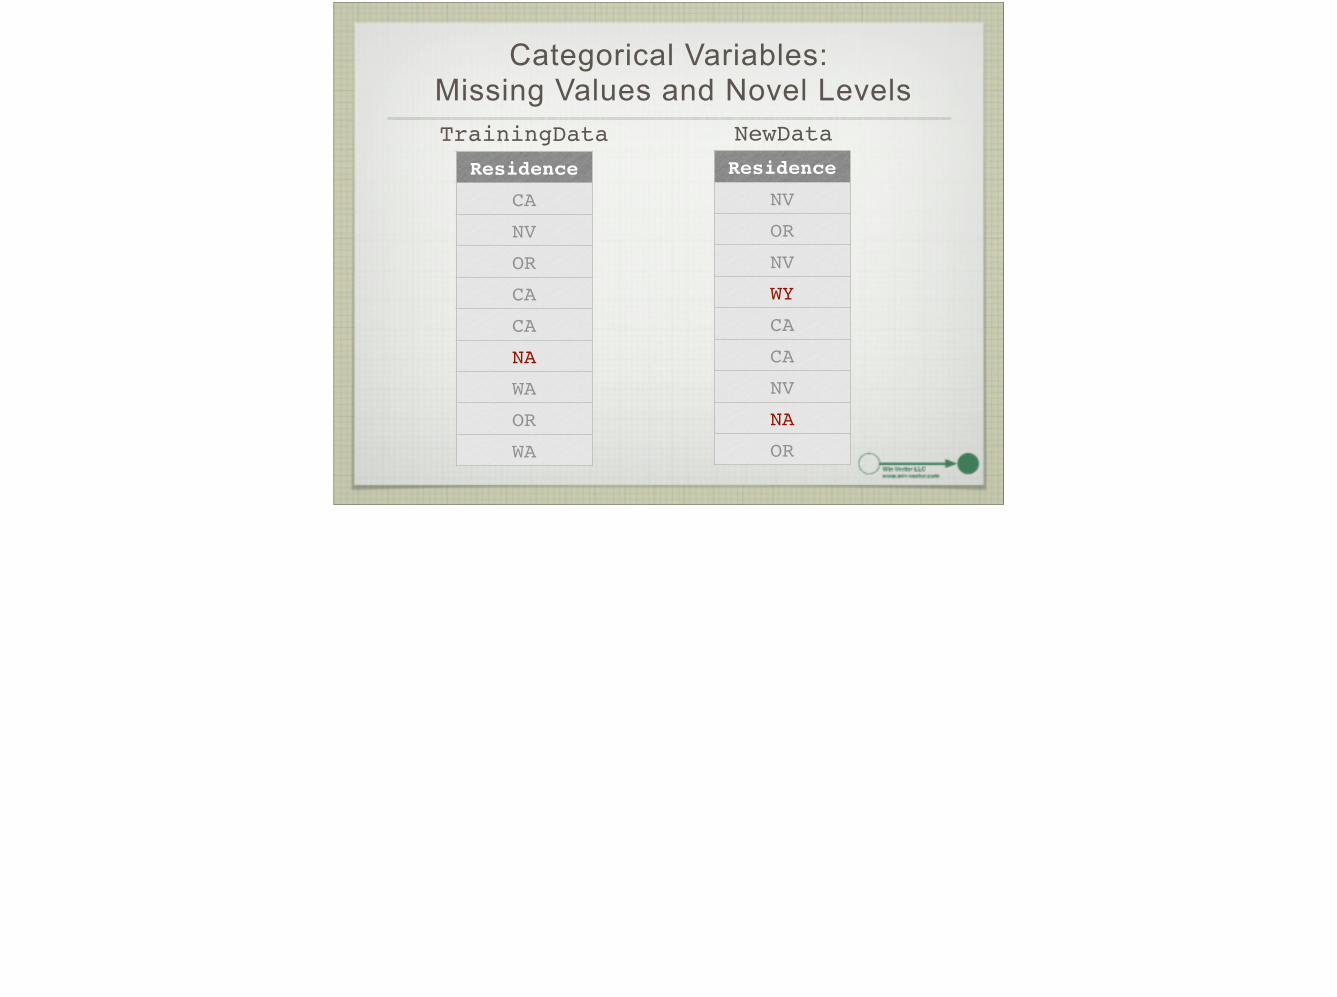
Categorical Variables: Missing Values and Novel Levels
Residence
CA
NV
OR
CA
CA
NA
WA
OR
WA
Residence
NV
OR
NV
WY
CA
CA
NV
NA
OR
TrainingData NewData
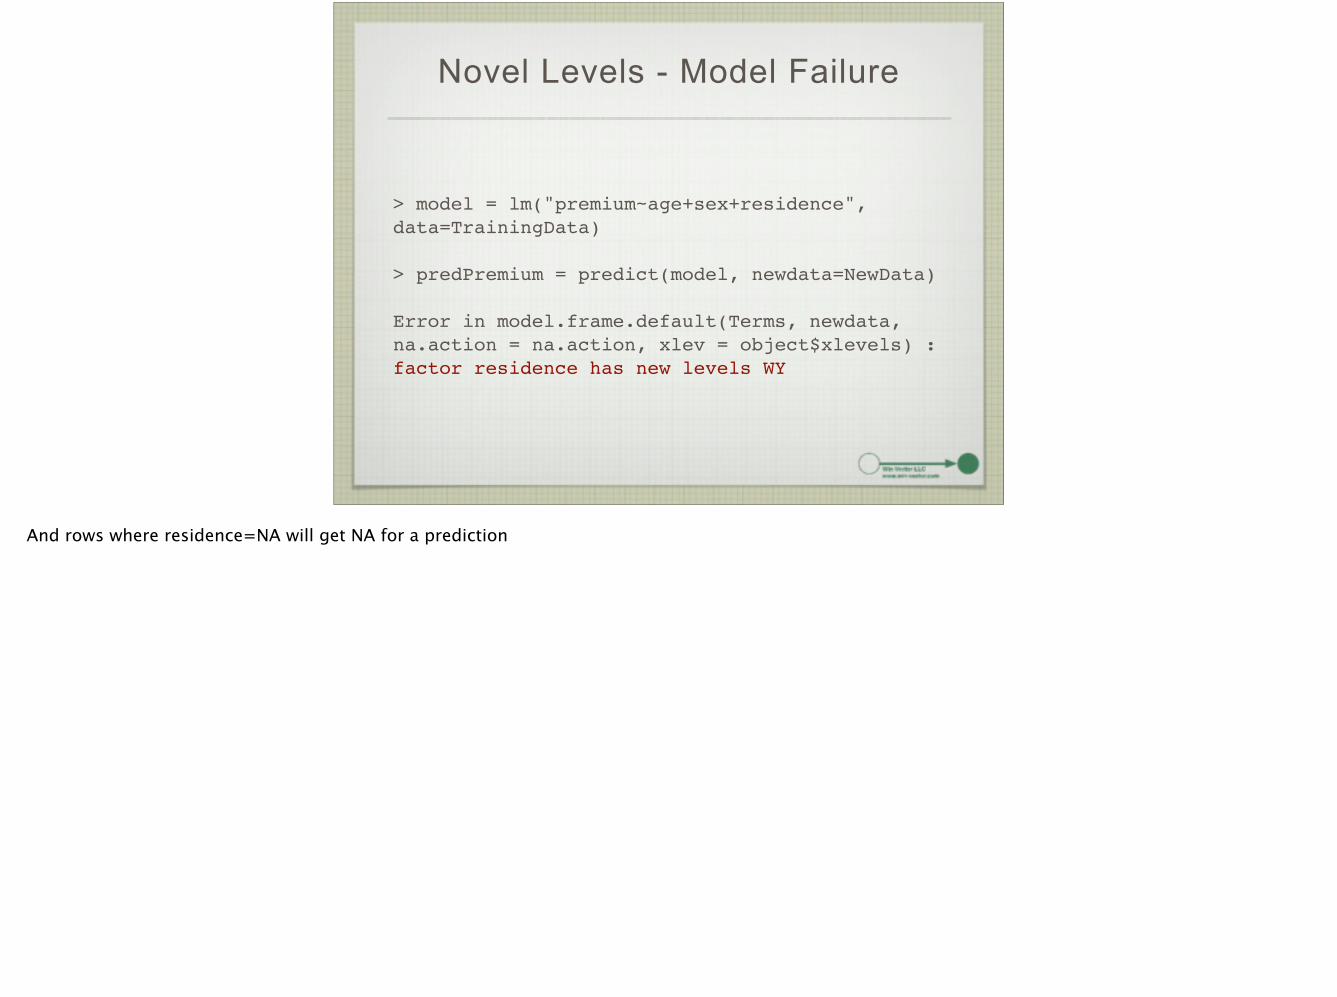
Novel Levels - Model Failure
> model = lm("premium~age+sex+residence", data=TrainingData)!!> predPremium = predict(model, newdata=NewData)!!Error in model.frame.default(Terms, newdata, na.action = na.action, xlev = object$xlevels) : factor residence has new levels WY
And rows where residence=NA will get NA for a prediction
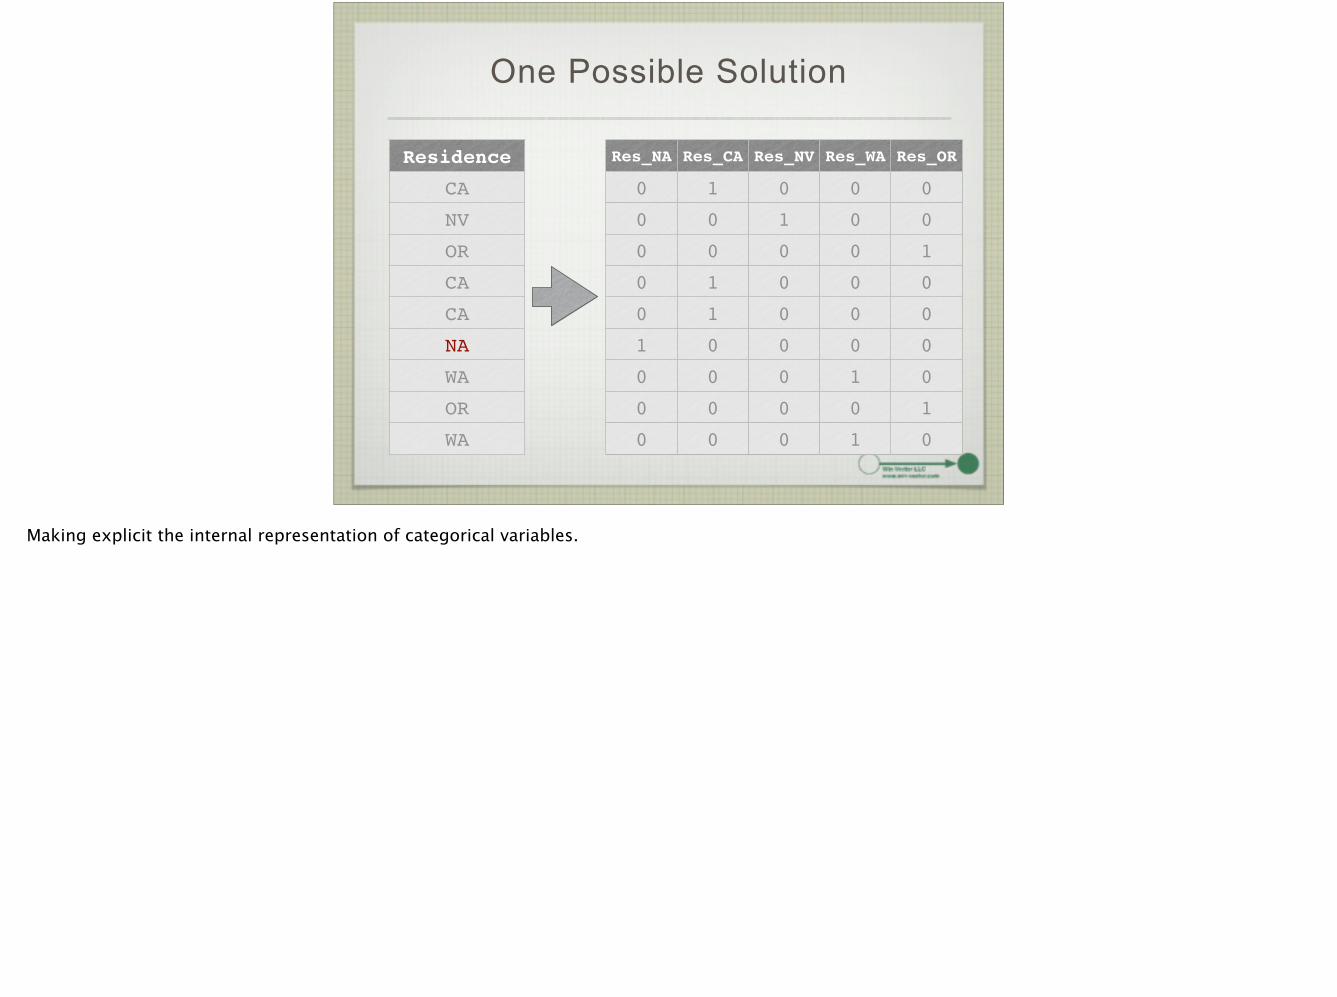
One Possible Solution
Residence
CA
NV
OR
CA
CA
NA
WA
OR
WA
Res_NA Res_CA Res_NV Res_WA Res_OR
0 1 0 0 0
0 0 1 0 0
0 0 0 0 1
0 1 0 0 0
0 1 0 0 0
1 0 0 0 0
0 0 0 1 0
0 0 0 0 1
0 0 0 1 0
Making explicit the internal representation of categorical variables.

Representing a Novel Level as a Censored Level
Residence
WY
Res_NA Res_CA Res_NV Res_WA Res_OR
1/9 1/3 1/9 2/9 2/9
Training Data ProportionsNA CA NV WA OR
1/9 1/3 1/9 2/9 2/9
A novel level is weighted proportional to known levels
If WY is a transcription error or invalid level, then this representation says we don’t know what the value of Residence is, but we assume it to be any possible known level in the correct proportions — Bayesian “no information” assumption !If it’s truly a novel error, the representation isn’t as meaningful, but at least we will get *some* answer (and won’t crash the entire scoring run).
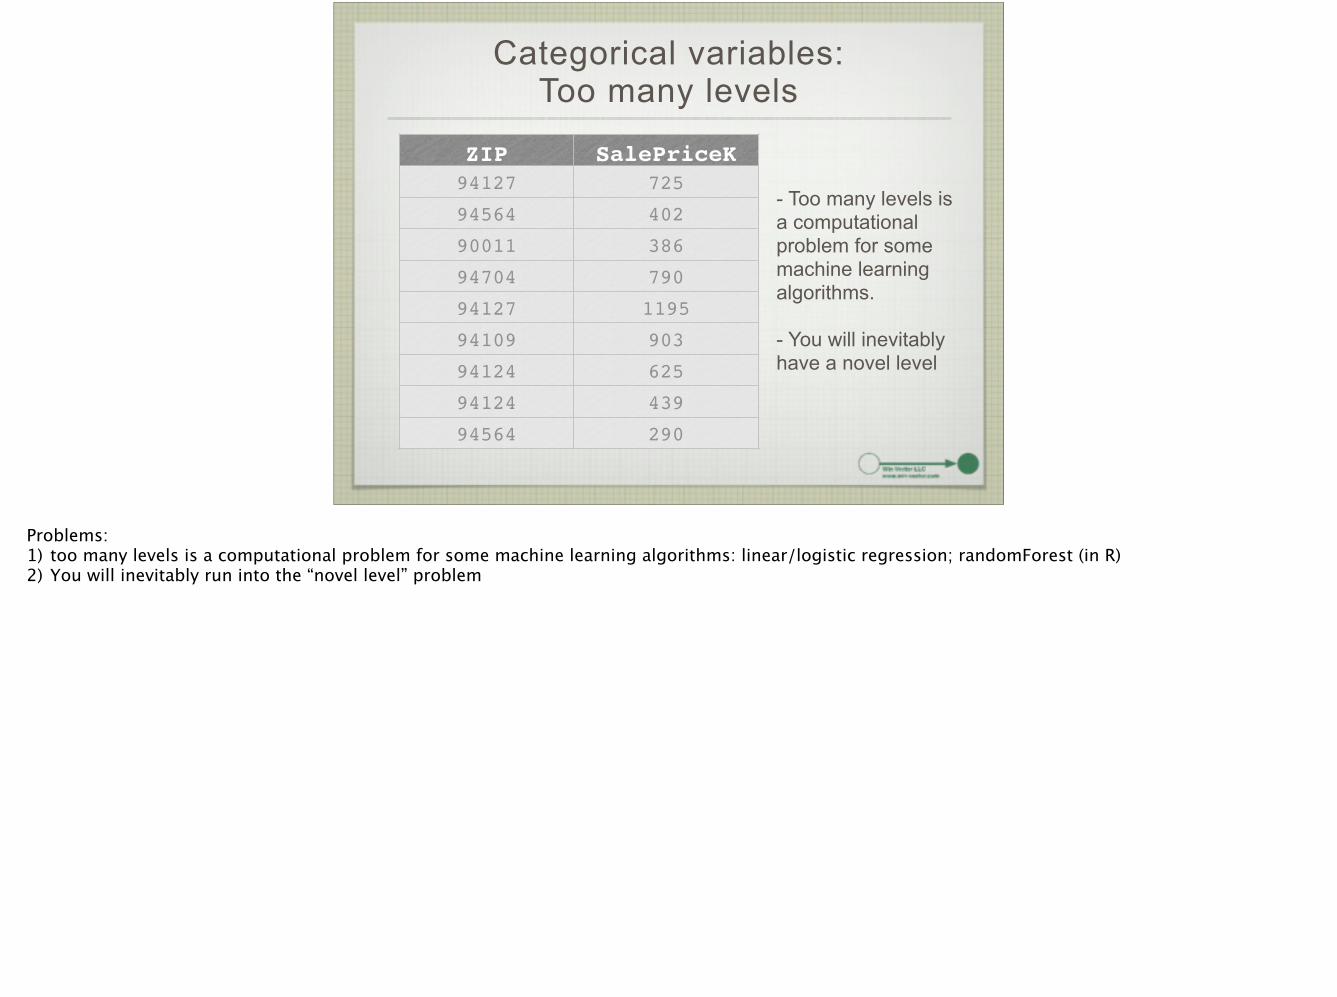
Categorical variables: Too many levels
ZIP SalePriceK94127 725
94564 402
90011 386
94704 790
94127 1195
94109 903
94124 625
94124 439
94564 290
- Too many levels is a computational problem for some machine learning algorithms. !- You will inevitably have a novel level
Problems: 1) too many levels is a computational problem for some machine learning algorithms: linear/logistic regression; randomForest (in R) 2) You will inevitably run into the “novel level” problem !

Solution: “Impact Coding”
ZIP avgPriceK ZIP_impact
90011 386 -253.4
94109 903 263.6
94124 532 -107.4
94127 960 320.6
94564 346 -293.4
94704 790 150.6
globalAvg 639.4 0
Impact coding is transforming the original categorical variable by a single variable Bayesian model for the change from the mean output (the “impact” of the variable on the output). The transformed numerical variable has a more concise representation for modeling, assuming we are trying to predict sales prices of homes. !Here’s the data we need to create the impact coding for our example. !Information on impact coding: !http://www.win-vector.com/blog/2012/07/modeling-trick-impact-coding-of-categorical-variables-with-many-levels/ !http://www.win-vector.com/blog/2012/08/a-bit-more-on-impact-coding/
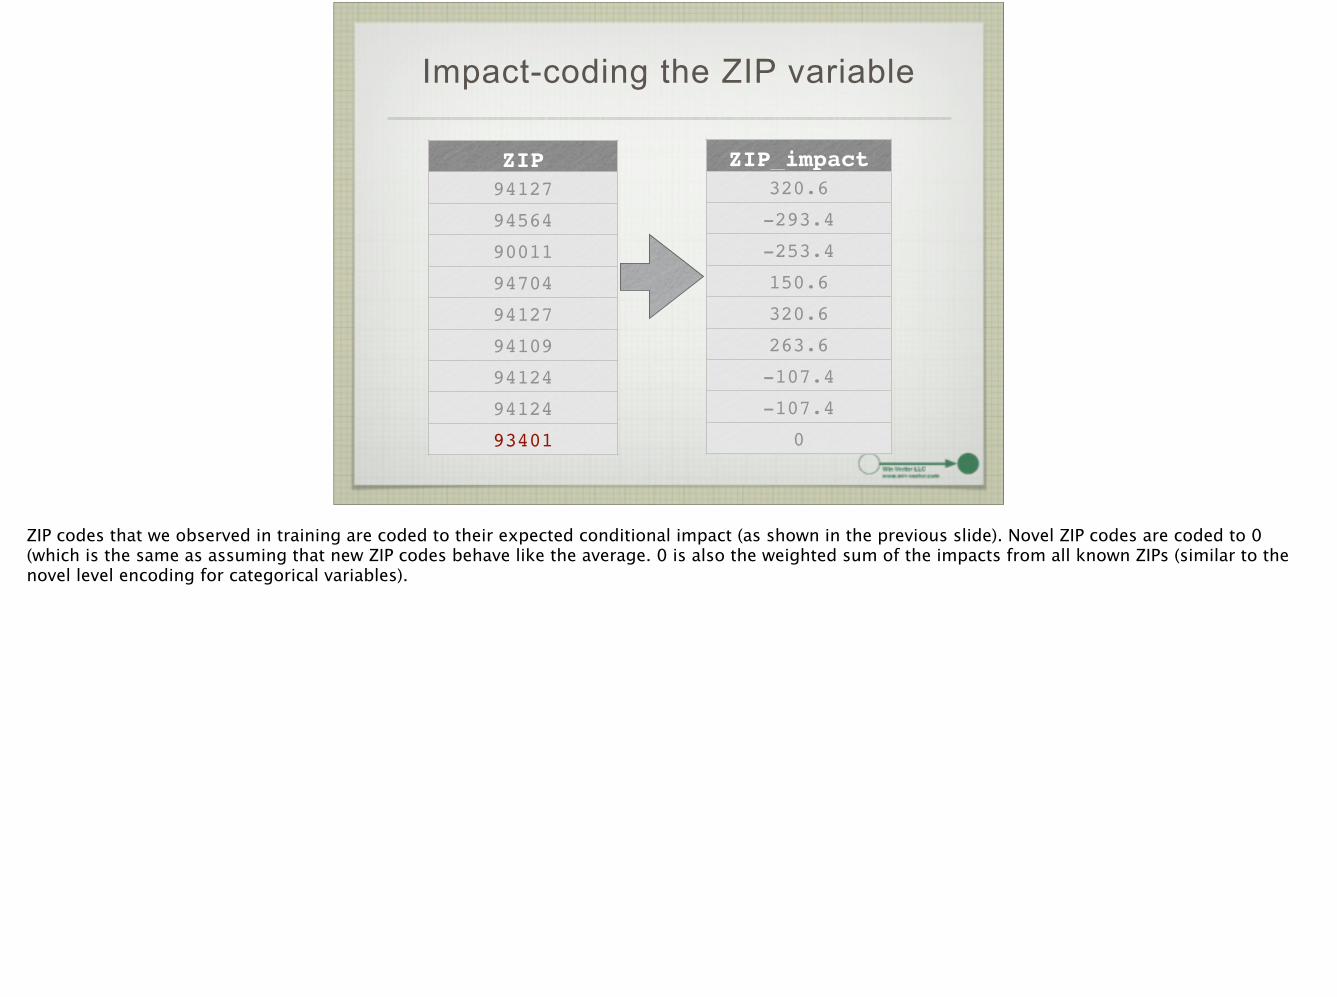
Impact-coding the ZIP variable
ZIP94127
94564
90011
94704
94127
94109
94124
94124
93401
ZIP_impact320.6
-293.4
-253.4
150.6
320.6
263.6
-107.4
-107.4
0
ZIP codes that we observed in training are coded to their expected conditional impact (as shown in the previous slide). Novel ZIP codes are coded to 0 (which is the same as assuming that new ZIP codes behave like the average. 0 is also the weighted sum of the impacts from all known ZIPs (similar to the novel level encoding for categorical variables). !
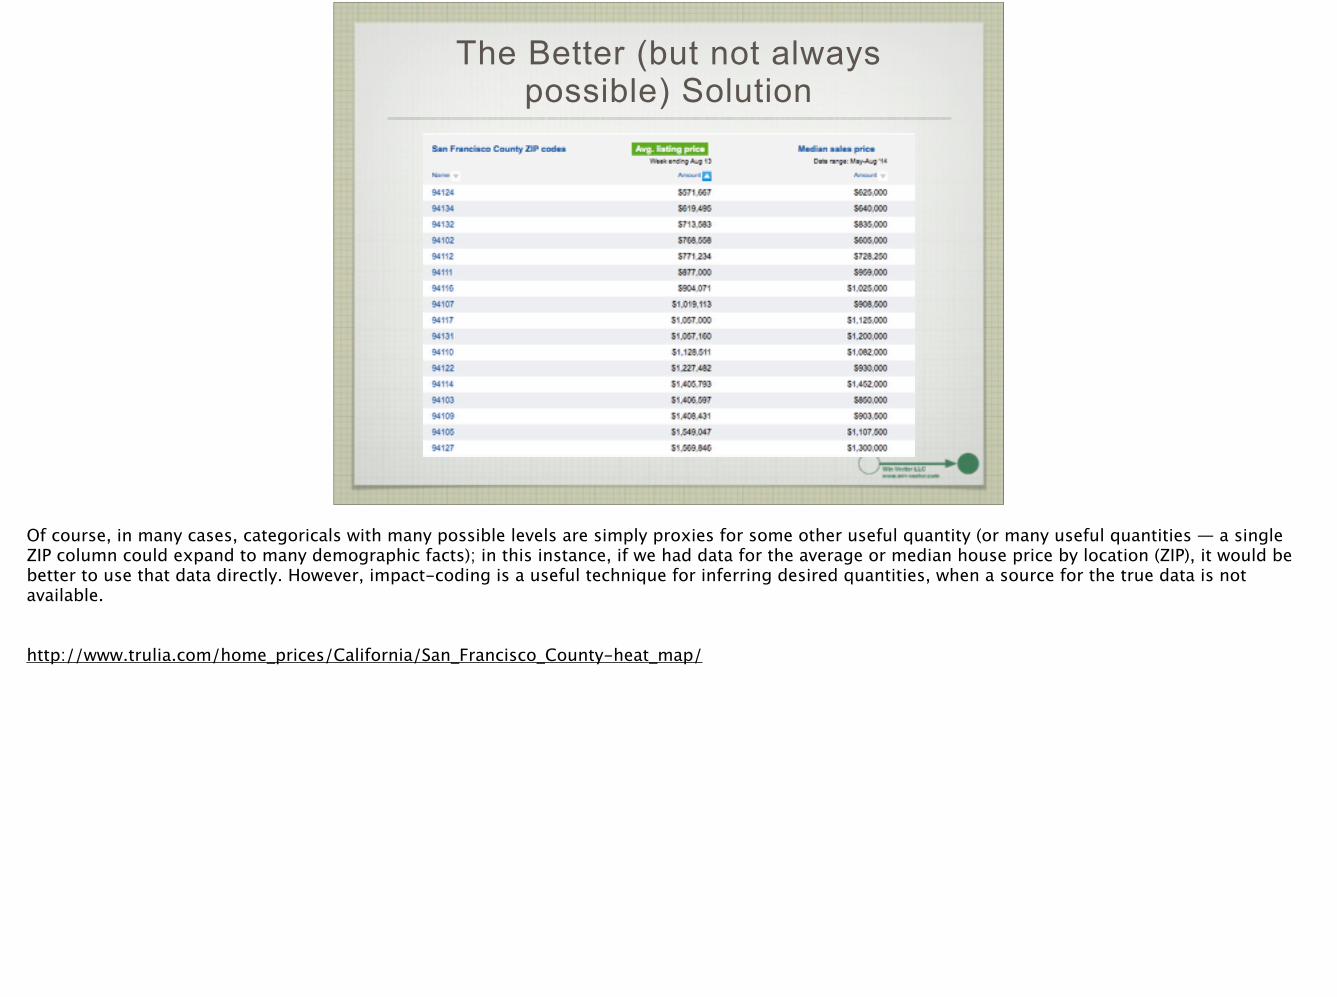
The Better (but not always possible) Solution
Of course, in many cases, categoricals with many possible levels are simply proxies for some other useful quantity (or many useful quantities — a single ZIP column could expand to many demographic facts); in this instance, if we had data for the average or median house price by location (ZIP), it would be better to use that data directly. However, impact-coding is a useful technique for inferring desired quantities, when a source for the true data is not available. !!http://www.trulia.com/home_prices/California/San_Francisco_County-heat_map/
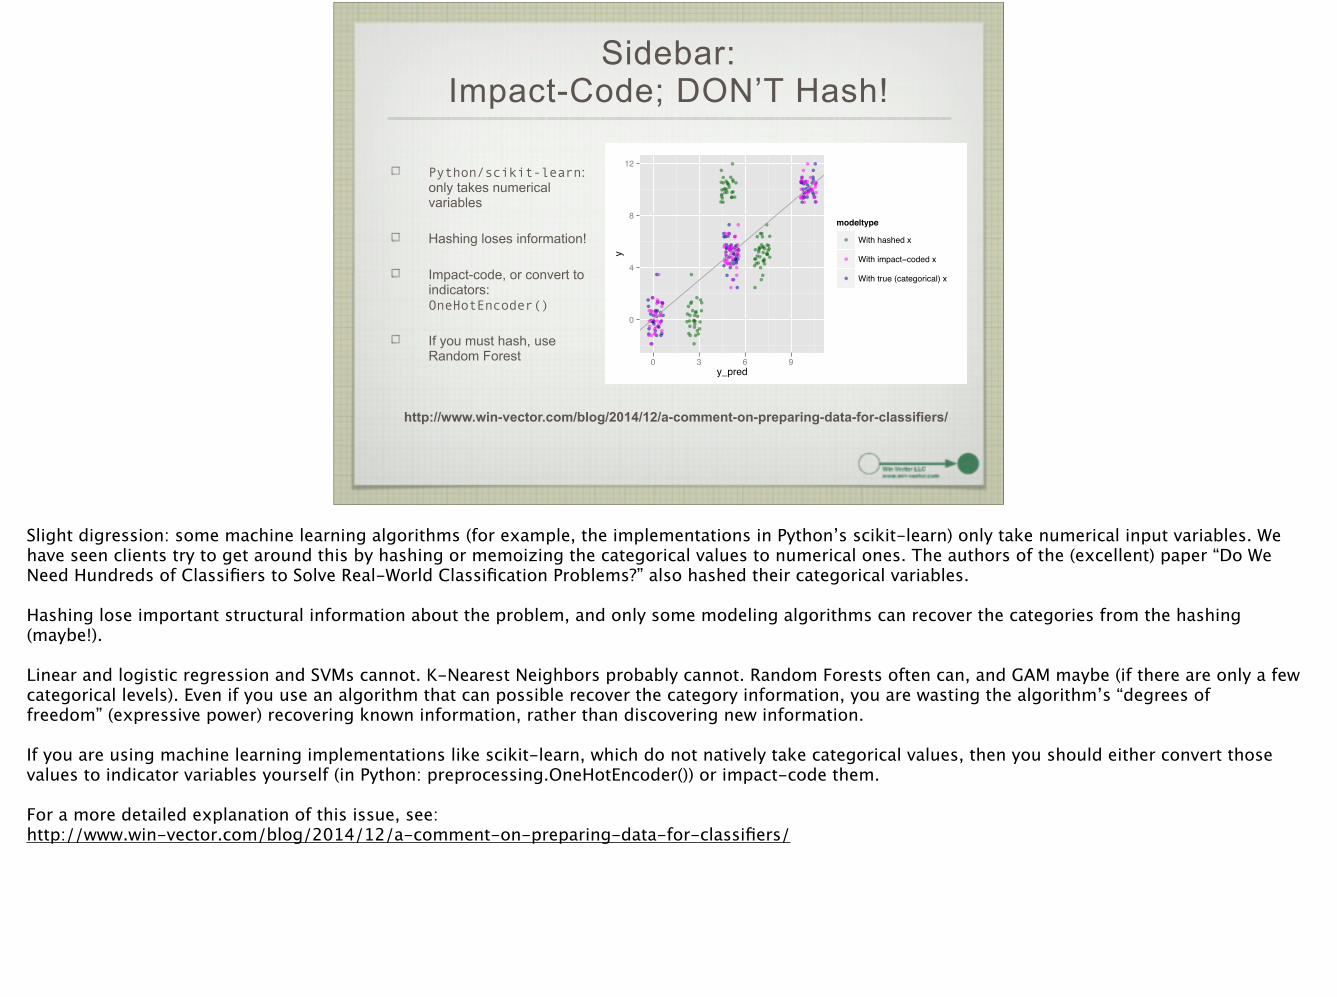
Sidebar: Impact-Code; DON’T Hash!
Python/scikit-learn: only takes numerical variables
Hashing loses information!
Impact-code, or convert to indicators: OneHotEncoder()
If you must hash, use Random Forest
0
4
8
12
0 3 6 9y_pred
y
modeltype
With hashed x
With impact−coded x
With true (categorical) x
http://www.win-vector.com/blog/2014/12/a-comment-on-preparing-data-for-classifiers/
Slight digression: some machine learning algorithms (for example, the implementations in Python’s scikit-learn) only take numerical input variables. We have seen clients try to get around this by hashing or memoizing the categorical values to numerical ones. The authors of the (excellent) paper “Do We Need Hundreds of Classifiers to Solve Real-World Classification Problems?” also hashed their categorical variables. !Hashing lose important structural information about the problem, and only some modeling algorithms can recover the categories from the hashing (maybe!). !Linear and logistic regression and SVMs cannot. K-Nearest Neighbors probably cannot. Random Forests often can, and GAM maybe (if there are only a few categorical levels). Even if you use an algorithm that can possible recover the category information, you are wasting the algorithm’s “degrees of freedom” (expressive power) recovering known information, rather than discovering new information. !If you are using machine learning implementations like scikit-learn, which do not natively take categorical values, then you should either convert those values to indicator variables yourself (in Python: preprocessing.OneHotEncoder()) or impact-code them. !For a more detailed explanation of this issue, see: http://www.win-vector.com/blog/2014/12/a-comment-on-preparing-data-for-classifiers/
Automating Variable Treatment in R:
vtreat!
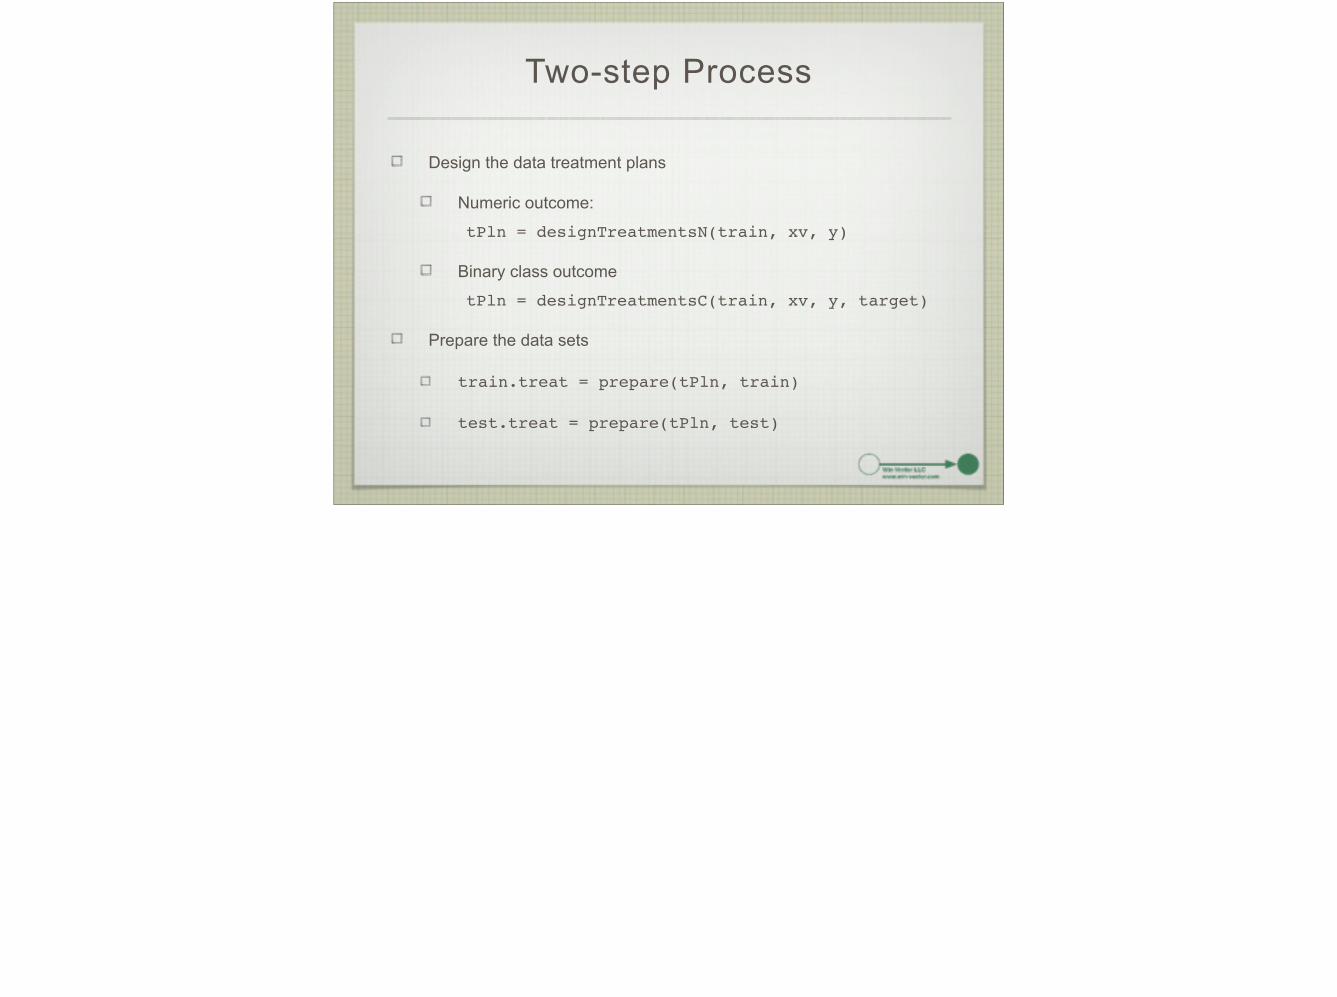
Two-step Process
Design the data treatment plans
Numeric outcome:
tPln = designTreatmentsN(train, xv, y)!
Binary class outcome
tPln = designTreatmentsC(train, xv, y, target)!
Prepare the data sets
train.treat = prepare(tPln, train)!
test.treat = prepare(tPln, test)

Designing the Treatment Plans: Numeric Output
salePrice ~ ZIP + homeType + numBed + numBath + sqFt
treatPlan = designTreatmentsN(train, !c(“ZIP”, “homeType”, “numBed”, “numBath”, “sqFt”), !
“salePrice”)
list of treatmentplan
objects training data
list of input variables to be treated numerical outcome
variable
Predicting home sale price ZIP : large categorical homeType: small categorical (say, “single-family”, “condo”, “townhouse”, “flat”) numBed, numBath, sqFt: numerical

Example Input
ZIP homeType numBed numBath sqFt salePrice! 94499 condo 4 4 1025 815678! 94403 condo 2 3 1082 600635! 94361 townhouse 1 3 751 444609! 94115 condo 2 3 1093 349433! 94217 <NA> NA 3 914 692468
treatPlan = designTreatmentsN(train, !c(“ZIP”, “homeType”, “numBed”, “numBath”, “sqFt”), !
“salePrice”)
many-level categorical
categorical numeric

Using the treatment plan to prepare data
df.treat = prepare(treatPlan, df)df is any frame of appropriate format (training or test)
ZIP_catN homeType_lev_NA homeType_lev_x.condo homeType_lev_x.loft! 190033.174 0 1 0! -5320.826 0 1 0! 35596.174 0 0 0! -119202.826 0 1 0! -94775.326 1 0 0!! homeType_lev_x.single.family homeType_lev_x.townhouse numBed_clean numBed_isBAD! 0 0 4.000000 0! 0 0 2.000000 0! 0 1 1.000000 0! 0 0 2.000000 0! 0 0 2.456325 1!! numBath_clean numBath_isBAD sqFt_clean salePrice! 4.000000 0 1025 815678! 3.000000 0 1082 600635! 3.000000 0 751 444609! 3.000000 0 1093 349433! 3.000000 0 914 692468
vtreat determines automatically whether a categorical variable should be impact coded, based on whether or not there are too many “rare levels” — too many levels that are off most of the time. By default “off too much” = on less than 2% of the time, and “too many rare levels” = the number of rare levels combined represent more than 4% of the data. These thresholds can be changed using the minFraction and maxMissing arguments to designTreatmentsN() and designTreatmentsC()
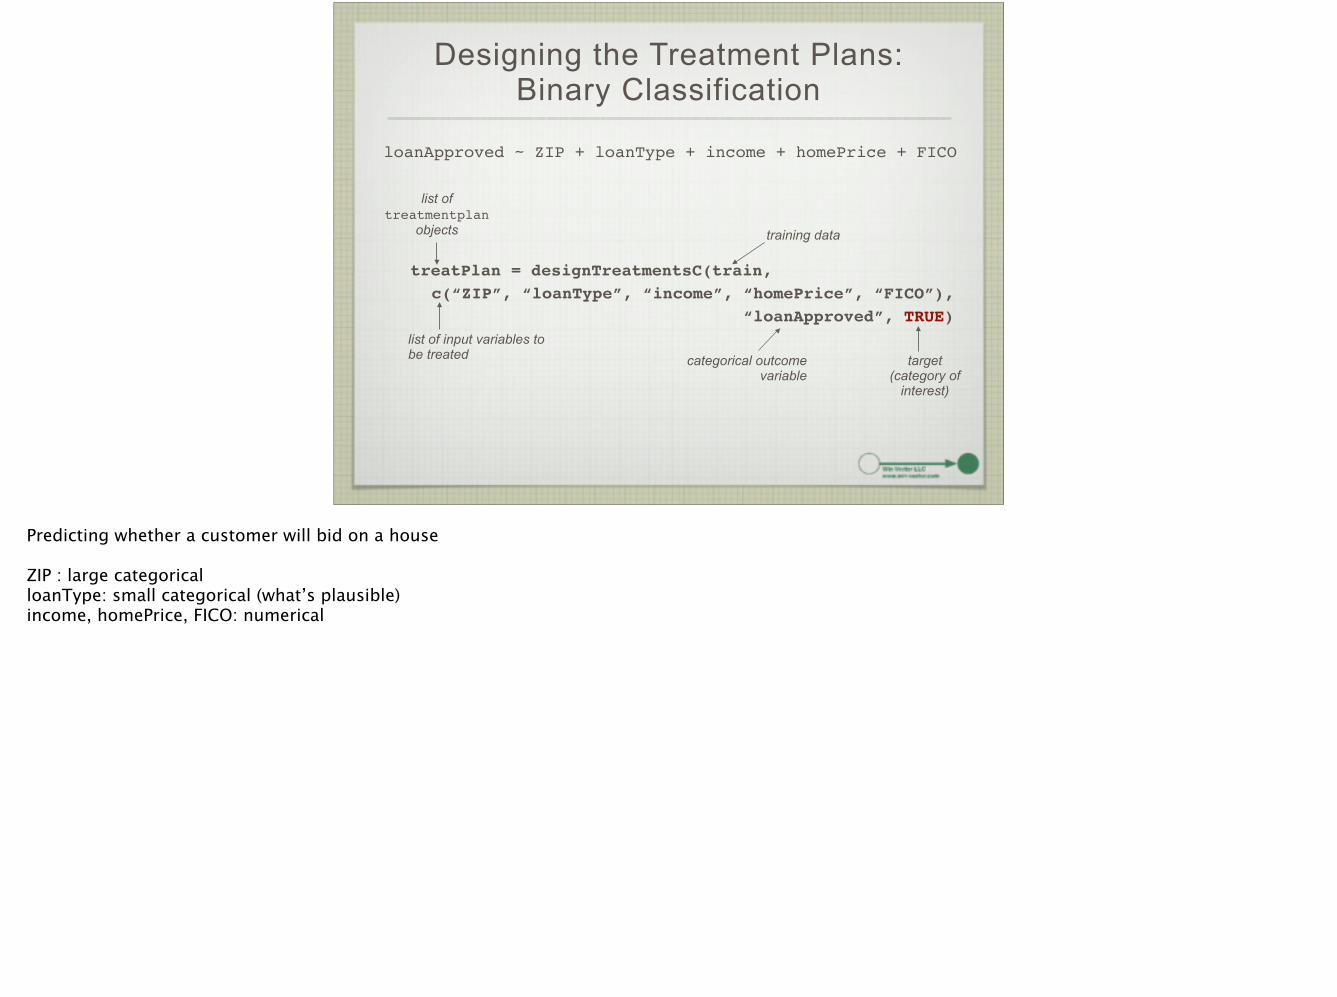
Designing the Treatment Plans: Binary Classification
loanApproved ~ ZIP + loanType + income + homePrice + FICO
treatPlan = designTreatmentsC(train, !c(“ZIP”, “loanType”, “income”, “homePrice”, “FICO”), !
“loanApproved”, TRUE)
list of treatmentplan
objects training data
list of input variables to be treated categorical outcome
variabletarget
(category of interest)
Predicting whether a customer will bid on a house !ZIP : large categorical loanType: small categorical (what’s plausible) income, homePrice, FICO: numerical

Variable Importance Scores

Simple Example
N = 1000!df=data.frame(x1=rnorm(N, mean=10),! x2=runif(N, min=5, max=15))!df$y=with(df, 2*x1+rnorm(N)) # only x1 affects y!!treatPlan = designTreatmentsN(df, c("x1","x2"), “y")!treatPlan$varScores!!# $x1_clean!# [1] 0.1833111!# !# $x2_clean!# [1] 1.000069

varScore: Based on Press Statistic
Press Statistic of a model: Sum of variances of all hold-one-out models (Predicted Residual Sum of Squares)
sum of (yi - fi)2
yi = outcome of ith data point
fi = prediction of model built using all data points except the ith
measure of predictive power
http://www.win-vector.com/blog/2014/09/estimating-generalization-error-with-the-press-statistic/

varScore: indication of variable importance
varScore of jth variable, xj:
Press statistic of lm(y~xj) / Press statistic of mean(y)
Smaller is better.
varScore ≥ 1: xj predicts outcome no better than mean(y)
By default, prepare() prunes variables with varScore > 0.99

treatPlan$varScores!# $x1_clean!# [1] 0.1833111!# !# $x2_clean!# [1] 1.000069!!df.treat = prepare(treatPlan, df)!summary(df.treat)!# x1_clean y !# Min. : 7.365 Min. :13.75 !# 1st Qu.: 9.372 1st Qu.:18.66 !# Median : 9.992 Median :20.09 !# Mean :10.013 Mean :20.07 !# 3rd Qu.:10.694 3rd Qu.:21.48 !# Max. :13.329 Max. :27.79 !!df.treat = prepare(treatPlan, df, pruneLevel=NULL)!summary(df.treat)!# x1_clean x2_clean y !# Min. : 7.365 Min. : 5.002 Min. :13.75 !# 1st Qu.: 9.372 1st Qu.: 7.145 1st Qu.:18.66 !# Median : 9.992 Median : 9.586 Median :20.09 !# Mean :10.013 Mean : 9.719 Mean :20.07 !# 3rd Qu.:10.694 3rd Qu.:12.152 3rd Qu.:21.48 !# Max. :13.329 Max. :14.991 Max. :27.79 !
There are other automatic variable prunings as well: for variables that don’t vary, as well as for variables that are “on” for less than a minimal fraction of the data (rare variables)

Conclusions
There’s no substitute for getting your hands in the data
Nonetheless, some variable treatments are reusable again and again
We’ve presented our go-to data treatments, and an R implementation for them: vtreat
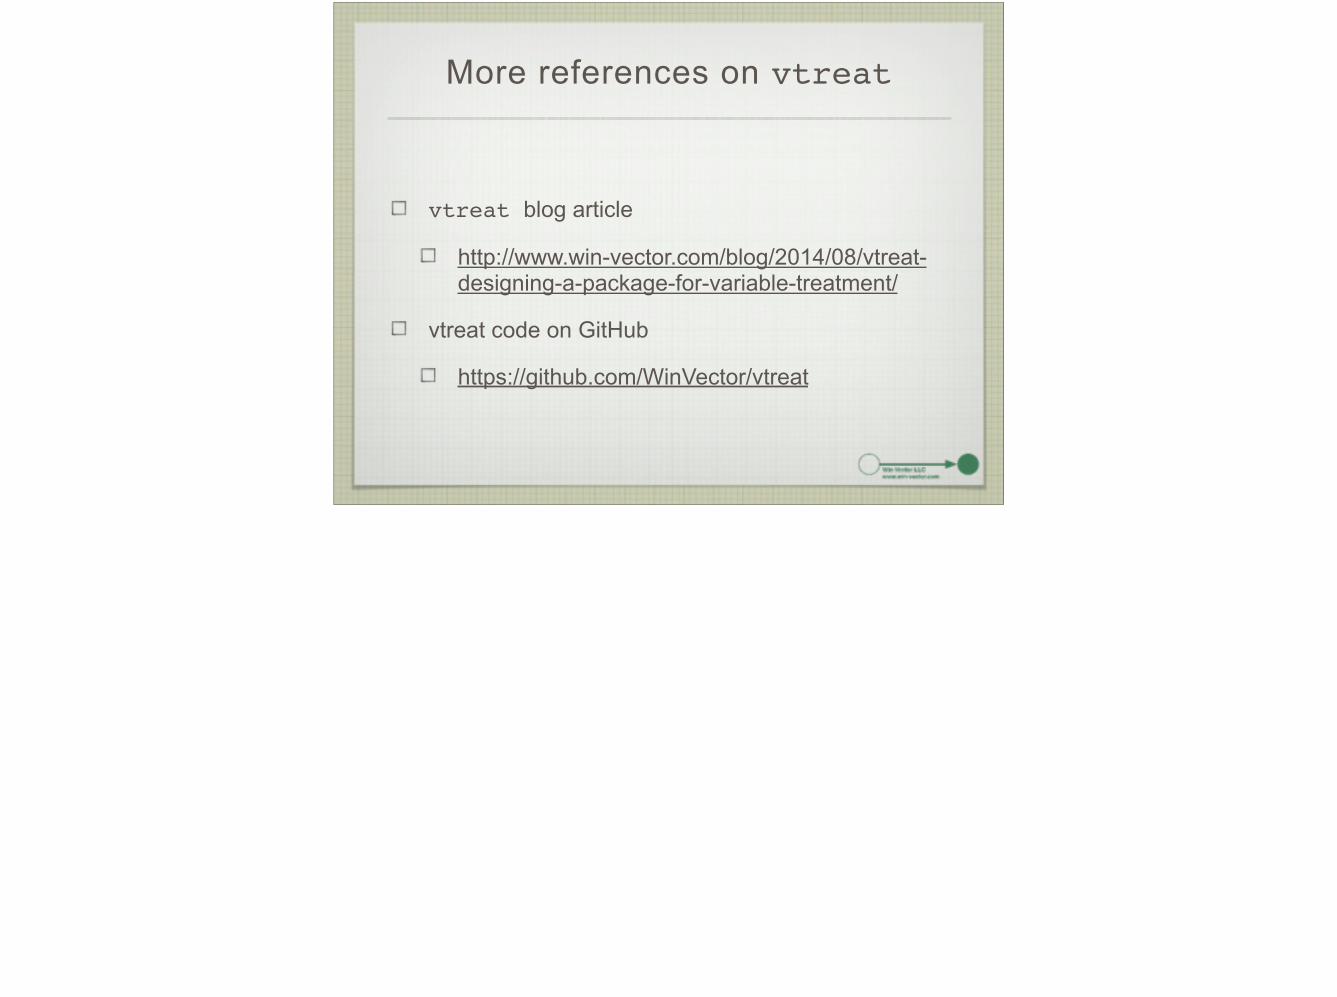
More references on vtreat
vtreat blog article
http://www.win-vector.com/blog/2014/08/vtreat-designing-a-package-for-variable-treatment/
vtreat code on GitHub
https://github.com/WinVector/vtreat

Further References
Impact Coding
http://www.win-vector.com/blog/2012/07/modeling-trick-impact-coding-of-categorical-variables-with-many-levels/
http://www.win-vector.com/blog/2012/08/a-bit-more-on-impact-coding/
Converting Categorical Variables to Numerical (No Hashing)
http://www.win-vector.com/blog/2014/12/a-comment-on-preparing-data-for-classifiers/
PRESS statistic
http://www.win-vector.com/blog/2014/09/estimating-generalization-error-with-the-press-statistic/
!!!

Thank You


