
AN ABSTRACT OF THE THESIS OF
Kunonga, Ngoni Ishe for the Master of Science
III Biology presented on 0 c( /1D .In Title: Prevalence of the Multiple Antibiotic Resistance Operon (marRAB ) in the
Genus Salmonella
Abstract Approved: :; £.4 5 {l~
The multiple antibiotic resistance operon (marRAB operon) is a member of the
Multidrug resistance (Mdr) systems. Similar to other Mdr systems, this operon codes for
resistance to structurally and functionally unrelated antibiotics. This operon has been
shown to be conserved in the family Entrobacteriaceace. Within the genus Salmonella, a
previous study (8) demonstrated S. typhimurium was positive for the marRAB operon
while S. arizonae appeared not to contain the operon. Thus, the objective of this study
was to determine the prevalence of the marRAB operon in genus Salmonella. Thirty
different veterinary Salmonella isolates were examined using PCR, Southern blot, and
dot blot analysis. PCR was performed on isolated chromosomal DNA from all thirty
organisms using primers based on the marRAB operon of S. typhimurium. The predicted
2.2 kb band was amplified in 16 organisms, including S. arizonae. The cloned 2.2 kb
PCR product of Salmonella enteritidis was subjected to DNA sequencing and shown to
have approximately 99% sequence homology to the marRAB operon of S. typhimurium.
Southern blot and dot blot analysis were performed on the PCR amplification products
using the sequenced marRAB fragment as a probe. Southern blot data revealed that the
probe hybridized with all PCR products appearing on the agarose gel. Dot blot analysis
data indicated the probe hybridized with chromosomal DNA from all thirty organisms.
.L

Induction studies were perfonned in the presence of low concentrations of either
tetracycline or chloramphenicol to detennine if the isolates have a functional marRAB
operon. There was an overall increase in the resistance of almost all induced organisms
to tetracycline, chloramphenicol, and ampicillin. Taken together, these data demonstrate
conservation of the marRAB operon in the thirty Salmonella species examined.
Prevalence of the Multiple Antibiotic Resistance Operon (marRAB ) in the Genus
Salmonella
A Thesis
Submitted to
the Division of Biological Sciences
Emporia State University
In Partial Fulfillment
of the Requirement of the Degree
Master of Science
By
Kunonga, Ngoni Ishe
.....

.-,:{ ", / ~--r-r==7'- \ /\ '1
iv
L

ACKNOWLEDGMENTS
The successful completion of my master's thesis is due to my research advisor Dr.
Scott Crupper. Through his lab, and countless thought provoking discussions I had with
him and my committee members Dr. Rod Sobieski and Dr. Gaylen Neufeld, I have learnt
to appreciate fundamentals of basic molecular microbiology research. I would like to
thank my fellow graduate students Frank Kuhn, with whom I spent countless hours in the
lab and for introducing me to Kansas State football, Ching Wen Tseng "Delores" for her
computer expertise, Tony Patton, Dorothy Nickels and Judson Spicer. Last, but not least,
my girlfriend Nyasha, I could not have done it without you, my parents, my brothers
Simba and Rutendo, my sister Runyararo, and the rest of the Kunonga family and the
Khuri family for their love and support.
v

PREFACE
This thesis was prepared following the publication style ofthe Journal of
Bacteriology.
Vi
~

TABLE OF CONTENTS
PAGE
ACKNOWLEGMENTS v
PREFACE VI
LIST OF FIGURES ix
LIST OF TABLES x
INTRODUCTION 1
I. Bacterial Antibiotic Resistance....... .. 1
II. Multiple Antibiotic Resistance Operon (marRAB operon) 2
A.) Structure and function 3
i.) MarC and MarB 3
ii.) MarR 6
iii.) MarA. . . . . . . . .. . . . . . . . .. . .. . . . . .. . . . . . . . .. . . .. .. . .. . . . . .. . 6
B.) Structural and functional homology ofMarA
to other proteins 7
III. Objective 7
MATERIALS AND METHODS 9
I. Bacterial Strains, Plasmids, and Growth Conditions. 9
II. Isolation ofDNA 9
A.) Chromosomal DNA isolation 9
B.) Isolation of plasmid DNA 11
C.) Quantification and purity of DNA 15
III. Polymerase Chain Reaction. . . . . . . . . . . .. . . . . . . . . . . . . . . . . .. . . . . . . . . . . . . . 15
Vll
~

IV. DNA Extraction from Agarose Gels 17
V. Preparation of CaCh Competent Cells..... 17
VI. Ligation Reactions 18
VII. Transformation 18.
VIII. Southern Blots 18
A.) Preparation of Dig labeled probe 18
B.) Agarose gel electrophoresis 20
C.) DNA transfer to nylon membrane 20
D.) Prehybridization and hybridization of nylon membrane 22
E.) Detection ofthe DIG -labeled probe bound to the
nylon membrane 22
F.) Dot blot analysis 23
IX. Induction of the Mar phenotype in Salmonella 23
X. Determination of the minimum inhibitory concentration (MIC) 24
RESULTS 25
I. Polymerase Chain Reaction (PCR) 25
II. Cloning and Sequence Analysis of marRAB. . . . . . . . . . . . . . . . . . . . . . . . . . . . . . . . .. 25
III. Southern Blot and Dot Blot Analysis........... 25
IV. Minimum Inhibitory Concentrations (MIC) Determination.... .. 30
DISCUSSION 38
LITERATURE CITED 41
Vlll
LIST OF FIGURES
PAGE
Figure 1. Organization of the marRAB operon 4
Figure 2. Agarose gel ofpeR products 26
Figure 3. Nucleotide sequence ofmarRAB operon ofSalmonella
enteritidis. . . . . . . . . . . . . . .. . . . . . . . .. . . . . . . . .. . . . . . . . .. . . . . . . . . . . . . . . . . . . . . . . .. 28
Figure 4. Minimum inhibitory concentrations ofuninduced Salmonella
Species 32
Figure 5. Minimum inhibitory concentrations of tetracycline induced
Salmonella species 34
Figure 6. Minimum inhibitory concentrations of chloramphenicol
Salmonella species 36
I ix
L,
LIST OF TABLES
PAGE
Table 1. Salmonella species used in this study 10
Table 2. Media and solutions used in this study 12
Table 3. Primers and reaction conditions used in peR. . .. ... . .. . . . . ... . . . .. . .. . .. .. 16
Table 4. Preparations of agarose gels and running conditions. . . . . .. . . . . . . . ... . . . .. 21
x

Introduction
I. Bacterial Antibiotic Resistance
Bacterial resistance to antibiotics is increasing faster than antibiotics can be
successfully developed. To date, several thousand antibiotics have been developed with
approximately one hundred being medically practical (11). Science has yet to determine
whether the genes for resistance to antibiotics present in infectious bacteria have always
been encoded in the genome of these organisms or are the result of random mutations
(14).
Gram-negative bacteria have unlinked genes encoding resistance to various
antibiotics that are plasmid-encoded. These plasmids, designated R-plasmids, are
characterized as being self-transmissible and usually have the resistance gene located on
a transposon (11,33). Some organisms, however, are able to confer resistance to multiple
antibiotics which are structurally unrelated (14). For example, organisms resistant to
chloramphenicol, ampicillin, and rifampin could have more than one unlinked gene
residing either on a R-plasmid, chromosomal DNA, or both.
Mechanisms of antibiotic resistance are diverse. For example, an unlinked gene
can encode a protein which degrades or enzymatically alters an antibiotic (9,38).
Alternatively, some mechanisms ofantibiotic resistance are accomplished by simply
overexpressing the protein that is targeted by the antibiotic. Regulating cell permeability,
however, is one of the main mechanisms utilized by gram-negative bacteria to confer
resistance to antibiotics. This is achieved in part by reducing the number of outer
membrane porins that are expressed. Outer membrane porins (amp) are partly
I

responsible for the influx of antibiotics into a bacteria (4,33). However, very little is
known about how the various porins are involved in antibiotic influx. In Escherichia
coli, OmpF and OmpC are the most abundant porins with OmpF being largely
responsible for antibiotic influx at low temperature (7,13).
Chromosomal-borne antibiotic resistance genes, collectively known as Multidrug
resistance (Mdr) genes, have been recently identified and characterized (14). These
genes encode resistance to structurally and functionally unrelated antibiotics. The gene
products of the Mdr genes regulate antibiotic levels in a bacteria non-specifically by
regulating the influx and efflux of antibiotics via membrane transporters (14).
Mdr genes are found associated with various enteric organisms. For example,
Klebsiella pneumoniae, Enterobacter cloacae, Serratia marcesens, Neisseria
gonorrhoeae, Pseudomonas aeruginosa, and Proteus vulgaris have an Mdr system which
is possibly organized in the form ofan operon (12,14,17,22,26,32). These systems, when
induced, encode resistance to structurally unrelated antibiotics. The mechanism of action
of these systems involves regulating cell permeability through efflux pumps, influx of
antibiotics, or a combination of both.
II. Multiple Antibiotic Resistance Operon (marRAB operon)
E. coli has various Mdr systems that confer resistance to a wide variety of
compounds such as antibiotics, dyes, and detergents (6,14,35). One of the Mdr systems
ofE. coli is known as the multiple antibiotic resistance operon (marRAB operon) and was
first described in 1983 (15,16). In this initial study, E. coli was incubated with
subinhibitory concentrations of either tetracycline or chloramphenicol. This resulted in
2
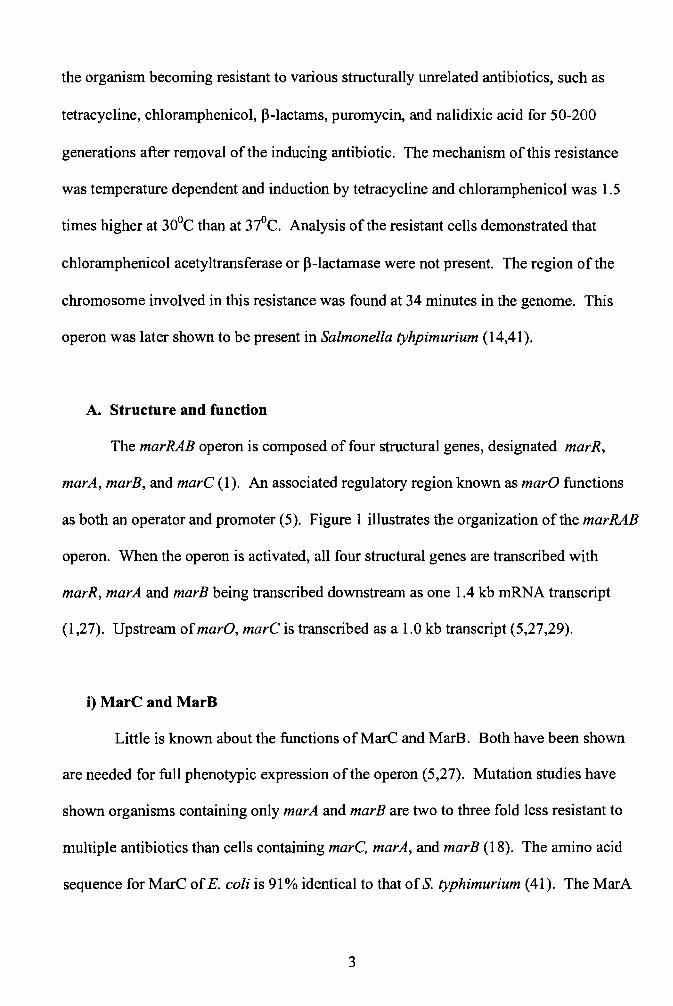
the organism becoming resistant to various structurally unrelated antibiotics, such as
tetracycline, chloramphenicol, ~-lactams, puromycin, and nalidixic acid for 50-200
generations after removal of the inducing antibiotic. The mechanism of this resistance
was temperature dependent and induction by tetracycline and chloramphenicol was 1.5
times higher at 30°C than at 37°C. Analysis of the resistant cells demonstrated that
chloramphenicol acetyltransferase or ~-lactamase were not present. The region ofthe
chromosome involved in this resistance was found at 34 minutes in the genome. This
operon was later shown to be present in Salmonella tyhpimurium (14,41).
A. Structure and function
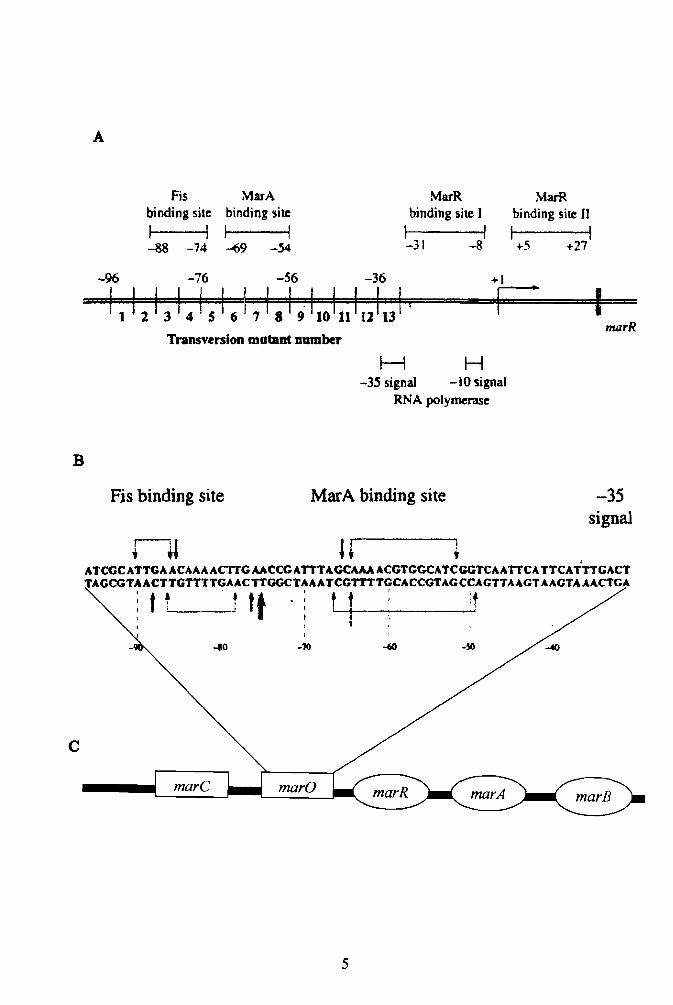
The marRAB operon is composed of four structural genes, designated marR,
marA, marB, and marC (1). An associated regulatory region known as marO functions
as both an operator and promoter (5). Figure 1 illustrates the organization of the marRAB
operon. When the operon is activated, all four structural genes are transcribed with
marR, marA and marB being transcribed downstream as one 1.4 kb mRNA transcript
(1,27). Upstream ofmarO, marC is transcribed as a 1.0 kb transcript (5,27,29).
i) MarC and MarB
Little is known about the functions ofMarC and MarB. Both have been shown
are needed for full phenotypic expression of the operon (5,27). Mutation studies have
shown organisms containing only marA and marB are two to three fold less resistant to
multiple antibiotics than cells containing marC, marA, and marB (18). The amino acid
sequence for MarC ofE. coli is 91 % identical to that ofS. typhimurium (41). The MarA
3

Fig. 1. Organization of the marRAB operon (30). (A) mar promoter region; (B) detailed
illustration of marO; (C) marRAB operon.
4
A
Fis MarA MarR MarR binding site binding site binding site J binding site II
I I I I I I I I -88 -74 -'69 -54 -31 -8 +5 +27
-96 -76 -56 -36 +1
marR Transversion mutant Dumber
H H -3S signal -10 signal
RNA polymerase
B
Fis binding site MarA binding site -35 signal
I1l U, ATCGCATTGA ACAAA ACTTG AACCGATTTAGCAAA ACGTGGCATCGGTCAATTCATTCATTTGACT TAGCGTAACTTGTTTTGAACTTGGCTAAATCGTTTTGCACCGTAGCCAGTTAAGTAAGTAAACTGA
. f ~ . , tt .: t t' ~t , , : '-1 . I
c
-40-10-10
5

and MarB proteins ofE. coli are 86% and 42% identical to MarA and MarB of
S. typhimurium, respectively (41).
ii) MarR
The first structural gene to be transcribed downstream of the operator/promoter
region is marR. MarR ofE. coli is 144 amino acids long and functions as a negative
transcriptional regulator of the marRAB operon. This protein represses not only its own
transcription, but also marA, marB, and marC. Repression of the marRAB operon occurs
when MarR binds to two positions on the operator region known as site I and site II
(Fig 1). Site I and Site II are 80% identical (31). When MarR binds, a 21 base pair
region is covered up on each site, overlapping the -35 and -10 positions (30,31). Actual
repression of the operon occurs when MarR binds at site I whereas occupation of site II
by MarR has no effect (30,39). MarR and MarA bind at different positions on marO;
MarA at the marbox and MarR at site I and II. The marbox is a DNA segment that is part
of the promoter region (marO). It is located at the -69 to -54 position ofmarO (30).
When MarA binds to the marbox, transcriptional activation of marRAB operon occurs.
Although MarR and MarA bind at different positions on marO, evidence suggests they
compete with each other for binding to their respective positions (39).
iii) MarA
MarA is a transcriptional activator that induces its own transcription and that of
marR, marB, and marC (27,28,41,42). In E. coli, the marbox is bound by MarA (41). An
accessory transcriptional activator known as Fis, enhances the binding ofMarA to the
6

---~
marbox (39). MarA has a DNA binding motifthat binds to the promoter of the marRAB
operon. This motif is also an ambidextrous transcriptional activator that binds to various
promoters, such as micF, soxRS andfumC (23,24). The micF promoter regulates the
expression ofOmpF (4,14). At 30°C, OmpF is more abundant than Ompe. When E. coli
is induced with either tetracycline or chloramphenicol at 30°C, the expression ofMarA
increases (4,14,21). MarA is a transcriptional activator ofmicF mRNA; micF mRNA is
an antisense post-transcriptional regulator of ompF. When micF mRNA is expressed, it
binds to ompF mRNA which in tum reduces the expression of ompF when either
tetracycline or chloramphenicol are present.
B. Structural and functional homology of MarA to other proteins
MarA is a member of Xyls/AraC, a family of transcriptional activators
characterized by a helix-tum-helix DNA binding motif. This family is composed of three
subgroups with over 27 members (20). Relative to other members of the Xyls/AraC
family, MarA is more homologous to SoxS (a protein that activates resistance to
antibiotics and oxidative agents), Rob (no known function), and TetD (no known
function) (2,5,19,20,25,36,43). The homology of the helix-tum-helix DNA binding motif
ofMarA to that of other proteins in this class makes it an ambidextrous transcriptional
activator of various promoters.
III. Objective
In this study, the prevalence of the marRAB operon in the genera Salmonella was
determined using the polymerase chain reaction, dot blot analysis, Southern blot analysis,
7

and antibiotic resistance patterns. A prior study (8) showed the marRAB operon was
prevalent in the family Enterobacteriaceace; however, the same study also demonstrated
that it mayor may not be present within the genus Salmonella. These inconclusive data
prompted the current investigation.
8

Materials and Methods
I. Bacterial Strains, Plasmids, and Growth Conditions
Thirty Salmonella species (Table 1) were routinely propagated in Brain Heart
Infusion (BHI) media or on agar plates at 37°C. Escherichia coli DH5-a, a routine
cloning strain of E. coli, was grown on Luria-Bertani (LB) media at 37°C. For long-term
storage, bacterial cultures were stored in BHI -20% glycerol at -70°C. Cells containing
the plasmid pT7Blue-3 (Novagen, Inc., Madison, WI) were selected using 100 Jlg/ml
ampicillin. The chromogenic substrate X-gal (5-bromo-4-chloro-3-indoly-p-D
galactoside) was used at 20 Jlg/fll. A complete listing of media and solutions used in this
study is depicted in Table 2.
II. Isolation of DNA
A. Chromosomal DNA isolation
Chromosomal DNA was isolated using a modification of an established procedure
(3,37). Organisms were inoculated into 6 ml of BHI and incubated for 18 hr at 37°C with
shaking at 250 rpm in a New Brunswick Series 25 Incubator (Edison, NJ). Cells were
harvested by centrifugation at 4,000 rpm for 5 min in a Sorvall model GLC-l General
Laboratory Centrifuge (Newton, CT). The supernatant was discarded and the cells
resuspended in 4 ml ofTris-ethylenediaminetetraacetic acid (TE) buffer. Cells were
lysed upon addition of 200 fll of 20% sodium dodecyl sulfate (SDS) and subsequent
9

Table 1. Salmonella species used in this study
Organism # Organism Stereotype Source
University of Iowa Kansas State University Veterinary Medicine Kansas State university Veterinary Medicine University of Iowa Kansas State University Veterinary Medicine Kansas State University Veterinary Medicine Kansas State University Veterinary Medicine Kansas State University Veterinary Medicine Kansas State University Veterinary Medicine Kansas State University Veterinary Medicine University of Iowa University of Iowa University of Iowa Kansas State University Veterinary Medicine Kansas State University Veterinary Medicine University of Iowa Kansas State University Veterinary Medicine Kansas State University Veterinary Medicine Kansas State University Veterinary Medicine Kansas State University Veterinary Medicine Kansas State University Veterinary Medicine Kansas State University Veterinary Medicine Kansas State University Veterinary Medicine Kansas State University Veterinary Medicine Kansas State University Veterinary Medicine University ofIowa Kansas State University Veterinary Medicine Kansas State University Veterinary Medicine Kansas State University Veterinary Medicine
University of Iowa
1 2 3 4 5 6 7 8 9 10 11 12 13 14 15 16 17 18 19 20 21 22 23 24 25 26 27 28 29 30
Salmonella agona Salmonella anatum Salmonella arizonae" Salmonella bardo Salmonella brandenburg Salmonella choleraesuis Salmonella derby Salmonella enteritidis Salmonella gallinarum Salmonella give Salmonella hamburg Salmonella hartford Salmonella heidelberg Salmonella kentucky Salmonella mbandaka Salmonella meleagridis Salmonella montevideo Salmonella muenster Salmonella newport Salmonella oranienburg Salmonella paratyphi Salmonella pullorum Salmonella reading Salmonella rubislaw Salmonella schottmuelleri Salmonella stanley Salmonella thompson Salmonella typhimurium Salmonella uganda
Salmonella urbana
B El
C3 B Cl B DI Dl El HI C 1 B C3 Cl E 1 Cl El C2 Cl A Dl B F B B C I B 1 El
N
"Belongs to the subgenus 111 (10)
10
incubation at 60°C for 15 min. Incubation at 37°C for 20 min in the presence of 10 III of
RNase (10 mg/ml) followed by incubation at 60°C for 2 hr with 30 III of proteinase K (10
mg/ml) was performed. Phenol extraction was carried out by adding 4 ml of phenol,
gently mixing by inversion, and centrifugation at 4,000 rpm for 5 min. The upper layer
(aqueous phase) was transferred to a fresh 15 ml conical tube and an additional phenol
extraction and chloroform/isoamyl alcohol (24: 1) extraction was performed as described
above. DNA was precipitated by adding 15 ml of ice cold 100% ethanol. The DNA was
transferred to a 1.5 ml microcentrifuge tube and dried in a ISS 110 Savant speedvac for
two minutes. Once dried, the DNA was resuspended in 200 III ofTE and concentration
and purity were determined as described below.
B. Isolation of plasmid DNA
Plasmid DNA was isolated using a modified protocol (3,37). Briefly, individual
colonies were incubated in 3 ml of LB broth containing the appropriate antibiotic for
16 hr at 37°C with shaking at 250 rpm. Cells were harvested by centrifugation for 30 sec
at 13,000 x g and resuspended in 200 III of Solution I. Cells were lysed upon the addition
of 200 III of Solution II and subsequent incubation for lO min at room temperature.
Protein-chromosomal DNA complexes were precipitated by adding 150 III of Solution
III. After incubation on ice for 10 min, centrifugation was performed for 5 min at 13,000
x g. The supernatant was added to 240 III of TE and 10 III of 1 mg/ml RNase. After 15
min of incubation at room temperature, 500 III of 1.6 M NaCl-13% Polyethylene Glycol
8000.
11
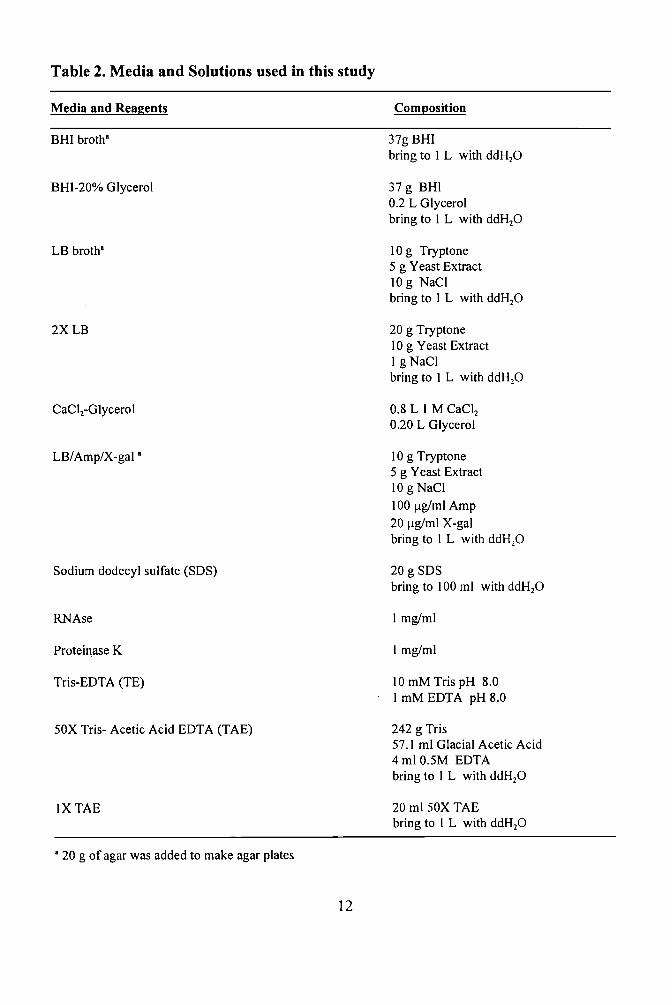
Table 2. Media and Solutions used in this study
Media and Reagents Composition
BHI broth·
BHI-20% Glycerol
LB broth"
2XLB
CaCl2-Glycerol
LB/AmpIX-gal·
Sodium dodecyl sulfate (SDS)
RNAse
Proteinase K
Tris-EDTA (TE)
50X Tris- Acetic Acid EDTA (TAE)
IXTAE
37g BHI bring to I L with ddHzO
37 g BHI 0.2 L Glycerol bring to I L with ddHP
109 Tryptone 5 g Yeast Extract 10 g NaCI bring to I L with ddHP
20 g Tryptone 10 g Yeast Extract I g NaCI bring to I L with ddHP
0.8 LIM CaCI2
0.20 L Glycerol
109 Tryptone 5 g Yeast Extract 10 g NaCI 100 flg/ml Amp 20 flg/ml X-gal bring to I L with ddHzO
20 g SDS bring to 100 ml with ddH20
I mg/ml
I mg/ml
10 mM Tris pH 8.0 I mM EDTA pH 8.0
242 g Tris 57.1 ml Glacial Acetic Acid 4 ml 0.5M EDTA bring to I L with ddH20
20 ml50X TAE bring to I L with ddHP
• 20 g of agar was added to make agar plates
12
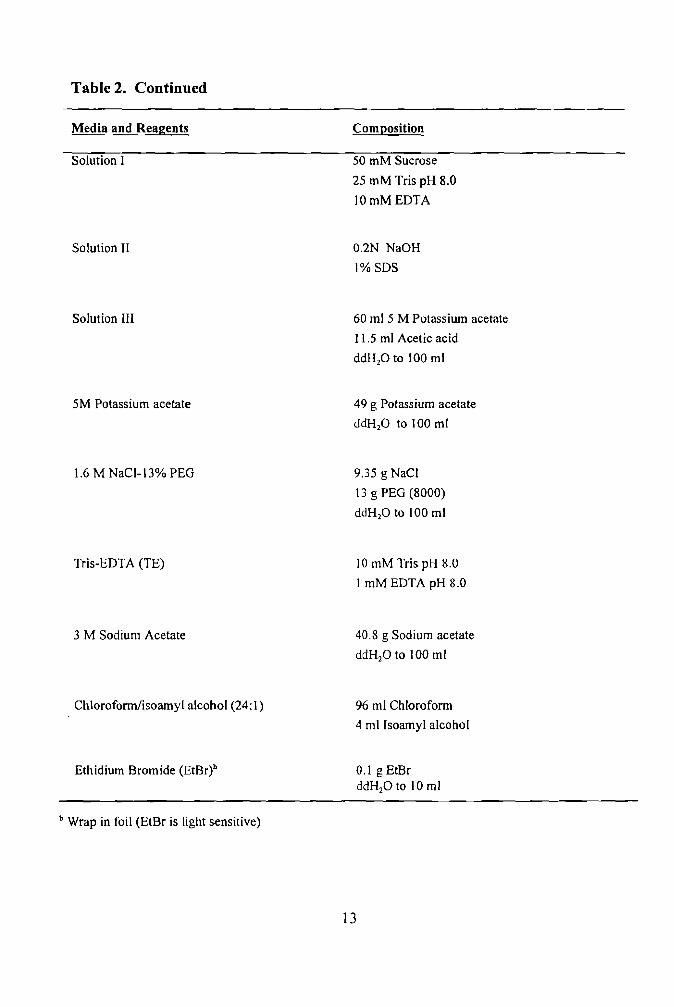
Table 2. Continued
Media and Reagents Composition
Solution I
Solution II
Solution III
5M Potassium acetate
1.6 M NaCl-13% PEG
Tris-EDTA (TE)
3 M Sodium Acetate
ChlorofonnJisoamyl alcohol (24:1)
Ethidium Bromide (EtBr)b
b Wrap in foil (EtBr is light sensitive)
50 mM Sucrose
25 mM Tris pH 8.0
10mMEDTA
0.2N NaOH
I%SDS
60 ml 5 M Potassium acetate
11.5 ml Acetic acid
ddHzO to 100 ml
49 g Potassium acetate
ddHzO to 100 ml
9.35 g NaCl
13 g PEG (8000)
ddHzO to 100 ml
10 mM Tris pH 8.0
I mM EDTA pH 8.0
40.8 g Sodium acetate
ddHzO to 100 ml
96 ml Chloroform
4 ml Isoamyl alcohol
0.1 g EtBr ddH20 to 10 ml
13
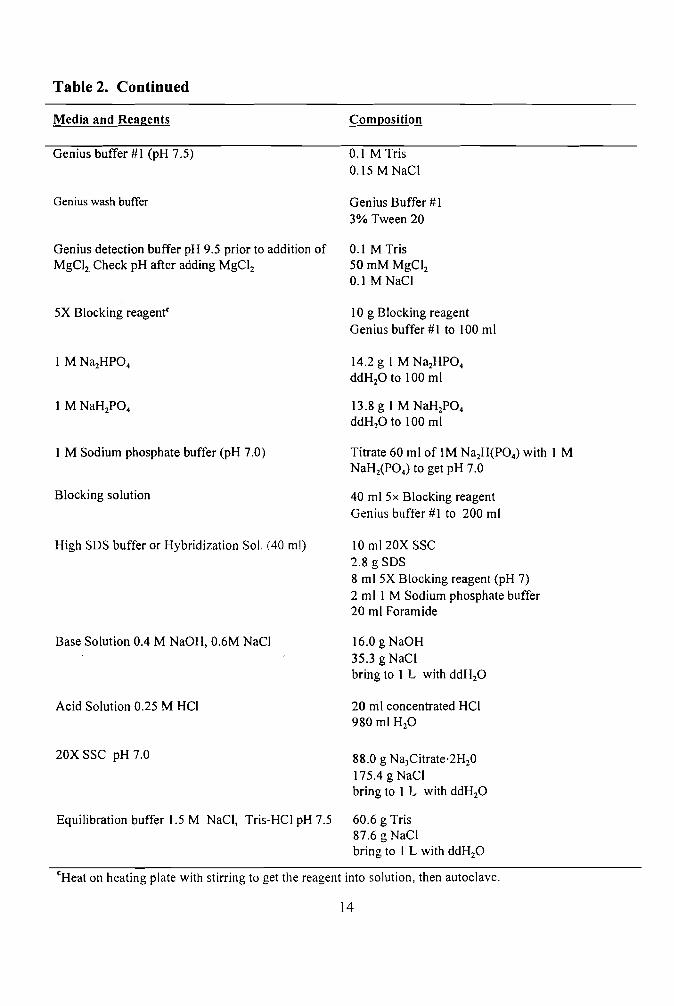
Table 2. Continued
Media and Reagents Composition
Genius buffer #1 (pH 7.5)
Genius wash buffer
Genius detection buffer pH 9.5 prior to addition of MgCI2 Check pH after adding MgCI2
5X Blocking reagentC
1 M Na2HP04
I MNaH2P04
I M Sodium phosphate buffer (pH 7.0)
Blocking solution
High SDS buffer or Hybridization Sol. (40 ml)
Base Solution 0.4 M NaOH, 0.6M NaCl
Acid Solution 0.25 M HCI
20X SSC pH 7.0
Equilibration buffer 1.5 M NaCI, Tris-HCI pH 7.5
0.1 M Tris 0.15 MNaCI
Genius Buffer #1 3% Tween 20
0.1 M Tris 50 mM MgCI2
0.1 M NaCl
109 Blocking reagent Genius buffer #1 to 100 ml
14.2 g I M N~HP04
ddHP to 100 ml
13.8 g I M NaH2P04 ddH20 to 100 ml
Titrate 60 ml of 1M Na2H(P04) with 1 M NaH2(P04) to get pH 7.0
40 ml 5x Blocking reagent Genius buffer #1 to 200 ml
10 ml20X SSC 2.8 g SDS 8 ml 5X Blocking reagent (pH 7) 2 mIl M Sodium phosphate buffer 20 ml Foramide
16.0 g NaOH 35.3 gNaCI bring to 1 L with ddH20
20 ml concentrated HCI 980 ml H20
88.0 g Na3Citrate·2H20 175.4 g NaCI bring to 1 L with ddH20
60.6 g Tris 87.6 g NaCI bring to I L with ddH20
CHeat on heating plate with stirring to get the reagent into solution, then autoclave.
14
(PEG) was added and the solution centrifuged for 5 min as described above. The
precipitate was resuspended in TE buffer and a phenol and chlorofonnJisoamyl alcohol
extraction was performed with 400 j.!l of the organic solvents as described above for
chromosomal DNA isolation. DNA was precipitated by adding 1 ml of95% ethanol and
incubating the solution on ice for 10 min. After centrifugation for 10 min, the
supernatant was discarded and the DNA dried and resuspended in 30 /-il of TE.
C. Quantification and purity of DNA
DNA concentration and purity were determined using a Beckman DU™ 530
spectrophotometer. A dilution factor of 1: 100 was used. The concentration of double
stranded DNA was determined using the following equation:
(OD26o)(Dilution factor)(50) = j.!g/ml. The purity of the DNA was determined by the
OD26010Dcso ratio.
III. Polymerase Chain Reaction
Polymerase Chain Reaction (PCR) was performed using a Minicycler™
Thermocycler (MJ Research, Inc., Watertown, MA). Reaction mixtures consisted of
500 ng of chromosomal DNA, 1.5 mM of MgC12, 50 /-iM of primers, 0.2 mM of dNTPs,
PCR buffer (30 mM Tris-HCl pH 7.4, 10 mM MgC12, 10 mM DTT, and 1 mM ATP), and
1 unit of Tag polymerase in a final volume of 100 /-il (Table 3). In general, amplification
consisted of a denaturation step at 94°C for 1 min, followed by annealing of the primers at
15

Table 3. Primers and reaction conditions used in peR
Primers Primer Sequence Conditions
STmarRAB-F 5' GGG AAC AGG TIT CCG GCA GAC GAA 3' 94°C 5 min one cycle
94°C I min 30 cycles
60°C 2 min 30 cycles STmarRAB-R 5' GCT GGC GAG CGC CGC GGT GTI AC 3' noc 2 min 30 cycles
16

60°C for 2 min and extension at 72°C for 2 min. This 3-step cycle was repeated 30 times.
PCR products were analyzed by agarose gel electrophoresis.
IV. DNA Extraction from Agarose Gels
Extraction ofPCR products from agarose gels was performed using a Qiagen II
Extraction kit (Qiagen, Chatsworth, MA) according to the manufacturer's
recommendation.
V. Preparation of CaCI2 Competent Cells
Competent cells were prepared using a modification of an established protocol
(3,36). Briefly, 2 ml of 2X LB was inoculated with a single bacterial colony of E. coli
DH5a and incubated overnight at 30°C with shaking at 250 rpm. Following incubation,
0.5 ml of the culture was added to 1 L of prewarmed (30°C) 2X LB. Cells in the new
culture were propagated for approximately 5 hr at 30°C to an O.D60o ofO.3 at 250 rpm.
Four milliliters of 1 M MgCl2 was added and the incubation continued approximately 1 hr
until the O.D600 was between 0.45 and 0.55. The culture was incubated on ice for an
additional 2 hr. Cells were precipitated by centrifugation at 3,000 x g for 5 min and
resuspended in 100 ml of ice-cold CaCl2 media. After incubation on ice for 40 min, cells
were precipitated as described above. Cellular precipitates were resuspended in 5.1 mlof
ice-cold CaCl2-glycerol media. Cells were aliquoted and stored at -70°C.
17

VI. Ligation Reactions
In general, reaction mixtures consisted of 1 I..d ofT-vector (Novagen, Inc.,
Madison, WI) 1.5 Jll of buffer (final concentration 30 mM Tris-HC1 pH 7.4, 10 mM
MgC12, 10 mM DTT, and 1 mM ATP), 6 J..lI of DNA, and 1 J..ll ofT4 DNA ligase. After
incubation for 2-3 hr in a 15°C water bath, ligation mixtures were immediately
transformed into competent cells by heat shock as described below.
VII. Transformation
Ligation mixtures were incubated on ice for 15 min with 100 J..ll of competent
cells. Following incubation, the mixture was immediately placed in a 42°C water bath for
90 sec and then back on ice for 1 min. Nine hundred microliters of LB was added and
100 J..ll the mixture spread onto LB plates containing the appropriate antibiotic. Plates
were incubated overnight at 37°C and examined for growth.
VIII. Southern Blots
Southern Blot and dot blot analysis were performed according to the
manufacturer's recommendations with slight modifications as described bellow
(Boehringer Mannheim, Germany).
18

A. Preparation of Dig labeled probe
Gel extracted DNA was added to ddH20 in a 1.5 ml microfuge tub~ to a final
volume of 15 ~l. The tube was incubated in boiling water for 10 min and immediately
placed on ice. After a brief centrifugation for 1 sec, 2 1-11 ofhexanucleotide mix, 2 III of
dNTP mix, and 1 III of Klenow enzyme were added. The mixture was incubated at 3rc
for approximately 20 hr and stopped by the addition of 2 1-11 of 0.2 M EDTA (pH 8) and
1 1-11 of glycogen. Labeled probe was precipitated upon the addition of2.5 III of4M LiCI
and 75 1-11 of 100% ethanol followed by incubation for 2 hr at -20°C. After centrifugation
for 15 min, the precipitate was washed with 100 1-11 of 70% of ethanol and dried in a
speedvac. The Dig labeled probe was resuspended in 50 III of TE buffer and stored at
-20°e.
To verify labeling of the probe, 1 1-11 was placed on a piece of nylon membrane
(Micron Separation Inc., Westborough, MA) and crosslinked using a UV Crosslinker.
The nylon membrane was incubated with 10 ml of blocking solution for 5 min. This
solution was discarded and replaced with 10 ml of blocking solution containing 2 1-11 of
anti-DIG antibody. After incubation for 10 min, the nylon membrane was washed two
times in wash buffer for 5 min each and equilibrated in detection buffer for 1 min.
Finally, 10 ml of detection buffer containing 200 1-11 of Nitro-blue-tetrazolium-phosphate
(NBT/X-Phos) was added and the membrane incubated for 16 hr in the dark. Color
development was indicative of the DIG-labeled probe binding to DNA contained on the
membrane.
19

B. Agarose gel electrophoresis
Electrophoresis was carried out as described in Table 4. After electrophoresis, the
gel was placed in a plastic dish containing 10 ml of acid solution and incubated for 15
min with shaking at room temperature. The acid solution was discarded and the gel was
rinsed twice with ddH20. Base solution was added to the gel and incubation at room
temperature was performed for 30 min followed by rinsing twice with ddH20. After
incubation for 30 min at room temperature in equilibration buffer, the gel was ready for
transfer.
C. DNA transfer to nylon membrane.
Three pieces of chromatography paper (Whatman filter paper) and a piece of
MagnaGraph nylon transfer membrane were cut to the size of the agarose gel. A
Whatman paper wick was cut and pre-soaked in lOX sse for 15 min. A baking-dish was
filled half way with lOX sse and two empty pipette tip boxes were centered and placed
inside it. A glass plate was placed on top of the boxes. The wick was centered on the
glass plate with the ends in the lOX SSe. The agarose gel was centered on top of the
wick and a lOX sse pre-soaked nylon membrane placed on top of the agarose gel. Three
pieces of chromatography paper pre-soaked in lOX sse were centered on the nylon
membrane, and a stack of paper towels was placed on top of the chromatography paper.
A heavy flat object (e.g books) was stacked on top of the paper towels. Plastic wrap was
used to seal the baking-dish without covering the agarose gel. Transfer by capillary
20

Table 4. Preparation of agarose gels and electrophoresis conditions
Agarose % Range of Resolution (kb) Amount of Agarose
O.S" 0.7' 1.0' 1.28
1.5" 0.5b
30 to I 12 to 8
\OtoO.5 7 to 004 3 to 0.2 30 to I
0.15 g 0.21 g 0.30 g 0.36 g 0045g 2.25 g
830 ml of IX TAE and I III of EtBr mixed with agarose. Electrophoresis was performed at 80 volts for Ihr in ISO ml TAE buffer b ISO ml of IX TAE and 5 III of EtBr mixed with agarose. Electrophoresis was performed at liS volts for 1.5 hr in 1.75 L TAE butTer
21

action was accomplished in approximately 18 hr. After transfer, the side of the nylon
membrane bound by DNA was marked with a pencil along with the positions ofthe . . . .
wells. This was followed by UV-cross linking the DNA to the nylon membrane for
1 min. The nylon membrane was stored at -20°C until needed.
D. Prehybridization and hybridization of nylon membrane
The nylon membrane was placed in a hybridization bottle, 20 ml of hybridization
solution added, and rotation performed in a Hybaid hybridization oven (Midwest
Scientific., Valley Park, MO ) for 2 hr at 55°C. After incubation, the pre-hybridization
solution was discarded and 20 ml of hybridization solution containing the DIG-labeled
probe was added. Hybridization of the DIG-labeled probe to the nylon membrane was
allowed to proceed overnight at 60°C.
E. Detection of the DIG-labeled probe bound to the nylon membrane
After hybridization, the membrane was washed two times for 5 min each in 2X
SSC-l% SDS at room temperature. The membrane was transferred to a fresh
hybridization bottle containing 0.5X SSC-l % SDS and washing continued two times for
15 min each at 40°C with constant rotation in the hybridization oven. The nylon
membrane was placed in a Petri dish and 10 ml of wash buffer was incubated with the
nylon membrane for 5 min at room temperature with rocking. Ten milliliter of blocking
solution was added and rocking continued for 30 min at room temperature. This solution
22

was discarded and 10011 of blocking solution containing:2 fll of anti-DIG antibody was
added and the solution rocked for 30 min at room temperature. Two washings with 10011
of wash buffer each was performed at room temperature for IS min with constant
rocking. Af1er the nylon membrane was equilibrated in detection buffer for 5 min, 10 ml
of detection buffer containing 200 ~d ofNST/X-Phos was added and development \yas
allowed to proceed for 16 hr in the dark. Following visual analysis, the developed nylon
membrane was preserved in water and documented.
F. Dot blot analysis
Dot blot analysis was performed using a modification of the Southern blot
analysis procedure described above. Briefly, 5 ~d of 100 ng/ml DNA was spot-loaded
onto a nylon membrane. After the DNA solution dried. the nylon membrane was UV
cross-linked and the steps of pre-hybridization through detection were the same as for the
Southern blot protocol.
IX. Induction of the Mar Phenotype in Salmonella
Thirty different Salmonella species (Table I) were induced to express the
marRAB operon according to a preYiously defined protocol (8). Briefly. the 30 species
were individually inoculated into 3 ml of BHI broth and incubated at 30uC for 18 hr with
shaking at 250 rpm. Cells were harvested by centrifugation at 4.000 rpm for 3 min and
washed with 1.5 ml of physiological saline. i\fter centrifugation at 4,000 rpm for 3 min.
'I"~-)

cells were concentrated to 0.1 volume (e.g. 0.3 ml) of the original culture volume in
physiological saline.
One hundred microliter of saline-washed cells were spread onto BHI plates
containing either tetracycline (3 /1g/ml) or chloramphenicol (7 /1g/ml) and incubated at
30°C for 3-5 days. Resulting colonies were re-inoculated onto the respective antibiotic
media and propagated overnight 30°e.
X. Determination of the Minimum Inhibitory Concentration (MIC)
Organisms grown on BHI plates containing either tetracycline or chloramphenicol
were propagated in 3 ml ofBHI overnight at 30°C with shaking at 250 rpm. After 18 hr
of growth, the OD600 of the culture was determined. Cultures were diluted to an OD600 of
0.005 by adding the appropriate volume of physiological saline. BHI plates containing
either tetracycline, chloramphenicol, or ampicillin at variable concentrations were spot
inoculated with I /11 of the diluted cells and incubated for 16 hr at 30°e. The minimum
inhibitory concentration (MIC) of each species was visually determined by recording the
concentration of antibiotic that inhibited bacterial growth.
24

Results
I. Polymerase Chain Reaction (PCR)
PCR was performed on chromosomal DNA from 30 different Salmonella species
and amplification products visually analyzed by agarose gel electrophoresis (Fig. 2).
Primers used in the amplification were based on the marRAB operon ofSalmonella
typhimurium (Table 3). Sixteen of30 organisms amplified a 2.2 kb band indicative of the
marRAB operon. Four organisms, Salmonella kentucky (#14), Salmonella newport (#19),
Salmonella stanley (#26) and Salmonella uganda (# 29) amplified a band that appeared
slightly larger than the predicted 2.2 kb band, whereas DNA from Salmonella munester
(#18) resulted in no amplification. All 30 organisms, with the exception of Salmonella
munester, amplified at least one band smaller than the predicted 2.2 kb band. The most
conserved PCR amplification product was observed at approximately 0.5 kb.
II. Cloning and Sequence Analysis of marRAB
A 2.2 kb PCR product of Salmonella enteritidis was cloned into pT7Blue-3 and
its nucleotide sequence determined at the University of Arkansas for Medical Sciences.
The nucleotide sequence of marRAB is approximately 99% identical to the marRAB
operon of S. typhimurium (Fig. 3).
III. Southern Blot and Dot Blot Analysis
Southern blot analysis was performed on the PCR products illustrated in Figure 2
using a 2.2 kb Dig-labeled marRAB probe from S. enteritidis. All PCR amplified bands
25

Fig. 2. Agarose gel electrophoresis ofPCR amplified products using primers based on the
marRAB operon ofSalmonella enteritidis. The 30 Salmonella isolates are listed in
Table 1.
26

LZ

8Z

1 GGGAACAGG TTICCGGCAG ACGAAAATGC GCCTIAGTGG TACGTTTIAA TAATTTCCAA 61 CACGCCGTIG ATAATAAATT GCACGCCCAT ACACACCAGC AGGAATCCC ATIAAGCGGG 121 AGATCGCTIC AATCCCCCCT TTACCCACCA GCCGCATAAT AGCGCCAGA ACTGCGTAAG 181 CATCCCCACA GGATCACCGC CACGGCAAGG AAAATAATCG GCGGCGCGAC CATAATGACC 241 CAGTCGGGAA ACTCGCCGCC ATGACGCACC GTGGAAGCGG AACTGATGAT CATIGCGATG 301 GTCCCCGGTC CTGCGGTGCT TGGCATAGCC AGTGGAACAA ATGCAATATT AGCCGTCGGT 361 TCGTCTGCCA GCTCCTCCGA TTIGCTTTIC GCTICCGGCG ACTCATGCGC CTICTGCTGC 421 GGGAAAAGCA TICTGAAGCC GATAAACGCC ACGATIAACC CCCCGGCGAT CCGTAGCCCT 481 GGAATCGAAA TACCGAAGGT GTICATAACT AACTGCCCGG CGTAGTACGC CACCATCATA 541 ATAGCGAAGA CATAAACCGA AGCCATATAG GACTGCCGGT TGCGTICCGC ACTATTCATA 601 TTGCCCGCAA GGCCAAGAAA CAGCGCCACG GTGGTTAGCG GATIGGCTAA CGGGAGCAGT 661 ACGACCAACC CCAATCCAAT CGCTTIAAAC AAATCCATCA TAATACTATC TCTTACCCAT 721 CAGCGTTICA TGAACCGGAA GTATAAAGTG AAATTGCCCA GGCGCGCCAT TICGCCAGTG 781 TGCAAGTTAA TATCCTCTAC AACCTATAAC CTGTAATIAT CAATIAGTIA CAAGTIATCA 841 CAGCACAATA CCCCGGACGC CTITIAGCAA ATCGTGGCAT CGGCCAATIC ATTIAGTTGA 901 CTIATACTTG CCTGGGCAAT AGTATCTGAC GAAATTAATT ACTIGCCGGG GCAACCATTI 961 TGAAAAGCAC CAGTGATCTG TTCAATGAAA TCATICCGCT GGGTCGCTIG ATCTACATGG 1021 TAAATCAAAA AAAAGATCGC CTGTIAAATA ACTATTIATC CCCGCTGGAT ATCACCGCAA 1081 CACAGTTIAA AGTGCTTIGC TCGATACGCT GCGCGGGATG TATIACCCCG GTTGAACTIA 1141 AAAAAGTGCT GTCTGTCGAT CTCGGCGCAT TGACGCGAAT GCTCGACCGC CTGCTGTGCA 1201 AAGGCTGGAT CGAAAGACTG CCGAATCCTA ATGACAAACG CGGCGTACTG GTGAAGCTAA 1261 CGCCGGACGG CGCGGCAATI TGTGAGCAAT GTCATCAACG ACCAGGGCAA GACCTGCATC 1321 AGGAATIAAC AAAAAACTIA ACGGCGGACG AAGTGGCAAC GCTIGAGTAT TTGCTCAAGA 1381 AAATICTGCC GTAGCAAAAA AGAGGTATGA CGATGTCCAG ACGCAACACT GACGCTATTA 1441 CTATICATAG CATITIGGAC TGGATCGAGG ATAACCTGGA GTCGCCGCTC TCACTGGAAA 1501 AAGTGTCTGA GCGTTCAGGA TATICCAAAT GGCACCTGCA ACGGATGTTI AAAAAAGAGA 1561 CCGGTCATIC ATIAGGCCAA TACATCCGCA GCCGTAAAAT GACGGAAATC GCGCAAAAAT 1621 TAAAAGAGAG CAACGAGCCC ATICTCTATC TGGCGAACGC TATGGCTTTG AGTCACAGCA 1681 AACATIGACC CGGACGTICA AAAACTATTI TGATGTGCCG CCACACAAAT ACCGGATCAC 1741 CAATATGCAT GGCGAATCAC GGTATATGCT GCCGCTGAAC CATGGCAACT ACTAGTITGT 1801 TTATGCGCCA CGCGAAGAGC ACCATGAAAA TGCTGTTICC CGCCCTGCCG GGTCTGTTAC 1861 TIATCGCCTC CGGATATGGC ATIGCAGAAC AAACTITGTI ACCTGTGGCG CAAAATAGCC 1821 GCGATGTGAT GCTGCTGCCC TGTGTAGGCG ATCCGCCAAA TGACCTICAC CCCGTGAGCG 1981 TGAACAGCGA TAAGTCAGAT GAATTAGGCG TGCCCTATIA TAACGACCAA CACCTITAAC 2041 CTCTTIGCCC CGTITIGCGG GGCATTITTI TAGTACCGTC TGGCTATGAC AAGTCCGCCG 2101 CTATTACCCC GCGGCATGGT CTGAAATIAG CGTITGTCTT CTTAGTAACA TAATGCCTCA 2161 TCCGCTGACA CGCGCAGTAC GGCGCACACG AAATCCAAAC ACATIGATAT AGAGTCCAGC 2221 CATAATCAGT ACTGCGCCCG CAAGCTGCAT CCCGGTCAAC GTTICCCCGA GTAACACCGC 2281 GGCGCTCGCC AGC
29

appearing on the agarose gel in Figure 2 hybridized with the probe. Dot blot analysis was
also perfonned on the chromosomal DNA of all 30 Salmonella species. Using the same
probe, DNA from all 30 organisms hybridized.
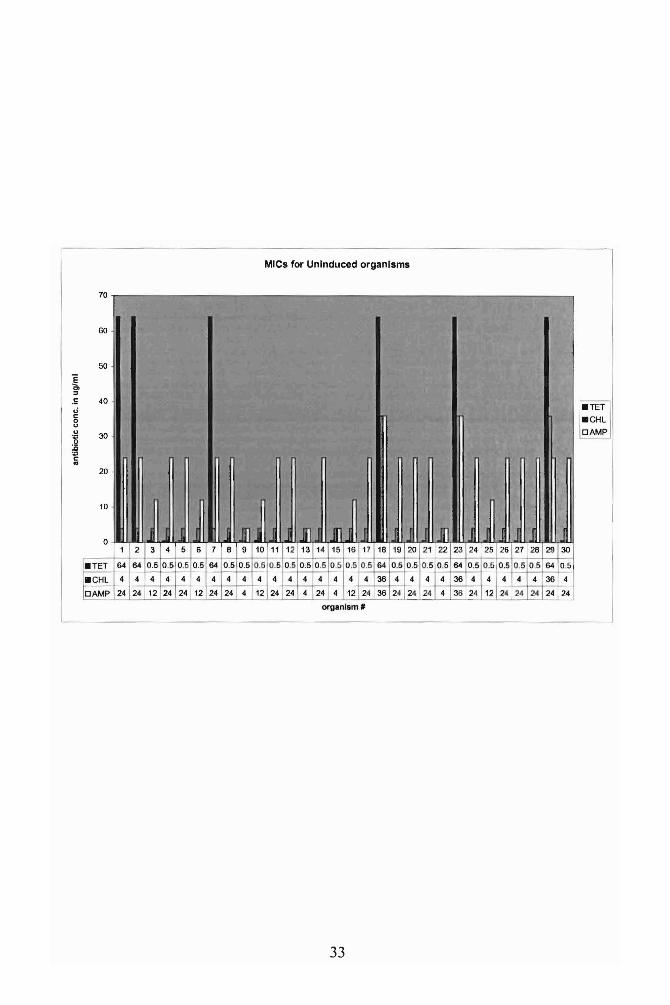
IV. Minimum Inhibitory Concentration (MIC) Determination
The minimum inhibitory concentrations (MIC) of all 30 Salmonella species were
detennined prior to induction with tetracycline (Tet) or chloramphenicol (ChI). Most
organisms demonstrated low levels of resistance to Tet, ChI, and Ampicillin (Amp)
(Fig. 4). S. agona (#1), S. anatum (#2), S. derby (#7), S. muenster (#18), S. reading
(#23), and S. uganda (#29) had innately high tetracycline resistance of64 ~g/m1.
Following induction with tetracycline, S. agona (#1), S. anatum (#2), S. derby
(#7), S. muenster (#18), S. reading (#23), and S. uganda (#29) did not increase their Tet
resistance and remained at 64 !!g/ml (Fig. 5). The majority of organisms however,
increased their Tet resistance from 0.5 to 2 ~g/m1. Additionally, most Tet induced
organisms demonstrated an overall increased resistance to ChI and Amp. S. anatum (#2),
S. cholerasesuis (#6), S. derby (#7), S. gallinarium (#9), and S. give (#10) did not change
their level of resistance to ChI after Tet induction whereas S. arizonae (#3) and
S. newport (#19) demonstrated a slight decrease in resistance. Following induction with
Tet, the resistance ofS. anatum (#2), S. arizonae (#3), S. derby (#7), S. pullorum (#22),
and S. uganda (#29) to Amp decreased.
Twenty-two of the ChI induced organisms increased their Tet resistance
from 0.5 ~g/ml to 3 !!g/ml or greater. Resistance ofS. agona (#1), S. anatum (#2),
S. derby (#7), S. muenster (#18) and S. reading (#23) to Tet remained at 64 ~g/ml
30

(Fig. 6). S. uganda (#29) decreased its resistance to Tet from 641lg/mi to 161lg/mi
following induction with ChI.
All organisms induced with ChI demonstrated an increased resistance to ChI.
Specifically 27 organisms increased their resistance to ChI from 4 Ilg/mi to greater than
12 Ilg/mi. S. arizonae (#3) increased its resistance from 4 Ilg/mi to 6 Ilg/mi. S. munester
(#18), S. reading (#23), and S. uganda (#29) increased their resistance to ChI from
36 Ilg/mi to 64 Ilg/mi. Following induction with ChI, all 30 organisms had an increase in
resistance to Amp ranging from 36llg/mi to 641lg/mi.
31

Fig. 4. Minimum inhibitory concentrations (MIC) for the 30 uninduced Salmonella
isolates. Antibiotics used were tetracycline, chloramphenicol and ampicillin. All 30
individual Salmonella isolates listed in Table 1 had some level of resistance to these
antibiotics before induction.
32
MICs for Uninduced organisms
:g ::J '" .E U :5 u u
~ .Q ;l ..C
70
60
50·
40·
·v "' -- . :.... v· ~~ . I ... - .'
30· ;-.. -.- . \' ~...
\
20, I
i•• 'I ~ l ~ ... ,,' .. .. ~-.. ' .. .. ~.
10·
J J J J J -Ill I I 11 11 I I 11 I a ~
1 2 3 4 5 6 7 6 9 10 11 12 13 14 15 16 17 16 19 20 21 22 23 24 25 26 27 26 2930
.TET 64 64 0.5 0.5 O.5 0.5 64 a.5 0.5 0,5 a.5 a.5 0.5 0,6 0,6 0.5 0,5 64 a.5 a.5 a.5 0,5 64 0,5 0.5 0,5 a.5 0.5 64 0.5
.CHL 4 4 4 4 4 4 4 4 4 4 4 4 4 4 4 4 4 36 4 4 4 4 36 4 4 4 4 4 36 4
DAMP 24 24 12 24 24 12 24 24 4 12 24 24 4 24 4 12 24 36 24 24 24 4 36 24 12 24 24 24 24 24
organism'
.TET
.CHL
DAMP
33

Fig. 5. Minimum inhibitory concentrations (MIC) for tetracycline induced Salmonella
isolates. MIC was perfonned using the antibiotics tetracycline, chloramphenicol, and
ampicillin. The 30 individual Salmonella isolates are listed in Table 1.
34

MICs for Tel Induced Organisms
~ .:"
70
60
I . . 50 . ~
,
,-40 - .
:~, .
~.
" .:. -< . , - ..
, 30 "
I" 'I , '1 ,L ,. ~ I, ~ • .JI I I' :.... ..
20 . ; ; ....
"'1 11
10
n IJf0
1 2 3 4 5 7 6 9 10 11 12 13 14 15 17 16 19 20 21 22 23 24 25 26 26 29 30 31 r--
64 2.TET 64 64 0.5 2 2 2 64 2 2 2 2 2 2 64 2 2 2 2 64 2 2 2 2 64 2
.CHL 12 4 2 16 16 4 12 4 4 64 16 16 16 16 16 64 0.5 16 16 16 64 16 16 16 12 64 16
CAMP 46 15 5 64 64 1o 64 5 15 64 46 46 6 4 64 64 64 64 64 64 3 64 64 24 46 64 10 64
organism'
.TETIi
.CHL8 CAMP
~ :c c:: '" to
35

Fig. 6. Minimum inhibitory concentrations (MIC) for chloramphenicol induced
Salmonella isolates. MIC was performed using the antibiotics tetracycline,
chloramphenicol, and ampicillin. The 30 individual Salmonella isolates are listed in
Table 1.
36

MICs for CHL Induced organisms
fO
I ,5 U c
.. , J' .'. , , . J' ,
60 _ . ". ij ( .po·iL 'r 1 ~"0-.
I ,. .·0'''·. I
I •~II I .., . I50 _ . . . . \,
40 _ I"
I I., ~ 'IJ " \!~.,..
" I ,,'.. "
30
• 20
J J J II
"
JI ~ II
10
III~II II Illl II II II II II I~ II II0 1~·3'~ 5 6 7 6 9 10 11 12 13 14 15 16 17 16 19 20 21 22 23 24 25 26 27 26 29 30 '31 I.TET 64 64 1-* 3 3 64 3 3 3 6 3 4 3 3 3 3 64 3 3 3 3 641 3 3 3 3 I 3 16 3
I.CHL 12 12 6 12 12 16 16 16 12 16 16 16 16 16 16 16 16 64 24 24 24 12 64 12 4 12 12 12116 64 16
IDAMP 64 64 46164 64 64 64 64 64 36 46 64 64 64 64 64 64 84 64 46 64 64 64164 36 46 64-f64 36 36
r:~~18 I~AMPI
I '":i
orUlnllm"
37

Discussion
Using the E. coli marRAB operon as a probe, Cohen et al (8) showed through dot
blot analysis that this genetic locus is prevalent in the Enterobacteriaceae family. Genera
that hybridized with the probe at an annealing temperature of 6SoC were Salmonella,
Klebsiella, Citrobacter, Hafnia, and Enterobacter. Interestingly, they also reported
within the genus Salmonella, S. typhimurium was positive for the marRAB operon while
S. arizonae was negative. These data suggested this operon may not be conserved
throughout Salmonella. Thus, these findings led to the basis of the current study to
determine the prevalence of the marRAB operon in the genus Salmonella.
Sulavik et al (40) further characterized the marRAB operon in S. typhimurium.
They showed the amino acid sequences ofMarR, MarA, and MarB ofS. typhimurium
were 91 %,86%, and 42% identical to those ofE. coli, respectively. However,
S. arizonae was not further characterized by these investigators. In the present study, 30
clinical veterinary Salmonella species were randomly chosen to determine the prevalence
of the marRAB operon (Table 1). PCR was performed on isolated chromosomal DNA
from these 30 organisms using primers based on the marRAB gene sequence of S.
typhimurium. These primers amplify a 2.2 kb region in the genome ofS. typhimurium
corresponding to the marRAB operon. After PCR, agarose gel electrophoresis was
performed to visually identify amplification products (Fig. 2). Sixteen organisms had
the predicted 2.2 kb band. To verify whether the 2.2 kb PCR product was indicative of
the marRAB operon, the amplification product from Salmonella enteritidis (#8) was
sequenced. Nucleotide sequence data revealed the genes marC, marR, marA and marB
where greater than 99% identical to those of S. typhimurium (Fig 2). Some organisms
38
.-l
also amplified a 0.5 kb band (Fig. 2). To determine ifthis was the result of internal
binding of the primers to the marRAB operon, PCR was performed on the cloned 2.2 kb
marRAB operon. Primers based on the marRAB operon ofS. typhimurium amplified both
a 2.2 kb and a 0.5 kb fragment. These results suggested the approximately 0.5 kb
amplification product was an internal fragment ofmarRAB .
Further confirmation was achieved by performing a Southern blot on an agarose
gel containing the PCR products of all 30 Salmonella species (Fig. 2). The probe used
was the sequenced 2.2 kb PCR product ofSalmonella enteritidis. Southern blot analysis
revealed that all bands appearing on the agarose gel hybridized with the probe. These
data suggested that all additional amplification products resulting from PCR using
S. typhimurium marRAB primers are a result of internal binding sites within the operon.
The variation in banding patterns suggest sequence divergence at the primer binding
sites. Thus, the lack of a 2.2 kb amplification product does not rule out the existence of
the operon. Dot blot analysis was also performed on the chromosomal DNA of all 30
organisms at a stringency of both 55°C and 60°C using the marRAB operon from
S. enteritidis as a probe. All 30 organisms hybridized with the probe at both
temperatures. S. arizonae also hybridized with the gene probe which is contrary to prior
a study (8) that suggested the marRAB operon is not found in S. arizonae. The negative
S. arizonae results by Cohen et al (8) may in part be explained the use of an E. coli
marRAB probe. PCR, Southern blot, and dot blot analysis generated in this study
strongly suggest the marRAB operon is well conserved in the genera Salmonella.
Induction experiments were performed on the 30 organisms to determine
if they have a functional marRAB operon. Prior to induction, the background minimum
39
inhibitory concentration (MIC) of all 30 organisms to tetracycline (Tet), chloramphenicol
(ChI), and ampicillin (Amp) was determined. As predicted, the MIC demonstrated all 30
Salmonella isolates had some level of innate resistance to Tet, ChI, and Amp prior to
induction. These three antibiotics were chosen because they are structurally and
functionally unrelated. Prior research (8) has shown the marRAB operon is induced by
subinhibitory concentrations of either Tet or ChI. This results in an organism that is
resistant to several unrelated antibiotics (15,16).
In this study, most Tet induced organisms increased their resistance to Tet, ChI,
and Amp. The exceptions were S. agona (# 1), S. anatum (#2), S. derby (#7), S. muenster
(#18), S. reading (#23), and S. uganda (#29) which maintained a Tet resistance of
64 J..lg/ml (the highest concentration tested). S. anatum (# 2), S. cholerasesius (#6),
S. derby (#7), S. gallinarium (#9), and S. give (#10) maintained the same level of
resistance to ChI after Tet induction, whereas S. arizonae (#3) and S. newport (#19) had a
slight decrease in resistance to ChI. The organisms S. anatum (#2), S. arizonae (#3),
S. derby (#7), S. pullorum (#22), and S. uganda (#29) decreased their resistance to Amp
following induction with Tet.
Most ChI induced organisms demonstrated increased resistance to Tet, ChI, and
Amp. S. agona (#1), S. anatum (#2), S. derby (#7), S. muenster (#18), and S. uganda
(#29) remained resistant to high levels ofTet (64 J..lg/ml). S. uganda (#29) was the only
organism that decreased its resistance to Tet following induction with ChI. However,
S. uganda (#29) did increase its level of resistance to Amp and ChI following induction
with ChI.
40
...l

Various reasons exist as to why some of the organisms did not increase or why
some decreased their level of resistance to the three antibiotics following induction. It is
probable that these organisms have other mechanisms involved in antibiotic influx which
are not regulated by the marRAB operon. Alternatively, experimental error could account
for some of the differences.
As previously discussed, E. coli has various multidrug resistant (Mdr) genes that
confer resistance to either Tet, or ChI, or both. Following induction with these
antibiotics, the organisms become more resistant to a wide array of structurally and
functionally unrelated antibiotics. Genetically, E. coli is very similar to organisms
comprising the genus Salmonella. This makes it highly probable that the 30 Salmonella
species used in this study may have the same Mdr genes that are found in E. coli.
Although this study suggests the marRAB operon is conserved in these 30 organisms,
further analysis of this and other mechanisms of antibiotic resistance in these organisms
needs to be examined.
I 41
-l

LITERATURE CITED
1. Ariza, R. R., S. P. Cohen, N. Bachhawat, S. B. Levy, and B. Demple. 1994.
Repressor mutations in the marRAB operon that activate oxidative stress genes and
multiple antibiotic resistance in Escherichia coli. J. Bacteriol. 176:143-148.
2. Ariza, R. R., Z. Li, N. Ringstad, and B. Demple. 1995. Activation ofmultiple
antibiotic resistance and binding of stress-inducible promoters by Escherichia coli
Rob protein. J. Bacteriol. 177:1655-1661.
3. Brown, T. A., et ale (ed.). Essential Molecular Biology. Oxford University Press,
New York., N.Y.
4. Chou, J. H., J. T. Greenberg, and B. Demple. 1993. Posttranscriptional repression
ofEscherichia coli ompF protein in response to redox stress: positive control of the
micF antisense RNA by the soxRS locus. J. Bacteriol. 175: 1026-1031.
5. Cohen, S. P., H. Hachler, and S. B. Levy. 1993. Genetic and functional analysis of
the multiple antibiotic resistance (mar) locus in Escherichia coli. J. Bacteriol.
175:1484-1492.
6. Cohen, S. P., S. B. Levy, J. Foulds, and J. L. Rosner. 1993. Salicylate induction of
antibiotic resistance in Escherichia coli: activation of the mar operon and a mar
independent pathway. J. Bacteriol. 175:7856-7862.
7. Cohen, S. P., L. M. McMurry, and S. B. Levy. 1988. marA locus causes decreased
expression of OmpF porin in multiple-antibiotic resistant (Mar) mutants of
Escherichia coli. J. Bacterio1.170:5416-5422.
42
...............

8. Cohen, S. P., W. Yan, and S. B. Levy. 1993. A multidrug resistance regulatory
chromosomal locus is widespread among enteric bacteria. 1. Infect. Dis, 168:484-488.
9. Cuevas, C. F. A., M. C. Garcia, and M. Ludgar. 1995. Antibiotic resistance. Amer.
Sci. 83:320-329.
10. Difico Manual. 1984. Difco Manual 10th ed. Difco Laboratories, Detorit, M.N.
11. Davis, B. D., R. Dulbecco, H. N. Eisen, and H. S. Ginsberg. 1990. Microbiology 4th
ed. J. B. Lippincott Companay, New York, N.Y.
12. Fralick, J. A., 1996. Evidence that TolC is required for functioning of the
Mar/AcrAB efflux pump ofEscherichia coli. J. Bacteriol. 178:5803-5805.
13. Gambino, L., S. J. Gracheck, and P. F. Miller. 1993. Overexpression of the MarA
positive regulator is sufficient to confer multiple antibiotic resistance in Escherichia
coli. J. Bacteriol. 175:2888-2894.
14. George, A. M. 1996. Multidrug resistance in enteric and other gram negative
bacteria. FE 139:1-10.
15. George, A. M., and S. B. Levy. 1983. Amplifiable resistance to tetracycline,
chloramphenicol, and other antibiotics in Escherichia coli: involvment of a non
plasmid-determined efflux of tetracycline. J. Bacteriol. 155:531-540.
16. George, A. M, and S. B. Levy. 1983. Gene in the major cotransduction gap of the
Escherichia coli K-12 linkage map required for the expression of chromosomal
resistance to tetracycline and other antibiotics. J. Bacteriol. 155:541-548.
17. George, A. M., R. M. Hall, and H. W. Strokes. 1995. Multidrug resistance in
Klebsiella pneumoniae: a novel gene, ramA, confers a multidrug resistance phenotype
in Escherichia coli. Microbiology. 141: 1909-1920.
43

18. Goldman, J. D., D. G. White, and S. B. Levy. 1996. Multiple antibiotic resistance
(mar) locus protects Escherichia coli from rapid cell killing by fluoroquinolones.
Antimicrob. Agents Chemother. 40:1266-1269.
19. Greenberg, J. T., J. H. Chou, P. A. Monach, and B. Demple. 1991. Activation of
oxidative stress genes by mutations at the soxQlcfxBlmarA locus ofEscherichia coli.
J. Bacteriol. 173:4433-4439.
20. Hachler, H., S. P. Cohen, and S. B. Levy. 1996. Untranslated sequence upstream of
MarA in the multiple antibiotic resistance locus ofEscherichia coli is related to the
effector-bind domain of the XylS transciptional activator. J. Mol. Evol. 42:409-413.
21. Haechler, H., S. P. Cohen, and S. B. Levy. 1991. marA, a regulated locus which
controls expression of chromosomal multiple antibiotic resistance in Escherichia coli.
J Bacteriol. 173:5532-5538.
22. Ishida, H., H. Fuziwara, Y. Kaibori, T. Houriuchi, K. Sato, and Y. Osada. 1995.
Cloning of multidrug resistance gene pqrA from Proteus vulgaris. Antimicrob.
Agents Chemother. 39:453-457.
23. Jair, K.-W., X. Yu, K. Skarstad, B. Thony, N. Fujita, A. Ishihama, and R. E.
Wolf, Jr. 1996. Transcriptional activation ofpromoters of the superoxide and
multiple antibiotic resistance regulons by Rob, a binding protein of the Escherichia
coli origin of chromosomal replication. J. Bacteriol. 178:2507-2513.
24. Jair, K.-W., R. G. Martin, J. L. Rosner, N. Fujita, A. Ishihama, and R. E.Wolf,
Jr. 1995. Purification and regulatory properties ofMarA protein, a transcriptional
activator ofEscherichia coli multiple antibiotic and superoxide resistance promoters.
J. Bacteriol. 177:7100-7104.
44

25. Lee, E., E. Collatz, I. Podglajen, and L. Gutmann. 1996. A rob-like gene of
Enterobacter cloacae affecting porin synthesis and susceptibility to multiple
antibiotics. Antimicrob. Agents Chemother. 40:2029-2033.
26. Lomovskaya, 0., K. Lewis, and A. Martin. 1995. EmrR is a negative regulator of
the Escherichia coli multidrug resistance pump EmrAB. J. Bacteriol. 177:2328-2334.
27. Maneewannakul, K., and S. B. Levy. 1996. Identification of mar mutants among
quinolone-resistant clinical isolates ofEscherichia coli. Antimicrob. Agents
Chemother. 40: 1695-1698.
28. Martin, R. G., K. Jair, R. F. Wolf, Jr., and J. L. Rosner. 1996. Autoactivation of
the marRAB multiple antibiotic resistance operon by the MarA transcriptional
activator in Escherichia coli. J. Bacteriol. 178:2216-2223.
29. Martin, R. G., P. S. Nyantakyi, and J.L. Rosner. 1995. Regulation of the multiple
antibiotic resistance (mar) regulon by marORA sequences in Escherichia coli. J.
Bacteriol. 177:4176-4178.
30. Martin, R. G., K. and J. L. Rosner. 1997. Fis, an accessorial factor for
transcriptional activation of the mar (Multiple Antibiotic Resistance) promoter of
Escherichia coli in the presence of the activator MarA, SoxS, or Rob. J. Bacteriol.
179:7410-7419.
31. Martin, R. G., and J. L. Rosner. 1995. Binding of purified multiple antibiotic-
resistance repressor protein (MarR) to mar operator sequences. Proc. Natl. Acad. Sci.
USA 92:5456-5460.
j 45
I

32. McDermott, P. F., D. G. White, I. Podglajen, M. N. Alekshun, S. B. Levy. 1998.
Multidrug resistance following expression of the Escherichia coli marA gene in
Mycobacterium smegmatis. J. Bacteriol. 180:2995-2998.
33. Murray P. R., K. S. Rosenthas, G. S. Kobayshi, and M. A. Pralle. 1998. Medical
Microbiology, 3rd • Mosby, Chicago, IL.
34. Neidhart, F. C., J. L. Ingraham, M. Schaechter. 1990. Physiology of the Bacterial
Cell. Sinauer Associates Inc, Sunderland, M.S.
35. Okuso, H., D. Ma, and H. Nikaido. 1996. AcrAB efflux pump plays a major role in
the antibiotic resistance phenotype ofEscherichia coli multiple-antibiotic-resistance
(Mar) mutants. J. Bacteriol. 178:306-308.
36. Rosner, J. L, and J. L. Slonczewski. 1994. Dual regulation ofinaA by the multiple
antibiotic resistance (Mar) and superoxide (SoxRS) stress response systems of
Escherichia coli. J. Bacteriol. 176:6262-6269.
37. Sambrook, J., E. F. Fritsch, and T. Maniatis. 1989. Molecular cloning: a
laboratory manual, 2nd ed. Cold Spring Harbour Laboratory Press, Cold Spring
Harbor, N.Y.
38. Schaechter M., N. C. Engleberg, B. I. Eisenstein, and G. Medoft. 1998.
Mechanism of Microbial Diseases, 3rd ed. Williams and Wilkins, London, U.K.
39. Seoane, A. S., and S. B. Levy. 1995. Characterization ofMarR, the repressor of the
multiple antibiotic resistance (mar) operon in Escherichia coli. J. Bacteriol.
177:3414-3419.
40. Seoane, A. S., and S. B. Levy. 1995. Identification of new genes regulated by the
marRAB operon in Escherichia coli. J. Bacteriol. 177:530-535.
46
..l

41. Sulavik, M. C., M. Dazer, and P. F. Miller. 1997. The Salmonella typhimurium
locus: Molecular and Genetic analyses and assessment of its role in virulence. J.
Bacteriol.179:l857-l866.
42. Sulavik, M. c., L. F. Gambino, and P. F. Miller. 1994. Analysis ofthe genetic
requirements for inducible multiple-antibiotic resistance associated with the mar
locus in Escherichia coli. J. Bacteriol. 176:7754-7756.
43. Wu, J., and B. Weiss. 1991. Two divergently transcribed genes, soxR and soxS,
control a superoxide response regulon ofEscherichia coli. J. Bacteriol. 173:2864
2871.
47
~
5t-t?tf-5, ~ Signature ofMajor A<1vIsor
I, Kunonga, Ngoni Ishe, hereby submit this thesis to Emporia State University as partial fulfillment of the requirements for an advanced degree. I agree that the library of the University may make it available to use in accordance with its regulations governing material s of this type. I further agree that quoting, photocopying, or other reproduction of this document is allowed for private study, nonprofit in nature. No copying which involves potential financial gain will be allowed without written permission ofthe author.
@/Jete! Date' ;
Prevalence of the Multiple Antibiotic Resistance Operon (marRAB ) in the Genus
Salmonella
. ' _.-~- -
-;/
Title of thesis
Signature of Graduate Office Staff
}J~l/-.O..V " \ ~ C\ q, Date Received
I I
" !/
I
......~


