
University of South FloridaScholar Commons
Graduate Theses and Dissertations Graduate School
3-25-2015
An analysis of technology applications in therestaurant industryMuhittin CavusogluUniversity of South Florida, [email protected]
Follow this and additional works at: https://scholarcommons.usf.edu/etd
Part of the Hospitality Administration and Management Commons
This Thesis is brought to you for free and open access by the Graduate School at Scholar Commons. It has been accepted for inclusion in GraduateTheses and Dissertations by an authorized administrator of Scholar Commons. For more information, please contact [email protected].
Scholar Commons CitationCavusoglu, Muhittin, "An analysis of technology applications in the restaurant industry" (2015). Graduate Theses and Dissertations.https://scholarcommons.usf.edu/etd/5456

An Analysis of Technology Applications in the Restaurant Industry
by
Muhittin Cavusoglu
A thesis submitted in partial fulfillment
of the requirements for the degree of
Master of Science
Department of Hospitality Management
College of Hospitality and Technology Leadership
University of South Florida
Major Professor: Cihan Cobanoglu, Ph.D.
Katerina Berezina, Ph.D.
Serdar Ongan, Ph.D.
Date of Approval:
March 25, 2014
Keywords: Restaurant technology, Front of house applications, Back of house technologies,
Mobile POS, PCI DSS
Copyright© 2015, Muhittin Cavusoglu

Acknowledgments
I would like to express my gratitude to my major advisor, Dr. Cihan Cobanoglu for his
great support of my master’s thesis. I am very thankful to him for his continues motivation,
feedback, and patience.
I am also grateful to the other members of my committee members, Dr. Katerina
Berezina and Dr. Serdar Ongan, for their valuable guidance, feedback, and encouragement.
Besides the major advisor and committee members, I would like to thank my family, all
my teachers and professors throughout my education for their support and attention on me.
Last but not least, I take this opportunity to express gratitude to Republic of Turkey
Ministry of National Education for providing scholarship for me to study at U.S.

i
TABLE OF CONTENTS
List of Tables: ........................................................................................................................... iii
List of Figures: ............................................................................................................................v
Abstract: ................................................................................................................................... vi
Chapter One: Introduction: ..........................................................................................................1
Research Questions .........................................................................................................4
Hypotheses ......................................................................................................................5
Limitations and Assumption ............................................................................................7
Chapter Two: Literature Review: ................................................................................................8
Technology and Economic Growth ..................................................................................8
The Relationship between Technology and Economic Growth .............................9
The Relationship between Information Technology and Business ...................... 10
The Information Technology Paradox ................................................................ 12
The Economic Impact of Food Industry on Total U.S. Economy.................................... 13
Economic Impact of the Restaurant Industry .................................................................. 15
Food Eaten Away from Home ............................................................................ 17
Hospitality Industry and Information Technology .......................................................... 18
The Relationship between Information Technology and the Restaurant Industry 19
Technology Systems / Applications in the Restaurant Industry ...................................... 22
Front of House (FOH) Operations Systems .................................................................... 23
Point of Sale (POS) Systems .............................................................................. 23
POS Integrated Modules .................................................................................... 25
POS Integrated Payment Applications ................................................................ 29
Emerging FOH Operation Technologies............................................................. 32
Back of House (BOH) Operations .................................................................................. 33
Accounting / Financial Software ........................................................................ 34
Labor Management System /Labor Screening and Recruitment Tool ................. 34
Customer Relationship Management System ...................................................... 35
Business Intelligence System ............................................................................. 35
Inventory Management Application ................................................................... 35
Company Intranet............................................................................................... 36
Kitchen Management Systems ........................................................................... 36
Integrated Cost Control System .......................................................................... 37
Cloud-based Application .................................................................................... 37
Enterprise Management System (EMS) .............................................................. 38
Enterprise Reporting System (ERS) and Real-Time based Reporting ................. 38
Disaster Recovery System .................................................................................. 39

ii
Personal Digital Assistant (PDA) and Intra-day Reporting ................................. 40
Chapter Three: Methodology:.................................................................................................... 41
Research Design and Instrument .................................................................................... 41
Sample .......................................................................................................................... 42
Limitations and Assumption .......................................................................................... 43
Construct Validity ......................................................................................................... 44
Reliability ...................................................................................................................... 44
Data Analysis ................................................................................................................ 45
Chapter Four: Findings:............................................................................................................. 49
Company Characteristics, IT Budgets and Strategies ..................................................... 49
Research Questions ....................................................................................................... 55
Exploratory Factor Analyses .......................................................................................... 64
Hypotheses Testing ....................................................................................................... 74
Hypotheses Related to POS FOH Technology Features ...................................... 75
Hypotheses Related to POS BOH Technology Features ..................................... 77
Hypotheses Related to Mobile POS Perspectives................................................ 80
Hypotheses Related to PCI DSS Compliance ..................................................... 82
Chapter Five: Conclusions and Recommendations: ................................................................... 85
References: ............................................................................................................................... 91
Appendix A: Letter of Permission from the Current Holder of the Data:.................................. 100

iii
LIST OF TABLES
Table 1: Summary of Kondratiev Waves ...........................................................................................................9
Table 2: U.S. Personal Consumption Expenditures by Type of Product (Billions of dollars) 13
Table 3: Expenditures for Travel, Consumer Expenditure Interview Survey, 2005–2011.... 19
Table 4: Job Function of the Respondents ..................................................................................................... 50
Table 5: Company Description ............................................................................................................................ 50
Table 6: Type of the Restaurant .......................................................................................................................... 51
Table 7: Business Metrics Comparison Current Year and Previous Year ....................................... 51
Table 8: Organization Preferences: Business Leadership versus Technology Leadership .... 52
Table 9: IT Budged Projection for Today and in Three Years as a Percentage of Sales ........... 52
Table 10: Corporate Annual IT Budget in Dollars for 2013 .................................................................. 53
Table 11: Comparison between Capital Expenditures versus Operating Expenditures ......... 53
Table 12: Reference to IT Strategic Planning in the Mission Statement of Company ............... 54
Table 13: Level of IT Decision Making at the Company .......................................................................... 54
Table 14: IT Steering Committee........................................................................................................................ 54
Table 15: POS System Replacement ................................................................................................................. 55
Table 16: IT Budget Distribution at the Restaurant Companies ......................................................... 56
Table 17: Technology Area IT Budget Distribution................................................................................... 56
Table 18: Main Drivers the Company’s IT Efforts ...................................................................................... 57
Table 19: Top Challenges for the Restaurant Technology Departments ........................................ 58
Table 20: POS FOH Technology Software/Hardware Utilization and Their Importance ....... 59

iv
Table 21: POS BOH Technology Software/Hardware Utilization and Their Importance ....... 60
Table 22: Mobile POS Perspectives ................................................................................................................... 61
Table 23: PCI Compliance Trends and Challenges ..................................................................................... 62
Table 24: Payment Card Industry Data Security Standards ........................................................................ 63
Table 25: Level of Payment Card Industry Compliance .......................................................................... 64
Table 26: Reliability Scores ................................................................................................................................... 66
Table 27: Bartlett’s Test of Sphericity and the Kaiser-Meyer-Olkin Measure of Sampling
Adequacy (KMO) ........................................................................................................................................................ 69
Table 28: Rotated Component Matrix for POS FOH Operation Features ........................................ 70
Table 29: Rotated Component Matrix for POS BOH Operation Features ....................................... 71
Table 30: Rotated Component Matrix for Mobile POS Perspectives ................................................. 72
Table 31: Rotated Component Matrix for PCI DSS Compliance........................................................... 73
Table 32: Hypothesis Testing for POS FOH Technology Features ..................................................... 76
Table 33: Hypothesis Testing for POS BOH Technology Features ..................................................... 78
Table 34: Hypothesis Testing for Mobile POS Perspectives .................................................................. 81
Table 35: Hypothesis Testing for PCI DSS Compliance ........................................................................... 83
v
LIST OF FIGURES
Figure 1: Kondratiev waves ................................................................................................................................... 10
Figure 2: Comparison of personal consumption expenditures for the year 2013* ............................ 14
Figure 3: Multiplier effect graph of some important sectors ..................................................................... 16
Figure 4: Food away from home (FAFH) as a share of household food expenditures .................... 17

vi
Abstract
The purpose of this study was to examine the utilization of Front of House and Back of
House technology applications by U.S. restaurants across different types of restaurants along
with their level of IT management style, and the importance of these technology applications to
the restaurants’ operations. This study used secondary data. The survey data collected from 500
randomly selected restaurant technology managers who are current subscribers of Hospitality
Technology Magazine as of January 2013. Response rate was 27.2% and these sample groups
represented 67,299 restaurant units. The data analysis was organized into 3 parts (descriptive,
factor analysis and independent samples t-test). The data analyzed with The Statistical Packages
for Social Sciences (SPSS, version 21). In the descriptive part of the data analysis, the
information about respondents’ job functions, company characteristics and companies’ IT
perspectives are evaluated. In the second part, factor analysis was used. Since the factor
analysis is a data reduction technique, factor analysis is used to create correlated variable
composites and to reduce variables for better interpretation. The third and final stage of the data
analysis included testing hypotheses based on factor analysis outcomes by using an independent
samples t-test. The main purpose of using an independent samples t-test is to determine whether
position (IT versus Non-IT), types of restaurant (Chain versus Independent), business leadership
and technology leadership (Innovator versus Follower) differ on the factor attributes.

1
CHAPTER ONE:
INTRODUCTION
The service industry is one of the most important industries in the United States (U.S.
Bureau of Economic Analysis, 2014a). Similarly, restaurant industry is one of the biggest
components of the service industry. The National Restaurant Association (2015a) stated that
restaurant industry sales are predicted to be more than $709.2 Billion in 2015. Moreover,
expenditures in food services and accommodations have increased steadily from 2010 to 2013
rising from $617.7, $649.5, and $685.0 to $714.7 Billion respectively (U.S. Bureau of Economic
Analysis, 2014a). The proportion of the food services and accommodations in the total personal
consumption expenditures was 6.22% (U.S. Bureau of Economic Analysis, 2014a), whereas it
was 4.18% of the total U.S. Gross Domestic Product in 2013 (U.S. Bureau of Economic
Analysis, 2015). As a result, the restaurant industry is one of the growing industries in the U.S.
The restaurant industry is divided into two main categories: Chain restaurants and
independent restaurants (DeMicco et al., 2015). Chain restaurants are defined as “two or more
eating establishments at separate locations under common ownership or related through other
legal entities which as dominant activity provide prepared food for consumption on or off
premises” (Wyckoff and Sasser, 1978, p. xxiii); whereas independent restaurants are the owner-
operated restaurants having no partnership with any national or international restaurants (Pizam,
2005). Based on the level of service, these restaurants are divided into several main categories.

2
According to DeMicco et al. (2015), these categories are: quick service restaurants, casual
restaurants and fine dining restaurants. Each category is further defined below.
Quick service restaurants: Quick service restaurants provide a limited number of food
items to customers in a very short window of time, and generally customers order their food at a
counter or through a drive-through and pay for their food before consuming it (DeMicco et al.,
2015).
Casual restaurants: “Casual restaurant were initially created to cater to the needs and
wants of the middle class who were looking to enjoy the activity of going out to eat and being
served without the high price tag associated with upscale or fine dining restaurants” (DeMicco et
al., 2015 p. 5).
Fine dining restaurants: Fine dining restaurants are also known as white tablecloth
restaurants. “A high level of service is delivered and expected by the patron. The restaurant
décor itself helps to deliver the feeling that a superior dining experience is about to be delivered
by the staff and experienced by the customers” (DeMicco et al., 2015 p. 5). Therefore, a high
level of service delivery results in a high price tag in the fine dining restaurants (DeMicco et al.,
2015).
Across all these levels of restaurant types, technological advancements in the world have
influenced the restaurant business. Technology has become a major factor in the operation of
restaurant businesses with the blossoming of the telecommunications industry, advancements in
computer capabilities, and the development of sophisticated software to support delivery of
services (Buhalis, 1998; Olsen and Connoloy, 2000). The restaurant industry is no exception
(Collins, Cobanoglu, and Malik, 2003). Previous studies have also shown that investing in
information technology (IT) companies were able to achieve revenue growth as well as cost

3
savings (Kauffman and Walden, 2001; Kulatilaka and Venkatraman, 2001; Patil and
Wongsurawat, and Irani, 2015; Ruth, Brush, and Ryu, 2015; Sambamurthy, Bharadwaj and
Grover, 2003). As a result, “with the advent of new technology and its impact on restaurant
operations, one would believe that most firms in the restaurant industry would be IT oriented in
the production and delivery of goods and services” (Oronsky and Chathoth, 2007, p. 942).
Despite this, IT may not be seen as a major function in restaurants. Less than half of the IT
managers in restaurants are solely responsible for IT, while the rest have a main function (e.g.,
accounting manager, restaurant manager etc.) within the restaurant and secondarily have IT
management responsibilities (Cobanoglu, 2007). Cobanoglu (2007) stated that “this simple fact
indicates a potential problem within the restaurant industry wherein managers who have a core
responsibility in an area other than technology would be unable to spend sufficient time on
technology management…” (p. 40).
All restaurant technology may be divided into two major categories: Front of House
(FOH) and Back of House (BOH) technologies that respectively support FOH and BOH
operations (American Hotel & Lodging Association [AH&LA], 2006; Walker, 2014).
Therefore, the main technology system used in these operations in a restaurant is the point of sale
system (POS) which is “a network of cashiers and server terminals that typically handles food
and beverage orders, transmission of orders to the kitchen and bar, guest-check settlement,
timekeeping, and interactive charge posting to guest folios” (Collins and Cobanoglu, 2008, p.
245). Another version of POS used in the restaurant industry is the handheld POS terminal,
which is also known as a mobile POS device or tableside ordering device. A handheld POS
terminal is a portable device which has all the capability of the main functions of a pre-check
POS system, as well as integrated tableside ordering and payment devices (Kasavana, 2011). All
4
of these restaurant technologies which accept, process, store or transmit credit card payments
must comply with a set of security standards known as the Payment Card Industry Data Security
Standards (PCI Security Standards Council, 2013). The existence of these technology-based
systems in restaurants and how they are used in restaurants are the main focus of this study.
Restaurants may have different approaches to the management of technology based on their level
of receptivity of innovation (i.e., whether they are innovators vs. followers) from the business
and technology perspective (Collins and Cobanoglu, 2008).
Restaurant managers are continuously facing a problem of selecting technologies for their
establishments. However, a fast growth and development of restaurant technology makes it
difficult to follow those technology solutions that are important for the industry. This study will
close this gap. Therefore, the purpose of this study was to examine the utilization of Front of
House and Back of House technology applications by U.S. restaurants across different types of
restaurants along with their level of IT management style, and the importance of these
technology applications to the restaurants’ operations.
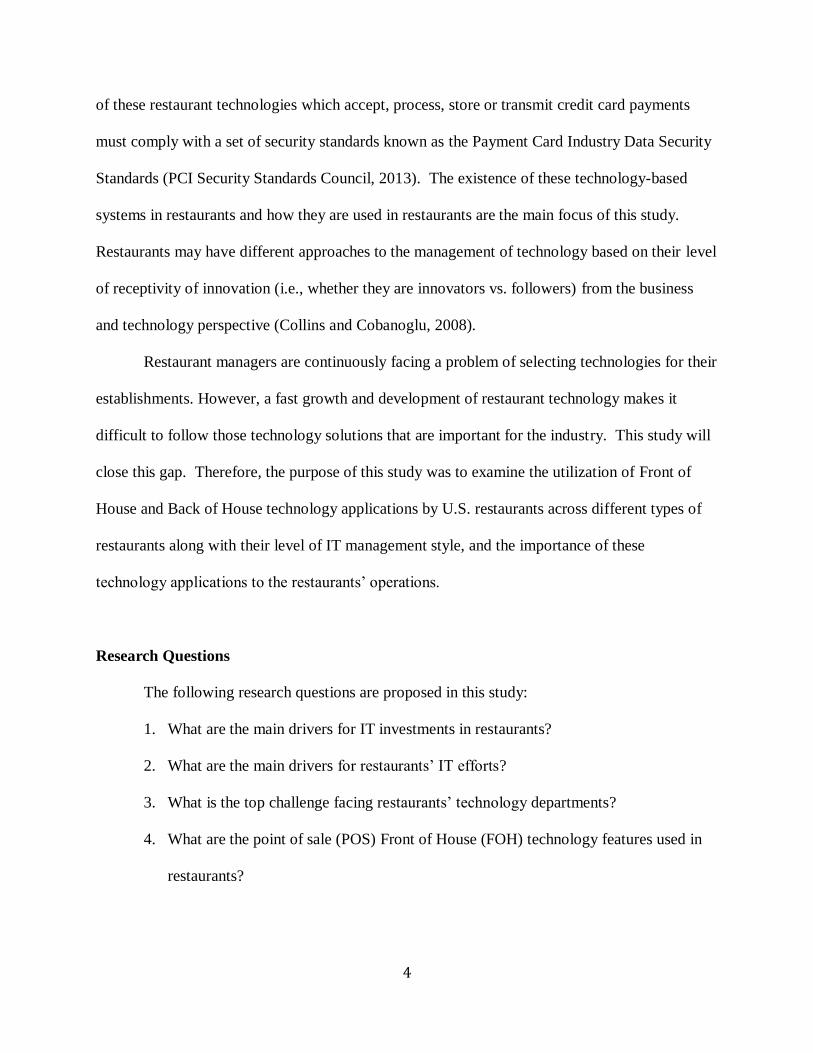
Research Questions
The following research questions are proposed in this study:
1. What are the main drivers for IT investments in restaurants?
2. What are the main drivers for restaurants’ IT efforts?
3. What is the top challenge facing restaurants’ technology departments?
4. What are the point of sale (POS) Front of House (FOH) technology features used in
restaurants?

5
5. What is the importance of POS FOH technology features to the restaurants’
operations by IT managers?
6. What are the point of sale (POS) Back of House (BOH) technology features used in
restaurants?
7. What is the importance of POS BOH technology features to the restaurants’
operations by IT managers?
8. What are the perceptions of restaurant IT managers on mobile POS systems?
9. What are the perceptions of restaurant IT managers on Payment Card Industry Data
Security Standards (PCI DSS) practices in restaurants?
10. To what extent are U.S. restaurants compliant with PCI DSS requirements?
11. What is the level of PCI DSS compliance in restaurants?
Hypotheses
Based on the research questions listed above the following hypotheses are developed:
1. HA1 = There is a significant difference in POS FOH technology features between
chain restaurants and independent restaurants.
2. HA2 = There is a significant difference in POS FOH technology features between
restaurants which identify themselves as innovators versus followers from a business
perspective.
3. HA3 = There is a significant difference in POS FOH technology features between
restaurants which identify themselves as innovators versus followers from a
technology perspective.

6
4. HA4 = There is a significant difference in POS FOH technology features between
restaurants with IT educated IT managers versus non-IT educated IT managers.
5. HB1 = There is a significant difference in POS BOH technology features between
chain restaurants versus independent restaurants.
6. HB2 = There is a significant difference in POS BOH technology features between
restaurants which identify themselves as innovators versus followers from a business
perspective.
7. HB3 = There is a significant difference in POS BOH technology features between
restaurants which identify themselves as innovators versus followers from a
technology perspective.
8. HB4 = There is a significant difference in POS BOH technology features between
restaurants with IT educated IT managers versus non-IT educated IT managers.
9. HC1 = There is a significant difference in mobile POS perspectives between chain
restaurants versus independent restaurants.
10. HC2 = There is a significant difference in mobile POS perspectives between
restaurants which identify themselves as innovators versus followers from a business
perspective.
11. HC3 = There is a significant difference in mobile POS perspectives between
restaurants which identify themselves as innovators versus followers from a
technology perspective.
12. HC4 = There is a significant difference in mobile POS perspectives between
restaurants with IT educated IT managers versus non-IT educated IT managers.

7
13. HD1 = There is a significant difference in PCI DSS compliance between chain
restaurants versus independent restaurants.
14. HD2 = There is a significant difference in PCI DSS compliance between restaurants
which identify themselves as innovators versus followers from a business perspective.
15. HD3 = There is a significant difference in PCI DSS compliance between restaurants
which identify themselves as innovators versus followers from a technology
perspective.
16. HD4 = There is a significant difference in PCI DSS compliance between restaurants
with IT educated IT managers versus non-IT educated IT managers.
Limitations and Assumption
The limitations of this study are the sampling procedure and sample size. The sample
consisted of the IT managers of restaurants who subscribe to Hospitality Technology Magazine;
therefore, the results may not able to be generalized beyond this population. Additionally, it was
assumed that the respondents had the responsibility for their restaurant companies, including
multi-units, and their answers represented the technology outlook of the entire enterprise.

8
CHAPTER TWO:
LITERATURE REVIEW
Technology and Economic Growth
The literature reviewed shows a positive and significant relationship between
improvements made in technology, and economic growth. Study of the relationship between
technology and economic growth goes back to the early 1900s to the work of Joseph Alois
Schumpeter. He is considered to be one of the leading economists in the twentieth century
(Hospers, 2005; Sledzik, 2013; Tichy, 2011). There are also many current studies focusing on
technology and economic growth. Search of the literature reveals a wealth of studies, such as:
Bosworth and Triplett (2001), What's new about the new economy? IT, economic growth and
productivity; Brynjolfsson and Hitt (2000), Beyond computation: Information technology,
organizational transformation and business performance; Debackere, Verbeek, Luwel, and
Zimmermann (2002), Measuring progress and evolution in science and technology–II: The
multiple uses of technometric indicators; Dedrick (2003), Information technology and economic
performance: A critical review of the empirical evidence; Hospers (2005), Joseph Schumpeter
and his legacy in innovation studies ; Jorgenson (2001), Information technology and the U.S.
economy, Jorgenson and Vu (2005), Information Technology and the World Economy and Sood
and Tellis (2005), Technological Evolution and Radical Innovation.

9
The Relationship between Technology and Economic Growth
According to Sledzik (2013) and Tichy (2011), Schumpeter’s main contribution to
economics was showing the role of technological innovation in economic growth. Schumpeter
argues in his book The theory of economic development (1934) that technological innovation is
one of the main engines or dynamics of economic growth. Furthermore, in another book,
Business cycles: A theoretical, historical, and statistical analysis of the capitalist process (1939),
he studied the correlation between economic upswings and technological innovation. As a result
of that study, he concluded that one of the most important reasons for economic upswings is
technological innovation (Schumpeter, 1939).
Schumpeter defined the effect of technological innovation on economic growth through
Kondratiev waves, which are 50-year cycles (Rosenberg and Frischtak, 1984; Tichy, 2011). The
idea of Kondratiev waves belongs to Russian Nikolai Kondratiev; however, it was kept alive and
further developed by Schumpeter in the first half of the 1900s (Tanning and Tanning, 2013).
Table 1 summarizes the Kondratiev waves (Tichy, 2011, p. 16).
Table 1: Summary of Kondratiev Waves
Source: Tanning and Tanning (2013) and Czesany (2006).
In the research cited in Schumpeterian business cycles: Past, present and future (2011),
Tichy reported that although there are many signs of the fifth Kondratiev wave (such as
“information and communication technologies, renewable resources, biotechnologies, and
Kondratiev wave Period Innovation
1st 1780s-1842 Industrial revolution
2nd 1842-1897 The age of steam and steel Railroad, cement, telegraph, photos
3rd 1898-1950 Electricity, chemistry, motors, automobile industry Aluminum, plane, cinema
4th 1950-2000 Electronics, TV, nuclear energy, plastic, cosmonautic, computers
5th 2000->>> ???

10
innovative materials (like nano-materials) studies” (p. 1073)), many researchers are persuaded by
the idea of information and communication technologies as being the fifth Kondratiev wave.
The graph below (Tanning, Saat, and Tanning, 2013, p. 6) shows that the relationship
between economic growth/upswings and the technological innovation/developments occur on
average every 50-year period from the Schumpeterian approach of Kondratiev theory.
Figure 1: Kondratiev waves
Source: Korotayev and Tsirel (2010) and Tanning et al., (2013).
The Relationship between Information Technology and Business
Brynjolfsson and Hitt (2000) defined information technology (IT) as “computers as well
as related digital communication technology [that have] the broad power to reduce the costs of
coordination, communications, and information processing” (p. 24). Advancement in
information technology has entirely changed the way business is done in many industries (Ansel
and Dyer, 1999; Brynjolfsson and Hitt, 2000; Buhalis, 2003; Jorgenson and Stiroh, 2000).
Melville, Kraemer and Gurbahani (2004) concluded that information technology is valuable

11
because it provides broad benefits, such as “flexibility, quality improvement, cost reduction,
productivity enhancement” (p. 54) and much more in the business industry. Additionally,
Mithas, Tafti, Bardhan and Goh (2012) found out in their study (conducted with a sample of over
400 international companies between the years 1998 to 2003) that investment in information
technology has a positive effect on profitability and revenue growth. Previous studies also
showed that through the investment in information technology, companies were able to achieve
revenue growth as well as cost savings (Kauffman and Walden, 2001; Kulatilaka and
Venkatraman, 2001; Patil and Wongsurawat, and Irani, 2015; Ruth, Brush, and Ryu, 2015;
Sambamurthy, Bharadwaj and Grover, 2003). Moreover, information technology offers
competitive advantages to firms (Barney, 2015; Bienstock, Stafford and Stafford, 2015; Cho and
Olsen, 1998; Clemons, 1986; Law, Leung and Buhalis, 2009; Madhavaram and Appan, 2015;
McFarlan, 1984; Melville et al., 2004; Porter, 1985). Liang and Tang (1992) reported that there
are two strategies (proactive or reactive) when evaluating competitive advantages: “The
proactive strategy requires the firm to be an innovator; whereas, the reactive strategy suggests
the firm to be a follower…” (p. 29). To gain an early competitive advantage from the
technology, innovator companies have proactive information technology strategies, leading them
to benefit from the technology first; on the other hand, followers avoid the innovation risks but
as a result follower companies also benefit from technology later (Liang and Tang, 1992).
Lastly, since information technology is adopted in areas such as operational efficiency, customer
relationship, cost control, and strategic decision-making, it becomes an integral part of each and
every one of these operations (Laudon and Laudon 2010; Law et al., 2009; Nyheim, McFadden,
and Connolly, 2005).

12
The Information Technology Paradox
Literature reviewed on this issue demonstrates that a series of studies on the effects of
information technology on company performance and productivity show a significant
relationship between information technology and productivity and company’s key performance
indicators (revenue growth, profitability, cost savings etc.). However, this positive effect is not
universal. For instance, Barua, Kriebel and Mukhopadhyay (1995), Brynjolfsson and Hitt
(1998), and Weill (1992) reject these findings. Moreover, Robert Solow, a Nobel awarded
economist (as quoted in Mogotlhwane, Khosrowshahi, and Underwood, 2006) stated that “[w]e
see the computer age everywhere except in the productivity statistics” (p. 270).
Researchers who reject the positive relationship between information technology and
productivity and company performance, named their theory the “productivity paradox” or
“information technology productivity paradox” (Oz, 2005; Xiong and Luo, 2012). Additionally,
some of the studies conclude that there might not be a direct effect of information technology on
productivity and company performance, and therefore the advantages of information technology
should be measured in other ways than company increased performance and productivity (David,
Grabski and Kasavana, 1996).
As a result, the latest studies have shown that either there is no information technology
paradox (Xiong and Luo, 2012) or that there has been an indirect effect of information
technology on company productivity and performance in the hospitality industry (Mihalic and
Buhalis, 2013). Moreover, Kimes (2008) stressed that “correctly implemented, technology can
more than offset its cost with increased revenue” (p. 298).

13
The Economic Impact of Food Industry on Total U.S. Economy
According to the U.S. Bureau of Economic Analysis (2014a), personal consumption
expenditures by type of product reached $11,484.3 Billion, whereas Gross Domestic Product was
$17,078.3 Billion in the U.S. Economy in 2013 (U.S. Bureau of Economic Analysis, 2015).
Table 2 below shows the U.S. personal consumption expenditures by type of product from 2010
to 2013 (U.S. Bureau of Economic Analysis, 2014a).
Table 2: U.S. Personal Consumption Expenditures by Type of Product (Billions of dollars)
Main Categories 2010 2011 2012 2013
2013 2013
Total
Exp. % GDP %
Goods
Motor vehicles and parts 342 363.5 395.1 417.7 3.64 2.45
Furnishings and durable household
equipment 250.4 260.7 271.1 280.9 2.45 1.64
Recreational goods and vehicles 312.7 321 334.8 348.7 3.04 2.04
Other durable goods 165.6 180.2 191.1 202 1.76 1.18
Food and beverages purchased for
off-premises consumption 788.9 829.1 854.9 872.2 7.59 5.11
Clothing and footwear 320.6 338.9 353.7 360.7 3.14 2.11
Gasoline and other energy goods 333.4 409.6 415.5 408.3 3.56 2.39
Other nondurable goods 849.2 893.5 925.7 960.7 8.37 5.63
Services
Housing and utilities 1909 1959.9 2009 2086.3 18.17 12.22
Health care 1690.7 1764.7 1854.7 1920.3 16.72 11.24
Transportation services 292.9 308.1 319.9 332.6 2.90 1.95
Recreation services 385.1 400.6 418.4 436 3.80 2.55
Food services and accommodations 617.7 649.5 685 714.7 6.22 4.18
Food services* 532.2 558.7 588.1 611.4 5.32 3.58
Accommodations* 85.5 90.8 96.8 103.3 0.90 0.60
Financial services and insurance 763.2 795.8 788.4 826.7 7.20 4.84
Other services 905.4 939.3 977.4 1010.9 8.80 5.92
Final consumption expenditures of
nonprofit institutions serving households 275.4 275 288.5 305.6 2.66 1.79
Total Personal consumption
expenditures 10202.2 10689.3 11083.1 11484.3 100
Gross Domestic Product 17078.3 100
*Sub-categories of food services and accommodations
Source: U.S. Bureau of Economic Analysis (2014a).
According to Table 2, expenditures in food services and accommodations categories have

14
increased steadily ($617.7, $649.5, $685.0 and $714.7 Billion, respectively) from 2010 to 2013.
The proportion of the food services and accommodations in the total personal consumption
expenditures was 6.22%, whereas it was 4.18% of the total US GDP in 2013. When food and
beverages purchased for off-premises consumption is taken into consideration for the year 2013,
total food industry expenditures was calculated at 12.91% (food services, 5.32% + food and
beverages purchased for off-premises consumption 7.59%) of the total personal consumption
expenditures in the U.S. Additionally, the total food industry has 8.69% (food services, 3.58%+
food and beverages purchased for off-premises consumption 5.11%) of the total U.S. GDP in
2013.
The chart below (U.S. Bureau of Economic Analysis, 2014a) shows the personal
consumption expenditures by type of product and the comparison with only food and beverages
services in 2013.
Figure 2: Comparison of personal consumption expenditures for the year 2013*
*Some of the main categories and sub-categories were chosen. Based on data from U.S. Bureau
of Economic Analysis (2014a).
611.4
417.7
408.3
388.6
360.7
348.7
332.6
309.6
280.9
267.8
266.6
0 100 200 300 400 500 600 700
Food and beverage services
Motor vehicles and parts
Gasoline and other energy goods
Pharmaceutical and other medical products
Clothing and footwear
Recreational goods and vehicles
Transportation services
Insurance
Furnishings
Education services
Communication
Billions of dollars

15
According to the above “comparison of personal consumption expenditures” chart,
expenditures in food and beverage services were more than some of the main U.S. services such
as communication, education, insurance, transportation as well as goods such as furnishings,
recreational goods and vehicles, clothing and footwear, pharmaceutical and other medical
products, gasoline and other energy goods and motor vehicles and parts. There is a difference of
approximately $200 Million between food and beverage services, and gasoline and other energy
goods and motor vehicles and parts. The total proportion of food and beverage services in the
U.S. total personal consumption expenditures were calculated at 5.32 %, whereas that same
sector was 3.58% of the total U.S. GDP in 2013.
Economic Impact of the Restaurant Industry
Since the total food industry comprises an important proportion of the U.S. total personal
consumption even when compared with other important services and goods, it is creating an
important economic impact all over the U.S. economy (Kim and Gu, 2003). According to the
National Restaurant Association (2015a), the restaurant industry had a 47% sales share of the
total food industry in 2014, while it was 25% in 1955. In other words, as of 2014, the restaurant
business has gained approximately half of the sales of the total food industry. Therefore, the
restaurant industry is one of the main branches of the food industry. Moreover, total sales are
estimated at $709.2 Billion in 2015, a dramatic increase over the $42.8 Billion realized in 1970
(National Restaurant Association, 2015a). Furthermore, the economic impact of the restaurant
business is projected to total $1.8 Trillion and “each $1 spent in restaurants generates an extra $2
in sales for other industries” (National Restaurant Association, 2015b). In other words, the

16
economic multiplier effect of the restaurant industry is 2 to 1 in the U.S. economy and higher
than some other important industries (U.S. Bureau of Economic Analysis, 2014b).
Figure 3: Multiplier effect graph of some important sectors
Source: U.S. Bureau of Economic Analysis (2014b), Annual Input-Output Tables
The restaurant industry provides a variety of products and services and accesses almost
every household in one-way or another (Andaleeb and Conway, 2006). Hua and Templeton
(2010) reported from Kim and Gu (2003) and the National Restaurant Association (2007) that
“consumers spending was 53 cents out of every dollar on food away from home, compared to 45
cents in 1999” (p. 56). Besides the economic impact, in terms of employment capacity the
restaurant industry is the second largest private industry with 14 Million employees and is
expected to reach 15.7 Million by 2025 (National Restaurant Association, 2015a). For these
reasons, according to Hua and Templeton (2010) and Kim and Gu (2003), the restaurant industry
contributes significantly to the U.S. economy.

17
Food Eaten Away from Home
In recent decades, there has been a great tendency to dine out in the U.S. According to
Binkley (2006), food eaten away from home (FAFH) is one of the main changes in American
dining habits. FAFH as a proportion of household food expenditures has increased steadily from
1970 (25.9%) to 2012 (43.1%) (U.S. Department of Agriculture, 2014).
Figure 4: Food away from home (FAFH) as a share of household food expenditures
Source: Based on data from U.S Department of Agriculture (2014).
There have been numerous studies which have addressed the reasons for this growth,
such as: the increased value of household time as well as increased household income (Binkley,
2006; Byrne, Capps and Saha, 1998; Kinsey, 1983; McCracken and Brandt, 1987; Prochaska and
Schrimper, 1973; Redman, 1980; Yen 1993). According to Goch (1999), the employment rates
of married women have almost tripled since 1950. Additionally, the U.S. Department of Labor
(2014) has reported that the participation rate of married women is 59.5% in the workforce
compared to 57.7% of the total female population overall.
0.0
10.0
20.0
30.0
40.0
50.0
Percent

18
Since married women are increasingly participating the U.S. labor force, they have not
had much time to prepare meals at home, and more importantly they have increased household
income (Binkley, 2006). Moreover, according to Mogelonsky (1998), dining out becomes more
frequent and ordinary instead of as a planned occasion. As result of lack of time to cook at home
and increased household income, people now prefer to dine out. All these factors have led to our
current “booming restaurant industry ” (Andaleeb and Conway, 2006, p. 3). Because the
American people have been dining out more and the way of life has changed in the U.S., the
restaurant industry now has a huge economic impact on the U.S. economy (Andaleeb and
Conway, 2006).
Hospitality Industry and Information Technology
According to Leung and Law (2013), information technology is playing a crucial role as
one of the most important tools in the hospitality industry. Cobanoglu and Collins (2008) claim
that information technology is an inseparable part of the hospitality industry.
A large amount of capital has been invested on information technology in the hospitality
industry to increase revenues, to decrease the costs and to improve service quality for its
customers (Huo, 1998; Siguaw, Enz and Namasivayam, 2000). Furthermore, by implementing
information technology, hospitality businesses have realized a positive and significant
correlation between the use of information technology and the development of a competitive
advantage (Barney, 2015, Cho and Olson, 1998; Clemons, 1986; Madhavaram and Appan 2015;
McFarlan, 1984; Porter, 1985). Additionally, researchers from academia as well as industry
professionals have highlighted the valuable impact which information technology has had and
they have paid attention to the more effective contributions to the hospitality industry (Ham, Kim

19
and Jeong, 2005; Hua, Morasan, and DeFranco, 2015; Law, Buhalis, and Cobanoglu, 2014
Siguaw et al., 2000).
The Relationship between Information Technology and the Restaurant Industry
According to the U.S. Bureau of Labor Statistics as reported by Paulin (2012), on
average, a traveler spent $1372 per trip in 2011. Table 3 below has been prepared based on
surveys collected by the U.S. Bureau of Labor Statistics (2012), from the year 2005 to 2011.
Table 3: Expenditures for Travel, Consumer Expenditure Interview Survey, 2005–2011
Total trip spending 2005 2006 2007 2008 2009 2010 2011 2011
$1,29
3
$1,40
8
$1,46
2
$1,41
1
$1,27
3 $1,300 $1,372 Share %
Food and beverages 320 329 332 327 313 309 329 23.98
Food prepared by consumer
unit on out-of-town trips 41 43 43 49 49 43 48 3.50
Food away from home 236 243 246 238 223 223 236 17.20
Alcoholic beverages 42 43 44 40 42 43 45 3.28
Lodging 294 321 343 329 300 299 315 22.96
Transportation 538 610 643 622 543 570 603 43.95
Airfare 285 335 360 343 301 325 342 24.93
Train, bus, ship fare 73 83 84 71 72 65 62 4.52
Car and truck rental 27 28 28 27 25 26 23 1.68
Other vehicle rental*
Local transportation (taxi,
etc.) 18 21 21 20 17 17 20 1.46
Gasoline and motor oil 121 129 132 146 110 119 141 10.28
Parking fees and tolls 10 10 10 10 11 11 10 0.73
Recreational vehicles 4 5 7 4 6 7 5 0.36
Fees and admissions 141 148 145 134 116 122 125 9.11
*Expenditure is positive, but less than $0.50.
Source: U.S. Bureau of Labor Statistics, (2012).
As can be seen in Table 3, total trip spending was categorized into four main groups
which are food and beverages, lodging, transportation and fees and admissions. Shares for these
categories were 23.98%, 22.96%, 43.95% and 9.11% respectively. Among the four major

20
components of total trip spending, food and beverages came in second place with a 23.98%
share, after transportation expenditure (43.95%). As a result, all of the above figures also show
the importance and economic impact of the food and beverages industry on the total hospitality
industry, in addition to total U.S. personal consumption expenditures and U.S. GDP.
The World Travel Organization Tourism Highlights (2014) reported that total
international tourism receipts across the Americas (including North, Central, and South America
and the Caribbean) were $229.2 Billion in 2013. Additionally, STR Analytics’ Hotel Operating
Statistics Almanac (2014) reported that the revenue in the hotel industry has reached on
estimated $163 Billion in 2013. When international tourism receipts and projected hotel industry
revenue are added to each other, they still could not reach the restaurant sales which totaled
$660.5 Billion in the U.S. (National Restaurant Association, 2013).
In addition to its impact on the U.S. economy and the food industry, the restaurant
industry is also one of the main branches of the hospitality industry. So the fact that information
technology is commonly used in the hospitality industry, it brings many benefits to the restaurant
industry. Therefore, Information technology creates a large difference (Hayes, 2002) and
strongly affects the restaurants’ performance (Devaraj and Kohli, 2003). According to Kimes
(2008), convenient technology can bring many benefits to the restaurant industry.
Kimes (2008) points out that the benefits of technology include: shortening time spent in
the ordering process (e.g., handheld terminals), enhancing processing in food production (e.g.,
kitchen technology), speeding up the service time (e.g., table management systems), providing
faster payment (e.g., handheld terminals), shortening seat turnover or turnaround time (e.g., near
field communications and/or table management systems), and decreasing labor cost (e.g., labor
management systems, online reservation systems and POS integration into online ordering). In
21
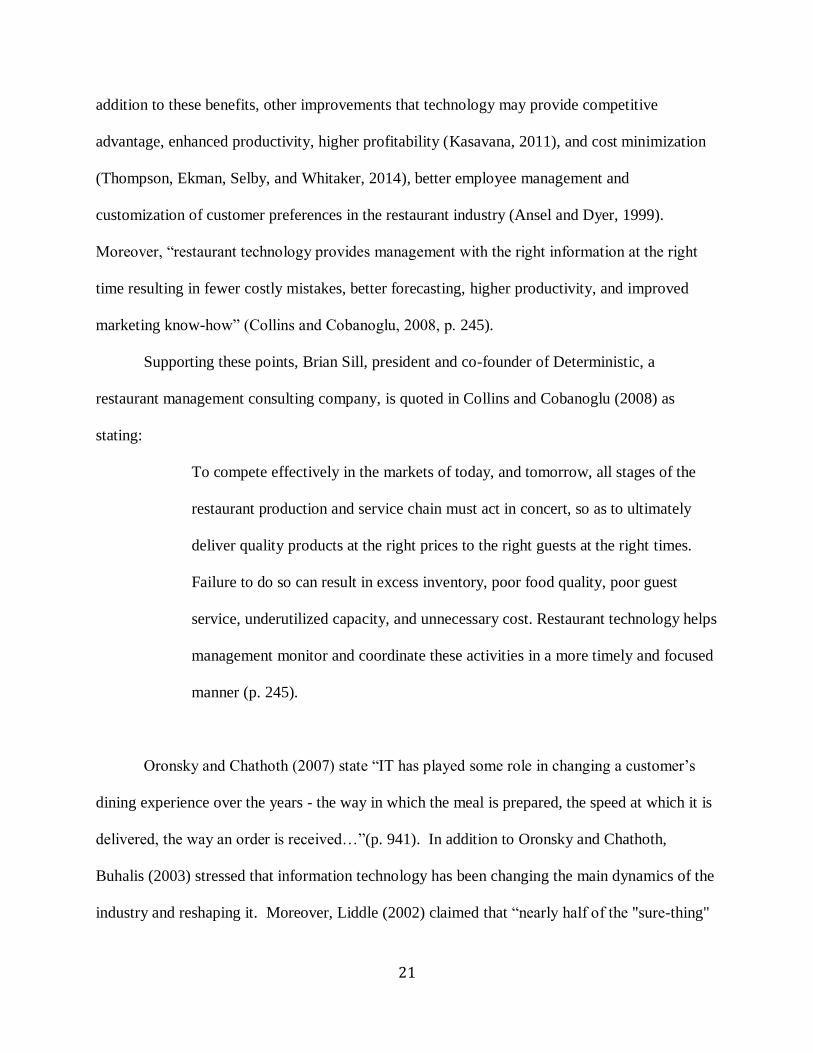
addition to these benefits, other improvements that technology may provide competitive
advantage, enhanced productivity, higher profitability (Kasavana, 2011), and cost minimization
(Thompson, Ekman, Selby, and Whitaker, 2014), better employee management and
customization of customer preferences in the restaurant industry (Ansel and Dyer, 1999).
Moreover, “restaurant technology provides management with the right information at the right
time resulting in fewer costly mistakes, better forecasting, higher productivity, and improved
marketing know-how” (Collins and Cobanoglu, 2008, p. 245).
Supporting these points, Brian Sill, president and co-founder of Deterministic, a
restaurant management consulting company, is quoted in Collins and Cobanoglu (2008) as
stating:
To compete effectively in the markets of today, and tomorrow, all stages of the
restaurant production and service chain must act in concert, so as to ultimately
deliver quality products at the right prices to the right guests at the right times.
Failure to do so can result in excess inventory, poor food quality, poor guest
service, underutilized capacity, and unnecessary cost. Restaurant technology helps
management monitor and coordinate these activities in a more timely and focused
manner (p. 245).
Oronsky and Chathoth (2007) state “IT has played some role in changing a customer’s
dining experience over the years - the way in which the meal is prepared, the speed at which it is
delivered, the way an order is received…”(p. 941). In addition to Oronsky and Chathoth,
Buhalis (2003) stressed that information technology has been changing the main dynamics of the
industry and reshaping it. Moreover, Liddle (2002) claimed that “nearly half of the "sure-thing"

22
changes that will reshape foodservice by 2010 will involve technology” (p.4).
According to Oronsky and Chathoth (2007), recent trends of information technology in
the restaurant industry are customer feedback systems (e.g., customer relationship management
(CRM), social media activity integrated into CRM platform, and real-time, web-based reporting),
repeat business management applications (e.g., e-reservation systems, point of sale (POS)
integration into online ordering), marketing management systems (e.g., POS software and
handheld terminals), operational restaurant systems (e.g., wireless credit card authorization or
mobile POS and revenue management system, accounting/financial software, and integrated cost
control software or inventory management tools), human resources management systems (e.g.,
labor management systems, labor screening and recruitment systems, and company intranet), and
Back of House management systems (e.g., kitchen technologies, kitchen management systems,
kitchen displays, and kitchen printers).
As a result, based on all the above information, the role which technology is playing in
the restaurant industry is an important one.
Technology Systems / Applications in the Restaurant Industry
There are many technology systems used in the restaurant industry. However, a review
of literature demonstrated that there have not been studies on restaurant technology as much as
on other fields in the hospitality industry (Huo, 1998; Lam, Cho and Qu, 2007; Kim, Lee and
Law, 2008). According to AH&LA, “Food and Beverage Systems Report” (2006), technologies
used in restaurants are divided into two main groups: systems/applications that are used in Front
of House (FOH) operations, and those used in Back of House (BOH) operations.

23
Front of House (FOH) Operations Systems
FOH operations can be defined as the process starting with taking orders and delivering
food to guests and completing with payment process (AH&LA, 2006). There are many
technology applications that used in this process. Most of the important technologies that are
used in Front of House are: point of sale systems, POS integrated modules, POS integrated
payment applications and some emerging technologies used in FOH operations.
Point of Sale (POS) Systems
POS system is “a network of cashiers and server terminals that typically handles food and
beverage orders, transmission of orders to the kitchen and bar, guest-check settlement,
timekeeping, and interactive charge posting to guest folios” (Collins and Cobanoglu, 2008, p.
245). According to AH&LA (2006), “the POS system is the core system for F&B
operations…”(p. 3). POS systems date back to the early 1980s (Ansel and Dyer, 1999). They
make it possible to update prices, change menu items, and track sales data through POS systems,
all in a simple and quick way (Ansel and Dyer, 1999). A POS system has mainly two
components, which are POS hardware and POS software (Kasavana, 2011).
The POS hardware systems are installed on computers and provide the capability of
connecting any piece of equipment or device to the POS such as: touch screen terminal,
integrated credit card swipe device and table side ordering devices such as handheld terminals
(Collins and Cobanoglu, 2008). The POS hardware is meaningless itself and cannot work for the
purpose of the restaurants, so there should be some POS applications installed into POS
hardware “to instruct to what to do, how to do it and when to do it”(Kasavana, 2011, p. 131).
Advancement in POS technology results in user-friendly POS hardware such as touch
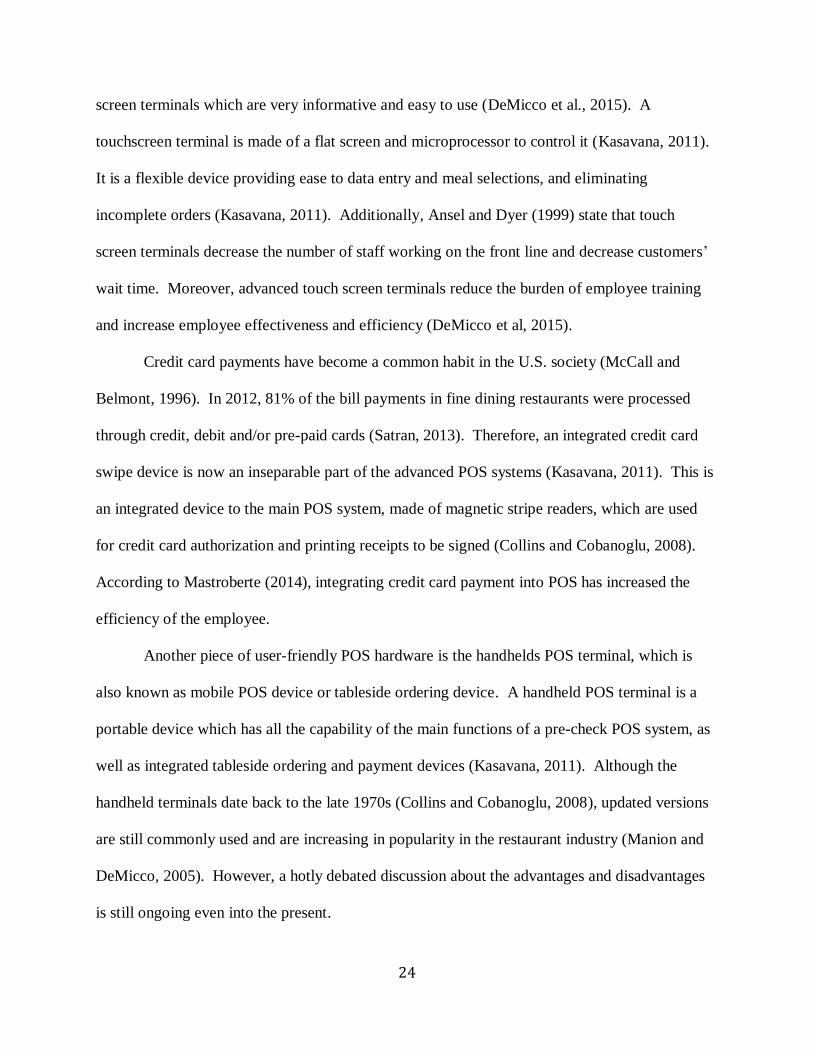
24
screen terminals which are very informative and easy to use (DeMicco et al., 2015). A
touchscreen terminal is made of a flat screen and microprocessor to control it (Kasavana, 2011).
It is a flexible device providing ease to data entry and meal selections, and eliminating
incomplete orders (Kasavana, 2011). Additionally, Ansel and Dyer (1999) state that touch
screen terminals decrease the number of staff working on the front line and decrease customers’
wait time. Moreover, advanced touch screen terminals reduce the burden of employee training
and increase employee effectiveness and efficiency (DeMicco et al, 2015).
Credit card payments have become a common habit in the U.S. society (McCall and
Belmont, 1996). In 2012, 81% of the bill payments in fine dining restaurants were processed
through credit, debit and/or pre-paid cards (Satran, 2013). Therefore, an integrated credit card
swipe device is now an inseparable part of the advanced POS systems (Kasavana, 2011). This is
an integrated device to the main POS system, made of magnetic stripe readers, which are used
for credit card authorization and printing receipts to be signed (Collins and Cobanoglu, 2008).
According to Mastroberte (2014), integrating credit card payment into POS has increased the
efficiency of the employee.
Another piece of user-friendly POS hardware is the handhelds POS terminal, which is
also known as mobile POS device or tableside ordering device. A handheld POS terminal is a
portable device which has all the capability of the main functions of a pre-check POS system, as
well as integrated tableside ordering and payment devices (Kasavana, 2011). Although the
handheld terminals date back to the late 1970s (Collins and Cobanoglu, 2008), updated versions
are still commonly used and are increasing in popularity in the restaurant industry (Manion and
DeMicco, 2005). However, a hotly debated discussion about the advantages and disadvantages
is still ongoing even into the present.

25
Advantages of mobile POS devices include: serving guests more quickly, delighting
guests (DeMicco et al., 2015), increasing guest satisfaction (Kasavana, 2011) and reducing credit
card skimming (Cobanoglu, Erdem, Nusair, and Berezina, 2012). In contrast to these
advantages of mobile POS devices, however, there are also some drawbacks, such as: they are
easy to lose, and easy to damage (Collins and Cobanoglu, 2008), the devices are expensive
(Manion and DeMicco, 2005), and they are not a secure method of payment due to the possibility
of data interception through wireless technology so some managers do not want to invest in
mobile POS devices (Lucas, 2003). Besides the mobile POS devices, customers are willing to
try new technologies; therefore, mobile POS applications and mobile optimized websites are
gaining popularity among restaurant customers (DeMicco et al., 2015).
Other than POS hardware, there are many modules or programs compatible with POS
systems, such as: gift card modules, POS integration into online ordering, social media activity
integrated into POS, table management systems, reservation systems, menu management
systems, and take-out/delivery systems used in the restaurant industry. Furthermore, POS
systems provide some payment applications, such as: wireless credit card authorization, tableside
payment devices, near field communication, and bill pay via customers’ mobile phones. In
addition to payment applications, the advanced POS systems integrate some emerging FOH
operation technologies, which are: digital signage devices, energy efficient POS, barcode
scanners, and biometric readers.
POS Integrated Modules
POS systems are becoming more powerful, with the ability to connect different modules
(Collins and Cobanoglu, 2008). Gift card integration, POS integration into online ordering,

26
social media activity integrated into POS, table management systems, reservation systems, take-
out/delivery systems, and menu management systems are some commonly used modules in the
restaurant industry.
A gift card module is a piece of integrated POS software that tracks the gift cards sales
and redemption (Collins and Cobanoglu, 2008). According to Kasavana (2011), a gift card
program helps to increase customer loyalty, attracts new customers, and provides advanced cash
flow. Moreover, other benefits of gift card programs are “increased sales, the frequency and
nature of customers’ transactions are tracked, a higher profit margin because not all gift cards are
redeemed, and the refilling and reusing of them by customers ” (DeMicco et al., 2015, p. 137).
According to Collins and Cobanoglu (2008), 10% of the all transactions in Starbucks are done
through gift cards which provided the company a great benefit.
POS integration into online ordering is another beneficial module for the restaurant
industry. It is another type of distribution channel for the restaurant industry to increase sales,
and also decrease labor costs (Kimes, 2008). Since it is connected to a POS system, it provides
quick food delivery and reduces the waiting time (Kimes, 2008). According to Creamer and
Lorden (2014), most of the POS companies are offering an integrated online ordering module as
part of a POS system.
Social media activity integration into POS is another interface that enables restaurant to
advertise their menus online and receive orders through social media (Riggs, 2013). According
Creamer and Lorden (2014), 33% of the restaurant customers are expecting social media
integration into the POS. In the same reports, it was clearly seen that some of the important POS
systems providers are seeking to integrate online ordering and/or social media activity with the
POS systems (Creamer and Lorden, 2014).

27
There are some POS modules that help restaurateurs to organize and to handle table
management, reservations and menu management much better. Table management systems are
one of the most efficient modules for organizing and handling table status and reservations
(DeMicco et al., 2015). Ansel and Dyer (1999) state that “table management systems are
designed to track table status to improve timeliness of service and speed turns” (p. 2). Table
management system can be a function or an integrated mechanism of the POS system which
provides better communication among servers and guests, decreases waiting time, keeps tracks
of reservations and distributes the tables equally among the servers (Collins and Cobanoglu,
2008; Kimes, 2008). Through a computer screen, seating area as a whole can be graphically
displayed, vacant, occupied and reserved tables can be checked, and whether a guest check is
paid or still open can be controlled (DeMicco et al., 2015). Additionally, a particular table status
can be checked and guests informed as to when it might become available (Collins and
Cobanoglu, 2008). As a result, table management systems can increase effectiveness and
efficiency of the restaurants (DeMicco et al., 2015).
To be able to keep track of reservations, table management systems require reservation
modules. The reservation module is a part of the table management system and monitors the
call-in and walk-in reservations, shows the current status of the tables and forecasts seat turnover
or turnaround time (Collins and Cobanoglu, 2008). According to Kimes (2008), reservation
systems also keep track of online reservations and provide guest records as well as changes to
reservations. Some of the restaurant companies have reported that online reservations accounted
for 30% of the all reservations (Ruggless, 2003). Consequently, reservation systems bring many
benefits to restaurants.
Nowadays, instead of having reservations and dining at a restaurant, some people prefer

28
to order food online for both take out or home delivery; therefore, online ordering attracts more
customers to the restaurants and increases the popularity of this method (Kimes, 2008).
Moreover, according to Lang (2006), there has been an increase in restaurant sales after
implementing online ordering and reservations into the restaurants’ technology. DeMicco et al.
(2015) state that home delivery has been growing in popularity among the table service
restaurants. Therefore, the take-out/delivery system is addressed to the people who demand
online ordering. The take-out/delivery system is an order placement system which includes
restaurant customers’ addresses, map directions to the customers, phone number, and previous
preferences for delivering food their address (Collins and Cobanoglu, 2008). Take-out/delivery
systems bring important benefits to the restaurants industry. These benefits include: enhancing
delivery timing, increasing driver productivity, providing efficient routing to the drivers, and
offering maps with highlighted routes, and optional step-by-step directions (DeMicco et al.,
2015).
Another effective POS module is menu management. Monitoring the entire menu is as
important as monitoring the reservations. It helps the restaurants to assign prices, keeps track of
entire menu items, provides detailed recipes and nutritional information, and also gives
management the opportunity to control inventory usage and cost of the items (Collins and
Cobanoglu, 2008; Kasavana, 2011). Menu management systems can provide a detailed menu
item analysis report which includes the quantity of each menu item sold, cost control
performance, the ideal cost of food for each item, and the contribution margin of each menu item
(DeMicco et al., 2015). Therefore DeMicco et al. (2015) stressed that “this information is
helpful in analyzing profitability, food costs, customer preference, menu structure, trends,
promotion effectiveness, product performance and contribution” (p. 145).

29
POS Integrated Payment Applications
Customer-facing payment technologies (which are basically tableside payment devices,
mobile wallets, and mobile remote payment/wireless credit card authorization) have been
increasing in popularity among the both restaurants and consumers (Kimes and Collier, 2014).
According to Horovitz (2012), 44% of the casual restaurant consumers now prefer to use
tableside payment.
A tableside payment device allows customers to make their payment on-site by using
their credit or debit cards and retaining their credit card information during the payment process.
Since the tableside payment device requires credit card authorization, it needs to be connected
with the POS system. Wireless credit card authorization is an integrated module on the POS,
which accepts the payments through tableside payment devices or personal digital assistants
(Tesone, 2005). According to Scornavacca, Prasad, and Lehmann (2006), it provides higher
efficiency, quicker service, increased preciseness and is more user friendly. Moreover,
according to Kimes and Collier (2014), tableside payment devices decrease the payment time in
restaurants; therefore they increase customer satisfaction by providing faster payment.
Another popular customer-facing payment technology is mobile payment. Horovitz
(2012) reported that 33% of the casual restaurants’ and 25% of the quick service restaurants’
customers would like to use mobile payment. For example, in a two-year period mobile payment
transactions have reached 20% of the total transactions in Starbucks (Wester, 2013). The mobile
payment system is a module integrated into the POS system for helping the customers to pay
their bills through smart phones (Rehman and Coughlan, 2013). According to Creamer and
Lorden (2014), 59% of the POS technology upgrades will be on mobile wallet or bill pay via
customers’ mobile phone. Additionally, in 2015, most of the POS vendors interviewed have

30
planned to add mobile wallet module on the POS systems (Creamer and Lorden, 2014).
Since there is an increasing demand for mobile payment, some institutes are working on
mobile payment to offer a secure and faster mobile payment system (Rehman and Coughlan,
2013). Therefore, near field communication technology is beginning to replace current radio
frequency identification (RFID) usage in the mobile devices with a secure PIN for faster
authorization and transaction, as this provides wider connectivity and provisioning via mobile
devices (Kasavana, 2011). Additionally, “the use of near field communications (NFC) means
that the smartphone or mobile device never leaves the customers’ hands when they scan their
payment” (Kimes and Collier, 2014, p. 8). As a result, since the customers do not give their
phones to the servers, mobile payment technology can be thought more secure. This is supported
by Cobanoglu et al. (2012) when they state “mobile POS technology reduces credit card
skimming” (p. 15).
Although Cobanoglu et al. (2012) state that “mobile POS technology reduces credit card
skimming” (p. 15), they also stress that network protection is itself a serious concern. According
to the 2014 Trustwave Global Security Report, 59% of the credit card fraud in 2013 came from
the U.S. Additionally, 18% of the fraud came from the food and beverage industry, whereas
11% of the fraud came from the hospitality industry in 2013 (Trustwave Global Security Report,
2014). Furthermore, in 2013, 1,165,090 complaints were recorded with regard to fraud, and 17%
of the fraud complaints came from credit card holders (Federal Trade Commission, 2014). Since
the network security and fraud issues have increased in the last decade, the Payment Card
Industry Data Security Standards (PCI DSS) were established in 2006 by global payment brands
including: American Express, Discover Financial Services, JCB International, MasterCard, and
Visa Inc. (Berezina, Cobanoglu, Miller and Kwansa, 2012). As a result, all companies that

31
accept credit cards must abide by the set of standards or requirements initiated by PCI DSS
(Connolly and Haley, 2008). PCI data security standards (version 3.0) with which all companies
which are processing, storing or transmitting credit card information must comply, are provided
below (PCI Security Standards Council, 2013):
Install and maintain a firewall configuration to protect cardholder data.
Do not use vendor-supplied defaults for system passwords and other security
parameters.
Protect stored cardholder data.
Encrypt transmission of cardholder data across open, public networks.
Use and regularly update anti-virus software or programs.
Develop and maintain secure systems and applications.
Restrict access to cardholder data by business need-to-know.
Assign a unique ID to each person with computer access.
Restrict physical access to cardholder data.
Track and monitor all access to network resources and cardholder data.
Regularly test security systems and processes.
Maintain a policy that addresses information security for all personnel.
Besides the requirements above, there are some practices that may improve the credit
card transaction’s security. These practices can be “Use of point-to-point encryption (P2PE)”,
“Outsource PCI compliance efforts”, and “Use of tokenization at the card swipe”. (PCI Security
Standards Council, 2011, 2012, 2013). Additionally, researchers identified several issues and
barriers to PCI DSS compliance in restaurants (Collins and Cobanoglu, 2008; Collins,

32
Cobanoglu, and Bilgihan, 2013). They are: lack of budget, brand responsibility, the high burden
of PCI DSS compliance on merchants, lack of knowledgeable staff, complexity of PCI DSS, and
limited support from vendor and top management.
Emerging FOH Operation Technologies
Advancement in technology is bringing useful tools and applications in daily life as well
as the restaurant industry. According to Lorden’s (2012) interview, David Lehn, Vice President
of Information Technology for Noodles & Company, stated that a modern restaurant should have
digital menu boards and signage, and R.P. Rama, Vice President & Chief Technology Officer
for JHM Hotels, predicts that biometric tools will bring many benefits to the hospitality industry,
stating: “[i]t would resolve any issues with stolen or lost credit cards or even getting duplicate
cards”. Digital signage devices, meantime, can be used as interactive digital menus, and used for
promoting special meals and discounts, sharing photos and videos about the restaurants, and
informing the guests about forthcoming events (Sonnenshein, 2014). According to the Digital
Signage Federation (N.A.), a digital sign can easily be a standard fixture of a restaurant and
offers many benefits, such as: cost savings, promoting special and new items, and providing
upselling opportunities. A biometric reader is another innovative technology for the restaurant
industry. A biometric reader is a device that identifies people by their unique physical traits
(such as fingerprints, retina prints, and voice), and stores these identifiers to use for later
verification of the same customers based on their profile in the database, which includes their
identities linked to their unique makers (Collins and Cobanoglu, 2008). As a result of
implementing biometric-enabled POS, Hooters, one of the biggest chains with 452 world
restaurants, has accomplished reduction in transaction fraud, payroll fraud, and food costs. Also,

33
Hooters got rid of swipe card replacement cost and unauthorized overrides (Hospitality
Technology Magazine, 2015).
On an annual Hospitality Technology Magazine review on the latest POS Hardware
releases, Mastroberte (2014) reported that some of the vendors released energy efficient POS and
barcode scanners/readers integrated with the POS system. A barcode scanner/reader is a device
that reads the barcodes and converts them into language-based information such as the product’s
name, price, and any discounts attached to the item, if available (Kim and Lim, 2011). Barcode
readers also provide ease and efficiency in meal coupon redemption. Another recent release is
the energy efficient POS system. This is a POS system which uses low energy consumption
units in and of itself, as well as in other devices such as handheld devices, and the mobile tablets
also connected to the energy efficient POS (Mastroberte, 2014).
Back of House (BOH) Operations
According to AH&LA (2006), it is difficult to manage a restaurant without measuring
and controlling important main performance indicators. With the help of BOH operation systems
it is possible to measure and monitor these indicators, such as: cost of food, inventory, financial
status, and labor scheduling and productivity (AH&LA, 2006). Some of the important BOH
operations systems are: accounting / financial software, labor management system / labor
screening and recruitment tool, customer relationship management system, business intelligence
system, inventory management application, company intranet, kitchen management systems
(kitchen displays and kitchen printers), integrated cost control systems, cloud-based application,
enterprise management system, enterprise reporting system and real-time based reporting,
disaster recovery system, and personal digital assistant and intra-day reporting.

34
Accounting / Financial Software
This is a software application connected with POS systems which creates sales
transaction reports and economic events (Tesone, 2005). Many BOH operations software
programs include a variety of accounting modules but most of them generally include at least:
accounts receivable, accounts payable, payroll accounting, inventory accounting, purchasing, and
financial reporting modules (Kasavana, 2011). The main reason of using the accounting
software is to keep track of all financial transactions which occur among the stakeholders of the
company (Collins and Cobanoglu, 2008). Moreover, the main benefits of the accounting
applications are “managing cash flow, collecting monies owed by customers, controlling and
tracking expenditures, evaluating financial status, and tracking monies owed to creditors”
(Collins and Cobanoglu, 2008, p. 225)
Labor Management System /Labor Screening and Recruitment Tool
Labor management systems help the restaurant to create working schedules for better and
more efficient work force forecasting, and gives the managers better opportunity to analyze the
performance of employees, and to control clock-in/clock-out hours (AH&LA, 2006). According
to National Restaurant Association (2014), employee turnover rate in the accommodations and
restaurant industry was 62.6% in 2013, whereas it was 42.2% in the overall private industry.
Therefore, some of the POS systems provide labor screening, which offers restaurateurs the
opportunities to keep track of employee status such as: employee records, tax information,
employee benefits, and recruitment tools (AH&LA, 2006). This offers restaurateurs control over
the online new position applicants, to better hire the right employee and to train them effectively
(AH&LA, 2006). As a result, it was aimed to decrease the turnover rate with the help of labor

35
management/screening tools.
Customer Relationship Management System
This is an information technology management system which allows restaurants to
mainly focus on customer activities for maintaining a profitable customer loyalty in the long run
(Lo, Stalcup and Lee, 2010). With the help of the customer relationship management systems,
contact information (e.g., email, mailing address, cell phone numbers etc.) of the restaurant
customers can be kept and promotional campaigns can be sent to customers by using this contact
information (Collins and Cobanoglu, 2008). Another important feature of this system is that this
system provides a record which contains useful information such as name and previous meal
preferences. As a result, costumers can be greeted by the servers with their name, and help them
with their meal preferences (DeMicco et al., 2015).
Business Intelligence System
This is an integrated module with BOH operation system and provides detailed reports
such as: budgets, profit/loss statements, balance sheets and daily reports (e.g., guest counts, food
cost, and labor cost) that keep managers’ eyes on daily operations (AH&LA, 2006). The main
advantage of the business intelligence system is that it provides the reports in real time.
Therefore, restaurant managers can have quicker and more informed decisions (AH&LA, 2006)
Inventory Management Application
This is an integrated module with accounting system which provides detailed information
on the quantity and price of the products, and has the capability to monitor the replacement
36
period of the inventory (Kasavana, 2011). Additionally, inventory management systems make
the process of the ordering and receiving the inventories easier for the restaurant operators
(Collins and Cobanoglu, 2008). Moreover, with the help of a handheld device which is
connected to inventory management software, taking the inventory and organizing the storage
will be easier and quicker (Collins and Cobanoglu, 2008).
Company Intranet
This is an internal network inside the company which requires Internet to communicate
among the employees of the company (Collins and Cobanoglu, 2008). Intranet is an important
and flexible system for easy “access to operations manuals, discussion forums, company news
items, a corporate documents library, e-mail between sites and many other purposes” (AH&LA,
2006, p. 17). Moreover, intranet provides many benefits such as “rapid transmission of up-to-
date information, improved communication flows, knowledge enhancement, sharing of best
practice in context and encouragement of innovation” (Curry and Stancich, 2000, p. 249).
Kitchen Management Systems
The Kitchen management system is crucial to the success of service in restaurants (Ansel
and Dyer, 1999). The main components, which facilitate the kitchen management system, are:
kitchen display systems, and kitchen printers. Kitchen display systems are made of video
monitors which “can be used to help the kitchen better manage orders and to ensure that orders
are prepared in a timely fashion” (Kimes, 2008, p. 304). Kitchen display systems provide some
additional advantages such as keeping track of the preparation times for menu items, therefore,
allowing the management to measure and compare the performance of the kitchen staff (Collins

37
and Cobanoglu, 2008). In addition, kitchen display systems serve as a communication tool
between the kitchen staff and servers. Kitchen printers serve the same purpose as the kitchen
display systems but they are used instead if there is a need for paper copies for an internal control
system, or if the printed copies are critical for the production operations (Kasavana, 2011). As a
result, with the advanced kitchen technologies, restaurants would have a successful service and
would not have any service interruption (Oronsky and Chathoth, 2007)
Integrated Cost Control System
This is an integrated application on the POS, which uses the current prices of the products
to calculate the cost of menu items (O’Connor, 1996). Based on each recipe’s portion size,
cooking or preparation method, and ingredients, which are identified on the system before hand,
the selling price can be calculated with a viable profit percentage (O’Connor, 1996). Cobanoglu
(2012) stated the benefits of the integrated cost control systems are keeping track of the perpetual
inventory, accessing the cost information, and keeping track of the cost instantly and having the
ability to make right decisions about cost on time.
Cloud-based Application
According to Mell and Grange (2011), cloud computing also known as virtual computing
is defined as “a model for enabling ubiquitous, convenient, on-demand network access to a
shared pool of configurable computing resources (e.g., networks, servers, storage, applications,
and services) that can be rapidly provisioned and released with minimal management effort or
service provider interaction” (p. 2). The cloud represents the delivery of the software via the
Internet (Kasavana, 2011). In other words, the software is distributed to the clients with the help

38
of the Internet. The restaurant industry is switching to cloud-based applications. Some examples
of them include cloud-based POS, integrated video/IP video for security and back office systems.
Integrated video/IP video is used as part of POS in which the transactions are recorded at a unit
level (Collins and Cobanoglu, 2008). If an exception rule is achieved (e.g., a server voids orders
3 or more times per shift), this video is sent to management over the cloud systems for additional
screening to conclude if the employee is stealing money.
Enterprise Management System (EMS)
Enterprise management system (EMS) provides the technology infrastructure for multi-
unit hospitality organizations including restaurant chains (Kasavana, 2011). According to
Norton (1999), EMS is “an integrated solution for planning, executing, and controlling business
processes horizontally across the value chain” (p. 38). Most of the EMS is based on cloud
technology where all information are retained and distributed from central point with the help of
Internet and intranet. EMS accesses the data on a real time from different systems that feed the
central database. Property level data is fed into the central EMS on a real-time basis or on
predetermined intervals for analysis and reporting purposes. For EMS to work, property based
systems must integrate to the central database, allowing the data to be consolidated and stored for
additional analysis.
Enterprise Reporting System (ERS) and Real-Time based Reporting
Enterprise Reporting Systems (ERS) distributes the collected by EMS to the authorized
users after turning it to information (Kasavana, 2011). This information helps the executives to
make timely, well-informed business decisions (Collins and Cobanoglu, 2008). EMS is

39
structured to make different analysis on the data collected from property level systems by sorting
data by regions, price points, and other variables, implementing some business and financial
rules (e.g., occupancy rates, revenue per available seat). Once these analyses are finalized, the
ERS reports this information on a dashboard that is designed to present complex data on a simple
manner. All information contains “drill down” feature that allow the executive to go in deeper
into data form that makes the information. For example, an executive can sort all restaurants
based on annual sales amounts company wide, then drill down to a regional basis to a city, and
then to a store.
Real-time based reporting is used in ERS as a method to distribute the information to
authorized users on a real-time basis (Kasavana, 2008). Real-time based reporting feature is
designed to provide immediate feedback to the management team, enabling them to make faster
decisions to maximize the revenue or minimize the costs.
Disaster Recovery System
Restaurants depend on technology systems on a daily basis for operational and
managerial level (Collins and Cobanoglu, 2008). These systems are called “mission-critical”
systems indicating that restaurants may have a hardship if these systems do not work or function
properly. For this reason, restaurant companies employ disaster recovery systems that will
enable the restaurant operators to restore their systems in the shortest time possible (Cobanoglu,
2007; Kasavana, 2011). Disaster recovery system employs different tools and techniques such as
daily back up and redundant servers.

40
Personal Digital Assistant (PDA) and Intra-day Reporting
PDA provides many useful functions for management. According to Writing (N.A.),
PDA can work as an electronic secretary, an electronic notebook, and a voice recorder.
Moreover, using a PDA in the restaurant industry offers many advantages, such as: “increased
efficiency, speedier service, better usability and ease of use, enhanced reputation/image and
increased accuracy” (Prasad, Scornavacca, and Lehmann, 2005). Additionally, PDA can access
the POS system and some of POS functionalities such as intra-day reporting. This function
offers hour-by-hour reports about the restaurant sales, guest checks, and guest counts. As a
result, restaurant managers can have a better control over their daily tasks and decisions.

41
CHAPTER THREE:
METHODOLOGY
The purpose of this study was to examine the utilization of Front of House and Back of
House technology applications by U.S. restaurants across different types of restaurants along
with their level of IT management style, and the importance of these technology applications to
the restaurants’ operations.
Research Design and Instrument
The survey had four sections. The first section listed Budgets and Business Strategies
where respondents were asked to provide information about their IT budgets and business
strategies. The second section listed Point of Sale Front of House (POS FOH) operation
technology features where respondents were asked to indicate if they utilize these technologies.
If they answered “yes”, then it asked the level of the importance of each item for the restaurants.
All items concerning the importance of POS FOH operation technology features were rated on a
5-point Likert-scale ranging from 1 = Not important at all to 5 = Extremely important. In
addition to POS FOH operation technology features in the first section, levels of agreement with
perspectives on mobile POS were asked to respondents (1 = Strongly disagree, 5 = Strongly
agree, and 6 = Not sure1). The third section of the survey included Point of Sale Systems Back
of House (POS BOH) tools features and asked the respondents to indicate if they utilize these
1 This option was given to respondents when they could not evaluate the item with certainty and this number was
not used in the mean calculation.

42
technologies. If they answered “yes”, then it asked the level of each items importance for the
restaurants. All items concerning the importance of POS BOH operation tools features were
rated on a 5-point Likert-scale ranging from 1 = Not important at all to 5 = Extremely important.
Finally, the fourth section asked for levels of agreement on Payment Card Industry Data Security
Standard (PCI DSS) compliance in restaurants (1 = Strongly disagree, 5 = Strongly agree, and 6
= Don’t know2). In addition to these four sections, there were also questions about respondent
and company information. All of the section questions about the restaurant technology were
obtained through extensive review of the literature.
Sample
The sample consisted of 500 randomly selected restaurant technology managers who are
current subscribers of Hospitality Technology Magazine as of January 2013. This study utilized
secondary data which was provided by Cobanoglu. Secondary data is useful when it is difficult
to find valid and reliable primary data (Cowton, 1998). “It is suggested that secondary data not
only offer advantages in terms of cost and effort, as conventionally described in research
methods books, but also that in certain cases their use may overcome some of the difficulties that
particularly afflict business ethics researchers in the gathering of primary data” (Cowton, 1998,
p. 423). After eliminating some of the suspected and incomplete surveys, 136 survey data were
processed. These sample groups represented 67,299 restaurant units. Of this number, 57,208
were quick service restaurants, 8,457 were casual/family restaurants, 109 were fine-dining
restaurants, and 1,525 were other types of restaurant. All of the sample members had an email
address, therefore only an online version of the survey was conducted.
2 This option was given to respondents when they could not evaluate the item with certainty and this number was
not used in the mean calculation.

43
Sample size is a hotly debated topic in the literature. Comrey and Lee (1992) suggest
that there should be at least 300 participants and each variable in the factor analysis should have
5 to 10 observations. However, Tabachnick and Fidell (2013) stress that 5 observations for each
item would be enough in most cases. Adding to debate, Gorsuch (1983) and Hatcher (1994)
state that a sample that consists minimum, 100 responses would be adequate for an exploratory
factor analysis. The sample size in this study is greater than 100 and there was a 5 to 1 ratio for
each variable for the POS FOH, POS BOH, mobile POS perspective and PCI DSS compliance.
Consequently, according to the above sample size evaluation, the sample group that is used in
this study is acceptable.
Limitations and Assumption
The limitations of this study are the sampling procedure and sample size. The sample
consisted of the IT managers of restaurants who subscribe to Hospitality Technology Magazine;
therefore, the results may not able to be generalized beyond this population. Additionally, it was
assumed that the respondents had the responsibility for their restaurant companies, including
multi-units, and their answers represented the technology outlook of the entire enterprise.
Whenever there is less than 100 percent participation in a survey, there is a question of
non-response bias: that is, the likelihood of data being changed if all members of the population
would have responded to the survey. We have conducted a non-response analysis using wave
analysis (early versus later respondents) to answer (1) whether non-respondents and respondents
differed significantly, (2) whether equivalent data from those who did not respond would have
significantly altered findings. Rylander, Propst, and McMurtry (1995) suggested that late
respondents and non-respondents were alike and wave analysis and respondent/non-respondent

44
comparisons yielded the same results. Therefore, we conducted an independent samples t-test on
the means of POS BOH and POS FOH technology features’ importance to see if early
respondents’ responses were different from late respondents’. Analysis indicated that there was
no significant difference in any of the POS BOH and POS FOH technology features’ importance,
concluding that this survey did not suffer non-response bias and therefore, was representative of
the population that is Hospitality Technology Magazine subscribers who are in charge of
information technology in restaurants.
Construct Validity
Construct validity is a very critical task and one of the most difficult types of validity to
establish (Churchill, 1979). Therefore, the instrument in this study was sent to a panel of
restaurant technology experts to make sure the questions in the instruments were valid. Based on
their suggestions some minor adjustments have been made to the instrument to increase construct
validity.
Reliability
“Reliability concerns the extent to which measurements are repeatable…”(Nunnally and
Durham, 1975, p. 10). Cronbach’s coefficient alpha is the most known and commonly used test
for reliability issues (Pallant, 2013). Grau (2007) cited from Cronbach (1951) that “Cronbach’s
alpha is a coefficient that describes how well a group of items focuses on a single idea or
construct” (p. 3104). The recommendation of Nunnally (1978) for Cronbach’s alpha is a
minimum of .70. DeVellis (2012) supports that Cronbach’s alpha values between .60 and .65,
.65 and .70, .70 and .80, and .80 and .90 are undesirable, acceptable, respectable and very good

45
respectively. Reliability scores in this study were: .76, .88, .71, and .76 for POS FOH, POS
BOH, Mobile POS Perspective and PCI DSS compliance, respectively. According to DeVellis
(2012) and Nunnally (1978), Cronbach’s alpha scores of the POS FOH, Mobile POS Perspective
and PCI DSS Compliance sections do fit the parameters of an acceptable and/or respectable
range for this study. Moreover, Cronbach’s alpha score of POS BOS is “very good” (DeVellis,
2012).
Data Analysis
The data analysis was organized into 3 parts (descriptive, factor analysis and independent
samples t-test). The data analyzed with The Statistical Packages for Social Sciences (SPSS,
version 21). In the descriptive part of the data analysis, the information about respondents’ job
functions, company characteristics and companies’ IT perspectives are evaluated.
In the second part, factor analysis was used. According to Yong and Pearce (2013), “the
broad purpose of factor analysis is to summarize data so that relationships and patterns can be
easily interpreted and understood” (p. 79). In this study, 20 variables were used to test the POS
FOH systems, 19 variables used to test the POS FOH systems, 13 variables used to test the
Mobile POS features and 11 variables used to test the PCI DSS Compliance. Since the factor
analysis is a data reduction technique, factor analysis is used to create correlated variable
composites and to reduce variables for better interpretation.
Exploratory and confirmatory factor analysis are the two approaches to factor analysis
(Pallant, 2013; Thompson, 2004; Yong and Pearce, 2013). Most of the social science researchers
have reported their studies with exploratory and/or confirmatory factor analysis (Osborne,
Costello, and Kellow, 2008). Costello and Osborne (2005) reported that exploratory factor

46
analysis had been used in more than 1700 studies during a two-year period covered by the
American Psychological Association (PSYCINFO) database.
Confirmatory factor analysis is used for “confirming previously defined hypotheses
concerning the relationships between variables” (Walker and Maddan, 2008, p. 326), whereas
exploratory factor analysis is used for exploring the number of components affecting variables
and to test the variables which go together (Child, 2006). Since this study was not confirming
previously defined hypotheses, exploratory factor analysis was used.
According to Costello and Osborne (2005), other than acceptable sample size, there are
three critical issues (extraction method, rotation method, and scores of factor loadings) which
researchers have to ensure to have a better result from exploratory factor analysis. In addition to
Costello and Osborne, Walker and Maddan (2008) suggested that before starting the factor
analysis, it is important to have a univariate analysis for a normal distribution, and also to check
the two measures of the univariate analysis: skewness and kurtosis. Furthermore, it is necessary
to test reliability issues before factor analysis (Grau, 2007; Yong and Pearce, 2013).
Principal components, principal factors, image factoring, maximum likelihood factoring,
alpha factoring, unweighted least squares, and generalized least squares are the extraction
methods; however, principal components analysis is the one method generally used by most
researchers (Pallant, 2013). Principal components analysis is an effective technique to decrease
large items into small components or groups without losing a lot of data (Matsunaga, 2010,
Tabachnick and Fidell, 2013). The aim of principal component analysis fit the purpose of this
study; therefore it was selected as the extraction method.
Factor analysis requires a rotation method for better interpretation. Yong and Pearce
(2013) stated that factors need to be rotated for better understanding since it is difficult to

47
interpret them without rotation. Two main techniques for rotation are orthogonal (varimax,
quartimax and equamax) and oblique (direct oblimin and promax) (Pallant, 2013). The
orthogonal technique presumes that factors are uncorrelated, however; the assumption in the
oblique methods is that factors are correlated (Brown, 2009). Varimax is the most popular and
commonly used orthogonal technique for rotation (Costello and Osborne, 2005; Pallant, 2013).
Yong and Pearce (2013) state “Varimax minimizes the number of variables that have high
loadings on each factor and works to make small loadings even smaller” (p. 84). As a result,
since the assumptions for factors are correlated, and it is required to minimize the number of
variables that have high loadings on each factor, the Varimax technique was used.
According to Matsunaga (2010), the cutoff point of factor loading is one of the common
approaches used in deciding the scores of factor loading of items: that is, whether to keep items
in the factor loading table or not. Although Costello and Osborne (2005) and Pallant (2013)
have suggested .30 to be the set point for factor loading, Matsunaga (2010) reported that the
cutoff point is .40 or higher or for liberal estimates and .60 is the minimum cutoff limit for more
conservative researchers (2010). Therefore, items with factor loadings of .40 or higher were
preferred to cluster variables together. The factors with eigenvalues greater than one were
considered as significant based on the recommendation of Yong and Pearce (2013).
In addition to above, skewed and kurtosis variables should also be investigated very
carefully, since normal distribution is crucial for the factor analysis (Walker and Maddan, 2008).
“Skewness is a measure to what extent a distribution of values deviates from symmetry around
the mean, whereas kurtosis is a measure of the peakedness or the flatness of a distribution”
(Tijhuis, Brattli, and Sæther, 2002, p. 71). The range for skewness and kurtosis is a controversy
in the literature reviewed. George and Mallery (1999) indicate that a value range between +2 to -

48
2 for skewness and kurtosis is adequate for a normal univariate distribution. However,
Tabachnick and Fidell (2013) stress that the acceptable values for skewness and kurtosis should
be between +1.5 and -1.5. Moreover, values exceeding 3 and 10 for skewness and kurtosis
respectively should be considered to be a problem for a normal univariate distribution (Kline,
2005). In light of the literature reviewed, skewness and kurtosis of each item used in the factor
analyses was checked and the variables that have values of skewness and kurtosis greater than
three were removed from the model.
The third and final stage of the data analysis included testing hypotheses based on factor
analysis outcomes by using an independent samples t-test. The main purpose of using an
independent samples t-test is to determine whether position, types of restaurant, business
leadership and technology leadership differ on the factor attributes.

49
CHAPTER FOUR:
FINDINGS
The purpose of this study was to examine the utilization of Front of House and Back of
House technology applications by U.S. restaurants across different types of restaurants and along
with level of IT management style, and the importance of these technology applications to the
restaurants’ operations. In this section, descriptive statistics, factor analysis results, and
independent samples t-test results are reported in order to the answer research questions and test
the hypotheses. Sample size of this study was 136 and these sample groups represented 67,299
restaurant units.
Company Characteristics, IT Budgets and Strategies
In this section, descriptive statistics are demonstrated related to: job function of the
respondents, company description, represented number of restaurants and types of restaurants,
business metrics comparison, organization preferences from business leadership and technology
leadership, IT budget projections of companies as sales percentages, corporate annual IT budget,
comparison between capital expenditures versus operating expenditures, reference to IT strategic
planning in the mission statement of company, level of IT decision making at the company, IT
steering committee and POS system replacement.

50
Table 4: Job Function of the Respondents
Job Function Valid Percent
Information systems/Technology management 39.0
Owner/Operator 21.1
Corporate management 18.7
Food/Beverage management 4.9
Operations/Property management 4.1
Financial management 3.3
Sales/Marketing management 2.4 Purchasing management 1.6
Other (including Business developer, IS developer, General manager) 4.9
Total 100.0
The highest proportion (39%) of the respondents hold the “Information
systems/Technology management” position in their companies. The second and the third highest
proportions of the respondents hold “Owner/Operator” (21.1%) and “Corporate Management”
(18.7%) positions (See Table 4).
Table 5: Company Description
Company Description Valid Percent*
National restaurant chain 30.9
Regional restaurant chain 20.6
Global restaurant chain 16.2
Independent restaurant management company without franchised products 14.7
Franchisor 14.0
Independent restaurant management company with franchised products 7.4
Other (including cinema eatery-multi unit, independent single unit operator,
sports & entertainment retail / F&B/catering and privately owned 7.4
*Percentages don't add up to 100% due to multiple selections allowed.
More than 60% of the respondents work for chain restaurants, a category further
subdivided into: “National restaurant chain” (30.9%), “Regional restaurant chain” (20.6%) and
“Global restaurant chain” (16.2%). Almost 30% of the respondents work for independent
restaurants, a category further subdivided into: Independent restaurant management company
without franchised products” (14.7%), “Independent restaurant management company with

51
franchised products” (7.4%) and other independent types of restaurants (7.4%). Moreover,
14.0% of the respondents work for “Franchisors” (See Table 5).
Table 6: Type of the Restaurant
Type of Restaurant Number Valid Percent
Quick Service Restaurant (including fast casual) 57208 85.0
Casual/Family Restaurant (full service) 8457 12.6
Fine Dining Restaurant 109 0.2
Other 1525 2.3
Total 67299 100.0
As indicated in Table 6, in this study, 67,299 individual restaurants were represented by
the respondents, including: “Quick service restaurants” (57,208), “Casual/family restaurants”
(8,457), “Fine dining restaurants” (209) and other types of restaurants (1,525).
Table 7: Business Metrics Comparison Current Year and Previous Year
Business Performance: Decreased Remained Flat Increased Total %
Gross revenue (company-wide) - 42.6 57.4 100.0
Average guest check (per customer) 2.2 41.3 56.5 100.0
Guest counts (guest volume) 9.3 55.8 34.9 100.0 Same store sales growth (per location) - 46.8 53.2 100.0
Net profitability (company-wide) 4.3 51.1 44.7 100.0
The main drivers of restaurant business performance (“Gross revenue”, “Average guest
check”, “Guest counts”, “Same store sales growth” and “Net profitability”) have been examined
(See Table 7). The majority of the restaurants have reported that more than 90% of the business
performance was either flat (42.6%) or better (57.4%) compared to the previous year. More than
50% of the attendees reported that “Gross revenue”, “Average guest check”, and “Same store
sales growth” increased but “Average guest check” and “Net profitability” remained flat. Some

52
respondents (9.3%) have seen a decrease on “Guest counts” compared to the previous years (See
Table 7).
Table 8: Organization Preferences: Business Leadership versus Technology Leadership
Organization Preferences from A business leadership A technology leadership
Valid Percent Valid Percent
An innovator/leader 53.7 31.5
A close follower 25.9 38.9
A distant follower 9.3 22.2
A reactor to industry conditions and competitors moves 11.1 7.4
Total 100.0 100.0
As seen in the Table 8, 53.7% of the restaurants companies reported that they preferred to
be “An innovator in business leadership”; however, only 31.5% of them preferred to be “An
innovator in technology leadership”. While 25.9% of the companies preferred to be “A close
follower in business leadership”, 38.9% of the companies preferred to be to be “A close follower
in technology leadership”. Moreover, 11.1% of the companies preferred to be “A reactor to
industry conditions and competitor moves in business leadership”, compared to 7.4% in
technology leadership (See Table 8).
Table 9: IT Budged Projection for Today and in Three Years as a Percentage of Sales
IT budget For 2013 Projection in three years
Less than 1% 31.5 16.7
1% 25.9 16.7 2% 13.0 25.9
3% 7.4 13.0
4% 3.7 1.9
5% 11.1 11.1
6% - 3.7
7% - 1.9
8% - 1.9
I don’t know 7.4 7.4
Total 100.0 100.0
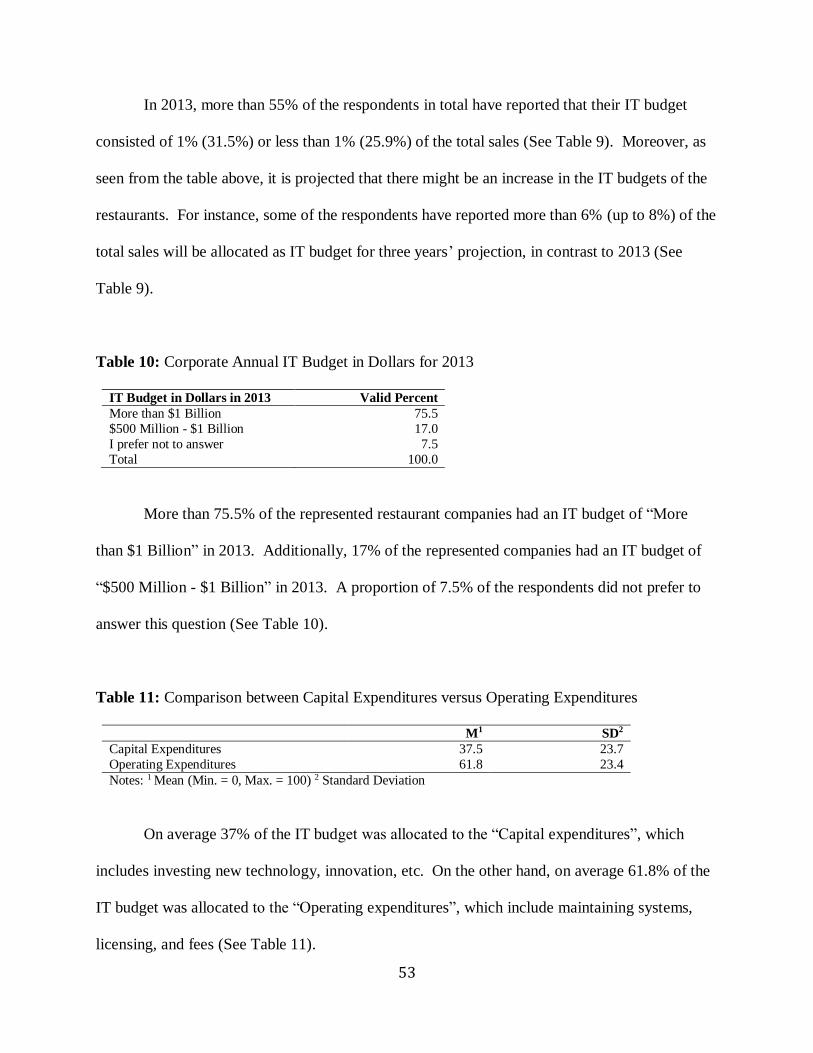
53
In 2013, more than 55% of the respondents in total have reported that their IT budget
consisted of 1% (31.5%) or less than 1% (25.9%) of the total sales (See Table 9). Moreover, as
seen from the table above, it is projected that there might be an increase in the IT budgets of the
restaurants. For instance, some of the respondents have reported more than 6% (up to 8%) of the
total sales will be allocated as IT budget for three years’ projection, in contrast to 2013 (See
Table 9).
Table 10: Corporate Annual IT Budget in Dollars for 2013
IT Budget in Dollars in 2013 Valid Percent
More than $1 Billion 75.5
$500 Million - $1 Billion 17.0
I prefer not to answer 7.5
Total 100.0
More than 75.5% of the represented restaurant companies had an IT budget of “More
than $1 Billion” in 2013. Additionally, 17% of the represented companies had an IT budget of
“$500 Million - $1 Billion” in 2013. A proportion of 7.5% of the respondents did not prefer to
answer this question (See Table 10).
Table 11: Comparison between Capital Expenditures versus Operating Expenditures
M1 SD2
Capital Expenditures 37.5 23.7
Operating Expenditures 61.8 23.4
Notes: 1 Mean (Min. = 0, Max. = 100) 2 Standard Deviation
On average 37% of the IT budget was allocated to the “Capital expenditures”, which
includes investing new technology, innovation, etc. On the other hand, on average 61.8% of the
IT budget was allocated to the “Operating expenditures”, which include maintaining systems,
licensing, and fees (See Table 11).

54
Table 12: Reference to IT Strategic Planning in the Mission Statement of Company
Reference to IT strategic planning in the mission statement of company Valid Percent
Yes 17.0
No 71.7
Don't have a mission statement 9.4
Not sure 1.9
Total 100.0
The majority of the respondents (71.7%) declared that the mission statement of the
company does not point out IT strategic planning (See Table 12). While 17.0% of the
respondents stated that IT strategic planning is part of the mission statement of the companies,
entirely 11.3% of the respondents state that they are not sure (1.9%) or that their companies do
not have a mission statement (9.4%) (See Table 12).
Table 13: Level of IT Decision Making at the Company
IT decisions are made predominately at the: Valid Percent
Corporate level 92.2
Unit level 5.9
Other (including owner/operator) 2.0 Total 100.0
Most of the restaurants (92.2%) predominantly make their IT decisions on “Corporate
level”. Only 5.9% of the restaurants companies make their IT decisions on the “Unit level” and
2.0% of the respondents state that IT decisions are predominately made by the “Owner/operator”
(See Table 13).
Table 14: IT Steering Committee
IT steering committee Valid Percent
Yes 41.5
No 54.7
Not sure 3.8
Total 100.0

55
While 41.5% of the companies have an IT steering committee, 54.7% of the companies
do not, and 3.8% of the respondents are not sure whether their companies have an IT steering
committee or not (See Table 14).
Table 15: POS System Replacement
Replacement your company's current POS system Valid Percent
Within a year 12.5
1-2 years 14.6
3-4 years 39.6
5-6 years 12.5
7-8 years 10.4
More than 10 years 10.4
Total 100.0
More than 65% of the companies replaced their POS System within the last four years or
less than four years (12.5% within a year, 14,6% within 1-2 years, and 39.6% within 3-4 years).
However, more than 30% of the respondents state that they replaced their POS system 5 years
and/or more than 5 years ago (12.5% 5-6 years ago, 10.4% 7-8 years ago and 10.4% more than
10 years ago) (See Table 15).
Research Questions
In this section, research questions that proposed for this study are shown and further
explained.
1. “What are the main drivers for IT investments in restaurants?”
To be able to answer the first research question, respondents were asked, “Please indicate
the approximate distribution of IT budget or spending at your company” and “Please indicate the

56
approximate distribution of Technology area budget allocation (not including personnel) in
percentages at your company”.
Table 16: IT Budget Distribution at the Restaurant Companies
M1 SD2
Hardware 20.6 16.0
Software 19.2 16.0
Internal personnel 17.5 16.7
External service providers 13.7 17.0
Networks & Telecom 9.4 7.6
Facilities 4.1 7.6
Other 3.2 6.8
Notes: 1 Mean (Min. = 0, Max. = 100) 2 Standard Deviation
As seen in the Table 16, companies allocated on average 20.6% for “Hardware”, 19.2%
for “Software”, 17.5% for “Internal personnel”, 13.7% for “External service providers”, 9.4%
“Networks and telecom”, 4.1% for “Facilities” and 3.2% for other spending of their IT budget.
Table 17: Technology Area IT Budget Distribution
M1 SD2
POS solutions 30.8 21.0
Back office solutions 22.0 15.8
Networking 11.5 10.7
Security solutions 9.3 14.3
Mobile/Web technologies 9.0 9.4
Kitchen technology 6.3 9.4
Notes: 1 Mean (Min. = 0, Max. = 100) 2 Standard Deviation
For the technology area IT budget distribution, “POS solutions” (30.8%) and “Back
office solutions” (22.0%) received the bulk of the funds, which together accounted for more than
52% of the overall technology area IT budget (See Table 17). Other than POS solutions and
Back office solutions, companies spent on average 11.5% for “Networking”, 9.3% for “Security

57
solutions”, 9.0% for “Mobile/Web technologies” and 6.3% for “Kitchen technology” of their
technology area IT budget (See Table 17).
2. “What are the main drivers for restaurants’ IT efforts?”
Table 18: Main Drivers the Company’s IT Efforts
Main Drivers for the Company's IT Efforts Valid Percent*
Business efficiency 30.9
Enhanced guest service 27.2
Employee productivity 25.7
Security/compliance (PCI and payments) 25.0
Cost-saving measures 22.8
Revenue-generating opportunities 14.7 Increasing guest loyalty 14.7
Preserve existing technology investment(s) 12.5
Competitive pressure 6.6
Social responsibility (e.g., Green initiatives) 4.4
Other (including business intelligence and future focus ) 1.5
*Percentages don't add up to 100% due to multiple selections allowed.
According to the Table 18, “Business efficiency” (30.9%), “Enhanced guest service”
(27.2%), “Employee productivity” (25.7%), “Security/Compliance” (25.0%) and “Cost savings
measures” (22.8%) are the top five main drivers for the company’s IT efforts. The other main
drivers for the company’s IT efforts are “Revenue-generating opportunities” (14.7), “Increasing
guest loyalty” (14.7%), “Preserve existing technology investment” (12.5%), “Competitive
pressure” (6.6%) “Social responsibility” (4.4%) and other main drivers including: business
intelligence and future focus (1.5%) (See Table 18).

58
3. “What is the top challenge facing restaurant’ technology departments?”
Table 19: Top Challenges for the Restaurant Technology Departments
Top challenges for the technology departments Valid Percent
Insufficient IT budgets to keep pace with needed investments 33.3
The technology itself is insufficient to meet our needs 19.6
Guests expect greater technology than we can keep pace with 15.7
We lack IT talent in our internal team 13.7
Our company philosophy does not embrace technology innovation 9.8
Other (including growth in new stores, team bandwidth and difficulties in training) 7.8
Total 100.0
As can be seen in the Table 19, 33.3% of the respondents pointed out that “Insufficient IT
budget to keep pace with needed investment” is the top challenge of the technology departments.
The other main challenges for the restaurant technology departments are “The technology itself
is insufficient to meet our needs” (19.6%), “Guests expect greater technology than we can keep
pace with” (15.7%) and “We lack IT talent in our internal team” (13.7%).
4. “What are the point of sale (POS) Front of House (FOH) technology features used in
restaurants?”
5. “What is the importance of POS FOH technology features to the restaurants’
operations by IT managers?”
Addressing the questions above, respondents were asked: “For each of the POS FOH
features/devices, to indicate if their organization is currently using the technology/solution, or if
it has plans to add the technology in the coming 12 months. In addition, they were asked to rate
the importance of each technology to their organization and the overall restaurant industry.”

59
Table 20: POS FOH Technology Software/Hardware Utilization and Their Importance
POS FOH technology software/hardware utilized Current usage Importance
Yes No Plan to add Total % M1 SD2
POS hardware 95.9 4.1 100.0 4.4 0.9
Touch screen 93.9 2.0 4.1 100.0 4.4 0.8
POS software 93.8 6.3 100.0 4.6 0.8
Gift card integration 87.8 6.1 6.1 100.0 4.4 0.8
Integrated credit card swipe into POS 81.6 16.3 2.0 100.0 4.3 1.1
Take-out/Delivery system 44.4 35.6 20.0 100.0 3.1 1.5
Energy efficient POS 32.7 59.2 8.2 100.0 2.8 1.0 POS Integration into online ordering 32.7 38.8 28.6 100.0 3.6 1.3
Menu labeling/Nutritional information 32.7 49.0 18.4 100.0 3.2 1.1
Wireless credit card authorization 30.6 53.1 16.3 100.0 3.0 1.4
Digital signage 30.6 49.0 20.4 100.0 3.1 1.3
Table management 26.5 67.3 6.1 100.0 2.3 1.4
Reservations 20.4 73.5 6.1 100.0 2.1 1.5
Biometrics fingerprint reader 16.7 68.8 14.6 100.0 2.4 1.4
Barcode scanners 16.3 59.2 24.5 100.0 2.7 1.2
Social media activity integrated into POS and/or
CRM platform 12.8 57.4 29.8 100.0 3.2 1.1
Tableside payment device 10.6 74.5 14.9 100.0 2.3 1.5 Tableside ordering device (tablet, other hardware) 8.5 80.9 10.6 100.0 2.2 1.4
Near field communications (NFC) capability 6.1 81.6 12.2 100.0 2.5 1.3
Bill pay via customers’ mobile phone 2.1 60.4 37.5 100.0 2.7 1.3
Notes: 1 Mean (1 = Not important at all, 5 = Extremely important) 2 Standard Deviation
Based on the Table 20, “POS hardware” (95.9%), “Touch screen” (93.9%), “POS
software” (93.8%), “Gift card integration” (87.7%), and “Integrated credit card swipe into POS”
(81.6%) are heavily used in the industry. “Bill pay via customers’ mobile phone” (37.5%),
“Social media activity integrated into POS and/or CRM platform” (29.8%), “POS Integration
into online ordering” (28.6%), “Barcode scanners” (24.5%), “Digital signage” (20.4%), “Take-
out/Delivery system” (20.0%) are the some of the POS FOH features/devices that companies
plan to add in the future. In the restaurant industry, the five most important POS FOH
features/devices are “POS hardware”, “Touch screen”, “POS software”, “Gift card integration”,
and “Integrated credit card swipe into POS” (See Table 20).

60
6. “What are the point of sale (POS) Back of House (BOH) technology features used in
restaurants?”
7. “What is the importance of POS BOH technology features to the restaurants’
operations by IT managers?”
To be able to answer questions above, respondents were asked: “For each of the POS
BOH features/devices, to indicate if their organization is currently using the technology/solution,
or if it has plans to add the technology in the coming 12 months. In addition, they were asked to
rate the importance of each technology to their organization and the overall restaurant industry.”
Table 21: POS BOH Technology Software/Hardware Utilization and Their Importance
POS BOH technology software/hardware utilized Current usage Importance
Yes No Plan to add Total % M1 SD2
Accounting/Financial software 93.3 6.7 0.0 100.0 4.4 1.0
Enterprise reporting 86.7 11.1 2.2 100.0 4.3 1.0
Inventory management software 84.1 13.6 2.3 100.0 4.3 1.1
Kitchen printers 75.6 24.4 0.0 100.0 3.9 1.4
Company intranet 71.1 20.0 8.9 100.0 3.7 1.1
Labor management 68.9 20.0 11.1 100.0 4.2 1.0 Intra-day reporting 66.7 28.9 4.4 100.0 3.8 1.2
Disaster recovery plan for technology systems 57.8 26.7 15.6 100.0 4.1 1.1
Integrated video / IP video for security 55.6 31.1 13.3 100.0 3.5 1.1
Cloud-based applications 47.7 36.4 15.9 100.0 3.4 1.3
Kitchen displays 46.7 37.8 15.6 100.0 3.6 1.2
Integrated cost control software 46.7 46.7 6.7 100.0 3.6 1.2
Business intelligence system 44.4 28.9 26.7 100.0 3.9 1.1
Labor screening and recruitment tools 42.2 40.0 17.8 100.0 3.6 1.3
Real-time, web-based reporting 42.2 22.2 35.6 100.0 3.8 1.2
Kitchen management 40.0 51.1 8.9 100.0 3.5 1.1
Customer relationship management system 33.3 48.9 17.8 100.0 3.4 1.1 Mobile device for manager use 28.9 51.1 20.0 100.0 3.2 1.0
Notes: 1 Mean (1 = Not important at all, 5 = Extremely important) 2 Standard Deviation
As seen in the Table 21, “Accounting/Financial software” (93.3%), “Enterprise
reporting” (86.7%), and “Inventory management software” (84.1%) are the heavily used POS
BOH Technology Software/Hardware in the restaurant industry. Moreover, “Kitchen printers”

61
(75.6%), “Company intranet” (71.1%), “Labor management” (68.9%), “Intra-day reporting”
(66.7%), “Disaster recovery plan for technology systems” (57.8%), and “Integrated video / IP
video for security” (55.6%) are the mostly used POS BOH Technology Software/Hardware in
the restaurant industry. “Real-time, web-based reporting” (35.6%), “Business intelligence
system” (26.7%) and “Mobile device for manager use” (20.0%) are the some of the POS BOH
features/devices that companies plan to add in the future. The five most important POS BOH
features/devices are “Accounting/Financial software”, “Enterprise reporting”, “Inventory
management software”, “Kitchen printers” and “Company intranet” (See Table 21).
8. “What are the perceptions of restaurant IT managers on mobile POS systems?”
Table 22: Mobile POS Perspectives
M1 SD2
Mobile POS helps serve guests more quickly 4.0 1.0
Mobile POS terminals increase guest satisfaction 3.9 1.1
Mobile credit card terminals reduce credit card skimming 3.9 1.3
Mobile POS devices are easy to break 3.7 1.1
Mobile POS devices are too expensive 3.7 1.1
Mobile POS terminals "wow" guests 3.5 1.1 Mobile POS devices are easy to lose 3.3 1.0
My company has a website that is optimized for mobile devices (i.e. iPhone, Android) 3.2 1.4
My company does not see the value in investing in wireless handheld POS terminals 2.8 1.3
Mobile POS is not a secure method of payment 2.8 1.2
My company has a mobile app 2.6 1.4
Notes: 1 Mean (1 = Strongly Disagree, 5 = Strongly Agree) 2 Standard Deviation
M > 3.5 is considered as “Agree”
The survey respondents mainly agreed on the following mobile POS perceptions “Mobile
POS helps serve guests more quickly”, “Mobile POS terminals increase guest satisfaction”,
“Mobile credit card terminals reduce credit card skimming”, “Mobile POS devices are easy to
break” and “Mobile POS devices are too expensive” (See Table 22).

62
9. “What are the perceptions of restaurant IT managers on Payment Card Industry
Data Security Standard (PCI DSS) practices in restaurants?”
Table 23: PCI Compliance Trends and Challenges
M1 SD2
Card brands should take greater responsibility in ensuring payment technology is secure 4.6 0.9
Merchants have an unreasonable burden associated with protecting cardholders 4.4 1.2
Our organization plans to upgrade devices and procedures by the April 2015 EMV
deadline for merchant compliance 4.2 1.1
PCI Standards are too complex 3.9 1.1
Our franchisees lack commitment to compliance efforts 3.6 1.6
We are fully aware of changes necessary to implement EMV technology 3.5 1.3 We have deployed the PCI council’s best practices for mobile payments 3.5 1.4
We lack vendor support for PCI compliance efforts 3.0 1.4
We lack the budget necessary to implement payment security technologies 2.9 1.3
We lack knowledgeable staff at a senior-level to oversee payment security measures 2.8 1.3
We have limited commitment from top management for payment security 2.4 1.3
Notes: 1 Mean (1 = Strongly Disagree, 5 = Strongly Agree) 2 Standard Deviation
M > 3.5 is considered as “Agree”
The survey respondents mainly agreed on the following PCI compliance and challenges,
“Card brands should take greater responsibility in ensuring payment technology is secure”,
“Merchants have an unreasonable burden associated with protecting cardholders”, “Our
organization plans to upgrade devices and procedures by the April 2015 EMV deadline for
merchant compliance”, “PCI Standards are too complex” and “Our franchisees lack commitment
to compliance efforts” (See Table 23).

63
10. “To what extent are U.S. restaurants compliant with PCI DSS requirements?”
Table 24: Payment Card Industry Data Security Standards
Yes No Don't
know Total
Install and maintain a firewall configuration to protect
cardholder data 95.3% 2.3% 2.3% 100.0%
Use and regularly update anti-virus software or programs 95.3% 2.3% 2.3% 100.0%
Restrict access to cardholder data by business need-to-
know 93.0% 2.3% 4.7% 100.0%
Assign a unique ID to each person with computer access 93.0% 4.7% 2.3% 100.0% Protect stored cardholder data 90.7% 4.7% 4.7% 100.0%
Encrypt transmission of cardholder data across open,
public networks 90.7% 2.3% 7.0% 100.0%
Track and monitor all access to network resources and
cardholder data 86.0% 11.6% 2.3% 100.0%
Regularly test security systems and processes 85.7% 9.5% 4.8% 100.0%
Develop and maintain secure systems and applications 83.7% 9.3% 7.0% 100.0%
Maintain a policy that addresses information security for
all personnel 81.4% 11.6% 7.0% 100.0%
Do not use vendor-supplied defaults for system
passwords and other security parameters 76.7% 20.9% 2.3% 100.0%
Use of point-to-point encryption (P2PE) 51.2% 25.6% 23.3% 100.0%
Outsource PCI compliance efforts 46.5% 44.2% 9.3% 100.0%
Our organization has invested in PCI compliance
insurance 38.1% 45.2% 16.7% 100.0%
Use of tokenization at the card swipe 32.6% 46.5% 20.9% 100.0%
PCI data security standards are used by the restaurant companies in the range of 81.4% to
95.3%, except for the “Use original passwords (non-vendor-supplied defaults) for system
passwords and other security parameters” which 76.7% of the respondents answered “yes” and
20.9% of the respondents answered “no”. Additionally, practices such as “Use of point-to-point
encryption (P2PE)”, “Outsource PCI compliance efforts”, “Our organization has invested in PCI
compliance insurance” and “Use of tokenization at the card swipe” were not preferred by
majority of the respondents (See Table 24).

64
11. “What is the level of PCI DSS compliance in restaurants?”
Table 25: Level of Payment Card Industry Compliance
M1 SD2
Level of PCI compliance 87.0 15.7
Notes: 1 Mean (Min. = 0, Max. = 100) 2 Standard Deviation
On average, the level of payment card industry compliance is 87% in the represented
restaurant companies (See Table 25).
Exploratory Factor Analyses
In this study, exploratory factor analyses (EFA) were utilized to identify the proposed
factors of Point of Sales Front of House (POS FOH) operation technology features, Point of Sale
Systems Back of House (POS BOH) tools features, mobile POS perspectives, and Payment Card
Industry Data Security Standard (PCI DSS) compliance statements.
From literature reviewed and the advice of restaurant technology experts, 20 significant
software/hardware items were captured for POS FOH operations, whereas 19 significant
software/hardware items were captured for POS BOH operation. The respondents were asked to
indicate if they utilize POS FOH and POS BOH technology. Besides the “yes” and “no” option
to this question, the option “have plan to add” was also given to respondents. If they answered,
affirmatively, then it asked the level of each item’s importance for the restaurants. All items the
concerning importance of POS FOH and POS BOH operation technology features were rated on
a 5-point Likert-scale ranging from 1 = Not important at all to 5 = Extremely important.

65
For the mobile POS perspectives and PCI DSS, 13 and 11 items, respectively, captured
and asked the level of each item’s importance for the restaurants on a 5-point Likert-scale
ranging from 1 = Strongly disagree to 5 = Strongly agree.
Before starting the EFA, due Walker and Maddan’s (2008) suggestion, two measures of
univariate analysis (skewness and kurtosis) of each item in each section were checked as a first
step. Although, the majority of items in each section had a skewness and kurtosis value between
+1.5 and -1.5, there were some items that had a skewness and kurtosis value greater than 3.
According to Kline (2005), the values exceeding 3 were considered to be a problem for a normal
univariate distribution. Therefore, the items which had a skewness and/or kurtosis value greater
than 3 were removed from the model.
In the POS FOH section, since the kurtosis of the survey items: “POS Hardware”
(3.088) and “POS Software” (7.431) were greater than 3; they were removed from
further analysis.
In the POS BOH section, since the kurtosis of the survey item: “Enterprise
Reporting” (3.342) was greater than 3; it was removed from the further analysis.
In the PCI DSS section, since the kurtosis of the survey items: “Card brands should
take greater responsibility in ensuring payment technology is secure” (9.058) and
“Merchants have an unreasonable burden associated with protecting cardholders”
(3.189) were greater than 3; they were removed from the further analysis.
As a second step, the reliability scores of each section were calculated, and are
demonstrated in the Table 26. According to DeVellis (2012) and Nunnally (1978), Cronbach’s
Alpha scores of the POS FOH, Mobile POS Perspective and PCI DSS Compliance sections are

66
within parameters considered to be acceptable and/or respectable for this study. Moreover, a
Cronbach’s alpha score of POS BOS is considered “very good” (DeVellis, 2012).
Table 26: Reliability Scores
Survey Sections Cronbach’s Alpha
POS FOH 0.76
POS BOH 0.88
Mobile POS Perspective 0.71
PCI DSS Compliance 0.76
After removing the items that did not distribute normally and/or did not have acceptable
reliability scores, as the following step EFA with principal components analysis and Varimax
rotation was conducted on the each section’s remaining items. After exploratory factor analysis
was utilized, according to suggestion of Yong and Pearce (2013), table of correlation matrix,
Bartlett’s test of sphericity and the Kaiser-Meyer-Olkin measure of sampling adequacy (KMO),
as well as anti-image correlation matrix, eigenvalues, communalities and percentage of the non-
redundant residuals, total variance explained, and rotated factor matrix were checked for each
section.
To be able to interpret an exploratory factor analysis there should be some correlations of
.30 or greater (Pallant, 2013). Yong and Pearce (2013) stressed that correlations among the
variables greater than +/- .90 should be removed from the model. Therefore, for each item and
section, it was ensured that the majority of the item correlations were .30 or greater and there
was not a correlation among the variables greater than +/- .90.
After the correlation matrix test, it is a requirement to check the significance level of
Bartlett’s test of sphericity and the Kaiser-Meyer-Olkin measure of sampling adequacy (KMO),
to be able to determine the factorability of the data (Pallant, 2013). Bartlett’s test of sphericity

67
should also demonstrate a significance level of p<0.05 to be able to continue the exploratory
factor analysis (Yong and Pearce, 2013). Although Yong and Pearce (2013) states that the cutoff
for the Kaiser-Meyer-Olkin measure of sampling adequacy (KMO) should be greater than .50,
Pallant (2013) states that the value for KMO should be .60 or above. As a result, due to the fact
that all of the four sections’ values of the Kaiser-Meyer-Olkin measure of sampling adequacy
was higher than the recommend value of .60 and Bartlett’s test of sphericity was significant at a
level of p<0.05, an anti-image correlation matrix was checked for supporting the Kaiser-Meyer-
Olkin measure of sampling adequacy (KMO) and Bartlett’s test of sphericity.
Anti-image correlation “matrices contain measures of sampling adequacy for each
variable along the diagonal and the negatives of the partial correlation/covariance on the off-
diagonals” (Field, 2013, p. 287). According to Yong and Pearce (2013), the value on the
diagonal element of the anti-image correlation matrix should be above .50, and if the value is
below the cutoff point (.50), more data should be collected or the item that has a value below the
cutoff should be removed from the model. As a result, it was realized that there were some items
in each section that had an anti-image correlation value of less that .50. Therefore, items with a
value of less than .50 anti-image correlations were removed from the model. Since there were
few items with a value of less than .50 anti-image correlations in some of the sections, as a first
step, the item with the lowest value was removed from the model and the model tested again.
After trying few different variations to select the item to be removed, it was decided that items
should be removed one by one from lowest value to highest value, which are less than .50.
Consequently;
In the POS FOH section, the survey items “Integrated credit card swipe into POS”
(.224), “Touch screen” (.380), “Menu labeling/nutritional information” (.462) and
68
“Gift card integration” (.487) were removed from the model respectively.
In the POS BOH section, the survey items “Kitchen printers” (.201), “Mobile device
for manger use” (.481) and “Customer relationship management system” (.456) were
removed from the model respectively.
In the Mobile POS perspective section, the survey item “My company does not see
the value in investing in wireless handheld POS terminals” (.406) was removed from
the model.
In the PCI DSS section, the survey item “We have deployed the PCI council’s best
practices for mobile payment” (.456) was removed from the model.
Before evaluating the table of total variance explained and rotated factor matrix,
communalities and percentage of the non-redundant residuals were checked. According to
Walker and Maddan (2008), it is important to inspect the communality, of which is “represented
by the sum of the squared loadings for a variable across factors” (p. 333). The lowest, moderate
and highest values of communalities in the social sciences are considered to be .40, .70, and .80
or greater respectively, and if the communality of the item is below .40, it can be removed from
the model (Costello and Osborne, 2005). Another critical test in the exploratory factor analysis
is residuals. Yong and Pearce (2013) point out that “a model that is a good fit will have less than
50% of the non-redundant residuals with absolute values that are greater than .05” (p. 90). As a
result of the communalities check, all four sections had less than 50% of the non-redundant
residuals with absolute values that are greater than .05. However, some of the items had a value
lower than .50 in communalities table:
In the POS FOH section, since the “Digital signage” (.483) had a value lower than .50
in the communalities table, it was removed from the model.

69
In the mobile POS Perspective section, “Mobile POS is not a secure method of
payment” (.242) had a value lower than .50 in the communalities table so it was
removed from the model.
By successfully completing all of the above tests, the significance level of Bartlett’s test
of sphericity, the Kaiser-Meyer-Olkin measure of sampling adequacy (KMO), table of total
variance explained and rotated factor matrix were checked and the results are demonstrated
below.
Table 27: Bartlett’s Test of Sphericity and the Kaiser-Meyer-Olkin Measure of Sampling
Adequacy (KMO)
POS
FOH POS BOH
Mobile POS
Perspectives
PCI DSS
Compliance
Kaiser-Meyer-Olkin Measure
of Sampling Adequacy. .644 .763 .703 .695
Bartlett's Test of Sphericity Approx. Chi-Square 268.949 326.908 205.170 136.954
df 78 105 36 28
Sig. .000 .000 .000 .000
As seen in the table above, all of the four sections’ values of the Kaiser-Meyer-Olkin
measure of sampling adequacy were higher than the recommend value of .60 (Pallant, 2013) and
Bartlett’s test of sphericity was significant at a level of p<0.05 (Yong and Pearce, 2013).
To be able to assess the total number of significant factors, it is required to find the table
of total variance explained and check the initial eigenvalues that are 1 or greater (Yong and
Pearce, 2013). This is the most commonly used technique and is known as the Kaiser-Guttman
criterion (Matsunaga, 2010). In the table of total variance explained, the initial eigenvalues
equal to 1 or greater show the total variance explained as components and as a cumulative
percent of variance (Pallant, 2013).
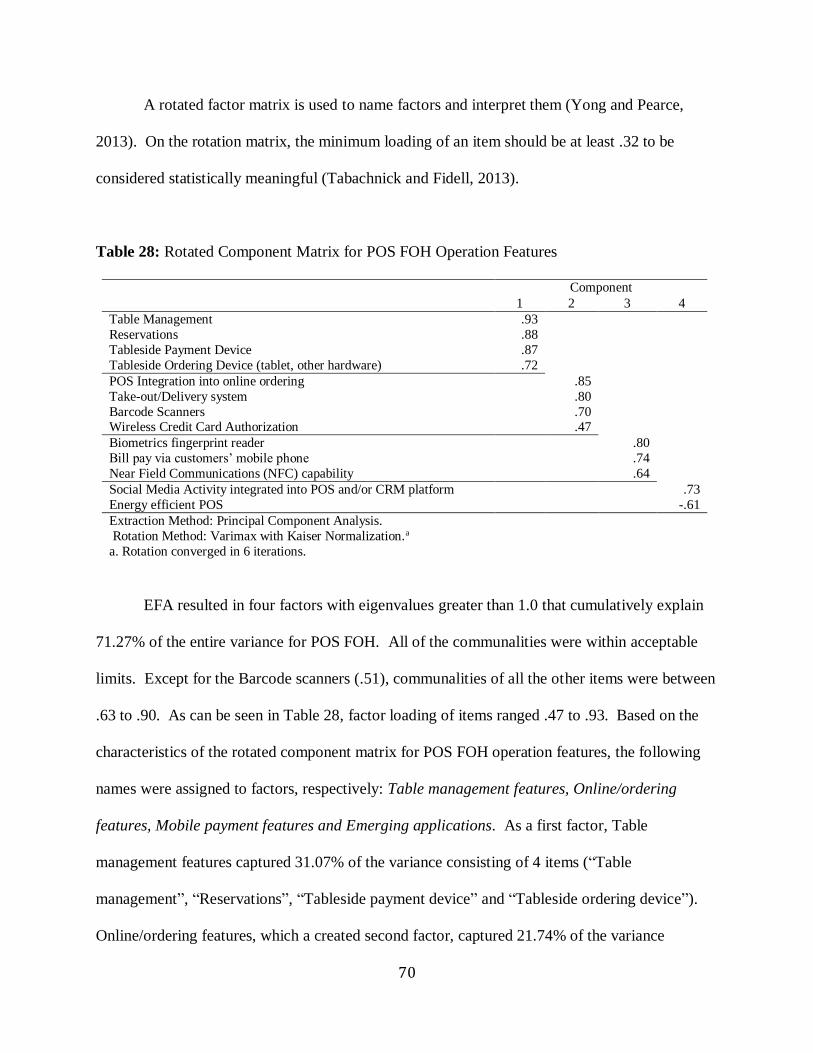
70
A rotated factor matrix is used to name factors and interpret them (Yong and Pearce,
2013). On the rotation matrix, the minimum loading of an item should be at least .32 to be
considered statistically meaningful (Tabachnick and Fidell, 2013).
Table 28: Rotated Component Matrix for POS FOH Operation Features
Component
1 2 3 4
Table Management .93
Reservations .88
Tableside Payment Device .87
Tableside Ordering Device (tablet, other hardware) .72
POS Integration into online ordering .85
Take-out/Delivery system .80
Barcode Scanners .70 Wireless Credit Card Authorization .47
Biometrics fingerprint reader .80
Bill pay via customers’ mobile phone .74
Near Field Communications (NFC) capability .64
Social Media Activity integrated into POS and/or CRM platform .73
Energy efficient POS -.61
Extraction Method: Principal Component Analysis.
Rotation Method: Varimax with Kaiser Normalization.a
a. Rotation converged in 6 iterations.
EFA resulted in four factors with eigenvalues greater than 1.0 that cumulatively explain
71.27% of the entire variance for POS FOH. All of the communalities were within acceptable
limits. Except for the Barcode scanners (.51), communalities of all the other items were between
.63 to .90. As can be seen in Table 28, factor loading of items ranged .47 to .93. Based on the
characteristics of the rotated component matrix for POS FOH operation features, the following
names were assigned to factors, respectively: Table management features, Online/ordering
features, Mobile payment features and Emerging applications. As a first factor, Table
management features captured 31.07% of the variance consisting of 4 items (“Table
management”, “Reservations”, “Tableside payment device” and “Tableside ordering device”).
Online/ordering features, which a created second factor, captured 21.74% of the variance

71
consisting of 4 items (“POS integration into online ordering”, “Take-out/delivery system”,
“Barcode scanners”, and “Wireless credit card authorization”). Mobile payment features, as the
third factor, captured 10.29% of the variance consisting of 3 items (“Biometrics fingerprint
reader”, “Bill pay via customers’ mobile phone” and “Near field communications capability”).
As a last factor, Emerging applications captured 8.18% of variance consisting of 2 items (“Social
media activity integrated into POS and/or CRM platform” and “Energy efficient POS”).
Table 29: Rotated Component Matrix for POS BOH Operation Features
Component
1 2 3 4
Enterprise management software .85
Labor Management .83
Accounting/Financial Software .74
Business Intelligence System .74
Inventory Management Software .64
Real-time, web-based reporting .63
Kitchen Management .87 Cloud-based applications .75
Kitchen Displays .73
Labor screening and recruitment tools .65
Intra-day reporting .80
Company Intranet .78
Disaster recovery plan for technology systems .59
Integrated Cost Control Software .83
Integrated Video / IP Video for Security .81
Extraction Method: Principal Component Analysis.
Rotation Method: Varimax with Kaiser Normalization.a
a. Rotation converged in 6 iterations.
EFA for POS BOH resulted in four factors with eigenvalues greater than 1.0 that
cumulatively explain 71.28% of the entire variance. All of the communalities were within
acceptable limits. Other than the “Disaster recovery plan for technology systems” (.50),
communalities ranged from .65 to .87. As is clearly shown in the Table 29, factor loading of
items ranged .59 to .87, suggesting a high correlation of the items. Following names, Essential
functions, Cloud applications, Enterprise systems and Integrated systems were assigned to

72
factors respectively, based on the characteristics of the rotated component matrix for POS BOH
operation features. Essential functions, as the first factor, captured 39.66% of the variance
consisting of 6 items (“Enterprise management software”, “Labor management”,
“Accounting/financial software”, “Business intelligence system”, “Inventory management
software” and “Real-time, web-based reporting”). Cloud applications, as the second factor,
captured 15.75% of the variance consisting of 4 items (“Kitchen management”, “Cloud-based
applications”, “Kitchen displays”, and “Labor screening and recruitment tools”). Enterprise
systems, as the third factor, captured 8.28% of the variance consisting of 3 items (“Intra-day
reporting”, “Company intranet” and “Disaster recovery plan for technology systems”). As the
last factor, Integrated systems captured 7.58% of the variance consisting of 2 items (“Integrated
cost control software” and “Integrated video / IP video for security”).
Table 30: Rotated Component Matrix for Mobile POS Perspectives
Component
1 2 3
Mobile POS helps serve guests more quickly .87
Mobile POS terminals increase guest satisfaction .84
Mobile credit card terminals reduce credit card skimming .81
Mobile POS terminals "wow" guests .78
Mobile POS devices are easy to break .86
Mobile POS devices are easy to lose .84
Mobile POS devices are too expensive .78
My company has a mobile app .84 My company has a website that is optimized for mobile
devices (i.e. iPhone, Android) .84
Extraction Method: Principal Component Analysis.
Rotation Method: Varimax with Kaiser Normalization.a
a. Rotation converged in 5 iterations.
EFA for Mobile POS revealed the presence of three components with eigenvalues higher
than 1, explaining 45.06%, 17.81%, and 12.94% of the variance respectively and explaining the
total 75.81% of the entire variance . All of the communalities were acceptable with a range from

73
.67 to .83. As is clearly shown Table 30, factor loading of items ranged from .78 to .87,
suggesting a high correlation of the items. Based on the characteristics of the rotated component
matrix for Mobile POS perspectives, following names were assigned to factors respectively:
Advantages of Mobile POS, Disadvantages of Mobile POS, and Web-enabled mobile POS
Features. As the first factor, Advantages of Mobile POS captured 45.06% of the variance
consisting of 4 items (“Mobile POS helps serve guests more quickly”, “Mobile POS terminals
increase guest satisfaction”, “Mobile credit card terminals reduce credit card skimming” and
“Mobile POS terminals "wow" guests”). Disadvantages of Mobile POS, as the second factor,
captured 17.81% of the variance consisting of 3 items (“Mobile POS devices are easy to break”,
“Mobile POS devices are easy to lose” and “Mobile POS devices are too expensive”). As the
last factor, Web-enabled mobile POS Features captured 12.94% of the variance consisting of 2
items (“My company has a mobile app” and “My company has a website that is optimized for
mobile devices”).
Table 31: Rotated Component Matrix for PCI DSS Compliance
Component
1 2 3
We lack knowledgeable staff at a senior-level to oversee payment security
measures .84
We lack the budget necessary to implement payment security technologies .81
We have limited commitment from top management for payment security .72
We lack vendor support for PCI compliance efforts .90
Our franchisees lack commitment to compliance efforts .86
Our organization plans to upgrade devices and procedures by the April 2015 EMV deadline for merchant compliance
.86
PCI Standards are too complex .64
We are fully aware of changes necessary to implement EMV technology .64
Extraction Method: Principal Component Analysis.
Rotation Method: Varimax with Kaiser Normalization.a
a. Rotation converged in 6 iterations.
EFA for PCI DSS compliance revealed the presence of three components with

74
eigenvalues higher than 1, explaining 42.02%, 19.33%, and 15.38% of the variance respectively
and explaining 76.73% of the entire variance. All of the communalities were acceptable with a
range from .67 to .84. As can be clearly seen Table 31, factor loading of items ranged from .64
to .86 suggesting a high correlation of the items. Based on the characteristics of the rotated
component matrix for PCI DSS compliance, the following names were assigned to factors
respectively: Barriers to PCI DSS, Lack of support, and Emerging Features. As the first factor,
Barriers to PCI DSS captured 42.02% of the variance consisting of 3 items (“We lack
knowledgeable staff at a senior-level to oversee payment security measures”, “We lack the
budget necessary to implement payment security technologies”, and “We have limited
commitment from top management for payment security”). Lack of support, as the second
factor, captured 19.33% of the variance consisting of 2 items (“We lack vendor support for PCI
compliance efforts” and “Our franchisees lack commitment to compliance efforts”). As the last
factor, Emerging Features captured 12.94% of the variance consisting of 3 items (“Our
organization plans to upgrade devices and procedures by the April 2015 EMV deadline for
merchant compliance”, “PCI Standards are too complex” and “We are fully aware of changes
necessary to implement EMV technology”).
Hypotheses Testing
Based on the job function, respondents were divided into two groups, named IT and Non-
IT position holder, respectively. Additionally, based on the company descriptions, companies
were also divided into two groups: chain and independent restaurants. Finally, according to
companies’ reported preferences from business and technology perspectives, companies were

75
grouped under two categories (Business Leadership and Technology Leadership): either
“innovator” or “follower”.
Hypotheses Related to POS FOH Technology Features
An independent samples t-test was conducted to compare factors of POS FOH
technology features for restaurant types (“Chain” and “Independent”), business leadership
perspective (“Innovator” and “Follower”), technology leadership perspective (“Innovator” and
“Follower”), and job function (“IT” and “Non-IT”), and to test the hypotheses below:
1. HA1 = There is a significant difference in POS FOH technology features between
chain restaurants and independent restaurants.
2. HA2 = There is a significant difference in POS FOH technology features between
restaurants which identify themselves as innovators versus followers from a business
perspective.
3. HA3 = There is a significant difference in POS FOH technology features between
restaurants which identify themselves as innovators versus followers from a
technology perspective.
4. HA4 = There is a significant difference in POS FOH technology features between
restaurants with IT educated IT managers versus non-IT educated IT managers.

76
Table 32: Hypothesis Testing for POS FOH Technology Features
Business Leadership Innovator Follower
M1 SD2 M1 SD2 t3 Sig.4
Table management features 2.24 1.30 2.05 0.88 0.54 0.59
Online/ordering features 3.23 0.93 2.78 1.33 1.23 0.23
Mobile payment features 2.79 0.97 1.88 1.02 2.68 0.01
Emerging applications 3.16 0.67 2.41 0.77 3.11 0.00
Technology Leadership Innovator Follower
M1 SD2 M1 SD2 t3 Sig.4
Table management features 2.09 1.21 2.45 1.23 -0.92 0.37
Online/ordering features 3.31 0.94 2.73 1.14 1.76 0.08
Mobile payment features 2.81 1.03 2.09 0.94 2.27 0.03
Emerging applications 3.13 0.64 2.69 0.89 1.95 0.05
Notes: 1 Mean (1 = Not important at all, 5 = Extremely Important) 2 Standard Deviation 3 t statistics (independent samples t-test) 4 Significance
There is not a statistically significant difference between the chain and independent
restaurants’ mean for factors of POS FOH technology features:
Table management features; t = -1.16, p = 0.25
Online/ordering features; t = 1.23, p = 0.23
Mobile payment features; t = 1.25, p = 0.22
Emerging applications; t = -1.00, p = 0.32
Therefore, hypothesis HA1 (“There is a significant difference in POS FOH technology
features between chain restaurants versus independent restaurants”) was rejected.
Due to the fact that there is a statistically significant difference between restaurants which
identify themselves as innovators or followers from a Business Leadership perspective for POS
FOH technology features on “Mobile payment features”, t = 2.68, p = 0.01 and “Emerging
applications”, t = 3.11, p = 0.00 but not a statistically significant difference on “Table
management features”, t = 0.54, p = 0.59 and “Online/ordering features”, t = 1.23, p = 0.23,
hypothesis HA2 was partially supported, at α ≤ 0.05.

77
Although there is a statistically significant difference between restaurants which identify
themselves as innovators or followers from a Technology Leadership perspective for POS FOH
technology features on “Mobile payment features”, t = 2.27, p = 0.03 and “Emerging
applications”, t = 1.95, p = 0.05, there is not a statistically significant difference on “Table
management features”, t = -0,92, p = 0.37 and “Online/ordering features”, t = 1.76, p = 0.09.
Therefore, hypothesis HA3 was partially supported, at α ≤ 0.05.
There is not a statistically significant difference between the IT educated IT managers
and non-IT educated IT managers mean for factors of POS FOH technology features:
Table management features; t = -0.42, p = 0.68
Online/ordering features; t = 0.40, p = 0.69
Mobile payment features; t = -1.32, p = 0.20
Emerging applications; t = -0.20, p = 0.84
Therefore, hypothesis HA4 (“There is a significant difference in POS FOH technology
features between restaurants with IT educated IT managers versus non-IT educated IT
managers”) was rejected.
Hypotheses Related to POS BOH Technology Features
To compare factors of POS BOH technology features for restaurant types (“Chain” and
“Independent”), business leadership perspective (“Innovator” and “Follower”), technology
leadership perspective (“Innovator” and “Follower”), and job function (“IT” and “Non-IT”), and
to test the hypotheses below, an independent samples t-test was conducted and results are
demonstrated below:

78
1. HB1 = There is a significant difference in POS BOH technology features between
chain restaurants versus independent restaurants.
2. HB2 = There is a significant difference in POS BOH technology features between
restaurants which identify themselves as innovators versus followers from a business
perspective.
3. HB3 = There is a significant difference in POS BOH technology features between
restaurants which identify themselves as innovators versus followers from a
technology perspective.
4. HB4 = There is a significant difference in POS BOH technology features between
restaurants with IT educated IT managers versus non-IT educated IT managers.
Table 33: Hypothesis Testing for POS BOH Technology Features
Restaurant Types Chain Independent
M1 SD2 M1 SD2 t3 Sig.4
Essential functions 4.28 0.80 3.67 0.97 2.05 0.05
Cloud applications 3.66 0.89 2.97 1.03 2.00 0.05
Enterprise systems 1.44 0.50 1.47 0.39 -0.17 0.87
Integrated systems 1.53 0.47 1.80 0.71 -1.13 0.28
Business Leadership Innovator Follower
M1 SD2 M1 SD2 t3 Sig.4
Essential functions 4.19 0.88 3.96 0.83 0.70 0.49
Cloud applications 3.69 0.94 2.95 0.79 2.25 0.03
Enterprise systems 1.47 0.49 1.37 0.43 0.58 0.56 Integrated systems 1.54 0.51 1.75 0.63 -1.08 0.29
Technology Leadership Innovator Follower
M1 SD2 M1 SD2 t3 Sig.4
Essential functions 4.38 0.57 3.63 1.16 2.30 0.04
Cloud applications 3.67 0.96 3.20 0.88 1.56 0.13
Enterprise systems 1.43 0.53 1.47 0.37 -0.22 0.83
Integrated systems 1.50 0.44 1.77 0.68 -1.39 0.18
Notes: 1 Mean (1 = Not important at all, 5 = Extremely Important) 2 Standard Deviation 3 t statistics (independent samples t-test) 4 Significance

79
Although there is a statistically significant difference between chain restaurants and
independent restaurants mean for POS BOH technology features on “Essential functions”, t =
2.05, p = 0.05 and “Cloud applications”, t = 2.00, p = 0.05, there is not a statistically significant
difference on “Enterprise systems”, t = -0,17, p = 0.87 and “Integrated systems”, t = -1.13, p =
0.28. Therefore, hypothesis HB1 was partially supported, at α ≤ 0.05.
Due to the fact that there is a statistically significant difference between restaurants which
identify themselves as innovators or followers from a Business Leadership perspective for POS
BOH technology features on “Cloud applications”, t = 2.25, p = 0.03 but not a statistically
significant difference on “Essential functions”, t = 0.70, p = 0.49, “Enterprise systems”, t = 0.58,
p = 0.57, and “Integrated systems hypothesis”, t = -1.08, p = 0.29, HB2 was partially supported, at
α ≤ 0.05.
There is a statistically significant difference between restaurants which identify
themselves as innovators or followers from a Technology Leadership perspective mean for POS
BOH technology features on “Essential functions”, t = 2.30, p = 0.04. However, there is not
statistically significant difference between restaurants which identify themselves as innovators or
followers from a Technology Leadership perspective on “Cloud applications”, t = 1.56, p = 0.13,
“Enterprise systems”, t = -0.22, p = 0.83, and “Integrated systems hypothesis”, t = -1.39, p =
0.18. As a result, HB3 was partially supported, at α ≤ 0.05.
There is not a statistically significant difference between the IT educated IT managers
and non-IT educated IT managers mean for factors of POS BOH technology features:
Essential functions; t = 1.75, p = 0.09
Cloud applications; t = 0.12, p = 0.90
Enterprise systems; t = -0.76, p = 0.45
80
Integrated systems; t = 0.80, p = 0.42
Therefore, hypothesis HB4 (“There is a significant difference in POS BOH technology
features between restaurants with IT educated IT managers versus non-IT educated IT
managers.”) was rejected.
Hypotheses Related to Mobile POS Perspectives
An independent samples t-test was conducted: to compare factors of mobile POS
perspectives for restaurant types (“Chain” and “Independent”), business leadership perspective
(“Innovator” and “Follower”), technology leadership perspective (“Innovator” and “Follower”),
and job function (“IT” and “Non-IT”), and to test the hypotheses below:
1. HC1 = There is a significant difference in mobile POS perspectives between chain
restaurants versus independent restaurants.
2. HC2 = There is a significant difference in mobile POS perspectives between
restaurants which identify themselves as innovators versus followers from a business
perspective.
3. HC3 = There is a significant difference in mobile POS perspectives between
restaurants which identify themselves as innovators versus followers from a
technology perspective.
4. HC4 = There is a significant difference in mobile POS perspectives between
restaurants with IT educated IT managers versus non-IT educated IT managers.

81
Table 34: Hypothesis Testing for Mobile POS Perspectives
Technology Leadership Innovator Follower
M1 SD2 M1 SD2 t3 Sig.4
Advantages of mobile POS 4.06 0.77 3.28 1.18 2.33 0.03
Disadvantages of mobile POS 3.60 0.79 3.44 1.13 0.56 0.58
Web enabled mobile POS features 3.11 1.33 2.47 0.90 1.95 0.05
Job Functions IT Non-IT
M1 SD2 M1 SD2 t3 Sig.4
Advantages of mobile POS 3.95 0.68 3.69 1.20 0.91 0.37
Disadvantages of mobile POS 3.81 0.77 3.31 0.97 1.98 0.05
Web enabled mobile POS features 3.22 1.17 2.60 1.25 1.74 0.09
Notes: 1 Mean (1 = Strongly disagree, 5 = Strongly agree) 2 Standard Deviation 3 t statistics (independent samples t-test) 4 Significance
There is not a statistically significant difference between the chain and independent
restaurants mean for factors of mobile POS perspectives:
Advantages of mobile POS; t = 0.25, p = 0.81
Disadvantages of mobile POS; t = -0.22, p = 0.83
Web enabled mobile POS features; t = 0.96, p = 0.34
Therefore, hypothesis HC1 (“There is a significant difference in mobile POS perspectives
between chain restaurants versus independent restaurants.”) was rejected.
There is not a statistically significant difference between restaurants which identify
themselves as innovators or followers from a Business Leadership perspective mean for factors
of mobile POS perspectives:
Advantages of mobile POS; t = 1.43, p = 0.16
Disadvantages of mobile POS; t = 0.34, p = 0.74
Web enabled mobile POS features; t = 0.88, p = 0.39
Therefore, hypothesis HC2 (“There is a significant difference in mobile POS perspectives
between restaurants which identify themselves as innovators versus followers from a business
perspective.”) was rejected.

82
There is a statistically significant difference between restaurants which identify
themselves as innovators or followers from a Technology Leadership perspective for mobile POS
perspectives on “Advantages of mobile POS”, t = 2.33, p = 0.03 and “Web enabled mobile POS
features”, t = 1.95, p = 0.05. However, there is not statistically significant difference between
restaurants which identify themselves as innovators or followers from a Technology Leadership
perspective on “Disadvantages of mobile POS”, t = 0.56, p = 0.58. As a result, HC3 was partially
supported, at α ≤ 0.05.
Due to the fact that there is a statistically significant difference between restaurants with
IT educated IT managers and non-IT educated IT managers on “Disadvantages of mobile POS”,
t = 1.98, p = 0.05 but not a statistically significant difference on “Advantages of mobile POS”, t
= 0.91, p = 0.37 and “Web enabled mobile POS features”, t = 1.74, p = 0.09, hypothesis HC4 was
partially supported, at α ≤ 0.05.
Hypotheses Related to PCI DSS Compliance
To compare factors of PCI DSS compliance for restaurant types (“Chain” and
“Independent”), business leadership perspective (“Innovator” and “Follower”), technology
leadership perspective (“Innovator” and “Follower”), and job function (“IT” and “Non-IT”), and
to test the hypotheses below, an independent samples t-test was conducted and results are
demonstrated below:
1. HD1 = There is a significant difference in PCI DSS compliance between chain
restaurants versus independent restaurants.

83
2. HD2 = There is a significant difference in PCI DSS compliance between restaurants
which identify themselves as innovators versus followers from a business perspective.
3. HD3 = There is a significant difference in PCI DSS compliance between restaurants
which identify themselves as innovators versus followers from a technology
perspective.
4. HD4 = There is a significant difference in PCI DSS compliance between restaurants
with IT educated IT managers versus non-IT educated IT managers.
Table 35: Hypothesis Testing for PCI DSS Compliance
Business Leadership Innovator Follower
M1 SD2 M1 SD2 t3 Sig.4
Barriers to PCI DSS 2.62 1.04 3.03 1.43 -1.02 0.31
Lack of support 3.07 1.27 4.05 1.59 -2.03 0.05
Emerging features 3.90 0.80 3.73 1.00 0.57 0.57
Technology Leadership Innovator Follower
M1 SD2 M1 SD2 t3 Sig.4
Barriers to PCI DSS 2.64 1.00 2.84 1.38 -0.55 0.58
Lack of support 2.97 1.11 3.93 1.69 -2.01 0.05
Emerging features 3.97 0.66 3.67 1.12 0.96 0.35
Notes: 1 Mean (1 = Strongly disagree, 5 = Strongly agree) 2 Standard Deviation 3 t statistics (independent samples t-test) 4 Significance
There is not a statistically significant difference between the chain and independent
restaurants mean for factors of PCI DSS compliance:
Barriers to PCI DSS; t = 0.99, p = 0.33
Lack of support; t = 0.74, p = 0.46
Emerging features; t = -0.28, p = 0.78
Therefore, hypothesis HD1 (“There is a significant difference in PCI DSS compliance
between chain restaurants versus independent restaurants.”) was rejected.

84
Due to the fact that there is a statistically significant difference between restaurants which
identify themselves as innovators or followers from a Business Leadership perspective for PCI
DSS compliance on “Lack of support”, t = -2.03, p = 0.05 but not a statistically significant
difference on “Barriers to PCI DSS”, t = -1.02, p = 0.31 and “Emerging features”, t = 0.57, p =
0.58, HD2 was partially supported, at α ≤ 0.05.
Although there is a statistically significant difference between restaurants which identify
themselves as innovators or followers from a Technology Leadership perspective for PCI DSS
compliance on “Lack of support”, t = -2.01, p = 0.05, there is not a statistically significant
difference on “Barriers to PCI DSS”, t = -0.55, p = 0.58 and “Emerging features”, t = 0.96, p =
0.35. Therefore, hypothesis HD3 was partially supported, at α ≤ 0.05.
There is not a statistically significant difference between restaurants with IT educated IT
managers versus non-IT educated IT managers mean for factors of PCI DSS compliance:
Barriers to PCI DSS; t = 0.35, p = 0.73
Lack of support; t = 1.04, p = 0.30
Emerging features; t = 0.97, p = 0.34
Therefore, hypothesis HD4 (“There is a significant difference in PCI DSS compliance
between restaurants with IT educated IT managers versus non-IT educated IT managers.”) was
rejected.

85
CHAPTER FIVE:
CONCLUSIONS AND RECOMMENDATIONS
Based on the findings of this study, the following conclusions may be made.
Among all respondents who are responsible for information technology (IT) management
in their companies, only about 40% have IT as their sole job function. A majority of the
respondents have IT as their secondary job function. This supports the previous studies’ findings
that IT is still not a major job function in restaurant companies (Cobanoglu, 2007). With the
increased dependence on IT and other compliance requirements such as Payment Card Industry
Data Security Standards (PCI DSS), restaurateurs may view their IT management policy and
create a formal IT structure that supports the entire operation. This finding is also in line with
another finding in the study: Business Leadership versus Technology Leadership. A majority of
the respondents identified their companies as an innovator from a business perspective while
only one third of the companies identified themselves as a leader from a technology perspective.
On average 37% of companies’ IT budgets were allocated to capital expenditures, which
include investing in new technology, innovation, etc. On the other hand, on average 61.8% of
the IT budget was allocated to operating expenditures, which include maintaining systems,
licensing, and fees. This finding is somewhat in line with results found by the Info Tech
Research Group (Johnston, 2015) that “a company’s total percentage of all expenditures should
be 33 percent for capital assets and 67 percent for operating expenses”. Additionally, it can
easily be observed that IT budgets in restaurants are increasing. Findings of the study indicated

86
that Point of Sale Systems (Front of House and Back of House features) continue to dominate the
IT spending in respondents’ restaurants. The spending for mobile technologies continues to
increase even though these technologies constitute only nine percent of the total spending
currently.
The top five main drivers for company’s IT efforts are: “Business efficiency”, “Enhanced
guest service”, “Employee productivity”, “Security/compliance (PCI and payments)”, and “Cost-
saving measures”. These drivers are in line with Kasavana’ (2011) and Ansel and Dyer (1999).
The main three challenges for restaurant technology companies are “Insufficient IT
budgets to keep pace with needed investments”, “The technology itself is insufficient to meet our
needs”, and “Guests expect greater technology than we can keep pace with”. This finding is also
supported by Fellah (2015). This may be explained with the fact that restaurateurs do not see IT
as a major job function, rather as a cost-center. A problem of insufficient investments in IT may
disappear, as technology becomes an integral part of business operations and its positive impact
to the bottom line becomes clearer. Additionally, according to National Restaurant Association
(2015a), “technology rapidly is becoming an expectation rather than a novelty when dining out”.
As a result, 25% of the consumers state that technology is an important decision making for
choosing a restaurant. Therefore, restaurants may allocate more budgets to meet customer
expectations in this area, and consider IT as a major job function.
Top five used POS FOH technology features are “POS hardware”, “Touch screen”, “POS
software”, “Gift card, integration”, and “Integrated credit card swipe into POS”. The five least
used technology features are “Social media activity integrated into POS and/or CRM platform”,
“Tableside payment device”, “Tableside ordering device (tablet, other hardware)”, “Near field
communications capability”, and “Bill pay via customers’ mobile phone”. This finding makes
87
sense as the least utilized technologies are emerging technologies. As these technologies
develop further, one can predict that they will be used by more restaurants. This is supported by
another finding in this study. Restaurant managers have plans to implement “Bill pay via
customers’ mobile phone”, and “Social media activity integrated into POS and/or CRM
platform” technology features into their FOH operation technology systems in the future.
Additionally, “POS Integration into online ordering”, “Barcode scanners”, “Digital signage” and
“Take-out/Delivery system” are the some other technology features that managers plans to add
into the FOH operations’ technology systems in their restaurants.
Top five used POS BOH technology features are “Accounting/Financial software”,
“Enterprise reporting”, “Inventory management software”, “Kitchen printers”, and “Company
intranet”. The five least used technology features are “Labor screening and recruitment tools”,
“Real-time, web-based reporting”, “Kitchen management”, “Customer relationship management
system” and “Mobile device for manager use”. These underutilized hardware/software may
bring potential benefits of cost savings and enhanced productivity. Some of the restaurant
managers have realized their importance and have plan to implement “Real-time, web-based
reporting” and “Mobile device for manager use” technology feature to their restaurant in the
future. Additionally, “Business intelligence system” is another POS BOH features that restaurant
managers wish to have in the future.
There is a positive point of view about Mobile POS devices among the restaurant
managers. Respondents agreed with the statements: “Mobile POS helps serve guests more
quickly”, “Mobile POS terminals increase guest satisfaction”, and “Mobile credit card terminals
reduce credit card skimming.”

88
Restaurateurs may do well by developing mobile app for their restaurants, or, at the very
least, optimizing their websites for mobile phones. Alternatively, restaurants may utilize existing
apps, such as Yelp, to make sure that the restaurant is reaching target customers and their
feedbacks or reviews. Finally, the reviews in these different apps need to be monitored on a
continuing basis by management.
The findings indicated that the restaurants comply with 87% of PCI DSS on average.
Even though this appears a high percentage, normally PCI DSS compliance should be 100%
among the restaurants that accept, process, and transmit credit card information. PCI DSS
requirements do not accommodate a partial compliance. A restaurant may deem “not compliant”
even if one of the PCI DSS standards is not met. Restaurants may do well by allocating
resources on PCI DSS compliance as a data breach can cost restaurants significant resources as
fines. The average cost of a data breach in 2010 was $7.2 Million (Stepleton, 2012). About 21%
of the respondents indicated that they use vendor supplied default passwords. This represents a
significant potential risk for restaurants as these passwords are highly known publicly and
hackers use them widely in data breaches.
There is no statistically significant difference between the Chain and Independent
restaurants mean for factors of POS FOH technology features. In addition, there is no
statistically significant difference between the IT educated IT managers and non-IT educated IT
managers’ opinions with regard to the factors of POS FOH technology features. These findings
are expected due to the fact that these features are the mission critical of any restaurant. Mission
critical systems are defined as systems that are integral to the operation of a restaurant (Collins,
Cobanoglu and Bilgihan, 2013). The means of mobile payment features and emerging
applications for POS FOH technology features differ significantly between innovators and

89
followers. This finding is expected as innovator restaurant companies are expected to invest in
emerging and new technologies earlier than follower restaurant companies.
The means of essential functions and cloud applications differ significantly for POS BOH
technology features for chain and independent restaurants. Essential functions factor consisted
of the following variables: “Enterprise management software”, “Labor management”,
“Accounting/financial software”, “Business intelligence system”, “Inventory management
software” and “Real-time, web-based reporting”. This finding may be attributed to the necessity
of the essential functions in the chain restaurants. Due to the fact that chain restaurants are
composed of multiple units, they may need these functions more than independent restaurants
which are usually have one or few units.
In terms of mobile POS perspectives, innovator restaurants from technology leadership
perspective agree significantly more in advantages of mobile POS (“Mobile POS helps serve
guests more quickly”, “Mobile POS terminals increase guest satisfaction”, “Mobile credit card
terminals reduce credit card skimming” and “Mobile POS terminals “wow” guests”) and web-
enabled mobile POS features (“My company has a mobile app” and “My company has a website
that is optimized for mobile devices”). Innovator companies are expected to experiment with
new technologies before follower companies. Therefore, this is another expected finding.
Additionally, IT educated managers realize the disadvantages of mobile POS features
significantly more than non-IT educated managers.
In terms of PCI DSS compliance, there are some significant differences between
innovator and follower restaurant companies and between IT educated managers and non-IT
educated managers. Followers need more support from vendors and franchisors in PCI DSS
compliance. As expected, there is no significant difference between chain and independent

90
restaurants, as well as between IT educated restaurant managers and non-IT educated restaurant
managers with regard to their opinions on PCI DSS compliance.
Future research may include the replication of this study every other year to keep track of
the trends in restaurant technology. In addition, the impact of technology on restaurant
customers’ satisfaction is another future research topic. Finally further research is needed in
emerging technology from both operators and customers’ perspectives.

91
REFERENCES
American Hotel & Lodging Association. (2006). Food and Beverage Systems. Retrieved from
http://www.ahla.com/uploadedFiles/AHLA/Members_Only/_Common/technology_prime
rs_pdf/88126NEI01ENGE.pdf
Andaleeb, S., & Conway, C. (2006). Customer satisfaction in the restaurant industry: an
examination of the transaction-specific model. Journal of Services Marketing, 20(1), 3-
11.
Ansel, D., & Dyer, C. (1999). A framework for restaurant information technology. The Cornell
Hotel and Restaurant Administration Quarterly, 40(3), 74-4.
Barney, J. (2015). 15 Firm resources and sustained competitive advantage.International Business
Strategy: Theory and Practice, 283.
Barua, A., Kriebel, C. H., & Mukhopadhyay, T. (1995). Information technologies and business
value: An analytic and empirical investigation. Information systems research, 6(1), 3-23.
Berezina, K., Cobanoglu, C., Miller, B. L., & Kwansa, F. A. (2012). The impact of information
security breach on hotel guest perception of service quality, satisfaction, revisit intentions
and word-of-mouth. International journal of contemporary hospitality
management, 24(7), 991-1010.
Bienstock, C. C., Stafford, M. R., & Stafford, T. F. (2015). The Role of Technology in Industrial
Customers’ Perceptions of Logistics Service Quality and Their Future Purchase
Intentions. In Revolution in Marketing: Market Driving Changes (pp. 122-122). Springer
International Publishing.
Binkley, J. K. (2006). The effect of demographic, economic, and nutrition factors on the
frequency of food away from home. Journal of Consumer Affairs, 40(2), 372-391.
Bosworth, B. P., & Triplett, J. E. (2001). What’s New About the New Economy? IT, Economic
Growth and Productivity. International Productivity Monitor, 2, 19-30.
Brown, J. D. (2009). Choosing the right type of rotation in PCA and EFA. JALT Testing &
Evaluation SIG Newsletter, 13(3), 20-25.
Bryjolfsson, E., & Hitt, L. M. (1998). Beyond the productivity Paradox: Computers are the
catalyst for bigger changes. Communication of the ACM.
Brynjolfsson, E., & Hitt, L. M. (2000). Beyond computation: Information technology,
organizational transformation and business performance. The Journal of Economic
Perspectives, 23-48.
Buhalis, D. (1998). Information technologies in tourism: Implications for the tourism
curriculum (pp. 289-297). Springer Vienna.
Buhalis, D. (2003). eTourism: Information technology for strategic tourism management.
Pearson Education.
Byrne, P. J., Capps, O., & Saha, A. (1998). Analysis of quick-serve, mid-scale, and up-scale food
away from home expenditures. The International Food and Agribusiness Management
Review, 1(1), 51-72.

92
Child, D. (2006). The essentials of factor analysis. (3rd ed.). New York, NY: Continuum
International Publishing Group.
Cho, W., & Olsen, M. D. (1998). A case study approach to understanding the impact of
information technology on competitive advantage in the lodging industry. Journal of
Hospitality & Tourism Research, 22(4), 376-394.
Churchill Jr, G. A. (1979). A paradigm for developing better measures of marketing
constructs. Journal of marketing research, 64-73.
Clemons, E. K. (1986). “Information Systems for Sustainable Competitive Advantage.”
Information & Management, 11 (3): 131-36.
Cobanoglu, C. (2007). A critical look at restaurant network security: Attacks, prevention tools,
and practices. Journal of Foodservice Business Research, 10 (1). 31-50.
Cobanoglu, C. (2012). New Management Technologies Fill Missing Tech Links. Hospitality
Technology Magazine. Retrieved from
http://hospitalitytechnology.edgl.com/columns/New-Management-Technologies-Fill-
Missing-Tech-Links79439
Cobanoglu, C., Erdem, M., Nusair, K.K., & Berezina, K. (2012). 14th Annual Restaurant
Technology Study. Hospitality Technology. Retrieved from http://www.hospitality-
it.com/pdfs/2012resttechstudy.pdf
Collins, G. R., & Cobanoglu, C. (2008). Hospitality information technology: Learning how to
use it (6th ed.). Dubuque, IA: Kendall/Hunt
Collins, G., Cobanoglu, C., & Bilgihan, A. (2013). Hospitality Information Technology:
Learning How to Use it (7th Ed.) Kendall Hunt.
Collins, G., Cobanoglu, C., & Malik, T (2003). Hospitality Information Technology: Learning
How to Use it (5th Ed). Kendall Hunt.
Comrey, L.A. & Lee, H.B. (1992). A first course in factor analysis (2nd ed.). Hillside, NJ:
Lawrence Erlbaum Associates.
Connolly, D. J., Haley, M. G., (2008). PCI DSS Compliance: Just Whose Responsibility is It?
Hospitality Technology. Retrieved from
http://www.htmagazine.com/ME2/dirmod.asp?sid=&nm=&type=MultiPublishing&mod=
PublishingTitles&mid=3E19674330734FF1BBDA3D67B50C82F1&tier=4&id=D70138
F32BB54C2ABED5EFDB27ACB157
Costello, A. B., & Osborne, J. (2005). Best practices in exploratory factor analysis: four
recommendations for getting the most from your analysis. Practical Assessment Research
& Evaluation, 10(7)
Cowton, C. J. (1998). The use of secondary data in business ethics research. Journal of Business
Ethics, 17(4), 423-434.
Creamer, D., & Lorden, A.A (2014). POS software trend report 2015. Hospitality Technology.
Retrieved from http://hospitalitytechnology.edgl.com/news/POS-Software-Trend-Report-
201597065
Curry, A., & Stancich, L. (2000). The intranet—an intrinsic component of strategic information
management?. International journal of information management, 20(4), 249-268.
Czesany, S. (2006). Hospodarsky cyklus. Linde Praha, Praha.
David, J. S., Grabski, S., & Kasavana, M. (1996). The productivity paradox of hotel-industry
technology. The Cornell Hotel and Restaurant Administration Quarterly, 37(2), 64-70.

93
Debackere, K., Verbeek, A., Luwel, M., & Zimmermann, E. (2002). Measuring progress and
evolution in science and technology–II: The multiple uses of technometric
indicators. International Journal of Management Reviews, 4(3), 213-231.
Dedrick, J., Gurbaxani, V., & Kraemer, K. L. (2003). Information technology and economic
performance: A critical review of the empirical evidence. ACM Computing Surveys
(CSUR), 35(1), 1-28.
DeMicco, F., Cobanoglu, C., Dunbar, J., Grimes, R., Chen, C., & Keiser, J. R. (2015).
Restaurant Management: A Best Practices Approach. Dubuque, IA: Kendall/Hunt.
Devaraj, S., & Kohli, R. (2003). Performance impacts of information technology: Is actual usage
the missing link?. Management science, 49(3), 273-289.
DeVellis, R. F. (2012). Scale development: Theory and applications (3rd ed.). Thousand Oaks,
CA: Sage Publications, Inc.
Digital Signage Federation. (N.A.). Primary benefits of digital signage/menu boards for
restaurants and QSR locations. Retrieved from
http://www.digitalsignagefederation.org/Resources/Documents/Articles%20and%20Whit
epapers/Primary_Benefits_DSMenuBoards.pdf
Federal Trade Commission. (2014). Consumer sentinel network data book for January-
December 2013.Retrieved from
https://www.ftc.gov/system/files/documents/reports/consumer-sentinel-network-data-
book-january-december-2013/sentinel-cy2013.pdf
Fellah, A. (2015, February 3). Meeting Guest Expectations is an Ongoing Challenge. Retrieved
from http://www.wi-fi360.com/hotels-increase-tech-spending-2015/
Field, A. (2013). Discovering statistics using IBM SPSS statistics. Sage.
George, D. & Mallery, P. (1999). SPSS for Windows Step by Step. A simple Guide and
Reference. Allyn and Bacon, Boston, 359 pp.
Goch, L. (1999). The 51% niche market. Best’s Review; Life/Health Edition. Vol. 99, pp. 40-3.
Gorsuch, R. L. (1983). Factor analysis (2nd ed.) Hillsdale, NJ: LEA.
Grau, E. (2007). Using Factor Analysis and Cronbach’s Alpha to Ascertain Relationships
Between Questions of a Dietary Behavior Questionnaire. In Proceedings of the Survey
Research Methods Section, ASA.
Ham, S., Kim, W. G., & Jeong, S. (2005). Effect of information technology on performance in
upscale hotels. International Journal of Hospitality Management, 24(2), 281-294.
Hatcher, L. (1994). A step-by-step approach to using the SAS system for factor analysis and
structural equation modeling. Cary, NC:SAS Institute, Inc.
Hayes, J., 2002. Industry execs: best customer feedback info is ‘real’ thing. Nation’s Restaurant
News March 18, 36(11)
Horovitz, B. (2012, December 10). Consumers demanding more mobile meal options. USA
Today. Retrieved from
http://www.usatoday.com/story/money/business/2012/12/10/mobile-meal-ordering-
restaurants/1759007/
Hospers, G. J. (2005). Joseph Schumpeter and his legacy in innovation studies. Knowledge,
Technology & Policy, 18(3), 20-37.
Hospitality Technology Magazine. (2015, February 26). Increasing profits and reducing theft
with biometric-enabled POS. Retrieved from
http://hospitalitytechnology.edgl.com/news/Increasing-Profits-and-Reducing-Theft-with-
Biometric-Enabled-POS98547
94
Hua, N., & Templeton, A. (2010). Forces driving the growth of the restaurant industry in the
USA. International Journal of Contemporary Hospitality Management, 22(1), 56-68.
Hua, N., Morosan, C., & DeFranco, A. (2015). The other side of technology adoption:
Examining the relationships between e-commerce expenses and hotel
performance. International Journal of Hospitality Management, 45, 109-120.
Huo, Y. H. (1998). Information technology and the performance of the restaurant firms. Journal
of Hospitality & Tourism Research, 22(3), 239-251.
Johnston, K. (2015). Differences and Similarities of Capital and Operational Budgeting.
Retrieved from http://smallbusiness.chron.com/differences-similarities-capital-
operational-budgeting-33149.html
Jorgenson, D. W. (2001). Information technology and the U.S. economy (Presidential address to
the American Economic Association). American Econ. Rev. 91, 1, 1–32.
Jorgenson, D. W., & Stiroh, K. J., (2000). Raising the speed limit: US economic growth in the
information age. Brookings papers on economic activity, 125-235.
Jorgenson, D. W., & Vu, K. (2005). Information Technology and the World Economy. The
Scandinavian Journal of Economics, 107(4), 631-650.
Kasavana, M. L. (2011). Managing Technology in the Hospitality Industry (6th ed.). Lansing,
MI: The American Hotel & Lodging Educational Institute.
Kauffman, R. J., & Walden, E. A. (2001). Economics and Electronic Commerce: Survey and
Directions for Research. International Journal of Electronic Commerce (5:4), pp. 5-116.
Kim, H., & Gu, Z. (2003). Risk-adjusted performance: a sector analysis of restaurant
firms. Journal of Hospitality & Tourism Research, 27(2), 200-216.
Kim, T. G., Lee, J. H., & Law, R. (2008). An empirical examination of the acceptance behaviour
of hotel front office systems: An extended technology acceptance model. Tourism
Management, 29(3), 500–513.
Kim, Y. G., & Lim, J. (2011). A POS system based on the remote client-server model in the
small business environment. Management Research Review,34(12), 1334-1350.
Kimes, S. E. (2008). The role of technology in restaurant revenue management. Cornell
Hospitality Quarterly, 49(3), 297-309.
Kimes, S. E., & Collier, J. (2014). Customer-facing payment technology in the U.S. restaurant
industry. Cornell Hospitality Reports, 14(12), 6-17.
Kinsey, J. (1983). Working wives and the marginal propensity to consume food away from
home. American Journal of Agricultural Economics, 65(1), 10-19.
Kline, R. B. (2005). Principles and practice of structural equation modeling (2nd ed.). New
York, NY: Guilford.
Korotayev, A. V. & Tsirel, S. V. (2010). A Spectral Analysis of World GDP Dynamics:
Kondratieff Waves, Kuznets Swings, Juglar and Kitchin Cycles in Global Economic
Development, and the 2008–2009 Economic Crisis. Structure and Dynamics. 4(1): 3-57.
Kulatilaka, N. H., & Venkatraman, N. (2001). Strategic Options in the Digital Era. Business
Strategy Review (12:4), pp. 7-15.
Lam, T., Cho, V., & Qu, H. (2007). A study of hotel employee behavioral intentions towards
adoption of information technology. International Journal of Hospitality Management,
26(1), 49–65.
Lang, J. (2006). Is the Web Really a Sales Builder?. Restaurant Business,105(5), 11-12.
Laudon, K. C., and J. P. Laudon. (2010). Management Information Systems: Managing the
Digital Firm. 11th ed. Upper Saddle River, NJ: Pearson Prentice Hall.

95
Law, R., Buhalis, D., & Cobanoglu, C. (2014). Progress on information and communication
technologies in hospitality and tourism. International Journal of Contemporary
Hospitality Management, 26(5), 727-750.
Law, R., Leung, R., & Buhalis, D. (2009). Information technology applications in hospitality and
tourism: A review of publications from 2005 to 2007. Journal of Travel & Tourism
Marketing, 26(5-6), 599-623.
Leung, R., & Law, R. (2013). Evaluation of hotel information technologies and EDI adoption the
perspective of hotel IT managers in Hong Kong. Cornell Hospitality Quarterly, 54(1),
25-37.
Liang, T. P., & Tang, M. J. (1992). VAR analysis: a framework for justifying strategic
information systems projects. ACM SIGMIS Database, 23(1), 27-35.
Liddle, A.J. (2002). NRA tech poll bolsters think-tank’s 2010 forecast. Nation’s Restaurant
News November 26, 36(47)
Lo, A. S., Stalcup, L. D., & Lee, A. (2010). Customer relationship management for hotels in
Hong Kong. International Journal of Contemporary Hospitality Management, 22(2),
139-159.
Lorden, A.A., (2012, February 21). Industry outlook. Hospitality Technology. Retrieved from
http://hospitalitytechnology.edgl.com/news/Industry-Outlook--78720
Lucas, P. (2003, November 1). Wireless Gets a New Lease on Life. Credit Card Management
Retrieved from http://business.highbeam.com/137021/article-1G1-110621368/wireless-
gets-new-lease-life
Madhavaram, S., & Appan, R. (2015, January). Deconstructing Research on Information
Technology (IT) Capabilities: Implications for Marketing Strategy. InProceedings of the
2010 Academy of Marketing Science (AMS) Annual Conference (pp. 25-25). Springer
International Publishing.
Manion, C., & DeMicco, F. J. (2005). Handheld wireless point of sale systems in the restaurant
industry. Journal of Foodservice Business Research, 7(2), 103-111.
Mastroberte, T. (2014, September 5). What's new in POS hardware for 2014. Hospitality
Technology. Retrieved from http://hospitalitytechnology.edgl.com/news/What-s-New-in-
POS-Hardware-for-201495084
Matsunaga, M. (2010). How to factor-analyze your data right: Do’s, don’ts, and how-
to’s. International Journal of Psychological Research, 3(1), 97-110.
McCall, M., & Belmont, H. J. (1996). Credit card insignia and restaurant tipping: Evidence for
an associative link. Journal of Applied Psychology, 81(5), 609.
McCracken, V. A., & Brandt, J. A. (1987). Household consumption of food-away-from-home:
total expenditure and by type of food facility. American Journal of Agricultural
Economics, 69(2), 274-284.
McFarlan, F. W. (1984). “Information Technology Changes the Way You Compete.” Harvard
Business Review, 62 (3): 98-103.
Mell, P., & Grance, T. (2011). The NIST definition of cloud computing.
Melville, N., Kraemer, K., & Gurbaxani, V. (2004). Review: Information technology and
organizational performance: An integrative model of IT business value. MIS
quarterly, 28(2), 283-322.
Mihalic, T., & Buhalis, D. (2013). ICT as a new competitive advantage factor–case of small
transitional hotel sector. Economic and Business Review, 15(1), 33-56.

96
Mithas, S., Tafti, A. R., Bardhan, I., & Goh, J. M. (2012). Information technology and firm
profitability: mechanisms and empirical evidence. Mis Quarterly, 36(1), 205-224.
Mogelonsky, M. (1998). Food on demand. American Demographics, Vol. 20 No. 1, p. 57.
Mogotlhwane, T., Khosrowshahi, F., & Underwood, J. (2006, April). Information technology
productivity paradox. In 6th International Postgraduate Research Conference.
National Restaurant Association. (2013). 2013 Restaurant Industry Pocket Factbook. Retrieved
from http://www.restaurant.org/Downloads/PDFs/News-
Research/Factbook2013_LetterSize.pdf
National Restaurant Association. (2014). Economist's notebook: Hospitality employee turnover
rose slightly in 2013. Retrieved from http://www.restaurant.org/News-
Research/News/Economist-s-Notebook-Hospitality-employee-turnover
National Restaurant Association. (2015a). 2015 Restaurant Industry Forecast. Retrieved from
http://www.restaurant.org/Downloads/PDFs/News-
Research/research/ForecastExecSummary2015-FINAL.pdf
National Restaurant Association. (2015b). 2015 Economic Engine. Retrieved from
http://www.restaurant.org/Industry-Impact/Employing-America/Economic-Engine
Norton, D. (1999). SAP Strategic Enterprise Management: Translating Strategy into Action: The
Balanced Scorecard. SAP AG.
Nunnally, J. C. (1978). Psychometric theory (2nd ed.). New York: McGraw-Hill
Nunnally, J. C., & Durham, R. L. (1975). Validity, reliability, and special problems of
measurement in evaluation research. In E. L. Struening & M. Guttentag (Eds.), Handbook
of evaluation research. Beverly Hills, CA: Sage.
Nyheim, P. D., McFadden, F. M., & Connolly, D. J. (2005). Technology Strategies for the
Hospitality Industry. Upper Saddle River, NJ: Prentice Hall.
O'Connor, P. (1996). Using computers in hospitality. Cassell plc.
Olsen, M. D. & Connolly, J. D. (2000). Experienced-based Travel. Cornell Hotel and Restaurant
Administration Quarterly, 41, 30.
Oronsky, C. R., & Chathoth, P. K. (2007). An exploratory study examining information
technology adoption and implementation in full-service restaurant firms. International
Journal of Hospitality Management, 26(4), 941-956.
Osborne, J. W., Costello, A. B., & Kellow, J. T. (2008). Best Practices in Exploratory Factor
Analysis. In J. W. Osborne (Ed.), Best Practices in Quantitative Methods (pp. 205-213).
Thousand Oaks, CA: Sage Publishing.
Oz, E. (2005). Information technology productivity: in search of a definite
observation. Information & Management, 42(6), 789-798.
Pallant, J. (2013). SPSS survival manual. (5th ed.) McGraw-Hill International.
Patil, S., & Wongsurawat, W. (2015). Information Technology (IT) Outsourcing by Business
Process Outsourcing/Information Technology Enabled Services (BPO/ITES) Firms in
India--A Strategic Gamble. Journal of Enterprise Information Management, 28(1).
PCI Security Standards Council. (2011). PCI DSS Tokenization Guidelines. Retrieved from
https://www.pcisecuritystandards.org/documents/Tokenization_Guidelines_Info_Supple
ment.pdf
PCI Security Standards Council. (2012). Point-to-Point Encryption (P2PE), Retrieved from
https://www.pcisecuritystandards.org/documents/P2PE_v1_1_FAQs_Aug2012.pdf
PCI Security Standards Council. (2013). PCI DSS v3.0. Retrieved from
www.pcisecuritystandards.org/documents/pci_dss_v2.pdf

97
Pizam, A. (Ed.). (2005). International encyclopedia of hospitality management. Routledge.
Porter, M. E. (1985). Competitive Advantage: Creating and Sustaining Superior Performance.
New York: Free Press.
Prasad, M., Scornavacca, E., & Lehmann, H. (2005). Using wireless personal digital assistants in
a restaurant: impact and perceived benefits. InMobile Business, 2005. ICMB 2005.
International Conference on (pp. 69-74). IEEE.
Prochaska, F. J., & Schrimper, R. A. (1973). Opportunity cost of time and other socioeconomic
effects on away-from-home food consumption. American Journal of Agricultural
Economics, 55(4 Part 1), 595-603.
Redman, B. J. (1980). The impact of women's time allocation on expenditure for meals away
from home and prepared foods. American Journal of Agricultural Economics, 62(2), 234-
237.
Rehman, S., & Coughlan, J. (2013). An efficient mobile payment system based on NFC
technology. Int. Sci. Index, 7, 1702-1706.
Riggs, N. (2013). Social media and your POS: The search for Bigfoot. Fast Casual. Retrieved
from http://www.fastcasual.com/blogs/social-media-and-your-pos-the-search-for-bigfoot/
Rosenberg, N., & Frischtak, C. R. (1984). Technological innovation and long waves. Cambridge
Journal of Economics, 7-24.
Ruggless, R., (2003). Industry execs, educators seek ways to boost customer counts. Nation’s
Restaurant News December 15, 37(50)
Ruth, D., Brush, T. H., & Ryu, W. (2015). The use of information technology in the provision of
HR compensation services and its effect on outsourcing and centralization. Journal of
Purchasing and Supply Management, 21(1), 25-37.
Rylander, R. G., Propst, D. B., & McMurtry, T. R. (1995). Nonresponse and recall biases in a
survey of traveller spending. Journal of Travel Research, 33 (4), 39–45.
Sambamurthy, V., Bharadwaj, A., & Grover, V. (2003). Shaping Agility through Digital
Options: Reconceptualizing the Role of Information Technology in Contemporary Firms.
MIS Quarterly (27:2), pp. 237 - 263.
Satran, J. (2013, January 23). Credit Cards And Restaurants: Industries Mull 'Cashless' Dining
Consequences. Retrieved from http://www.huffingtonpost.com/2013/01/23/credit-cards-
restaurants-cashless-dining_n_2482242.html
Schumpeter, J. A. (1934). The theory of economic development. Cambridge, MA: Harvard
University Pres.
Schumpeter, J. A. (1939). Business cycles (Vol. 1, pp. 161-74). New York: McGraw-Hill.
Scornavacca, E., Prasad, M., & Lehmann, H. (2006). Exploring the organisational impact and
perceived benefits of wireless Personal Digital Assistants in restaurants. International
Journal of Mobile Communications, 4(5), 558-567.
Siguaw, J., Enz, C., & Namasivayam, K., (2000). Adaptation of information technology in US
Hotels: Strategically driven objectives. Journal of Travel Research 39(2), 192–201.
Sledzik, K. (2013). Schumpeter’s View on Innovation and Entrepreneurship.Management Trends
in Theory and Practice,(ed.) Stefan Hittmar, Faculty of Management Science and
Informatics, University of Zilina & Institute of Management by University of Zilina.
Sonnenshein, M., (2014, October 06). Digital signs in restaurants offer surprising benefits.
Gourmet Marketing. Retrieved http://www.gourmetmarketing.net/digital-signs-
restaurants-offer-surprising-benefits/

98
Sood, A. & Tellis, G. J. (2005). Technological Evolution and Radical Innovation. Journal of
Marketing,152-168.
Stepleton, T. (2012). Data Breach Cost. Retrieved from
http://www.zurichna.com/internet/zna/sitecollectiondocuments/en/products/securityandpr
ivacy/data%20breach%20costs%20wp%20part%201%20%28risks,%20costs%20and%20
mitigation%20strategies%29.pdf
STR Analytics. (2014). HOST Almanac Highlights 2014. Retrieved from
http://www.str.com/Media/Default/Samples/HOSTAlmanac_Highlights.pdf
Tabachnick, B. G., & Fidell, L. S. (2013). Using multivariate statistics (6th ed.). Boston, MA:
Allyn and Bacon.
Tanning, L., & Tanning, T. (2013). How the Baltic States Transportation Companies Survived
the Economic Crisis: The Lessons of Crisis. International Journal of Operations and
Logistics Management, 2(4), 14-32.
Tanning, T., Saat, M., & Tanning, L. (2013). Kondratiev wave: overview of world economic
cycles. Global Business and Economics Research Journal, 2(2), 1-11.
Tesone, D. V. (2005). Hospitality information systems and e-commerce. John Wiley & Sons, Inc.
Thompson, B. (2004). Exploratory and confirmatory factor analysis: Understanding concepts
and applications. American Psychological Association.
Thompson, S., Ekman, P., Selby, D., & Whitaker, J. (2014). A model to support IT infrastructure
planning and the allocation of IT governance authority.Decision Support Systems, 59,
108-118.
Tichy, O. (2011). Schumpeterian business cycles: past, present and future. Economics &
Management, 16.
Tijhuis, L., Brattli, B., & Sæther, O. M. (2002). A geochemical survey of topsoil in the city of
Oslo, Norway. Environmental Geochemistry and Health, 24(1), 67-94.
Trustwave. (2014). 2014 Trustwave Global Security Report. Retrieved from
https://www2.trustwave.com/rs/trustwave/images/2014_Trustwave_Global_Security_Rep
ort.pdf
U.S. Bureau of Economic Analysis. (2014a). Personal Consumption Expenditures by Type of
Product. Retrieved from
http://www.bea.gov/iTable/iTable.cfm?ReqID=9&step=1#reqid=9&step=3&isuri=1&90
3=70
U.S. Bureau of Economic Analysis. (2014b). U.S. Bureau of Economic Analysis, Annual Input-
Output Tables. Retrieved from
http://www.themanufacturinginstitute.org/~/media/A3407E22FF1D4177B3AA203227E0
C841.ashx
U.S. Bureau of Economic Analysis. (2015). Gross Domestic Product. Retrieved from
http://www.bea.gov/iTable/iTable.cfm?ReqID=9&step=1#reqid=9&step=3&isuri=1&90
3=5
U.S. Bureau of Labor Statistics. (2012). Travel expenditures, 2005–2011: spending slows during
recent recession. Beyond the Numbers, Vol. 1 No. 20, p. 1. Retrieved from
http://www.bls.gov/opub/btn/volume-1/pdf/travel-expenditures-2005-2011-spending-
slows-during-recent-recession.pdf
U.S. Department of Agriculture. (2014). Food Expenditures. Retrieved from
http://www.ers.usda.gov/topics/food-choices-health/food-consumption-demand/food-
away-from-home.aspx

99
U.S. Department of Labor. (2014). Women in the Labor Force: A Databook. Retrieved from
http://www.bls.gov/cps/wlf-databook-2013.pdf
Walker, J., & Maddan, S. (2008). Statistics in criminology and criminal justice: analysis and
interpretation. Jones & Bartlett Learning.
Walker, J.R., (2014) The restaurant: From concept to operation (7th ed.). Hoboken, NJ: John
Wiley & Sons, Inc.
Weill, P. (1992). The relationship between investment in information technology and firm
performance: A study of the valve manufacturing sector. Information systems
research, 3(4), 307-333.
Wester, J. (2013, January 28). Starbucks still feeling a buzz from mobile payments. Retrieved
from http://www.fastcasual.com/news/starbucks-still-feeling-a-buzz-from-mobile-
payments/
World Travel Organization Tourism Highlights. (2014). UNWTO Tourism Highlights 2014
Edition. Retrieved from
http://dtxtq4w60xqpw.cloudfront.net/sites/all/files/pdf/unwto_highlights14_en_hr_0.pdf
Writing, A. (N.A.). Organizational uses of a PDA. Small Business. Retrieved from
http://smallbusiness.chron.com/organizational-uses-pda-455.html
Wyckoff, D.D., & Sasser, W.E. (1978) The Chain Restaurant Industry. Lanham, MD: Lexington
Books.
Xiong, W., & Luo, Y. J. (2012). A Study of IT Productivity Paradox in Luxury Hotels: A Case
Study in Guangzhou [J]. Tourism Tribune, 4, 015.
Yen, S. T. (1993). Working wives and food away from home: the Box-Cox double hurdle
model. American Journal of Agricultural Economics, 75(4), 884-895.
Yong, A. G., & Pearce, S. (2013). A beginner’s guide to factor analysis: Focusing on exploratory
factor analysis. Tutorials in Quantitative Methods for Psychology, 9(2), 79-94.

100
APPENDIX A:
Letter of Permission from the Current Holder of the Data


