AN ASSESSMENT OF ASSOCIATIONS BETWEEN FUNCTIONAL ABILITY,
NUTRITION, AND DENTITION IN HOMEBOUND OLDER ADULTS
by
DENISE M. DeSALVO
A THESIS
Submitted in partial fulfillment of the requirements for the degree of Master of Science
in the Department of Nutrition in the Graduate School of
The University of Alabama
TUSCALOOSA, ALABAMA
2010

Copyright Denise M. DeSalvo 2010 ALL RIGHTS RESERVED

ii
ABSTRACT
The relationship between nutrition, oral health, and functional ability has not been well
investigated. The purpose of this research was to examine the associations between functional
ability, dentition status, and the intake of specific dietary components in a group of homebound
older adults. This cross-sectional study was a secondary analysis of data from a longitudinal
study investigating causes of under eating in homebound older adults.
Descriptive statistics, correlation and linear regression analyses were conducted.
Participants’ baseline physical function summary score, a proxy measure for functional ability,
was the dependent variable. Mean dietary intakes of energy, protein, calcium, phosphorus,
vitamin C, vitamin D, vitamin K, and the mean oral health index summary score were the
independent variables. Average age of the 230 participants was 79.1 ± 8.6 years. The study
population was 79% female, 62% Caucasian, and 38% African American.
Statistical analysis revealed that physical function was significantly (p < .05) correlated
with participants’ oral health score and vitamin K intake. The oral health score was a single
number representing an assessment of multiple factors including chewing, swallowing, pain, dry
mouth, denture use, and number of remaining natural teeth. A lower oral health summary score
was indicative of better overall oral health. Therefore, the negative association between the
physical function score and oral health score meant that as physical function improved oral
health improved and vice versa. The oral health score and vitamin K intake were also the only
variables to significantly predict physical function in the final linear regression.

iii
These results provide interesting insight into the impact of nutrition and dentition on
homebound older adult functional ability and offer guidance for future research. This study
highlights a need for additional research especially in the homebound segment of the older adult
population to better understand the scope of their needs. There is also a need for consistency in
defining, measuring, and researching older adult functional ability. Finally, future research must
be carefully designed to provide useful results that address homebound older adult nutritional,
dental, and functional needs, and their quality of life.

iv
LIST OF ABBREVIATIONS AND SYMBOLS
p Probability associated with the occurrence under the null hypothesis of a value as
extreme as or more extreme than the observed value
α Value that defines the limits for rejecting a null hypothesis
g Gram, a unit of measure of weight
H01 Hypothesis 1
kcal Kilocalories, a unit of measure of energy
mg Milligram, a unit of measure of weight
mcg Microgram, a unit of measure of weight
< Less than
> Greater than
≤ Less than or equal to
≥ Greater than or equal to
= Equal to
± Plus or minus a value
% Percent

v
ACKNOWLEDGMENTS
I would like to take this opportunity to thank my colleagues, friends, and University of
Alabama faculty members who have helped me with this research project. I am most grateful to
Dr. Jeannine Lawrence, my thesis advisor, for sharing her knowledge, experience, and research
expertise regarding older adult nutrition. I would also like to thank all of my committee
members, Dr. Olivia Kendrick, Dr. Yasmin Neggers, and Dr. Jen Nickelson for their support and
input, and for the knowledge they have imparted in my progress toward this academic goal. I
would also like to thank Dr. Julie Locher for sharing her research, thereby allowing me the
opportunity to conduct this thesis research.
This research would not have been possible without the support of my friends and family.
Specifically, I wish to thank Deborah, Byron, and Michelle. In every circumstance each of you
listened to my concerns, offered continual encouragement, and always seemed truly interested in
my work. While I have gained much in this process, I realize how much more there is to know.
I consider myself fortunate to have experienced this process--it has truly been an experience of a
lifetime. Thank you all very much.

vi
CONTENTS
ABSTRACT ................................................................................................ ii
LIST OF ABBREVIATIONS AND SYMBOLS ...................................... iv
ACKNOWLEDGMENTS ...........................................................................v
LIST OF TABLES .................................................................................... vii
LIST OF FIGURES ................................................................................. viii
1. INTRODUCTION ...................................................................................1
2. LITERATURE REVIEW ........................................................................5
3. METHODS ............................................................................................31
4. RESULTS ..............................................................................................36
5. DISCUSSION ........................................................................................42
REFERENCES ..........................................................................................48
APPENDIX ................................................................................................55

vii
LIST OF TABLES
1. Demographic Data .................................................................................38
2. Physical Function Score and Dietary Intake Data .................................39
3. Oral Health Quality of Life Information ................................................40
4. Correlational Analysis of Physical Function, Oral Health, and Diet .....41
5. Final Regression Model – Physical Function as Dependent Variable ...41

viii
LIST OF FIGURES
1. Pathways for Oral-Nutrition Relationship .............................................26

1
CHAPTER 1
INTRODUCTION
For the last thirty years the Surgeon General’s Office has directed the United States’
national public health policy through the Healthy People reports. Improving the length and
quality of life is one of the two primary public health goals set forth in the most recent report,
Healthy People 2010.1 “Quality of life reflects a general sense of happiness and satisfaction with
our lives and environment. General quality of life encompasses all aspects of life, including
health, recreation, culture, rights, values, beliefs, aspirations, and the conditions that support a
life containing the elements.”1(p. 10) However most Americans rate their quality of life based on
their individual physical health status and their ability to function independently.2 A negative
trend in data from the National Center for Chronic Disease Prevention and Health Promotion of
the Centers for Disease Control and Prevention (CDC) suggests the nation is headed in the
wrong direction. From 1993 to 2007 there were annual increases in the percentage of Americans
reporting poor health or limited physical activity.2 Examples of factors that influence physical
health and functional independence include chronic illnesses and diseases, like diabetes and
arthritis, disability due to physical or mental limitations, inadequate nutrition, and poor oral
health.2
Longevity poses a great challenge to the quality of life goal of Healthy People 2010. The
longer a person lives, the more likely it is that they will be diagnosed with a chronic illness. As a
result of their longevity, older adults (persons 65 years of age and older) tend to have higher rates
of chronic illness and functional limitation than other age groups in the United States (US)

2
population. It is the combination of chronic illness and age-related changes, such as changes in
oral health, vision, and hearing that causes health and functional decline which subsequently
decreases the quality of life for many in this group.3
The rapidly growing older adult segment of the population is primarily comprised of
aging baby-boomers (persons born after the end of World War II from 1946-1964).3 This
generation of older adults continues their legacy of challenging established norms within the
society. A prime example of this is the 24% decline in nursing home residency rates that has
occurred over the last 19 years, despite the growing number of older adults.3 Today, instead of
choosing to reside in nursing homes, as many of their predecessors have done, many older adults
are choosing to age in place [italics added]. The term aging in place means that older adults
remain living where they have lived most of their adult years, in a non-healthcare environment
with access to the products and services they need so they do not have to move when their
circumstances change.4
As the number of older adults living in their homes increases, the number of homebound
older adults [italics added] within this segment of the population also increases. While there
may be many reasons an older adult is homebound,5 the medical perspective of a homebound
older adult is a person who may be recovering from surgery or who is being treated for an illness
or receiving long-term therapeutic medical services at home rather than in a hospital or nursing
home; medical care for this individual is directed by a physician, delivered by a home health care
company, and paid for by Medicare.6 A homebound individual is not necessarily bed-bound, but
usually has difficulty performing one or more activities necessary for independent functioning.6,7
This trend to remain living at home in familiar surroundings is forcing changes to the
way health care services are delivered, creating a pressing need to improve and develop
treatment interventions to slow or prevent health declines in older Americans.4 In order for

3
homebound older adults to experience a good quality of life, strategies that delay the
development of chronic illnesses and physical disability must be developed. Preventive
measures, focusing on good nutrition and oral health with effective interventions, are central to
such health and wellness efforts.
A review by Amarantos and colleagues8 provided an overview of the relationships
between nutrition, functional status, and quality of life in an older adult. They explained that
older adults might change their dietary intake because of diminished senses of taste and smell,
oral health, and digestive problems. A sub-optimal nutritional intake impacts physical stamina
and ability, often causing weakness, which results in the inability to function independently,
thereby leading to disability. Although the real-life experiences of older adults are more
complex than the example, the review showed the interconnectedness of oral health, nutrition,
functional status, and quality of life.8 Research results from studies specific to homebound older
adults revealed that 27% had inadequate intakes of six or more nutrients,9 and there were
significant associations between lower extremity physical performance (a measure indicative of
functional ability), nutrient intake, and body mass index (BMI).10 Physical performance declined
with lower nutrient intakes and higher BMI scores.10 With respect to oral health, it has been
shown that homebound older adults with higher body weights tended to have no chewing or
swallowing problems; this finding was consistent with earlier research showing a relationship
between dental disease and poor nutrition in older adults.11 In contrast, an investigation of factors
associated with under-eating in homebound older adults showed that neither oral health nor
functional status significantly contributed to under-eating.5 So, while it appears that both
nutrition and oral health play pivotal roles in the functional ability of homebound older adults,
research involving all three factors is limited. The purpose of this research was to evaluate the
significance of relationships between dietary intake, oral health, and functional ability in a group

4
of homebound older adults. Such findings offer the potential for future developments to improve
the quality of life within this segment of the older adult population.
RESEARCH OBJECTIVE & HYPOTHESES
The objective of this research was to determine if there are any associations between
functional ability, oral health status, and dietary intake of select nutrients in a group of
homebound older adults. The goal was to identify significant correlations among the variables
and identify those that predicted functional ability level. The select nutritional variables that
were investigated included: energy, protein, calcium, phosphorus, vitamin C, vitamin D, and
vitamin K. The research addressed the following questions:
1. Are there any significant associations between functional ability and oral health status
and dietary intake of select nutrients in a group of homebound older adults?
2. Which, if any, variables predict functional ability?
The research hypotheses that were tested were as follows:
H01: There are no significant associations between functional ability level and oral health
status or nutrient intake levels in a group of homebound older adults.
H02: There are no study variables that significantly predict functional ability level.

5
CHAPTER 2
LITERATURE REVIEW
The longevity of the rapidly growing older adult segment of the US population presents a
significant challenge to the goal of improving or increasing quality of life set forth by Healthy
People 2010.1 Quality of life is a subjective measure of each individual. Quite simply, the longer
a person lives the more likely it is he or she will be diagnosed with a chronic illness or disease
that will negatively affect their health. An older adult whose health has declined such that they
no longer function independently is more likely to report dissatisfaction with their quality of
life.8 Limitations in functional ability significantly impact older adult quality of life. In 2005,
more than 40% of adults over the age of 65 reported some kind of limitation in their functional
ability.3 Falls and chronic health conditions can cause a wide range of physical disabilities and
are two factors frequently associated with older adult functional limitation and decline. Changes
in oral health, vision, and hearing also contribute to decreasing functional independence and
decline.3 Tooth loss is often considered a natural part of aging, but that is not quite true because
the detection and treatment of oral health problems that cause tooth loss may delay or prevent
edentulism.3 In 2006, about half of older men and one-third of older women reported problems
with their hearing; 20% of adults over the age of 65, and 30% of those over the age of 85
reported some kind of vision problem.3 However, current Medicare insurance coverage does not
extend to hearing, vision, or dental services. The only way older adults can obtain new glasses or
hearing aids or receive routine dental treatment is to pay for such services out of their private

6
funds. In many cases, older adult family members, charitable organizations, and/or community
agencies pay for these non-Medicare covered services.3
In the last 20 years, as the number of older adults with chronic health problems and
functional limitations has increased, there have been changes in the way these older adults
receive health care services. Traditionally, when an older adult required long term medical care
or rehabilitative treatment, such as speech, physical or occupational therapy, these services were
provided in a rehabilitation hospital or nursing home. The emerging trend has been for older
adults to receive on-going medical care at home, causing an increase in the number of
homebound older adults within the older adult population. In a medical context, a homebound
older adult is one who is receiving health care services at home rather than in a hospital or
nursing home; medical care for a homebound older adult is directed by a physician, delivered by
a home health care company, and paid for by Medicare.6 A homebound person does not have to
be bed-bound, but is usually limited in his or her ability to perform one or more of the activities
required to live independently. Some examples of the types of activities necessary for
independent living are: being able to shop for food and prepare meals, being able to transfer
from the bed to the chair, and being able to dress oneself.6,7 The 2000 Census estimated roughly
23% of adults over the age of 65 had at least one physical disability that made it difficult to leave
their home, and as age increased, the number of disabilities also increased.12 As more older
adults choose to age in place, which is interpreted as living where they have lived for years in a
familiar, non-institutionalized setting, the number of homebound older adults is expected to
increase.4 This growing segment of the older adult population has not been well studied and there
are many unknowns, especially with respect to “increasing the quality and years of healthy life,”
a primary goal of Healthy People 2010.1(p. 2) The following literature review focuses on current
research that examines the relationships between functional ability, nutrition, and oral health.

7
Special attention is given to research investigations that are specific to the homebound segment
of the older adult population.
PREVALENCE
A recent government report revealed that in 2006 there were about 37 million adults over
the age of 65, comprising roughly 12% of the total US population. There are projections this
number will double to as many as 71 million, or 19% of the US population by 2030, when the
baby-boomers start to turn 65 years old.3,13 After 2030, the number of people over the age of 65
will level off, while the number of those 85 years of age and older will increase because of the
aging baby-boomers.
The group of homebound older adults is a segment within the older adult population. The
number of older adults who receive home health care services under the Medicare insurance
benefit determines their prevalence in the population. There were 2.8 million homebound within
the older adult population in 2004.14 Although the homebound represent less than 10% of the
older adult portion of the population, a 2006 Congressional Report revealed that the annual 6%
growth in the number of homebound from 2003 to 2004 outpaced the growth of the entire older
adult portion of the population during the same time period.15
FUNCTIONAL ABILITY
Functional ability is a term with several synonyms including functional status and
functional capacity. The term relates to a person’s physical and mental ability or capacity to
independently carry out their daily life routine.8 Since independent function encompasses several
domains (cognitive, physical, and social), there is wide variety among the tools used to measure
this indicator. However, it is most often measured in terms of a person’s ability to perform tasks
that are categorized as either instrumental activities of daily living (IADLs) or activities of daily
living (ADLs). Tasks in the IADL group consist of light housekeeping, using the telephone,

8
grocery shopping, and cooking; those in the ADL group are those tasks that support basic
survival, consisting of eating, bathing, toileting, walking, dressing, and getting in or out of a
chair.6,8 In addition to ADLs and IADLs, five very important measures of physical ability
contribute greatly to older adult functional independence. These include the ability to: stoop and
kneel, reach over head, write, walk 2-3 blocks, and lift 10 pounds. In 2005, 32% of older women
were unable to perform at least one of these physical tests compared to only 19% of older men.3
Research suggested that physical decline, combined with changes in cognition and environment,
lead to decreased ability to perform ADLs and IADLs, which lead to disability. The pattern of
decline had a tendency to be cyclic rather than linear, the overall trend with time was reduced
function and increased sedentary activity, causing functional decline which lead to increased risk
for falls and injury.16
Although arthritis affects close to 59% of older adult men and women and is the primary
health condition associated with functional limitations in older adults, falls are the single biggest
cause of functional impairment and decline.3 Falls are also the leading cause of injury death for
adults over the age of 65.3,17,18 From their analysis of the 2006 Behavioral Risk Factor
Surveillance System (BRFSS) survey data, experts from the CDC estimated that roughly 1.8
million (5%) of older adults experienced some type of fall-related injury in 2006.18 Falls cause
most of the non-fatal injuries for older adults and are the reason for most trauma-related hospital
admissions. Fall-related hospitalizations occur five times more frequently than any other reason
for hospitalization in this age group17 because 10 to 20% of fall-related injuries result in either
fracture or head trauma.19 Hip fracture is the most serious fall-related injury. Data from research
conducted in the early 1990s showed that of all the older adults hospitalized for hip fracture, only
50% were able to return to their homes or live independently after their fall.17 The trauma was so
severe in the remaining group of older adults hospitalized with hip fracture, they never regained

9
their former level of function and had to either move in with family or into a nursing home or
other type of institutional setting.17
Falls research data revealed there were numerous risk factors for falls in older adults; the
list included, but was not limited to: older age, female gender, history of previous falls, lack of
physical activity, use of multiple medications, depression, lower extremity weakness, vision
impairment, and gait imbalance.16,17,19,20 Evidence from a very small study with 30 homebound
subjects, showing that the balance ability of fallers was no different from the balance ability of
non-fallers, suggested that being homebound was a potential cause of older adult falls.16 In a
recent study investigating the consequences of falling, researchers found a significant association
between female gender and all measured consequences of falls, including increased health care
utilization and decreased functional ability.21
Runge and Hunter22 advocated that older adult functional decline could be delayed if an
easy-to-administer, research-based fall risk assessment of older adults could be developed and
incorporated into older adult medical check-up examinations.22 The reviewers supported the idea
of annual assessment so that interventions could be implemented to prevent falls to delay, reduce
and possibly prevent older adult functional decline. In their review, they cited mobility as the
single most predictive measure of functional decline. “Locomotor limitations are consistently
and strongly correlated with falls, hip fractures, frailty, immobility and disability, which are all
intertwined in a common pathogenic pathway.”22(p. 167) They proposed the idea that “locomotor
falls” are a “pre-cursor to disability,” and are, “simultaneously the cause, consequence and early
indicator of the disabling process.”22(p. 167) The relationship between locomotion, muscle function
and osteoporosis is explained in the following sentence: “Whereas limitations of muscle power
generate falls, decreased loading of bones, i.e., decreased muscle force, determines reduction of
bone strength.”22(p. 167) These relationships between muscle function, mobility and bone health

10
revealed the importance of the “muscle-bone-unit” in older adult functional ability and supported
the reviewer’s idea of making fall risk assessment a routine part of older adult medical care.22
A different research review presented strong, positive evidence that physical activity
improved older adult muscle strength, balance and coordination—important factors that
contribute to fall avoidance.23 The evidence that physical activity reduced the number of falls
was inconsistent; data revealed that physical activity “seemed” to reduce the number of falls
among community dwelling older adults, but not among institutionalized older adults. The
authors suggested the reason for the difference was that the institutionalized older adults were
too sick or too high risk to participate in physical activities.23
A psychological component accompanies the physical component of falling. This
psychological impact of falling extends to both older adults who fall and those who do not fall.
Both groups can and do develop a fear of falling (FOF) causing many to limit their activities,
which reduces their mobility and physical fitness level resulting in increased risk for falling.
Older adults’ FOF combined with mobility and physical fitness declines lead to reduced social
and physical functioning, which negatively impacted their health causing a diminished quality of
life.19 Several longitudinal studies documented associations between older adult FOF and
functional ability, and some also uncovered associations with nutrition.24-26
The InCHIANTI study was a large epidemiological study, conducted in the Chianti
region of Italy, investigating issues related to aging and disability in a cohort of older men and
women.24 The goals of the study by Deshpande and colleagues24 were to evaluate how much
older adults restricted their activities due to their FOF, and to determine if participants’ FOF was
associated with either their self-reported disability or study-measured decline in physical
performance after 3 years.24 At baseline, ADL measures were similar for all study participants
and only the 15% who severely restricted their activity due to FOF had significantly worse IADL

11
and physical performance measures.24 At the three-year follow-up, there was evidence of decline
in ADLs, IADLs, and physical performance tests for all participants.24 Multivariate analysis,
controlling for age, sex and BMI revealed that severe activity restriction was a significant
independent predictor of both ADL disability and decline in physical performance. The analysis
also showed that both moderate and severe activity restriction were significant independent risk
factors for IADL decline.24 Similar findings of significance between mobility deficits and older
adult FOF were documented in a large Australian study, which also found new onset FOF with
advancing age.25 In contrast, Martin and colleagues26 evaluated activity limitation, FOF, and
functional capacity in a cohort of young-old [italics added] female study participants who had
been followed for 11 years; average age was 64.2 ± 6 years.26 Study results revealed a significant
association between activity limitation due to FOF and both mild and moderate reductions in
functional ability in 10% of study participants.26 These research findings support the importance
of physical activity and mobility to functional ability level, regardless of age. Because falls and
fear of falling reduce older adult activity and mobility, functional decline results. Accompanying
problems with nutrition and oral health further exacerbate this decline.
As with most living things, humans require an energy source for basic function and
survival. Food provides that energy source in the form of calories derived from the
macronutrients: proteins, fats, and carbohydrates. Food is also a source of micronutrients,
vitamins and minerals, each of which has a specific functional or structural role in human
growth, development, and maintenance. Quite often, older adults have a sub-optimal dietary
intake because of economic, social, environmental, medical, and/or physical reasons.5 While
dietary intake is modifiable and research has shown that nutritional status can be improved with
interventions such as Meals on Wheels and between-meal supplements, improved nutritional
status does not necessarily translate into improved older adult functional ability.8,27 Nutrition

12
research continues in an effort to reveal the mechanisms or nutrients that may cause the
development of certain chronic illnesses and functional changes that occur as part of the aging
process.27 The following section reviews select macro- and micronutrients pertinent to older
adult health and function in more detail.
NUTRITION
For the past several decades much of the research investigating functional ability and
nutrition focused on falls, fractures, osteoporosis, and bone health.17,19 As a result, there is an
abundance of information on select macro- and micronutrients because of their relationship to
specific health issues or functional conditions. The following is a brief overview of the role and
function of select nutrients pertaining to this thesis research including: energy (kilocalories),
protein, calcium, phosphorus, vitamin C, vitamin D, and vitamin K.
Energy: All foods, with the exception of some beverages, yield energy in the form of
calories obtained from proteins, fats, and/or carbohydrates. Energy is necessary to sustain
human life, because it is necessary for the growth, development, maintenance, and repair of all
the tissues that make up the human body. The human body is comprised of lean tissue (muscle
and bone), fat tissue, and water; the combination of these components determines body weight.28
In order to have a good or optimal level of function, a person must maintain an adequate and
balanced intake of energy to support his/her skeletal and muscular function. For example,
research revealed a positive association between bone mineral density (BMD) and body weight,
noting increases in BMD with weight gain and decreases in BMD with weight loss.29
Researchers believed the gains and losses were the result of weight bearing forces on the
skeleton. Anorexia nervosa is a condition in which low body weight causes decreased BMD.
With anorexia nervosa, intake of most nutrients is inadequate and osteoporotic fractures are
common due to very low BMD.29

13
The relationships between energy intake, body weight, and muscle function in older
adults are complex and usually quite different from children and young adults. Sometimes, as
people age, energy intake declines, resulting in weight loss; weight loss can cause decreased
stamina and endurance, causing physical activity levels to decline as well. The combination of
weight loss and decreased physical activity causes reduced muscle mass and strength which can
cause mobility problems that lead to disability.16,28
Protein: Protein has several roles in human nutrition. It is a component of all human
cells, particularly bone and muscle.28 Appropriate protein intake plays a significant role in bone
health. Research is inconsistent with respect to the amount of protein in the diet and bone
demineralization increasing the risk for fracture.29 In their review, Ilich and Kerstetter 29 stated
that some studies showed positive associations between protein intake and BMD, while other
studies gave evidence of increased fracture rates among those eating high protein diets.
However, the evidence showing the detrimental effects of a low dietary protein intake is more
consistent.29 Low dietary protein intake, 0.7 to 0.8 grams/kilogram body weight, resulted in
decreased BMD; when supplemented with additional dietary protein, bone density improved,
showing a reduction in bone loss after one year.29 The suggested optimal level of intake in this
review is 1.0 to 1.5 grams of protein per kilogram of body weight.29
Protein is also especially important in older adult nutrition because of the condition
known as sarcopenia.30 “Sarcopenia is the involuntary decline in lean muscle mass, strength and
function that occurs with aging. Sarcopenia increases the risk of disability and loss of functional
capacity in the elderly…”30(p. 140S) While research has yet to determine the exact cause(s) for the
condition, poor nutrition and decreased mobility have been shown to be contributing factors.30
Muscle atrophy occurs when there is a disruption in the balance of synthesis and breakdown.30 In
their review, Dreyer and Volpi30 stated that research investigations attempting to demonstrate

14
improvements in older adult muscle mass and strength through the use of mixed nutrient
supplements have yielded differing results. The reviewers noted the research results revealed
that resistance training alone improved muscle mass and strength compared to resistance training
and administration of a mixed nutrient supplement. Dreyer and Volpi30 suggested the difference
in results was due to calories, explaining that in the study of resistance training and nutritional
supplement, the investigators reduced the total energy amounts by the number of calories
contained in the supplement so that participants’ total calorie intake did not increase. When a
follow-up study was conducted, increased energy was positively associated with improved
muscle mass and strength.30
In light of the above results and in attempt to determine if protein synthesis is affected by
nutrient composition, Dreyer and Volpi30 investigated the effects of amino acids only versus
amino acids and glucose together on young adult and older adult subjects. Their results in older
adults revealed that the administration of amino acids only increased muscle synthesis and had
no effect on muscle breakdown; however, when they administered a combination amino acid and
glucose supplement there was no protein synthesis, but protein breakdown was diminished
achieving a net response of improved protein balance due to a decrease in muscle catabolism.30
In younger adults, protein synthesis increased and breakdown was static.30 In discussing the
different responses between the two groups with the amino acid and glucose combination,
Dreyer and Volpi30 suggested a possible “age-associated disregulation in the response of muscle
proteins to insulin.”30(p. 143S)
Calcium: Calcium is the most widely distributed and abundant mineral in the human
body, serving several functional roles. Calcium’s primary role is to provide structure and
strength to the bones of the skeleton and to teeth. Ionized calcium circulates in body fluid and
serves an important function in muscle contraction. While a consistent and adequate dietary

15
intake of calcium is important throughout the lifecycle, research has shown that calcium intake is
extremely important for older adults because of the association with bone health and
osteoporosis.28
Calcium’s role in bone health and the development of osteoporosis in relation to falls and
fractures has been widely studied.29,31,32 The National Osteoporosis Foundation estimated there
were 10 million Americans with osteoporosis and another 34 million Americans who were at risk
for developing the disease due to low bone mass.33 The critical time for bone health is in older
adulthood when hormone levels of estrogen and testosterone decline and cease for women and
men respectively; 80% of those with osteoporosis are women.29,33
Phosphorus: Phosphorus is the second most abundant mineral in the human body, most
of which (85%), is found in the skeleton.29 Like calcium, phosphorus is found in all cells of the
body as part of the acid-base buffering system and as part of DNA and RNA, the nucleic acids
that drive cell development and growth.28 Phosphorus is available in a wide variety of foods
including most meats, fish, poultry, eggs, dairy, legumes and carbonated beverages.29,31 One
research review noted increases in dietary phosphorus over the past several decades because of
the increased use of phosphates in food processing, and the increased consumption of colas and
carbonated beverages.29 Reviews of the research on the effects of increased dietary intake of
phosphorus and the effect on calcium homeostasis have failed to show adverse effects on bone
health in either animal or human studies conducted in the United States.29,31,32 Similarly, research
on the potential negative effect of excess phosphorus on bones due to increased soda
consumption has been inconclusive. Research suggested the best explanation of how increased
dietary phosphorus intake from carbonated soda impacted bone health was the simple fact that
soda has replaced milk as a beverage choice, resulting in lowered dietary calcium intake.29,32,34,35
The concern regarding phosphorus intake in older adults is primarily in relation to its role in

16
bone structure and bone health and the association with osteoporosis, and the subsequent
associations with older adult falls and functional ability.
Vitamin D: Vitamin D in the active form of calcitriol (vitamin D3) plays a critical role in
calcium absorption and utilization in the body. Vitamin D functions in concert with parathyroid
hormone influencing bone turnover to maintain equilibrium in body calcium levels.29,31 With
sufficient exposure to sunlight, humans manufacture this vitamin, but levels can vary depending
on age, health status, season of the year, and geography. Food sources include fatty fish like
salmon, liver, fish-liver oils like cod-liver oil, and fortified foods such as milk, orange juice and
breakfast cereals.29,31 Results of vitamin D research studies and bone health have been mixed. In
the Study of Osteoporotic Fractures, Cumming and colleagues36 reported vitamin D
supplementation had no effect on fractures.36 In contrast, in a randomized, double blind trial,
older adult men and women in the vitamin D treatment group had lower fracture rates than those
in the placebo group.37
Several reviews documented research findings of improved lower extremity muscle
strength with increased serum levels of vitamin D; improved lower extremity muscle strength
was a fall prevention tactic for older adults.31,38 The reviewers also mentioned randomized
clinical trials in which there was a significant reduction in the number of falls when participants
received calcium and vitamin D together.31,38 While research has suggested that higher doses of
supplemental vitamin D decreases fracture risk in older adults, and the addition of calcium
improves the effect; increased intakes must be maintained over time for effectiveness, and older
adults still need to consume a nutrient rich diet of a variety of foods.31 The reviewers also noted
that vitamin D deficiency was a common problem for older adults, a growing public health
problem, because many were homebound or institutionalized and got little exposure to sunlight
to initiate vitamin synthesis in the skin and/or had inadequate diets. Results from several

17
randomized clinical trials indicated that the administration of high doses of vitamin D, either
daily or intermittently, was safe and beneficial in reducing the number of bone fractures in older
adults.31,38
Vitamin C: Vitamin C, also known as ascorbic acid, is a water-soluble vitamin with
multiple physiologic forms functioning both as an enzyme and as an antioxidant. A primary role
of vitamin C is in the formation of collagen, the protein matrix onto which calcium and
phosphorus bind during bone and tooth formation.28 Several research investigations have shown
positive associations between vitamin C intake and BMD. Prynne and colleagues39 evaluated the
BMD scores and dietary intakes of fruits and vegetables and nutrients of adolescent boys and
girls, young adult women, and older adult men and women.39 They found significant positive
associations between mineral content and fruit in adolescent boys, girls and older women.39
However, vitamin C was only significant in adolescent boys.39 And, although the association
with vitamin C was only found in boys, the evidence was strong enough to suggest a role for the
vitamin in bone health.39 Results from a longitudinal study of women showed that vitamin C and
several other nutrients were associated with reduced femoral neck bone loss.40 These and other
research results formed the basis for the recommendation that dietary intake meet the established
dietary reference intakes (DRIs) for this vitamin.31
Vitamin K: Vitamin K is a fat-soluble vitamin primarily involved in blood clotting. The
vitamin does have a role in the development of certain bone proteins; however, its exact role in
osteoporosis is unclear.28 One review of the research suggested the vitamin’s role was in the
carboxylation of the bone protein osteocalcin, noting research studies showed associations
between levels of serum vitamin K and fracture incidences.31 Other evidence suggested that
individuals with osteoporosis may exhibit vitamin K deficiency and that supplementation
improves bone status.41

18
FUNCTIONAL ABILITY AND NUTRITION RESEARCH
There are several important and noteworthy findings from investigations of nutrition and
functional ability. While both of these topics are broad and measured with a variety of tools,
research investigations tend to be very specific. Therefore, the following research review is
organized by study design. Results of investigations involving specific aspects of nutrition and
functional ability are explained within each study design sub-heading. Pertinent nutrition and
functional ability topics that are reviewed include but are not limited to: nutrient intake
associations with bone health and fracture risk measured as BMD, dietary intake and disability,
and the associations between body weight, physical activity levels, falls and FOF.
Cross-Sectional Studies: Calcium intake was an important factor of functional ability in
three of the four studies reviewed. In one study of Caucasian women evaluating the relationship
between intake of dietary nutrients and BMD, only energy, calcium, and protein were
significantly associated with BMD in individual factor and multiple regression analyses.42 In
another study of Caucasian women investigating BMD, body composition, calcium intake, and
physical activity, researchers found positive associations between calcium and hip BMD for the
entire group.43 The data revealed a positive association between level of physical activity and
BMD.43 It also showed that increasing age was associated with decreases in BMD and lean body
mass.43 In a large study of Brazilian men and women (average age 58), intakes of calcium,
vitamin D, magnesium, vitamin K, and vitamin A were all below the DRI amount while protein
and phosphorus were close to the recommended amount.41 Calcium, phosphorus, and magnesium
were significantly associated with fractures in women in this study and phosphorus intake was
independently associated with increased risk of fractures. The study reported, “…for every 100
mg of phosphorus intake the risk of fractures increases by 9%.”41(p. 5)

19
In a study examining differences between dietary and serum levels of ascorbic acid,
BMD, and fractures in men and women, dietary ascorbic acid was the only factor independently
associated with BMD in premenopausal women; there were no associations with fractures in
premenopausal women.44 Results for postmenopausal women were quite different. In
postmenopausal women with a history of smoking and estrogen use, serum ascorbic acid levels
were associated with a decrease in reported fractures.44 Conversely, in postmenopausal women
with no smoking or estrogen use, serum ascorbic acid levels were associated with lower BMD
levels.44 In men, both dietary and serum ascorbic acid levels were associated with BMD and
fracture report.44 The researchers noted the inconsistencies in their findings and emphasized the
need for further investigation.44
Longitudinal Studies: Two prospective studies revealed distinctively different results
with respect to calcium and fracture risk. In one study, calcium was a significant risk factor for
fracture of the arm and wrist.45 Calcium was not a risk factor for hip fracture in the other study,
nor was vitamin D, but dietary intake of animal protein was negatively associated with hip
fracture risk in the participant group of postmenopausal women.46
An investigation of the prevalence and risk factors associated with vitamin D deficiency
and disability in older adult women in the US revealed that 6% of higher functioning older
women and 12% of moderate to severely disabled older women had deficient blood levels of
vitamin D.47 Black race and older age were both significant risk factors for vitamin D deficiency
in the most disabled women.47 Significant risk factors in the higher functioning group included
black race, BMI ≥ 30, increased triceps skinfold thickness, winter season, and elevated serum
creatinine levels.47
Results of research investigating the association of vitamin D and fall and fracture risk
were very different. British researchers designed a study similar to one conducted in Finland, to

20
investigate the effectiveness of annual injections of vitamin D on reducing fractures in older
adults.48 Their study was a randomized, double-blind, placebo-controlled trial. Participants were
injected once a year with either placebo or a high dose of vitamin D2, ergocalciferol. Results
showed the vitamin D injections had no effect in reducing the number of falls or fractures in the
study population.48 The investigators postulated that the type of vitamin D used may have
contributed to the lack of significance in the results.48 Blood levels of ergocalciferol declined
faster than cholecalciferol, which suggested the problem was the type of vitamin D or possibly
the frequency of injection.48 Following a thorough discussion of other research, these authors
noted the overwhelming evidence that vitamin D alone was not effective in reducing falls or
fractures in older adults.48 Results of the study by Prince and colleagues49 supported this
conclusion. These investigators conducted a randomized, double-blind, controlled trial in a
group of Australian women with a history of falls.49 Participants consumed oral doses of vitamin
D2, ergocalciferol, and calcium or placebo for one year. Treatment revealed a significant
reduction in the percentage of participants experiencing one fall; treatment was not significant
for those with multiple falls.49 Treatment was also more effective in reducing falls that occurred
in winter when sun exposure is limited.49
Body weight, measured as BMI, was associated with decreased activity, mobility and
FOF in the Italian and the Australian studies with older adults.24,25 In the InCHIANTI study, 24%
of subjects were obese at baseline, with a BMI > 30. Factors associated with greater activity
restriction at baseline included higher BMI, symptoms of depression, poorer cognition and lack
of mobility. The longitudinal analysis three years later showed decline in participant ADLs,
IADLs, and physical performance tests, but because the researchers controlled for BMI in the
longitudinal analysis, there were no conclusions with regard to BMI and FOF from this study.24
In the Australian study, 24% of participants were obese at baseline, with BMI scores > 30, while

21
only 3.3% were underweight with BMI scores < 20.25 Approximately one-third of participants
had FOF at baseline; common factors associated with FOF were older age, living alone,
increased BMI, medications for depression and hypertension, cognitive impairment, slower
timed-up-and-go (TUG) score, poor balance, use of a walking aid, and little physical activity.25
At the three-year follow-up, almost half the cohort reported FOF, a 12% increase from
baseline.25 There was a significant association with BMI in the persistent FOF group; BMI and
TUG scores were both significantly associated as independent risk factors for developing new
FOF.25 These results were different from previous studies. The authors suggested a possible
explanation for the difference in results was due to the fact that their study was the first to
analyze BMI as a causal factor rather than a control variable.25
Studies with Homebound Older Adults: A cross-sectional study published in 2002
evaluated the adequacy of the dietary intake and highlighted important demographic and health
related associations to that intake for a group of 345 homebound older adult men and women
participating in a home-delivered meal program in North Carolina.9 The initial dietary analysis
revealed the entire study population had intakes below the recommended dietary allowance
(RDA) or adequate intake (AI) levels for energy, vitamin D, vitamin E, vitamin B6, folate,
calcium, magnesium, and zinc.9 Analysis by gender showed women had poorer intakes of more
nutrients compared to men overall.9 Arthritis was the most common health problem, reported by
78% of the group; osteoporosis was reported by 20% of the participants and was only reported
by women.9 More than half the sample population reported some kind of oral health problem,
chewing, swallowing, or mouth pain, but oral health was not a significant factor in the final data
analysis.9 The three health-related factors included in the multiple regression analysis because
they were significantly correlated with nutrient intake were: “diminished sense of taste, physical
limitation in meal preparation and consumption, and breakfast consumption.” 9(p. 1439) Of these

22
three, only breakfast consumption remained significantly associated with nutrient intake after
controlling for other variables.9 Skipping breakfast was significantly associated with lower
intakes of energy, protein, and 12 of 16 vitamins and minerals assessed in the study.9 Several
points made by the authors were noteworthy and of interest. First, the researchers contrasted the
inconsistency between participants’ dietary intakes to their participation in a community home-
delivered prepared meal program. Second, the authors expressed their concern regarding the
extremely low intakes of calcium and vitamin D, two nutrients that are very important in older
adult health. Third, they discussed potential benefits of breakfast as a second meal for inclusion
in a home-delivered meal program, especially for the homebound.9
The same researchers conducted another study in the same group of homebound older
adult men and women, investigating the relationship between dietary intake of calcium, vitamin
D, magnesium, and phosphorus, and lower body physical function.10 The investigators selected
these four nutrients because of their role in muscle function and bone health.10 The researchers
developed and validated the reliability of their summary musculoskeletal nutrient (SMN) score,
which was a three category variable of relative nutrient intake. Lower body physical performance
was assessed via tests measuring balance, walking speed, and the ability to stand up from a
sitting position, known as a chair stand. The researchers developed a combined score for
physical performance, which also was a three category variable. Obesity, evidenced by BMI ≥
30 and ≥ 35, was prevalent in the study population, especially among women.10 Arthritis was the
most common diagnosis affecting ADLs, and female study subjects frequently reported FOF.10 A
majority of study subjects consumed less than 70% of the recommended amount of calcium and
fewer than half the sample consumed the recommended level for vitamin D.10 Compared to men,
women had significantly lower mean and median relative intakes of calcium, vitamin D, and
phosphorus.10 According to the study results, significantly more women than men scored “worst”

23
on the physical performance tests; more women than men were also unable to complete the
physical performance tests.10 Overall results using multivariate analysis showed that the lowest
SMN intakes and highest BMI scores were significantly associated with worsening scores of
lower body physical performance; FOF was one of several health-related factors shown to have a
significant association with worsening lower body physical performance.10 The results of this
study were important because they revealed associations between dietary intake, body weight,
and physical performance and older adult functional ability and offered more specific direction
for future research.10
A one-year longitudinal study was designed using a random sample from this same group
of homebound older adults in North Carolina. The study was designed because of the growing
public health problem of obesity; the specific goal was to evaluate the effect of BMI on lower
body physical performance over time.50 At baseline, BMI ≥ 35 (Stage II Obesity) was
significantly associated with age, race, poor performance on lower body physical tests, and
several health conditions.50 Analysis at the one-year follow up showed the same BMI ≥ 35 level
increased the odds up to seven times for poor performance on the lower body physical tests and
for nursing home admission.50 The odds ratio for poor physical performance was also increased
by FOF, arthritis, stroke, and age.50 The results of this study were important in that they showed
the significance of a nutrition related factor (body weight) to older adult functional decline.50
ORAL HEALTH AND DENTITION
“The oral cavity serves three essential functions in human physiology: the production of
speech, the initiation of alimentation, and protection of the host.” 51(p. 1454) In a report to
Congress, the US Surgeon General suggested that oral health issues, like tooth loss, swallowing
problems, mouth pain, and periodontal infections are often considered a natural part of aging and
are frequently considered less important and separate from general health issues.52 There are

24
reports that many older adults will enjoy good general and oral health as they age, but the real
challenge will be providing good oral health care for those with poor health, those with limited
financial means, and certain sub-segments like the homebound.53 Thirty percent of adults over
the age of 65 take prescription and over-the-counter medications; 75-94% of these prescription
medications have an oral health side effect like dry mouth, altered taste perception, decreased
saliva flow, and increased risk for involuntary oral movement.53 An Institute of Medicine report
on functional independence and older adult health indicated that an older person’s ability to chew
and swallow without pain is a critical piece of information that is often overlooked by health care
providers and researchers alike when they are assessing older adult health.54 While oral health
and function often decline rapidly in older adults, thereby negatively impacting their quality of
life, often little if any attention is paid to oral health issues.51 The following comment from an
editorial on the 2000 Surgeon General’s Report on Oral Health, provides a good summary, “Oral
diseases should not be lifelong conditions that compromise quality of life. Poor oral health
affects mortality, general health, nutrition, digestion, speech, social mobility, employability, self-
image and esteem, school absences, quality of life, and well-being.”55(p. S82)
PREVALENCE
Edentulism, a condition in which a person has no natural teeth, is an oral health indicator
that is measured in the population. It is currently estimated that 23% of adults over 65 and 32%
of those over 85 have no natural teeth. When compared by income level, edentulism rates are
dramatically worse; 26% of older adults living above the poverty level and 39% living below the
poverty level report having no natural teeth.3 While these percentages represent large numbers of
individuals, edentulism rates continue to slowly decline because of advances in dental treatment
procedures and greater access to care.56 It is now more common for older adults to encounter
problems with dental caries (decay), periodontal (gum) disease, dry mouth, and oral cavity

25
lesions. It is estimated that caries affects roughly 50% of older adult natural teeth;56 dry mouth
or xerostomia is estimated in 30% of older adults and in 100% of those receiving radiation
treatment for head and neck cancers.57
FUNCTIONAL ABILITY AND ORAL HEALTH
Oral health status, dental service utilization and physical functioning ability are inter-
connected and, when evaluated together, explain individual behavior. Older adults with chronic
illnesses who are in poor general health are more focused on the medical issues that limit their
daily activities and generally do not seek dental care, so their oral health status is
questionable.58,59 In a randomized, prospective study of older adults in California, dental service
utilization was associated with declining functional ability.58,59 Poor physical health and
functional impairments are reasons many older adults do not visit the dentist; more than 10% of
older adults over the age of 75 need help with ADLs and IADLs.58,59 Fifty percent also report
limiting their physical activity levels due to chronic physical, mental, or emotional pain.
Limitations are higher among the poorest older adults.58,59 In contrast, older adults with natural
teeth are six times more likely to visit the dentist than those without teeth.59 So the advances in
dental treatment that occurred in the latter half of the twentieth century should result in older
adults retaining more of their natural teeth and experiencing improved oral health.59
ORAL HEALTH, DENTITION AND NUTRITION
“Oral health and nutrition have a synergistic bidirectional relationship. Oral infectious
diseases, as well as acute, chronic, and terminal systemic diseases with oral manifestations,
impact the functional ability to eat as well as diet and nutrition.”60(p. 1418) Unfortunately, nutrition
is not a routine part of regular dental care and other medical professionals do not routinely
address dental health issues, so many problems are not addressed or treated. Since older adults
are the fastest growing segment of the population, it is quite likely they will experience both oral

26
health and nutrition problems. Problems that are frequently observed are the loss of natural
teeth, use of partial or full dentures, chewing and digestion problems, and an inadequate intake of
calories, protein, and micronutrients.61 When combined, these can result in the loss of total and
lean body weight, osteoporosis, decreased mobility, functional decline and disability.61 Although
the amount of research is limited and many studies are cross-sectional in design, there is
evidence of a strong association between nutrition and oral health.60,62
In their research review, Ritchie and colleagues62 succinctly defined oral and nutritional
health and provided a conceptual model (Figure 1) to demonstrate the complexities of their
relationship and other factors that influenced outcomes.62
Figure 1. Pathways for Oral-Nutrition Relationship62 (Used with permission, Appendix A)
In the conceptual model the determinants of oral health are the health of the teeth, gums, and
jaw, along with the operational status of the salivary, taste, and pain functions in the oral cavity.

27
The determinants of nutritional health are diet quality, diet quantity, and individual nutritional
status, that is lean mass, fat mass, and serum nutrient levels.62 As the model shows, individual
human behavior is largely responsible for the outcome of these oral and nutritional factors. For
example, poor oral hygiene can lead to tooth loss causing chewing problems that can impact diet
quality, through the elimination of certain foods and their nutrients, and diet quantity, especially
if there is pain due to the tooth loss. From their review of studies, Ritchie and colleagues62
concluded the evidence suggested that tooth loss negatively impacted the nutrient quality of the
diet because of a decrease in the fruit and vegetable (often hard to chew) intake.62 Although in
this same review, Ritchie and colleagues62 documented finding mixed results regarding research
investigating the effect of dentures on nutritional intake, they noted that overall there was
evidence that wearing dentures resulted in a sub-optimal intake of multiple nutrients when
compared to not wearing dentures and having natural teeth.62 Similarly, their review of the
research regarding the impact of tooth loss and/or dentures on weight or BMI resulted in mixed
findings. However, Ritchie and associates62 did point out one study conducted in a community
dwelling population, in which having no teeth was an independent risk factor for significant
weight loss, a result that was sustained for over a year.62 The research review by Ritchie and
colleagues62 also included a review of studies involving other oral health problems such as
periodontal disease, xerostomia, and altered taste, but the only finding of note was the
association between dry mouth and poor dietary intake and lower body weight.62
ORAL HEALTH, DENTITION, AND NUTRITION RESEARCH
Cross-Sectional Studies: Analysis of the information from study participants completing
both the oral and nutritional examinations, n = 220, revealed an association between the number
of teeth or denture fit and nutrient adequacy and diet quality.63 Nutrient levels and diet variety
scores were lower in those with fewer teeth or with ill-fitting lower dentures compared to those

28
whose dentures fit or had their natural teeth. Specifically, intakes of protein, thiamin, riboflavin,
pantothenic acid, vitamin D, calcium, iron, magnesium and phosphorus were lower in subjects
with poor fitting lower dentures, and fewer of these subjects achieved adequacy in their intake of
vitamin B6, calcium, magnesium and phosphorus.63 Nutrient intake results were similar in a
larger study conducted in a younger cohort comparing nutritional intake with the number of
matching pairs of upper and lower back teeth.64 Participants with dentures and those with less
than 5 matched pairs had lower intakes of vitamin A, carotene, folic acid, and vitamin C; they
also had lower diet variety scores.64 Findings from both these studies and the earlier research
review confirm the associations between nutrition and dentition, highlighting the need for further
research to better understand how they impact older adult health and functional ability.
Longitudinal Studies: A one-year longitudinal study of 181 randomly selected older
adult men and women compared the nutritional intake and diet quality of those who reported
persistent chewing and swallowing problems to those who did not.65 A comparison of baseline
data to one-year follow up data revealed no significant differences in BMI, waist circumference,
or protein, fat, or carbohydrate intake in the two groups. Intake of vitamin A and dark yellow
and green leafy vegetables was lower in those with persistent chewing and swallowing problems;
this group also had lower diet variety scores, lower dietary fiber intake, and lower vitamins C
and B6 intake.65 A different one-year study compared dentition status to nutritional intake, body
weight and composition, and albumin and lipid levels by race.66 Findings revealed that 21% of
the total study sample were edentulous and most of those with no natural teeth wore dentures and
had more frequent complaints of chewing pain and decreased appetite.66 Overall analysis
revealed nutrient intakes above the recommended levels for all nutrients except vitamin E,
calcium, magnesium, and dietary fiber.66 When compared by dentition status, the edentate
consumed less than two-thirds of the recommended levels for most nutrients.66 Results also
29
showed no significant differences in weight status or weight change by dentition or race.
However, results did show that edentate participants were more likely to experience weight gain
over the course of the year than their dentate counterparts.66 There were also differences between
dentate and edentate subjects when compared by race. Among Caucasian participants, the
edentate had higher intakes of fat than their dentate counterparts, while there were no significant
differences in fat intake for African American participants.66 Although these two studies were
dissimilar in size and demographic characteristics, they both revealed a level of compromised
nutrient intake with impaired dentition warranting further research.
Studies with Homebound Older Adults: Fifty-four percent of the homebound participants
in a study investigating nutrient intake levels and individual characteristics and health factors
reported chewing problems, mouth pain, or swallowing problems.9 More women than men
reported swallowing problems, 30% to 11% respectively. In addition, 94% of participants who
reported no chewing issues had missing teeth, and 59% of those wore dentures and reported their
dentures did not fit properly. Sharkey and colleagues9 recognized that the oral health issues were
significantly high and suggested that further research was warranted to elucidate the impact of
oral health in homebound older adults.9
ORAL HEALTH, NUTRITION AND FUNCTIONAL ABILITY RESEARCH
Two of the studies reviewed revealed associations between oral health, nutrition, and
functional ability, the three areas pertinent to this research. The earlier of the two was a small
study of 49 homebound older adults, 94% of whom had BMI scores below 24, more than half
had oral health problems, and almost 20% had inadequate serum albumin levels.11 There was a
positive association between low albumin, older age, wearing of dentures, and ADL
dependence.11 Oral health problems were also associated with lower BMI levels, leading to the
conclusion that oral health impacted the nutritional status of homebound older adults.11 In their

30
research, Bartali and colleagues67 compared nutritional intakes to nutrition-related ADLs;
difficulty chewing was one of several nutrition-related ADLs in this study.67 Results showed that
intake of easy to chew foods that required little cooking, like soup, crackers, and Melba toast
were higher in the older age groups in this study. Multivariate analysis of the nutrition-related
ADLs showed that each was a predictor of inadequate energy intake and that chewing difficulty
was the strongest predictor for inadequate vitamin C intake in the study population.67 The
importance of the similarity in the findings between these dissimilar studies is the relationship
between oral health, nutrition and functional ability and their combined effect on the health and
well being of older adults.
The foregoing literature review reveals that current scientific research provides evidence
of associations between the three areas of interest pertinent to this investigation. However, very
few studies include all three areas, functional ability, nutrition, and dentition, or focus
specifically on homebound older adults, obviating the need for this thesis research. Methods of
the original study and the secondary analysis are explained in Chapter 3.

31
CHAPTER 3
METHODS This research was a secondary analysis of cross-sectional data derived from a
longitudinal study of factors associated with under-eating in homebound older adults conducted
by Locher and colleagues.5
DESIGN In the original study, trained interviewers conducted in-home visits with homebound
participants to administer study-related questionnaires, to obtain anthropometric data, and to
inspect food storage and preparation areas, including refrigerator space and service utensils.
During these home visits, participants completed an initial 24-hour dietary recall survey.
Interviewers conducted two subsequent 24-hour dietary recall interviews with participants by
telephone in the two weeks following the initial home visit; at least one day of the weekend was
included in the 24-hour recalls to ensure an accurate overall dietary intake was measured. All
other data were collected at baseline and two six-month follow-up intervals. The study was
reviewed and approved by the Institutional Review Board at the University of Alabama at
Birmingham prior to any study activity.5
This study, a secondary analysis of the baseline data from the study by Locher and
associates,5 investigated associations between functional ability, nutrition, and oral health in
homebound older adults. The study was a cross-sectional analysis of specific, select variables
from the original study. Review and approval by the Institutional Review Boards at both The

32
University of Alabama and the University of Alabama at Birmingham were received prior to any
data analysis in the current study.
SUBJECTS
Participants in the original study conducted by Locher and colleagues5 were 238
homebound older adult men and women in Birmingham, Alabama.5 All participants were
receiving home health care services as some participants had recently been discharged from the
hospital. To be eligible for the study, participants had to be living in the community in a private
residence and had to be able to verbally communicate or have a caregiver communicate for them
in English. Participants had to score ≥ 24 on a test of cognitive ability (Mini-Mental State
Examination, MMSE) if they lived alone; scores for those with a caregiver had to be ≥ 15.
Participants had to be able to consume food by mouth; tube feeding was not allowed.
Participants with terminal diagnoses were ineligible for the study.5
Study participants were recruited from home health care agencies, an in-patient hospital
rehabilitation unit, and local churches in the Birmingham area; those involved in recruitment
were aware of study eligibility criteria.5
MEASURES In the original study, nutrient data from the three 24-hour dietary recall interviews were
averaged for each participant and then analyzed using a dietary software package.5
Anthropometric measures were obtained and recorded as part of the Mini Nutritional
Assessment–MNA68 (Appendix B) during the in-home visits. Interviewers used a portable scale
with a vertical ruler to assess the body weight and height of those participants who were able to
stand upright. Self-reported weight and height information was used for participants who were
unable to stand. Height and weight measures were used to calculate participant BMI scores. The

33
nutrient and anthropometric information was used to assess whether or not subjects met the study
definition of under-eating.5
In the original study, demographic information was collected via self-report on the
Demographics Questionnaire (Appendix C) at the baseline interview, along with other measures
of medical, functional, economic, social, oral health, religious, and psychological factors.5 The
physical function portion of the SF-36v2™© Health Survey, Version 1, QualityMetric, Inc.,
1999,69 (Appendix D) was used to assess and score participants’ functional status. Oral health
data were collected and scored using the Oral Health-Related Quality of Life70 measure7
(Appendix E) that the researchers adapted for the study. Locher and colleagues5 selected
measures “…based on their psychometric properties, use in older populations, and particular
relevance to the research question.”5(p. 226)
Measures used in the secondary analysis included participant demographic information
such as age, gender, ethnicity, highest level of education completed, marital status, living
arrangement, level of food security, and subjects’ participation in the Meals on Wheels Program
(Appendix C). A participants’ level of food security was defined as the level of availability of
food or access to food at all times.5 Dietary intake levels for the selected nutrients were derived
from information collected during the three 24-hour dietary recall interviews in the original
study.
A proxy measure, the physical function subscale score, was used as the measure for
functional ability in the secondary analysis. The SF-36v2™© Health Survey69 is comprised of 36
questions that have been validated to assess functional ability in the older adult population.69 It is
described as a “generic” tool because it can be used across a broad range of ages and groups; its
use is not intended for any specific age groups or populations.69 The physical function portion of
the survey is made up of 10 questions that address specific physical activities such as the ability

34
to walk, to climb stairs and to lift and carry groceries.69 Possible scores for the survey range from
0 to 100; higher scores equate to better physical function.69 In the parent study, data from the
physical function portion of the SF-36v2™© Health Survey69 questionnaire (Appendix D) were
analyzed to provide a single score, the physical function subscale score, representative of
participants’ baseline level of physical function.
Baseline oral health summary scores from the original study were used to represent
participants’ oral health status in the present study. Researchers in the parent study developed an
abbreviated Oral Health Quality of Life Questionnaire (Appendix E) based on an existing and
more detailed oral health tool described elsewhere.70 The adapted tool contained 7 questions
related to chewing, swallowing, mouth pain, and denture use. The number of intact natural teeth
was also measured and recorded on the oral health survey. Questionnaires were analyzed to
provide a single oral health summary score ranging from 0 to 9. A lower score indicated better
oral health and fewer issues with chewing, swallowing, and/or mouth pain, whereas a higher
score indicated poorer oral health and more difficulty with chewing, swallowing and/or mouth
pain.
DATA ANALYSIS
In the secondary analysis, participant demographic data were characterized with
descriptive statistics including total number, mean, minimum, maximum, standard deviation, and
percent. Correlational analyses were used to determine the relationships between physical
function and the level of dietary intake for each study nutrient, the oral health summary score,
and demographic characteristics. Pearson’s correlation coefficients were measured comparing
the physical performance score to the level of dietary intake of energy, protein, calcium,
phosphorus, vitamins C, D, and K, the oral health index summary score, BMI, age, gender,
ethnicity, education level, marital status, living arrangement, level of food security, and Meals on

35
Wheels participation. Correlation coefficients were considered significant at α = 0.05. Multiple
linear regression analyses were also performed. In the final model, physical performance score
was the dependent variable; the dietary intake of energy, protein, calcium, phosphorus, vitamins
C, D, and K, and the oral health index summary score were the independent variables. All data
were analyzed using SPSS (version 17.0, 2007, SPSS Inc, Chicago, IL).

36
CHAPTER 4
RESULTS
Two hundred thirty eight participants were originally enrolled in the parent study.
However, in this secondary study, data were analyzed only for those participants who had
completed all home interview questionnaires and all three dietary recall interviews.
Demographic information for these participants is shown in Table 1. Participants included 49
men and 181 women with a mean age of 79.1 ± 8.58. Approximately two-thirds (61.7%) were
Caucasian and one-third (38.3%) were African American. The educational level of the
participants was diverse, ranging from the level of having completed no formal education
through completion of a professional or graduate level of education. Although the majority were
widowed, more than 68% of the older adults in the study lived with someone else. Most were
food secure and did not participate in the Meals on Wheels Program. BMI scores ranged from
12.7 to 65.2 with a mean of 27.6 ± 8.33.
Physical function score and dietary intake data for study variables are shown in Table 2.
Although the possible score range for physical function score was 0 to 100, the mean physical
function score for the homebound participants in the study was 13.47 ± 4.47 with a range of 10
to 29. Average energy intake for the study population was 1,507 kilocalories per day. Average
protein intake was 62 grams per day. Of the three vitamins and two minerals studied,
participants’ average intake of calcium and vitamin D was below the recommended AI level for
both men and women; participants’ average intake for vitamin K was below the recommend AI
for men.71 Average daily intakes for other nutrients met or exceeded recommended amounts.

37
Table 3 presents the results from participants’ Oral Health Quality of Life
Questionnaires. The questionnaire assessed issues regarding chewing, swallowing, mouth pain,
dry mouth, and denture use. A physical count of the number of remaining natural teeth of each
participant was also conducted as part of the study. Scores were summarized into a single number from 0 to 9 as the oral health index summary score. Lower scores indicated better oral health. The mean oral health index summary score for this study population was 1.17 ± 1.71.
While close to 80% or more of the older adults reported no issues with chewing, swallowing, or
mouth pain, approximately one-third (32.8%) reported issues with dry mouth. Similarly, 63.9%
reported having dentures, but only 40% reported wearing them all the time. Evaluation of the
individual questions comprising the index revealed that 43 subjects (18.7%) reported chewing
difficulty, 47 subjects (20.4%) reported swallowing difficulty, 32 subjects (14.3%) reported
mouth pain, and 75 subjects (32.6%) reported dry mouth at least or more often than some of the
time. Of the 147 (63.9%) participants that reported having dentures, 15 of them (10.2%)
reported they wore them none of the time (there was no data for 83 participants (36.1%) on this
question). On average, participants had eight remaining natural teeth.
Bivariate correlations are shown in Table 4. Participants’ oral health index summary
score and dietary intake of vitamin K were the only variables significantly associated (p < .05)
with physical function; the association between the oral health index summary score and vitamin
K intake was not significant. None of the demographic variables, including gender and race,
were significantly associated with physical function; therefore none of these variables were
included in the final model. Variables tested in regression analyses, with physical function as the
dependent variable included dietary intake of energy, protein, calcium, phosphorus, vitamins D,
C, and K, the oral health index summary score, BMI, age, gender, ethnicity, education level,
marital status, living arrangement, level of food security, and Meals on Wheels participation.
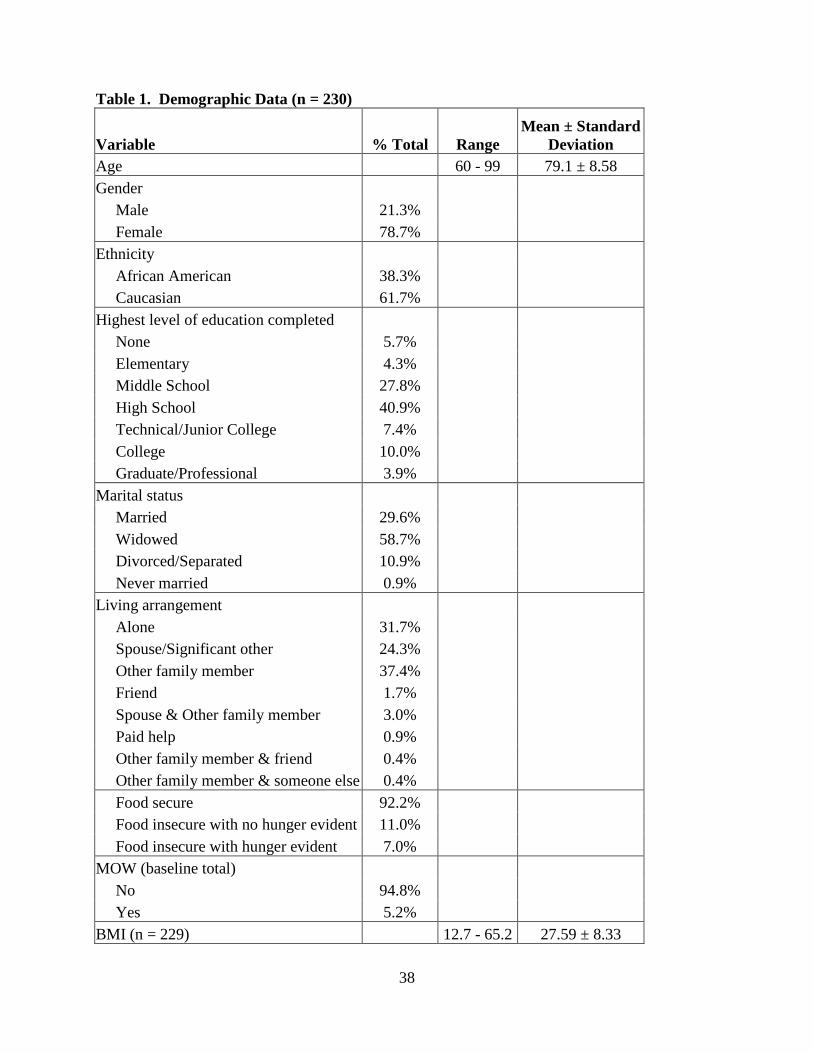
38
Table 1. Demographic Data (n = 230)
Variable % Total Range Mean ± Standard
Deviation Age 60 - 99 79.1 ± 8.58 Gender Male 21.3% Female 78.7% Ethnicity African American 38.3% Caucasian 61.7% Highest level of education completed None 5.7% Elementary 4.3% Middle School 27.8% High School 40.9% Technical/Junior College 7.4% College 10.0% Graduate/Professional 3.9% Marital status Married 29.6% Widowed 58.7% Divorced/Separated 10.9% Never married 0.9% Living arrangement Alone 31.7% Spouse/Significant other 24.3% Other family member 37.4% Friend 1.7% Spouse & Other family member 3.0% Paid help 0.9% Other family member & friend 0.4% Other family member & someone else 0.4% Food secure 92.2% Food insecure with no hunger evident 11.0% Food insecure with hunger evident 7.0% MOW (baseline total) No 94.8% Yes 5.2% BMI (n = 229) 12.7 - 65.2 27.59 ± 8.33

39
However, only two variables, dietary intake of vitamin K and the oral health index summary
score, were significant predictors (p < .05) of participants’ level of physical function, and were
therefore included in the final regression model (Table 5).
Table 2. Physical Function Score and Dietary Intake Data (n = 230)
Variable Range Mean ± Standard
Deviation
Physical function score 10.00 - 29.00 13.47 ± 4.47
Energy (kcals) 230.00 - 3005.97 1507.20 ± 468.48
Total protein (g) 6.26 - 123.07 62.24 ± 20.11
Vitamin D (mcg) .00 - 27.89 8.67 ± 6.00
Vitamin K (mcg) 1.54 - 847.53 104.32 ± 107.34
Vitamin C (mg) 1.05 - 453.97 115.07 ± 73.39
Calcium (mg) 150.19 - 3493.98 773.76 ± 467.33
Phosphorous (mg) 15.15 - 2301.24 1004.36 ± 367.75

40
Table 3. Oral Heath Quality of Life Information (n = 230)
Variable % Total Range Mean ± Standard
Deviation Oral health index summary score 0 - 9 1.17 ± 1.71 Difficulty chewing None of the time 81.3% Some of the time 11.3% Most of the time 6.5% All of the time 0.9% Difficulty swallowing None of the time 79.6% Some of the time 15.2% Most of the time 2.6% All of the time 2.6% Mouth pain None of the time 85.7% Some of the time 10.0% Most of the time 3.0% All of the time 0.9% Dry mouth None of the time 67.4% Some of the time 23.0% Most of the time 7.0% All of the time 2.8% Dentures Yes 63.9% No 36.1% Wear dentures (n = 147) None of the time 10.2% Some of the time 12.2% Most of the time 15.0% All of the time 62.6% Number of natural teeth 0 - 31 8.25 ± 9.69

41
Table 4. Correlational Analysis of Physical Function, Oral Health, and Diet
Physical Function SF - 36 p value
Oral Health Index Summary Score* -0.18 0.006***
Energy (kcals) 0.008 0.901
Total Protein 0.035 0.593
Vitamin D 0.106 0.109
Vitamin K 0.184 0.005***
Vitamin C 0.041 0.535
Calcium 0.009 0.893
Phosphorus 0.063 0.344 * N = 229 ** p < .05 *** p < .01 Table 5. Final Regression Model - Physical Function as Dependent Variable Model Summary
Model R R Square Adjusted R
Square Std. Error of the
Estimate
1 .252a 0.064 0.055 4.3528 a. Predictors: (Constant), VitK, oral health index summary score baseline Coefficientsa
Model Unstandardized Coefficients Standardized Coefficients
B Std. Error Beta t Sig. (Constant) 13.227 0.454 29.15 .000 Oral health index summary score baseline -0.447 0.169 -0.171 -2.647 .009** Vitamin K 0.007 0.003 .177 2.75 .006** a. Dependent Variable: PF SF-36 subscale baseline * p < .05 ** p < .01

42
CHAPTER 5
DISCUSSION
The purpose of this research was to examine associations between oral health, dietary
intake and functional ability in homebound older adults. Results of this secondary data analysis
revealed that the oral health index summary score, a measure of overall oral health status derived
from individual factors such as such as chewing ability, swallowing ability, dry mouth, and
mouth pain, and dietary intake of vitamin K were both significantly correlated with, and
significant predictors of, homebound older adult functional ability measured as physical
function. These results provided evidence to reject both research hypotheses that were:
H01: There are no significant associations between functional ability level and oral health
status or nutrient intake levels in a group of homebound older adults.
H02: There are no study variables that significantly predict functional ability level.
The oral health index summary score was negatively associated with physical function, such that
a higher oral health summary score equated to poorer oral health and a lower oral health
summary score equated to better oral health. The negative association would mean that a
homebound older adult with poorer oral health, indicated by a higher oral health summary score,
would have poorer physical function. In this study, the mean oral health summary score of 1.17
indicated better oral health amongst participants. The mean physical function score of 13.47
indicated lower levels of physical function, which was consistent with this homebound
population of older adults receiving home health care services due to illness or hospitalization.

43
Although limited, there is research that reveals associations between dentition status and
physical function and the relationship to quality of life. Japanese researchers investigating the
relationship between dentition status and physical function/functional ability, identified
associations that have the potential to greatly impact older adult quality of life through fall
reduction/avoidance.72 Results from this small, case-controlled study provided evidence that
tooth loss could be a risk factor for body balance control, which is an important factor in older
adult fall prevention.72 The study compared the body balance ability of community-dwelling
older adults with natural teeth or crowns as the control group to the body balance ability of older
adults with full dentures, either upper, lower, or both, as the test group. Body balance was
measured as the amount of time a participant could stand on one leg with eyes open, and as
functional reach, a measure of the difference between arm length and forward reach. Body sway
was also measured as a component of balance ability. Results were significantly better for both
measures of body balance and body sway in the test group, giving evidence that tooth loss is a
risk factor for body balance.72 The researchers suggested their results occurred because denture
wearers lack certain periodontal ligaments that influence the body’s posture through a reflexive
action related to the mandible, and called for a longitudinal research investigation.72
German researchers compared dentition status to physical and psychological aspects of
quality of life.73 Although they found no significant relationships between dentition and
psychological factors, there were several significant findings between dentition status and
physical factors (physical factors were either disease states or medical conditions).73 Their results
indicated that having 9 or fewer natural teeth and no dental prostheses was a negative quality of
life factor, and that older adults with compromised dentition reported quality of life scores that
were similar to those of persons diagnosed with cancer or renal disease.73

44
While the research results of the present study are consistent with other studies that found
associations between diet and/or oral health and physical function,10,73 the results of the present
study seem unique with respect to the finding of significance between physical function and
dietary intake of vitamin K. Of the research reviewed on physical function and nutritional intake
in older adults or homebound older adults, none included vitamin K. A possible reason for this
lack of research is that historically, vitamin K has been known as the vitamin responsible for
human blood clotting. Therefore, much of the existing research on vitamin K concerns its role in
blood coagulation and anti-coagulation drug therapy along with population-based studies that
assess dietary intake levels of the vitamin or the identification of food sources in the American
diet.74-76 However, as the number of older adults in the US population has increased,
accompanied by increases in age-associated diseases like osteoporosis and Alzheimer’s disease,
there is emerging research with respect to vitamin K. In osteoporosis, vitamin K research
involves its role as an enzyme in the carboxylation of certain proteins, specifically osteocalcin,
one of the proteins responsible for BMD.76,77 In fact, vitamin K was included as a study variable
in this thesis research because of its potential role in bone health and because of the association
of older adult bone health with function ability. With Alzheimer’s disease, research concerns the
role of vitamin K in activating a specific vitamin K-dependent brain protein or its role in
sphingolipid metabolism, which involves nerve signals and other types of cell functions.78 While
there is yet no research indicating a direct relationship between vitamin K and physical function
or functional ability, there are efforts underway that suggest possible indirect associations.
Of the literature reviewed, there was a preponderance of research regarding the
relationship between dentition status and nutritional status. Numerous studies revealed that
better dentition was related to better nutritional intake.79-82 In a study of adult males 61 ± 8 years
of age, Krall and colleagues79 found that subjects with intact dentition (natural teeth only) and

45
those with removable partial dentures had the best intakes.79 These two groups had higher
intakes of macronutrients and micronutrients, except niacin, than subjects with compromised
dentition (fewer than 14 natural teeth on one or both sides of the mouth and no removable
dentures) or with full dentures.79 Subjects with full dentures had the lowest intakes of study
nutrients. Regardless of dentition, none of the groups consumed the recommended amount of
dietary fiber, 25 grams per day.79 These researchers also found that age was a positive,
significant predictor of nutrient intake; older subjects had higher intakes of dietary fiber,
calcium, phosphorus, thiamin, riboflavin, folic acid and vitamins A, B6, B12, C, D.79 Correlations
between chewing ability and intake of fiber, folic acid, thiamin, riboflavin, vitamins A, B6, C, D,
carotene, magnesium, phosphorus and iron were also revealed in the research study.79 Krall and
colleagues79 concluded that the research results emphasized the need to continue efforts to
prevent tooth loss and promote restoration in order to affect better dietary intakes and possibly
reduce diet-related illnesses.79 Sheiham and colleagues80 reported similar findings of positive
associations between dentition and nutritional status.80 Community dwelling older adults with no
teeth had significantly lower intakes of energy, protein, intrinsic and milk sugars, fiber (non-
starch polysaccharides), calcium, non-heme iron, niacin and vitamin C than older adults with at
least some teeth.80 These researchers also found that older adults with just a few teeth had better
nutrient intakes those with no teeth,80 a finding which was corroborated in a 2007 population-
based study.81 Shinkai and colleagues82 also identified small, but statistically significant
relationships between some very specific aspects of dentition and select nutrients (sodium,
energy, vitamin C, protein, and fiber).82 However, when these same researchers evaluated diet
quality using the Healthy Eating Index, a measure that evaluated intake by food groupings as
well as by variety, the conclusion was that positive or good dentition did not translate into a
healthy, varied diet.82 In fact, the research showed that older adults in the study had poorer oral

46
function, but better dietary intake scores than younger participants.82 While the results are not
suggestive of a causal relationship, the researchers recommended that nutrition and diet
counseling accompany dental restoration treatments.82
In developing the hypotheses for the present study, there was an expectation of finding a
statistical association between physical function and energy or protein or both. The parent study
of this secondary analysis was an investigation of factors associated with under-eating in
homebound older adults, therefore it seemed logical to expect a relationship between physical
function and energy intake. Similarly, because muscle strength and endurance are components
of physical function, an association between protein, a component of muscle tissue, and physical
function was also anticipated. Therefore the significant findings associated with vitamin K in the
secondary analysis were unanticipated. Hypothetically, the significant finding with vitamin K
could be explained by the fact that some of the study participants were receiving home health
care services because of recent hospitalizations. It is possible these subjects were hospitalized
for anticoagulation treatment and received therapeutic diets restricted in vitamin K during the
hospital stay. As a result, post hospitalization subjects would have lower dietary intakes of
vitamin K foods because of medical treatment for one or possibly multiple chronic health
conditions, and functional decline is associated with chronic illness.82 This hypothesis however,
requires future study for proof of certainty.
There were several limitations to the current research. First, this was a secondary
analysis of baseline data from a longitudinal study, resulting in a cross-sectional design. The
study sample was relatively small with only 230 subjects and disproportionate by race and
gender. Two-thirds of the study sample were Caucasian and three-fourths were female. The
sample was also limited to a very specific segment of the older adult population, the homebound
older adult segment, and more specifically, homebound older adults receiving home health care

47
because of a recent illness or hospitalization. One final limitation was that the research data for
the study was based on participant self-report.
While the outcomes of this research investigation were unexpected in terms of the finding
related to vitamin K, there are data to confirm the findings with respect to dentition and
function.72,73 There has also been previous research linking micronutrients to function and/or
dentition.67,79,80,82,83 It is also possible that previous research may have found associations with
vitamin K had researchers included the vitamin in the analyses.
In conclusion, the results of this thesis research provide some interesting insights into the
impact of nutrition and dentition with respect to homebound older adult functional ability.
However, there is an evident need for additional research in the homebound older adult segment
of older adults. There is also a need for consistency in measuring functional ability, and there is
most definitely a need for more research with regards to the potential relationship between
vitamin K and physical function in this population.

48
REFERENCES
1. US Department of Health and Human Services. Healthy People 2010: Understanding and Improving Health. 2nd ed. Washington, DC: US Government Printing Office, November 2000. 2. Health-Related Quality of Life — Prevalence Data. http://apps.nccd.cdc.gov/HRQOL/. Accessed August 2, 2009. 3. Federal Interagency Forum on Aging-Related Statistics. Older Americans 2008: Key Indicators of Well-Being. March 2008. http://www.agingstats.gov/agingstatsdotnet/Main_Site/About/FAQ.aspx. Accessed May 26, 2009. 4. Cheek P, Nikpour L, Nowlin H. Aging well with smart technology. Nurs Admin Q. 2005;29(4):329-338. 5. Locher JL, Ritchie CS, Robinson CO, Roth DL, West DS, Burgio KL. A multidimensional approach to understand under-eating in homebound older adults: the importance of social factors. The Gerontologist. 2008;48(2):223-234. 6. Centers for Medicare & Medicaid Services. Medicare and Home Health Care. CMS Publication No. 10969. http://www.cms.hhs.gov. Accessed May 25, 2009. 7. Senator Jeffords (VT). Homebound Clarification Act of 2000. 2000;146:35(Congressional Record):pS1748. Accessed May 25, 2009. 8. Amarantos E, Martinez A, Dwyer J. Nutrition and quality of life in older adults. J Gerontol A Biol Sci Med Sci. 2001;56A:54-64. 9. Sharkey JR, Branch LG, Zohoori N, Giuliani C. Inadequate nutrient intakes among homebound elderly and their correlation with individual characteristics and health-related factors. Am J Clin Nutr. 2002;76(6):1435-1444. 10. Sharkey JR, Giuliani C, Hunter PS, Branch LG. Summary measure of dietary musculoskeletal nutrient (calcium, vitamin D, magnesium, and phosphorus) intakes is associated with lower-extremity physical performance in homebound elder men and women. Am J Clin Nutr. 2003;77(4):847-856. 11. Ritchie CS, Burgio KL, Locher JL, Cornwell A. Nutritional status of urban homebound older adults. Am J Clin Nutr. 1997;66(4):815-818.

49
12. 2000 Census. We The People: Aging in the United States. Census 2000 Special Reports. 2004:11. 13. CDC. Public Health and Aging: Trends in Aging---United States and Worldwide. MMWR. February 14, 2003 2003:101. http://www.cdc.gov/mmwr/preview/mmwrhtml/mm5206a2.htm. Accessed May 26, 2009. 14. Locher JL, Ritchie CS, Roth DL, Sen B, Vickers KS, Vailas LI. Food choice among homebound older adults: motivations and perceived barriers. J Nutr Health Aging. 2009;13(8):659-664. 15. About Medpac#1075. http://www.medpac.gov/results. Accessed November 10, 2009. 16. Trader SE, Newton RA, Cromwell RL. Balance abilities of homebound older adults classified as fallers and nonfallers. Journal of Geriatric Physical Therapy. 2003;26(3):3-8. 17. Reducing Falls and Resulting Hip Fractures Among Older Women. http://www.cdc.gov/mmwr/preview/mmwrhtml/rr4902a2.htm. Accessed November 10, 2009. 18. CDC. Self-Reported Falls and Fall-Related Injuries Among Persons Aged >65 Years -- United States, 2006. http://www.cdc.gov/mmwr/preview/mmwrhtml/mm5709al.htm. Updated 2008. Accessed April 12, 2009. 19. Aging - State of Aging and Health Report. http://www.cdc.gov/aging/saha.htm. Accessed November 10, 2009. 20. Iinattiniemi S, Jokelainen J, Luukinen H. Falls risk among a very old home-dwelling population. Scand J Prim Health Care. 2009;27(1):25-30. 21. Stel VS, Smit JH, Pluijm SM, Lips P. Consequences of falling in older men and women and risk factors for health service use and functional decline. Age Ageing. 2004;33(1):58-65. 22. Runge M, Hunter G. Determinants of musculoskeletal frailty and the risk of falls in old age. J Musculoskelet Neuronal Interact. 2006;6(2):167-173. 23. Karlsson MK, Nordqvist A, Karlsson C. Physical activity, muscle function, falls and fractures. Food Nutr Res. 2008;52:10. Epub 2008 Dec 30. http://www.foodandnutritionresearch.net/index.php/fnr/article/view/1920/2100. Accessed November 10, 2009. 24. Deshpande N, Metter EJ, Lauretani F, Bandinelli S, Guralnik J, Ferrucci L. Activity restriction induced by fear of falling and objective and subjective measures of physical function: a prospective cohort study. J Am Geriatr Soc. 2008;56(4):615-620. 25. Austin N, Devine A, Dick I, Prince R, Bruce D. Fear of falling in older women: a longitudinal study of incidence, persistence, and predictors. J Am Geriatr Soc. 2007;55(10):1598-1603.

50
26. Martin FC, Hart D, Spector T, Doyle DV, Harari D. Fear of falling limiting activity in young-old women is associated with reduced functional mobility rather than psychological factors. Age Ageing. 2005;34(3):281-287. 27. Payette H. Nutrition as a determinant of functional autonomy and quality of life in aging: a research program. Can J Physiol Pharmacol. 2005;83(11):1061-1070. 28. Whitney EN, Rolfes SR. Understanding Nutrition. 8th ed. West/Wadsworth; 1999. 29. Ilich JZ, Kerstetter JE. Nutrition in bone health revisited: a story beyond calcium. J Am Coll Nutr. 2000;19(6):715-737. 30. Dreyer HC, Volpi E. Role of protein and amino acids in the pathophysiology and treatment of sarcopenia. J Am Coll Nutr. 2005;24(2):140S-145S. 31. Nieves JW. Osteoporosis: the role of micronutrients. Am J Clin Nutr. 2005;81(5):1232S-1239S. 32. Tucker KL. Dietary intake and bone status with aging. Curr Pharm Des. 2003;9(32):2687-2704. 33. NOF - Bone Mass Measurement. http://www.nof.org/osteoporosis/diseasefacts.htm. Accessed November 10, 2009. 34. Heaney RP, Rafferty K. Carbonated beverages and urinary calcium excretion. Am J Clin Nutr. 2001;74(3):343-347. 35. Kim SH, Morton DJ, Barrett-Connor EL. Carbonated beverage consumption and bone mineral density among older women: the Rancho Bernardo Study. Am J Public Health. 1997;87(2):276-279. 36. Cumming RG, Cummings SR, Nevitt MC, et al. Calcium intake and fracture risk: results from the study of osteoporotic fractures. Am J Epidemiol. 1997;145(10):926-934. 37. Trivedi DP, Doll R, Khaw KT. Effect of four monthly oral vitamin D3 (cholecalciferol) supplementation on fractures and mortality in men and women living in the community: randomised double blind controlled trial. BMJ. 2003;326(7387):469-475. 38. Venning G. Recent developments in vitamin D deficiency and muscle weakness among elderly people. BMJ. 2005;330(7490):524-526. 39. Prynne CJ, Mishra GD, O'Connell MA, et al. Fruit and vegetable intakes and bone mineral status: a cross sectional study in 5 age and sex cohorts. Am J Clin Nutr. 2006;83(6):1420-1428. 40. Macdonald HM, New SA, Golden MH, Campbell MK, Reid DM. Nutritional associations with bone loss during the menopausal transition: evidence of a beneficial effect of calcium,

51
alcohol, and fruit and vegetable nutrients and of a detrimental effect of fatty acids. Am J Clin Nutr. 2004;79(1):155-165. 41. Pinheiro MM, Schuch NJ, Genaro PS, Ciconelli RM, Ferraz MB, Martini LA. Nutrient intakes related to osteoporotic fractures in men and women--the Brazilian Osteoporosis Study (BRAZOS). Nutr J. 2009;8:6-14. 42. Ilich JZ, Brownbill RA, Tamborini L. Bone and nutrition in elderly women: protein, energy, and calcium as main determinants of bone mineral density. Eur J Clin Nutr. 2003;57(4):554-565. 43. Ilich-Ernst J, Brownbill RA, Ludemann MA, Fu R. Critical factors for bone health in women across the age span: how important is muscle mass? Medscape Womens Health eJournal. 2002;7(3). http://www.medscape.com/viewarticle/432910. Accessed March 18, 2008. 44. Simon JA, Hudes ES. Relation of ascorbic acid to bone mineral density and self-reported fractures among US adults. Am J Epidemiol. 2001;154(5):427-433. 45. Nguyen TV, Center JR, Sambrook PN, Eisman JA. Risk factors for proximal humerus, forearm, and wrist fractures in elderly men and women: the Dubbo Osteoporosis Epidemiology Study. Am J Epidemiol. 2001;153(6):587-595. 46. Munger RG, Cerhan JR, Chiu BC. Prospective study of dietary protein intake and risk of hip fracture in postmenopausal women. Am J Clin Nutr. 1999;69(1):147-152. 47. Semba RD, Garrett E, Johnson BA, Guralnik JM, Fried LP. Vitamin D deficiency among older women with and without disability. Am J Clin Nutr. 2000;72(6):1529-1534. 48. Smith H, Anderson F, Raphael H, Maslin P, Crozier S, Cooper C. Effect of annual intramuscular vitamin D on fracture risk in elderly men and women--a population-based, randomized, double-blind, placebo-controlled trial. Rheumatology (Oxford). 2007;46(12):1852-1857. 49. Prince RL, Austin N, Devine A, Dick IM, Bruce D, Zhu K. Effects of ergocalciferol added to calcium on the risk of falls in elderly high-risk women. Arch Intern Med. 2008;168(1):103-108. 50. Sharkey JR, Ory MG, Branch LG. Severe elder obesity and 1-year diminished lower extremity physical performance in homebound older adults. J Am Geriatr Soc. 2006;54(9):1407-1413. 51. Ship JA. Improving oral health in older people. J Am Geriatr Soc. 2002;50(8):1454-1455. 52. Carmona RH. "Ageism in Healthcare: Are Our Nation's Seniors Receiving Proper Oral Health Care?" 2003(108th Congress). http://www.surgeongeneral.gov/news/testimony/ageism09222003.htm. Accessed May 22, 1009.

52
53. US Department of Health and Human Services. Oral Health in America: A Report of the Surgeon General. 2000. http://www.surgeongeneral.gov/library/oralhealth. Accessed November 10, 2009. 54. Institute of Medicine. The Role of Nutrition in Maintaining Health in the Nation’s Elderly: Evaluating Coverage of Nutrition Services for the Medicare Population. . http//books.nap.edu/catalog/9741.html. Accessed May 31, 2009. 55. Allukian M,Jr. The neglected epidemic and the surgeon general's report: a call to action for better oral health. Am J Public Health. 2008;98(9 Suppl):S82-85. 56. Ettinger RL. Oral health and the aging population. J Am Dent Assoc. 2007;138 Suppl:5S-6S. 57. Turner MD, Ship JA. Dry mouth and its effects on the oral health of elderly people. J Am Dent Assoc. 2007;138 Suppl:15S-20S. 58. Dolan TA, Atchison K, Huynh TN. Access to dental care among older adults in the United States. J Dent Educ. 2005;69(9):961-974. 59. Kiyak HA, Reichmuth M. Barriers to and enablers of older adults' use of dental services. J Dent Educ. 2005;69(9):975-986. 60. Touger-Decker R, Mobley CC, American Dietetic Association. Position of the American Dietetic Association: oral health and nutrition. J Am Diet Assoc. 2007;107(8):1418-1428. 61. Moynihan PJ. The relationship between nutrition and systemic and oral well-being in older people. J Am Dent Assoc. 2007;138(4):493-497. 62. Ritchie CS, Joshipura K, Hung HC, Douglass CW. Nutrition as a mediator in the relation between oral and systemic disease: associations between specific measures of adult oral health and nutrition outcomes. Crit Rev Oral Biol Med. 2002;13(3):291-300. 63. Marshall TA, Warren JJ, Hand JS, Zie X, Stumbo PJ. Oral health, nutrient intake and dietary quality in the very old. J Am Dent Assoc. 2002;133(10):1369-1379. 64. Sahyoun NR, Lin CL, Krall E. Nutritional status of the older adult is associated with dentition status. J Am Diet Assoc. 2003;103(1):61-66. 65. Bailey RL, Ledikwe JH, Smiciklas-Wright H, Mitchell DC, Jensen GL. Persistent oral health problems associated with comorbidity and impaired diet quality in older adults. J Am Diet Assoc. 2004;104(8):1273-1276. 66. Lee JS, Weyant RJ, Corby P, Kritchevsky SB. Edentulism and nutritional status in a biracial sample of well-functioning, community-dwelling elderly: The Health, Aging, and Body Composition Study. Am J Clin Nutr. 2004;79(2):295-302.

53
67. Bartali B, Salvini S, Turrini A, et al. Age and disability affect dietary intake. J Nutr. 2003;133(9):2868-2873. 68. Nestlé Nutrition Institute - MNA® Elderly - Overview. http://www.mna-elderly.com/default.html. Accessed April 15, 2010. 69. What We Do > Generic Health Surveys > QualityMetric Incorporated. http://www.qualitymetric.com/WhatWeDo/GenericHealthSurveys/tabid/184/Default.aspx. Accessed April 15, 2010. 70. Kressin NR, Atchison KA, Miller DR. Comparing the impact of oral disease in two populations of older adults: application of the geriatric oral health assessment index. J Public Health Dent. 1997;57(4):224-232. 71. DRI Tables: Dietary Guidance: Food and Nutrition Information Center. http://fnic.nal.usda.gov/nal_display/index.php. Accessed April 10, 2010. 72. Yoshida M, Kikutani T, Okada G, Kawamura T, Kimura M, Akagawa Y. The effect of tooth loss on body balance control among community-dwelling elderly persons. Int J Prosthodont. 2009;22(2):136-139. 73. Mack F, Schwahn C, Feine JS, et al. The impact of tooth loss on general health related to quality of life among elderly Pomeranians: results from the Study of Health in Pomerania (SHIP-O). Int J Prosthodont. 2005;18(5):414-419. 74. Bach AU, Anderson SA, Foley AL, Williams EC, Suttie JW. Assessment of vitamin K status in human subjects administered "minidose" warfarin. Am J Clin Nutr. 1996;64(6):894-902. 75. Booth SL, Pennington J, Sadowski JA. Food sources and dietary intakes of vitamin K-1 (phylloquinone) in the American diet: data from the FDA Total Diet Study. J Am Diet Assoc. 1996;96(2):149-154. 76. Booth SL, Webb DR, Peters JC. Assessment of phylloquinone and dihydrophylloquinone dietary intakes among a nationally representative sample of US consumers using 14-day food diaries. J Am Diet Assoc. 1999;99(9):1072-1076. 77. Booth SL, Broe KE, Gagnon DR, et al. Vitamin K intake and bone mineral density in women and men. Am J Clin Nutr. 2003;77(2):512-516. 78. Presse N, Shatenstein B, Kergoat M, Ferland G. Low vitamin K intakes in community-dwelling elders at an early stage of Alzheimer's disease. J Am Diet Assoc. 2008;108(12):2095-2099. 79. Krall E, Hayes C, Garcia R. How dentition status and masticatory function affect nutrient intake. J Am Dent Assoc. 1998;129(9):1261-1269.
54
80. Sheiham A, Steele JG, Marcenes W, et al. The relationship among dental status, nutrient intake, and nutritional status in older people. J Dent Res. 2001;80(2):408-413. 81. Nowjack-Raymer RE, Sheiham A. Numbers of natural teeth, diet, and nutritional status in US adults. J Dent Res. 2007;86(12):1171-1175. 82. Shinkai RS, Hatch JP, Sakai S, Mobley CC, Saunders MJ, Rugh JD. Oral function and diet quality in a community-based sample. J Dent Res. 2001;80(7):1625-1630. 83. Bartali B, Semba RD, Frongillo EA, Varadhan R. Low Micronutrient Levels as a Predictor of Incident Disability in Older Women. Arch Intern Med. 2006;166(21):2335-2340.

55
APPENDIX A
Permission for Figure 1

56

57
APPENDIX B
Nutrition Questionnaire

58

59

60

61
APPENDIX C
Demographics Questionnaire

62

63
APPENDIX D
SF-36v2™© Questionnaire

64

65

66

67

68
APPENDIX E
Oral Health Quality of Life Questionnaire

69


