
AN INFORMED ELECTORATE: THE RELATIONSHIP BETWEEN THE
STANDARDIZATION OF PUBLIC EDUCATION
AND VOTER PARTICIPATION
by
SHELLEY JACQUES PINEO-JENSEN
A DISSERTATION
Presented to the Department of Educational Methodology, Policy, and Leadership and the Graduate School of the University of Oregon
in partial fulfillment of the requirements for the degree of
Doctor of Philosophy
June 2013

ii
DISSERTATION APPROVAL PAGE Student: Shelley Jacques Pineo-Jensen Title: An Informed Electorate: The Relationship Between the Standardization of Public Education and Voter Participation This dissertation has been accepted and approved in partial fulfillment of the requirements for the Doctor of Philosophy degree in the Department of Educational Methodology, Policy, and Leadership by: Yong Zhao Chairperson David Conley Core Member Keith Hollenbeck Core Member Ronald Beghetto Institutional Representative and Kimberly Andrews Espy Vice President for Research and Innovation; Dean of the Graduate School Original approval signatures are on file with the University of Oregon Graduate School. Degree awarded June 2013
iii
©2013 Shelley Jacques Pineo-Jensen

iv
DISSERTATION ABSTRACT Shelley Jacques Pineo-Jensen Doctor of Philosophy Department of Educational Methodology, Policy, and Leadership June 2013 Title: An Informed Electorate: The Relationship Between the Standardization of Public Education and Voter Participation
This exploratory investigation examined the relationship between states’
educational standardization and voter turnout, using cultural and critical theory lenses. The
study documented the problem of low voter participation and current education
standardization policies.
The study used a complementarity mixed-methods design with sequential
quantitative and qualitative components. The quantitative component developed a tool for
measuring states’ levels of educational standardization, the Standardized Education Index
(SEI). Data for voter age population (VAP) and voter eligible population (VEP) in state
presidential elections between 2000 and 2012 were used as measures of voter turnout. A
weak correlation was found between the SEI and voter turnout for VEP in 2000 and VAP
in 2000, 2004, and 2008, with between 6% and 14% of variability explained. While no
evidence of a positive relationship between higher levels of SEI and higher voter turnout
was found, no counter argument could be established either.
The qualitative component utilized case studies of exemplars of states with high
SEI/low voter turnout and high SEI/low voter turnout, which were Arkansas and New
Hampshire, respectively. Investigated elements were educational Administrative Rules,

v
voting regulations, and cultural/geographic and demographic attributes. Data were
compiled and compared. A binary sort, a Dichotomous Sort of Accountability Concepts,
framed the critical analysis of educational standards data. Arkansas was found to be a
location of standardized education and restrictive voting regulations. New Hampshire was a
location of more differentiated education supporting civic engagement with easier access to
voting.
This study’s results are a baseline for further investigation of the relationship of
educational standardization to voter participation. If standards based reform has a positive
effect on voter participation, then future correlation analysis will produce a moderate to
strong positive relationship. If the relationship remains negative, then it will provide
evidence that standards reform does not engender an informed electorate.

vi
CURRICULUM VITAE NAME OF AUTHOR: Shelley Jacques Pineo-Jensen GRADUATE AND UNDERGRADUATE SCHOOLS ATTENDED: University of Oregon, Eugene California State University at Chico DEGREES AWARDED:
Doctor of Philosophy, Educational Methodology, Policy, and Leadership, 2013, University of Oregon
Bachelor of Arts, Liberal Studies, 1995, California State University at Chico AREAS OF SPECIAL INTEREST: Standardization of K-12 Public Education Education for Empowerment and Enfranchisement Social Justice Queer Theory PROFESSIONAL EXPERIENCE: Teaching Assistant, University of Oregon, 2007-2011 Public School Teacher, Thermalito Union School District, 1996-2006 PUBLICATIONS: Jensen, S. J. (submitted). Dangerous white lady In E. A. Daniels & B. J. Porfilio (Eds.), Dangerous counterstories in the corporate academy: Narrating for understanding solidarity, resistance, and community in the age of neoliberalism. Charlotte, NC: Information Age Publishers.
Jensen, S. J. (submitted). The ruling ideas in the textbook. In H. Hickman & B. J. Porfilio (Eds.), The new politics of the textbook: Problematizing the portrayal of marginalized groups in textbooks. Rotterdam; Boston: Sense Publishers.
Porfilio, B. J., Gorlewski, J. A., & Pineo-Jensen, S. J. (submitted). Graduate
studies and the academic labor market a special issue of the peer-reviewed journal Workplace: A Journal for Academic Labor 2012.
vii
ACKNOWLEDGMENTS I wish to express sincere appreciation to Professors Yong, Hollenbeck, Conley,
and Beghetto for their assistance in the preparation of this manuscript. In addition, special
thanks are due to Professors Yovanoff, Scalise, Rosiek, and Coukos whose contributions
were foundational during the early phase of this undertaking.

viii
Dedicated to my mother, Dr. Claudia Patricia Pineo

ix
TABLE OF CONTENTS
Chapter Page I. THE PROBLEM....................................................................................................... 1
II. LITERATURE REVIEW ........................................................................................ 10
III. METHODS ............................................................................................................ 56
IV. RESULTS .............................................................................................................. 95
V. DISCUSSION ......................................................................................................... 152
APPENDICES ............................................................................................................. 166
A. FINANCIAL SPONSORS OF ACHIEVE ....................................................... 166
B. FULL ACHIEVE WEBSITE REPORT FOR TENNESSEE ........................... 167
C. RACE TO THE TOP THEORY OF ACTION SECTIONS ............................. 168
D. NEXT GENERATION SCIENCE STANDARDS........................................... 170
E. ADOPTION OF COMMON CORE STANDARDS ........................................ 171
F. STATE VOTER PERCENTAGES ................................................................... 172
G. SEI SCORES WITH TRANSFORMATION TO Z-SCORES ......................... 173
REFERENCES CITED ................................................................................................ 174

x
LIST OF FIGURES Figure Page 1. Hypothetical relationship of Educational Standardization and Voter Turnout ...... 8 2. Comparison of Voter Turnout 1992-2000. ............................................................ 12 3. Decline in U.S. Voter Participation ....................................................................... 13
4. VEP and VAP for Presidential Elections ............................................................... 14
5. Voter Turnout by Educational Level and Age ....................................................... 15
6. Variation in U.S. Voting Rates by State ................................................................ 16
7. Voter Participation by State ................................................................................... 17
8. Mixed-Methods Research Designs ........................................................................ 58
9. Detail of Achieve Policy goals for Tennessee ....................................................... 66
10. Purposeful Sampling four Cell Grid ...................................................................... 81
11. Histogram for SEI z-score ...................................................................................... 97
12. Boxplot for SEI z-score .......................................................................................... 97
13. VEP 2000 Histogram ............................................................................................. 98
14. VEP 2012 Histogram ............................................................................................. 98
15. Difference Histogram............................................................................................. 98
16. Boxplots for Difference ......................................................................................... 98
17. Relationship of SEI z-score to 2000 Election ........................................................ 100
18. Relationship of SEI z-score to 2012 Election ........................................................ 100
19. Relationship of SEI z-score to Difference ............................................................. 101
20. 2x2 Grid of SEI and 2012 Voter Turnout Scatterplot ............................................ 102
21. Individual Correlations for SEI Score with VEP and VAP 2000-2012 ................. 105

xi
Figure Page
22. Combined Regression Lines for SEI with VEP and VAP 2000-2012 ................... 106
23. Comparison of Support for Standardization/Differentiation Found in ARs .......... 125
24. U.S. Divided into Regions ..................................................................................... 130
25. Population Density ................................................................................................. 133
26. Employment ........................................................................................................... 136
27. Average Rents as Population Estimates ................................................................. 137
28. Average Rents as Percentages ............................................................................... 138
29. Access to Vehicles as Percentages of Households ................................................ 139
30. Mobility as Percentages of Households ................................................................. 140
31. Employment in Selected Job Categories................................................................ 141
32. Composition of Congress by Political Party Affiliation ........................................ 145
33. Voter Participation by Party for Governor’s Race ................................................. 145
34. Party Affiliation ..................................................................................................... 146

xii
LIST OF TABLES Table Page 1. Six Purposes of Education ..................................................................................... 1 2. Text of Selected Criteria for Three 21st Century Skills Advocacy Groups ........... 47 3. Dichotomous Sort of Accountability Concepts ..................................................... 53
4. Dissertation Methods Steps.................................................................................... 61
5. SEI Indicator Descriptions and Sources ................................................................ 65
6. Sample Language from PARCC and SBAC Race to the Top Applications .......... 68
7. Comparison of the Theories of Action of PARCC and SBAC .............................. 69
8. 2012 SEI z-scores and Voter Turnout Percentages for Selected States ................. 82
9. Descriptive Statistics for the Standardized Education Index z-scores ................... 96
10. Descriptive Statistics for Voter Participation ........................................................ 98
11. Correlations Between State SEI z-scores and Voter Turnout ................................ 99
12. Descriptive Statistics for Voter Participation ........................................................ 104
13. Correlations Between State SEI z-scores and Voter Turnout ................................ 104
14. Comparison of Two States for Required Content Areas ....................................... 113
15. Comparison of Educational ARs for K-12 Standards and Accountability ............ 119
16. Comparison of Voter Regulations Marked for State with Greater Access ............ 129
17. Urban Population Density ...................................................................................... 133
18. Rural Population Density ....................................................................................... 134
19. Racial Composition as a Percent............................................................................ 134
20. Education Levels for Persons 25 and Older ........................................................... 135
21. Economic Demographics as a Percent ................................................................... 136

xiii
Table Page
22. Selected Social Characteristics in the U.S. ............................................................ 143
23. Religious Affiliation in Percentages. ..................................................................... 144

1
CHAPTER I
THE PROBLEM
Making claims about the goals of public education is “complicated and
multifaceted, reflecting a range of beliefs” (Farenga & Ness, 2005, p. 49). Eisner (1978)
advised us that defining what quality education is depends upon one’s conception of
schooling. Eisner described “five major views about the mission or purposes of
schooling” (p. 21): (a) development of a student’s thinking or cognitive process; (b)
“initiation into the intellectual disciplines” (p. 21); (c) helping students discover their
own interests; (d) adapting students to earn a living; and (e) preparing children to become
active in solving inequities in society. Farenga and Ness (2005) described Eisner’s work
as the five basic orientations towards the goals of curriculum. Moreover, they combined
Eisner’s fourth and fifth views into one and added a new fifth element, curriculum as
technology, which “stresses accountability - often in relation to student standardized
testing” (p. 49). Table 1 presents a summary of the concepts.
Table 1
Six Purposes of Education (Eisner, 1978; Farenga & Ness, 2005)
Purpose Description
Development of cognitive processes Development of students’ cognitive processes
Academic rationalism Fosters intellectual growth of students
Personal relevance Allows students to pursue individual learning interests
Social adaptation Preservation of the status quo in preparing students for employment
Social reconstruction Students are encouraged to question and challenge the values and structures of society
Curriculum as technology Stressing accountability and promoting student learning of specific testable objectives

2
Eisner (1978) elaborated on his fifth a goal for education, social reconstruction, as
a goal of public education that was “not to create adaptive or pliant citizens [but rather] . .
. to help children become aware of the inequities so they will eventually do something
about altering them” (p. 21). He pointed out that at the time of his writing, half of all
those eligible did not vote in presidential elections and that participation in school board
elections was much lower (16%). He identified a mission to “prepare people who can
create a better social order” (p. 21).
Public Education Should Have a Positive Influence on Participation in a Democracy
“An education that creates a disposition to active citizenship is a necessary
condition of free societies” (Crick, 1999, p. 337). Drawing on the ideas of Locke (1766,
1769), Rousseau (1773) and Mill (1861), Nie, Junn and Stehlik-Barry (1996) found that
“a common theme throughout western Enlightenment political philosophy is the
importance of education in developing the cognitive and moral qualities necessary for
citizenship in a democratic polity” (p. 12). They pointed out that
the continued importance of education to citizenship is illustrated by the
extent to which government directs public education in the United States; .
. . there is common agreement that education provides both the skills
necessary to become politically engaged and the knowledge to understand
and accept democratic principles. (p. 12)
King (1947) suggested that “the function of education is to teach one to think
intensively and to think critically. Intelligence plus character – that is the goal of true
education” (para. 5). The famous civil rights advocate warned that “education which
stops with efficiency may prove the greatest menace to society” (para. 3). As reported in

3
W. E. B. Du Bois Speaks: Speeches and Addresses (1970), in 1906 Du Bois delivered the
Niagara Address in which he called for real education for Blacks, by which he meant
“the development of power and ideal, . . . a right to know, to think, to aspire” (p. 172)
which he contrasted with schools whose purpose is ”to educate black boys and girls
simply as servants and underlings, or simply for the use of other people” (p. 172).
Public education could and should play a pivotal role in producing an informed
electorate. In 1787, Jefferson wrote to Madison that “above all things I hope the education
of the common people will be attended to, convinced that on their good sense we may
rely with the most security for the preservation of a due degree of liberty" (2012, para.
12). Continuing to advocate for public education to prepare citizens for participation in
democracy, in 1820 Jefferson wrote:
I know of no safe depository of the ultimate powers of the society but the
people themselves; and if we think them not enlightened enough to
exercise their control with a wholesome discretion, the remedy is not to
take it from them, but to inform their discretion by education. (para. 2)
Jefferson, Du Bois, King, and Eisner articulated a mission for public education that it
should empower citizens.
Voting Is an Indicator of Participation in a Democracy
The prime indicator of empowerment of citizens is voter participation. The literal
definition of democracy is “rule by the people” (Dahl, 2012, para. 1). Voting, the
“machinery of democracy” (Bird, Campbell, & Briggs, 2012, para. 1), is the most
obvious and most important indicator of participation in a democracy (Baek, 2009; Dahl,
1971; Lijphart & Aitkin, 1994; G. Parry & Moyser, 2001). In order for a democratic

4
process to be viewed as legitimate, citizens must have the opportunity to determine their
preferences, to communicate these preferences effectively, both as individuals and
collectively, and to be able to express these preferences without discrimination (Dahl,
1971). Furthermore, Dahl stated that these opportunities depend on several required
institutional guarantees, including: the “right to vote, . . . alternative sources of
information, . . . [and] free and fair elections” (p. 3). Lack of voter participation reduces
the perceived legitimacy of those who are elected to govern (Ross, 2012). In other words,
voter participation is the hallmark of a democracy.
Problems with Voter Turnout in the United States
Unfortunately, there have been problems with voter turnout in the U.S. These
issues included lower voter participation in the U.S. as compared to other countries, a
reported decline in voter participation, fluctuation in voter turnout, difference in voter
turnout for various groups, and varying challenges found in voting procedures.
Voter participation was lower in the U.S. compared to other countries
(International IDEA, 2012; Powell, 1986). Causes for high voter turnout included
institutional rules such as mandatory voting (International Institute for Democracy and
Electoral Assistance, 2012).
Much has been reported about a decline in voter turnout in the U.S starting in
1960 (Blais & Rubenson, 2012; Kahne & Westheimer, 2003; Pearson Education, 2012;
Reuters, 2011; Ross, 2012; U.S. Census Bureau, 1991). One researcher argued that these
concerns were over-stated and that a more careful analysis of the data would take into
account residents who were not entitled to vote (M. McDonald, 2012c).

5
U.S. voting rates fluctuated widely from one election to the next (Reuters, 2011;
U.S. Census Bureau, 1991). There were clear differences of level of participation based
on the type of election being held. Voter turnout was lowest in primary elections, and
lower in off-year elections as compared to general elections (The Center for Voting and
Democracy, 2013; U.S. Census Bureau, 2010a). Voter participation rates in the U.S.
varied greatly across demographic attributes of educational level and age (Baum, Ma, &
Payea, 2010) and from state to state (U.S. Census Bureau, 2012b, 2012c)
To summarize, there has been a long-standing problem with voter turnout in the
U.S. The electoral process has been distorted by a variety in voter registration laws some
of which create obstacles to voting. Impediments to voting were not distributed equally.
Distribution of laws that create blocks to voting affected persons of color
disproportionately and were concentrated in states with the greatest amount of minority
population growth (Haygood, 2012).
Voter participation was lower in the U.S. as compared to other countries. Some
found evidence that voter turnout has declined, fluctuated, and varied by age and
education level. In particular, there was a wide range of levels of voter participation
across the states. As voter turnout continued to be a problem in the U.S., education was
changing as a result of the standards based reformed movement. One well documented
change in public education was a narrowing of the curriculum in K-12 public education.
Narrowing of the Curriculum
The increase in standardization of education can be traced back to the early part of
the 20th century during the progressive movement. During that time, standardized tests
were widely adopted for use in sorting students into two kinds of high schools, those

6
which prepared students for college and those which prepared students for work. Another
turning point in the standardization movement was the publication of Why Johnny Can’t
Read (Flesch, 1955) and the launch of Sputnik in 1957 (Garber, 2007), which built on
Cold War anxieties to foster the claim that U.S. education was falling behind in the race
for world domination. One highly influential report, A Nation at Risk (National
Commission on Excellence in Education, 1983), offered claims that the U.S. was falling
behind our competitors for global supremacy because of the failure of our education
system. The pressure to improve education forced waves of reform based on higher
standards and greater accountability of educators to produce outcomes which were
increasingly defined as student scores on large-scale high risk-tests. The reauthorization
of Elementary and Secondary Education Act in 2001as the No Child Left Behind of 2001
(NCLB) ("No Child Left Behind Act of 2001," 2002) codified increased testing,
accountability, and standardization mandates such as “ensuring that all groups of students
reach proficiency within 12 years” (U.S. DOE, 2001, para. 5).
As a result of standards based reform of education, instructional time has become
more focused on teaching standards to prepare students for mandated tests. As a result,
there has been a documented narrowing of the curriculum to focus on science,
technology, engineering and math (STEM) or even more narrowly on just reading and
math (Dillion, 2006; Gunzenhauser, 2003; K. V. King & Zucker, 2005, p. 5; Mathis,
2003; Pedulla et al., 2003; Robelen, 2011; Vogler, 2003; von Zastrow & Janc, 2004).
This narrowing of the curriculum has been at the cost of class room time devoted to
civics and social studies content.

7
Reduction of Civics and Social Studies Instruction
Standards based reform focuses on science, technology, engineering, and math
(STEM) or more specifically, the Common Core Standards which address reading and
math; “we continue to focus on reading and math while ignoring the other studies that are
essential elements of a good education” (Ravitch, 2010, p. 226). “Federal expenditures by
the Department of Education on civic education totaled less than half of one percent of
the overall department budget (Kahne & Westheimer, 2003, p. 35) and in a time of ever
increasing mandated tests of Common Core content for public school students, “social
studies and civic education, the areas of the curriculum most tied to the democratic
mission of schools, share no such requirements” (p. 35). The content areas of social
studies, which encompasses civics, U.S. history, and other knowledge that would be
fundamental to engendering voting behavior, are not key parts of standards based
movement reform and time committed to instruction in these content areas has declined
(Duncan, 2011). Eisner was pointed in addressing that which is not taught in public
schools:
Schools have consequences not only by virtue of what they do teach, but
also by virtue of what the neglect to teach. . . . We can identify the null
curriculum — the options students are not afforded, the perspectives they
may never know about, much less be able to use, the concepts and skills
that are not part of their intellectual repertoire. (Eisner, 1979, pp. 103,
106-107).

8
Convergence
If educational standardization improved the quality of education in the direction
of empowering students to become active citizens, one result would be greater voter
participation. However, as school reform efforts pressured states to standardize
education, voter turnout continued to decrease, or at least to fluctuate, while variability of
voter turnout was evident across several measures such as in comparisons between and
among states. Figure 1 represents a theory of the relationship between standardization of
K-12 public education and voter turnout; as standardization increases, voter participation
declines. The dashed lined represents increased educational standardization while the
solid line presents the decline in voter turnout (Pearson Education, 2012), hypothesizing a
negative correlation.
Is it possible that standardization actually goes hand in hand with lower voter
turnout? On the other hand, a positive correlation would indicate that educational
standardization was related to increased voter turnout and would provide support for
recent implementation of policies that support the standards based reform movement. The
policy theory that drives this work is that K-12 public education could and should
produce an informed electorate (voters).
Figure 1. Hypothetical Relationship of Educational Standardization and Voter Participation
35%45%55%65%
1960 1970 1980 1990 2000 2010
Voter Rates Level of Standardization

9
If there is a correlation between standardization of education and voter turnout,
what might cause this phenomenon? Because evidence reveals a wide range of voter
participation levels among the states, something must drive that variation. This
exploratory research was intended help inform a framing of the issue of the goals of a
public education, investigating both the presence and direction of the relationship
between educational standardization and voter turnout and then probing for elements that
might have influenced covariance of the variables.

10
CHAPTER II
LITERATURE REVIEW
A synthesis of the literature relevant to this dissertation is presented in two parts.
The first section describes the larger context of voter turnout and the myriad of
researched potential causes of voter participation and then narrows the focus to discuss
reports of research linking education to voting behavior. The second section reviews the
history, trajectory, and forces supporting the standardization of K-12 education in the
U.S., some background on education for civic knowledge, and describes the contrast
between standardized and differentiated education.
Voter Participation
Voting is a fundamental indicator of participation in a democracy (Dahl, 1971,
2012; Enclopaedia Britannica, 2012; M. Johnson, 2001; Pillsbury & Johnannesen, 2010);
voting is the “machinery of democracy” (Bird et al., 2012, para. 1). In other words, voter
participation is the hallmark of a democracy.
One example of the consequences of low voter turnout was reported by
Halcoussis, Ng, and Virts (2009), who found evidence of the negative effects of variation
in rates of voter participation on educational opportunity for disadvantaged students who
already faced the challenge of being a minority race. Levels of voter turnout in county
elections had a direct effect on differential school funding for racially segregated schools
with white students benefiting as compared to black students. The next section will
describe concerns about voter participation in the U.S.
11
Problems with Voter Turnout in the United States
Voter participation in the U.S. compared to turnout in other countries. In the
1980s, concerns were voiced that voting rates were lower in the U.S than in other
countries (Powell, 1986). Since that time, voter turnout in other countries has remained
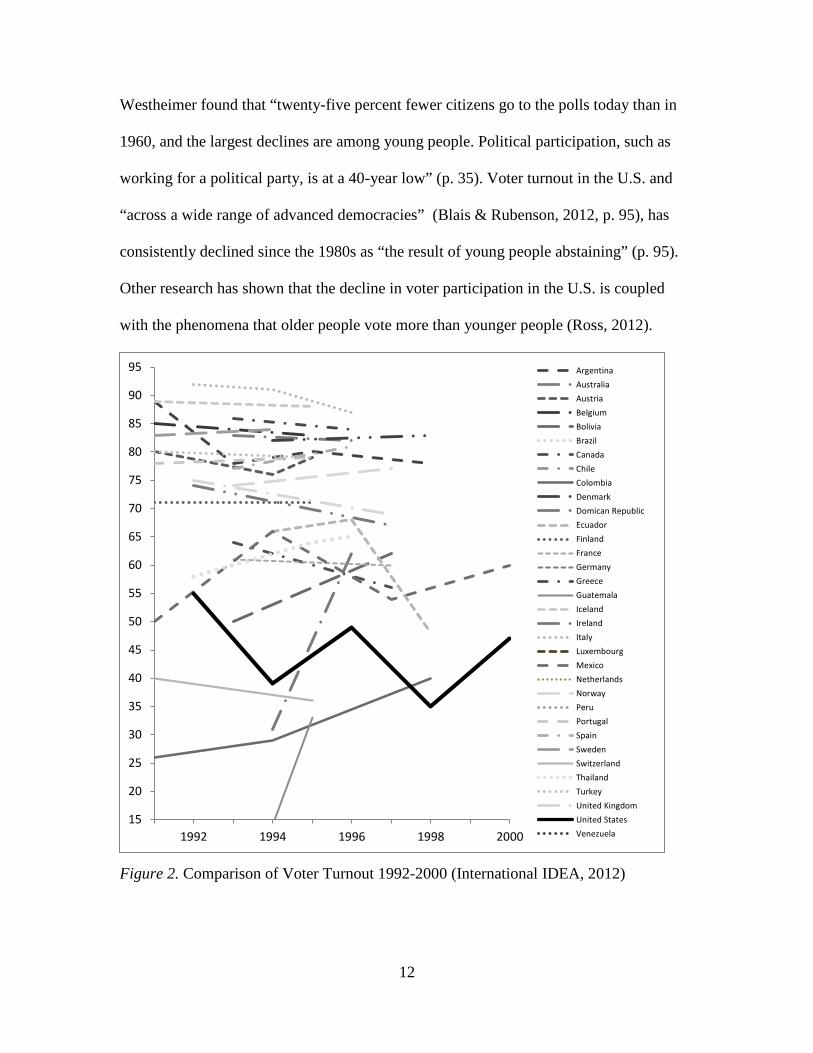
higher than in it was the U.S (International IDEA, 2012). Figure 2 provides a graphical
representation of voter turnout for some countries from 1991 to 2000. Voter turnout in
the U.S. is higher for presidential elections than mid-term elections. When graphed, these
peaks and valleys create a picket fence effect, clearly shown in Figure 1. In general, the
national elections depicted in Figure 2 are for each country’s national general election
which may include, as in the U.S., high interest and low interest national contests. The
graph reveals that U.S. is not one of the countries with high voter turnout. Causes for
high voter turnout include institutional rules such as mandatory voting (International
Institute for Democracy and Electoral Assistance, 2012).
A decline in voter participation in the U.S. Much has been reported about a
decline in voter turnout in the U.S that started in 1960. One researcher argued that these
concerns are over-stated and that a more careful analysis of the data would take into
account residents who are not entitled to vote.
Evidence for a decline in voter participation. The U.S. Census Bureau called
attention to the issue of low voter participation in its report The Decline in American
Voter Turnout (1991). Voter participation has been declining in the U.S. since 1960
(Blais & Rubenson, 2012; Kahne & Westheimer, 2003; Pearson Education, 2012;
Reuters, 2011; Ross, 2012), from 63% to 57% in presidential election years, and from
47% to 38% in off-year elections (Pearson Education, 2012). In 2003 Kahne and
12
Westheimer found that “twenty-five percent fewer citizens go to the polls today than in
1960, and the largest declines are among young people. Political participation, such as
working for a political party, is at a 40-year low” (p. 35). Voter turnout in the U.S. and
“across a wide range of advanced democracies” (Blais & Rubenson, 2012, p. 95), has
consistently declined since the 1980s as “the result of young people abstaining” (p. 95).
Other research has shown that the decline in voter participation in the U.S. is coupled
with the phenomena that older people vote more than younger people (Ross, 2012).
Figure 2. Comparison of Voter Turnout 1992-2000 (International IDEA, 2012)
15
20
25
30
35
40
45
50
55
60
65
70
75
80
85
90
95
1992 1994 1996 1998 2000
ArgentinaAustraliaAustriaBelgiumBoliviaBrazilCanadaChileColombiaDenmarkDomican RepublicEcuadorFinlandFranceGermanyGreeceGuatemalaIcelandIrelandItalyLuxembourgMexicoNetherlandsNorwayPeruPortugalSpainSwedenSwitzerlandThailandTurkeyUnited KingdomUnited StatesVenezuela

13
Figure 3 shows an overall trend of declining voter participation from 1952 to
2008 with identification of the contests associated with the elections that had the
strongest turn-outs – Kennedy/Nixon in 1960, Clinton/Bush in 1992, and Obama/McCain
in 2008.
Figure 3. Decline in U.S. Voter Participation (U.S. Census Bureau, 2010a)
A challenge to claims of voter decline. The reported decline in voter participation
in the U.S. was challenged by McDonald’s (2012c) analysis of voter turnout. State voter
participation was reported either as Voting Age Population (VAP) or Voting Eligible
Population (VEP). VAP was calculated by dividing the number of votes cast by the
number of state residents older than 18 as reported in the U.S. Census. VEP was
calculated with same operation but the denominator was adjusted using U.S. Census
reports of residents and estimates of non-citizens, Department of Justice prison,
probation, and parole reports, and Federal Voting Assistance Program estimates of
62% 59%
63% 61% 61%
55% 54% 53% 53%
50%
55%
49% 50%
56% 57% 58% 56%
58% 58% 55%
51% 49% 48% 47%
45%
51%
46% 47%
52% 53%
41% 42% 43% 45% 45%
44%
36% 34%
38%
34% 34% 37%
33% 35% 36% 37%
30%
70%
1952 1956 1960 1964 1968 1972 1976 1980 1984 1988 1992 1996 2000 2004 2008
Presidential U.S Representatives U.S. Representatives (Off-Year)
Linear (Presidential) Linear (U.S Representatives) Linear (U.S. Representatives (Off-Year))
Kennedy/Nixon Clinton/Bush Obama/McCai

14
overseas (non-resident citizen) voters. McDonald claimed that “the much lamented
decline in voter participation is an artifact of poor measurement” (M. McDonald, 2012c).
Figure 4 represents McDonald’s evidence that VEP turnout rates revealed smaller decline
in voter turnout than VAP rates. In the graph, the lower line is the VAP data.
Figure 4. VEP and VAP for Presidential Elections (M. McDonald, 2012c)
Fluctuations in voter turnout. U.S. voting rates fluctuated widely from one
election to the next. (Reuters, 2011; U.S. Census Bureau, 1991). The previously
described picket fence effect is clearly visible in any depiction of U.S. national voter
turnout that reports both the years of presidential elections and the years in-between (off
year elections). Voter turnout was lower in primary elections compared to general
elections, local elections compared to general elections, and lower in off-year elections as
compared to presidential elections (The Center for Voting and Democracy, 2013). Figure
3 shows clear differences between voter turn-out between different types of races.
Variability of voter turnout. Voter participation rates in the U.S. varied greatly
across demographic attributes of educational level and age, ranging from 27% to 78%

15
(Baum et al., 2010). Additionally, U.S. voting rates varied greatly from state to state,
ranging from 36% to 59% in 2010 (M. McDonald, 2011c) and from 40% to 75% in 2012
(M. McDonald, 2012b). Figure 5 reveals large differences in voting behavior; the more
education a person had the more likely that person was to vote in every age category. For
the youngest age bracket, 18 to 24, 27% of non-high school graduates voted while 70%
of those with Bachelor’s Degrees or higher voted. Voter participation also varied by age,
with voting behavior generally increasing as age increased except for a slight decline in
the oldest age category, 75 and over.
Figure 5. Voter Turnout by Education Level and Age (Baum et al., 2010, p. 33)
Here, and throughout this document, Washington D.C. (DC) is treated as though it
is a state. Figure 6 reveals a wide disparity in voter participation among states (U.S.
Census Bureau, 2012b) ranging from a low of 36% to a high of 59% (U.S. Census
Bureau, 2012c). The electoral process in the U.S. was distorted by variety in voter
registration laws and other obstacles to voting and these impediments to voting were not
distributed equally.

16
Figure 6. Variation in U.S. Voting Rates by State (U.S. Census Bureau, 2012c)
After improved voter participation by people of color in the 2008 presidential
election, an “assault on voting rights that is historic both in terms of its scope and
intensity . . . [of] restrictive voting measures . . . threatens to . . . suppress . . . the political
participation of people of color, the poor, the elderly, and the young” (Haygood, 2012, p.
1019). Haygood reported that since 2010, fifteen states had passed restrictive voting
measures that affected persons of color disproportionately, and that the distribution of
these blocking laws was concentrated in “the very same states that experienced high rates
of minority population growth and political participation over the last decade” (p. 1030).
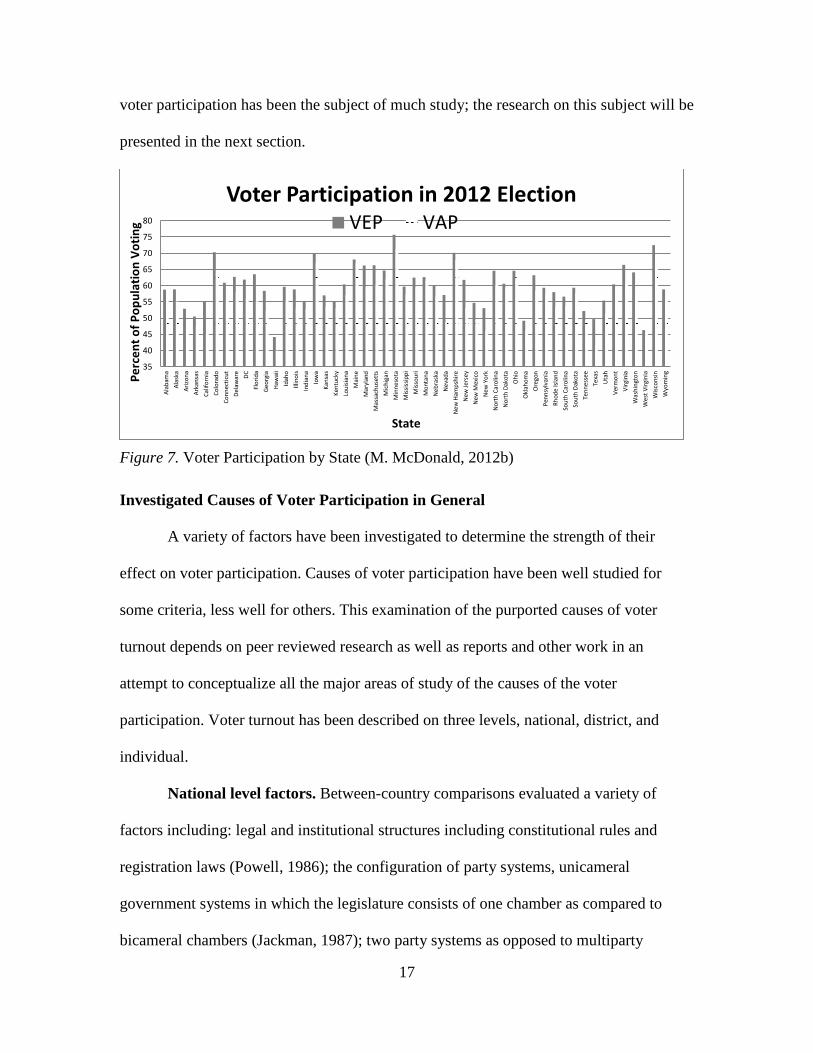
Figure 7 presents voter turnout by state for the 2012 general election for VEP and VAP
which ranged from approximately 40% to 75%.
Summary. Voter participation has been a problem in the U.S. Voter turnout is the
U.S. is lower than many other countries. Some found evidence that it was declining. U.S.
voter turnout fluctuated, varied by age and education level, and in particular, there was a
wide range of levels of voter participation among the states. Determining what causes
17
voter participation has been the subject of much study; the research on this subject will be
presented in the next section.
Figure 7. Voter Participation by State (M. McDonald, 2012b)
Investigated Causes of Voter Participation in General
A variety of factors have been investigated to determine the strength of their
effect on voter participation. Causes of voter participation have been well studied for
some criteria, less well for others. This examination of the purported causes of voter
turnout depends on peer reviewed research as well as reports and other work in an
attempt to conceptualize all the major areas of study of the causes of the voter
participation. Voter turnout has been described on three levels, national, district, and
individual.
National level factors. Between-country comparisons evaluated a variety of
factors including: legal and institutional structures including constitutional rules and
registration laws (Powell, 1986); the configuration of party systems, unicameral
government systems in which the legislature consists of one chamber as compared to
bicameral chambers (Jackman, 1987); two party systems as opposed to multiparty
35
40
45
50
55
60
65
70
75
80
Alab
ama
Alas
kaAr
izona
Arka
nsas
Calif
orni
aCo
lora
doCo
nnec
ticut
Dela
war
eDC
Flor
ida
Geor
gia
Haw
aii
Idah
oIll
inoi
sIn
dian
aIo
wa
Kans
asKe
ntuc
kyLo
uisia
naM
aine
Mar
ylan
dM
assa
chus
etts
Mic
higa
nM
inne
sota
Miss
issip
piM
issou
riM
onta
naN
ebra
ska
Nev
ada
New
Ham
pshi
reN
ew Je
rsey
New
Mex
ico
New
Yor
kN
orth
Car
olin
aN
orth
Dak
ota
Ohi
oO
klah
oma
Ore
gon
Penn
sylv
ania
Rhod
e Isl
and
Sout
h Ca
rolin
aSo
uth
Dako
taTe
nnes
see
Texa
sU
tah
Verm
ont
Virg
inia
Was
hing
ton
Wes
t Virg
inia
Wisc
onsin
Wyo
min
gPerc
ent o
f Pop
ulat
ion
Votin
g
State
Voter Participation in 2012 Election VEP VAP

18
systems (Jackman, 1987; Powell, 1986); and mandatory voting requirements and
proportional representation (Jackman, 1987). Political situations were considered such as
nationally competitive electoral districts (Jackman, 1987), the effect of polarized two
party systems compared with fractionalized parties (Wang, 2012), and the newness of a
country’s democracy, which positively influenced voter participation when paired with
government expenditures (Drazen & Brender, 2006), and in the context of historical
legacies and the mode of transition to democracy (Kostadinova & Power, 2007, p. 363).
Demographic variables were evaluated including macro social and economic
conditions, socioeconomic status, and educational attainment (Powell, 1986). Contrary to
the general finding that increased income is related to increased voter participation, poor
voters were more likely to vote in times of economic downturn in order to “express their
grievances at the polls” (Aguilar & Pacek, 2000, p. 995). Cultural factors were studied
including the case of poor people who were more aware of global environmental issues
and linked these concerns with their local region demographic variables (Jacobs, 2002)
and positive attitudes towards government (Powell, 1986). Studies of the effect of media
advertising campaigns found that they increased voter turnout. (Baek, 2009; Hall &
Bonneau, 2008).
District level factors. Within-country factors that were studied revealed that
competitiveness of a particular election as well as group and party get-out-the-vote
GOTV efforts increased voter turnout and that urban areas had a higher turnout than rural
areas due to the distance to polling places and access to registration (Blais, 2000; M.
Johnson, 2001; Rosenstone & Wolfinger, 1978; Verba, Nie, & Kim, 1978). Being a

19
member of a minority party increased the likelihood of voting (Gimpel, Dyck, & Shaw,
2004) as did residence in a wealthy area (Solecki, Mason, & Martin, 2004).
Institutional structures of state registration and voting laws profoundly influenced
voter turnout. The introduction of more demanding voter registration laws decreased
voter participation by several percentage points while Election Day registration increased
voter participation (Ansolabehere & Konisky, 2006; Neiheisel & Burden, 2012). The
effect of term limits, intended to increase voter participation, was in the other direction;
voter turnout decreased in districts where term limits were implemented (Nalder, 2007).
Other factors that were investigated include electioneering communication,
advertising campaigns, and candidate election spending and party efforts to get-out-the-
vote (GOTV) (Francia & Herrnson, 2004). Voter participation increased in districts
where residents were informed about voter participation levels (Lassen, 2005). Areas
defined by zip codes were analyzed for the effect of foreclosure rates (Estrada-Correa &
Martin, 2012) which were related to decreased voter turnout.
Individual level factors. Some of the research looked at individual attributes in
the context of a group designation or affiliation. Membership in a group (racial group
being one example) was considered as an individual characteristic in some studies,
described in terms of “overall group differences in electoral participation” (Logan,
Darrah, & Oh, 2012, p. 993), but also as a “collective act . . . [such that] indicators of the
things group members have in common support the conclusion that the group context of
participation influences choices to register and vote” (p. 1016). Individual factors that
influence voting have been described in terms of three categories, demographic,
attitudinal, and political affiliation (M. Johnson, 2001). Stein, Leighley, and Owens

20
categorized individual level factors that influence voter participation somewhat
differently, as “institutional rules, social and demographic traits, psychological resources,
and the mobilization efforts of parties and their candidates” (p. 2). The next sections will
describe research on demographic, attitudinal, political affiliation and other attributes of
individuals that have been studied in relationship to voter participation.
Demographic attributes. Studied demographic attributes included socio-
economic status, gender, age, race and level of educational attainment. Members of
higher socio-economic groups had greater levels of voter participation than those who
were less well off (A. L. Campbell, 2002; K. Greene & Nikolaev, 1999; Rosenstone &
Hansen, 1993; W. J. Scott & Acock, 1979). Generally speaking, individual characteristics
affected voter turnout in the U.S. such that the men voted more than women, older more
than younger, dominant race/ethnicity more than non-white race/ethnicity (given that this
attribute was confounded with a strong relationship with educational attainment and
income); and of particular interest to this study, better educated more than less well
educated (M. Johnson, 2001; Leighley & Nagler, 1992; Powell, 1986; Stein et al., 2005;
Verba, Schlozman, & Brady, 1995; R. E. Wolfinger & Rosenstone, 1980). Health status
was also studied (Blakely, Kennedy, & Kawachi, 2001). Healthy people were more likely
to vote than people with health challenges.
Race has been a focus of several studies on voter turnout (R. A. Jackson, 2003;
Logan et al., 2012; Xu, 2005). Non-whites voted less than members of the dominant
group; some of this variability was explained by socio-economic status (R. A. Jackson,
2003; Xu, 2005). Increase of same-race candidates increased voter participation (Barreto
& Masuoka, 2004; Logan et al., 2012). African-American voter participation increased

21
when there was a group-based assessment of economic advantage (Kinder, Adams, &
Gronke, 1989; Wilson, 2012) and Latino voters were more likely to vote if they had been
contacted through door-to-door GOTV efforts (Michelson, 2003). Marital status, age, and
level of education by race were studied (R. A. Jackson, 2003) showing differences in
voter turnout among races for these attributes.
Tied to racial demographics, the relationship of voting to demographic attributes
of immigrants was studied regarding nation of origin for new citizens (Bueker, 2005; Xu,
2005) and immigration status, length of residency, and measures of acculturation and
assimilation (Xu, 2005). Voting regulations and state policies related to treatment of
immigrants was found to be a factor in decreased voter participation for Hispanic voters
(Logan et al., 2012; Xu, 2005). Not surprisingly, these studies found that level of
education mitigated obstacles to voting which were faced disproportionately by
immigrants.
Attitudinal attributes. The influence of personal attributes of attitude and other
psychological resources have been investigated for relationships to voter participation.
While it was posited that citizen satisfaction would lead to complacency and low voter
turn-out, (Hirschman, 1970), this was not the case; positive attitudes about the democratic
institutions of a country were related to higher voter participation (Powell, 1986).
Other studies found a relationship of civic engagement to increased voter turnout
(Almond & Verba, 1963; A. Campbell, 1960; Lijphart, 1997; Pacheco & Plutzer, 2007;
Verba & Nie, 1972), although Stein et al. (2005) challenged the effect claiming it was a
mixed or “moderate effect” (p. 5). Previous voting behavior predicted later voting
behavior (Brody & Sniderman, 1977; Gerber, Green, & Shachar, 2003; Green & Shachar,

22
2000; Nownes, 1992; Plustzer, 2002; Stein et al., 2005). Perceptions of political efficacy
increased voter participation (Almond & Verba, 1963; A. Campbell, 1960; Stein et al.,
2005; Verba & Nie, 1972); decline in perceptions of political efficacy were related to a
decline in voter participation (Abramson & Aldrich, 1982; Rosenstone & Hansen, 1993;
Timpone, 1998) although others challenged these results (W. Miller, 1980, 1992; Stein et
al., 2005).
As previously reported regarding race, increases in voter participation were
related to individuals’ group membership and the perception of relevance of a candidate
or ballot issue to the group. Such groups included poor seniors (A. L. Campbell, 2002),
public employees (K. Greene & Nikolaev, 1999), farmers (R. E. Wolfinger &
Rosenstone, 1980), and veterans (Lipset, 1960). Ballot issues in general increased voter
turnout in otherwise low-turnout elections (Tolbert & Smith, 2005).
Adolescent characteristics were studied in relation to later voter behavior.
Attributes that were related to the likelihood of later reduced voter participation included:
divorce of parents (Sandell & Plutzer, 2005), early parenthood, and drop-out status,
(Frisco, Muller, & Dodson, 2004). Adolescent attributes that were related to the
likelihood of later increased voter participation included: adolescent membership in
voluntary organizations (Frisco et al., 2004), civic engagement, and political socialization
(Pacheco, 2008).
Political affiliation. Engagement in the political process was studied to identify
attributes that increase voter participation. Characteristics of affiliation included strength
of party identification, the amount of time the person worked for political candidates and
parties, and contact with government officials. The more attributes of affiliation an

23
individual had, the greater the chances that the person voted (M. Johnson, 2001; Powell,
1986).
The Internet and social media. Voter participation levels were higher for those
with access to: the Internet and online election news (Tolbert & McNeal, 2003) and
information from social networks, media coverage of campaigns and elections, and
exposure to campaign advertising (Freedman, Franz, & Goldstein, 2004; Patterson &
Caldeira, 1983; Stein et al., 2005, p. 3). Social connectedness was a related factor that
was found to increase individual political participation (M. Johnson, 2001).
Summary. This exhaustive search of the causes of voter participation turned up
one key relationship that is a matter of interest to this research project: the more
education a person had, the more likely she or he was to vote. The next section will
illuminate research relating to this factor.
Research on the Relationship of Education and Voter Participation
Many assumptions and inferences are required in order to discuss the relationship
of education to voter turnout. The most crucial issue is that most definitions of education
are general or imprecise; they do not differentiate between private and public education
or between K-12 and higher education. The focus of this research project was K-12
public education, but there has been little research on the effects of education on voting
that defines education that narrowly. Be that as it may, there was a wealth of reports of
research on the role of education in association with voter participation that helped to
contextualize and frame the research project. This section discusses demographic
variables, the possibility of causal relationships, the difference between educational

24
attainment as an absolute or relative variable, and the moderating effect of education for
voters in circumstances that would otherwise reduce participation.
Demographic variables. Level of formal education, as a demographic variable
that counts the number of years of education a person has attained, was probably the
single most important correlate to voting; “education is everywhere the universal solvent,
and the relationship is always in the same direction” (Converse & Campbell, 1972, p.
324).
Historical consideration of the issue found that regardless of whether social status
was defined as a measure of income, occupation, or education, “citizens of higher social
and economic status participate more in politics” (Verba & Nie, 1972). College
graduates, white-collar workers, and the rich voted more than high school graduates,
blue-collar workers, and the poor, respectively and “these variables are related to each
other” (R. E. Wolfinger & Rosenstone, 1980, p. 13).
Most research found a strong positive relationship between voting and education
(Barber, 1969; A. Campbell, 1960; Milbrath & Goel, 1965; Stein et al., 2005; R. E.
Wolfinger & Rosenstone, 1980). A few researchers (Milbrath & Goel, 1965; Verba et al.,
1978) found that income had a stronger relationship to voter turnout than did education.
Evidence of causality. Some aspects of education were found to have a causal
relationship to voter participation. Educational interventions for preschool and fifth grade
students was a “causal influence on [later] electoral participation” (Sondheimer & Green,
2010, p. 180). Tenn (2007) challenged the role of education as a causal factor in voter
turnout, wondering if it might be “spuriously correlated with voting” (p. 446). He
suggested that a selection bias of “unobserved factors, such as family background
25
characteristics, influence both education and voter turnout, which generates a positive
correlation between the two variables” (p. 458). Burden (2009) discounted Tenn’s notion
that the effect of education on voter turnout is spurious, citing research on the positive
effect of certain college curricula (Hillygus, 2005) and of on-campus political discussions
(Klofstad, 2007) on later political participation. In examining education as a variable
related to voter participation, it is important to recognize the difficulty of isolating
education from related and confounding variables. It is less defensible to impute
causation from relationships between voter participation and education, however it is
measured, than it is to suggest root causes that drive the correlation.
Absolute or relative. Education, whether described as a causal or correlative
variable related to voter turnout, can be thought of as absolute or relative. Absolute
education is the number of years of education a person has attained. In earlier times, more
education meant a high school education. More recently, more education has come to
mean a college degree. Relative educational level was defined variously by different
researchers, but always positioned the level of education as a comparison of an individual
or group with other individuals or groups, rather than just a count of the number of years
of schooling or degrees a person had acquired.
Absolute levels of education. There is “an empirically observable relationship [to
support the claim that] . . . more educated and better informed individuals are more likely
to vote than those less educated and informed” (Stein et al., 2005, p. 3). The more
education a person had, the more likely that person was to vote (Burden, 2009; Dee,
2004; Freedman et al., 2004; Lassen, 2005; Leighley & Nagler, 1992; Nie et al., 1996;
Powell, 1986; Rosenstone & Hansen, 1993; Sondheimer & Green, 2010; Verba et al.,

26
1995; R. E. Wolfinger & Rosenstone, 1980) or as the U.S Census reported in a 1991
statistical brief, “chances of voting increase with education” (para. 6).
Some of the reasons given to explain how more education led to increased voter
turnout included: education provided skills needed to interpret voting procedures and
make educated decisions; education increased political knowledge and interest; and going
to school increased social interaction and networking and that more community
involvement improved voter participation (Sondheimer & Green, 2010).
Higher education was found to improve voter participation. Improved language
skills and participation in social science curriculum in college that fostered the
development of civic skills was related to increased voter participation (Hillygus, 2005).
Kim and Palmer (2008) challenged the causality of this relationship, finding that most of
the variability in voter participation between high school and college graduates was a
function of other underlying factors, such as socio-economic status.
Relative levels of education. Tenn (2005) called attention to a paradox,
sometimes described as “Brody’s Puzzle” (Brody, 1978), in which an increase in the
level of educational attainment for an individual increased the likelihood that the person
would vote, but national increases in level of education did not increase the likelihood of
an increase in national voter turn-out. He suggested that the relationship was relative, in
other words, that whether voter turnout increased, decreased or remained stagnant, those
who had more years of education relative to others in the voter pool continued to be more
likely to vote than those who had fewer years of education. Relative educational levels
had strong explanatory power in several studies (Nie et al., 1996; Persson, 2012; Tenn,
2005).

27
The moderating effect of education. Increased education was a characteristic
identified with the ability of individuals to negotiate obstacles to voting more
successfully than others with less education. Evidence for the moderating effect of
education was found for voting obstacles of: complicated voting procedure (Gallego,
2010); voter registration requirements (Milligan, Moretti, & Oreopoulos, 2004); and
distance from and difficulty of locating polling places, as well as mobility (Squire,
Wolfinger, & Glass, 1987). Milligan et al. found education had a moderating effect in the
U.S. where “registration rules present a barrier to participation” (p. 1667) but not in the
United Kingdom, where such barriers did not exist.
Summary. For individuals, the more education a person had, the more likely it
was that the person would vote. This finding did not extend to the nation as a whole;
when the average number of years of education increased for the entire population, this
did not translate into increased voter participation, in fact voter participation declined.
Early intervention programs at school focused on high-risk students and improved their
outcomes in several ways; one of them was increased likelihood of voting. Education had
a moderating effect for various classes of individuals who were faced with obstacles to
voting; those with more education surmounted obstacles to voting more often than
similarly positioned peers with less education.
Much has been speculated about the cause of the relationship between increased
education and increased voting behavior, but there were no compelling explanations for
the phenomena.

28
Conclusion
This section described the scholarly discussion of one variable of this study, voter
turnout, including problems with voter turnout and researched causes of voter
participation. As voter turnout continued to be a problem in the U.S., education was
changing as a result of the standards based reformed movement. This literature review
now turns to an examination of the literature and other background information to
develop an understanding the other variable, standardization of education.
Standardization in K-12 Public Education
Standardization of public education appears to be widely accepted in the U.S.
This section begins by describing the original view of public education at the foundation
of the country as important in producing an informed electorate. It will then report the
key milestones in the gradual altering of goals and values that have fostered a reform of
American education to become more standardized. The following sections will describe
the strongest advocates for educational standardization and the consequential narrowing
of the curriculum as a result of reform. Next will be an examination of the potential for
civic knowledge to be an attribute of an education that fosters an informed electorate.
This section will conclude with a description of the difference between a standardized
education and one that differentiates instruction to meet the needs of unique and diverse
learners.
The History of Educational Standardization in the U.S.
The most basic rationale for an education system that is financed by taxes is that it
benefits society. How this public good is framed influences education policies and
accountability systems. Several goals have been postulated for public education. An

29
examination of the roots of public education in the United States will help to understand
how the goals of public education have drifted from the original intentions of the
founders and how the current emphasis on large-scale high-risk testing has been driven
by an emphasis on efficiency and accountability, or standardization.
Original rationale for public education. The influence of the Enlightenment,
before the foundation of the nation, fostered the earliest commitment to public education
in support of the “responsibility of government to ensure the participation of citizens in
government” (Heck, 2004, p. 45). Democracy required an educated populace; Jefferson
was influential in advocating for a free public school system, arguing that “peace and
stability in the new nation were best preserved by giving people access to education” (p.
46). Mann promoted free public education in the early 1800s; “public schools became a
means for ensuring the transfer of knowledge between generations” (p. 47). Up to that
point, public education provided for the transmission of culture and the development of
literacy as a prerequisite for voting.
Progressivism. The late 1800s saw the start of the progressive movement, which
was a response to industrialization, migration from rural to urban areas, and immigration.
Public education acquired another domain of public utility beyond literacy for citizenship
and communication of culture; health education was added to the goals for education as it
“became a self-conscious instrument of social change” (Mintz & McNeil, 2012, para. 3).
Among other health initiatives in public schools in the early part of the twentieth century,
massive programs of immunization of children at school were implemented (Rosen,
1958). With the addition of health education, the basic charge to educators had been
enlarged. In the early 1900s, John Dewey was the most famous advocate for progressive

30
education, which moved educational practice away from rote learning to active learning;
emphasizing the needs of the whole child was in vogue.
Concurrent with the rise of the progressive movement was the rise of the power of
corporations. As the American frontier was exhausted in the 1890s, the election of
McKinley was supported by “commercial and manufacturing interests . . . [using] the
new political methods of mass advertising” (Heck, 2004, p. 86). “The cultural values of
the corporate state were politically unassailable in twentieth century America”
(Goodwyn, 1978, p. 278). As the 20th century proceeded, Dewey’s theories gave way in
the transition towards more bureaucratic and meritocratic ideals which matched business
values of efficiency and accountability.
Meritocracy. As school districts and states implemented progressive aspirations
of free and compulsory education for all, public financing gave rise to the need for
accountability and efficiency. “Municipal Reform . . . put the power in the hands of
business elites . . . with superintendents overseeing school operations as scientific
educational managers” (Heck, 2007, p. 93). Efficiency became a dominate theme and
corporate-ethic models were now applied to educational systems.
Standardized testing was introduced, based on the perceived success of Stanford-
Binet IQ tests that were used as a sorting tool by the U.S. Army in World War I.
Following the war, the development of standardized achievement tests for public
education was “among the most important developments. [The tests] caught on quickly
because of the relative ease of administration and scoring and the [perception of a] lack
of subjectivity or favoritism. . . . [They were] less expensive and more efficient than
essay tests. Their use proliferated widely” (R. M. Kaplan & Saccuzzo, 1989, pp. 15-16).
31
The goals of education had not changed much, but differentiated high schools tracked
some students towards college and others towards blue collar jobs, based on their
supposed merit as determined by their scores on standardized tests. Testing students
allowed educational systems to sort students efficiently but not equitably. This system did
not benefit members of what we now refer to as subgroups who did not do as well on
tests contextualized in the culture and norms of the dominant group (Shea, 1977). The
stage was set for the standards-based movement.
The Cold War. Throughout these eras, American education continued to be
viewed as the development of a public good, an educated society, which also benefitted
the individual. The publication of Why Johnny Can’t Read (Flesch, 1955) challenged the
notion that our schools were doing a good job of fostering an educated society. The
launch of Sputnik in 1957 (Garber, 2007) built on Cold War anxieties to escalate the
influence of the claim that U.S. education was falling behind in the race for world
domination. Concerns about the quality of public education in the U.S. crystalized with
the publication of A Nation of Risk, (Gardner, 1983). The document was the product of
the National Commission on Excellence in Education, which examined existing analysis
and reports commissioned from experts but also depended on public hearings,
symposiums, meetings, and letters. The report also relied on conjecture founded on
“descriptions of notable programs and promising approaches” (pp. 2-3). The author
commended “public-minded citizens who took the trouble to share their concerns . . .
[and noted the] diversity of opinion it received regarding the condition of American
education, [commenting that] . . . how we have treated their suggestions is, of course, our
responsibility alone” (p. 3). In the introductory materials, the author did not cite scientific

32
research in support of the claims made in the document but rather framed the document
as the representation of the opinions of those who testified at public hearings.
The opening pages of A Nation of Risk presented a series of claims, that the
United States was “being overtaken by competitors throughout the world” (p. 5), that
American education was “mediocre” (p. 5) and that we had “lost sight of the basic
purposes of schooling” (p. 5). The document supplied a list of risk indicators, as claimed
by presenters at commission hearings: poor U.S. performance compared to international
competitors on academic tests, the large amount of illiterate Americans, lower
achievement on standardized tests, poor performance of gifted students, decline in
Scholastic Assessment Test (SAT) and other College Board scores, low levels of higher
order intellectual skills, increase in remedial courses required for entering college
students, lower college exit scores, and complaints from business and the military that
entry level students lack basic math and reading skills. Here the author sounded a dire
warning: “We are raising a new generation of Americans that is scientifically and
technologically illiterate” (p. 10).
Researchers at Sandia Laboratories investigated the claims of the National
Commission on Excellence in Education. Overall, their evidence contradicted A Nation at
Risk, finding that “the present system [of education] has shown a steady or improving
trend” (Huelskamp, 1993, p. 718). Their analysis of high school graduation found that
when students taking longer than four years to complete high school or who later
obtained a GED were included, graduation rates had remained stable, and were “among
the best in the world” (p. 719). They evaluated SAT and National Assessment of
Educational Progress (NAEP) scores and found gradual improvement in NAEP scores

33
and misrepresentation of the meaning of the decline in SAT scores, that is, that decline in
scores was caused by the increased participation of low-achieving students and those
from formerly underrepresented groups were taking the SAT more than ever before.
Sandia researchers dismissed the international comparisons as not meeting their
expectations for the appropriateness of the comparisons, or yielding contradictory
findings showing that the U.S. was performing well compared to international
counterparts.
Because of the lack of rigor associated with the data collection, analysis, and
conclusions of A Nation at Risk, it is appropriate to discount it as political posturing
based on opinions. The Sandia Laboratories report revealed the need for greater scientific
basis for educational policy decisions. Nonetheless, A Nation at Risk was highly
influential in driving the standards-based movement, with its commonly accepted
assumptions that education in the United States no longer served the public good. This
major change in the goals of education came along with the clamor for reform of
education. Public education was now expected to be competitive. This new emphasis
featured the United States pitted against international rivals in a contest to produce the
largest gross national product and be the greatest influence on the world. Higher
standards and testing would be key components of new goals for education.
The War on Poverty. In a move that enlarged the federal government’s role in
education far beyond anything that had been done before, Congress passed The
Elementary and Secondary Education Act of 1965 (ESEA) as part of President Johnson’s
War on Poverty. Building on the goals of the civil rights movement and designed to
improve educational equity, ESEA was “the first major social legislation to mandate

34
project reporting” (McLaughlin, 2011, p. v). The evaluation requirement of ESEA was
intended to provide political accountability so that local constituents would be able to see
if the money from the federal government was being spent appropriately to improve the
education of disadvantaged students. It was also hoped that federal management of
education programs would be brought in line with business accounting methods. Data
would be presented in “cost-benefit terms . . . leading to more effective local practices
and more efficient federal decision making” (p. v). There was opposition to ESEA
policies by those who “contended that evaluation was inconsistent with best practice in
that it consumed already limited program resources and employed invidious and
inappropriate measures of ‘success’ – achievement scores” (p. v). Such resistance to
ESEA did not slow the incremental increase in the use of standardized tests.
A shift to industry published tests. Slowly but surely, states moved towards
adoption of large-scale high-stakes standards-based assessments. Formerly relying on off-
the shelf standardized products from the testing industry, states now sought to match their
testing materials with their specific curriculum and standards. By the mid-1990s, test
publishing companies were being hired by states to help design these assessment
materials (Jorgensen & Hoffman, 2003). This rise of a profit driven testing materials
industry was a consequence of the refocusing of national and state education policies on
standards and accountability.
No Child Left Behind. With the 2002 reauthorization of ESEA as NCLB, a new
"accountability regime" (McGuinn, 2006, p. 194) completed the move from the War on
Poverty’s focus on equity and improved access for the disadvantaged to improved
education for “all students, . . . with increased accountability for school performance” (p.

35
194). While NCLB was positioned as intending to reduce federal influence over
education, it is widely accepted that it enlarged the federal role in education (Education
Week, 2004). Standards and accountability components led it to be described as “the
most sweeping federal intrusion into state and local control of education in the history of
the United States” (Kelderman, 2004). In order to continue to receive federal funding,
states, districts, and schools were mandated, among other things, to test virtually all
students annually and to meet targets for achievement on the tests. “According to NCLB,
all public school students should perform at grade level (be proficient) in reading and
mathematics by the end of the 2013-2014 school year” (ALSDE, 2011, p. 1).
Obama’s Blueprint. As of 2010, not much had changed since the publication of
A Nation at Risk in the political framing of education in America as ineffective and in
need of reform. In A Blue Print for Reform, (U.S. DOE) national goals for education were
still articulated in terms of competition. President Obama claimed that “the countries that
out-educate us today will out-compete us tomorrow” (p. 1), echoing the competitive and
alarmist language of A Nation of Risk.
Comparing the educational system of the United States to that of other countries
is a tricky business; it is really comparing apples and oranges. A critical concept
presented by Darling-Hammond (2007) is that “most high-achieving countries not only
provide high-quality universal preschool and healthcare for children, they also fund their
schools centrally and equally, with additional funds going to the neediest schools” (p. 3).
Darling-Hammond reported that successful schools systems in other countries had high
quality teacher preparation and professional development programs, while NCLB

36
ironically called for “alternative routes that often reduce training for the teachers of the
poor” (p. 3).
Furthermore, Herman (2008) suggested that “there is only so much that public
schools can do to close an achievement gap that grows out of greater social and historical
inequities” (p. 227). He recommended health care clinics at schools, comprehensive early
childhood education, and intensive after school and summer school programs, higher
teacher salaries, and smaller class sizes, which matched Darling-Hammonds description
of what other countries were doing well.
The intensity of the demands of the standards-based movement increased with the
mandates of NCLB: students, teachers, schools, districts, and states, were now evaluated
on the basis of students’ scores on annual high-stakes tests. Competition and a business
model were applied more fully to educational policies and practice. In capitalism,
companies that cannot compete fail and go out of business. In applying these principles to
education, schools were labeled failing and increases in parental choice through vouchers
allowed some parents to move their children to other public or private schools. Some
schools were taken over by the state and some were closed, a market forces solution.
Race to the Top. President Obama’s American Recovery and Reinvestment Act of
2009 (H.R. 1--111th Congress, 2012) provided funding for education in the form of the
Race to the Top Fund which offered competitive grants for innovation that were expected
to result in improved student outcomes, increases in school system capacity, and
“increased productivity and effectiveness” (U.S. DOE, 2009, p. 2). Race to the Top
positioned states as rivals for grant money to support innovation and reform of education
polices. Winners of the competition were expected to achieve “significant improvement

37
in student outcomes, including making substantial gains in student achievement, closing
achievement gaps, improving high school graduation rates, and ensuring student
preparation for success in college and careers; and implementing ambitious plans in four
core education reform areas” (p. 2).
Summary. This section has described the evolution of the American system of
public education from the generation of a public good, an informed electorate that was
seen as necessary for a democracy of the people, to a more businesslike operation
organized around producing workers ready to compete for jobs in global markets. In the
reformed practices of education, teachers were directed to produce student outcomes
quantified as rigorous standards measured as scores on high-stakes tests. The next section
will examine what forces have advocated effectively for standardization of American
educational policies and practices.
Advocates for Standardization
The National Academy of Sciences’ National Research Council (NRC) (2013)
published a summary of its workshop Assessing the Role of K-12 Standards in States
(Beatty, 2008). They reported a “vigorous response” (p. vii) to the call for higher
standards promoted in A Nation at Risk. They reported that every state and Washington
D.C had adopted academic standards in the core subjects. NRC called standards-based
education reform a “catch all term for measures that states have taken to improve
instruction and learning by organizing both policy and practice around clear, measurable
standards” (p. 2). They described the progress of standards-based reforms the “move
toward national standards in core academic subjects” (p. vii) with an assumption of
inevitability, given that educational leaders “generally take standards based reform and

38
accountability for granted [as the] . . . central framework guiding state education policy
and practice” (p. 4). The report defined standardization this way:
It should be noted that the general term “standards” is somewhat
imprecise. In the context of the workshop it was generally used to refer to
both content standards, which describe material that students should be
expected to learn, and performance standards, which describe the level of
proficiency or mastery expected of students. Most state standards specify
both. (2008, p. 2)
Many different goals have been ascribed to the standards based movement,
including equity for disadvantaged students and improving the quality of education
(Beatty, 2008). NCLB drew on the premise that by setting high standards with
measurable goals, all students would reach proficiency in reading and math by the end of
the 2013-14 school year and that this would improve the outcomes for individual
students. These measurable goals have come to be accepted as scores on large-scale high-
risk tests and scoring well on standardized tests is assumed to be a reliable predictor of
improved life outcomes and a path out of poverty. The following sections will describe
the strongest advocates for these conceptions of the goals and values that have lately
come to dominate education policy in the U.S.
College- and career-ready. In recent years, new attention has been focused on
standards for high school graduates. Standardization in education has had no greater
champion than Gates. A corporate leader, he played a role in “framing the debate about
high schools” (Hess, 2005, p. 113). In an influential 2005 speech to the National
Governors Association, Gates, echoing A Nation at Risk, claimed that “America’s high

39
schools are obsolete . . . broken, flawed, and under-funded . . . [and] cannot teach our
kids what they need to know today” (pp. 1-3). He made an economic argument about our
nation’s lack of the “workforce of tomorrow,” comparing our high school and college
graduation rates unfavorably to “all industrialized nations” (p. 3). Gates proposed to the
governors that they adopt this goal: “declare that all students can and should graduate
from high school ready for college, work, and citizenship” (p. 5). Through his Bill &
Melinda Gates Foundation, Gates was an influential force in the American Diploma
Project (ADP) (Hess, 2005, p. 131), which was administered under the non-profit
educational policy advocacy group Achieve. Gates launched the latest language of the
standards based movement; high school students are expected to graduate “college and
career ready” (U.S. DOE, 2010a). Being career-ready was seen as requiring the same
education as being college-ready, and the standardization reform movement’s goals of
high standards with testable objectives invigorated efforts to redefine a high school
diploma as not the accomplishment of passing sufficient numbers and types of courses
but rather by passing rigorous tests to demonstrate mastery of such content as Algebra II.
ADP encouraged states to adopt high school exit examinations in an attempt to certify
what students have learned. “College and career readiness for all students seems to be
idea whose time has come” (Conley, 2010).
Achieve. Achieve (2012e) was a non-profit educational policy advocacy group
created in 1996 by a “a bipartisan group of governors and corporate leaders . . . dedicated
to supporting standards-based education reform efforts across the states” (2012d, para. 1).
Achieve was ranked by Education Week in 2006 “as one of the most influential education

40
policy organizations in the nation” (para. 2). The Bill & Melinda Gates Foundation was a
contributor, along with other corporate sponsors. See Appendix A for a complete list.
Achieve reported their analysis of states’ efforts to standardize educational policy
in Closing the Expectations Gap 2011: Sixth Annual 50-State Progress Report (2011). In
December of 2012, a detailed online presentation of the report, The States (2012e),
described how well aligned each state was to Achieve goals of standardization of
educational policy and practice regarding standards, high school diploma, assessment, P-
20 longitudinal data collection system, and accountability as well as membership in
national standardization groups. Achieve’s ratings for states college-and career ready
policies are available online (Achieve, 2012f).
Common Core State Standards Initiative. Common Core State Standards
Initiative (CCSSI) was a joint effort of the National Governors Association and the Chief
State School Officers (CCSSO). “Governors and state commissioners of education from
across the country have committed to joining a state-led process to develop a common
core of state standards in English-language arts and mathematics for grades K-12” (2013,
para. 5). In March of 2013, CCSSI reported that 45 states and DC had adopted the
Common Core Standards (CCSSI, 2013b).
Educational Testing Service. Another powerful advocate for the standardization
of K-12 public education has been Educational Testing Service (ETS). ETS identified A
Nation at Risk as sounding the “call” (Barton, 2009, p. 3) for educational reform. They
cited the urgency of “strong voices . . . arguing that the nation is in crisis without
standards” (p. 7).

41
Partnership for Assessment of Readiness for College and Careers. States that
joined the Partnership for Assessment of Readiness for College and Careers (PARCC)
consortium agreed to work together “to develop a common set of K-12 assessments in
English and math anchored in what it takes to be ready for college and careers” (2013,
para. 1). PARCC’s vision was of building a K-12 assessment system that “creates high-
quality assessments that measure the full range of the Common Core State Standards, . . .
makes better use of technology in assessments, and advances accountability at all levels”
(para. 3).
WestEd. WestEd made a serious commitment to supporting schools and districts
with standardization efforts (WestEd, 2013). WestEd drew financial support from the
some of the same corporate sponsors as Achieve, such as the Bill and Melinda Gates
Foundation (WestEd, 2012a), and provided support to states for college- and career-
readiness with some of its resources (WestEd, 2012c). WestEd also supported
educational differentiation in a variety of ways. One example was found in their Inclusive
Education Starter Kit; they pointed out that “differentiated instruction is based upon the
belief that students learn at different rates and in different ways. To accommodate the
diverse learners in any classroom, teachers must differentiate their instruction.
Differentiation is a proactive” (WestEd, 2012b, para. 1). Partnership with WestEd was an
indication that a state embraced differentiation in education policy.
Summary. There have been a number of advocates for standardization as part of
the reform of the American educational system, but Achieve has probably been the most
articulate and effective. Achieve’s focus has gone beyond merely advocating for adoption
of the Common Core Standards, supplying customer/states with testing materials, or

42
preparing Race to the Top applications. Achieve has identified many discrete measures of
standardization and maintains a comprehension data base on this subject which is
available to the public at no charge. The next section examines evidence of a narrowing
of the curriculum as a direct consequence of the educational reform around
standardization.
Narrowing of the Curriculum
The challenge of meeting curriculum targets expressed as testable standards on
large scale high-risk tests has resulted in narrowing of the curriculum (Gunzenhauser,
2003; Mathis, 2003; Vogler, 2003) so that teachers focus on tested subjects of reading
and math at the expense of social studies, physical education, arts, foreign languages,
vocational education, etc.
Findings in a survey by the National Board on Educational Testing and Public
Policy (Pedulla et al., 2003) revealed that in states with accountability testing, 79% of
teachers reported that instruction in the tested subject areas had either increased a great
deal or moderately. Additionally, more educational minutes were committed to
curriculum that was tested than on content that was not tested. “This change is seen as a
nearly unavoidable reaction to the pressure on teachers from district and state educational
leaders to raise test scores. These effects have been documented in education research”
(K. V. King & Zucker, 2005, p. 5). A study by the Council for Basic Education “found
that the greatest erosion of the curriculum is occurring in schools with high minority
populations—the very populations whose access to such a curriculum has been
historically most limited” (von Zastrow & Janc, 2004, p. 7). Narrowing of the curriculum

43
has had consequences for many content areas. The effect on social studies and science
will be described next.
Social studies. The National Council for the Social Studies (NCSS, 2013)
identified ten themes of social studies; two of them were: “power, authority, governance”
(para. 32), and “civic ideals and practices” (para. 56). Social studies has been the content
area most associated with teaching about how the electoral process works, particularly
the role of voting. According to the U.S. Secretary of Education:
NCLB . . . has created flawed incentives for states and school districts to
narrow their curricula to English and math. This fundamentally misguided
practice leaves out core disciplines that are essential to a well-rounded
curriculum, including social studies . . . as well as science, the arts,
physical education, and others necessary for a well-rounded education.
(Duncan, 2011, p. 124)
The solution offered by the Secretary was to “set higher standards and develop
better assessments” (p. 125) for social studies as well as considering adding
accountability measures. If education has a role to play in fostering voting, social studies
is the part of the curriculum that is most directly related to content knowledge of how
voting fits into democracy. Narrowing of the curriculum had the direct consequences of
loss of instructional time devoted to knowledge that supports voter participation.
Science standards. In 2012, science standards were being developed and
promoted by Next Generation Science Standards (NGSS). Achieve was managing the
promotion of the standards, which they expected to be adopted by every state (Achieve,
2012e; NGSS, 2013b). The National Science Teachers Association (NSTA) advocated

44
for accountability for mastery of science standards. “The purpose of this accountability
ultimately must be to ensure high-level student achievement in science as evidenced by
fair and multiple student assessments” (2013, para. 1).
Summary. The focus of instruction on content areas that are part of the current
Common Core Standards, reading and math, in order to prepare students to pass rigorous
tests, diverted attention from other subjects, such as social studies and science. Advocates
for these untested content areas worked to ensure that instructional time would be
committed to them. The examples of social studies and science demonstrate that in order
to assign priority to a content area, supporters proposed that standards and accountability
measures must be put in place, an apparent response to the narrowing of the curriculum
that NCLB engendered. Another content area, civics, has also fallen victim to narrowing
of the curriculum. The next section will describe the role education can play in
acquisition of civic knowledge, as an attribute of an informed electorate, and the role, if
any, that citizenship education has to play in fostering voting behavior.
Civic Knowledge
Studies of civic knowledge have been one way of exploring the indirect linkage
between education practices and voter participation. There a fundamental differences in
teaching citizenship, teaching civics, and empowering citizens to participate in elections.
Teaching citizenship can be reduced to getting along with others, “to fit in with society
and conform to societal norms” (Hope, 2012, p. 96). Civics curriculum is the study of
how government works accompanied by “respectable fantasies about the universal good
work of elected representatives both local and national” (Crick, 1999, p. 340).
Researchers who study the acquisition of civic knowledge have recently added the word

45
active to their descriptions of what effective curriculum might look like. The following
sections focus on citizenship, as conceptualized as a goal of 21st century skills, and active
civic knowledge
21st century skills and citizenship. The U.S. Department of Commerce was an
early advocate (Stuart, Dahm, & United States. Dept. of, 1999) of 21st century skills. In
2002, the U.S. Department of Education provided matching funds of $1.5 million to
create Partnership for 21st century skills. The previously described narrowing of the
curriculum may have given urgency to advocacy for “creativity” (Center for 21st Century
Skills, 2012b, para. 1).
Defining 21st century skills is somewhat problematic, because there is no clear
ownership of the concept. Trilling and Fadel described three 21st century skills (2009):
“learning and innovation skills, digital literacy skills [and] life and career skills” (2012,
para. 5). Verizon Foundation’s Thinkfinity website devoted to 21st century skills
identified the “four Cs: critical thinking and problem solving, communication,
collaboration, and creativity and innovation” (2012, para. 1).
In general, proponents of 21st century skills valued development of students’
critical thinking and problem solving, communication, collaboration, creativity,
innovation, and citizenship. However, this movement’s goals did not include education
for the political empowerment of the most disadvantaged economic classes, or anyone
else. Rather, citizenship was seen as the ability to “value and demonstrate personal
responsibility, character, cultural understanding, and ethical behavior [and the]
demonstration of proper technology use, global awareness, and moral capacity in and
outside of the classroom” (Center for 21st Century Skills, 2012, para. 8-9).

46
Some, but not all, of the funding for 21st century skills advocacy and
implementation comes from corporate sponsors like AOL Time Warner, Apple, Cisco,
Dell, and Microsoft (Assessment & Teaching of 21st Century Skills, 2012a; Partnership
for 21st Century Skills, 2012b). Advocates used the language of preparation of workers
for competition in global markets to frame the project: “all around the world . . . nations
are competing with us that never competed before” (Center for 21st Century Skills,
2012a, para 1); “ATC21S aims to offer 21st-century curricula recommendations for
education systems to support an improved workforce” (2012b, para 7); “Are They Ready
for Work?” (Partnership for 21st Century Skills, 2012a, para. 11); and "prepare citizens
with the 21st Century Skills they need to compete" (Partnership for 21st Century Skills,
2008, p. 1). Educating students to prepare them to win a competition for jobs that provide
more money, prestige and power and the accompanying greater access to resources
would seem, by definition, to be in contrast to collaboration with others and success of a
community or a nation.
Table 2 excerpts the language of empowerment and citizenship taken from the
websites of the key advocates for 21st century skills. Voter participation is not an attribute
of skills required of citizens in the 21st century skills model, as currently conceptualized
by these advocates for non-STEM education. The follow section discusses the
development of active civic knowledge as an instructional goal.
Active civic knowledge. Some scholars have promoted a definition of active civic
knowledge that refers more specifically to learning how to participate in the political
decisions of a democracy (Hope, 2012). Recent scholarship in citizenship education
incorporated the word active into the term civic participation, distinguishing between a

47
good citizen who passively follows the laws and feels patriotic and an active citizen who
“will be able to discuss whether laws work well, if they are inequitable, and how they can
be changed” (Ross, 2012, p. 7).
Another distinction was the difference between understanding how one’s
government works and being empowered to exercise political freedom (Crick, 1999).
Voting is the most obvious form of active citizenship. Ross described three other
attributes of active citizenship: “participation in social movements, . . . action for social
change, . . . [and] enterprise citizenship, . . . an economic model of citizenship activity”
(2012, p. 8). Chow (2012) developed a “general framework of civic competency . . . as a
blended measure of civic knowledge, skills, attitudes, values, beliefs, behavioral
intentions and behaviors” (p. 140) to evaluate curriculum and its effects on later behavior
including voting, “the fundamental participatory action of active citizenship” (p. 143).
Table 2
Text of Selected Criteria for Three 21st Century Skills Advocacy Groups
Center for 21st Century Skills (Education Connection)
Partnership for 21st Century Skills
Assessment & Teaching of 21st Century Skills (ATC21S)
Sponsors State of Connecticut Regional Education Service Center (Education Connection, 2012)
AOL Time Warner Foundation; Apple Computer; Cisco Systems; Dell Computer Corporation; Microsoft Corporation; National Education Association; U.S. Department of Education
Partnership for 21st Century Skills; Cisco Systems; Intel; Microsoft; Achieve; WestEd; University of Melbourne; University of Oslo; University of Minnesota; Center for Research on Educational Testing, Japan; Scottish Qualifications Authority, UK
Empowerment - - Empowering kids to succeed
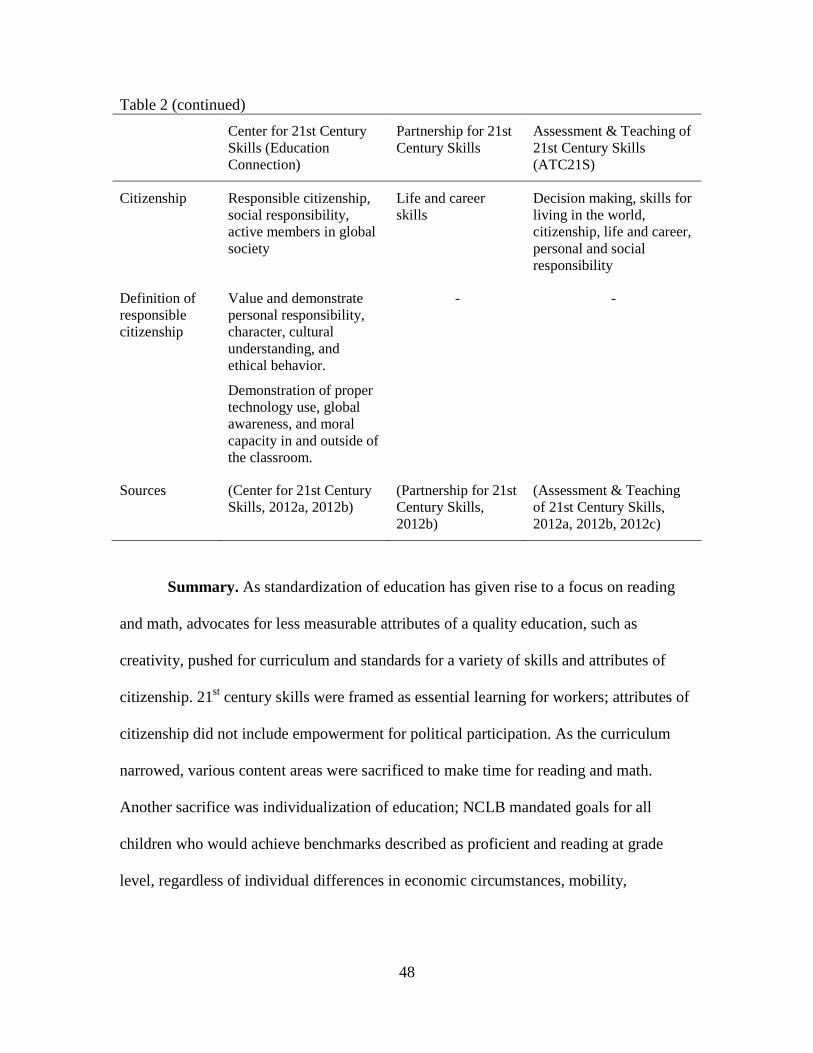
48
Table 2 (continued) Center for 21st Century
Skills (Education Connection)
Partnership for 21st Century Skills
Assessment & Teaching of 21st Century Skills (ATC21S)
Citizenship Responsible citizenship, social responsibility, active members in global society
Life and career skills
Decision making, skills for living in the world, citizenship, life and career, personal and social responsibility
Definition of responsible citizenship
Value and demonstrate personal responsibility, character, cultural understanding, and ethical behavior.
Demonstration of proper technology use, global awareness, and moral capacity in and outside of the classroom.
- -
Sources (Center for 21st Century Skills, 2012a, 2012b)
(Partnership for 21st Century Skills, 2012b)
(Assessment & Teaching of 21st Century Skills, 2012a, 2012b, 2012c)
Summary. As standardization of education has given rise to a focus on reading
and math, advocates for less measurable attributes of a quality education, such as
creativity, pushed for curriculum and standards for a variety of skills and attributes of
citizenship. 21st century skills were framed as essential learning for workers; attributes of
citizenship did not include empowerment for political participation. As the curriculum
narrowed, various content areas were sacrificed to make time for reading and math.
Another sacrifice was individualization of education; NCLB mandated goals for all
children who would achieve benchmarks described as proficient and reading at grade
level, regardless of individual differences in economic circumstances, mobility,

49
disability, or English learner status. The next section will present a comparison of
standardized education as contrasted to differentiated education.
Standardization versus Differentiation
The binary. Binary opposition was first described as an element of structuralism
(Saussure, Bally, Sechehaye, & Riedlinger, 1949). A term or concept can only be
completely understood by knowing not only what it is but what it is not; a clearly
articulated specification of the opposite of a concept is required in order to define the
concept completely. One example of the hierarchical nature of the binary (Derrida, 1976)
is the male/female binary. The constellation of attributes of human behavior is divided
into two groups, one of which is attributed to the dominant group while the other is
attributed to the subordinate group. This dichotomous sort of attributes was/is
rationalized as natural, biological, or self-evident; the male/female binary allows for
attributions of rational/emotional and instrumental/receptive.
The binary has been used to justify the otherising of the colonized by the
conqueror (Said, 1978) with a binary of white/black, imperial/colonized, orthodox/exotic,
superior/inferior, and winner/loser. The binary has been useful in explaining male
hegemony (Connell, 1995) and how we “‘do’ gender” (West & Zimmerman, 1987). The
binary enables the maintenance of power and privilege by the dominate group as both
sides of the binary accept the attributes as normal and inevitable. “Privileged groups
continue to dominate the public discourse by exerting powerful influence over the
discourse of the public media” (E. S. Herman & Chomsky, 2002).
A binary for educational standardization. Educational policy and practice can
been divided into two contrasting practices and theories, standardization and
50
differentiation (Noddings, 2010). The theory that underlies standardization is
instructionism (Papert, 1993). Instructionism is a traditional vision of knowledge as a
collection facts and procedures that teachers transmit to students. One assumption of
instructionism is that “the way to determine the success of schooling is to test students to
see how many of these facts and procedures they have acquired” (Sawyer, 2006, p. 1).
The U.S. Department of Education (US DOE) advocated for standardization (U.S. DOE,
2010a, 2010b; U.S. DOE Office of Vocational and Adult Education, 2012) as a major
theme in the latest round of education reform. Other powerful advocates for
standardization, American corporations and business leaders, have:
articulated a powerful and steady vision for the standards-based reform
movement to policymakers, educators, parents, students and the public
about the urgency of school reform. This school reform movement rests on
high academic standards, rigorous assessments that measure achievement
and real accountability for results at all levels of the education system.
(Business Tools for Better Schools, 2012, para. 2)
While some promoted standardization, others argued for differentiation
(Noddings, 2010; Smutny, 2003; Wood, 2002). “We do not need to standardize. We need
to differentiate—to offer a greater variety of courses” (Noddings, 2010, para. 9).
Teachers rarely teach in homogenous classrooms; usually their students have “significant
differences in learning styles, skill and ability, and linguistic and cultural background.
These differences make the ‘one size fits all’ principle inoperative” (Smutny, 2003, p. 7).
With each passing year, general education teachers face the additional challenges of an
increasing inclusion of children with disabilities and greater numbers of students for

51
whom English is a second language. “Without question, one of the primary concerns of
classroom teachers throughout the nation is how to meet the ever increasing diverse
learning needs of students in our classrooms today” (Wood, 2002, p. 155).
The theory that underlies differentiation is constructivism (Piaget & Gabain,
1932; Vygotskii & Cole, 1978). Constructivism is antithetical to instructionism (G.
Johnson, 2009). Rather than seeing a student as a recipient of knowledge, in a
constructivist description of the learning process a student constructs knowledge by
interacting with the environment in developmental stages such as concrete and abstract
operations (Piaget & Gabain, 1932). A student constructs meaning as a result of
interacting with content that is within that individual’s zone of proximal development
(Vygotskii & Cole, 1978). Cognitive or learning science (Sawyer, 2006) elaborates on
these theories. The learning sciences incorporate “the importance of deeper
understanding, . . . focusing on student learning in addition to teaching, . . . creating
learning environments, . . . the importance of building on a learner’s prior knowledge,
[and] . . . the importance of reflection” (p. 2). Sawyer contrasted instructionism with
“learning knowledge deeply [based on] findings from cognitive science” (p. 4). He
described the attributes of flexible and inventive knowledge workers who collaborate and
adapt to changing circumstances “in complex social settings” (p. 5). “Authentic
practices” (p. 4) are a pedagogical response to Sawyer’s desirable outcomes, in which
differentiated instruction allows students to engage in inquiry rather than merely
memorize facts.
Educational standardization can be subject to a critical theory lens that applies the
concept of the binary, in which educational standardization is the dominant half of the

52
opposing pairs of terms and differentiation is the subordinate half. Table 3 presents a
Dichotomous Sort of Accountability Concepts, one way of thinking about the contrast
between standardized and differentiated educational practice and the policies that support
these contrasting visions.
Summary
Educational standardization has been a process that matches the rise of
corporatization of American life. Business values of efficiency and market driven
strategies of competition, rewarding success and punishing failure, have slowly and
incrementally taken over the guiding vision of education. Narrowing of the curriculum
has been a natural consequence of the standards based movement, particularly as
manifested in NCLB. Solutions to the problem of the narrowing of the curriculum, as
promoted by educational leaders like Secretary of Education Duncan, focused on
including social studies as a content area subject to mandatory testing and accountability,
while science teachers advocated for adding science to the list of content areas for which
teachers and schools must be held accountable. Even advocates of the development of
creativity in school children (21st century skills) framed this as beneficial to workers in
the service of the businesses who employ them when they graduate, college- and career-
ready.
Some make the argument that goals for all children, manifested in expected
mastery of explicit standards based on a child’s chronological age, do not adequately
address the wide variety of student strengths and weakness. Differentiation of instruction
to meet the needs of individuals can be seen as an alternative to standardization.

53
Table 3
Dichotomous Sort of Accountability Concepts
Standardized Differentiated
Commerce; business; industry; technological innovation; blueprint
Educated populace; enlightened participation; respect for the individual; personal agency
Cost-benefit; inputs/outputs; efficiency Optimal outcomes for individuals
Produces workers; world markets Individual responsibility, freedom, and benefits
Competition to succeed; winners and losers Collaboration among peers
Accountability; blame, failure Support; professional development
Sanctions, punishment; choice, privatization Funding; opportunity to learn; equitable facilities
High standards; setting the bar high Zone of proximal development (ZPD); Response to Intervention (RTI)
High expectations for all students Optimal outcomes for each student
High school diploma based on passing proficiency exams (Algebra II, etc.)
Various levels of diploma with certifications for Algebra II and other gateway courses
Meritocracy / sorting of students by “ability” to prepare them for jobs in business and industry
Respect for the individual; play is the work of children; constructivism; active learning; higher order thinking skills, creativity, entrepreneurship
Large scale testing; accountability Needs of the whole child; school climate
Summative assessments drive performance Formative assessments inform instruction
Measuring for effective teachers (VAM) Teacher learning communities
Testing; measurement Active learning; SEL, developing human consciousness, social responsibility, life skills
Teacher dominated classroom Student centered classroom
Science, Technology, Engineering, and Mathematics (STEM)
Foreign languages, vocational shops, history, political science, art, music, theater, sports, citizenship, philosophy, physical education, health education, family and consumer studies
B.F. Skinner, Adam Smith, A Nation at Risk Vygotsky, Piaget, Dewey, Jefferson, Du Bois

54
Conclusion
Few would argue against the notion that U.S. public education should produce, as
Jefferson envisioned, an informed electorate. Unfortunately, as standardized education
policies and practices have increased, voter participation has remained low compared to
other countries and has declined or at least fluctuated, while continuing to vary
substantially between groups and among states. Of the many factors investigated for their
relationship to voter participation, education stands out not only because it has been
consistently related to improved outcomes, but also because offers a path for action.
While we cannot easily redistribute the wealth and thus change a person’s economic
status, we can distribute more education. Unfortunately, the mechanism by which more
education increases voter turnout is not easily understood and is confounded by other
variables. Evidence does support the role of education as a moderator to challenges of
institutional voter suppression, as well as poverty, mobility and other obstacles to voting.
The evidence assembled in this literature review does not provide any evidence
that the standardization of public education is intended to support voter participation.
Ross advocated for an education system that foments active citizenship; “the curriculum .
. . must help the individual understand both their own identity and the nature of society,
and how to actively engage with the complex relationship of rights and responsibilities
that exist between the two” (p. 7). Hope argued for “experiential learning” (2012, p. 99)
for students who were to be valued as citizens in the contemporary moment, rather than
prepared from some abstract future citizenship. “Making democracy work requires that
schools take this goal seriously: to educate and nurture engaged and informed democratic
citizens” (Kahne & Westheimer, 2003, p. 36).

55
Is there a relationship between a state’s commitment to standardization and to
voter participation? Do states that embrace the new vision of educational reform also
institutionalize obstacles to voting? If there is a relationship between state educational
standardization and state voter turnout, it will provide a direction for critical scholars and
others who theorize on the role public education can and should play in producing an
informed electorate. A finding of a negative correlation informs policy makers about the
unintended consequences of an emphasis on Common Core content at the expense of
other content areas. If no relationship is found, the importance of empowering
disadvantaged groups will not be diminished; such research helps direct the attention of
scholars to other more fruitful avenues of investigation. This study asked four questions.
Research Questions
1. What is the relationship between a state’s level of educational standardization
and its voter turnout in the 2012 national election?
2. What is the relationship between a state’s level of educational standardization
and change in that state’s voter turnout between 2000 and 2012?
3. What institutional factors affect educational standardization and voter turnout?
4. What cultural and demographic attributes provide context for understanding a
state’s level of educational standardization and voter turnout?

56
CHAPTER III
METHODS
This exploratory investigation examined the relationship between educational
standardization and voter turnout for states. This exploratory research was framed by
cultural theory and critical theory lenses. It relied also on the methodology of
complementarity mixed-methods research design, which allowed for an exploration of
both quantitative and qualitative data in order to generate knowledge and refine questions
around educational standardization, voter turnout, and the proper role of education.
A cultural theory lens explained “policy regularities (patterns of policy activity
resulting from a state political culture . . . [focusing] on belief systems and external
societal variables as driving policy activity, particularly at state level” (Heck, 2004, p.
322). A cultural theory design utilized case study, was non-experimental, and policy
decision was the conceptual unit of analysis. Using a cultural theory lens, regularities in
state policy behavior and differences between states were explained by a set of basic
concepts including value preferences, in this study the Dichotomous Sort of
Accountability Concepts.
A critical theory lens can “examine how systemic features structure, disguise,
suppress, and silence conflict for marginal groups” (Heck, 2004, p. 24). The
Dichotomous Sort of Accountability Concepts drew directly on the critical theory concept
of a hierarchical binary as a tool for reification of power and privilege (Connell, 1995;
Derrida, 1976; E. S. Herman & Chomsky, 2002; Saussure et al., 1949; West &
Zimmerman, 1987). A first iteration of the Standardized Educational Index (SEI) was

57
developed to measure state level of standardization as part of the quantitative component
of the study.
In the qualitative component, elements of both cultural theory and critical theory
lenses framed exploration of two exemplar states’ institutional factors and cultural,
geographic, and demographic attributes regarding the nature and formation of their
educational standards and accountability Administrative Rules (ARs) and voter
regulations (Heck, 2004). “Flexibility in examining a policy problem from alternative
perspectives . . . opens up new possibilities for understanding problems in expansive
ways that move us toward viable policy solutions” (p. xxii).
Research Design
Complementarity Design
A mixed-methods study is an approach to social inquiry involving “the planned
use of two or more different kinds of data gathering and analysis techniques” (J. Greene,
Kreider, & Mayer, 2005, p. 274). One model for understanding mixed-methods research,
depicted in Figure 8, identifies seven purposes for mixing methods—triangulation,
complementarity, expansion, iterative, embedded/nested, holistic, and transformative (J.
Greene & Caracelli, 1997).
Component designs of triangulation and expansion types and integrated designs of
iterative, embedded/nested, holistic, and transformative types look contemporaneously at
both quantitative and qualitative aspects of a topic or subject. In contrast, the
complementarity design is sequenced; it seeks to enhance or clarify an aspect of the study
(J. Greene & Caracelli, 1997). “In a complementarity mixed-method study, qualitative
and quantitative methods are used to measure overlapping but also different facets of a

58
phenomenon, yielding an enriched, elaborated understanding of that phenomena” (J.
Greene, Caracelli, & Graham, 1989, p. 258). Complementarity is an appropriate design
for this study, which starts with a quantitative analysis of observable facts and then
follows up with an in-depth examination of the nature of the phenomena.
As previously noted in the first chapter, in this work the terms standardization or
standardized mean uniformly administered to meet set standards. The SEI is a measure of
the extent to which states’ K-12 educational practices are uniformly administered to meet
set standards. This is to be differentiated from the standardization of scores for statistical
analysis, such as the generation of z-scores, which is indicated by the term statistically
standardized.
Designs for mixed methods research
Component designs: methodologically discrete, combination at level of interpretation only
triangulation seeking convergence on one aspect
complementarity seeking enhancement or clarification of an aspect
expansion considering different aspects (side-by-side)
Integrated Designs: integrate methods and elements of different paradigms
iterative interplay of different methodologies over time (multiple stages)
embedded/nested one methodology set in "creative tension" within another contrasting method of inquiry
holistic interdependent methodologies working simultaneously with complex data
transformative valuing the dialog across different traditions; value-based and action oriented
Figure 8. Mixed-Methods Research Designs (J. Greene & Caracelli, 1997, p. 18)

59
Quantitative Design
This study was conducted in two stages. First, the quantitative component
developed a tool for measuring state levels of educational standardization, the
Standardized Education Index (SEI), modeled on Richard Florida’s Creativity Index
(2002). The SEI will be useful in a variety of contexts to help answer research questions
involving comparisons between states involving standardization of K-12 public
education. In this study, a 2012 measure of SEI and state voter turnout data were used to
answer two questions:
1. What is the relationship between a state’s level of educational standardization
and its voter turnout in the 2012 national election?
2. What is the relationship between a state’s level of educational standardization
and change in that state’s voter turnout between 2000 and 2012?
Qualitative Design
The second stage of the project was an in-depth analysis of two states. A
“common purpose for combining qualitative and quantitative methods is to use the results
from one method to elaborate, enhance, or illustrate the results from the other” (J. Greene
et al., 1989, p. 266), sometimes called “peeling back the layers of an onion” (Creswell,
2008, p. 183).
In the qualitative component of this study, emergent cross-case analysis explored
and described relevant data for two states selected on the basis of the quantitative
component to suggest answers to the final research questions:
3. What institutional factors affect educational standardization and voter
turnout?

60
4. What cultural and demographic attributes provide context for
understanding a state’s level of educational standardization and voter
turnout?
The Steps
There were several steps in this study’s methods. The quantitative component
started with the collection of data that supported the SEI and the calculation of state SEI
scores. Next was the collection of comparable data on state voter participation in national
elections for 2000 and 2012. Statistical analysis determined any correlative relationship
between the two variables.
An examination of the results of the relationship between the 2012 SEI and the
2012 VEP data led to the purposeful selection of two states for the quantitative
component; Arkansas and New Hampshire were chosen as the two states for case study
and a cross-case exploration was conducted and a description was written. Table 4
provides a step-by-step description of these steps. The following sections describe the
quantitative and qualitative components and address validity issues.
Quantitative Component
The quantitative component of the study had two key variables, the SEI and voter
turnout. The SEI was used to calculate a state’s level of standardization compared with
other states. Voter participation data relied on the United States Elections Project (USEP)
data for 2000 and 2012 (M. McDonald, 2011a, 2012b). Correlation analysis determined
any relationship between a states’ SEI and its voter participation rate. The first correlation
analyses tested for a relationship between state’s SEI and its 2000 and 2012 voter

61
participation levels. The other correlation analysis tested for a relationship between a
state’s SEI and any increase or decrease in voter turnout between 2000 and 2012.
Table 4
Dissertation Methods Steps
Sequence Item Details
1 SEI Collect SEI data, determine scores.
2 Voter participation Collect voter participation data, prepare for analysis.
3 Data analysis Using SPPS, run correlation tests for two research questions.
4 Interpretation Examine the results for relationships and interpret.
5 Selection of cases Choose two exemplar states for cross-case exploration.
6 Exploration Collect equivalent data for each state regarding the two variables, synthesize, and report.
Data Collection: Standardized Education Index
Drawing on the Creativity Index developed by Richard Florida (2002), the SEI
was developed as a tool for measuring state levels of educational standardization. The
next sections describe the literature relevant to the creation of the SEI, the construct of
standardized K-12 education, similarities and differences between Florida’s Creativity
Index and the SEI, and finally describe the SEI and its indicators.
Research basis for the SEI. An index is “a number derived from a formula, used
to characterize a set of data” (The Free Dictionary, 2013, para. 7) or “a number (as a
ratio) derived from a series of observations and used as an indicator or measure”
(Merriam-Webster, 2013, para. 7). This study developed a tool for evaluating state levels
of educational standardization, the SEI, modeled on Richard Florida’s (2002) Creativity
Index.

62
Knowledge workers are those who think for a living (Sawyer, 2006). Such
employees include software engineers and architects; they are a hypothesized desirable
economic outcome of a public education that goes beyond instructionism. The concept of
a Creative Class is another approach in describing attributes of similarly desirable
workers. Florida (2002) invented the creativity index and used it to compare the creativity
of geographic regions as a variable that was useful in predicting economic outcomes.
Florida posited that members of the Creative Class achieve economic and social
power in their “roles as purveyors of creativity” (p. ix). Florida developed contextual or
environmental indicators that correlated with the presence of the creative class. He
described a set of places which he termed “creative centers” (p. 218). His research
showed that creative centers were magnets for the creative class and primed these regions
for economic growth.
Florida divided workers into four categories, Creative Class, Super-Creative Core,
Working Class, and Service Class. His Creativity Index was comprised of four indicators:
the representation of the creative class in the workforce; innovation as measured by
patents per capita, the ranking of cities as a high-tech centers, and diversity, as measured
by the “Gay Index, . . . a measure which explores the location patterns of gay people” (p.
x). Using his Creativity Index, Sawyer identified “the San Francisco Bay Area as the
nation’s undisputed leader in creativity” (p. 244). There has been some criticism of
Florida’s causality claims connecting the Creative Class with regional economic growth
(Glaeser, 2005; Peck, 2005; A. Scott, 2006), but Glaeser saw his concern as “a small
quibble” (2005, p. 596). Some support for Florida’s creativity indicators has been found
by other researchers (Clifton, 2008; Lorenzen & Vaarst Andersen, 2005). One study

63
found that several researchers had tested “Florida’s claims about the causalities between
labor and capital in a European context . . . [and] found good correlations among the
presence of a creative class, ethnic diversity, cultural services, and economic growth in a
European context” (Lorenzen & Andersen, 2009, p. 368).
Most important to this dissertation, Florida developed a theoretical framework for
matching a theoretical construct (the Creative Class) with a geographical location (a
creative class region), using a measurement tool (the Creativity index), that draws on
indicators (share of workforce, innovation level, high-tech industry ranking, and diversity
measure). To justify the geographical location of a creative context, Florida devised a
creativity indicator with four variables, a percentage of workers who were members of
the creative class, rate of innovation, a measure of high-tech development, and the Gay
Index of cities.
Defining a construct. The SEI is a measure of the extent to which a state’s
policies and practices are organized and administered around clear, measurable standards.
The SEI is intended to reflect a state’s development of both content and performance
standards in compliance with the current emphasis on large-scale high-risk testing driven
by an emphasis on efficiency and accountability. A key aspect of state standardization is
collaboration and cooperation with other states in developing uniform and shared
standards as expressed in the Common Core Standards. Variability of the SEI within the
population of U.S. states and of voter turnout for states allowed for analysis of
relationships between a state’s SEI and its voter turnout.
Comparison. While Florida’s creativity index identified four contextual or
environmental indicators that correlated with the presence of what he termed the creative

64
class, the SEI identified nine indicators of standardized education to measure states’ level
of educational standardization. Florida described a set of places which he termed
“creative centers” (2002, p. 218). His research showed that the geographic areas that
qualified as creative centers were magnets for the creative class and primed these regions
for economic growth. The SEI has been used here to investigate relationships between
states’ SEI scores and their levels of voter turnout.
The 2012 SEI. The SEI used in this study was based on nine indicators of
educational standardization, summarized in Table 5. A state’s SEI score was calculated
using a counting system ranging from zero to nine, with zero assigned to a state with no
indicators of a standardized educational context and nine being the strongest indicator of
a standardized educational context for a state. Statistical standardization of the SEI scores
(standardization of coefficients) was utilized to generate z-scores to represent each state’s
SEI score.
Indicators 1 through 8. A key source of data for SEI was Achieve (2012e), a
non-profit educational policy advocacy group created in 1996 by a “a bipartisan group of
governors and corporate leaders . . . dedicated to supporting standards-based education
reform efforts across the states” (2012d, para. 1). Achieve was ranked by Education Week
in 2006 “as one of the most influential education policy organizations in the nation”
(para. 2). Achieve reported their analysis of states’ efforts to standardize educational
policy in Closing the Expectations Gap 2011: Sixth Annual 50-State Progress Report
(2011). In December of 2012, a detailed online presentation of the report, The States
(2012e), described how well aligned each state was to the Achieve goals of
standardization of educational policy and practice regarding standards, high school

65
diploma, assessment, P-20 longitudinal data collection system, and accountability as well
as membership in national standardization groups.
Table 5
SEI Indicator Descriptions and Sources
Indicator Title Description Source
1 Standards Align high school standards with the expectations of college and careers
(Achieve, 2012e)
2 High school diploma Align highs school graduation requirements with college- and career-ready expectations
(Achieve, 2012e)
3 Assessment Develop college- and career-ready assessment systems
(Achieve, 2012e)
4 P-20 Develop P-20 longitudinal data systems (Achieve, 2012e)
5 Accountability Develop accountability and reporting systems that promote college and career readiness
(Achieve, 2012e)
6 College- and career-ready goals
Member of Achieve’s ADP Network (Achieve, 2012e)
7 Standardized growth model across states
Member of PARCC (Achieve, 2012e)
8 Leader in standardizing science
NGSS lead partner state (Achieve, 2012e)
9 Common core standards
Adopted Common Core Standards for math and English language arts
(ASCD, 2012b; CCSSI, 2012)
Indicators 1-5. Of the indicators drawn from Achieve data sources, the first five
indicators were drawn directly from Achieve’s ratings for states College- and dareer-
ready policies (Achieve, 2012f). as detailed in Figure 9, the Achieve website entry for the
state of Tennessee (Achieve, 2012f). The full report for Tennessee can be found in
Appendix B.

66
College and Career-Ready Policy
Align high school standards with the expectations of college and careers Yes
Align high school graduation requirements with college- and career-ready expectations
Yes
Develop college- and career-ready assessment systems Yes
Develop P-20 longitudinal data systems
Develop accountability and reporting systems that promote college and career readiness
Figure 9. Detail of Achieve Policy Goals for Tennessee (Achieve, 2012f)
Indicators 6, 7 and 8. The next three indicators reported states’ membership status
regarding three standardization groups, all reported by Achieve as evidence of
standardization. Indicator 6 was membership in ADP (Achieve, 2012e); indicator 7 was
membership in the PARCC consortium (2012e); and indicator 8 reflected a state’s status
as a Next Generation Science Standards (NGSS) Lead Partner state (2013a).
Indicator 6 drew on a source related to Achieve, the American Diploma Project
(ADP) (Achieve, 2012e). Achieve launched ADP in 2005 “to make college and career
readiness a priority in the states” (Achieve, 2012b, para. 1); ADP was the direct result of
Bill Gates’ advocacy and funding in support of college- and career-readiness (Hess,
2005). “Through the ADP Network governors, state education officials, postsecondary
leaders and business executives work together to improve postsecondary preparation by
aligning high school standards, graduation requirements and assessment and
accountability systems with the demands of college and careers” (Achieve, 2012b, para.
2). State membership in ADP was a strong indication of adoption of college- and career-

67
ready goals, in alignment with a key goal of the standards movement as promoted by
Achieve.
Indicator 7 drew on Achieve website data (Achieve, 2012e) on states’
membership in the PARCC consortium. In 2012, membership in PARCC reflected a
state’s affiliation with other states sharing the goal of aligning educational standards,
assessments, and policies, a standardized growth model across states. The theory of
action section of the consortium’s Race to the Top application (2010) provides evidence
of the standardization reform that underlies PARCC’s operating principles.
Two key consortiums of states emerged in the Race to the Top grant application
process. PARCC was led by the Florida DOE (PARCC, 2010) and Achieve (2012a), and
Smarter Balanced Assessment Consortium (SBAC) (2012), was led by the Washington
State DOE (SBAC, 2010) and WestEd (2011). Race to the Top applications required
documentation of a theory of action. Instructions for this federal grant money specified
the inclusion of “a theory of action that describes in detail the causal relationships
between specific actions or strategies in the eligible applicant’s proposed project and its
desired outcomes for the proposed project, including improvements in student
achievement and college- and career-readiness” (Willhoft, 2010, p. 19).
Drawing the binary standardized/ differentiated presented in the Dichotomous
Sort of Accountability Concepts (see Table 3), the theories of action presented by the
PARCC and SBAC consortiums reveal divergent rationales, with PARCC supporting a
standardization framework and SBAC prioritizing differentiation of instruction to
respond to the varying strengths and weakness of individual students, as well as less
regimentation of expectations for teacher performance. The PARRC application offered

68
an assessment driven system. Key concepts included: students “are on a trajectory for
postsecondary success; . . . where gaps may exist and how they can be remediated; . . .
enter the workforce; . . . proposed assessments are one lever for improvement, and . . . the
assessments’ success is tied to the strength and rigor of classroom curriculum” (2011, pp.
34-35). In contrast, the theory of action in the SBAC application featured: “assessments
are structured to continuously improve teaching and learning; . . . teachers involved in
development and scoring of assessments; . . . assessments produce evidence of student
performance; [and] multiple measures” (2010, pp. 32-33). Building on the language
embedded in the PARRC theory of action and that of SBAC, a dichotomous sort of
concepts is presented in Table 6. For supporting text from the PARCC and SBAC theory
of action sections of their Race to the Top applications, see Appendix C.
Table 6
Sample Language from PARCC and SBAC Race to the Top Applications
PARCC SBAC
Assessments are a lever to improve the education system.
Assessments are structured to continuously improve teaching and learning.
Assessments success is tied to the strength and rigor of classroom curriculum.
Teachers should be involved in the creation of assessments.
Students are on a trajectory for success or failure; gaps exist and should be remediated.
Assessments provide evidence of student performance.
Table 7 presents an interpretation of the theories of action, corresponding to the
PARCC and SBAC Race to the Top applications, which helps contextualize the use of
PARCC membership as an indicator of a state’s level of standardized education by
comparing it to SBAC’s underlying values. The SBAC theory of action was orientated
less towards all students achieving standardized goals and more towards differentiation of

69
instruction, relying less on scores on high-stakes large scale tests as the measure of a
successful student, teacher, and educational process and more on goals of teacher
collaboration to produce success.
Indicator 8 reflected a state’s status as a Next Generation Science Standards
(NGSS) Lead Partner state (2013a). In December 2012, Achieve identified “lead state
partners [taking responsibility to] provide leadership to . . . other states as they consider
adoption of the NGSS, and address common issues involved in adoption and
implementation of the [NGSS] standards” (Achieve, 2012c, para. 1). NGSS leadership
status was evidence of a state’s promotion of educational standardization; the list of tasks
to which lead partner states agreed included sending a representative to NGSS meetings
to plan adoption and implementation of state science standards and publicizing the work,
including promoting a timeline for adoption of the standards (Achieve, 2012c). (See
Appendix D for the complete list of state responsibilities.)
Table 7
Comparison of the Theories of Action of PARCC and SBAC
Standardized (PARCC) Differentiated (SBAC)
High expectations for all students Optimal outcomes for each student
Summative assessments drive performance Formative assessments inform instruction
Competition to succeed Collaboration among peers
Measuring for effective teachers (VAM) Teacher learning communities
Accountability, failure, sanctions Support, opportunity to learn
70
Indicator 9. A state’s adoption of the Common Core Standards was a strong
indication of attempts to standardize education. The website of the Common Core State
Standards Initiative (CCSSI) (2013a) states:
The standards clearly communicate what is expected of students at each
grade level. This will allow our teachers to be better equipped to know
exactly what they need to help students learn and establish individualized
benchmarks for them. The Common Core State Standards focus on core
conceptual understandings and procedures starting in the early grades, thus
enabling teachers to take the time needed to teach core concepts and
procedures well—and to give students the opportunity to master them.
With students, parents and teachers all on the same page and working
together for shared goals, we can ensure that students make progress each
year and graduate from school prepared to succeed in college and in a
modern workforce. (para. 1-2)
Another advocate for the adoption of the Common Core Standards was ASCD
(formerly known as the Association for Supervision and Curriculum Development), a
membership organization of 150,000 superintendents, supervisors, principals, teachers,
professors of education, and school board members from 145 countries (2012a). Indicator
9 reported a state’s adoption of the Common Core Standards, drawing on data provided
on the CCSSI website on the states that had adopted the Common Core Standards in
December of 2012 (CCSSI, 2012). This information is detailed in Appendix E. the next
section describes the data collection for the other variable in the study, state voter
participation.
71
Data Collection: Voter Turnout
Choosing the source for data on voter participation at the state level for the 2000
and 2012 general elections was a complex process. An examination of the literature
revealed that there were two kinds of data sources for U.S. voter participation levels used
in peer-reviewed studies. The first was actual vote counts and data based on those counts.
The second was based on surveys, or self-reports. Actual vote counts are more reliable
than self-reports of voting behavior. The most obvious choice for data on actual vote
counts was The U.S. Census Bureau (USCB) but their report of voter turnout by state for
the 2012 election was not available in December of 2012 while data was being collected
for this study.
An investigation into an alternative reliable source for comparable data for 2000
and 2012 started with phone calls to USCB, moved to the Clerk of the U.S. House of
Representatives (Clerk of the House), and then led through a labyrinth of governmental
agencies. Each individual contacted was interviewed to get leads on reliable data for the
2012 election. The most useful conversation with a government official was an interview
with Underhill (2012), a Senior Policy Specialist at the National Conference of State
Legislatures (NCSL), Elections and Campaigns Division (NCSL, 2013). She
recommended two experts in the country who generate reliable data on voter participation
levels for the 2012 (and other) elections, McDonald and Gans. The following sections
describe the kinds of data sources used in peer-reviewed studies involving voter turnout,
results of the investigation of a reliable source of voter turnout data for the 2000 and 2012
presidential elections, and the decision process utilized to select a data source for this
study.

72
Data sources in peer-reviewed studies. Relevant reports of research discussed or
referenced in this work were examined for the sources of voter participation data. Studies
before 1997, studies that did not cover U.S. national elections, and studies that were at
the most local levels (lower than state level) were screened out. Additionally, a search of
all University of Oregon (UO) Library databases for the term “voter turnout” provided
some insight into how other researchers determine voter turnout for the purposes of
quantitative statistical analysis. Of 120 records located, some germane studies were
identified. Next the UO Library databases were searched for the term “voter
participation.” 120 items were located, of which five relevant sources were not redundant
and have been included in the following analysis of sources of voter turnout in recent
relevant studies published in peer-reviewed journals. Most of the studies relied on self-
report survey data; altogether, one study was located that used actual vote counts and one
that used VEP data based on the actual counts. In the next sections, peer-review studies
are examined for their data sources; first, official sources are examined, then, data based
on actual vote counts, next survey sources, and finally some online and ambiguous
sources are discussed.
U.S. Census Bureau. USCB (2012a) provided official reports of voter turnout,
drawing on official reports from the Clerk of the House. One example is Table 397.
Participation in Elections for President and U.S. Representatives (para. 1), which
reported the raw data of participation in presidential elections from 1932 to 2010. USCB
was a reliable source of voter participation data. Exact data on election participation up
through 2010 was available for each state on the USCB website. In order for this to be
study contemporary and relevant, it was desirable to use data from the 2012 election, but
73
that information had not been made available on the USCB website by late December of
2012. After a day of phone calls to various governmental agencies, it became clear that
no U.S. agency, including the USCB, would make available data on the 2012 election
results for months. Predicted publication dates ranged from spring to fall of 2013.
Clerk of the U.S. House of Representatives. The Clerk of the House has
provided the official records of voter turnout in federal elections since 1920 (2013). A
phone call to the Clerk of the House in late December of 2012 elicited the information
that producing official records of voter turnout depends on states submitting legally
sanctioned documents, a process which takes much longer than the accounts of voter
turnout reported by states to the public at the time of an election. The predicted release
date of official U.S. government reports for the 2012 presidential election was spring of
2013 or later, too late to be used as the data collection for this study. Clerk of the House
voter turnout data was used in one study, (Plane & Gershtenson, 2004). This study relied
on survey data as well and is reported again below.
United States Election Project. Underhill recommended McDonald (2011a,
2012b) as an expert whose work supplied reliable data on voter participation levels for
the 2012 and other elections (Underhill, personal communication, December 31, 2012).
USEP voter turnout relied on federal and state official reports of voter turnout.
McDonald’s data, reported on the USEP website, differentiated between VAP and VEP.
Two studies utilized this work (M. McDonald & Popkin, 2001; Tolbert & Smith, 2005).
Gans. Underhill also identified one of the authors of Voter Turnout in the United
States 1788-2009 (Gans & Mulling, 2011), as a nationally recognized expert on voter
turnout. The book, which is available in electronic form online, was based on and
74
reported the work of the Center for the Study of the American Electorate. Tables in the
book provided VEP data for presidential elections using calculations similar to
McDonald’s USEP formulas. A phone conversation was conducted with Gans on
December 31, 2012. He predicted that his work on the 2012 election would be made
available to the public in a few weeks, not in time for the data collection phase of this
study.
U.S. Census Bureau’s Current Population Survey. One popular source of voter
participation rates has been survey data presented in the U.S. Census Current Population
Survey (CPS). “The CPS is a monthly survey of about 50,000 households conducted by
the Bureau of the Census for the Bureau of Labor Statistics. The CPS is the primary
source of information on the labor force characteristics of the U.S. population” (U.S.
Department of Commerce, 2013, para. 1). Well respected because of its large sample
size and detailed demographic information, it reports survey results about, “citizenship
status, registration and voting” (N. H. Wolfinger & Wolfinger, 2008, p. 1516). Some
quantitative studies published in peer-reviewed journals depended on CPS voter
participation data (Blakely et al., 2001; Bueker, 2005; Flavin, 2012; R. A. Jackson, 2003;
Logan et al., 2012; M. McDonald, 2008; Tenn, 2005, 2007; Vonnahme, 2012; N. H.
Wolfinger & Wolfinger, 2008; Xu, 2005)
American National Election Studies. The American National Election Studies
(ANES), often referred to as NES, or in older research as the Michigan Studies, used
surveys to gather data on voter turnout and other forms of political participation. Besides
CPS, it was “the other common source for analyses of electoral participation, completed
pre- and post-election interviews” (N. H. Wolfinger & Wolfinger, 2008, p. 1516). The

75
NES Time Series Studies collects before and after survey data for presidential years.
Numerous studies, as reported in peer reviewed journals, relied on ANES, NES, or the
Michigan studies for data on voter participation (Adams, Dow, & Iii, 2006; Blais &
Rubenson, 2012; Burden, 2009; A. L. Campbell, 2002; Fullerton & Borch, 2008;
Fullerton & Stern, 2010; Goldstein & Ridout, 2002; Green & Shachar, 2000; K. Greene
& Nikolaev, 1999; Killian, Schoen, & Aaron, 2008; Plane & Gershtenson, 2004; Squire
et al., 1987; Timpone, 1998; Tolbert & McNeal, 2003; N. H. Wolfinger & Wolfinger,
2008),
National Center for Education Statistics. The National Center for Education
Statistics (NCES) (IES, 2013b) collected survey data on a nationally representative
sample of students, starting when they were in eighth grade, which was then reported in
the National Education Longitudinal Survey, 1988-2000 (NELS). Among other things,
NELS collected data on voter participation of respondents in the 1992 and 1996
presidential elections. NELS was the data source in peer-reviewed studies featuring
quantitative analysis of voting behavior (Frisco et al., 2004; Pacheco & Plutzer, 2007;
Sandell & Plutzer, 2005). One part of the NELS data collection was made available as the
High School & Beyond data set (IES, 2013a), which was used in one relevant study (Dee,
2004). The Baccalaureate and Beyond Study (ANES, 2013) was another data collection
by NCES; it was used in one study of voter participation (Hillygus, 2005).
National Black Election Study Series. The Program for Research on Black
Americans at the Institute for Social Research, University of Michigan started collecting
survey data in 1984 in The National Black Election Study series (NBES), relying on the
Ford Foundation, the Rockefeller Foundation, and the Carnegie Corporation for funding.

76
The survey design of pre-and post- presidential election interviews allowed for
monitoring of changes in Black political views and actions. (J. S. Jackson, Gurin, &
Hatchett, 2013). NBES survey data was used for two relevant studies (Chong & Rogers,
2005; Wilson, 2012) reported in peer-reviewed journals.
The National Annenberg Election Survey. The National Annenberg Election
Survey (NAES) (University of Pennsylvania, 2013) examined political attitudes about
candidates. utilizing internet and phone surveys. NAES was the source of voter
participation data in one study (Flavin, 2012) reported in a peer reviewed journal.
Roper Social and Political Trends. Roper Social and Political Trends Data,
1973-1994 (Roper Center, 2013) “includes selected items from 207 public opinion
surveys conducted as part of the Roper Reports series by the Roper Organization or its
successor organization RoperASW between 1973 and 1994. More than 400,000 unique
respondents are included in this cumulative file” (para. 3). This survey data source was
used in one quantitative study (Platt, 2008), as reported in a peer-reviewed journal.
Researcher surveys. Some studies into voter participation relied on surveys
developed by the researchers themselves. This research on voter turnout was based on
surveys by internet, phone or in-person interviews that utilized questionnaires created (or
assembled from other sources) and conducted by the researchers themselves (Claassen,
2008; Fowler & Dawes, 2008; Mann, 2005; J. Parry, Barth, Kropf, & Jones, 2008; Schur,
Shields, Kruse, & Schriner, 2002).
Online data sources. One peer-reviewed quantitative analysis of voter turnout of
American youth (Pacheco, 2008) relied on two websites. The first was sponsored by
Harvard University, The Record of American Democracy (ROAD) (G. King &

77
Palmquist, 1999). The other, Dave Leip’s Atlas of U.S. Presidential Elections (2013b),
was the work of an electrical design engineer (Leip, 2013a).
Ambiguity. Some reports of quantitative research in peer-reviewed journals did
not clearly state the sources of voter turnout data. One study (Burden, 2000) used the
terms “official estimates [and] official voter turnout” (p. 389) without describing the
source of that data. Another study (Green & Shachar, 2000) mentioned concerns about
the “ongoing debate about whether to use report or actual vote” (pp. 565-566), and
mentioned using ANES data for 1972-76, which is survey-based self-reported data. The
authors then reported: “It turns out, however, that the choice of one measure over the
other has little effect on the estimates we obtain, a finding that squares with some other
studies that find relatively small differences between analyses of validated and reported
vote” (p. 566) but no mention was made of the source of the actual or validated voter
turnout used in the study.
Challenges to survey data. NES overestimated the official voter turnout for
presidential elections; in 1952 it was 11% over; in 1996 it was 24% over (Burden, 2000).
“It is common knowledge that the NES estimates are substantially higher than official
government estimates of voter turnout reported by the media just after each election” (p.
390). None-the-less, at the time of writing, Burden reported that the NES “remains the
best source of American political survey data” (p. 389). Burden suggested that the most
common explanation is that the data collected from surveys like the NES relies on self-
reports of voting behavior. Survey data that relies on self-reports of voting behavior is
inherently less reliable than actual government reports of voter turn-out.
78
Conclusion. This study relied on USEP report of voter participation in 2000 (M.
McDonald, 2011a) and 2012 (2012b). In addition to being available at the time of data
collection, McDonald’s VEP data sets were more representative of voter participation
than the U.S. Census VAP data. This study drew on the most reliable source of official
voter participation rates that would allow for a comparison between states based on the
2000 and 2012 presidential elections, USEP. Following this report of data collection
methodology for two variables is a presentation of the data analysis of the quantitative
component of the study.
Data Analysis
The two variables, SEI and voter turnout, were prepared for analysis. State SEI
scores were converted to z-scores. USEP voter turnout data were transformed with a
variance stabilizing transformation, arcsine transformation. Three correlation analyses
were run. The next sections will provide details on arcsine transformation and correlation
analysis.
Variance stabilizing transformation. The percentages that represented the voter
turnout for states were not equal interval data. Each data point represented a group with
different means and different variances. As a preparation for doing correlation analysis,
the data was converted to allow comparison data through an arcsine transformation,
which is commonly used to normalize distributions for proportional data such as
percentages (Sheskin, 2004). The arcsine transformation “is commonly used for
proportions, which range from 0 to 1 . . . [and] consists of taking the arcsine of the square
root of a number. The result is given in radians, not degrees, and can range from −π/2 to
π/2. (J. McDonald, 2009, para. 12). The data was transformed into radians and then to

79
degrees. This allowed for a correlation analysis that more accurately represented the
attributes of the data. Arcsine transformation stabilizes variance and normalizes
proportional data (Howell, 2013).
Correlation analyses. Using SPSS, correlation analyses were conducted to reveal
any relevant relationships between a state’s SEI score and (a) the state’s voter
participation rate for the national 2000 election, (b) the state’s voter participation rate for
the national 2012 election, and (c) the difference between the state’s voter turnout for the
national 2000 and 2012 elections. Graphic displays were prepared to represent the
findings.
Exploration of Alternative Explanations
Discovery of similar trend lines for the correlations of SEI with the 2000 and
2012 elections combined with the finding of a weak correlation significantly different
from zero for the relationship of the SEI to the 2000 election spawned a deeper
exploration of quantitative data. In order to investigate alternative explanations,
correlations analyses were run between SEI and USEP VEP and VAP for the 2000, 2004,
2008, and 2012 elections. The data was drawn for the same source, USEP (M.
McDonald, 2011a, 2011b, 2012a, 2012b). Graphic displays were prepared to represent
the findings.
Qualitative Component
Cross-case analysis can enhance the generalizability of a study, and more
importantly, it can “deepen understanding and explanation” (Miles & Huberman, 1994, p.
173). Two states were selected as exemplars to study the institutional factors affect
educational standardization and voter turnout as well as the the cultural and demographic

80
attributes that provide context for understanding a state’s level of educational
standardization and voter turnout.
Selection of Cases
Two states were selected for cross-case analysis (Miles & Huberman, 1994) to
identify and evaluate potential causes for differences between states in voter turnout
related to levels of educational standardization. An a priori purposeful sampling design
called for the identification of two states, one with a high level of educational
standardization and low voter turnout, (HL) and the other with the a low level of
standardization and high voter turnout (LH). States were sorted into a dichotomized two-
by-two grid or four-cell design based on the relationship of each state’s score to the mean
for each variable. States with positive SEI z-scores were placed in the top half of the grid
while those with negative SEI z-scores were placed in the bottom half. A state with a
2012 voter participation level that was above the mean was placed on the right side of the
grid; a state with voter participation levels below the mean was placed on the left side of
the grid. The four cells were: (a) High Standardization and Low Voter Participation (HL),
(b) High Standardization and High Voter Participation (HH), (c) Low Standardization
and Low Voter Participation (LL), and (d) Low Standardization and High Voter
Participation (LH). One state each was selected from the HL and LH cells as the most
representative example of the highest or lowest values for each variable. See Figure 10
for a depiction of high-low (HL) and low-high (LH) states in relation to the grid.

81
Level of Voter Participation
Low High
Leve
l of S
tand
ardi
zatio
n
High
High Standardization Low Voter Participation
(HL)
High Standardization High Voter Participation
(HH)
Low
Low Standardization Low Voter Participation
(LL)
Low Standardization High Voter Participation
(LH)
Figure 10. Purposeful Sampling Four Cell Grid
Results (reported in Chapter IV) revealed that the HL quadrant, Georgia was
alone as the state with the highest z-score (2.03), but with a voter turnout near the mean
(58.4%) it was not an exemplar of HL status. Hawaii was also located in the HL quadrant
and was the state with the lowest voter turnout of all the states (44.2%), but with a
relatively low z-score (0.72) was not chosen as an exemplar. Of the three states sharing
the next highest z-score (1.37) below Georgia, Arkansas had the lowest voter turnout
(50.5%) and was chosen as the exemplar state from the HL quadrant. Two states in the
LH quadrant were among the four states with the highest voter turnout and had the
highest voter turnout in the LH quadrant, Wisconsin (72.5%) and New Hampshire
(70.1%). Wisconsin’s SEI z-score (-0.59) was near to the mean (-0.03) while New
Hampshire was in a group with two other states with the lowest SEI z-score (-1.90). New
Hampshire was chosen for the exemplar state for the LH quadrant. Table 8 displays the z-
scores and voter turnout percentages for the states considered as exemplars. A complete
report on the data is found in Chapter IV.

82
Table 8
2012 SEI z-scores and Voter Turnout Percentages for Selected States
State SEI z-score Voter turnout (%)
High SEI/low turnout
Georgia 2.03 58.4
Arkansas 1.37 50.5
Hawaii 0.72 44.2
Low SEI/high turnout
Wisconsin -0.59 72.5
New Hampshire -1.90 70.1
Mean
-0.03 60.0
Data Collection
“In multiple case designs the cross-case analysis can only take place when all the
individual cases have been completed. . . . The findings from each case can be used as
the raw data for the cross-case analysis” (Pickard, 2007, p. 92). Examining the data
supporting the SEI and voter turnout permitted an examination of superficial
characteristics. Emergent and generative research examined the details of the variables
and then explored the elements that support an understanding of the exemplar states’ SEI
scores and voter participation levels.
“Case study research aims to present rich, descriptive narratives at a micro level,
to provide detailed descriptions (Pickard, 2007, p. 92). A key focus of the exploration
was the collection of state data relating to the two variables in the form of state
administrative rules and voting regulations. Project Vote Smart, also referred to as
VoteSmart, (2013) provided “unbiased political information” (Stross, 2000, para. 1) and

83
was a rich source of data for a comparison of state voting regulations. “For reliable,
meat-and-potatoes political information, research experts nearly all recommend Project
Vote Smart” (New York Times, 1999, para. 5). The New York Times used the Project
Vote Smart website data for a variety of purposes, for example in support of election
reporting (T. Kaplan, 2012) and for an interactive map on their website depicting by U.S
Congressional district How the N.R.A. Rates Lawmakers (2012). According to a one
nonprofit nonpartisan organization devoted to governmental transparency, Sunlight
Foundation (2013), “one hundred and fifty-four organizations, Clear Channel, LA Times,
Gannet News Service, Dish Network among others are using [Project Vote Smart] APIs
to enrich their own reporting” (S. Miller, 2008, para. 3). The Federal Voting Assistance
Program lists Project Vote Smart on its website Links (2013) page in support state voter
registration. Project Vote Smart is a reliable and well respected source for current data on
voting, including voter registration requirements of interest to this study.
Additional elements investigated were:
• Geographic region/culture region
• Population density/distribution
• Distribution of race
• Average level of education/distribution of levels of education
• Average income/distribution of income
• Other economic factors including employment distribution
• Distribution of social characteristics
• Distribution of religious affiliation
• Distribution of political affiliation

84
Cross-Case Analysis
The case study investigation was both generative and emergent, letting the
qualitative exploration emerge as a result of the quantitative analysis. Comparison tables
clarified similarities and differences between the two states. A narrative description
captured the key features of the exemplar states, described by Creswell (1994) as a
“realist tale, a direct, matter-of-fact portrait” (p. 159). Conclusions were drawn as
warranted.
Validity and Reliability
The defensibility of “the research study, its parts, the conclusions drawn, and the
applications based on it” (Onwuegbuzie & Johnson, 2006, p. 48) depends, in part, on
“good theories” (p. 49). The value that drives this work is that K-12 public education
could and should produce an informed electorate (voters). Evidence revealed some
support, if disputed, of a decline in voter turnout in the U.S. and strong support that voter
turnout is lower in the U.S. than in many nations of the world as well as a wide range of
voter participation among the states and for other criteria.
Many studies have investigated potential causes for variation in voter
participation and disenfranchisement. This study hypothesized that the same forces that
affected a state’s voter participation affected its embrace of the standardization of
education, as measured by the SEI. It asked, in other words, if the two variables have a
positive or negative correlation, or whether they were instead unrelated. This study first
tested for a correlation between states’ SEI score and voter turnout rates and second
investigated the elements that were associated with both variables within two exemplar
states. Validity issues are addressed for this mixed-methods research project, its

85
quantitative component including the reliability of the SEI, and the qualitative
component, focusing on construct validity, internal validity, external validity, and
conclusion validity (Onwuegbuzie & Johnson, 2006; Trochim, 2001; Yin, 2009).
The primary threat to the validity of this study can be traced back to the issue
presented in Chapter I that quality education depends upon one’s conception of schooling
(Eisner, 1978). If one rejects the notion that K-12 public education should prepare
citizens to participate actively in democracy by voting, then the study will be of little use.
For researchers and scholars who accept the premise that a quality education will
engender voter participation, a primary claim to validity will be met. This challenge to
validity goes to the subjective nature of the research question itself. Asking the question
“Does a K-12 public education have something to do with low and variable voting rates
in the U.S.?” reveals a bias of the researcher who asks it because it is predicated on the
assumption that public education should empower voters.
The overall validity of the study is bolstered by a clear logic chain (Kane, 2001),
as presented in Chapter I. To wit:
1. Public education should have a positive influence on participation in democracy.
2. Voting is an indicator of participation in a democracy.
3. Voter participation in the U.S. is lower than in many other countries. There has
been a purported decline in voter participation in the U.S. There is great
variability of voter turnout among states.
4. An increase in standardization of education and resulting narrowing of the
curriculum to focus on tested content areas has occurred.
86
5. The content areas of civics, U.S. history, and other knowledge that would be
fundamental to engendering voting behavior are not part of the standards based
movement reform process and time committed to instruction in these content
areas has declined.
Mixed-Methods Research
Mixed-methods research “draw[s] from the strengths and minimize[s] the
weaknesses of both” (R. B. Johnson & Onwuegbuzie, 2004, pp. 14-15) quantitative and
qualitative paradigms. Onwuegbuzie and Johnson (2006) argued that new language is
needed to discuss validity issues in mixed-methods research, retaining the use of validity
for discussing the defensibility of quantitative research, using the term trustworthiness for
qualitative research, and using legitimation for mixed-methods research. The distinctions
are fine-gauge; the purpose of describing threats to validity is to establish the
dependability of the results. This study is intended to meet the standard of not only
legitimacy and trustworthiness, but also of validity.
Messick described consequential validity as the “evaluation of the intended and
unintended social consequences” (1988, p. 39) of the work; any determination of the
validity of a test must incorporate the consequences of its use. The use of mixed-
methodology in this study allowed for a criterion-based examination of the variables
followed by an exploratory examination of two cases that allowed for the development of
inferences about the relationship of the variables. It is not expected that wide ranging
generalizations can be drawn from this work; rather greater understanding of the
relationship between the SEI and voter turnout can sort out potential areas for further
investigation. Overall, the consequences of this work should be to allow researchers and

87
scholars to deepen their understanding of the relationship educational standardization and
democracy, framed as fundamental public good.
Both components of this study, quantitative and qualitative, utilized empirical
observations to address the research questions. Safeguards built into the inquiries were
intended to “minimize confirmation bias and other sources of invalidity” (R. B. Johnson
& Onwuegbuzie, 2004, p. 15). Mixed research “can produce more complete knowledge
necessary to inform theory and practice” (p. 21). The use of both quantitative and
qualitative methodologies adds needed depth to this investigation of the relationship of
state SEI scores to voting patterns in which no causal relationship is inferred between the
two variables.
The next sections describe several aspects of validity relating to the quantitative
and qualitative components of the study, addressed separately. Construct, internal,
external and conclusion validity are discussed, followed by a brief comment about overall
validity.
Quantitative Component
Construct validity. There are two constructs in this work. One is voter turnout.
The other is the K-12 educational standardization.
Voter participation. Voter participation, simply defined as voting in an election,
is a variable that has been studied empirically since at least the 1980s (Achen, 1992). The
construct of voter participation has been well utilized. Or as Bird said, voting is the
“machinery of democracy” (2012, para. 1).
SEI. The construct of the SEI is a theoretical construct of a state’s level of
educational standardization, a new concept introduced in this work. The SEI is a measure
88
of the extent to which a state’s policies and practices are organized and administered
around clear, measurable standards. An SEI score reflects a state’s development of both
content and performance standards in compliance with the current emphasis on large-
scale high-risk testing driven by an emphasis on efficiency and accountability.
The construct of a state’s level of educational standardization has been
operationalized into the SEI by drawing on one of the most successful and respected
advocates for educational standardization reform Achieve. A key aspect of state
standardization is collaboration and cooperation with other states in developing uniform
and shared standards as expressed in the Common Core Standards.
Additionally, the attributes of the SEI have been vetted by experts in the form of a
university college of education dissertation committee. Additional strength for construct
validity is provided by a clear and logical chain of argumentation framing the notion that
public K-12 education should produce an informed electorate (Kane, 1992). One
challenge to validity is the recent invention of the SEI; devised for this dissertation it has
not been highly scrutinized and future iterations may result in response to critics who
locate weaknesses.
Internal validity. Internal validity was supported in four ways. Data sources,
sampling error, weighting, and reliability will be discussed.
Data sources. For eight of its nine elements, the 2012 SEI drew on data collected
and disseminated by a well-known and respected advocate for standardization, Achieve
(2012a). The data for the ninth element was based on the Common Core State Standards
Initiative (CCSSI, 2013b) report of state adoption of the Common Core Standards.
Internal validity has been maximized by the use of Achieve and other reliable sources of

89
state education data in support of standardization and by meticulous work. Achieve
quantified in true/false values a state’s status in accomplishing Achieve’s goals of
educational standardization.
Sampling. Sampling issues were not a challenge to validity of the voting variable
of the study. Sampling is the selection of a subset of the population of interest that allows
the researcher to infer or estimate about the population. In this study, the population of
interest was all the U.S. States and the District of Columbia (DC). A sample was not
used; rather data was collected for the entire population. Issues of sampling error were
not relevant.
The sampling of the indicators of the SEI may have been more problematic. The
SEI was an initial attempt to measure a state’s level of standardization of public K-12
education as compared to other states and evaluation by experts in the field of indexes
would improve its utility.
Weighting. A final challenge to internal validity was the weighting of the
attributes of the SEI. The SEI, as used in this study, weighted all the indicators equally,
following Florida’s design in the Creativity Index (Florida, 2002). This practical solution
to the weighting issue depended on a simple counting strategy; the more evidence there
was of standardization, the higher the value of the score was. This un-weighted analysis
could have distorted the results to make the composite score inflated or diminished in
relation to its true value. It was not possible to determine this a priori. After the data was
analyzed, a more sophisticated system could be suggested that would give more or less
weight to each of the criteria in relation to its explanatory power and might yield more
useful scores in further research on this subject.

90
Reliability of the SEI. The reliability of the SEI rating given to each state was re-
evaluated by a second evaluator who found a 100% match for 100% of the data. The SEI
was a reliable measure of the construct state educational standardization, as measured by
the selected attributes.
External validity. An examination of the external validity of the study is directed
toward the claims that underpin the work and the usefulness of the findings. The SEI,
drawing as it does on the work of one the strongest proponent of educational
standardization, Achieve, goes to the source, in framing the construct and for much of the
data. The SEI generalizes across all states and DC in terms of the construct of educational
standardization, as proposed by Achieve and others. Additionally, a census of all states
and DC is more safely generalizable than a sample of the population. The SEI scores can
be used as reliable measures of a state’s level of standardization as compared to other
states, placed as it is in the framework of the most prominent advocates of the construct.
Relationships found between states’ SEI and voter turnout are likewise
defensible, to the extent that significant correlations were found for some of tests and all
of them were in the same direction. One challenge to validity is that some of the
correlative relationships were not significantly different from zero, but this work has not
claimed more than the analysis has revealed, a tendency in the direction of a relationship
between high SEI and low voter turnout.
Conclusion validity. This study does not suggest a causal relationship between
the variables; it draws no causal inference. Conclusions were not drawn from the
quantitative component about the potential shared cause(s) of any discovered covariance;
rather exemplar states were selected and investigated in the qualitative phase of the
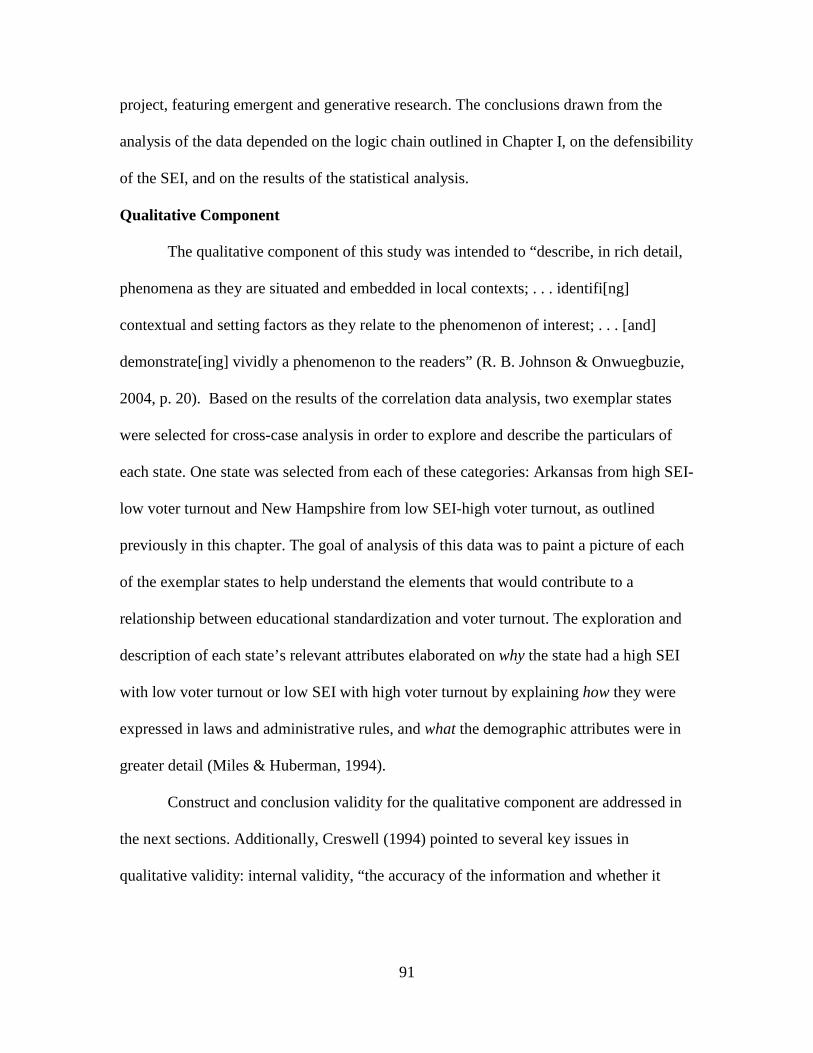
91
project, featuring emergent and generative research. The conclusions drawn from the
analysis of the data depended on the logic chain outlined in Chapter I, on the defensibility
of the SEI, and on the results of the statistical analysis.
Qualitative Component
The qualitative component of this study was intended to “describe, in rich detail,
phenomena as they are situated and embedded in local contexts; . . . identifi[ng]
contextual and setting factors as they relate to the phenomenon of interest; . . . [and]
demonstrate[ing] vividly a phenomenon to the readers” (R. B. Johnson & Onwuegbuzie,
2004, p. 20). Based on the results of the correlation data analysis, two exemplar states
were selected for cross-case analysis in order to explore and describe the particulars of
each state. One state was selected from each of these categories: Arkansas from high SEI-
low voter turnout and New Hampshire from low SEI-high voter turnout, as outlined
previously in this chapter. The goal of analysis of this data was to paint a picture of each
of the exemplar states to help understand the elements that would contribute to a
relationship between educational standardization and voter turnout. The exploration and
description of each state’s relevant attributes elaborated on why the state had a high SEI
with low voter turnout or low SEI with high voter turnout by explaining how they were
expressed in laws and administrative rules, and what the demographic attributes were in
greater detail (Miles & Huberman, 1994).
Construct and conclusion validity for the qualitative component are addressed in
the next sections. Additionally, Creswell (1994) pointed to several key issues in
qualitative validity: internal validity, “the accuracy of the information and whether it

92
matches reality” (p. 159), external validity, the “generalizability of findings from the
study” (p. 159), and reliability, the possibility of replication of the study.
Construct validity. The construct being explored in the qualitative component of
this study was the notion that there may be elements of a state’s regulations, culture,
demographics, or other, as yet unidentified, characteristics that would drive a correlation
between a state’s SEI and its level of voter participation. The logic chain and discussion
elsewhere in this document make a strong claim that education should be related to voter
turnout, and if it is not that is a cause for investigation.
This emerging construct was generated by the investigation of the elements for
each of the two exemplar states. The potential for researcher bias was a challenge to
construct validity, as it was imbedded in the methodology. Reliability was supported by
an analysis of an independent auditor who verified the scores of the SIE. The tactics
described in the next section will address or mitigate this threat.
Internal validity. The a priori selection process distributed the states across the
range of the two variables, allowing for the identification of states with the highest and
lowest SEI as correlated with the highest and lowest voter turnout. The two states chosen
were exemplars in their categories in support of an investigation of underlying features of
states with high SEI and low voter turnout, in contrast with states with low SEI and high
voter turnout.
An in-depth description of two states may have produced evidence that was
“idiosyncratic” (Miles & Huberman, 1994, p. 172). Researcher bias has been described as
occurring “when the researcher has personal biases or a priori assumptions that . . . she is
unable to bracket” (Onwuegbuzie & Leech, 2007, p. 236). Internal validity was

93
maximized by the use of well-established procedures of case study methodology. The
qualitative component of this study identified elements of a state’s governmental
decisions (laws and administrative rules) and demographics that were comparable
between the two exemplar states. An “audit trail” (p. 240) documented the reliability of
the sources and increased validity. Due to the emergent and generative nature of the
study, additional facets of each state’s culture/attributes were located but were always
comparable, with all elements reported in detailed tables. Such data was not particularly
vulnerable to researcher bias in that the data collected focused on demographic
characteristics and the states’ laws and administrative rules related to K-12 educational
standardization and voting regulations. It will up to the reader to judge the impartiality of
the conclusions that were drawn on the basis of the qualitative evidence.
External validity. On one hand, “one aim of studying multiple cases is to
increase generalizability; . . . the aim is to see processes and outcomes . . . to understand
how they are qualified by local conditions, and thus to develop more sophisticated
descriptions, and more powerful explanations” (Miles & Huberman, 1994, p. 172), “to
deepen understanding and explanation” (p. 173). On the other hand, a key weakness of
qualitative research of this type is that “knowledge produced may not generalize to . . .
other settings. [Additionally], the results are more easily influenced by the researcher’s
personal biases and idiosyncrasies” (R. B. Johnson & Onwuegbuzie, 2004, p. 20). As
described in the previous section, an a priori selection plan allowed for a defensible
selection of exemplar states. Careful and equivalent data collections have allowed for an
emergent study of potential relationships between SEI level and voter participation, but
this kind of work can only go so far. Generalizations about the relationship between the

94
two variables have been worded cautiously, more as speculation than generalizable
results, in order to remain defensible.
Conclusion validity. Challenges to conclusion validity were addressed by
discussing rival explanations (Kane, 1992). The strongest rival explanation would be that
details offered to explain a tentative relationship between high SEI and low voter turnout,
and visa versa, are artifacts of the individual states chosen of the case studies. This study
has made no strong claim that the explorative nature of the qualitative component of the
study, and this is defensible.
Summary
The legitimacy of this study is both enhanced and challenged by its mixed-
methods. The quantitative component benefited from consultation with educational
leadership scholars, but the SEI was a first attempt at quantifying a state’s level of
educational standardization and might benefit from further review by experts. A clear
logic chain supported the development of the study from a concrete examination of
verifiable facts, the indicators of the SEU, actual voter turnout, and quantitative analysis,
then moving to an emergent and generative examination and comparison of two exemplar
state’s regulations, administrative rules, and demographics. The very emergent and
generative aspects that increase the value of the qualitative component also introduce the
threat of researcher bias. Rigor in collection of comparative elements helped to mitigate
this threat to the conclusions drawn in a discussion of the role of public education in
producing an empowered electorate. A clear and realistic report of the analyses allowed
for the defensibility of conclusions that do not claim more than has been proven.

95
CHAPTER IV
RESULTS
This results section reports the results of exploratory research, beginning with a
quantitative data analysis with an exploration of alternative explanations. It then
describes the results of a qualitative case study of two exemplar states: an investigation
and analysis of institutional elements of educational ARs for standards and accountability
and voter regulations, followed by an investigation and analysis of cultural/geographic
and demographic data.
Quantitative Analysis
Two questions were asked in the quantitative analysis part of the study. Question
1 was: What is the relationship between a state’s level of educational standardization and
its voter turnout in the 2012 national election? Question 2 was: What is the relationship
between a state’s level of educational standardization and change in that state’s voter
turnout between 2000 and 2012? The null hypothesis to be evaluated for both questions
was H0: p < 0.
Description of Variables
SEI. There were two versions of the data expressing a state’s level of educational
standardization, SEI Score and SEIzscore. These quantitative measured variables
represented a states’ SEI score. SEI Score was an ordinal variable, scores on a scale of 0
to 9 with a higher value indicating more educational standardization for a state. Statistical
standardization of the SEI Score values (standardization of coefficients) was utilized to
generate z-scores to represent each state’s SEI score as the variable SEIzscore. SEIzscore
was a continuous variable.

96
Voter turnout. The variables for voter turnout were each a continuous
quantitative measure of voter participation by state drawn from United States Elections
Project (USEP) data (M. McDonald, 2011a, 2011b, 2012a, 2012b). A higher percentage
meant that more people voted in that election. A variable was created for Voter Age
Population (VAP) and Voter Eligible Population (VEP) for each year of the study. The
variable Difference was the calculated difference between the voter turnout percentages
of VEP for 2000 and 2012. A higher percentage meant that there was a larger difference
in voter participation between the two years. Appendix F reports the raw state voter
turnout percentage data for 2000 and 2012.
Analysis and Results: Standardization of Education
The shape of the frequency distribution of the z-scores of state SEI scores
approximated a normal distribution, with a mean of 0.00, a standard deviation of 1.00,
and range of -1.90 to 2.03. There were no outliers. Table 9 provides supporting detail.
Figures 11 and 12 depict the histogram and box plot, respectively.
Table 9
Descriptive Statistics for the Standardized Education Index z-scores
Variable M SD n
SEIzscore 0.00 1.00 51
Analysis and Results: Voter Participation
The percentages that represented the voter turnout for states were not equal
interval data. Each data point represented a group with different means and different
variances. Arcsine transformation stabilizes variance and normalizes proportional data.

97
As a preparation for doing correlation analysis, the data was converted through an arcsine
transformation to radians and then to degrees to allow for appropriate comparison of data
points. This allowed for a correlation analysis that more accurately represented the
attributes of the data.
Figure 11. Histogram for SEI z-score
Figure 12. Boxplot for SEI z-score
The shape of the frequency distribution of the voter participation variables
VEP2000, VEP2012, and Difference each approximated a normal distribution, with
means of the percentage data of 55.68, 59.97, and 4.29, standard deviations of 6.52, 6.47,
and 4.48, and ranges of 44.2 to 69.5, 44.2 to 75.7, and − 9.2 to 13.9, respectively. For the
three variables transformed to degrees, the means were 48.29, 50.80, and 2.51, the
standard deviations were 3.79, 3.82, and 2.83, and the ranges were 41.7 to 56.5, 41.7 to
60.5, and -5.5 to 8.1, respectively. (See Table 10.) The outliers were expected variations
in the data and of interest to the study. For the three variables, Figures 13, 14, and 15
depict the histograms and Figure 16 the boxplots.

98
Table 10
Descriptive Statistics for Voter Participation
Percentages Degrees
Variable M SD M SD n
VEP2000 55.68 6.52 48.29 3.79 51
VEP2012 59.97 6.47 50.80 3.82 51
Difference 4.29 4.84 2.51 2.83 51
Figure 13. VEP 2000 Histogram
Figure 15. Difference Histogram
Figure 14. VEP 2012 Histogram
Figure 16. Boxplots for Difference

99
Analysis and Results: Correlation
The results of the correlation analysis are reported in Table 11. Figures 17, 18, 19
present the scatterplots and trend lines for the correlation analysis of SEI z-scores to the
2000 and 2012 VEP data and the difference between the two, respectively, as converted
to degrees through the arcsine transformation. A weak negative correlation found
between SEI level and voter turnout in 2000 was significantly different than zero, r(49) =
−.32, p = .02. About 11% of the variability in state voter turnout rate was explained by
the level of standardization of education. A weak negative correlation found between SEI
level and voter turnout in 2012 was not significantly different from zero, r(49) = -.17, p
= .22. About 3% of the variability in state voter turnout rate was explained by the level of
standardization of education. A weak positive correlation between SEI and the difference
between 2000 and 2012 voter turnout rates was not significantly different from zero,
r(49) = .20, p = .16). About 4% of the variability in state voter turnout rate was
explained by the level of standardization of education.
Table 11
Correlations Between State SEI z-scores and Voter Turnout
Variable R
VEP 2000 -.32*
VEP 2012 -.17
Difference .20
Note. *p < .05

100
Figure 17. Relationship of SEI z-score to 2000 Election
Figure 18. Relationship of SEI z-score to 2012 Election
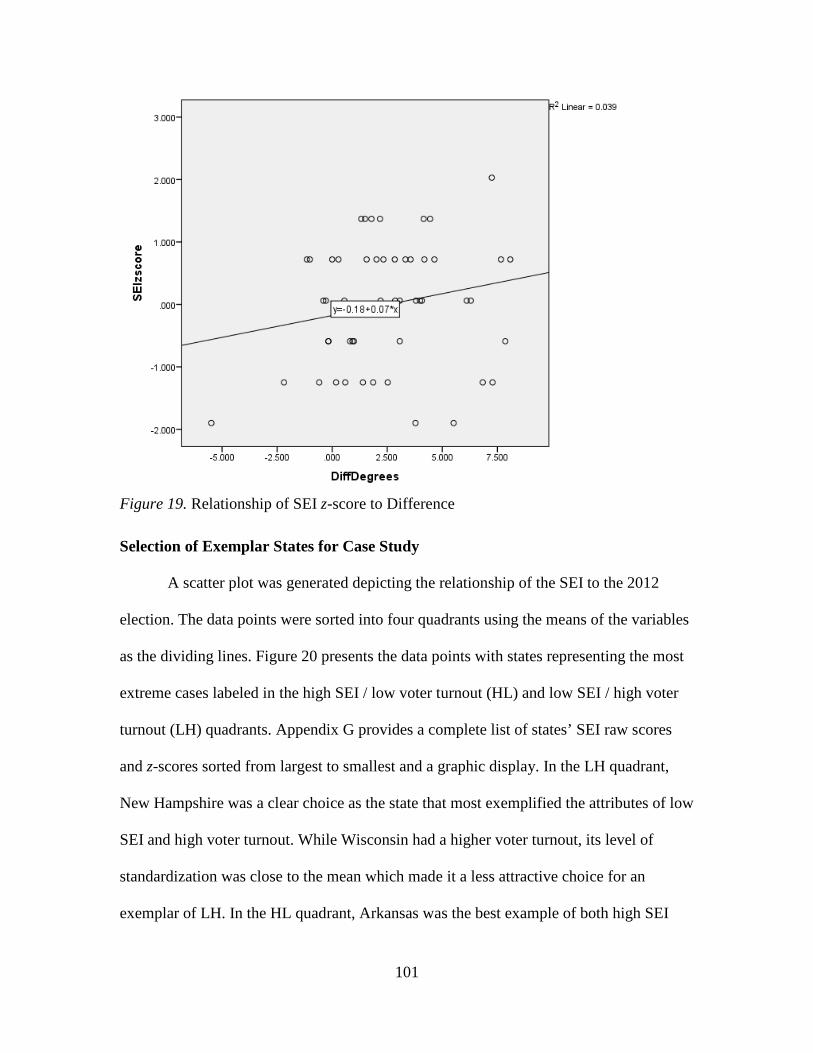
101
Figure 19. Relationship of SEI z-score to Difference
Selection of Exemplar States for Case Study
A scatter plot was generated depicting the relationship of the SEI to the 2012
election. The data points were sorted into four quadrants using the means of the variables
as the dividing lines. Figure 20 presents the data points with states representing the most
extreme cases labeled in the high SEI / low voter turnout (HL) and low SEI / high voter
turnout (LH) quadrants. Appendix G provides a complete list of states’ SEI raw scores
and z-scores sorted from largest to smallest and a graphic display. In the LH quadrant,
New Hampshire was a clear choice as the state that most exemplified the attributes of low
SEI and high voter turnout. While Wisconsin had a higher voter turnout, its level of
standardization was close to the mean which made it a less attractive choice for an
exemplar of LH. In the HL quadrant, Arkansas was the best example of both high SEI
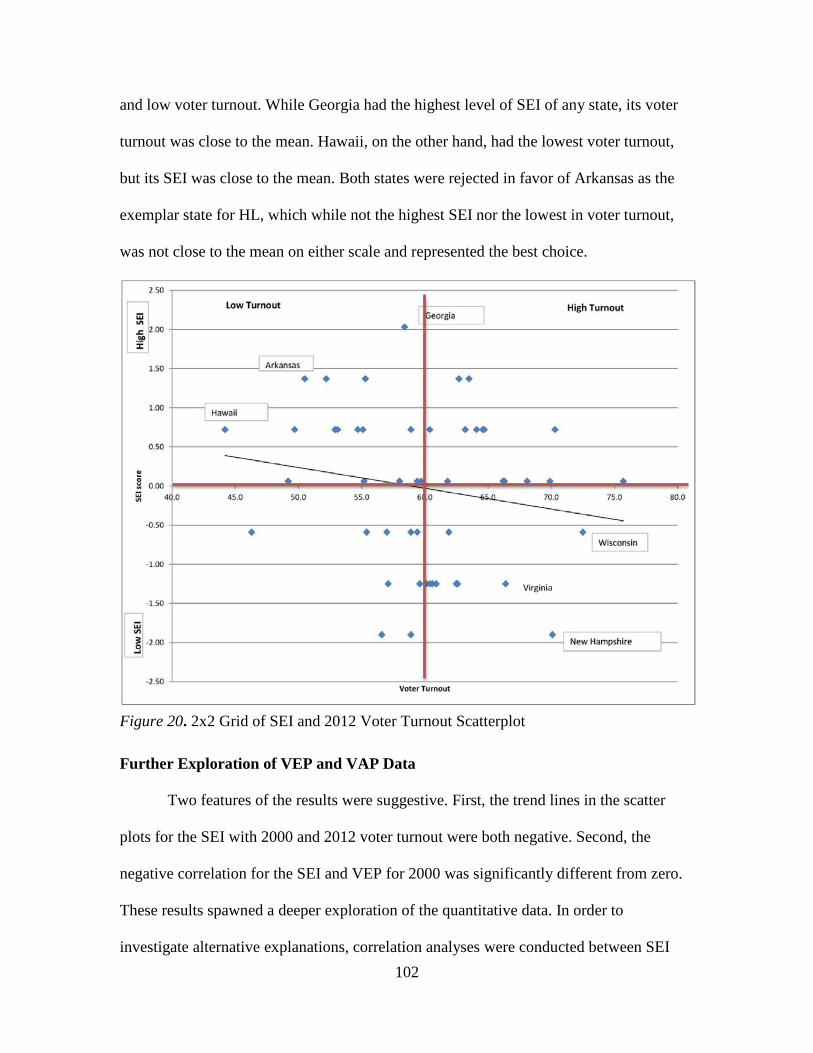
102
and low voter turnout. While Georgia had the highest level of SEI of any state, its voter
turnout was close to the mean. Hawaii, on the other hand, had the lowest voter turnout,
but its SEI was close to the mean. Both states were rejected in favor of Arkansas as the
exemplar state for HL, which while not the highest SEI nor the lowest in voter turnout,
was not close to the mean on either scale and represented the best choice.
Figure 20. 2x2 Grid of SEI and 2012 Voter Turnout Scatterplot
Further Exploration of VEP and VAP Data
Two features of the results were suggestive. First, the trend lines in the scatter
plots for the SEI with 2000 and 2012 voter turnout were both negative. Second, the
negative correlation for the SEI and VEP for 2000 was significantly different from zero.
These results spawned a deeper exploration of the quantitative data. In order to
investigate alternative explanations, correlation analyses were conducted between SEI

103
and USEP VEP and VAP for the 2000, 2004, 2008, and 20012 elections. The variables
were converted through arcsine transformation to degrees and analyzed for correlations
with the SEI variable using SPSS. The means and standard deviations are presented in
Table 12; the correlation statistics are reported in Table 13 Figures 21 and 22 present
graphic displays representing the findings..
Weak negative correlations were found between SEI level and VEP 2000 and
VAP 2000, 2004, and 2008. The correlations were significantly different from zero, r(49)
= −.32, p = .020, r(49) = −.37, p = .007, r(49) = −.29, p = .038, and r(49) = −.28, p =
.049, respectively. 11%, 14%, 9% and 6% of the variability was explained, respectively.
The correlations for the other four analyses were not significantly different from zero.
The resulting correlations revealed trend lines repeating those in the original analyses for
VEP 2000 and VEP 2012, creating the appearance that as SEI level increased, voter
participation decreased. Case studies of Arkansas and New Hampshire explored two
exemplars representing contrasting features, high SEI and low voter turnout compared
with low SEI and high voter turnout, respectively.
Qualitative Analysis
Two questions were asked in the qualitative analysis part of the study. Question 3
was: What institutional factors affect educational standardization and voter turnout?
Question 4 was: What cultural and demographic attributes provide context for
understanding a state’s level of educational standardization and voter turnout? The next
sections will report the study of two exemplar states, Arkansas and New Hampshire, for
institutional factors of educational administrative rules and voting laws, followed by
cultural and demographic attributes

104
Table 12
Descriptive Statistics for Voter Participation
Variable M SD n
VEP 2000 48.29 3.79 51
VAP 2000 46.38 4.01 51
VEP 2004 52.02 3.79 51
VAP 2004 49.63 4.19 51
VEP 2008 52.70 3.48 51
VAP 2008 50.16 3.78 51
VEP 2012 50.80 3.82 51
VAP 2012 48.37 4.02 51
Table 13
Correlations Between State SEI z-scores and Voter Turnout
Variable R
VEP 2000 -0.32*
VAP 2000 -0.37**
VEP 2004 -0.24
VAP 2004 -0.29*
VEP 2008 -0.20
VAP 2008 -0.28*
VEP 2012 -0.17
VAP 2012 -0.24
* p < .05.
** p < .01.

105
Figure 21. Individual Correlations for SEI Score with VEP and VAP 2000-2012 * Correlation was significant, p < .05.

106
Figure 22. Combined Regression Lines for SEI with VEP and VAP 2000-2012
* Correlation was significant, p < .05.
Bold lines represent correlations significantly different from zero.
Solid lines are VEP data; dashed lines are VAP Data
-2
-1.5
-1
-0.5
0
0.5
1
1.5
2
2.5
35 40 45 50 55 60 65
SEI S
core
Voter Turnout VEP2000* VEP2004 VEP2008 VEP2012
VAP2000* VAP2004* VAP2008* VAP2012
VEP 2000* VEP 2004 VEP 2008 VEP 2012
VAP 2000* VAP 2004* VAP 2008* VAP 2012

107
Study of Institutional Factors for Two States
Arkansas was chosen as an exemplar of states with high SEI and low voter
turnout. New Hampshire (NH) was chosen as an exemplar of states with low SEI and
high voter turnout. In order to explore for and generate a potential explanation of a
negative correlation between SEI score and voter turnout, the next section will compare
and contrast these states’ Administrative Rules (ARs) for K-12 educational standards and
accountability, including a detailed comparison of the results with the criteria of the
Dichotomous Sort of Accountability Concepts presented in Chapter II. The following
section will compare and contrast the exemplar state’s voting laws.
K-12 educational standards and accountability administrative rules. In order
to accurately describe the most current educational standards and accountability
regulations in New Hampshire, the data collection that is described here as New
Hampshire ARs was expanded to include official information provided by the New
Hampshire Department of Education (DOE) on their website. While there was some
common ground in the educational administrative rules for Arkansas and New
Hampshire, there were also sharp contrasts. This report focuses on observed differences
that shed light on how two exemplar states framed and implemented educational
standards and accountability in areas of orientation, goals, school improvement,
alternative plans, opportunity, funding, content areas, rigor, benchmarks, performance
targets, minimum competencies, uniform grading, high school exit exams, rewards,
failure, competition, differentiation, professional development, teacher ethics,
transparency, on-site monitoring, and takeover of public schools.
108
Orientation. In comparing Arkansas with New Hampshire, two passages
summarized the difference in their orientation towards education. While Arkansas
expected that "academic content standards are rigorous and equip students to compete in
the global workforce" (Arkansas DOE, 2013b, para 4), New Hampshire specified that "a
well-educated populace is essential for the maintenance of democracy" (NH DOE, 1993,
para. 1) and sought to “provide all students with the opportunity to acquire the knowledge
and skills necessary to prepare them for successful participation in the . . . political
systems of a free government” (NH DOE, 2007a, para. 1). Arkansas ARs did not mention
the value of education in a democracy and New Hampshire ARs did not mention role of
education in preparing students for competition in the global workforce.
Arkansas generally framed educational goals around “equal opportunity for all
students” (Arkansas DOE, 2007a, para. 5) to meet required performance levels using a
“single comprehensive testing, assessment and accountability program” (Arkansas DOE,
2013b, para. 2). New Hampshire generally framed educational goals around the notion of
the adequacy of public education (NH DOE, 2007b) to “provide all students to
opportunity to acquire” (NH DOE, 2007d, para. 1) not only content area skills and
knowledge but also life skills.
Goals. Arkansas structured educational reform around the goal of providing
“equal opportunity for all students, including identifiable subgroups, to meet the expected
performance levels established by the Board on all State assessments” (Arkansas DOE,
2007a, para. 5). It specified that the plan:
identifies a challenging set of goals and sets forth actions that will be
taken to achieve the goals; . . . specifies the responsibilities of the school
109
district and its schools . . . includes periodic benchmarks, measurements
processes, and evaluation protocols; and is based on an analysis of data
produced by the Arkansas Comprehensive Testing Program and other
reliable measures of student learning to determine classroom, school, and
school district academic performance. (para. 5)
New Hampshire specified that “a well-educated populace is essential for the
maintenance of democracy” (NH DOE, 1993, para. 1). It declared that
it is the policy of the state of New Hampshire that public elementary and
secondary education shall provide all students with the opportunity to
acquire the knowledge and skills necessary to prepare them for successful
participation in the social, economic, scientific, technological, and
political systems of a free government, now and in the years to come; an
education that is consistent with the curriculum and student proficiency
standards specified in state school approval rules and New Hampshire
curriculum frameworks . . . [and that] school districts then have flexibility
in implementing diverse educational approaches tailored to meet student
needs. (NH DOE, 2007a, paras. 1-2)
School improvement plan. Both Arkansas and New Hampshire had ARs related
to school improvement plans, but there was a difference in focus. Arkansas
Comprehensive School Improvement Plan (ACSIP) utilized a deficit model to close the
achievement gap (U.S. DOE, 2001) with “a plan developed by a local school team based
on an analysis of student performance data and other relevant data that provides a plan of
action to address deficiencies in student performance and any academic achievement

110
gap” (Arkansas DOE, 2007a, para. 3). In contrast, the New Hampshire Education and
Improvement Assessment Program (NHEIAP) called attention to the validity of
assessments, particularly content validity saying that a measure of accountability is
effective “when the assessment exercises or tasks are valid and appropriate
representations of the curriculum standards” (NH DOE, 1993, para. 2) and intended
specifically “not to establish a statewide curriculum” (para. 6).
Arkansas and New Hampshire both present two versions of their school
improvement system in compliance with NCLB. ACSIP in Arkansas and PART II
Performance-Based School Accountability System (PBAS) (NH DOE, 2012a) in New
Hampshire were based on student performance, that is academic achievement and growth
in reading/English language arts, mathematics, science and writing as informed by
standardized test scores (Arkansas DOE, 2013b; NH DOE, 2012a).
Alternative school improvement plan. In addition, both states offered an
alternative plans. Arkansas developed Arkansas Comprehensive Testing, Assessment and
Accountability Program (ACTAAP) in response to an ESEA waiver (Arkansas DOE,
2013b). The alternative plan followed closely along the lines of the original plan, aiming
to:
develop a single comprehensive testing, assessment and accountability
program which utilizes the most current and effective testing, evaluation,
and assessment research information designed to achieve the following
purposes: set clear academic standards that are periodically reviewed and
revised; establish professional development standards for all
administrators, teachers and instructional support personnel; establish
111
expected achievement levels; report on student achievement and other
indicators; provide evaluation data; recognize academic success and
failure; apply awards and sanctions; and comply with current federal and
state law and State Board rules and regulations. (Arkansas DOE, 2013b,
para. 2)
New Hampshire’s alternate system, PART I Input-based Accountability System
(IBAS) (NH DOE, 2012a) required schools to “complete an on-line survey to identify
how each school meets the self-assessment requirements” (p. 2). In addition to 10 subject
areas, school year and graduation credits comprised school adequacy standards.
Opportunity. Both Arkansas and New Hampshire addressed goals for school
accountability in terms of opportunity. Arkansas was “focused on student achievement . .
. to provide equal opportunity for all students” (Arkansas DOE, 2007a, para. 5). The
purpose of ACSIP was to provide equal opportunity for all students, including
identifiable subgroups, to meet the expected performance rate levels established by the
Board on all State assessments. (Arkansas DOE, 2013b, para. 8). New Hampshire framed
education in terms of “opportunity for an adequate education” (NH DOE, 2009a, para. 1).
Funding. In Arkansas ARs that mentioned educational funding established
protocols for supplementary funding, for specific issues or programs, for example to:
the Small, Rural School Achievement (SRSA) and Rural and Low-Income
School (RLIS) programs; . . . schools with a poverty percentage of 40
percent or more; . . . schools identified for improvement, corrective action
or restructuring; . . . schools that meet the definitions of ‘priority schools’
and ‘focus schools’; . . . [and] to reward a Title I school that significantly
112
closed the achievement gap between subgroups in the school or has
exceeded AYP for two or more consecutive years. (Arkansas DOE, 2013b,
para. 13)
The New Hampshire rule that provided special funds for local education
improvement and assessment plans, with a “priority for the use of any state funds shall be
given to lower-performing non-Title I schools” (NH DOE, 2003b, para. 3) was found to
be unconstitutional. More recently a New Hampshire rule stated a commitment to address
variation in educational challenges in individual schools: “schools with greater
educational challenges will benefit from varying resources” (2007c, para. 1). The other
mention of educational funding in New Hampshire ARs was for funding focused on the
“cost of an adequate education” (NH DOE, 2012b, para. 1). The state required that the
“definition of the opportunity for an adequate education . . . . [be used to] determine the
resources necessary to provide essential programs, considering educational needs” (para.
1).
Content areas. Arkansas’ accreditation of public schools defined a core academic
course as “a course taught in any of the following subject areas defined by NCLB:
English, Reading or Language Arts, Mathematics, Science, Foreign Language, Social
Studies, Arts (Arkansas DOE, 2009, para. 3). The New Hampshire’s input-based system
required each school to “demonstrate that they provide an opportunity for an adequate
education by meeting twelve of the existing school approval standards” (NH DOE, 2013).
“Ten of the twelve are curriculum and instruction standards: English language arts and
reading; mathematics; science; social studies; arts; world language; health education;
physical education; information and communication technologies; and technology

113
education” (NH DOE, 2012a, p. 2). Table 14 compares the two states content areas
required in accountability.
Table 14
Comparison of Two States for Required Content Areas
Arkansas core academic courses New Hampshire adequacy standards
English, reading or language Arts English/language arts and reading
mathematics mathematics
science science
social studies social studies
arts arts education
foreign language world language
- health education
- physical education
- technology education
- information and communication technologies
Rigor. Arkansas identified rigor as an attribute of education policy, prioritizing
content standards and curriculum frameworks that are rigorous, specific, sequenced,
clear, focused, and measurable [while ensuring] that low-level general education tracts
offered by districts are eliminated (Arkansas DOE, 2005, para. 5). Arkansas ARs sought
to “ensure that Arkansas academic content standards are rigorous [and to maintain] a
rigorous professional development system consistent with the comprehensive school
improvement plan” (2013b, para 4). New Hampshire did not use the term rigor in its
ARs.

114
Benchmarks. Arkansas incorporated benchmarks (Arkansas DOE, 2007a, 2011)
(2013b) into their standards and accountability ARs. New Hampshire did not.
Performance targets. NCLB required that states describe student achievement
using the terms advanced, proficient and basic. ("No Child Left Behind Act of 2001,"
2002). Arkansas required that “by the year 2013-2014 all students are expected to
perform at the proficient level or above” (Arkansas DOE, 2013b, para. 7) while New
Hampshire required that “On or before the 2013-2014 school year, schools shall ensure
that all pupils are performing at the basic level or above on the statewide assessment”
(NH DOE, 2003c, para. 1)
Minimum competency. Arkansas implemented “End-of-Course tests for
designated grades and content areas, and the high school literacy test.” (Arkansas DOE,
2007a, para. 3). The Arkansas Comprehensive Assessment Program updated these
requirements to “provide end-of-course examinations for designated grades and content
areas, and the high school literacy assessment. (2013b, para. 3). These exams, required
for Algebra I, Geometry, Biology, and an eleventh grade literacy assessment, were
defined as:
a criterion-referenced assessment taken upon the successful completion of
a course of study to determine whether a student demonstrates, according
to a requisite scale score established by rule of the Board, attainment of
necessary knowledge and skills. End-of- Course exams include both
general end-of-course assessments and high-stakes end-of-course
assessments. . . . Failure to meet the requisite scale score requires that the
student shall not receive academic credit for the course. (para. 3)

115
New Hampshire rules state that the Statewide Education Improvement and Assessment
Program “is not a minimum competency testing program” (NH DOE, 2003a, para. 2).
Uniform grading scales. Arkansas established “uniform grading scales to be used
by all public secondary schools in the state for regular courses, Advanced Placement
courses, International Baccalaureate courses, approved weighted honors courses and
approved weighted concurrent credit college courses” (Arkansas DOE, 2013c, para. 2)
with an option for public elementary schools to participate in the system. New Hampshire
had no similar system.
High school exit exams. Arkansas denied a high school diploma to any student
who did not “meet the requisite scale score on an end-of-course assessment and [did] not
satisfy the remedial requirements . . . for general end-of-course assessments” (Arkansas
DOE, 2012c, para. 6). New Hampshire did not have exit exam requirements, instead they
had a minimum number of credits required to earn a high school diploma (NH DOE,
2007b, 2011).
Rewards. Arkansas encouraged teacher and school success with financial and
other types of awards. The Rewarding Excellence in Achievement Program (REAP)
(Arkansas DOE, 2007b) increased pay for “forty percent to sixty percent (40% - 60%) of
the teacher’s total compensation . . . [for] achievement gains of students in each teacher’s
class on student scores under the statewide assessment program (para. 7). Schools were
awarded “financial or other recognition of a public school structured to recognize schools
that demonstrate and maintain high performance” (Arkansas DOE, 2013b, para 9).
Arkansas also established “procedures to provide incentives for teacher recruitment and
retention in high priority districts” (Arkansas DOE, 2012a, para. 2), including a signing

116
bonus of $5000 at the end of the first year, $4000 at the end of the second and third years,
and $3000 a year at the end of the fourth and any subsequent years (para. 4). New
Hampshire had no comparable system.
Failure. Arkansas identified the goals of recognizing failure of schools and
consequential application of sanctions and failure of students to meet a mandated test
score with the consequences of not receiving course credit and requirement that students
re-take the test (Arkansas DOE, 2013b). New Hampshire identified failure in the context
that if school that had been unable to “demonstrate that it provides the opportunity for an
adequate education” (NH DOE, 2009b, para. 3) for a third consecutive year an
assessment would determine how education funds were being spent. The school might be
required to redirect “adequacy funds . . . to address those areas that are contributing to the
failure of the school to provide the opportunity for an adequate education” (para. 3).
Competition. Arkansas utilized competition in some ARs; framing a key goal for
standards they will “equip students to compete in the global workforce” (Arkansas DOE,
2013b, para 4). Competition was the method by which teachers were to be selected to
participate in in the REAP plan for rewarding successful teachers; “participants shall be
selected through a competitive process” (Arkansas DOE, 2007b, para. 7). New
Hampshire’s ARs did not provide evidence of the use of competition as a policy
methodology or framing device.
Differentiation. Arkansas provided for differentiation of instruction for students
who had been held back. Its Alternative Education Intervention Program was “a special
instructional program for students who have been retained for two consecutive years. The
program shall include research-based learning opportunities and instructional strategies”

117
(Arkansas DOE, 2013b, para. 3). Arkansas also provided for individualized early
intervention, “short-term, intensive, focused, individualized instruction” (para. 3) in
reading, writing, and math for students in kindergarten and first grade, “to maintain a
student’s ability to function proficiently at grade level” (para. 3).
New Hampshire directed local school districts to “devise and implement
measures which focus on the continuing growth of individual students (NH DOE, 1993,
para. 5) and established a “framework for the delivery of educational services at the local
level. School districts then have flexibility in implementing diverse educational
approaches tailored to meet student needs” (NH DOE, 2007a, para. 2).
Professional development. Arkansas required continuous professional
development activities that were research and standards based to ensure that “all students
demonstrate proficiency in the state academic standards” (Arkansas DOE, 2007a, para. 3;
2012b, para. 2). New Hampshire required that professional development be “aligned with
school improvement goals. (NH DOE, 2009b, para. 3).
Teacher ethics. Arkansas developed a detailed set of procedures to “define
standards of ethical conduct and to outline procedures for receiving complaints,
authorizing and conducting investigations, and recommending enforcement of the Code
of Ethics” (Arkansas DOE, 2013a, para. 3). Ethical violations included failing to keep
standardized test materials secure with a potential fine of $100 (para. 9). New
Hampshire’s rules around teacher ethics dated from 1949; “no teacher shall advocate
communism as a political doctrine or any other doctrine which includes the overthrow by
force of the government” (NH DOE, para. 1).

118
Transparency. Arkansas made no provision for the release of test materials to
parents. New Hampshire gave to parents and guardians “the right to inspect and review
the pupil's assessment booklet, answer or response sheets, surveys, instructions or
directions to the pupil . . . after the assessment results are released by the department”
(NH DOE, 1999, para. 1).
On-site monitoring. Arkansas established an involved system for monitoring all
schools with on–site inspections as part of ASCIP (Arkansas DOE, 2007a). New
Hampshire had limited on-site inspections covering 10% of the schools that utilized
IBAS (NH DOE, 2011).
Takeover of public schools. For schools or districts identified as not meeting
identified goals, options included: annexation, consolidation, or reconstitution (Arkansas
DOE, 2013b, para. 10). Reconstitution was defined as a reorganization intervention of “a
public school district, including without limitation the suspension, reassignment,
replacement, or removal of a current superintendent or the suspension, removal, or
replacement of some or all of the current school board members, or both” (para. 3).
New Hampshire declared “Nothing in this chapter shall be construed to permit
either the department of education or the state board of education to take control of the
daily operations of any local public school” (NH DOE, 2003d, para. 1).
Summary. The educational attributes identified differentiate the two cases,
starting with a key goal identified for each state. Arkansas sought to prepare students to
compete in the global workforce while New Hampshire valued preparing students to
participate in democracy. Arkansas identified and punished failure while rewarding
success; New Hampshire sought to offer educational opportunity. Arkansas funded

119
special projects to remediate deficiencies and the achievement gap, whereas New
Hampshire intended to identify the parameters of an adequate education and fund it.
Arkansas’ alternative accountably plan was very similar to its main plan, while New
Hampshire devised an alternative plan with an emphasis less on standardized testing and
more on what schools were doing to offer an adequate education. While Arkansas
codified an expectation for high standards, selecting proficient as the requirement, New
Hampshire chose a lower standard of basic as the expectation. Arkansas had a complex
system of benchmarks, grading standards, and testing for minimum competency for
passing classes and graduating focused on STEM content, while New Hampshire had a
larger scope of educational content with less demand for testing, and rigor. For example,
New Hampshire did not have exit exams screening out graduates, rather all students who
passed the required course hours were permitted to graduate. Table 15 summarizes areas
of difference between Arkansas and New Hampshire educational ARs.
Table 15
Comparison of Educational ARs for K-12 Standards and Accountability
Element Arkansas New Hampshire
Orientation compete in the global workforce maintenance of democracy
Goals challenging goals, benchmarks, measurement processes, evaluation protocols; state level control
opportunity to acquire skills needed for participation in a free society; local control
Improvement plan addresses deficiencies; achievement gap
content validity
Alternative plan similar to first plan used school self-reports
Opportunity for student achievement an adequate education

120
Table 15 (continued) Element Arkansas New Hampshire
Funding supplementary programs in support of targeted needs received funding support
differential funding based on school need; the cost of an adequate education determined and funded
Content areas NCLB mandated curriculum and three more subjects
additional subject areas
Rigor in standards, curriculum, and professional development
-
Benchmarks benchmarks are part of the ARs no benchmarks in ARs
Performance targets proficient or higher basic
Minimum competency
Algebra I, Geometry, Biology, English II, high school literacy test
not a minimum competency program
Uniform grading Uniform grading scales required for secondary
-
High school diploma course exit exams required course credit required
Rewards financial awards for teachers and schools
-
Failure identification of, with consequences
reallocation of funding
Competition used as a policy methodology -
Differentiation for students who have been retained twice
at local level to meet needs of diverse student population
Professional development
ensures that students achieve proficiency on standards
is aligned with school improvement goals
Transparency - Parents and guardians have access to test materials
On-site monitoring all schools 10% of IBAS schools
School take-over annexation, consolidation, or reconstitution
not permitted

121
Relating Study Results to the Dichotomous Sort of Accountability Concepts.
The attributes herein described have a lot in common with the Dichotomous Sort of
Accountability Concepts (Table 3) presented earlier, listing the characteristics of
standardized education compared to those of differentiated education. Arkansas fits the
descriptor standardized; New Hampshire fits the descriptor differentiated.
The description of standardized education presented in the Dichotomous Sort of
Accountability Concepts matched the language of Arkansas’ administrative rules.
Concepts of commerce, business, industry, produces workers, and world markets
matched language of "academic content standards are rigorous and equip students
to compete in the global workforce" (Arkansas DOE, 2013b, para. 4). Competition to
succeed, winners, and losers matched language of "compete in the global workforce"
(para 4), “recognize academic success and failure; apply awards and sanctions” (para. 2),
“incentives for teacher recruitment and retention in high priority districts” (2012a, para.
2), and “participants shall be selected through a competitive process” (2007b, para. 7).
Accountability, blame, and failure matched the language of “failure of students to meet a
mandated test score with the consequences of not receiving course credit and
requirements that students re-take the test” (2013b, para. 3). High standards, setting the
bar high, and high expectations for all students matched the language of “a challenging
set of goals” (2007a, para. 5) and “proficient level or above” (2013b, para. 7). High
school diploma based on passing proficiency exams (Algebra II, etc.) matched the
language of “End-of-Course testing was required for Algebra I, Geometry and Biology,
as was an eleventh grade literacy assessment” (para. 3) and “meet the requisite scale
score on an end-of-course assessment and [did] not satisfy the remedial requirements . . .
122
for general end-of-course assessments” (2012c, para. 6). Large scale testing;
accountability, testing, and measurement matched the language of “equal opportunity for
all students” (2007a, para. 5) to meet required performance levels using a “single
comprehensive testing, assessment and accountability program” (2013b, para. 2), “equal
opportunity for all students, including identifiable subgroups, to meet the expected
performance levels established by the Board on all State assessments” (2007a, para. 5),
and “benchmarks, measurements processes, and evaluation protocols; and is based on an
analysis of data produced by the Arkansas Comprehensive Testing Program and other
reliable measures of student learning to determine classroom, school, and school district
academic performance” (para. 5).
While some elements of standardized education matched New Hampshire’s
administrative rules, the description of differentiated education presented in the
Dichotomous Sort of Accountability Concepts matched the language of New Hampshire’s
administrative rules in ways that Arkansas’ administrative rules did not. Educated
populace, enlightened participation, respect for the individual, and personal agency
matched the language of “all students with the opportunity to acquire the knowledge and
skills necessary to prepare them for successful participation in the . . . political systems of
a free government” (NH DOE, 2007a, para. 1) and "a well-educated populace is essential
for the maintenance of democracy" (1993, para. 1). Optimal outcomes for individuals
matched the language of “school districts then have flexibility in implementing diverse
educational approaches tailored to meet student needs” (para. 2), “basic level or above on
the statewide assessment” (2003c, para. 1), “devise and implement measures which focus
on the continuing growth of individual students” (1993, para. 5), and “tailored to meet

123
student needs” (2007a, para. 2). Funding, opportunity to learn, and equitable facilities
matched the language of defining educational funding based on determining “the
resources necessary to provide essential programs, considering educational needs”
(2012b, para. 1). Optimal outcomes for each student matched the language of adequacy
of public education (2007b), “provide all students to opportunity to acquire” (2007d,
para. 1) not only content area skills and knowledge but also life skills (2007d).
Graduation without exit exams, described in the Dichotomous Sort of Accountability
Concepts as various levels of diploma with certifications for Algebra II and other
gateway courses, matched the language “is not a minimum competency testing program”
(2003a, para. 2) and a minimum number of credits required to earn a high school diploma
(2007b, 2011).
Science, technology, engineering, and mathematics (STEM) matched the
language of both Arkansas (Arkansas DOE, 2009, para. 3) and New Hampshire (NH
DOE, 2012a, p. 2), but additional content areas mandated in Arkansas were limited to
social studies, arts, and foreign language (Arkansas DOE, 2009, para. 3) while in New
Hampshire, health education, physical education, technology education, and information
and communications technologies were added to social studies, arts education and world
language as required content areas
The qualitative analysis of the administrative rules for standards and
accountability of the two exemplar states revealed characteristics of standardization and
differentiation that matched the Dichotomous Sort of Accountability Concepts. While
New Hampshire shared in common with Arkansas some attributes of standardized
education, Arkansas had many elements of educational standardization that New
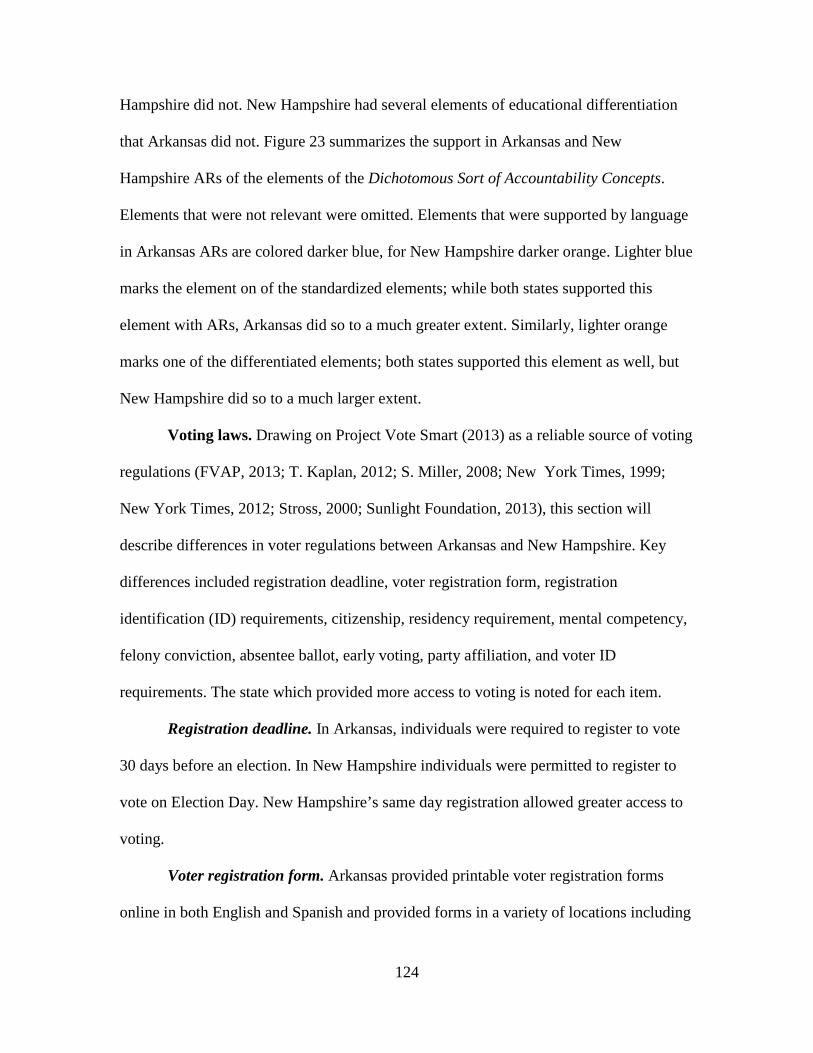
124
Hampshire did not. New Hampshire had several elements of educational differentiation
that Arkansas did not. Figure 23 summarizes the support in Arkansas and New
Hampshire ARs of the elements of the Dichotomous Sort of Accountability Concepts.
Elements that were not relevant were omitted. Elements that were supported by language
in Arkansas ARs are colored darker blue, for New Hampshire darker orange. Lighter blue
marks the element on of the standardized elements; while both states supported this
element with ARs, Arkansas did so to a much greater extent. Similarly, lighter orange
marks one of the differentiated elements; both states supported this element as well, but
New Hampshire did so to a much larger extent.
Voting laws. Drawing on Project Vote Smart (2013) as a reliable source of voting
regulations (FVAP, 2013; T. Kaplan, 2012; S. Miller, 2008; New York Times, 1999;
New York Times, 2012; Stross, 2000; Sunlight Foundation, 2013), this section will
describe differences in voter regulations between Arkansas and New Hampshire. Key
differences included registration deadline, voter registration form, registration
identification (ID) requirements, citizenship, residency requirement, mental competency,
felony conviction, absentee ballot, early voting, party affiliation, and voter ID
requirements. The state which provided more access to voting is noted for each item.
Registration deadline. In Arkansas, individuals were required to register to vote
30 days before an election. In New Hampshire individuals were permitted to register to
vote on Election Day. New Hampshire’s same day registration allowed greater access to
voting.
Voter registration form. Arkansas provided printable voter registration forms
online in both English and Spanish and provided forms in a variety of locations including

125
the library and by mail. New Hampshire did not provide voter registration forms online;
applications were available only from the county clerk. Registration by mail was handled
through the absentee ballot system described below. Arkansas’ more widely distributed
voter registration forms allowed greater access to voting.
Standardized Differentiated
Commerce; business; industry; technological innovation; blueprint
Educated populace; enlightened participation; respect for the individual; personal agency
Cost-benefit; inputs/outputs; efficiency Optimal outcomes for individuals
Produces workers; world markets Individual responsibility, freedom, and benefits
Competition to succeed; winners and losers
Collaboration among peers
Accountability; blame, failure Support; professional development
Sanctions, punishment; choice, privatization
Funding; opportunity to learn; equitable facilities
High standards; setting the bar high Zone of proximal development (ZPD); Response to Intervention (RTI)
High expectations for all students Optimal outcomes for each student
High school diploma based on passing proficiency exams (Algebra II, etc.)
Various levels of diploma with certifications for Algebra II and other gateway courses
Large scale testing; accountability Needs of the whole child; school climate
Science, Technology, Engineering, and Mathematics (STEM)
Foreign languages, vocational shops, history, political science, art, music, theater, sports, citizenship, philosophy, physical education, health education, family and consumer studies
Figure 23. Comparison of Support for Standardization/Differentiation Found in ARs
Arkansas had more than New Hampshire
Unique to New Hampshire Unique to Arkansas
New Hampshire had more than Arkansas

126
Registration ID requirements. In Arkansas, in order to register to vote, an
individual was required to supply a driver’s license, a social security number, a current
valid photo ID or a document showing the name and address of the voter including a
copy of a current utility bill, a bank statement or a paycheck. In order to register to vote
in New Hampshire, these and additional types of identification were permitted, including
completion of a qualified voter affidavit and verification of the person’s identity by
another registered voter who was known to the elections clerk or supervisor. New
Hampshire’s additional avenues for providing identification at time of registering to vote
allowed greater access to voting.
Citizenship. Arkansas made no special provision for proof of citizenship. New
Hampshire required new registrants to prove citizenship using a birth certificate, U.S.
Passport, naturalization papers, a qualified voter affidavit, or any other reasonable
document. Arkansas’ lack of requirement for proof of citizens allowed greater access to
voting.
Residency requirement. Arkansas required individuals to be residents of the state
at least 30 days prior to the election. New Hampshire had no minimum residency time
required before voting. New Hampshire’s lack of residency requirement allowed greater
access to voting.
Mental competency. Arkansas did not permit individuals who were currently
judged to be mentally incompetent to vote. New Hampshire had no voter restrictions
based on a person’s mental competency. New Hampshire’s lack of restriction to voters
with impaired mental health status allowed greater access to voting.

127
Felony conviction. Arkansas did not permit convicted felons to vote until their
sentences had been discharged or pardoned. New Hampshire permitted convicted felons
to vote at such time as the execution of the sentence was suspended, whether that
individual was on probation or on parole. There was some overlap of these rules. Because
New Hampshire permitted convicted felons to vote immediately on their release from
prison, whether their sentences had been discharged or not, New Hampshire had greater
access to voting for convicted felons.
Absentee ballot. Arkansas required that absentee ballot applications be received
seven days prior to an election. New Hampshire provided for absentee ballot to be
downloaded from its website and had no special timeline requirements for submission of
the ballot. New Hampshire’s ease of availability of absentee ballots and more flexible
timeline allowed greater access to voting.
Early voting. Arkansas provided opportunities for early voting, for periods
ranging from seven to fifteen days prior to the election, with expanded hours of
availability in high interest elections. New Hampshire had no early voting. Arkansas’
early voting allowed greater access to voting.
Party affiliation. Arkansas had open primaries, meaning that a person did not
need to be registered in a particular party to participate in that party’s primary elections.
New Hampshire permitted only undeclared voters, those with no declared or previously
demonstrated affiliation with a particular political party, to unrestricted access to vote in
any party’s primary election. Arkansas’ open primaries are less restrictive and allowed
greater access to voting.

128
Voter ID requirements. In order to vote in Arkansas, a resident was required to
state her or his name, address and birthdate to an election official. Required identification
could take the form of a current valid photo ID or a document showing the name and
address of the voter including a copy of a current utility bill, a bank statement or a
paycheck. In some cases, the person was permitted to vote with a note made on the
Precinct Voter Registration List, but if the person had registered to vote after 1/1/03 by
mail, the voter received a provisional ballot. In order to vote in New Hampshire, a
registered voter was not required to show identification at the polling place. New
Hampshire’s lack of voter ID requirements provided greater access to voting.
Summary. Table 16 summarizes the attributes of the case study states for voter
regulation. A simple count of attributes shows that Arkansas residents had less access to
voting (4 items) than did New Hampshire residents (7 items). Some of the differences
between Arkansas and New Hampshire in access to registration and voting were matters
of small degree and might individually effect only a small number of voters, but the
overall effect was cumulative and created a climate or culture of encouragement to vote
in New Hampshire. The most important element of New Hampshire’s institutionalized
access to voting was probably Election Day registration at the polling place. Lack of a
voter ID requirement at the polling place also probably contributed to higher voter
turnout in in New Hampshire as compared to Arkansas.
Study of Cultural and Demographic Attributes of Two States
Arkansas was chosen as an exemplar of states with high SEI and low voter
turnout. New Hampshire was chosen as an exemplar of states with low SEI and high
voter turnout. The next sections will compare and contrast these states’ cultural attributes

129
and demographic information in order to explore for and generate a potential explanation
of a negative correlation between the exemplar states’ SEI scores and voter turnout
levels.
Table 16
Comparison of Voter Regulations Marked for State with Greater Access
Item Arkansas New Hampshire
Registration deadline 0 1
Voter registration form 1 0
Registration ID requirements 0 1
Citizenship 1 0
Residency requirement 0 1
Mental competency 0 1
Felony conviction 0 1
Absentee ballot 0 1
Early voting 1 0
Party affiliation 1 0
Voter ID requirements 0 1
Total 4 7
Culture. In order to make claims about the cultural attributes of the two exemplar
states, Arkansas and New Hampshire were defined as members of regions with
documented cultural traits. This section places Arkansas in the Southeast region and New
Hampshire in the New England states and then describes cultural attributes of those
regions. Some details about the cultural claims of the individual states is also presented.

130
Geographic region. The regions of the U.S. are not defined the same by all
governmental agencies. While there is no disagreement about New Hampshire’s
inclusion as a New England state, the southern states are divided up into more or fewer
groups by various agencies. This study relies on the U.S. Embassy’s division of the U.S.
into six regions, New England, The Mid-Atlantic, The South, The Midwest, The
Southwest , and The West (U.S. Diplomatic Mission to Germany, 2008) Arkansas was
identified as a member of The South, and New Hampshire as a member of New England.
The map in Figure 24 presents a U.S. map of regions.
Figure 24. U.S. Divided into Regions (U.S. Diplomatic Mission to Germany, 2008)
Cultural heritage. Some common knowledge cultural attributes of The South
include its history of agriculture, slavery, losing the civil war, warm weather, and
southern hospitality. New England is known for a its history Protestant settlements, early
manufacturing, colonial activism leading to revolution, Ivy League schools, and the use

131
of town meetings to make governance decisions (U.S. Diplomatic Mission to Germany,
2008).
The State of Arkansas website devoted to Arkansas history and culture noted
Arkansas bauxite mining for use in aluminum as a critical contribution to the U.S. effort
to win World War II (The Department of Arkansas Heritage, 2013b). The page devoted
to the Culture of Arkansas (The Department of Arkansas Heritage, 2013a) focused on the
Arts and genealogy.
The State of New Hampshire devoted webpages to heritage, history, and culture,
boasting of a “the driving progress of industrial mills in Manchester [and] an
overwhelming spirit of community involvement and political participation” (Hampshire,
2013, para. 2). University of New Hampshire’s Center for New England Culture claimed
that “in no American place is the persistence of regional identity stronger than in New
England, and many have argued that core American values and characteristics originated
and still flourish in its six states” (2013, para. 4). New Hampshire took pride in its
Revolutionary War Heroes and historic places.
Summary. Arkansas and New Hampshire have different historical cultural
backgrounds. While both states are in the eastern half of the country, they draw on
different cultural traditions. Arkansas is embedded in The South, with a background of
agriculture and history that includes slavery and the civil war. Modern cultural attributes
emphasize new growth of industry, value of the arts, and an important role in World War
II. New Hampshire is part of New England, with cultural attributes that draw on a history
that goes back to Puritan settlements, the earliest manufacturing sites in the colonies, and

132
an important role in the Revolutionary War. Current articulations of culture emphasize
community involvement in the political process.
Demographics. Demographic data for Arkansas and New Hampshire revealed
some differences between the two states. This section reports data for population and
density, race, education levels, economics, social attributes, religion and political
affiliation.
Population and density. Using the U.S. Census website tool State and County
QuickFacts (U.S. Census Bureau, 2013d), comparative demographic information was
collected. Using 2012 estimates, the overall U.S. population was 313,914,040. With a
population of 2,949,131, Arkansas residents constituted about one percent (0.94%) of the
U.S. population. With a population of 1,320,718, New Hampshire residents constituted
less than half a percent (0.42%) of the U.S. population. Arkansas was about twice as
populated as New Hampshire.
Population density data from the U.S. Census Bureau (2010b) revealed a
substantial difference between Arkansas and New Hampshire. Population density in
Arkansas is about one third of what it is in New Hampshire. As displayed in Figure 25,
by that measure Arkansas is more rural than New Hampshire.
Additional data compiled by the U.S. Census Bureau (2010a) provided a more
nuanced understanding of the population density of the two case study states. Compared
to Arkansas, a greater percentage of the New Hampshire population was urban and three
times as much of the total land in the state was urban, although Arkansas’ population
density in urban areas was greater than was found in New Hampshire. Table 17 supplies
the details.

133
Figure 25. Population Density
Table 17
Urban Population Density (U.S. Census Bureau, 2010a)
State
Percentage of the total population of
the state represented by the urban population
Percentage of the land area of the state
represented by the land area of the urban areas
Population density of the urban areas
Arkansas 56% 2% 1493
New Hampshire 60% 7% 1233
The composition of rural population densities for the case study states was
somewhat the mirror of the demographics for urban population densities. For New
Hampshire, as compared to Arkansas, a smaller proportion of the population lived in
rural areas, less land was rural, and the population density of rural areas was greater.
Table 18 reports the data.
Race. In 2011 (U.S. Census Bureau, 2013e, 2013f), the distribution of race in
Arkansas was fairly close to the national averages, predominately White (80%) with
1990 2000 2010Arkansas 45.2 51.4 56.0New Hampshire 123.9 138.0 147.0United States 70.4 79.7 87.4
0
50
100
150
Pers
ons p
er S
quar
e M
ile
Population Density by Year

134
approximately 16% Black residents and 7% Hispanic/Latino residents. New Hampshire
was far more homogenous than both Arkansas and the national average; 95% of the
residents were White. Most of the non-White residents were divided between Asian (2%)
and Hispanic/Latino (3%) races. Table 19 provides supporting details.
Table 18
Rural Population Density (U.S. Census Bureau, 2010a)
State
Percentage of the total population of the state
represented by the rural population
Percentage of the land area of the state represented by the land area of the rural
areas
Population density of the
rural areas
Arkansas 44% 98% 25
New Hampshire 40% 93% 63
Table 19
Racial Composition as a Percent (U.S. Census Bureau, 2013e, 2013f)
Criteria Arkansas New
Hampshire U.S.
White persons, percent 80.1 94.6 78.1
Black persons, percent 15.6 1.3 13.1
American Indian and Alaska Native persons 0.9 0.3 1.2
Asian persons, percent 1.3 2.3 5.0
Native Hawaiian and Other Pacific Islander persons 0.2 <0.5 0.2
Persons reporting two or more races, percent 1.8 1.5 2.3
Persons of Hispanic or Latino Origin, percent 6.6 2.9 16.7
White persons not Hispanic, percent 74.2 92.2 63.4

135
Education levels. In 2007-2011 (U.S. Census Bureau, 2013e, 2013f), high school
graduation rates were lower for Arkansas (83%) than they were for New Hampshire
(91%). Similarly, fewer residents in Arkansas (20%) had at least a Bachelor’s degree, as
compared to New Hampshire (33%). Table 20 provides details.
Table 20
Education Levels for Persons 25 and Older (U.S. Census Bureau, 2013e, 2013f)
Criteria Arkansas New
Hampshire U.S.
High school graduate or higher 82.7 91.2 85.4
Bachelor's degree or higher 19.6 33.1 28.2
Economics. According to U.S. Census data for 2007-2011 (2013e, 2013f), the
poverty rate was over twice as high in Arkansas (18%) as it was in New Hampshire (8%).
Residents of Arkansas (68%) were less likely to own their own homes than residents of
New Hampshire (73%). The median value of owner-occupied homes for the same time
period was less than half as much in Arkansas ($105,100) and it was in New Hampshire
($250,000). Income levels followed the same pattern, with the per capita income for
Arkansas at $21,833 compared to $32,357 for New Hampshire; New Hampshire per
capita income represented a 48% increase over Arkansas income. Median household
income for 2007-2001 was $40,149 in Arkansas and 64,664 in New Hampshire. New
Hampshire median household income represented at 61% increase over Arkansas. Table
21 provides details of economic comparison data.

136
Table 21
Economic Demographics as a Percent (U.S. Census Bureau, 2011c, 2013f)
Criteria Arkansas New Hampshire U.S.
Persons below poverty level 18.40% 8.00% 14.30%
Homeownership rate 67.50% 72.50% 66.10%
Median value of owner-occupied housing units $105,100 $250,000 $186,200
Per capita money income in the past 12 months $21,833 $32,357 $27,915
Median household income $40,149 $64,664 $52,762
Employment status is a strong indicator of the economic situation in a state. The
U.S. Census Bureau report of Selected Economic Characteristics 2007-2011 American
Community Survey 5-Year Estimates (2011a, 2011b, 2011c) provided data on
employment; for residents age sixteen and older, Arkansas had fewer employed people
(55%) than New Hampshire (65%). One reason for this difference is that compared to
New Hampshire, Arkansas had more individuals who were not in the labor force, such as
students, homemakers, and retired workers. Figure 26 presents details.
Figure 26. Employment (U.S. Census Bureau, 2011a, 2011b, 2011c)
In labor force Employed Not in laborforce Unemployed
Arkansas 60.6% 55.2% 39.4% 8.4%New Hampshire 69.9% 65.4% 30.1% 6.3%United States 64.8% 58.8% 35.2% 8.7%
61% 55%
39%
8%
70% 65%
30%
6%
65% 59%
35%
9%
0%10%20%30%40%50%60%70%80%
Perc
ent
Employment Status
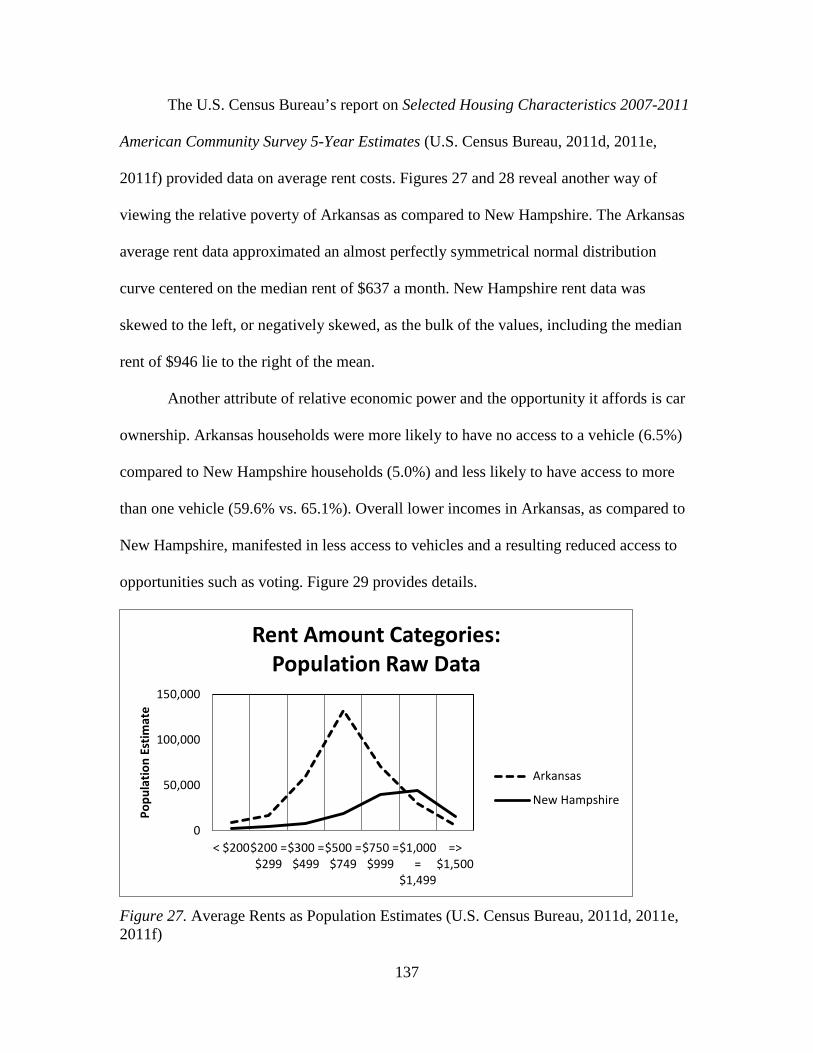
137
The U.S. Census Bureau’s report on Selected Housing Characteristics 2007-2011
American Community Survey 5-Year Estimates (U.S. Census Bureau, 2011d, 2011e,
2011f) provided data on average rent costs. Figures 27 and 28 reveal another way of
viewing the relative poverty of Arkansas as compared to New Hampshire. The Arkansas
average rent data approximated an almost perfectly symmetrical normal distribution
curve centered on the median rent of $637 a month. New Hampshire rent data was
skewed to the left, or negatively skewed, as the bulk of the values, including the median
rent of $946 lie to the right of the mean.
Another attribute of relative economic power and the opportunity it affords is car
ownership. Arkansas households were more likely to have no access to a vehicle (6.5%)
compared to New Hampshire households (5.0%) and less likely to have access to more
than one vehicle (59.6% vs. 65.1%). Overall lower incomes in Arkansas, as compared to
New Hampshire, manifested in less access to vehicles and a resulting reduced access to
opportunities such as voting. Figure 29 provides details.
Figure 27. Average Rents as Population Estimates (U.S. Census Bureau, 2011d, 2011e, 2011f)
0
50,000
100,000
150,000
< $200$200 =$299
$300 =$499
$500 =$749
$750 =$999
$1,000=
$1,499
=>$1,500
Popu
latio
n Es
timat
e
Rent Amount Categories: Population Raw Data
Arkansas
New Hampshire

138
Figure 28. Average Rents as Percentages (U.S. Census Bureau, 2011d, 2011e, 2011f)
A final aspect of economic factors can be interpreted as opportunity to vote: a
measure of mobility, how recently a resident moved into their current house. Figure 30
demonstrates that Arkansas residents (42.6%) were more likely than New Hampshire
residents (35.2%) to have moved into their current residence in the most recent category
for which data was collected, 2005 or later. In other words, people in Arkansas had
moved more recently than people in New Hampshire. Conversely, Arkansas residents
were less likely than New Hampshire residents to fall in the categories for having stayed
in the same residence for longer periods of time. (U.S. Census Bureau, 2011d, 2011e,
2011f).
According to the U.S. Census Bureau report Selected Economic Characteristics
2007-2011 American Community Survey 5-Year Estimates (U.S. Census Bureau, 2011a,
2011b, 2011c), for some industries, there was little difference between Arkansas and
New Hampshire: public administration; educational services, and health care and social
assistance; information; arts, entertainment, and recreation and accommodation and food
0%
10%
20%
30%
40%
50%
< $200 $200 =$299
$300 =$499
$500 =$749
$750 =$999
$1,000=
$1,499
=>$1,500
Perc
ent o
f Pop
ulat
ion
Rent Amount Categories by Percentage
Arkansas
New Hampshire
United States

139
services; wholesale trade, construction, and retail trade. Figure 31 presents comparative
data for the five industries with the greatest difference in employment between Arkansas
and New Hampshire. Arkansas employed more people than New Hampshire with
differences of 1.6% to 2.6% in the industries: manufacturing; transportation and
warehousing, and utilities; and agriculture, forestry, fishing and hunting, and mining.
Arkansas employed fewer people than New Hampshire in the industries of finance and
insurance, and real estate and rental and leasing (1.5% difference) and professional,
scientific, and management, and administrative and waste management services (3.2%
difference).
Figure 29. Access to Vehicles as Percentages of Households (U.S. Census Bureau, 2011d, 2011e, 2011f)
Social attributes. The U.S. Census also published social characteristics
differentiated by state for 2007-2011 in American Community Survey 5-Year (2013a,
2013b, 2013c). Small differences in social characteristics between Arkansas and New
No vehiclesavailable
1 vehicleavailable
2 vehiclesavailable
3 or morevehiclesavailable
Arkansas 6.5% 33.8% 39.4% 20.2%New Hampshire 5.0% 29.9% 42.6% 22.5%United States 8.9% 33.4% 37.8% 19.8%
0%
10%
20%
30%
40%
50%
Perc
ent
Vehicles Available to Households by Percentages

140
Hampshire suggest the influence of greater poverty on family stability and perhaps even
happiness. Arkansas had more single mothers (13.4%) than New Hampshire (9.3%),
more individuals who lived alone (27.3% vs. 24.9%), and more seniors (10.2% vs. 8.9%).
Arkansas had a smaller percentage than New Hampshire of men who never married
(28.8% vs. 30.4%), and a greater percentage who were separated (2.0% vs. 1.1%),
widowed (2.9% vs. 2.4%), or divorced (11.8% vs. 10.3%) and women who never married
(22.7% vs. 25.0%), and a greater percentage who were separated (2.8% vs. 1.3%),
widowed (11.1% vs. 8.6%), or divorced (13.2% vs. 12.7%). Table 22 provides the details.
Figure 30. Mobility as Percentages of Households (U.S. Census Bureau, 2011d, 2011e, 2011f)
Religion. The Pew Forum on Religion & Public Life published U.S. Religious
Landscape Survey Religious Affiliation: Diverse and Dynamic (2008), a survey of a
representative sample of 35,556 adults in the 50 U.S. states and D.C. Due to small
sample sizes in smaller states, some states were combined, including New Hampshire and
4.3% 5.9% 8.6%
19.5% 19.0%
42.6%
4.8% 6.2%
11.5%
21.4% 20.9%
35.2%
0%
10%
20%
30%
40%
50%
Moved in 1969or earlier
Moved in 1970to 1979
Moved in 1980to 1989
Moved in 1990to 1999
Moved in 2000to 2004
Moved in 2005or later
Year Housholder Moved Into Unit
Arkansas New Hampshire

141
Vermont. The data was also presented online (Pew Research Center, 2013). When asked
how important religion was in their lives, Arkansas (n = 681) residents were third in the
nation, with 74% of respondents saying religion was very important in their lives. New
Hampshire (combined with Vermont, n = 320) was last, with 36% of respondents saying
religion was very important in their lives. The national average was 56%. For those who
were religious, residents of Arkansas were far more likely to be members of Evangelical
Protestant churches (53%) than residents of New Hampshire (11%). Residents of New
Hampshire were far more likely to be non-evangelical Protestant (23%) or Catholic
(29%) than residents of Arkansas (16% and 5%, respectively).
Figure 31. Employment in Selected Job Categories
Political affiliation. Arkansas and New Hampshire did not present a clear pattern
of political affiliation. The political party of Representatives and Senators elected to the
U.S. Congress between 2005 and 2011 revealed fluctuations in voter party preference
Manufacturing
Transportation and
warehousing,and utilities
Agriculture,forestry,
fishing andhunting, and
mining
Finance andinsurance, and
real estateand rental and
leasing
Professional,scientific, andmanagement,
andadministrative
and wastemanagement
servicesArkansas 14.4% 5.6% 3.4% 5.1% 6.8%New Hampshire 12.8% 4.0% 0.8% 6.6% 10.0%United States 10.8% 5.1% 1.9% 6.9% 10.5%
14%
6% 3%
5% 7%
13%
4%
1%
7%
10% 11%
5%
2%
7%
11%
0.0%
5.0%
10.0%
15.0%
Perc
ent o
f Em
ploy
ed
Industry by Percentage

142
(U.S. Census Bureau, 2011g). Arkansas favored Democrats in 2005, 2007, and 2009, but
favored Republicans in the 2011 House races and split support between the two parties in
the Senate races. New Hampshire elected Republicans to Congress in 2005, Democratic
Representatives in 2007, 2009, and 2011 and Republican Senators in 2007, with split
support between Democrats and Republicans for Senate elections in 2009 and 2011.
Figure 32 provides details.
Recent elections of governors revealed that both states elected Democratic
governors by a wide margin. In Arkansas votes for the Democratic were about one third
more than for the Republican. In New Hampshire, the Democrat received one and half
times as many votes as the Republican. Figure 33 provides details.
Gallup (Saad, 2012) reported party affiliation of voters. This data revealed an
almost equal split between the voter registration party affiliation in both Arkansas and
New Hampshire. Figure 34 shows a graphic of this information.
One view of the political persuasions of the voters in Arkansas and New
Hampshire is that they were divided, as evidenced by the registration data. Another view
is that variation in the party affiliation of statewide elected officials demonstrated that
voters in both states were independent such that voters elected based on the person more
than on the party.

143
Table 22
Selected Social Characteristics in the U.S. (U.S. Census Bureau, 2013a, 2013b, 2013c)
Criteria
Arkansas New Hampshire U.S.
Estimate % Estimate % Estimate %
Households by type
Total households 1,121,386 100.0 514,869 100.0 114,761,359 100.0
Female householder, no husband present, family
149,710 13.4
47,932 9.3
14,606,354 12.7
Householder living alone 305,904 27.3 128,449 24.9 31,326,617 27.3
65 years and over 114,056 10.2 45,992 8.9 10,852,066 9.5
Marital Status
Males 15 years and over 1,120,066 100.0 528,822 100.0 119,550,497 100.0
Never married 322,285 28.8 160,538 30.4 41,414,163 34.6
Now married, except separated 610,644 54.5 295,320 55.8 61,813,577 51.7
Separated 22,582 2.0 5,713 1.1 2,163,466 1.8
Widowed 32,622 2.9 12,578 2.4 3,013,295 2.5
Divorced 131,933 11.8 54,673 10.3 11,145,996 9.3
Females 15 years and over 1,187,574 100.0 552,041 100.0 126,044,280 100.0
Never married 270,026 22.7 138,263 25.0 35,707,687 28.3
Now married, except separated 595,271 50.1 288,547 52.3 60,433,856 47.9
Separated 33,268 2.8 7,273 1.3 3,144,890 2.5
Widowed 132,264 11.1 47,671 8.6 11,896,896 9.4
Divorced 156,745 13.2 70,287 12.7 14,860,951 11.8

144
Table 23
Religious Affiliation in Percentages (Pew Research Center, 2013, pp. 96-98)
Attribute Arkansas New
Hampshire U.S.
Members of Evangelical Protestant Churches 53.0 11.0 26.0
Members of Mainline Protestant Churches 16.0 23.0 18.0
Members of Historically Black Protestant Churches 10.0 <0.5 7.0
Catholic 5.0 29.0 24.0
Mormon <0.5 1.0 2.0
Jehovah’s Witness 1.0 <0.5 1.0
Orthodox <0.5 <0.5 1.0
Other Christian 1.0 <0.5 <0.5
Jewish <0.5 1.0 2.0
Muslim <0.5 <0.5 1.0
Buddhist <0.5 1.0 1.0
Hindu <0.5 <0.5 <0.5
Other world religions <0.5 <0.5 <0.5
Other faiths <0.5 7.0 1.0
Unaffiliated 13.0 26.0 16.0
Don’t know / refused <0.5 <0.5 1.0

145
Figure 32. Composition of Congress by Political Party Affiliation (U.S. Census Bureau, 2011g)
Figure 33. Voter Participation by Party for Governor’s Race (U.S. Census Bureau, 2010b)
0%
25%
50%
75%
100%Ar
kans
as
New
Ham
pshi
re
Uni
ted
Stat
es
Arka
nsas
New
Ham
pshi
re
Uni
ted
Stat
es
Arka
nsas
New
Ham
pshi
re
Uni
ted
Stat
es
Arka
nsas
New
Ham
pshi
re
Uni
ted
Stat
es
Arka
nsas
New
Ham
pshi
re
Uni
ted
Stat
es
Arka
nsas
New
Ham
pshi
re
Uni
ted
Stat
es
Arka
nsas
New
Ham
pshi
re
Uni
ted
Stat
es
Arka
nsas
New
Ham
pshi
re
Uni
ted
Stat
es
Rep. Sen. Rep. Sen. Rep. Sen. Rep. Sen.
2005 2007 2009 2011
Composition of Congress by Political Party Affiliation: States
Democrat Republican
Arkansas (2006) New Hampshire (2008)Republican 40.7% 27.7%Democratic 55.6% 70.1%
0%
20%
40%
60%
80%
Vote
r Tur
nout
in P
erce
ntag
es
Governor's Race

146
Figure 34. Party Affiliation (Saad, 2012)
Summary
This results chapter has reported on quantitative analysis, exploration of
alternative explanations, and qualitative analysis. A detailed summary follows.
Quantitative Analysis
The first component of the study measured the relationship of two quantitative
variables, the SEI and voter turnout, to answer two research questions: (a) What is the
relationship between a state’s level of educational standardization and its voter turnout in
the 2012 national election? and (b) What is the relationship between a state’s level of
educational standardization and change in that state’s voter turnout between 2000
and 2012?
The SEI was a measure of each state’s level of educational standardization,
drawing on data collected and published by two of the most important advocates for
standardization, Achieve and Common Core State Standards Initiative. The voter turnout
rate was drawn from USEP’s report of state VEP data for two national general elections.
Arkansas New HampshireDemocrat /
Lean Democratic 41.5% 42.3%
Republican /Lean Republican 40.8% 43.8%
0.0%
10.0%
20.0%
30.0%
40.0%
50.0%Ax
is T
itle
Party Affliiation by State

147
The percentage statistic for VEP was calculated in a manner similar to the VEP
percentage; for both the numerator was the actual number of voters and the denominator
was the total of possible voters. In VAP, the denominator was all state residents age 18 or
older. In the VEP percentage, the denominator was reduced by the number of residents
who were ineligible to vote, such as non-citizens and felons, and increased by the number
of residents who were eligible to vote but out of the state, such as military personnel.
A weak negative correlation found between SEI level and voter turnout in 2012
was not significantly different from zero, r(49) = -.17, p = .22. About 3% of the
variability in 2012 state voter turnout rate was explained by the level of standardization
of education. A weak positive correlation between SEI and the difference between 2000
and 2012 voter turnout rates was not significantly different from zero, r(49) = .20, p =
.16. About 4% of the variability in the difference in state voter turnout rate between 2000
and 2012 was explained by the level of standardization of education. The statistical
analysis did not provide evidence that the level of standardization of education in state
was related to its voter turnout percentage.
Exploration of Alternative Explanations
In order to better explain the relationship between the SEI and voter turnout,
additional correlation analyses were conducted. Analysis of correlation between SEI and
VEP and VAP for 2000, 2004, 2008, and 2012 provided evidence that all the trend lines
were in the same negative direction, although for half of them, SEI with VAP 2012, and
VEP 2004, 2008, and 2012, the negative correlation was not significantly different from
zero. For the other four correlations, SEI with VEP and VAP 2000, and VAP 2004 and
2008, weak negative correlations were found that were significantly different from zero;

148
11%, 14%, 9% and 6% of the variability was explained, respectively.
Of interest to the study was the fact that none of the relationships were in a
positive direction. In other words, there was no evidence that for states, the
standardization of K-12 public education, as measured by the 2012 SEI, was positively
related to voter turnout, as measured by voter participation in presidential general
elections between 2000 and 2012.
Qualitative Analysis
The second component of the study investigated the circumstances of two
exemplar states to answer the final two research questions: (a) What institutional factors
affect educational standardization and voter turnout? and (b) What cultural and
demographic attributes provide context for understanding a state’s level of educational
standardization and voter turnout? Arkansas was selected as the best choice of an
exemplar of high SEI and low voter turnout; New Hampshire was selected as the best
choice of an exemplar of low SEI and high voter turnout. The data collection of state ARs
for educational standardization and accountability revealed differences in the framing and
mandates of education policy between the two states. Data collected on laws regulating
voter registration and voting illustrated differences in institutional barriers and
accessibility. Cultural and demographic attributes sharpened the contrast between a high
SEI / low voter turnout state and a low SEI / high voter turnout state.
Standardized education. ARs for Arkansas articulated a clear pattern of support
for standardized education. New Hampshire’s ARs presented a somewhat different
picture; while there was some evidence of standardization, there was also strong support
for differentiation of education. The descriptions of standardized and differentiated

149
education presented in the Dichotomous Sort of Accountability Concepts matched the
language of Arkansas’ and New Hampshire’s administrative rules as follows. Unique
attributes of standardization were located in the Arkansas’ ARS: commerce, business,
industry, produces workers, world markets, competition to succeed, winners, and losers,
accountability, blame, failure, high standards, setting the bar high, high expectations for
all students, high school diploma based on passing proficiency exams (Algebra II, etc.),
large scale testing, accountability, testing, and measurement. Attributes of differentiation
were located in New Hampshire’s ARs in ways that Arkansas’ administrative rules did
not: educated populace, enlightened participation, respect for the individual, personal
agency, optimal outcomes for individuals, funding, opportunity to learn, equitable
facilities, optimal outcomes for each student, graduation without exit exams (described in
the Dichotomous Sort of Accountability Concepts as various levels of diploma with
certifications for Algebra II and other gateway courses). Mandated curriculum was
another area of difference between Arkansas and New Hampshire. While both states
mandated STEM courses and three additional content areas, New Hampshire required
other additional content areas that Arkansas did not mandate.
Perhaps the most pointed language that contrasted the exemplar states’ support of
standardization and differentiation was expressed in mission statements. Arkansas
prioritized the goal that “academic content standards are rigorous and equip students
to compete in the global workforce” (Arkansas DOE, 2013b, para. 4). New Hampshire
expected to provide “all students with the opportunity to acquire the knowledge and skills
necessary to prepare them for successful participation in the . . . political systems of a
free government” (NH DOE, 2007a, para. 1) and stated that "a well-educated populace
150
is essential for the maintenance of democracy" (1993, para. 1).
Voter turnout. Regulations that affected voter participation were also different in
the two case study states. It is possible that the number of voter regulations hindered or
improved access to voting and contributed to Arkansas’ low voter participation rates
(50% in 2012), as compared to New Hampshire’s (70% in 2012). For four of the
elements of voter regulations, Arkansas provided greater access: voter registration form,
citizenship, early voting, and party affiliation. For seven of the elements of voter
regulations, New Hampshire provided greater access: registration deadline, registration
ID requirements, residency requirement, mental competency, felony conviction, absentee
ballot, and voter ID requirements. It is likely that one particular element of access was the
most important in the difference in voter participation, the requirement in Arkansas that
individuals must be residents of the state for and complete their voter registration at least
30 days prior to an election, whereas in New Hampshire, residents had no similar
residency requirements and were permitted to register to vote at the polling place on the
day of the election.
Culture. The cultural attributes of Arkansas and New Hampshire differed in one
key aspect that may have been relative to voter participation. Arkansas, as a part of The
South, is heir to historical legacy of losing the Civil War and having emancipation forced
upon it. These aspects of Arkansas’ history would not seem to particularly foster civic
participation in democracy. In contrast, New Hampshire, both as a state and as a part of
New England, is heir to a historical legacy of political involvement, from the first
European settlers who took action to obtain religions freedom, to the liberatory actions of
revolutionaries in our War of Independence, and living on today in local community
151
participation in political decisions. It is more difficult to hypothesize a connection
between the states’ cultural attributes and different levels of educational standardization.
Demographics. Demographic information provided a final area of contrast
between Arkansas and New Hampshire. Perhaps most compelling was the evidence of
Arkansas’ greater poverty, lower incomes, fewer high tech or management jobs, and
lower levels of educational attainment, as compared to New Hampshire. All of these
elements are known predictors of weaker political engagement and lower voter
participation. Differences in urban/rural population densities, with Arkansas being more
rural than New Hampshire, and religiosity, with Arkansas being more religious in general
and more fundamentalist in particular, as compared to New Hampshire, may have
contributed to a world view of the Arkansas population that more easily embraced both
the standards based movement in education and more demanding requirements of
potential voters.

152
CHAPTER V
DISCUSSION
This discussion of the relationship between the standardized of public education
and voter turnout begins with a short review of the problem, the literature review and the
study results. The rest of this section will discuss implications, contra-arguments,
limitations, and recommendations, followed by a conclusion.
Framing the Research
Voter participation was lower in the U.S. than in many other countries and decline
in voter turnout was a well-publicized problem. Voter participation continued to fluctuate
and vary between years and for types of elections, by educational level and age of voters,
and among states. An investigation of research related to the causes of voting behavior
found many and diverse studies which supplied one essential fact: evidence supported a
positive relationship between education and voting (Barber, 1969; Burden, 2009; A.
Campbell, 1960; Converse & Campbell, 1972; Dee, 2004; Freedman et al., 2004; M.
Johnson, 2001; Lassen, 2005; Leighley & Nagler, 1992; Milbrath & Goel, 1965; Nie et
al., 1996; Powell, 1986; Rosenstone & Hansen, 1993; Sondheimer & Green, 2010; Stein
et al., 2005; U.S. Census Bureau, 1991; Verba et al., 1995; R. E. Wolfinger &
Rosenstone, 1980). Relative education was a more powerful explanatory variable than
absolute education (Tenn, 2005), explaining the paradox of Brody’s puzzle. In other
words, better educated members of any particular group were more likely to vote than
their less well educated peers (Logan et al., 2012; Xu, 2005), but an increase in years of
education for any particular cohort did not correlate with increased voter participation for
that cohort. Education had a moderating effect on potential reduced participation by those
153
who faced obstacles to voting (Gallego, 2010; Milbrath & Goel, 1965; Milligan et al.,
2004; Squire et al., 1987), whether the challenges were centered on the individual, such
as poverty or mobility, or institutional, such as challenging voter registration and voter ID
rules or other impediments to voting that were not distributed equally across states. Well
documented problems with voter turnout in the U.S. occurred at the same time that
standardization of K-12 public education was increasing, incrementally and inexorably.
A historical understanding of educational standardization revealed a seemingly
inevitable transformation of policies from foundational aspirations of an informed
electorate essential in a democracy to a market forces model of efficiency and
productivity, a reshaping of educational purpose from producing personal empowerment
to producing employees ready to compete for jobs in the global workforce. A narrowing
of the curriculum was documented as educational emphasis moved towards student
outcomes represented by scores on large-scale high-stakes tests in common core content
areas of reading and math (Dillion, 2006; Gunzenhauser, 2003; K. V. King & Zucker,
2005, p. 5; Mathis, 2003; Pedulla et al., 2003; Robelen, 2011; Vogler, 2003; von Zastrow
& Janc, 2004). There was a decline in instructional minutes devoted to the content areas
most related to voter participation, civics and social studies (Kahne & Westheimer,
2003)(Duncan, 2011). Attempts to add creativity and citizenship back into the curriculum
through 21st century skills did not focus on empowerment of voters. Standardization
filled the educational space, leaving little room for the development of differentiation of
instruction, as defined in the Dichotomous Sort of Accountability Concepts.

154
The Study
The convergence of two phenomena, first low, declining, and variable voter
participation and second, increased standardization of education, was the focus of
exploratory research that developed a tool for measuring the level of state educational
standardization, the SEI. The nature of the relationship between the two variables was
explored using quantitative and qualitative methods using cultural and critical theory
lenses.
The study used a complementarity mixed-methods design with sequential
quantitative and qualitative components. The quantitative component developed a tool for
measuring states’ levels of educational standardization, the Standardized Education Index
(SEI). Data for voter age population (VAP) and voter eligible population (VEP) in state
presidential elections between 2000 and 2012 were used as measures of voter turnout. A
weak correlation was found between the SEI and voter turnout for VEP in 2000 and VAP
in 2000, 2004, and 2008, with between 6% and 14% of variability explained. While no
evidence of a positive relationship between higher levels of SEI and higher voter turnout
was found, no counter argument could be established either.
The qualitative component utilized case studies of exemplars of states with high
SEI/low voter turnout and high SEI/low voter turnout, which were Arkansas and New
Hampshire respectively. Investigated elements were: educational Administrative Rules,
voting regulations, and cultural/geographic and demographic attributes. Data was
compiled and compared. A binary sort, a Dichotomous Sort of Accountability Concepts,
framed the critical analysis of educational standards data. Arkansas was found to be a
location of standardized education and restrictive voting regulations. New Hampshire
155
was a location of more differentiated education supporting civic engagement with easier
access to voting.
Implications
This study provided some evidence that states with high SEI are more likely to
have low voter turnout than states with low SEI. This study provided no evidence to
support a positive relationship between SEI and improved voter turnout for states, but it
also made no claim that increased standardization decreased voter turnout. Qualitative
exploration identified suggested attributes of states with low educational standardization
and high voter turnout (LH), as contrasted with attributes of states with high educational
standardization and low voter turnout (HL): a historical emphasis on voter participation
in democracy, goals of education for political engagement, higher SES, more residents
employed in professional jobs, more urban, less agricultural, less religiosity in general
and more Protestants and Catholics as compared to Fundamentalists. There may be a
cultural driver that produced the LH result for states.
The concept of the SEI is useful in looking at the long range effect of
standardization of education on voter participation. The SEI is a measure of the relative
level of standardization as compared between and among states, statistically standardized
as a z-score. In the future, if data supporting some of the indicators are no longer
available, or if new indicators become relevant, these realities can be incorporated into a
new iteration of the SEI and comparisons of correlation analyses will still be relevant as a
way of looking at the longitudinal effect of SEI on voter turnout.
This study questions whether standardization of K-12 public education is the
solution to perceived problems with education, asking the question: Does standardization

156
cause more harm than any good it might do, by perpetuating or engendering low voter
participation. This study’s results are a baseline for further investigation of the
relationship of educational standardization to voter participation. If standards based
reform has a positive effect on voter participation, then future correlation analysis will
produce a moderate to strong positive relationship. If the relationship remains negative,
then it will provide evidence that standards reform does not engender an informed
electorate. After addressing alternative explanations in the next section, recommendations
will include improving the SEI, exploring states for attributes, the development of active
civic knowledge and the importance of addressing larger social issues.
Alternative Explanations
The key problem addressed by this study is the lack of improvement of voter
participation for members of various groups. One plausible justification for standardized
education as a solution to this problem is that better educated individuals are more likely
to vote than their less well educated peers, and that educational reform is increasing
education for all groups, particularly marginalized groups. This seemingly plausible
alternative explanation does not resolve the key concern of the study, which is that if
voter participation is a basic requirement of a democracy, the U.S. has not produced a
nation of voters using recent policies and practices. Educational standardization has
increased incrementally since the early twentieth century, and become the dominant
policy theme with NCLB, but voter participation has continued to fluctuate and remained
far below that of other countries.
Another alternative explanation of the study results of a weak negative correlation
between the SEI and voter turnout for some presidential elections between 2000 and 2012

157
is that the relationship is spurious. The students affected by the most stringent
implementation of standards based reform, NCLB, were not old enough to vote in 2012,
when the data for the study was collected. This alternative explanation undermines the
possibility of a causal relationship between the two variables, but this exploratory
research does not attempt to claim causality; rather, it helps inform the framing the issue
of the relationship of educational standardization and voter turnout. This study generated
a base line; further research in the future would be needed to identify a causal
relationship.
Limitations
The generalizability of the study is limited by a lack of causality imputed from
correlation analysis and the lack of statistical significance for some of the correlations.
Another limitation of the study is researcher bias in formulating questions predicated on
the notion that K-12 public education should foster voting behavior. For those who see no
merit to that values claim, the study may be of limited use. Addition limitations discussed
next include: confounding variables, SEI, temporal concepts, educational level, and
unaddressed alternative explanations.
Confounding Variables
This study has explored data in support of level of educational standardization and
voter turnout, but voter participation is confounded by socio-economic status. Poverty is
a strong predictor of reduced civic participation. A more complete discussion of
outcomes of educational level or voter participation level would explain the relationship
of poverty, and other potentially confounding variables, to voter participation.
158
SEI
The SEI was a first attempt to quantify the standardization of public education.
One limitation of the study is that the weighting of the SEI assumed that each indicator
was as important as any other in determining a score representing a state’s level of
educational standardization. Some might argue that some indicators were more or less
important than others. Problems with the SEI are not limited to the potential inadequate
weighing of the indicators. It may be that there is not much difference between PARCC
and SBAC in practice. Due to mandates of the US DOE, membership in SBAC may not
be a good indicator of differentiation of education, as contrasted to standardization. The
indicators used to calculate the SEI represent a sampling of available data on educational
standardization. The indicators may not be a valid sample. The SEI would benefit from
evaluation by experts in the field of indexes to improve both its validity and its utility.
Temporal Concepts
The findings of this study are limited by several aspects of the temporal
relationship of the variables. First, the SEI is based on 2012 data. Comparing states’
levels of educational standardization in 2012 with voter turnout in prior years (2000,
2004, and 2008) is problematic. Next, this examination of voting pattern did take into
account age of voter. Older voters went to school during periods of less standardization,
but older people tend to vote at a higher percentage. The relationship between these
factors is unknown. Additionally, the most dramatic narrowing of the curriculum began
in 2002 with the introduction of the harsh sanctions and testing mandates of NCLB, but
the students who have had the most opportunity to be affected by standards based reform
were not yet eligible to vote in 2012, the time of the study. Finally, increased voter

159
participation by the youngest voters in the 2008 and 2012 elections was a phenomenon
that was not incorporated into the investigation. This exploratory research did not resolve
questions around these issues.
Educational Level
The research did not disaggregate voting patterns by education level. Thus, while
overall voting has remained stagnant, the research could not parse out whether voting by
the well-educated increased with a concomitant decrease in the least educated or whether
both group's voting percentages remained the same.
Alternative Explanations
Relative educational level is a well-known correlate to voting when comparing
individual voter participation among peers in a cohort; it may be that Arkansas and New
Hampshire function as peers in a cohort of the states of the U.S. If so, the population of
Arkansas is generally less well educated than the population of New Hampshire and this
could be the source of the difference in voter turnout between two peers.
Arkansas residents had less access to voting than did residents of New
Hampshire. Arkansas residents were also less well educated than residents of New
Hampshire. It may be that states like Arkansas, lower levels of education further inhibit
voter participation, because the moderating effect of higher levels of education is less
available.
Summary
Limitations to this exploratory research have included confounding variables, the
preliminary nature of the SEI, temporal concepts, educational level, and alternative
explanations. Many of these unaddressed issues would be resolved with further study.

160
One of the recommendations in the following section is longitudinal study of the
relationship of state SEI scores to voter turnout.
Recommendations
The recommendations of this study fall into two categories. First will be
recommendations for improvement of the SEI and its use to develop more answers to the
question: is standardization of education creating the unintended consequence of reducing
voter participation? Second, recommendations will be made for increasing direct
instruction in social studies and civics to improve chances of voter participation and
addressing larger social problems with higher level policy recommendations.
The SEI
Standards based reform is justified as a public good because it is focused on
improving educational outcomes for members of marginalized groups, in other words, no
child will be left behind. This study raises the question: in attempting to accomplish that
goal, are other important outcomes (i.e. voter participation) being sacrificed?
The 2012 SEI was developed for this dissertation. It appears to be unique and
could serve as a valuable tool, but it is preliminary in nature. Another recommendation is
that the SEI be evaluated by experts to guild further development, in order to improve the
SEI’s validity and utility.
It cannot be said with certainty that the negative correlation between the SEI and
voter turnout is compelling evidence of the relationship because of the temporal
incongruence of the two variables. The SEI measured the standardization of K-12 public
education in the year 2012 for citizens who were not yet old enough to vote while the
voter participation data represented citizens who were no longer students in K-12 public
161
schools. Argumentation towards causality could be established with longitudinal studies
of the relationship of the SEI and voter turnout. If standardization of public education
continues as it is or increases, longitudinal studies will build evidence to explain better
the positive role of educational standardization in effecting voter turnout. In such a future
situation, analysis of the two variables will reveal moderate to high positive correlations
if the standardization of education is helping increase voter participation. However,
continuation of weak or low negative correlations, or perhaps moderate to high negative
correlations, will indicate that the standardization of public education is not helping
increase voter participation.
Exploration of States
With an improved SEI, future research should spring from the study to further
explore exemplar states using case study methodology. One recommendation is to further
explore states from the four quadrants of the 2x2 grid, LH, HL, HH, and LL, to determine
if the initial suggestions of attributes of LH and HL hold up under closer scrutiny.
Another area recommended for further study would answer the question: Are residents of
states with higher SEI scores less likely to have high school diplomas or graduate degrees
than states with higher SEI scores?
A more complete exploration of educational standardization and student
educational outcomes, as well as voter participation, would examine the role of
confounding variables such as socio-economic status and race / ethnicity. Investigation
into the relationship of educational standardization and voter participation would benefit
into a deeper investigation of the subgroups in the population, including categorization by

162
age, income, amount of time in the educational system under the constraints of the
standards based reform of NCLB.
Development of Active Civic Knowledge
Given the lack of progress in addressing wide variability of voter participation
among states and between groups, continuous lower voter participation in the U.S.
compared to other countries, and the role of education as a moderator for individuals
faced with obstacles to voting, education can serve the public interest in the generating an
informed electorate with commitment of instructional time to the development of active
civic knowledge.
Instruction in the content area of active civic knowledge (Hope, 2012; Kahne &
Westheimer, 2003; Ross, 2012) would develop an education system that promoted active
citizenship with a curriculum that educated and nurtured students so that they would be
able to “understand both their own identity and the nature of society, and how to actively
engage with the complex relationship of rights and responsibilities that exist between the
two” (p. 7). This study raises the question: would instruction in active civic knowledge
engender informed democratic citizens?
Addressing Larger Social Issues
Darling-Hammond (2007) and Herman (2008) pointed to a basic flaw in the
reasoning behind NCLB and other standardized reform efforts: the futility of attempting
to improve the socio-economic status of the poorest American students by demanding
more of their teachers while making no attempt to resolve the greater social and historical
inequities that frame our American social structure. Darling-Hammond and Herman
suggested that the solution to disparity in educational outcomes was high-quality

163
universal preschool, health care for children, central and equal funding of schools,
additional funding for struggling schools, smaller class sizes, intensive after school and
summer school programs, excellent teacher preparation, continuing professional
development, and higher teacher salaries. This study gives rise to another future research
question that asks would an education that produced an informed electorate be more
likely if U.S. educational policy attended to Darling-Hammond and Herman’s
suggestions?
Conclusion
This exploratory research has helped inform the framing of the relationship of
educational standardization and voter participation. It provided evidence that a higher
level of educational standardization is not related to higher voter turnout. The attributes
of states that embraced standardization of K-12 public education, as measured by the
2012 SEI, were not the attributes of states that generated higher voter turnout, whatever
those attributes may have been. The exploratory study of Arkansas and New Hampshire
for elements of educational standardization in administrative rules, obstacles to voting
found in laws and regulations, cultural/geographic evidence and demographic data
revealed differences in values and orientation that contributed to divergent framing of
relevant governmental policies along with divergent results in voter participation.
The language of standardization, which emphasizes preparing students for college
and career, as well as preparing students to compete in global markets, reveal an
emphasis on the fostering of efficient workers. Does this preparation of citizens to
become competitive workers in global markets come at the direct cost of preparation for
their participation in democratic systems of governance? Would this lack of focus on

164
active civic knowledge leave citizens less capable of using the power inherent in a
democracy to resist exploitation by corporate employers? Would education for an
empowered electorate increase the likelihood of the use of the tools of government to
ensure jobs with safe working conditions, family wage jobs, health care, and secure
retirement and to address the economic inequities that currently leave many Americans
unemployed, under-employed, and contingently employed?
Jefferson advocated for an informed electorate, so that a government “instituted
among Men, [and] deriving their just powers from the consent of the governed [would]
secure certain unalienable Rights, that among these are Life, Liberty and the pursuit of
Happiness” ("U.S. Declaration of independence," 1776). Du Bois called for “the
development of power and ideal, . . . a right to know, to think, to aspire” (1970, p. 172)
which he contrasted with schools whose purpose is ”to educate black boys and girls
simply as servants and underlings, or simply for the use of other people” (p. 172).
Franklin D. Roosevelt articulated this message to “the teachers and patrons of American
schools: . . . democracy cannot succeed unless those who express their choice are
prepared to choose wisely. The real safeguard of democracy, therefore, is education”
(1938, paras. 1-4). In proposing education that produces “intelligence plus character”
(King Jr., 1947, para. 5), the most influential American civil rights activist warned that
“education which stops with efficiency may prove the greatest menace to society” (para.
3).
This exploratory research has helped inform a framing of the issues around
educational standardization and voter participation, but has perhaps created more
questions than it answered. Fundamentally, is the increase in educational standardization

165
a problematic indicator of declining support of democratic institutions, particularly the
most important attribute of empowerment in a democracy: voting?
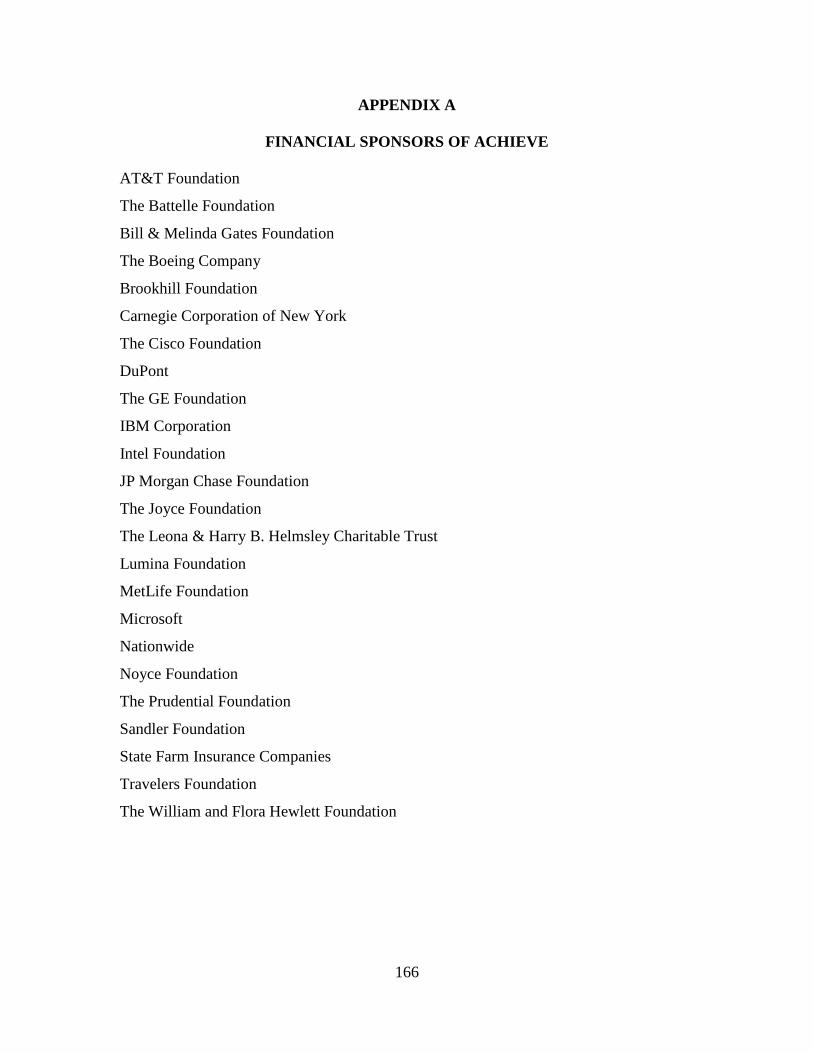
166
APPENDIX A
FINANCIAL SPONSORS OF ACHIEVE
AT&T Foundation
The Battelle Foundation
Bill & Melinda Gates Foundation
The Boeing Company
Brookhill Foundation
Carnegie Corporation of New York
The Cisco Foundation
DuPont
The GE Foundation
IBM Corporation
Intel Foundation
JP Morgan Chase Foundation
The Joyce Foundation
The Leona & Harry B. Helmsley Charitable Trust
Lumina Foundation
MetLife Foundation
Microsoft
Nationwide
Noyce Foundation
The Prudential Foundation
Sandler Foundation
State Farm Insurance Companies
Travelers Foundation
The William and Flora Hewlett Foundation

167
APPENDIX B
FULL ACHIEVE WEBSITE REPORT FOR TENNESSEE

168
APPENDIX C
RACE TO THE TOP THEORY OF ACTION SECTIONS
Partnership for Assessment of Readiness for College and Careers The theory of action submitted by PARCC (2011) claimed that the assessment
system would:
provide students, educators, policymakers and the public with the tools
needed to identify whether students — from grade 3 through high school
— are on a trajectory for postsecondary success and, critically, where gaps
may exist and how they can be remediated well before students enter
college or the workforce. Developing and implementing PARCC‘s
proposed assessment system is a fundamental and necessary step in
Partnership states’ larger efforts to dramatically improve student
achievement, but states know that assessments alone cannot accomplish
this. The partnership‘s proposed assessments are one lever for
improvement in the broader education system. The design and
implementation of these assessments will provide a platform for enriching
professional development and modeling good instruction, but the
assessments‘ success is tied to the strength and rigor of classroom
curriculum; the efforts of teachers, school principals, and district
administrators; and the involvement of parents in their children‘s
education. (pp. 34-35)
Smarter Balanced Assessment Consortium (SBAC) In their application, Smarter Balanced Assessment Consortium (SBAC) (2010)
presented a theory of action which featured seven principles:

169
Grounded in a thoughtful, standards-based curriculum and representing an
integrated system; assessments produce evidence of student performance;
teachers involved in development and scoring of assessments; system is
state-led with transparent governance; assessments are structured to
continuously improve teaching and learning; useful information on
multiple measures that is educative for all stakeholders; [and] adhering to
established professional standards (Willhoft, 2010, p. 20)

170
APPENDIX D
NEXT GENERATION SCIENCE STANDARDS
Explanation of Next Generation Science Standards Lead Partner States
Responsibilities
According to the Achieve website, (Achieve, 2012c, para. 2) lead state partners
will:
• Give serious consideration to adopting the resulting Next Generation
Science Standards as presented.
• Identify a state science lead who will attend meetings with writers to
provide direction and work toward agreement on issues around the
standards, adoption, and implementation.
• Participate in Multi-State Action Committee meetings (Committee of
the Chief State School Officers) to discuss issues regarding adoption
and implementation of the new standards.
• Publically announce the state is part of the effort to draft new science
standards and make transparent the state’s process for
outreach/receiving feedback during the process.
• Form broad based committee that considers issues regarding adoption
and provides input and reactions to drafts of the standards.
• Publicly identify timeline for adopting science standards.
• Utilize the collective experiences of the states to develop
implementation and transition plans while the standards are being
developed that can be used as models for all states.

171
APPENDIX E
ADOPTION OF COMMON CORE STANDARDS
(CCSSI, 2012)
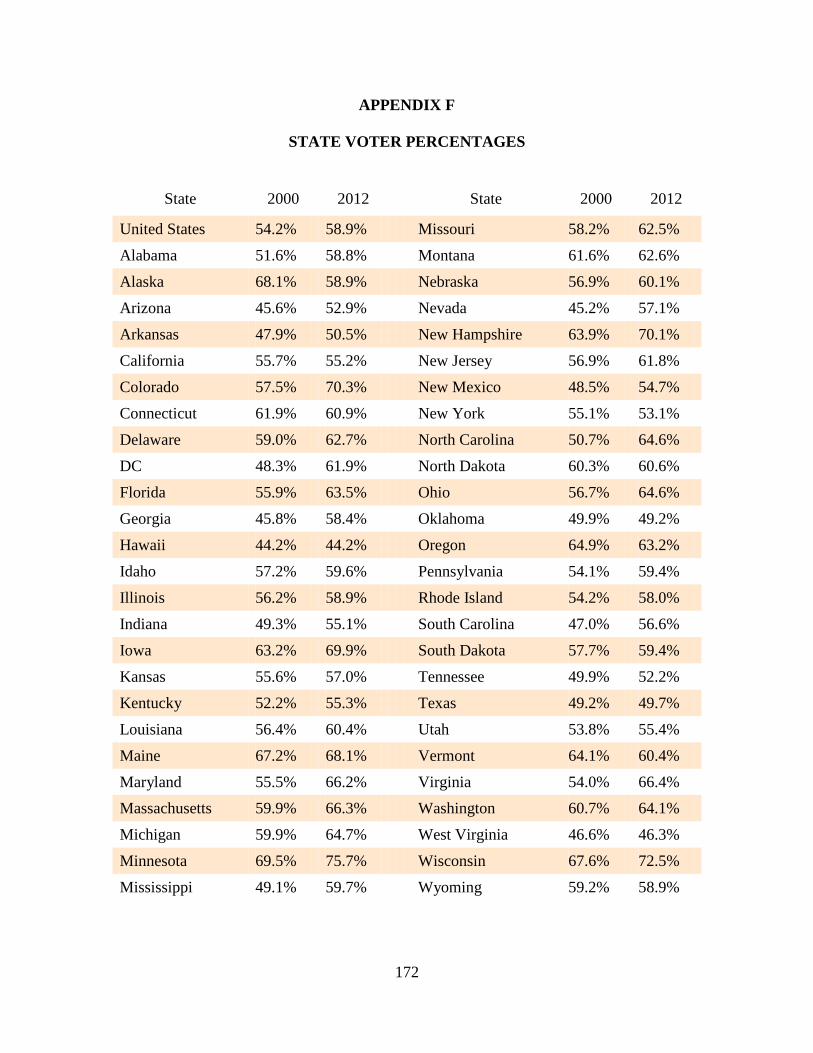
172
APPENDIX F
STATE VOTER PERCENTAGES
State 2000 2012
State 2000 2012
United States 54.2% 58.9% Missouri 58.2% 62.5%
Alabama 51.6% 58.8%
Montana 61.6% 62.6%
Alaska 68.1% 58.9% Nebraska 56.9% 60.1%
Arizona 45.6% 52.9%
Nevada 45.2% 57.1%
Arkansas 47.9% 50.5% New Hampshire 63.9% 70.1%
California 55.7% 55.2%
New Jersey 56.9% 61.8%
Colorado 57.5% 70.3% New Mexico 48.5% 54.7%
Connecticut 61.9% 60.9%
New York 55.1% 53.1%
Delaware 59.0% 62.7% North Carolina 50.7% 64.6%
DC 48.3% 61.9%
North Dakota 60.3% 60.6%
Florida 55.9% 63.5% Ohio 56.7% 64.6%
Georgia 45.8% 58.4%
Oklahoma 49.9% 49.2%
Hawaii 44.2% 44.2% Oregon 64.9% 63.2%
Idaho 57.2% 59.6%
Pennsylvania 54.1% 59.4%
Illinois 56.2% 58.9% Rhode Island 54.2% 58.0%
Indiana 49.3% 55.1%
South Carolina 47.0% 56.6%
Iowa 63.2% 69.9% South Dakota 57.7% 59.4%
Kansas 55.6% 57.0%
Tennessee 49.9% 52.2%
Kentucky 52.2% 55.3% Texas 49.2% 49.7%
Louisiana 56.4% 60.4%
Utah 53.8% 55.4%
Maine 67.2% 68.1% Vermont 64.1% 60.4%
Maryland 55.5% 66.2%
Virginia 54.0% 66.4% Massachusetts 59.9% 66.3% Washington 60.7% 64.1%
Michigan 59.9% 64.7%
West Virginia 46.6% 46.3%
Minnesota 69.5% 75.7% Wisconsin 67.6% 72.5%
Mississippi 49.1% 59.7%
Wyoming 59.2% 58.9%

173
APPENDIX G
SEI SCORES WITH TRANSFORMATION TO Z-SCORES
State SEI
score z-score
State SEI
score z-score Georgia 8 2.03 Minnesota 5 0.06 Alabama 7 1.37 Mississippi 5 0.06 Arkansas 7 1.37 New Jersey 5 0.06 Delaware 7 1.37 Oklahoma 5 0.06 Florida 7 1.37 Pennsylvania 5 0.06 Kentucky 7 1.37 Rhode Island 5 0.06 Tennessee 7 1.37 DC 4 -0.59 Arizona 6 0.72 Kansas 4 -0.59 Colorado 6 0.72 South Dakota 4 -0.59 Hawaii 6 0.72 Utah 4 -0.59 Illinois 6 0.72 West Virginia 4 -0.59 Indiana 6 0.72 Wisconsin 4 -0.59 Louisiana 6 0.72 Wyoming 4 -0.59 Michigan 6 0.72 Connecticut 3 -1.25 New Mexico 6 0.72 Idaho 3 -1.25 New York 6 0.72 Missouri 3 -1.25 North Carolina 6 0.72 Montana 3 -1.25 Ohio 6 0.72 Nebraska 3 -1.25 Oregon 6 0.72 Nevada 3 -1.25 Texas 6 0.72 North Dakota 3 -1.25 Washington 6 0.72 Vermont 3 -1.25 California 5 0.06 Virginia 3 -1.25 Iowa 5 0.06 Alaska 2 -1.90 Maine 5 0.06 New Hampshire 2 -1.90 Maryland 5 0.06 South Carolina 2 -1.90 Massachusetts 5 0.06
8 7 7 7 7 7 7
6 6 6 6 6 6 6 6 6 6 6 6 6 6 5 5 5 5 5 5 5 5 5 5 5
4 4 4 4 4 4 4 3 3 3 3 3 3 3 3 3
2 2 2
0
2
4
6
8
Geo
rgia
Alab
ama
Arka
nsas
Dela
war
eFl
orid
aKe
ntuc
kyTe
nnes
see
Ariz
ona
Colo
rado
Haw
aii
Illin
ois
Indi
ana
Loui
siana
Mic
higa
nN
ew M
exic
oN
ew Y
ork
Nor
th C
arol
ina
Ohi
oO
rego
nTe
xas
Was
hing
ton
Calif
orni
aIo
wa
Mai
neM
aryl
and
Mas
sach
uset
tsM
inne
sota
Miss
issip
piN
ew Je
rsey
Okl
ahom
aPe
nnsy
lvan
iaRh
ode
Isla
ndDi
stric
t of C
olum
bia
Kans
asSo
uth
Dako
taU
tah
Wes
t Virg
inia
Wisc
onsin
Wyo
min
gCo
nnec
ticut
Idah
oM
issou
riM
onta
naN
ebra
ska
Nev
ada
Nor
th D
akot
aVe
rmon
tVi
rgin
iaAl
aska
New
Ham
pshi
reSo
uth
Caro
lina
State SEI Scores

174
REFERENCES CITED
Abramson, P. R., & Aldrich, J. H. (1982). The decline of electoral-participation in America. American Political Science Review, 76(3), 502-521.
Achen, C. H. (1992). Social psychology, demographic variables, and linear regression: Breaking the iron triangle in voting research. Political Behavior, 14(3), 195-211. doi: 10.2307/586227
Achieve. (2011). Closing the expectations gap 2011: Sixth annual 50 - state progress report on the alignment of high school policies with the demands of college and careers: Achieve.
Achieve. (2012a). About achieve Retrieved March 9, 2012, from http://www.achieve.org/node/337
Achieve. (2012b). Adp network Retrieved December 15, 2012, from http://www.achieve.org/adp-network
Achieve. (2012c). Ngss lead partner states. Our Networks Retrieved December 15, 2012, from http://www.achieve.org/ngss-states
Achieve. (2012d). Our board of directors Retrieved November 9, 2012, from http://www.achieve.org/our-board-directors
Achieve. (2012e). The states. The States Retrieved December 15, 2012, from http://www.achieve.org/states
Achieve. (2012f). Tennessee. The States Retrieved May 25, 2012, from http://www.achieve.org/tennessee
Adams, J., Dow, J., & Iii, S. M. (2006). The political consequences of alienation-based and indifference-based voter abstention: Applications to presidential elections. Political Behavior, 28(1), 65-86. doi: 10.2307/4500210
Aguilar, E. E., & Pacek, A. C. (2000). Macroeconomic conditions, voter turnout, and the working-class/economically disadvantaged party vote in developing countries. Comparative Political Studies, 33(8), 995-1017.
Almond, G. A., & Verba, S. (1963). The civic culture: Political attitudes and democracy in five nations. Princeton, NJ: Princeton University Press.
ALSDE. (2011, July 2009). Accountability: Frequently asked questions Retrieved June 21, 2011, 2011, from https://docs.alsde.edu/documents/91/Accountability%20FAQs%202009.pdf
ANES. (2013). The origins of ANES. About ANES Retrieved January 7, 2013, from http://www.electionstudies.org/overview/origins.htm

175
Ansolabehere, S., & Konisky, D. M. (2006). The introduction of voter registration and its effect on turnout. Political Analysis, 14(1), 83-100.
Arkansas DOE (2005). Comprehensive plan for consistency and rigor in course work ADE 200 005.19 (January 10, 2005). Retrieved March 31, 2013, http://www.arkansased.org/public/userfiles/Legal/Legal-Current%20Rules/ade_200_revised_consistency_rigor_may05.pdf
Arkansas DOE (2007a). Monitoring of Arkansas comprehensive school improvement plans (acsip). ADE 285 005.15 (December 2007). Retrieved March 27, 2013, http://www.arkansased.org/public/userfiles/Legal/Legal-Current%20Rules/ade_285_acsip_1207_current.pdf
Arkansas DOE (2007b). Rewarding excellence in achievement program. ADE 277 005.16 (October 8, 2007). Retrieved March 31, 2013, http://www.arkansased.org/public/userfiles/Legal/Legal-Current%20Rules/ade_277_reap_100807.pdf
Arkansas DOE (2009). Standards for accreditation of Arkansas public schools and school districts. ADE 282 005.15 (July 2009). Retrieved March 31, 2013, http://www.arkansased.org/public/userfiles/Legal/Legal-Current%20Rules/ade_282_standards_0709_current.pdf
Arkansas DOE (2011). College and career readiness planning programs ADE 301 005.19 (July 2011). Retrieved March 31, 2013, http://www.arkansased.org/public/userfiles/rules/Current/ade_301_College_and_Career_Readiness_-_July_2011.pdf
Arkansas DOE (2012a). Incentives for teacher recruitment and retention in high priority dsitricts with an average daily membership of 1,000 or fewer. ADE 278 005.16 (March 31, 2012). Retrieved March 31, 2013, http://www.arkansased.org/public/userfiles/Legal/Legal-Current%20Rules/ade_278%20recruitment%20and%20retention%20-%20april%202012.pdf
Arkansas DOE (2012b). Professional development. ADE 207 005 (April 16, 2012). Retrieved March 31, 2013, http://www.arkansased.org/public/userfiles/Legal/Legal-Current%20Rules/ADE_207%20Professional%20Development%20Rules%20-%20April%202012.pdf
Arkansas DOE (2012c). Public school end-of-course assessments and remediation. ADE 294 005.15 (March 1, 2012). Retrieved March 31, 2013, http://www.arkansased.org/public/userfiles/Legal/Legal-Current%20Rules/ADE_294%20End%20of%20Course%20Rules%20-%20March%202012.pdf
176
Arkansas DOE (2013a). Code of ethics for Arkansas educators. ADE 291 005.16 (January 12, 2013). Retrieved http://www.arkansased.org/public/userfiles/rules/Current/ade_291_Code_of_Ethics_for_Arkansas_Educators_-_Jan_2013.pdf
Arkansas DOE (2013b). Comprehensive testing, assessment and accountability program and the academic distress program. ADE 247 005.19 (January 2013). Retrieved March 31, 2013, http://www.arkansased.org/public/userfiles/rules/Current/ade_247_ACTAAP_-_Jan_2013.pdf
Arkansas DOE (2013c). Uniform grading scales for public secondary schools and for optional use in public elementary schools. ADE 230 005.15 (October 2005). Retrieved March 31, 2013, http://www.arkansased.org/public/userfiles/Legal/Legal-Current%20Rules/ade_230_uniform_grading_scales.pdf
ASCD. (2012a). About ASCD Retrieved May 18, 2012, from http://www.ascd.org/about-ascd.aspx
ASCD. (2012b). Common core standards adoption by state Retrieved December 15, 2012, from http://www.ascd.org/common-core-state-standards/common-core-state-standards-adoption-map.aspx
Assessment & Teaching of 21st Century Skills. (2012a). Acknowledgments Retrieved May 15, 2012, from http://atc21s.org/index.php/about/acknowledgment/
Assessment & Teaching of 21st Century Skills. (2012b). Purpose Retrieved May 15, 2012, from http://atc21s.org/index.php/about/purpose/
Assessment & Teaching of 21st Century Skills. (2012c). What are 21st-century skills? Retrieved May 2, 2012, from http://atc21s.org/index.php/about/what-are-21st-century-skills/
Baek, M. (2009). A comparative analysis of political communication systems and voter turnout. American Journal of Political Science, 53(2), 376-393.
Barber, J. D. (1969). Citizen politics: An introduction to political behavior. Chicago: Markham.
Barreto, M. A., & Masuoka, N. (2004). Engagement, recruitment and minority participation: Measuring the mobilizing effects of co-ethnic candidates on Latino and Asian voter turnout. Paper presented at the Western Political Science Association 2004 Annual Conference, Portland. http://citation.allacademic.com/meta/p_mla_apa_research_citation/0/8/8/3/4/pages88348/p88348-1.php
Barton, P. E. (2009). National education standards: Getting beneath the surface. In E. T. Service (Ed.), Policy Information Perspective: Educational Testing Service.

177
Baum, S., Ma, J., & Payea, K. (2010). Education pays 2010: The benefits of higher education for individuals and society. Trends in Higher Education Series Retrieved July 18, 2012, from http://trends.collegeboard.org/downloads/Education_Pays_2010.pdf
Beatty, A. (2008). Assessing the role of K-12 academic standards in states: Workshop summary. Washington, D.C.: The National Academies Press.
Bird, W. L., Campbell, K., & Briggs, N. (2012). Vote: The machinery of democracy. Smithsonian National Museum of American History Retrieved August 24, 2012, from http://americanhistory.si.edu/vote/intro.html
Blais, A. (2000). To vote or not to vote?: The merits and limits of rational choice theory. Pittsburgh, Pa.: University of Pittsburgh Press.
Blais, A., & Rubenson, D. (2012). The source of turnout decline: New values or new contexts? Comparative Political Studies, 46(1), 95-117.
Blakely, T. A., Kennedy, B. P., & Kawachi, I. (2001). Socioeconomic inequity in voting participation and self-rated health. [Article]. American Journal of Public Health, 91(1), 99-104.
Brody, R. A. (1978). The puzzle of political participation in America. In S. H. Beer & A. King (Eds.), The new American political system. Washington: American Enterprise Institute for Public Policy Research.
Brody, R. A., & Sniderman, P. M. (1977). From life space to polling place: The relevance of personal concerns for voting behavior. British Journal of Political Science, 7(3), 337-360.
Bueker, C. S. (2005). Political incorporation among immigrants from ten areas of origin: The persistence of source country effects. International Migration Review, 39(1), 103-140.
Burden, B. C. (2000). Voter turnout and the national election studies. Political Analysis, 8(4), 389-398. doi: 10.2307/25791621
Burden, B. C. (2009). The dynamic effects of education on voter turnout. Electoral Studies, 28(4), 540-549.
Business Tools for Better Schools. (2012). Business leadership of education reform Retrieved May 23, 2012, from http://www.biztools4schools.org/what_business_has_already_done
Campbell, A. (1960). The American voter. New York: Wiley.
Campbell, A. L. (2002). Self-interest, social security, and the distinctive participation patterns of senior citizens. The American Political Science Review, 96(3), 565-574.
178
CCSSI. (2012). In the states. Common Core State Standards Initiative: Preparing American's Students for College and Career Retrieved December 15, 2012, from http://www.corestandards.org/in-the-states
CCSSI. (2013a). Home: Implementing the common core standards. Common Core State Standards Initiative: Preparing American's Students for College and Career Retrieved January 16, 2013, from http://www.corestandards.org/
CCSSI. (2013b). In the states. Common Core State Standards Initiative Retrieved March 15, 2012, from http://www.corestandards.org/in-the-states
CCSSI. (2013c). The standards. Common Core State Standards Initiative: Preparing American's Students for College and Career Retrieved January 16, 2013, from http://www.corestandards.org/the-standards
CCSSO. (2013). Standards, assessment & accountability. What We Do Retrieved March 15, 2013, from http://www.ccsso.org/What_We_Do/Standards_Assessment_and_Accountability.html
Center for 21st Century Skills. (2012a). Center for 21st century skills at education connection Retrieved May 2, 2012, from http://www.skills21.org/
Center for 21st Century Skills. (2012b). Our vision and philosophy Retrieved May 2, 2012, from http://www.skills21.org/about/our-vision/
Center for New England Culture. (2013). About CNEC. University of New Hampshire Retrieved April 11, 2013, from http://neculture.org/about.html
Chong, D., & Rogers, R. (2005). Racial solidarity and political participation. Political Behavior, 27(4), 347-374. doi: 10.2307/4500204
Chow, J. (2012). Establishing a general framework civic competency for European youth. [Article]. International Journal of Progressive Education, 8(3), 140-150.
Claassen, R. L. (2008). Testing the reciprocal effects of campaign participation. Political Behavior, 30(3), 277-296. doi: 10.2307/40213318
Clerk of the U.S. House of Representatives. (2013). Election statistics. Institution Retrieved January 5, 2013, from http://history.house.gov/Institution/Election-Statistics/Election-Statistics/
Clifton, N. (2008). The "creative class" in the UK: An initial analysis. [Article]. Geografiska Annaler Series B: Human Geography, 90(1), 63-82. doi: 10.1111/j.1468-0467.2008.00276.x
Conley, D. T. (2010). College and career ready: Helping all students succeed beyond high school. San Francisco: Jossey-Bass.
179
Connell, R. W. (1995). Masculinities. Berkeley: University of California Press.
Converse, P. E., & Campbell, A. (1972). The human meaning of social change. New York: Russell Sage Foundation.
Creswell, J. W. (1994). Research design: Qualitative & quantitative approaches. Thousand Oaks, Calif.: Sage Publications.
Creswell, J. W. (2008). Research design: Qualitative, quantitative, and mixed methods approaches: Sage Publications.
Crick, B. (1999). The presuppositions of citizenship education. [Article]. Journal of Philosophy of Education, 33(3), 337.
Dahl, R. A. (1971). Polyarchy: Participation and opposition. New Haven: Yale University Press.
Dahl, R. A. (2012). Democracy Retrieved August 24, 2012, from http://www.britannica.com/EBchecked/topic/157129/democracy
Darling-Hammond, L. (2007). Evaluating 'No Child Left Behind' The Nation (May 21, 2007 ed.).
Dee, T. S. (2004). Are there civic returns to education? Journal of Public Economics, 88(9-10), 1697-1720. doi: 10.1016/j.jpubeco.2003.11.002
Derrida, J. (1976). Of grammatology. Baltimore: Johns Hopkins University Press.
Dillion, S. (2006, March 26, 2006). Schools cut back subjects to push reading and math Retrieved August 15, 2012, from http://www.nytimes.com/2006/03/26/education/26child.html?pagewanted=all
Drazen, A., & Brender, A. (2006). Electoral economics in new democracies: Affecting attitudes about democracy: The Foerder Institute for Economic Research and The Sackler Institute of Economic Studies.
Du Bois, W. E. B. (1970). W. E. B. Du Bois speaks: Speeches and addresses. New York: Pathfinder Press.
Duncan, A. (2011). The social studies are essential to a well-rounded education. Social Education, 75(3), 124-125.
Education Connection. (2012). Overview Retrieved May 2, 2012, from http://www.educationconnection.org/about-us/overview/
Education Week. (2004). No Child Left Behind Retrieved June 21, 2011, 2011, from http://www.edweek.org/ew/issues/no-child-left-behind/
Eisner, E. W. (1978). What is quality education? Instructor, 88(3), 20-21.

180
Eisner, E. W. (1979). The educational imagination: On the design and evaluation of school programs. New York: Macmillan.
Enclopaedia Britannica. (2012). Election Retrieved August 24, 2012, from http://www.britannica.com/EBchecked/topic/182308/election/36692/Participation-in-elections
Estrada-Correa, V., & Martin, J. (2012). Foreclosure depresses voter turnout: Neighborhood disruption and the 2008 presidential election in California. Social Science Quarterly, 93(3), 559-576.
Farenga, S. J., & Ness, D. (2005). Encyclopedia of education and human development (Vol. 1). Armonk, New York: M.E. Sharpe.
Flavin, P. (2012). Does higher voter turnout among the poor lead to more equal policy representation? The Social Science Journal, 49(4), 405-412. doi: http://dx.doi.org/10.1016/j.soscij.2012.09.006
Flesch, R. (1955). Why Johnny can't read. New York: Harper & Row.
Florida, R. L. (2002). The rise of the creative class: And how it's transforming work, leisure, community and everyday life. New York, NY: Basic Books.
Fowler, J. H., & Dawes, C. T. (2008). Two genes predict voter turnout. The Journal of Politics, 70(3), 579-594. doi: 10.2307/30219439
Francia, P. L., & Herrnson, P. S. (2004). The synergistic effect of campaign effort and election reform on voter turnout in state legislative elections. State Politics & Policy Quarterly, 4(1), 74-93.
Freedman, P., Franz, M., & Goldstein, K. (2004). Campaign advertising and democratic citizenship. American Journal of Political Science, 48(4), 723-741.
Frisco, M. L., Muller, C., & Dodson, K. (2004). Participation in voluntary youth-serving associations and early adult voting behavior. [Article]. Social Science Quarterly (Blackwell Publishing Limited), 85(3), 660-676. doi: 10.1111/j.0038-4941.2004.00238.x
Fullerton, A. S., & Borch, C. (2008). Reconsidering explanations for regional convergence in voter registration and turnout in the United States, 1956-2000. Sociological Forum, 23(4), 755-785. doi: 10.2307/40210389
Fullerton, A. S., & Stern, M. J. (2010). Explaining the persistence and eventual decline of the gender gap in voter registration and turnout in the American south, 1956–1980. Volume 34, Number 2, Summer 2010, 34(2), 129-169.
FVAP. (2013). Links. Federal Voting Assistance Program Retrieved March 26, 2013, from http://www.fvap.gov/reference/links.html

181
Gallego, A. (2010). Understanding unequal turnout: Education and voting in comparative perspective. Electoral Studies, 29(2), 239-248. doi: http://dx.doi.org/10.1016/j.electstud.2009.11.002
Gans, C., & Mulling, M. (2011). Voter turnout in the United States 1788-2009 Retrieved January 3, 2013, from http://public.eblib.com/EBLPublic/PublicView.do?ptiID=634544
Garber, S. (2007). Sputnik and the dawn of the space age. Multimedia Interactive Feature on 50th Anniversary of the Space Age Retrieved August 5, 2012, from http://history.nasa.gov/sputnik/
Gardner, D. P. (1983). Nation at risk The Imperative For Educational Reform. An Open Letter to the American People. A Report to the Nation and the Secretary of Education: United States Department of Education.
Gates, B. (2005). Prepared remarks. Paper presented at the National Governors Association/Achieve Summit. http://www.nga.org/cda/files/ES05GATES.pdf
Gerber, A. S., Green, D. P., & Shachar, R. (2003). Voting may be habit-forming: Evidence from a randomized field experiment. American Journal of Political Science, 47(3), 540-550.
Gimpel, J., Dyck, J., & Shaw, D. (2004). Registrants, voters, and turnout variability across neighborhoods. [Article]. Political Behavior, 26(4), 343-375. doi: 10.1007/s11109-004-0900-4
Glaeser, E. (2005). Review of Richard Florida's the rise of the creative class. Regional Science and Urban Economics, 35(5), 593-596. doi: 10.1016/j.regsciurbeco.2005.01.005
Goldstein, K. M., & Ridout, T. N. (2002). The politics of participation: Mobilization and turnout over time. Political Behavior, 24(1), 3-29. doi: 10.2307/1558390
Goodwyn, L. (1978). The populist moment: A short history of the agrarian revolt in America. New York: Oxford University Press.
Green, D. P., & Shachar, R. (2000). Habit formation and political behavior: Evidence of consuetude in voter turnout. British Journal of Political Science, 30(4), 561-573.
Greene, J., & Caracelli, V. J. (1997). Advances in mixed-method evaluation: The challenges and benefits of integrating diverse paradigms. San Francisco: Jossey-Bass Publishers.
Greene, J., Caracelli, V. J., & Graham, W. F. (1989). Toward a conceptual framework for mixed-method evaluation designs. Educational Evaluation and Policy Analysis, 11(3), 255-274. doi: 10.2307/1163620

182
Greene, J., Kreider, H., & Mayer, E. (2005). Combining qualitative and quantitative methods in social inquiry. In B. Somekh & C. Lewin (Eds.), Research methods in the social sciences (pp. 274-281). London; Thousand Oaks, CA: Sage Publications.
Greene, K., & Nikolaev, O. (1999). Voter participation and the redistributive state. Public Choice, 98(1/2), 213-226.
Gunzenhauser, M. G. (2003). High-stakes testing and the default philosophy of education. Theory into Practice, 42(1), 51-58.
H.R. 1--111th Congress. (2012). American recovery and reinvestment Act of 2009 Retrieved March 26, 2012, from http://www.gpo.gov/fdsys/pkg/BILLS-111hr1enr/pdf/BILLS-111hr1enr.pdf
Halcoussis, D., Ng, K., & Virts, N. (2009). Property ownership and educational discrimination in the south. Volume 35, Number 2, Fall 2009, 35(2), 128-139.
Hall, M. G., & Bonneau, C. W. (2008). Mobilizing interest: The effects of money on citizen participation in state supreme court elections. American Journal of Political Science, 52(3), 457-470.
Hampshire, N. (2013). New Hampshire heritage, history, & culture Retrieved April 11, 2013, from http://www.visitnh.gov/what-to-do/nh-heritage-history-and-culture/default.aspx
Haygood, R. P. (2012). The past as prolgoue: Defending democracy against voter suppression tactics on the eve of the 2012 elections. Journal of Law & Education, 64(4), 1019-1064.
Heck, R. H. (2004). Studying educational and social policy: Theoretical concepts and research methods. Mahway, NJ: Lawrence Erlbaum Associates.
Heck, R. H. (2007). Examining the relationship between teacher quality as an organizational property of schools and students' achievement and growth rates. Educational Administration Quarterly, 43(4), 399-432.
Herman, E. S., & Chomsky, N. (2002). Manufacturing consent: The political economy of the mass media. New York: Pantheon Books.
Herman, J. L. (2008). Accountability and assessment: Is public interest in K-12 education being served? In K. E. Ryan & L. A. Shepard (Eds.), The future of test-based educational accountability (pp. 211-231). New York: Routledge.
Hess, F. (2005). Inside the gift horse's mouth: Philanthropy and school reform. Phi Delta Kappan, 8(2), 131-137.
Hillygus, D. S. (2005). The missing link: Exploring the relationship between higher education and political engagement. Political Behavior, 27(1), 25-47.

183
Hirschman, A. O. (1970). Exit, voice, and loyalty: Responses to decline in firms, organizations, and states. Cambridge, Mass.: Harvard University Press.
Hope, M. A. (2012). Becoming citizens through school experience: A case study of democracy in practice. [Article]. International Journal of Progressive Education, 8(3), 94-108.
Howell, D. C. (2013). Statistical methods for psychology. Belmont, CA: Wadsworth Cengage Learning.
Huelskamp, R. M. (1993). Perspectives on education in America. Phi Delta Kappan, v74(n9), p718(714).
IES. (2013a). High school & beyond (hs&b). National Center for Education Statistics Retrieved January 7, 2013, from http://nces.ed.gov/surveys/hsb/
IES. (2013b). National education longitudinal study of 1988 (nels:88). National Center for Education Statistics Retrieved January 5, 2013, from http://nces.ed.gov/surveys/nels88/
International IDEA. (2012). International voter turnout, 1991-2000 Retrieved May 3, 2012, from http://archive.fairvote.org/turnout/intturnout.htm
International Institute for Democracy and Electoral Assistance. (2012, March 2009). Compulsory voting Retrieved May 3, 2012, from http://www.idea.int/vt/compulsory_voting.cfm
Jackman, R. W. (1987). Political institutions and voter turnout in the industrial democracies. The American Political Science Review, 81(2), 405-424.
Jackson, J. S., Gurin, P., & Hatchett, S. J. (2013). National Black election study series. National Black Election Study Series Retrieved January 6, 2013, from http://www.icpsr.umich.edu/icpsrweb/ICPSR/series/163
Jackson, R. A. (2003). Differential influences on Latino electoral participation. [Article]. Political Behavior, 25(4), 339-366.
Jacobs, J. E. (2002). Community participation, the environment, and democracy: Brazil in comparative perspective. Latin American Politics and Society, 44(4), 59-88.
Jefferson, T. (2012). Educating the people. Thomas Jefferson on Politics & Government Retrieved May 12, 2012, from http://www.famguardian.org/Subjects/Politics/ThomasJefferson/jeff1350.htm
Johnson, G. (2009). Instructionism and constructivism: Reconciling two very good ideas. International Journal of Special Education, 24(3), 90-98.

184
Johnson, M. (2001). Revisiting the ties that bind: A rational psychological perspective on social connectedness. Paper presented at the Midwest Political Science Association Annual Conference, Chicago, IL. http://faculty.ucr.edu/~martinj/research/Johnson_MPSA02.pdf
Johnson, R. B., & Onwuegbuzie, A. J. (2004). Mixed methods research: A research paradigm whose time has come. Educational Researcher, 33(7), 14-26. doi: 10.2307/3700093
Jorgensen, M. A., & Hoffman, J. (2003). History of the No Child Left Behind Act of 2001 (NCLB) Retrieved June 21, 2011, 2011, from http://www.pearsonassessments.com/NR/rdonlyres/D8E33AAE-BED1-4743-98A1-BDF4D49D7274/0/HistoryofNCLB_Rev2_Final.pdf
Kahne, J., & Westheimer, J. (2003). Teaching democracy: What schools need to do. Phi Delta Kappan, 85(1), 34-66.
Kam, C. D., & Palmer, C. L. (2008). Reconsidering the effects of education on political participation. Journal of Politics, 70(3), 612-631.
Kane, M. T. (1992). An argument-based approach to validity. Psychological Bulletin, 112(3), 527-535.
Kane, M. T. (2001). Current concerns in validity theory. Journal of Educational Measurement, 38(4), 319-342. doi: 10.1111/j.1745-3984.2001.tb01130.x
Kaplan, R. M., & Saccuzzo, D. P. (1989). Psychological testing: Principles, applications, and issues. Pacific Grove, CA: Brooks/Cole Pub. Co.
Kaplan, T. (2012, October 26, 2012). Obama and Gillibrand are poised to win New York, poll finds, New York Times. Retrieved from http://www.nytimes.com/2012/10/27/nyregion/obama-and-gillibrand-favored-in-new-york-siena-poll-says.html?ref=kirstengillibrand&_r=0
Kelderman, E. (2004, January 28, 2004). State republicans assail Bush education law Retrieved July 20, 2011, from http://www.stateline.org/live/printable/story?contentId=15546
Killian, M., Schoen, R., & Aaron, D. (2008). Keeping up with the Joneses: The interplay of personal and collective evaluations in voter turnout. Political Behavior, 30(3), 323-340. doi: 10.2307/40213320
Kinder, D. R., Adams, G. S., & Gronke, P. W. (1989). Economics and politics in the 1984 American presidential election. [Article]. American Journal of Political Science, 33(2), 491.
King, G., & Palmquist, B. (1999). The record of American democracy (road) Retrieved January 3, 2013, from http://road.hmdc.harvard.edu/

185
King Jr., M. L. (1947). The purpose of education, The Maroon Tiger. Retrieved from http://www.drmartinlutherkingjr.com/thepurposeofeducation.htm
King, K. V., & Zucker, S. (2005). Curriculum narrowing. Pearson Education Retrieved January 15, 2013, from http://www.pearsonassessments.com/NR/rdonlyres/D3362EDE-7F34-447E-ADE4-D4CB2518C2B2/0/CurriculumNarrowing.pdf
Klofstad, C. A. (2007). Talk leads to recruitment: How discussions about politics and current events increase civic participation. Political Research Quarterly, 60(2), 180-191.
Kostadinova, T., & Power, T. J. (2007). Does democratization depress participation?: Voter turnout in the Latin American and eastern European transitional democracies. Political Research Quarterly, 60(3), 363-377.
Lassen, D. D. (2005). The effect of information on voter turnout: Evidence from a natural experiment. American Journal of Political Science, 49(1), 103-118.
Leighley, J. E., & Nagler, J. (1992). Individual and systemic influences on turnout: Who votes? 1984. Journal of Politics, 54(3), 718-740.
Leip, D. (2013a). About the atlas Retrieved January 3, 2013, from http://uselectionatlas.org/BOTTOM/about.php
Leip, D. (2013b). Dave Leip's atlas of U.S. Presidential elections Retrieved January 3, 2013, from http://uselectionatlas.org/
Lijphart, A. (1997). Unequal participation: Democracy's unresolved dilemma. The American Political Science Review, 91(1), 1-14.
Lijphart, A., & Aitkin, D. (1994). Electoral systems and party systems: A study of twenty-seven democracies, 1945-1990. Oxford, NY: Oxford University Press.
Lipset, S. M. (1960). Political man: The social bases of politics. Garden City, NY: Doubleday.
Locke, J. (1766). Two treatises of government Retrieved January 23, 2013, from http://find.galegroup.com/ecco/infomark.do?contentSet=ECCOArticles&docType=ECCOArticles&bookId=1310701200&type=getFullCitation&tabID=T001&prodId=ECCO&docLevel=TEXT_GRAPHICS&version=1.0&source=library&userGroupName=norm94900

186
Locke, J. (1769). Some thoughts concerning education. Retrieved January 23, 2013, from http://find.galegroup.com/ecco/infomark.do?contentSet=ECCOArticles&docType=ECCOArticles&bookId=1420200600&type=getFullCitation&tabID=T001&prodId=ECCO&docLevel=TEXT_GRAPHICS&version=1.0&source=library&userGroupName=norm94900
Logan, J. R., Darrah, J., & Oh, S. (2012). The impact of race and ethnicity, immigration and political context on participation in American electoral politics. Volume 90, Number 3, March 2012, 90(3), 993-1022.
Lorenzen, M., & Andersen, K. V. (2009). Centrality and creativity: Does Richard Florida's creative class offer new insights into urban hierarchy? Economic Geography, 85(4), 363-390.
Lorenzen, M., & Vaarst Andersen, K. (2005). The geography of the Danish creative class a mapping and analysis. Frederiksberg, Denmark: Imagine - Creative Industries Research, Copenhagen Business School.
Mann, C. B. (2005). Unintentional voter mobilization: Does participation in preelection surveys increase voter turnout? Annals of the American Academy of Political and Social Science, 601(The Science of Voter Mobilization), 155-168. doi: 10.2307/25046131
Mathis, W. J. (2003). No Child Left Behind: Costs and benefits. Phi Delta Kappan, 84(9), 679-686.
McDonald, J. (2009). Data transformations. Handbook of Biological Statistics Retrieved April 24, 2013, from http://udel.edu/~mcdonald/stattransform.html
McDonald, M. (2008). Portable voter registration. Political Behavior, 30(4), 491-501. doi: 10.2307/40213330
McDonald, M. (2011a, December 28, 2011). 2000 general election turnout rates. United States Election Project Retrieved January 16, 2013, from http://elections.gmu.edu/Turnout_2000G.html
McDonald, M. (2011b, December 29, 2011). 2004 general election turnout rates. United States Election Project Retrieved February 7, 2013, from http://elections.gmu.edu/Turnout_2004G.html
McDonald, M. (2011c, 12/28/11). 2010 general election turnout rates. United States Election Project Retrieved May 3, 2012, from http://elections.gmu.edu/Turnout_2010G.html
McDonald, M. (2012a, March 31, 2012). 2008 general election turnout rates. United States Election Project Retrieved February 7, 2013, from http://elections.gmu.edu/Turnout_2008G.html

187
McDonald, M. (2012b, December 31, 2012). 2012 general election turnout rates. United States Election Project Retrieved January 16, 2013, from http://elections.gmu.edu/Turnout_2012G.html
McDonald, M. (2012c). Voter turnout. United States Election Project Retrieved December 18, 2012, from http://elections.gmu.edu/voter_turnout.htm
McDonald, M., & Popkin, S. L. (2001). The myth of the vanishing voter. The American Political Science Review, 95(4), 963-974. doi: 10.2307/3117725
McGuinn, P. J. (2006). No Child Left Behind and the transformation of federal education policy, 1965-2005. Lawrence, KS: University Press of Kansas.
McLaughlin, M. W. (2011). Evaluation and reform: The Elementary and Secondary Education Act of 1965, Title I Retrieved June 20, 2011, 2011, from http://www.rand.org/content/dam/rand/pubs/reports/2009/R1292.pdf
Merriam-Webster. (2013). Index. Merriam-Webster Retrieved March 16, 2013, from http://www.merriam-webster.com/dictionary/index
Messick, S. (1988). The once and future issues of validity: Assessing the meaning and consequences of measurement. In H. Wainer & H. I. Braun (Eds.), Test validity. Hillsdale, N.J.: L. Erlbaum Associates.
Michelson, M. R. (2003). Getting out the Latino vote: How door-to-door canvassing influences voter turnout in rural central California. Political Behavior, 25(3), 247-263.
Milbrath, L. W., & Goel, M. L. (1965). Political participation: How and why do people get involved in politics? Chicago: Rand McNally.
Miles, M. B., & Huberman, A. M. (1994). Qualitative data analysis: An expanded sourcebook. Thousand Oaks, CA: Sage Publications.
Mill, J. S. (1861). Considerations on representative government. London: Parker, Son, and Bourn.
Miller, S. (2008, May 27, 2008). Project Vote Smart rocks Retrieved March 26, 2013, from http://sunlightfoundation.com/blog/2008/05/27/project-vote-smart-rocks/
Miller, W. (1980). Disinterest, disaffection, and participation in presidential politics. Political Behavior, 2(1), 7-32.
Miller, W. (1992). The puzzle transformed: Explaining declining turnout. Political Behavior, 14(1), 1-43.

188
Milligan, K., Moretti, E., & Oreopoulos, P. (2004). Does education improve citizenship? Evidence from the United States and the United Kingdom. Journal of Public Economics, 88(9–10), 1667-1695. doi: http://dx.doi.org/10.1016/j.jpubeco.2003.10.005
Mintz, S., & McNeil, S. (2012). Progressivism. Digital History Retrieved February 13, 2013, from http://www.digitalhistory.uh.edu/disp_textbook.cfm?smtID=2&psid=3132
Nalder, K. (2007). The effect of state legislative term limits on voter turnout. State Politics & Policy Quarterly, 7(2), 187-210.
National Commission on Excellence in Education. (1983). A nation at risk: The imperative for educational reform. Washington, D.C.: U.S. Department of Education.
NCSL. (2013). Wisconsin: Meet meet Bruce Feustel and Wendy Underhill, Wisconsin’s connections to NCSL. National Conference of State Legislatures Retrieved March 13, 2013, 2013, from http://www.ncsl.org/documents/saprofiles/wisconsin.pdf
NCSS. (2013). National curriculum standards for social studies: Chapter 2—the themes of social studies Retrieved March 16, 2012, from http://www.socialstudies.org/standards/strands
Neiheisel, J. R., & Burden, B. C. (2012). The impact of Election Day registration on voter turnout and election outcomes. American Politics Research, 40(4), 636-664.
New York Times. (1999). Reliable information. Technology Circuits Retrieved March 25, 2013, from http://partners.nytimes.com/library/tech/99/09/circuits/articles/02libe-nonp.html
New York Times. (2012, December 19, 2012). How the NRA rates lawmakers. Politics Retrieved March 26, 2013, from http://www.nytimes.com/interactive/2012/12/19/us/politics/nra.html?ref=politics
NGSS. (2013a). Lead state partners Retrieved January 15, 2013, from http://www.nextgenscience.org/lead-state-partners
NGSS. (2013b). The next generation science standards Retrieved January 15, 2013, from http://www.nextgenscience.org/next-generation-science-standards
NH DOE (1949). Title XV Education Chapter 19: Teachers' loyalty. RSA XV 191:1 (July 28, 1949.). Retrieved March 27, 2013, http://www.gencourt.state.nh.us/rsa/html/XV/191/191-1.htm

189
NH DOE (1993). Title XV Education Chapter 193-c: Statewide education improvement and assessment program section 193-c:1 statement of purpose. RSA XV 193-C:1 (June 22, 1993.). Retrieved March 27, 2013, http://www.gencourt.state.nh.us/rsa/html/XV/193-C/193-C-1.htm
NH DOE (1999). Title XV Education Chapter 193-c: Statewide education improvement and assessment program section 193-c:10 accessibility of assessment materials. RSA XV 193-C:10 (Jan. 1, 1999.). Retrieved March 27, 2013, http://www.gencourt.state.nh.us/rsa/html/XV/193-C/193-C-10.htm
NH DOE (2003a). Title XV Education Chapter 193-c: Statewide education improvement and assessment program section 193-c:3 program established; goals. RSA XV 193-C:3 (July 22, 2003.). Retrieved March 27, 2013, http://www.gencourt.state.nh.us/rsa/html/XV/193-C/193-C-3.htm
NH DOE (2003b). Title XV Education Chapter 193-c: Statewide education improvement and assessment program section 193-c:9 local education improvement and assessment plan; local education improvement fund. RSA XV 193-C:9 (July 22, 2003.). Retrieved March 27, 2013, http://www.gencourt.state.nh.us/rsa/html/XV/193-C/193-C-9.htm
NH DOE (2003c). Title XV Education Chapter 193-h school performance and accountability section 193-h:2 statewide performance targets. RSA XV 193-H:2 (July 22, 2003). Retrieved March 27, 2013, http://www.gencourt.state.nh.us/rsa/html/XV/193-H/193-H-2.htm
NH DOE (2003d). Title XV Education Chapter 193-h school performance and accountability section 193-h:5 powers of the Department of Education. RSA XV 193-H:5 (July 22, 2003). Retrieved March 27, 2013, http://www.gencourt.state.nh.us/rsa/html/XV/193-H/193-H-5.htm
NH DOE (2007a). Title XV Education Chapter 193-e adequate public education section 193-e:1 policy and purpose. RSA XV 193-E:1 (June 29, 2007.). Retrieved March 27, 2013, http://www.gencourt.state.nh.us/rsa/html/XV/193-E/193-E-1.htm
NH DOE (2007b). Title XV Education Chapter 193-e adequate public education section 193-e:2-a substantive educational content of an adequate education. RSA XV 193-E:2 (June 29, 2007.). Retrieved March 27, 2013, http://www.gencourt.state.nh.us/rsa/html/XV/193-E/193-E-2-a.htm
NH DOE (2007c). Title XV Education Chapter 193-e adequate public education section 193-e:2-c resource elements. RSA XV 193-E:2-c (June 29, 2007). Retrieved March 27, 2013, http://www.gencourt.state.nh.us/rsa/html/XV/193-E/193-E-2-c.htm
NH DOE (2007d). Title XV Education Chapter 193-e adequate public education section 193-e:2 criteria for an adequate education. RSA XV 193-E:2 (June 29, 2007.). Retrieved March 27, 2013, http://www.gencourt.state.nh.us/rsa/html/XV/193-E/193-E-2.htm

190
NH DOE. (2009a). NH accountability system: Overview Retrieved April 5, 2013, from http://www.education.nh.gov/instruction/school_improve/documents/overview.pdf
NH DOE (2009b). Title XV Education Chapter 193-e adequate public education section 193-e:3-e corrective and technical assistance. RSA XV 193-E:3-e (July 14, 2009.). Retrieved March 27, 2013, http://www.gencourt.state.nh.us/rsa/html/XV/193-E/193-E-3-e.htm
NH DOE (2011). Title XV Education Chapter 193-e adequate public education section 193-e:3-b accountability for the opportunity for an adequate education. RSA XV 193-E:3-b (Sept. 11, 2011). Retrieved March 27, 2013, http://www.gencourt.state.nh.us/rsa/html/XV/193-E/193-E-3-b.htm
NH DOE. (2012a). 2012 adequacy report Retrieved April 5, 2013, from http://www.education.nh.gov/instruction/school_improve/documents/adequacy-report.pdf
NH DOE (2012b). Title XV Education Chapter 193-e adequate public education section 193-e:2-b cost of an adequate education. RSA XV 193-E:2-b (Aug. 17, 2012). Retrieved March 27, 2013, http://www.gencourt.state.nh.us/rsa/html/XV/193-E/193-E-2-b.htm
NH DOE. (2013). NH input based school accountability system Retrieved April 5, 2013, from http://www.education.nh.gov/instruction/school_improve/account_sys_input.htm
Nie, N. H., Junn, J., & Stehlik-Barry, K. (1996). Education and democratic citizenship in America. Chicago: University of Chicago Press.
No Child Left Behind Act of 2001, 1425, Pub. L. No. 107-110 U.S.C. § 115, Stat. 1425 (2002).
Noddings, N. (2010). Differentiate, don't standardize Retrieved May 20, 2012, from http://www.edweek.org/ew/articles/2010/01/14/17noddings-comm.h29.html
Nownes, A. J. (1992). Primaries, general elections, and voter turnout: A multinomial logit model of the decision to vote. American Politics Quarterly, 20(2), 205-226.
NRC. (2013). Welcome to the National Research Council Retrieved March 15, 2013, 2013, from http://www.nas.edu/nrc/
NSTA. (2013). NSTA position statement: Accountability. About NSTA: Official Positions Retrieved March 17, 2013, from http://www.nsta.org/about/positions/accountability.aspx
Onwuegbuzie, A. J., & Johnson, R. B. (2006). The validity issue in mixed research. Research in the Schools, 13(1), 48-63.
191
Onwuegbuzie, A. J., & Leech, N. L. (2007). Validity and qualitative research: An oxymoron? Quality & Quantity, 41(2), 233-249. doi: 10.1007/s11135-006-9000-3
Pacheco, J. S. (2008). Political socialization in context: The effect of political competition on youth voter turnout. Political Behavior, 30(4), 415-436.
Pacheco, J. S., & Plutzer, E. (2007). Stay in school, don’t become a parent. American Politics Research, 35(1), 32-56. doi: 10.1177/1532673x06292817
Papert, S. (1993). The children's machine: Rethinking school in the age of the computer. New York: BasicBooks.
PARCC. (2010). Race to the Top assessment program application for new grants: Comprehensive assessment systems cfda number: 84.395b. Florida.
PARCC. (2011). Partnership for assessment of readiness for college and careers Retrieved April 20, 2011, from http://www.fldoe.org/parcc/pdf/apprtcasc.pdf
PARCC. (2013). About PARCC Retrieved March 15, 2013, from http://www.parcconline.org/about-parcc
Parry, G., & Moyser, G. (2001). More participation, more democracy? In R. Blaug & J. Schwarzmantel (Eds.), Democracy: A reader. New York: Columbia University Press.
Parry, J., Barth, J., Kropf, M., & Jones, E. T. (2008). Mobilizing the seldom voter: Campaign contact and effects in high-profile elections. Political Behavior, 30(1), 97-113. doi: 10.2307/40213306
Partnership for 21st Century Skills. (2008). 21st century skills, education & competitiveness: A resource and policy guide. Tucson, AZ: Partnership for 21st Century Skills.
Partnership for 21st Century Skills. (2012a). About us: Our history Retrieved May 15, 2012, from http://www.p21.org/about-us/our-history
Partnership for 21st Century Skills. (2012b). Overview: Framework for 21st century learning Retrieved May 2, 2012, from http://www.p21.org/overview/skills-framework
Patterson, S. C., & Caldeira, G. A. (1983). Getting out the vote: Participation in gubernatorial elections. The American Political Science Review, 77(3), 675-689.
Pearson Education. (2012). National voter turnout in federal elections: 1960–2010 Retrieved July 21, 2012, from http://www.infoplease.com/ipa/A0781453.html
Peck, J. (2005). Struggling with the creative class. International Journal of Urban and Regional Research, 29(4), 740-770. doi: http://www.blackwellpublishing.com/journal.asp?ref=0309-1317

192
Pedulla, J. J., Abrams, L. M., Madaus, G. F., Russell, M. K., Ramos, M. A., & Miao, J. (2003). Perceived effects of state-mandated testing programs on teaching and learning: Findings from a national survey of teachers. National Board on Educational Testing and Public Policy. Chestnut Hill, MA: Boston College.
Persson, M. (2012). Is the effect of education on voter turnout absolute or relative? A multi-level analysis of 37 countries. Journal of Elections, Public Opinion & Parties, 1-23. doi: 10.1080/17457289.2012.747530
Pew Forum on Religion & Public Life. (2008). U.S.Religious landscape survey religious affiliation: Diverse and dynamic. Washington, DC: Pew Research Center.
Pew Research Center. (2013). How religious is your state? Retrieved April 7, 2013, from http://www.pewforum.org/how-religious-is-your-state-.aspx
Piaget, J., & Gabain, M. (1932). The moral judgment of the child. London: K. Paul, Trench, Trubner & Co. ltd.
Pickard, A. J. (2007). Research methods in information. London: Facet.
Pillsbury, G., & Johnannesen, J. (2010). America goes to the polls 2010: A report on voter turnout in the 2010 election. In Nonprofit Vote (Ed.). St. Paul, Minnesota: Minnesota council of Nonprofits.
Plane, D. L., & Gershtenson, J. (2004). Candidates' ideological locations, abstention, and turnout in U.S. Midterm senate elections. Political Behavior, 26(1), 69-93. doi: 10.2307/4151359
Platt, M. B. (2008). Participation for what? A policy-motivated approach to political activism. Political Behavior, 30(3), 391-413. doi: 10.2307/40213323
Plustzer, E. (2002). Becoming a habitual voter: Inertia, resources, and growth in young adulthood. American Political Science Review, 96(01), 41-56. doi: 10.1017/S0003055402004227
Powell, G. B. (1986). American-voter turnout in comparative perspective. American Political Science Review, 80(1), 17-43.
Project Vote Smart. (2013). Media reviews Retrieved March 25, 2013, from http://votesmart.org/media/quotes#.UVDjihyeZ8E
Ravitch, D. (2010). The death and life of the great American school system: How testing and choice are undermining education. New York: Basic Books.
Reuters. (2011). Youth to lead drop in U.S. Voter turnout in 2012: Study Retrieved August 7, 2012, from http://www.reuters.com/article/2011/12/28/us-usa-campaign-turnout-idUSTRE7BR0UL20111228

193
Robelen, E. (2011, December 8, 2011). Most teachers see the curriculum narrowing, survey finds Retrieved August 15, 2012, from http://blogs.edweek.org/edweek/curriculum/2011/12/most_teachers_see_the_curricul.html
Roosevelt, F. D. (1938). 124 - message for American education week september 27, 1938. The American Presidency Project Retrieved April 28, 2013, from http://www.presidency.ucsb.edu/ws/?pid=15545
Roper Center. (2013). Roper social and political trends. Roper Center Public Opinion Archives Retrieved January 6, 2013, from http://www.ropercenter.uconn.edu/data_access/data/datasets/roper_trends.html
Rosen, G. (1958). A history of public health. New York: MD Publications.
Rosenstone, S. J., & Hansen, J. M. (1993). Mobilization, participation, and democracy in America. New York: Maxwell Macmillan International.
Rosenstone, S. J., & Wolfinger, R. E. (1978). The effect of registration laws on voter turnout. The American Political Science Review, 72(1), 22-45.
Ross, A. (2012). Education for active citizenship: Practices, policies, promises. [Article]. International Journal of Progressive Education, 8(3), 7-14.
Rousseau, J.-J. (1773). Emile: Translated from the French of J.J. Rousseau Retrieved January 23, 2013, from http://0-find.galegroup.com.biblio.eui.eu/ecco/infomark.do?contentSet=ECCOArticles&docType=ECCOArticles&bookId=1323000101&type=getFullCitation&tabID=T001&prodId=ECCO&docLevel=TEXT_GRAPHICS&version=1.0&source=library&userGroupName=europeo
Saad, L. (2012, August 3, 2012). Heavily democratic states are concentrated in the east. Gallup Politics, Retrieved April 10, 2013, from http://www.gallup.com/poll/156437/heavily-democratic-states-concentrated-east.aspx#2
Said, E. W. (1978). Orientalism. New York: Pantheon Books.
Sandell, J., & Plutzer, E. (2005). Families, divorce and voter turnout in the U.S. Political Behavior, 27(2), 133-162.
Saussure, F. d., Bally, C., Sechehaye, A., & Riedlinger, A. (1949). Cours de linguistique générale. Paris: Payot.
Sawyer, R. K. (2006). The Cambridge handbook of the learning sciences. Cambridge; New York: Cambridge University Press.

194
SBAC. (2010). Race to the Top assessment program application for new grants: Comprehensive assessment systems cfda number: 84.395b. Washington State.
SBAC. (2012). About. Smarter Balanced Assessment Consortium Retrieved January 17, 2013, from http://www.smarterbalanced.org/about/
Schur, L., Shields, T., Kruse, D., & Schriner, K. (2002). Enabling democracy: Disability and voter turnout. Political Research Quarterly, 55(1), 167-190. doi: 10.2307/3088070
Scott, A. (2006). Creative cities: Conceptual issues and policy questions. Journal of Urban Affairs, 28(1), 1-17. doi: 10.1111/j.0735-2166.2006.00256.x
Scott, W. J., & Acock, A. C. (1979). Socioeconomic status, unemployment experience, and political participation: A disentangling of main and interaction effects. Political Behavior, 1(4), 361-381.
Shea, T. E. (1977). An educational perspective of the legality of intelligence testing and ability grouping. Journal of Law & Education, 6(2), 137-158.
Sheskin, D. J. (2004). Handbook of parametric and nonparametric statistical procedures. Boca Raton, FL: Chapman & Hall/CRC.
Smutny, J. F. (2003). Differentiated instruction. Bloomington, Ind.: Phi Delta Kappa Educational Foundation.
Solecki, W. D., Mason, R. J., & Martin, S. (2004). The geography of support for open-space initiatives: A case study of New Jersey's 1998 ballot measure. [Article]. Social Science Quarterly (Blackwell Publishing Limited), 85(3), 624-639. doi: 10.1111/j.0038-4941.2004.00236.x
Sondheimer, R. M., & Green, D. P. (2010). Using experiments to estimate the effects of education on voter turnout. American Journal of Political Science, 54(1), 174-189.
Squire, P., Wolfinger, R. E., & Glass, D. P. (1987). Residential mobility and voter turnout. The American Political Science Review, 81(1), 45-66.
Stein, R. M., Leighley, J., & Owens, C. (2005). Who votes, who doesn’t, why and, what can be done?: A report to the federal commission on electoral reform. In Federal Commission on Electoral Reform (Ed.): Federal Commission on Electoral Reform.
Stross, R. E. (2000). We, the stunted. U.S. News & World Report Retrieved March 25, 2013, from http://www.usnews.com/usnews/biztech/articles/001030/archive_010453_2.htm

195
Stuart, L., Dahm, E., & United States. Dept. of, C. (1999). 21st century skills for 21st century jobs: A report of the U.S. Department of commerce, U.S. Department of Education, U.S. Department of Labor, National Institute for Literacy, and Small Business Administration. Washington, D.C.: For sale by U.S. Govt. Print. Office, Supt. of Docs.
Sunlight Foundation. (2013, May 27, 2008). Our mission Retrieved March 26, 2013, from http://sunlightfoundation.com/about/
Tenn, S. (2005). An alternative measure of relative education to explain voter turnout. The Journal of Politics, 67(1), 271-282. doi: 10.1111/j.1468-2508.2005.00317.x
Tenn, S. (2007). The effect of education on voter turnout. Political Analysis, 15(4), 446-464. doi: 10.2307/25791906
The Center for Voting and Democracy. (2013). Voter turnout. Fair Vote Retrieved March 22, 2013, from http://www.fairvote.org/voter-turnout#.UU0KqxyeZ8E
The Department of Arkansas Heritage. (2013a). Culture of Arkansas. Discover Arkansas History Retrieved April 11, 2013, from http://www.arkansasheritage.com/discover/culture.aspx
The Department of Arkansas Heritage. (2013b). Military. Discover Arkansas History Retrieved April 11, 2013, from http://www.arkansasheritage.com/discover/the_people/military.aspx
The Free Dictionary. (2013). Index. The Free Dictionary Retrieved March 16, 2012, from http://www.thefreedictionary.com/index
Thinkfinity: Verizon Foundation. (2012). 21st century skills Retrieved May 15, 2012, from http://www.thinkfinity.org/21st-century-skills
Timpone, R. J. (1998). Ties that bind: Measurement, demographics, and social connectedness. Political Behavior, 20(1), 53-77.
Tolbert, C. J., & McNeal, R. S. (2003). Unraveling the effects of the internet on political participation? Political Research Quarterly, 56(2), 175-185.
Tolbert, C. J., & Smith, D. A. (2005). The educative effects of ballot initiatives on voter turnout. American Politics Research, 33(2), 283-309.
Trilling, B., & Fadel, C. (2009). 21st century skills: Learning for life in our times. San Francisco: Jossey-Bass.
Trilling, B., & Fadel, C. (2012). 21st century skills: Learning for life in our times, from http://www.21stcenturyskillsbook.com/

196
Trochim, W. M. (2001). Research methods knowledge base. Cincinnati, OH: Atomic Dog Publishers.
U.S. Census Bureau. (1991). The decline in American voter turnout. Statistical Brief Retrieved August 7, 2012, from http://www.census.gov/population/socdemo/voting/SB91-23.pdf
U.S. Census Bureau. (2010a). Percent urban and rural in 2010 by state Retrieved April 13, 2013, from http://www.census.gov/geo/reference/ua/urban-rural-2010.html
U.S. Census Bureau. (2010b). Table 14. State population—rank, percent change, and population density: 1980 to 2010 Retrieved April 10, 2013, from http://www.census.gov/compendia/statab/2012/tables/12s0014.pdf
U.S. Census Bureau. (2011a). American fact finder: Selected economic characteristics 2007-2011 American community survey 5-year estimates: Arkansas Retrieved April 9, 2013, from http://factfinder2.census.gov/faces/tableservices/jsf/pages/productview.xhtml?pid=ACS_11_5YR_DP03
U.S. Census Bureau. (2011b). American fact finder: Selected economic characteristics 2007-2011 American community survey 5-year estimates: New Hampshire Retrieved April 9, 2013, from http://factfinder2.census.gov/faces/tableservices/jsf/pages/productview.xhtml?pid=ACS_11_5YR_DP03
U.S. Census Bureau. (2011c). American fact finder: Selected economic characteristics 2007-2011 American community survey 5-year estimates: United States Retrieved April 9, 2013, from http://factfinder2.census.gov/faces/tableservices/jsf/pages/productview.xhtml?pid=ACS_11_5YR_DP03
U.S. Census Bureau. (2011d). American fact finder: Selected housing characteristics 2007-2011 American community survey 5-year estimates: Arkansas Retrieved April 9, 2013, from http://factfinder2.census.gov/faces/tableservices/jsf/pages/productview.xhtml?pid=ACS_11_5YR_DP04
U.S. Census Bureau. (2011e). American fact finder: Selected housing characteristics 2007-2011 American community survey 5-year estimates: New Hampshire Retrieved April 9, 2013, from http://factfinder2.census.gov/faces/tableservices/jsf/pages/productview.xhtml?pid=ACS_11_5YR_DP04

197
U.S. Census Bureau. (2011f). American fact finder: Selected housing characteristics 2007-2011 American community survey 5-year estimates: United States Retrieved April 9, 2013, from http://factfinder2.census.gov/faces/tableservices/jsf/pages/productview.xhtml?pid=ACS_11_1YR_CP04&prodType=table
U.S. Census Bureau. (2011g). Table 412. Composition of congress by political party affiliation—states: 2005 to 2011 Retrieved April 10, 2013, from http://www.census.gov/compendia/statab/2012/tables/12s0412.pdf
U.S. Census Bureau. (2012a). 397 - participation in elections for president and U.S. Representatives. Elections: Voting-Age Population and Voter Participation Retrieved January 9, 2013, from http://www.census.gov/compendia/statab/cats/elections/voting-age_population_and_voter_participation.html
U.S. Census Bureau. (2012b). Elections: Voting-age population and voter participation Retrieved May 23, 2012, from http://www.census.gov/compendia/statab/cats/elections/voting-age_population_and_voter_participation.html
U.S. Census Bureau. (2012c). Voting hot report. Voting and Registration Retrieved August 9, 2012, from http://smpbff1.dsd.census.gov/TheDataWeb_HotReport/servlet/HotReportEngineServlet?reportid=767b1387bea22b8d3e8486924a69adcd&emailname=essb@boc&filename=0328_nata.hrml
U.S. Census Bureau. (2013a). American fact finder: Selected social characteristics in the United States 2011 American community survey 1-year estimates - Arkansas Retrieved April 7, 2013, from http://factfinder2.census.gov/faces/tableservices/jsf/pages/productview.xhtml?pid=ACS_11_1YR_DP02&prodType=table
U.S. Census Bureau. (2013b). American fact finder: Selected social characteristics in the United States 2011 American community survey 1-year estimates - New Hampshire Retrieved April 7, 2013, from http://factfinder2.census.gov/faces/tableservices/jsf/pages/productview.xhtml?pid=ACS_11_1YR_DP02&prodType=table
U.S. Census Bureau. (2013c). American fact finder: Selected social characteristics in the United States 2011 American community survey 1-year estimates - us Retrieved April 7, 2013, from http://factfinder2.census.gov/faces/tableservices/jsf/pages/productview.xhtml?pid=ACS_11_1YR_DP02&prodType=table
U.S. Census Bureau. (2013d). State & county quickfacts Retrieved April 7, 2013, from http://quickfacts.census.gov/qfd/index.html

198
U.S. Census Bureau. (2013e). State & county quickfacts: Arkansas Retrieved April 7, 2013, from http://quickfacts.census.gov/qfd/states/05000.html
U.S. Census Bureau. (2013f). State & county quickfacts: New Hampshire Retrieved April 7, 2013, from http://quickfacts.census.gov/qfd/states/33000.html
U.S. Declaration of independence, Paragraph 2 (1776).
U.S. Department of Commerce. (2013). Voting and registration. United States Census Bureau Retrieved January 3, 2013, from http://www.census.gov/hhes/www/socdemo/voting/
U.S. Diplomatic Mission to Germany. (2008, August, 2008). Travel & geography: The regions of the United States. About the U.S. Retrieved April 11, 2013, from http://usa.usembassy.de/travel-regions.htm
U.S. DOE. (2001). Excecutive summary. No Child Left Behind; Elementary and Secondary Education Act (ESEA), from http://www2.ed.gov/nclb/overview/intro/execsumm.html
U.S. DOE. (2009). Race to the Top program: Executive summary. Race to the Top Fund Retrieved July 14, 2011, 2011, from http://www2.ed.gov/programs/racetothetop/executive-summary.pdf
U.S. DOE. (2010a). A Blueprint for Reform: The reauthorization of the Elementary and Secondary Education Act. Washington D.C.: U.S. Department of Education Retrieved from http://www2.ed.gov/policy/elsec/leg/blueprint/blueprint.pdf.
U.S. DOE. (2010b). College- and career-ready standards and assessments Retrieved May 18, 2012, from http://www2.ed.gov/policy/elsec/leg/blueprint/faq/college-career.pdf
U.S. DOE Office of Vocational and Adult Education. (2012). Investing in America’s future: A blueprint for transforming career and technical education Retrieved May 17, 2012, from http://www2.ed.gov/about/offices/list/ovae/pi/cte/transforming-career-technical-education.pdf
Underhill, W. (2012, December 31, 2012).
University of Pennsylvania. (2013). National annenburg election survey (NAES). The Annenberg Public Policy Center Retrieved January 3, 2013, from http://www.annenbergpublicpolicycenter.org/ProjectDetails.aspx?myId=1
Verba, S., & Nie, N. H. (1972). Participation in America: Political democracy and social equality. New York: Harper & Row.
Verba, S., Nie, N. H., & Kim, J.-O. (1978). Participation and political equality: A seven-nation comparison. Cambridge, Eng.; New York: Cambridge University Press.

199
Verba, S., Schlozman, K. L., & Brady, H. E. (1995). Voice and equality: Civic voluntarism in American politics. Cambridge, Mass.: Harvard University Press.
Vogler, K. (2003). Where does social studies fit in a high-stakes testing environment? The Social Studies, 94(5), 207-211.
von Zastrow, C., & Janc, H. (2004). Academic atrophy: The condition of the liberal arts in America’s public schools. Washington, DC: Council for Basic Education.
Vonnahme, G. (2012). Registration deadlines and turnout in context. Political Behavior, 34(4), 765-779.
Vygotskii, L. S., & Cole, M. (1978). Mind in society: The development of higher psychological processes. Cambridge: Harvard University Press.
Wang, C.-H. (2012). The effects of party fractionalization and party polarization on democracy. [Article]. Party Politics. doi: 10.1177/1354068812448691
West, C., & Zimmerman, D. H. (1987). Doing gender. Gender and Society, 1(2), 125-151.
WestEd. (2011). Smarter Balanced Assessment Consortium Retrieved April 20, 2011, from http://www.wested.org/cs/we/view/pj/582
WestEd. (2012a). Funding sources Retrieved May 18, 2012, from http://www.wested.org/cs/we/print/docs/we/fund.htm
WestEd. (2012b). Inclusive education starter kit: Chapter 3 instructional and curricular practices Retrieved May 18, 2012, from http://www.wested.org/cpei/11Manual2Chapter3.pdf
WestEd. (2012c). Resources for states and districts Retrieved May 18, 2012, from http://www.wested.org/cs/we/print/docs/we/arra4.htm
WestEd. (2013). Assessment and standards development services Retrieved March 15, 2013, from http://www.wested.org/cs/we/view/pg/2
Willhoft, J. (2010). An overview of the Smarter Balanced Assessment Consortium. Smarter Balanced Retrieved April 18, 2011, from http://www.wera-web.org/pages/activities/WERA_Winter10/2.2%20SBAC_Overview.pdf
Wilson, J. M. (2012). How are we doing? Group-based economic assessments and African American political behavior. Electoral Studies, 31(3), 550-561. doi: 10.1016/j.electstud.2012.04.003
Wolfinger, N. H., & Wolfinger, R. E. (2008). Family structure and voter turnout. Volume 86, Number 4, June 2008, 86(4), 1513-1528.

200
Wolfinger, R. E., & Rosenstone, S. J. (1980). Who votes? New Haven: Yale University Press.
Wood, K. D. (2002). Differentiating reading and writing lessons to promote content learning. In C. C. Block, L. B. Gambrell & M. Pressley (Eds.), Improving comprehension instruction: Rethinking research, theory, and classroom practice. San Francisco: Jossey-Bass.
Xu, J. (2005). Why do minorities participate less? The effects of immigration, education, and electoral process on Asian American voter registration and turnout. Social Science Research, 34(4), 682-702.
Yin, R. K. (2009). Case study research: Design and methods. Thousand Oaks: Sage Publications.


