L E T T E RAn interaction switch predicts the nested architecture of
mutualistic networks
Feng Zhang,1* Cang Hui1 and
John S. Terblanche2
1Centre for Invasion Biology,
Department of Botany and Zoology,
Stellenbosch University, Private
Bag X1, Matieland 7602, South
Africa2Department of Conservation
Ecology and Entomology,
Stellenbosch University, Private Bag
X1, Matieland 7602, South Africa
*Correspondence: E-mail:
AbstractNested architecture is distinctive in plant–animal mutualistic networks. However, to date an integrative and
quantitative explanation has been lacking. It is evident that species often switch their interactive partners in real-
world mutualistic networks such as pollination and seed-dispersal networks. By incorporating an interaction
switch into a novel multi-population model, we show that the nested architecture rapidly emerges from an
initially random network. The model allowing interaction switches between partner species produced
predictions which fit remarkably well with observations from 81 empirical networks. Thus, the nested
architecture in mutualistic networks could be an intrinsic physical structure of dynamic networks and the
interaction switch is likely a key ecological process that results in nestedness of real-world networks. Identifying
the biological processes responsible for network structures is thus crucial for understanding the architecture of
ecological networks.
KeywordsAbundance, adaptive behaviour, antagonistic network, dynamic network, functional response, morphological
trait, nestedness, network size, pollination, seed disperser.
Ecology Letters (2011) 14: 797–803
INTRODUCTION
Mutualistic interactions are crucial processes to sustain ecosystem
function and services, foster biodiversity and affect community
stability (Bascompte & Jordano 2007; Okuyama & Holland 2008;
Bastolla et al. 2009; Thebault & Fontaine 2010). Specifically, bipartite
networks have been applied to depict mutualistic interactions such as
in pollination and seed-dispersal communities (Bascompte & Jordano
2007). A distinctive feature of mutualistic networks is their nested
architecture (but see Bascompte et al. 2003; Guimaraes et al. 2006,
2007a; Chamberlain et al. 2010); that is, specialists only interact with a
proper subset of the species interacting with the more generalist
species (Bascompte et al. 2003; Ollerton et al. 2003; Nielsen &
Bascompte 2007). Although a neutral model only considering fixed
species abundance has been proposed for explaining such nested
network architecture (Krishna et al. 2008), the model considerably
overestimated the observed nestedness. As multiple biological
mechanisms could be responsible for the nested architecture (Vazquez
et al. 2009), an integrative and quantitative understanding of this
distinctive feature of mutualistic networks is still lacking.
Mounting evidence has suggested that species often switch their
interaction partners not only in antagonistic interactions (i.e. food
webs; Murdoch 1969; Staniczenko et al. 2010) but also in mutualistic
networks (Basilio et al. 2006; Fortuna & Bascompte 2006; Olesen et al.
2008; Petanidou et al. 2008). For instance, in a pollination network,
pollinators continually switch the plant species with which they
interact in response to environmental disturbances and the availability
of resources (Whittall & Hodges 2007), whereas plants can also adjust
phenology (e.g. flowering time) and morphology (e.g. flower
heterostyly) to affect their pollinators (Aizen & Vazquez 2006; Barrett
2010; Kaiser-Bunbury et al. 2010). This implies a dynamic nature to
ecological networks; i.e. both species abundance and species
interaction could affect each other and change over time. Such
interaction switches between species could not only have ecological
and environmental reasons (e.g. resource availability) but also reflect
an adaptive behaviour of species for enhancing the efficiency of
resource utilisation. Compared with fixed interactions between
species, an interaction switch (alternatively, the �rewiring� of interac-
tions between species) can lead to greater stability in food webs
(Staniczenko et al. 2010) and pollination networks (Kaiser-Bunbury
et al. 2010). As such, a dynamic network with switching interactions
can be considered as a specific form of an adaptive network. Foraging
adaptation (shifts in prey selection) in adaptive networks can
predict the emergence of food-web complexity (Kondoh 2003;
Beckerman et al. 2006; Garcia-Domingo & Saldana 2007; Petchey et al.
2008). Because the consumer-resource interactions of mutualisms
resemble a predator–prey interaction (Holland & DeAngelis 2010), it
is expected that such adaptive behaviour of an interaction switch
could play a crucial role in determining the architecture of mutualistic
networks.
Using a mathematical model for depicting population dynamics in
mutualistic networks, we first introduce this interaction switch into
the model and then investigate whether the distinctive nested
architecture of mutualistic networks can be robustly predicted.
Importantly, we are able to demonstrate that a mutualistic network
converges from an initial random network to a nested network with an
intrinsic stable level of nestedness. This model was well supported by
several tests of the model�s predictions with multiple observations
from empirical pollination and seed-dispersal networks (see supple-
mentary Section S1). We believe this model to be a significant
conceptual contribution as it facilitates further research on the role of
species abundance and ⁄ or morphology in forming the nested
architecture of mutualistic networks and provides an explanation for
how real-world networks self organize and develop.
Ecology Letters, (2011) 14: 797–803 doi: 10.1111/j.1461-0248.2011.01647.x
� 2011 Blackwell Publishing Ltd/CNRS

MODEL AND METHODS
Assume that a plant–animal mutualistic network consists of m plant
species and n animal species. The population dynamics of plant i and
animal j can thus be depicted by its own density-dependent process
plus the functional response to its mutualistic interactions:
1
NðPÞi
dNðPÞi
dt¼ r
ðPÞi � c
ðPÞi N
ðPÞi þ
Pj bðPÞij aij vij N
ðAÞj
1þP
k haikvikNðAÞk
1
NðAÞj
dNðAÞj
dt¼ r
ðAÞj � c
ðAÞj N
ðAÞj þ
Pi bðAÞji aij vij N
ðPÞi
1þP
k hakj vkj NðPÞk
;
ð1Þ
where the superscripts (P) and (A) denote plants and animals
respectively, Ni the population size of species i, parameters ri and cithe intrinsic growth rate and density-dependent coefficient. The last
term describes the Holling�s (type II; 1959) functional response to the
mutualistic interaction (see supplementary Section S2), where the
interaction matrix {aij} denotes whether plant i and animal j interact
(aij = 1) or not (aij = 0); the preference matrix {vij} describe
the probability of an interaction once animal j encounters plant i; the
benefits matrix {bij} describes the benefit of species j to i; h is the
handling time (following Holland et al. (2006), we choose the same
value for both plants and animals; h = 0.1 as in Bastolla et al. (2009)).
We ignored competition between plants or between animals following
several previous studies (Bascompte et al. 2006; Holland et al. 2006;
Okuyama & Holland 2008; Thebault & Fontaine 2010).
The numerical solutions for the above model were obtained via the
Euler method with a time step of 0.01 starting from initial population
sizes randomly assigned between 0 and 1 (Ascher & Petzold 1998).
In the calculation, values of intrinsic growth rates (ri), density-dependent
coefficient (ci) and the benefits matrix {bij} were randomly assigned
numbers between 0 and 1, and the number of interactions and
network size (m · n) were assigned according to data from the real
mutualistic network (see supplementary Section S1). The interaction
matrix {aij} was initialised by a random binary (0 ⁄ 1) matrix but with a
fixed number of interactions (i.e. I ¼P
i
Pj aij remains constant in
the calculation) and elements in the preference matrix {vij} were
randomly assigned numbers between 0 and 1. In each time step, one
randomly chosen species stops the interaction of the minimum gain in
per capita population growth rate [i.e. the interaction with the least
bijaijvijNj in the denominator of the last term in eqn (1)]. To keep the
number of interactions constant, a randomly chosen interaction with
aij = 0 is reassigned to 1 and then the preference value of this new
interaction (vij) is updated by a random number between 0 and 1. This
rule of an interaction switch, although simple, ensures a basic process
of behavioural adaptation: individuals of each species try to effectively
take their limited time to interact only with species that can provide a
greater benefit rather than potentially wasting time on many low-
benefit interactions (as a consequence of the functional response; see
supplementary Section S2; Holling 1959). Therefore, each species in
the network can enhance its benefit through readjusting mutualistic
interactions.
As switching interactive partners (i.e. the �rule� of the interaction
switch) depends on the partner�s abundance and the benefits provided
(bijaijvijNj), we further evaluated how species abundance and benefits
contribute to the nested architecture by examining two special cases of
this model: benefit-neutral and demography-neutral interactions. The
former refers to no variation in both the benefits (bij) and the
preference (vij) of interactions (fixed at 0.5 for all species so that
the interaction switch is entirely determined by the functional
response to species abundance) while the latter indicates no variation
in demographic parameters (i.e. the intrinsic growth rate (ri) and
density-dependent coefficient (ci) are the same for all species and set at
1 in simulations). Evidently, the interaction switch is only driven
by demographic variations in the former, while it is mainly caused by
the variation of benefits in the latter.
We compiled 48 pollination networks and 33 seed-dispersal
networks from published sources (see supplementary Section S1).
Using the numbers of plant species and animal species of these real
networks and their interaction numbers as model inputs (other
parameters are randomly assigned as above), we simulated the model
system and tracked interaction matrices over time [at least
500 · (m + n) steps]. To assess model predictions, we compared
the nestedness predicted by the model with observations of the 81
real networks. The nestedness of interaction matrices was measured
based on overlap and decreasing fill (NODF; Almeida-Neto et al.
2008) using the software package ANINHADO 3.0 (Guimaraes &
Guimaraes 2006). The NODF measure of nestedness has a stronger
discriminative power of random matrices than other measures and
was thus favoured (Ulrich et al. 2009). Moreover, we considered
relative nestedness, defined as NODFR = (NODF ) NODF*) ⁄NODF* (Bascompte et al. 2003), where NODF* is the average
NODF of 1000 interaction matrices generated randomly by null
model Er or Ce provided by ANINHADO 3.0. Reduced major axis
regression was used to assess the model performance on predicting
the nestedness of real networks (RMA v. 1.17; Bohonak 2004).
RESULTS
In our theoretical model, the random networks rapidly converged to a
nested architecture via the interaction switch, with the nestedness of
the mutualistic network stabilised at a certain level (Fig. 1). Similar
results were observed when using NODFR (Fig. 1f; see supplementary
Section S3). Critically, the predicted nestedness concurred precisely
with values from real, observed networks (e.g. Fig. 1a–f) regardless of
the initial network structures (see supplementary Section S4), whereas
models with benefit-neutral interactions (Fig. 1g) and with demogra-
phy-neutral interactions (Fig. 1h) over- and under-estimated nested-
ness, respectively.
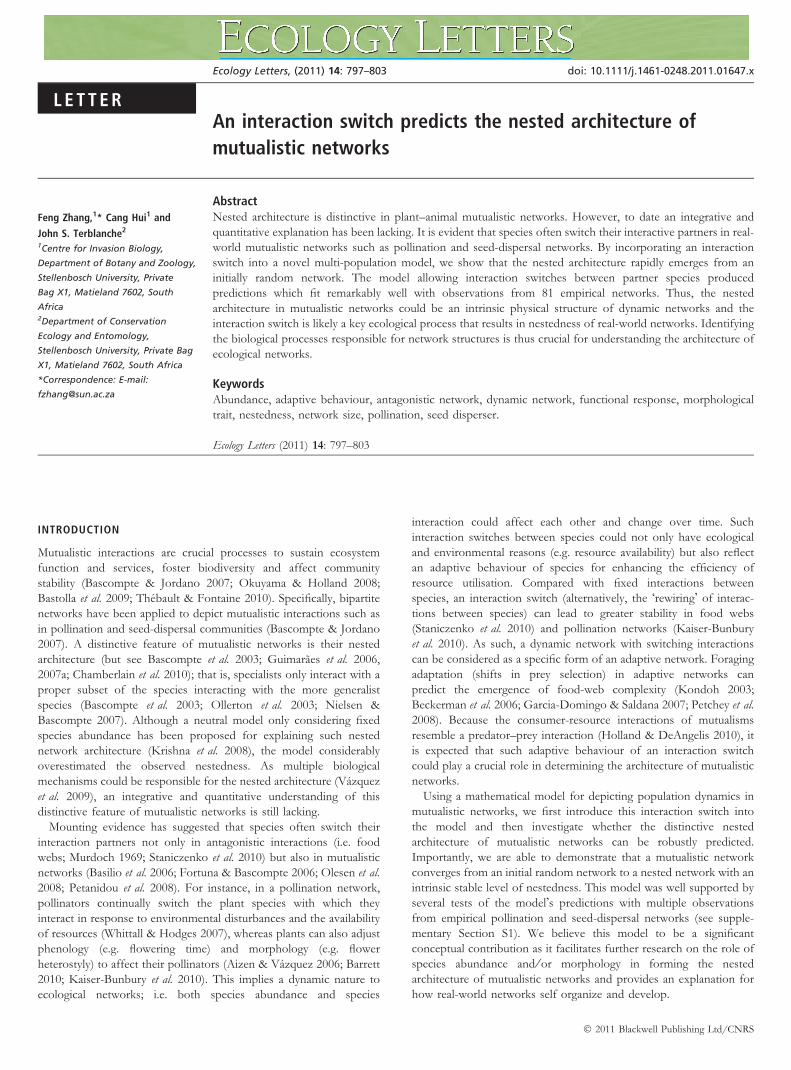
Overall, the predictions of NODF agreed well with observations
(reduced major axis regression: slope = 0.726 with nearly 80% variance
explained (R2 = 0.768); Fig. 2a). The same is true when using NODFR
(slope = 1.07, R2 = 0.46 for the null model Er; slope = 1.06,
R2 = 0.40 for the null model Ce; Fig. 2b), where the NODFR was
converted into 1 ⁄ (NODFR + 1) due to the negative correlation
between relative and absolute nestedness (r = )0.29, P < 0.01 for the
null model Er; r = )0.23, P = 0.04 for the null model Ce). Moreover,
the comparison of model predictions suggests that models with
benefit-neutral and demography-neutral interactions produced a higher
and lower value of NODF respectively than the general model
(Fig. 2c), indicating a negative effect of the variation in species benefits
on the nestedness of the mutualistic networks, in contrast to a positive
effect of demographic variation on the nestedness.
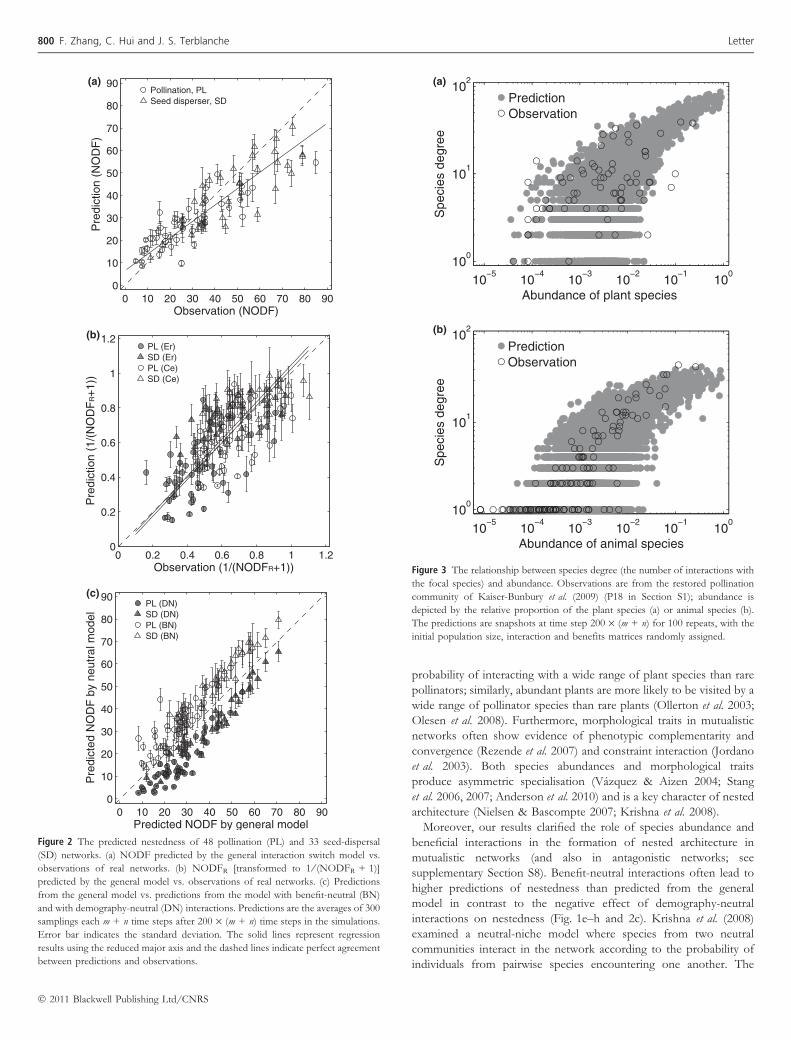
The number of interactive partners of a species (namely the species
degree) was strongly positively correlated with its abundance in our
modelled networks, consistent with real observations (Fig. 3a, b).
798 F. Zhang, C. Hui and J. S. Terblanche Letter
� 2011 Blackwell Publishing Ltd/CNRS

Although the benefit matrix was initially randomly assigned, species
interact more (i.e. have a higher probability of building an interaction)
with the species that can provide a higher benefit in the simulation.
Most interactions bring greater mutual benefits to both sides (instead
of one species gaining more from its partner than its partner gaining
from itself), leading to a high probability of interactions with a trivial
difference in benefits for the pairwise interacting species (see
supplementary Section S5).
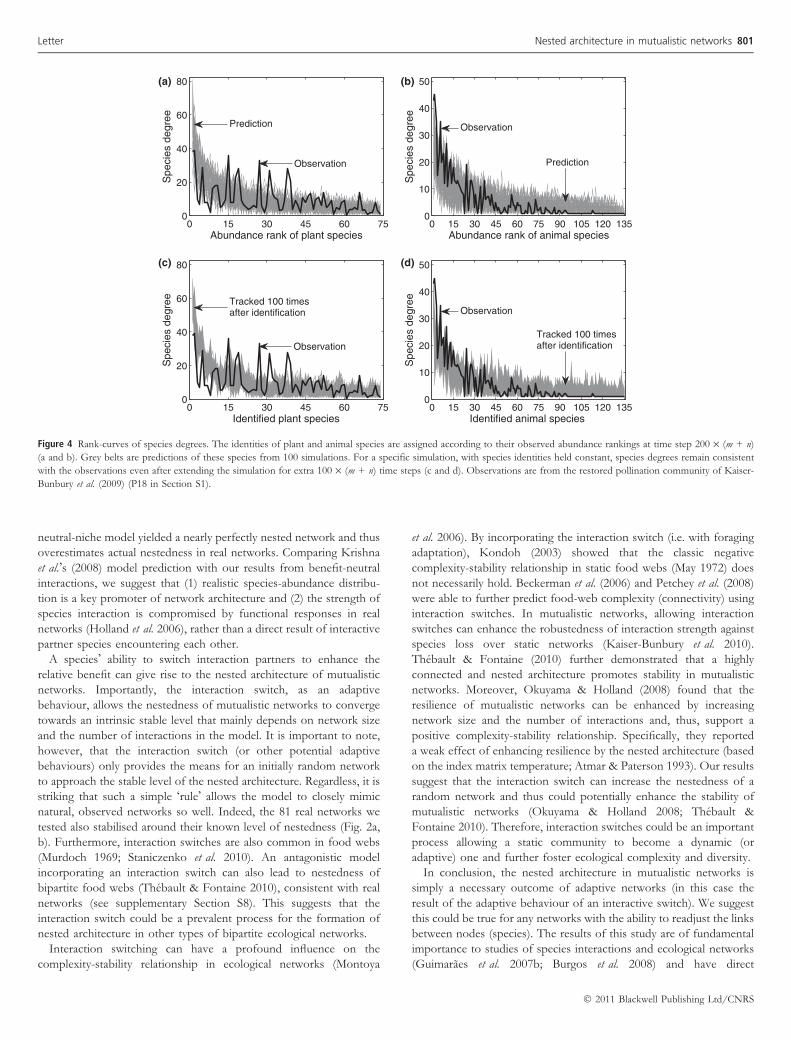
Moreover, once we aligned the simulated species [at time step
200 · (m + n)] according to their abundance ranks in the real network
(Fig. 4a, b; i.e. species identity was defined solely by abundance
rankings), the degrees of these identified species were found to be
consistent with the observed species degrees (Fig. 4a, b). This
indirectly suggests that our model could produce accurate species-
specific predictions. Furthermore, for one specific simulation, without
changing the species identity, species degree remained largely
unchanged after additional 100 · (m + n) time steps (Fig. 4c, d),
suggesting that these species-specific predictions are generally fixed
after an initial dynamic re-wiring period. Another indirect test that
identified species according to their strength (i.e. the total dependence
of other species on them; Bascompte et al. 2006; also see definition in
supplementary Section S6) yielded similar results (see supplementary
Section S7).
DISCUSSION
It is clear that species interactions in nature are highly dynamic in both
space and time (Whittall & Hodges 2007; Thompson et al. 2010). Our
model considered not only the dynamics of populations but also the
active changing of interactions between species over time and
demonstrated that a mutualistic network can, from an initially random
network, dynamically converge upon the nested architecture with a
stable level of nestedness (Fig. 1). Besides predicting the observed
nestedness of real networks well, the model can also support other
commonly observed patterns in mutualistic networks (see supple-
mentary Section S6): (1) the asymmetry (dissimilarity) between the
mutual dependence of plant–animal pairwise interactions (Bascompte
et al. 2006; Vazquez et al. 2007), (2) the truncated power-law
distribution of species degree (Jordano et al. 2003) and (3) the positive
relationship between species degree and species strength (Bascompte
et al. 2006). Therefore, these results show that this model has a
fundamental robustness and broad applicability in representing
mutualistic networks.
One potential reason for this dynamism of species interactions is
that species switch their interaction partners to enhance the benefit
obtained from another species. The interaction switch in turn may
be determined by the new partner�s abundance and whether the benefit
is mutual or perhaps biased towards one of the interaction partners
(Bascompte et al. 2006). An interaction partner is more likely to switch
to a more abundant or potentially more beneficial partner species.
Because the benefit of an interaction often depends on morphological
traits of interacting species (Thompson 2005; Pauw et al. 2009), our
results support the hypothesis that species abundance and adaptive
morphological traits are important factors in the architecture of
mutualistic networks (Ollerton et al. 2003; Rezende et al. 2007;
Vazquez et al. 2009). For instance, abundant pollinators have a higher
Pla
nts
t = 15
10
20
30P
lant
s
t = 0
10
20
30
NO
DF
General model
20
40
60
Time
NO
DF
Benefit neutral20
40
60
Pla
nts
t = 70
10
20
30
Animals
Pla
nts
Realistic
1 15 30 45 60 751
10
20
30
0 100 200 300 400 500 600
20
40
60
TimeN
OD
F
Demography neutral
0
0.4
0.8
NO
DF
R
General model
(a)
(b)
(c)
(d)
(e)
(f)
(g)
(h)
Figure 1 The dynamics of mutualistic interaction networks. Simulations started from a random interaction matrix, which has the same numbers of plant and animal species, as
well as the same number of interactions, as the real network of Elberling & Olesen (P11 in Mutualistic Network Database, see supplementary Section S1). Panel (a), (b) and (c)
are the snapshots of interaction matrices at the beginning and time 15 and 70 (note that each time is m + n time steps) respectively. Panel (d) illustrates the interaction matrix of
Elberling & Olesen�s real network. Panel (e) and (f) gives the dynamical behaviour of nestedness (NODF) and relative nestedness (NODFR with the null model Ce provided by
ANINHADO 3.0) over time for the general model. Panel (g) and (h) gives the dynamics of nestedness for models with only benefit-neutral and demography-neutral interactions
respectively. Dashed lines indicate NODF or NODFR of the real network. See additional dynamics of absolute and relative nestedness using other null models in ANINHADO
3.0 in Section S3 of the supporting online materials.
Letter Nested architecture in mutualistic networks 799
� 2011 Blackwell Publishing Ltd/CNRS
probability of interacting with a wide range of plant species than rare
pollinators; similarly, abundant plants are more likely to be visited by a
wide range of pollinator species than rare plants (Ollerton et al. 2003;
Olesen et al. 2008). Furthermore, morphological traits in mutualistic
networks often show evidence of phenotypic complementarity and
convergence (Rezende et al. 2007) and constraint interaction (Jordano
et al. 2003). Both species abundances and morphological traits
produce asymmetric specialisation (Vazquez & Aizen 2004; Stang
et al. 2006, 2007; Anderson et al. 2010) and is a key character of nested
architecture (Nielsen & Bascompte 2007; Krishna et al. 2008).
Moreover, our results clarified the role of species abundance and
beneficial interactions in the formation of nested architecture in
mutualistic networks (and also in antagonistic networks; see
supplementary Section S8). Benefit-neutral interactions often lead to
higher predictions of nestedness than predicted from the general
model in contrast to the negative effect of demography-neutral
interactions on nestedness (Fig. 1e–h and 2c). Krishna et al. (2008)
examined a neutral-niche model where species from two neutral
communities interact in the network according to the probability of
individuals from pairwise species encountering one another. The
0 10 20 30 40 50 60 70 80 900
10
20
30
40
50
60
70
80
90(a)
(b)
(c)
Observation (NODF)
Pre
dict
ion
(NO
DF
)Pollination, PLSeed disperser, SD
0 0.2 0.4 0.6 0.8 1 1.20
0.2
0.4
0.6
0.8
1
1.2
Observation (1/(NODFR+1))
Pre
dict
ion
(1/(
NO
DF
R+
1))
PL (Er)SD (Er)PL (Ce)SD (Ce)
0 10 20 30 40 50 60 70 80 900
10
20
30
40
50
60
70
80
90
Predicted NODF by general model
Pre
dict
ed N
OD
F b
y ne
utra
l mod
el
PL (DN)SD (DN)PL (BN)SD (BN)
Figure 2 The predicted nestedness of 48 pollination (PL) and 33 seed-dispersal
(SD) networks. (a) NODF predicted by the general interaction switch model vs.
observations of real networks. (b) NODFR [transformed to 1 ⁄ (NODFR + 1)]
predicted by the general model vs. observations of real networks. (c) Predictions
from the general model vs. predictions from the model with benefit-neutral (BN)
and with demography-neutral (DN) interactions. Predictions are the averages of 300
samplings each m + n time steps after 200 · (m + n) time steps in the simulations.
Error bar indicates the standard deviation. The solid lines represent regression
results using the reduced major axis and the dashed lines indicate perfect agreement
between predictions and observations.
10−5
10−4
10−3
10−2
10−1
100
100
101
10(a)
(b)
2
Abundance of plant species
Spe
cies
deg
ree
PredictionObservation
10−5
10−4
10−3
10−2
10−1
100
100
101
102
Abundance of animal species
Spe
cies
deg
ree
PredictionObservation
Figure 3 The relationship between species degree (the number of interactions with
the focal species) and abundance. Observations are from the restored pollination
community of Kaiser-Bunbury et al. (2009) (P18 in Section S1); abundance is
depicted by the relative proportion of the plant species (a) or animal species (b).
The predictions are snapshots at time step 200 · (m + n) for 100 repeats, with the
initial population size, interaction and benefits matrices randomly assigned.
800 F. Zhang, C. Hui and J. S. Terblanche Letter
� 2011 Blackwell Publishing Ltd/CNRS
neutral-niche model yielded a nearly perfectly nested network and thus
overestimates actual nestedness in real networks. Comparing Krishna
et al.�s (2008) model prediction with our results from benefit-neutral
interactions, we suggest that (1) realistic species-abundance distribu-
tion is a key promoter of network architecture and (2) the strength of
species interaction is compromised by functional responses in real
networks (Holland et al. 2006), rather than a direct result of interactive
partner species encountering each other.
A species� ability to switch interaction partners to enhance the
relative benefit can give rise to the nested architecture of mutualistic
networks. Importantly, the interaction switch, as an adaptive
behaviour, allows the nestedness of mutualistic networks to converge
towards an intrinsic stable level that mainly depends on network size
and the number of interactions in the model. It is important to note,
however, that the interaction switch (or other potential adaptive
behaviours) only provides the means for an initially random network
to approach the stable level of the nested architecture. Regardless, it is
striking that such a simple �rule� allows the model to closely mimic
natural, observed networks so well. Indeed, the 81 real networks we
tested also stabilised around their known level of nestedness (Fig. 2a,
b). Furthermore, interaction switches are also common in food webs
(Murdoch 1969; Staniczenko et al. 2010). An antagonistic model
incorporating an interaction switch can also lead to nestedness of
bipartite food webs (Thebault & Fontaine 2010), consistent with real
networks (see supplementary Section S8). This suggests that the
interaction switch could be a prevalent process for the formation of
nested architecture in other types of bipartite ecological networks.
Interaction switching can have a profound influence on the
complexity-stability relationship in ecological networks (Montoya
et al. 2006). By incorporating the interaction switch (i.e. with foraging
adaptation), Kondoh (2003) showed that the classic negative
complexity-stability relationship in static food webs (May 1972) does
not necessarily hold. Beckerman et al. (2006) and Petchey et al. (2008)
were able to further predict food-web complexity (connectivity) using
interaction switches. In mutualistic networks, allowing interaction
switches can enhance the robustedness of interaction strength against
species loss over static networks (Kaiser-Bunbury et al. 2010).
Thebault & Fontaine (2010) further demonstrated that a highly
connected and nested architecture promotes stability in mutualistic
networks. Moreover, Okuyama & Holland (2008) found that the
resilience of mutualistic networks can be enhanced by increasing
network size and the number of interactions and, thus, support a
positive complexity-stability relationship. Specifically, they reported
a weak effect of enhancing resilience by the nested architecture (based
on the index matrix temperature; Atmar & Paterson 1993). Our results
suggest that the interaction switch can increase the nestedness of a
random network and thus could potentially enhance the stability of
mutualistic networks (Okuyama & Holland 2008; Thebault &
Fontaine 2010). Therefore, interaction switches could be an important
process allowing a static community to become a dynamic (or
adaptive) one and further foster ecological complexity and diversity.
In conclusion, the nested architecture in mutualistic networks is
simply a necessary outcome of adaptive networks (in this case the
result of the adaptive behaviour of an interactive switch). We suggest
this could be true for any networks with the ability to readjust the links
between nodes (species). The results of this study are of fundamental
importance to studies of species interactions and ecological networks
(Guimaraes et al. 2007b; Burgos et al. 2008) and have direct
0 15 30 45 60 750
20
40
60
80(a) (b)
(c) (d)
Abundance rank of plant species
Spe
cies
deg
ree
Observation
Prediction
0 15 30 45 60 75 90 105 120 1350
10
20
30
40
50
Abundance rank of animal species
Spe
cies
deg
ree
Observation
Prediction
0 15 30 45 60 750
20
40
60
80
Identified plant species
Spe
cies
deg
ree
Observation
Tracked 100 timesafter identification
0 15 30 45 60 75 90 105 120 1350
10
20
30
40
50
Identified animal speciesS
peci
es d
egre
e
Observation
Tracked 100 timesafter identification
Figure 4 Rank-curves of species degrees. The identities of plant and animal species are assigned according to their observed abundance rankings at time step 200 · (m + n)
(a and b). Grey belts are predictions of these species from 100 simulations. For a specific simulation, with species identities held constant, species degrees remain consistent
with the observations even after extending the simulation for extra 100 · (m + n) time steps (c and d). Observations are from the restored pollination community of Kaiser-
Bunbury et al. (2009) (P18 in Section S1).
Letter Nested architecture in mutualistic networks 801
� 2011 Blackwell Publishing Ltd/CNRS
implications for understanding network robustness under environ-
mental or anthropogenic perturbations (Kaiser-Bunbury et al. 2009,
2010; Staniczenko et al. 2010).
ACKNOWLEDGEMENTS
We are grateful to Marcel Holyoak, Jennifer Dunne and four
anonymous referees for their constructive suggestions on an earlier
version of this manuscript. F.Z. is supported by the DST-NRF Centre
of Excellence for Invasion Biology at Stellenbosch University; C.H.
is supported by the NRF Blue Sky Research Programme; J.S.T. is
supported by the South African National Research Foundation.
AUTHORSHIP
FZ and CH designed research; JST collected data; FZ and CH
performed modelling work and analysed data; FZ wrote the first draft of
the manuscript and all authors contributed substantially to revisions.
REFERENCES
Aizen, M.A. & Vazquez, D.P. (2006). Flowering phonologies of hummingbird
plants from the temperate forest of southern South America: is there evidence of
competitive displacement? Ecography, 29, 357–366.
Almeida-Neto, M., Guimaraes, P., Guimaraes, P.R. Jr, Loyola, R.D. & Ulrich, W.
(2008). A consistent metric for nestedness analysis in ecological systems: rec-
onciling concept and measurement. Oikos, 117, 1227–1239.
Anderson, B., Terblanche, J.S. & Ellis, A.G. (2010). Predictable patterns of
trait mismatches between interacting plants and insects. BMC Evol. Biol., 10,
204.
Ascher, U.M. & Petzold, L.R. (1998). Computer Methods for Ordinary Differential
Equations and Differential-algebraic Equations. Society for Industrial and Applied
Mathematics, Philadelphia, PA.
Atmar, W. & Paterson, B.D. (1993). The measure of order and disorder in the
distribution of species in fragmented habitats. Oecologia, 96, 373–382.
Barrett, S.C.H. (2010). Darwin�s legacy: the forms, function and sexual diversity of
flowers. Phil. Trans. R. Soc. B, 365, 351–368.
Bascompte, J. & Jordano, P. (2007). Plant–animal mutualistic networks: the
architecture of biodiversity. Annu. Rev. Ecol. Evol. Syst., 38, 567–593.
Bascompte, J., Jordano, P., Melian, C.J. & Olesen, J.M. (2003). The nested
assembly of plant–animal mutualistic networks. Proc. Natl Acad. Sci. USA, 100,
9383–9387.
Bascompte, J., Jordano, P. & Olesen, J.M. (2006). Asymmetric coevolutionary
networks facilitate biodiversity maintenance. Science, 312, 431–433.
Basilio, A.M., Medan, D., Torretta, J.P. & Bartoloni, N.J. (2006). A year-long plant-
pollinator network. Austral. Ecol., 31, 975–983.
Bastolla, U., Fortuna, M.A., Pascual-Garcıa, A., Ferrera, A., Luque, B. & Basco-
mpte, J. (2009). The architecture of mutualistic networks minimizes competition
and increases biodiversity. Nature, 458, 1018–1020.
Beckerman, A.P., Petchey, O.L. & Warren, P.H. (2006). Foraging biology predicts
food web complexity. Proc. Natl Acad. Sci. USA, 103, 13745–13749.
Bohonak, A.J. (2004). RMA: Software for Reduced Major Axis regression v. 1.17.
Available at: http://www.bio.sdsu.edu/pub/andy/RMA.html. Last accessed 2
March 2011.
Burgos, E., Ceva, H., Hernandez, L., Perazzo, R.P.J., Devoto, M. & Medan, D.
(2008). Two classes of bipartite networks: nested biological and social systems.
Phys. Rev. E, 78, 046113.
Chamberlain, S.A., Kilpatrick, J.K. & Holland, J.N. (2010). Do extrafloral nectar
resources, abundances, and body sizes contribute to the structure of ant-plant
mutualistic networks? Oecologia, 164, 741–750.
Fortuna, M.A. & Bascompte, J. (2006). Habitat loss and the structure of plant–
animal mutualistic networks. Ecol. Lett., 9, 278–283.
Garcia-Domingo, J.H. & Saldana, J. (2007). Food-web complexity emerging from
ecological dynamics on adaptive networks. J. Theor. Biol., 247, 819–826.
Guimaraes, P.R. Jr & Guimaraes, P. (2006). Improving the analyses of nestedness
for large sets of matrices. Environ. Model. Soft., 21, 1512–1513.
Guimaraes, P.R. Jr, Rico-Gray, V., dos Reis, S.F. & Thompson, J.N. (2006).
Asymmetries in specialization in ant-plant mutualistic networks. Proc. R. Soc.
London B, 273, 2041–2047.
Guimaraes, P.R..Jr, Rico-Gray, V., Oliveira, P.S., Izzo, T.J., Reis, S.F. & Thompson,
J.N. (2007a). Interaction intimacy affects structure and coevolutionary dynamics
in mutualistic networks. Curr. Biol., 17, 1–7.
Guimaraes, P.R. Jr, Sazima, C., Furtado dos Reis, S. & Sazima, I. (2007b). The
nested structure of marine cleaning symbiosis: is it like flowers and bees? Biol.
Lett., 3, 51–54.
Holland, J.N. & DeAngelis, D.L. (2010). A consumer–resource approach to the
density-dependent population dynamics of mutualism. Ecology, 91, 1286–1295.
Holland, J.N., Okuyama, T. & DeAngelis, D.L. (2006). Comment on �Asymmetric
Coevolutionary Networks Facilitate Biodiversity Maintenance�. Science, 313, 1887.
Holling, C.S. (1959). Some characteristics of simple types of predation and para-
sitism. Canad. Entomol., 91, 385–398.
Jordano, P., Bascompte, J. & Olesen, J.M. (2003). Invariant properties in coevo-
lutionary networks of plant–animal interactions. Ecol. Lett., 6, 69–81.
Kaiser-Bunbury, C.N., Memmott, J. & Muller, C.B. (2009). Community structure of
pollination webs of Mauritian heathland habitats. Perspect. Plant Ecol. Evol. Syst.,
11, 241–254.
Kaiser-Bunbury, C.N., Muff, S., Memmott, J., Muller, C.B. & Caflisch, A. (2010). The
robustness of pollination networks to the loss of species and interactions: a
quantitative approach incorporating pollinator behaviour. Ecol. Lett., 13, 442–452.
Kondoh, M. (2003). Foraging adaptation and the relationship between food-web
complexity and stability. Science, 299, 1388–1391.
Krishna, A., Guimaraes, P.R. Jr, Jordano, P. & Bascompte, J. (2008). A neutral-
niche theory of nestedness in mutualistic networks. Oikos, 117, 1609–1618.
May, R.M. (1972). Will a large complex system be stable? Nature, 238, 413–414.
Montoya, J.M., Pimm, S.L. & Sole, R.V. (2006). Ecological networks and their
fragility. Nature, 442, 259–264.
Murdoch, W.W. (1969). Switching in general predators: experiments on predator
specificity and stability of prey populations. Ecol. Monogr., 39, 335–354.
Nielsen, A. & Bascompte, J. (2007). Ecological networks, nestedness and sampling
effort. J. Ecol., 95, 1134–1141.
Okuyama, T. & Holland, J.N. (2008). Network structural properties mediate the
stability of mutualistic communities. Ecol. Lett., 11, 208–216.
Olesen, J.M., Bascompte, J., Elberling, H. & Jordano, P. (2008). Temporal dynamics
in a pollination network. Ecology, 89, 1573–1582.
Ollerton, J., Johnson, S.D., Cranmer, L. & Kellie, S. (2003). The pollination ecology
of an assemblage of grassland asclepiads in South Africa. Ann. Bot., 92, 807–834.
Pauw, A., Stofberg, J. & Waterman, R.J. (2009). Flies and flowers in Darwin�s race.
Evolution, 63, 268–279.
Petanidou, T., Kallimanis, A.S., Tzanopoulos, J., Sgardelis, S.P. & Pantis, J.D.
(2008). Long-term observation of a pollination network: fluctuation in species
and interactions, relative invariance of network structure and implications for
estimates of specialization. Ecol. Lett., 11, 564–575.
Petchey, O.L., Beckerman, A.P., Riede, J.O. & Warren, P.H. (2008). Size, foraging,
and food web structure. Proc. Natl Acad. Sci. USA, 105, 4191–4196.
Rezende, E.L., Lavabre, J.E., Guimaraes, P.R. Jr, Jordano, P. & Bascompte, J.
(2007). Non-random coextinctions in phylogenetically structured mutualistic
networks. Nature, 448, 925–928.
Stang, M., Klinkhamer, P.G.L. & van der Meijden, E. (2006). Size constraints and
flower abundance determine the number of interactions in a plant-flower visitor
web. Oikos, 112, 111–121.
Stang, M., Klinkhamer, P.G.L. & van der Meijden, E. (2007). Asymmetric spe-
cialization and extinction risk in plant–flower visitor webs: a matter of mor-
phology or abundance? Oecologia, 151, 442–453.
Staniczenko, P.P.A., Lewis, O.T., Jones, N.S. & Reed-Tsochas, F. (2010). Structural
dynamics and robustness of food webs. Ecol. Lett., 13, 891–899.
Thebault, E. & Fontaine, C. (2010). Stability of ecological communities and the
architecture of mutualistic and trophic networks. Science, 329, 853–856.
Thompson, J.N. (2005). The Geographic Mosaic of Coevolution. Chicago University
Press, Chicago.
Thompson, J.N., Laine, A.L. & Thompson, J.F. (2010). Retention of mutualism in a
geographically diverging interaction. Ecol. Lett., 13, 1368–1377.
802 F. Zhang, C. Hui and J. S. Terblanche Letter
� 2011 Blackwell Publishing Ltd/CNRS

Ulrich, W., Almeida-Neto, M. & Gotelli, N.J. (2009). A consumer�s guide to
nestedness analysis. Oikos, 118, 3–17.
Vazquez, D.P. & Aizen, M.A. (2004). Asymmetric specialization: a pervasive feature
of plant-pollinator interactions. Ecology, 85, 1251–1257.
Vazquez, D.P., Melian, C.J., Williams, N.M., Bluthgen, N., Krasnov, B.R. & Pou-
lin, R. (2007). Species abundance and asymmetric interaction strength in eco-
logical networks. Oikos, 116, 1120–1127.
Vazquez, D.P., Bluthgen, N., Cagnolo, L. & Chacoff, N.P. (2009). Uniting pattern
and process in plant–animal mutualistic networks: a review. Ann. Bot., 103, 1445–
1457.
Whittall, J.B. & Hodges, S.A. (2007). Pollinator shifts drive increasingly long nectar
spurs in columbine flowers. Nature, 447, 706–709.
SUPPORTING INFORMATION
Additional Supporting Information may be found in the online
version of this article:
Section S1 Mutualistic Network Database.
Section S2 Holling�s type II functional response for mutualistic
networks.
Section S3 The dynamics of nestedness and relative nestedness.
Section S4 The effect of initial structures of the interaction matrices
on the stable level of nestedness.
Section S5 Probability distribution of interaction benefits.
Section S6 Predicting other patterns in mutualistic networks.
Section S7 Species rank curves predicted from the model.
Section S8 Antagonistic interaction model and results.
As a service to our authors and readers, this journal provides supporting
information supplied by the authors. Such materials are peer-reviewed
and may be re-organised for online delivery, but are not copy-edited or
typeset. Technical support issues arising from supporting information
(other than missing files) should be addressed to the authors.
Editor, Jennifer Dunne
Manuscript received 14 March 2011
First decision made 15 April 2011
Manuscript accepted 1 June 2011
Letter Nested architecture in mutualistic networks 803
� 2011 Blackwell Publishing Ltd/CNRS


