
ORIGINAL ARTICLE
An ISM approach for modelling the enablersin the implementation of Total Productive Maintenance (TPM)
Rajesh Attri • Sandeep Grover • Nikhil Dev •
Deepak Kumar
Received:11September2014/Revised:9January2015
� The Society for Reliability Engineering, Quality and Operations Management (SREQOM), India and The Division of Operation and
Maintenance,LuleaUniversityofTechnology,Sweden2015
Abstract Total Productive maintenance (TPM) is
increasingly implemented by many organizations to
improve their equipment efficiency and to obtain the
competitive advantage in the global market in terms of cost
and quality. But, implementation of TPM is not an easy
task. There are certain enablers, which help in the imple-
mentation of TPM. The utmost need is to analyse the
behaviour of these enablers for their effective utilization in
the implementation of TPM. The main objective of this
paper is to understand the mutual interaction of these e-
nablers and identify the ‘driving enablers’ (i.e. which
influence the other enablers) and the ‘dependent enablers’
(i.e. which are influenced by others). In the present work,
these enablers have been identified through the literature,
their ranking is done by a questionnaire-based survey and
interpretive structural modelling (ISM) approach has been
utilized in analysing their mutual interaction. An ISM
model has been prepared to identify some key enablers and
their managerial implications in the implementation of
TPM.
Keywords TPM � Total productive maintenance �Enablers � Interpretive structural modelling
1 Introduction
In the present high-stress, turbulent business-environment,
well run organisations strive continually to enhance their
capabilities to create excellent value for their customers by
improving the cost effectiveness of their operations.
Maintenance is thus a vital support function in business,
especially as increasingly large investments are being
required in physical assets (Tsang et al. 2000). Strategic
investments in the maintenance function can lead to
improved performance of manufacturing system and
enhance the competitive market position of the organiza-
tion (Coetzee 1999; Jonsson and Lesshammar 1999). This
has provided the impetus to the leading organizations
worldwide to adopt effective and efficient maintenance
strategies such as Condition Based Maintenance (CBM),
Reliability Centered Maintenance (RCM) and Total Pro-
ductive Maintenance (TPM), over the traditional fire
fighting reactive maintenance approaches such as Break-
down maintenance (BDM) (Sharma et al. 2005). Ahuja and
Khamba (2008b) have discussed that maintenance concept
has progressed from Breakdown maintenance to Total
productive maintenance (Fig. 1) over the years.
TPM can be regarded as an improvement program
establishing a comprehensive productive-maintenance
system throughout the entire life of the equipment,
encompassing all equipment-related fields, and with the
participation of all employees, to promote productive
maintenance through motivation or voluntary team- based
activities (Dal et al. 2000). TPM is designed to maximize
equipment effectiveness by establishing a comprehensive
productive maintenance system covering the entire life of
the equipment, spanning all equipment-related fields and
with participation of all employees from the top
R. Attri (&) � S. Grover � N. Dev
Department of Mechanical Engineering, YMCA University
of Science and Technology, Faridabad 121006, India
e-mail: [email protected]
D. Kumar
Department of Mechanical Engineering, Advanced Institute
of Technology and Management, Palwal 121105, India
123
Int J Syst Assur Eng Manag
DOI 10.1007/s13198-012-0088-7
Downloaded from http://www.elearnica.ir

management to the shop-floor workers, to promote pro-
ductive maintenance through motivation management or
voluntary small group activities (Tsuchiya 1992).
TPM can be defined as an approach to achieve rapid
improvement of manufacturing processes by involving and
empowering production related employees and introducing an
ongoing process of quality improvement (Nakajima 1988).
TPM implementation has resulted into increased equipment
effectiveness, higher productivity, better quality, fewer
breakdowns, lower costs, reliable deliveries, motivating
working environments, enhanced safety and improved morale
of the employees (Ahuja and Khamba 2008b).
Though TPM provides a lot of benefits but implemen-
tation of TPM is difficult task. It has been observed that
many of the organizations that attempt to implement TPM
initiatives experience difficulties and are not able to
achieve the anticipated benefits. Mora (2002) has stated
that though in recent years, many companies have
attempted to implement TPM programs, less than 10 % of
companies succeed in implementing TPM. Implementing
TPM requires the change of the organizational culture and
change of existing behaviours of all employees, operators,
engineers, maintenance technicians, and managers. The
TPM implementing process has been fraught with road-
blocks and pitfalls. These roadblock or pitfall which make
this implementation a difficult task include: lack of man-
agement support, lack of involvement of production asso-
ciates, lack of resources, lack of term vision, lack of
sustained momentum, no delegate person (Chan et al.
2005). No doubt there are certain barriers which inhibit
TPM implementation process but despite this, there are
certain enablers for successful implementation of TPM.
These enablers help the management to implement TPM in
their firms. But need to be properly analysed and the
effectiveness of these enablers understood so that the
implementation process is completed without many hur-
dles. These enablers not only affect the implementation
process of TPM but also influence one another. So it is
really necessary to understand the nature of these enablers
and their mutual relationship so that those enablers which
support other enablers (called ‘driving enablers’) and those
which are most influenced by others (called ‘dependent
enablers’) are identified.
In the present paper, an attempt has been made to
accomplish the task of analysis of enablers of total produc-
tive maintenance (TPM) through an interpretive structural
modelling (ISM) approach. It is a well-established method-
ology for identifying relationships among specific items
which define a problem or an issue (Sage 1977). Therefore, in
this research TPM enablers have been analysed using the
ISM approach, which shows the inter-relationships of the
enablers, their driving power and dependencies. In this
paper, 10 enablers have been identified through the literature,
a questionnaire-based survey and opinions of experts both
from industry and academia. A questionnaire based survey
was conducted on Indian industries to seek their views
regarding the main enablers for the successful adaptation of
TPM. In accordance with the ISM methodology, the opinions
of experts were sought to develop the relationship matrix,
which is later used in the development of ISM model.
The main objectives of this paper are as follows:
• To identify and rank the enablers the implementation of
TPM.
• To establish relationships among these enablers using
ISM.
• To discuss managerial implication of this research and
suggest directions for future research.
In the remainder of this paper, identification of various
enablers through the literature survey and discussion with
experts is presented in Sect. 2. In Sect. 3, an overview of
ISM technique is given. Use of the ISM approach in the
modelling of various enablers is discussed in Sect. 4.
MICMAC analysis of these enablers is presented in Sect. 5.
The results of this research are followed by discussion and
conclusions in Sect. 6 respectively.
2 Identification of enablers in TPM implementation
Literature review and experiences of maintenance and pro-
duction managers and academicians reveal that
Fig. 1 Journey of maintenance concept
Int J Syst Assur Eng Manag
123

implementation of TPM is not an easy task by any means as it
requires establishing new cultures (Patterson et al. 1996),
changing attitudes (Turbide 1995), creating new work
environment’s (Maggard and Rhyne 1992), accomplishing
paradigm shifts (Jeszenka 1993) and shifting the responsi-
bility of the maintenance department to being everyone’s
responsibility (Lawrence 1999). Based on the extent litera-
ture review, questionnaire survey and discussion with
experts in the organizations, ten major enablers were iden-
tified, which can serve as an invaluable lesson to those
organizations that are planning to implement TPM or are in
the process of implementation. Beside these enablers, some
enablers like teams, preventive maintenance, strategic
planning, knowledge and beliefs were excluded from the
study due to very low mean score in the questionnaire survey.
Moreover, the enablers like worker training, cross-
functional training, employee involvement, operator
involvement, committed leadership which are often cited
with different names and headings are covered in this study
under a common name like training and education, total
employee involvement and Top management commitment
and support. Hence, these ten enablers are assumed to be
major TPM enablers in the successful implementation of
TPM. Enablers along with their references/sources are
being represented in Table 1.
2.1 Top management commitment and support
In order to successfully implement TPM, companies must
have top management support, understanding and com-
mitment, along with training and motivation of everyone in
the organization (Patterson et al. 1996; Park and Han
2001). The role of top management’s commitment and
leadership has been frequently emphasized in many
literatures to have the decisive influence over successful
TPM implementation (Tsang and Chan 2000). Bamber
et al. (1999) have found management commitment as
factor affecting successful implementation of TPM in UK
manufacturing firms.
Patterson et al. (1995) explained that to successfully
implement TPM, an organization must be led by top
management that is supportive understanding and com-
mitted to the various kinds of TPM activities. Top man-
agement has the primary responsibility of preparing a
suitable and supportive environment before the official
kick-off of TPM within their organization. Only with the
sustained commitment and enthusiasm of top and senior
management can changes in corporate strategy be properly
devised and executed. Such support is necessary to ensure
the incorporation of TPM into the business strategy, and
continuity of policy across company divisions (Park and
Han 2001).
The successful implementation of TPM requires top
management support, commitment and involvement. Top
management needs to have a strong commitment to the
TPM implementation program and should go all-out for
evolving mechanisms for multi-level communication to all
employees explaining the importance and benefits of the
whole program, and whole heartedly propagating the TPM
benefits to the organization, employees by linking TPM to
the overall organizational strategy and objectives (Ahuja
and Khamba 2008a). Nakajima (1989) stated that the top
management’s primary responsibility is to establish a
favourable environment where the work environment can
support autonomous activities. Chan et al. (2005) have also
found management support as the critical success factor in
implementation of total productive maintenance in an
electronics manufacturing company.
Table 1 TPM enablers and their references/sources
S. no TPM enablers References/sources
1 Top management commitment
and support
Patterson et al. (1996), Park and Han (2001), Tsang and Chan (2000),
Bamber et al. 1999, Patterson et al. 1995, Ahuja and Khamba (2008a),
Nakajima (1989), Chan et al. (2005)
2 Cultural change Ahuja and Khamba (2008a), Park and Han (2001)
3 Coordination Badiru and Schlegel (1994), Park and Han (2001)
4 Communication Eti et al. (2004), Park and Han (2001)
5 Cooperation Park and Han (2001)
6 Total employee involvement Ahuja and Khamba (2008a), Nakajima (1989), Chen (1997)
7 Training and Education Maggard and Rhyne (1992), Turbide (1995), Moore (1997), Swanson (1997),
Blanchard (1997), Chan et al. (2005), Ahuja and Khamba (2008a),
Eti et al. 2004, Thiagarajan and Zairi (1997)
8 Integration of TPM goals and
objectives into business plans
Ahuja and Khamba (2008b)
9 Motivation Bamber et al. (1999)
10 Empowerment and encouragement Davis and Willmott (1999), Eti et al. (2004), Agyris (1998), Patterson et al. (1995)
Int J Syst Assur Eng Manag
123

Before TPM implementation, top management should
decide the vision, mission, and goals for the organization.
Top management should lay down sound foundation for
initiating TPM activities. Top management must develop
overall TPM framework by formulating policies.
2.2 Cultural change
The biggest challenge before the organization is to be able
to make radical transformation in the organization’s culture
for ensuring overall employee participation towards the
maintenance and manufacturing performance improvement
through TPM initiatives. The focused and concerted efforts
have to be made by the top management to bring about
motivating organization culture by creating awareness to
the employees about the true potential of TPM and by
communicating to the employees about the contributions of
TPM towards the employees in particular (Ahuja and
Khamba 2008a).
Preparing for TPM implementation includes creating a
favourable environment for effective change. TPM is a
significant cultural change; motivating individuals to
change from ‘‘that’s not my job’’ to ‘‘this is what I can do
to help’’ will require major adjustments by everyone
involved (Park and Han 2001). Organizations require a
change in mindset of people for successfully implementing
TPM.
2.3 Coordination
The efforts of the TPM implementation team must be
coordinated after successfully initiating the communication
and cooperation functions. Coordination facilitates condu-
cive organization of implementation efforts (Badiru and
Schlegel 1994; Park and Han 2001). In TPM program
coordinated effort is emphasized along with individual
efforts. Management must evolve a mechanism to coordi-
nate activities. Coordination will help in achieving TPM
objectives and goals more easily.
The TPM program should be coordinated within the
company by an enthusiast who is appointed on a full-time
basis, at least during the planning and implementation
phases, and who can lead an implementation team that is
representative of different company divisions (Park and
Han 2001).
2.4 Communication
Communication is an exchange of information and under-
standing between two or more persons or groups. Com-
munications should be in the recipients’ language and
within his/her understanding: therefore the message must
be in terms of that individual’s experience and perception
(Eti et al. 2004). Implementing new technology may gen-
erate concerns both within and outside the organization. A
frequent concern is the loss of jobs. Sometimes, there may
be uncertainties about the impact of the proposed tech-
nology. Proper communication can help alleviate the fears
of those to be affected by the implementation effort. Well-
developed, two-way communication is required to support
a TPM system. Wide communication is a vital factor in
securing support for a TPM implementation project (Park
and Han 2001). Communication will help the employee to
know the technical and philosophical aspects of TPM.
2.5 Cooperation
The successful implementation of TPM presupposes the
ready cooperation of all within the organization. TPM
emphasizes that people—operators, maintenance techni-
cians, engineers, designers, and planners—must work as a
team if they are to maximize the overall effectiveness of
their equipment, by actively seeking creative solutions for
eliminating waste owing to equipment problems (Park and
Han 2001). TPM is a team activity not a single man activity
which requires overall cooperation of all employees espe-
cially production and maintenance personnel’s.
2.6 Total employee involvement
Total employee involvement is indeed a pre-requite to
successful TPM implementation and can be ensured by
enhancing the competencies of employees towards the
jobs, evolving the environment of equipment and system
ownership by the employees, adequate employee counsel-
ing, union buy-in, effective appropriate suggestions
schemes and deploying encouraging and safe work envi-
ronment in the organizations (Ahuja and Khamba 2008a).
TPM demands active participation from the shop floor
operators in the continuous improvements activities,
crossfunctional teamwork, work suggestion schemes
(Nakajima 1989).
TPM accomplished the maximization of equipment
effectiveness through total employee participation and
incorporated the use of Autonomous Maintenance in the
small group activities to improve on the equipment reli-
ability, maintainability and productivity (Chen 1997).
2.7 Training and education
Training and education is an ongoing process for everyone
in the organization. Maggard and Rhyne (1992) stated that
training and education is crucial to the success of TPM.
The importance of training is also highlighted by Turbide
(1995) and Moore (1997). Swanson (1997) has emphasized
upon worker training as a key component for successful
Int J Syst Assur Eng Manag
123

implementation of TPM in an organization. Blanchard
(1997) pointed out that training and educational issues had
become one of the critical factors to establish successful
TPM implementation, where proper education begin as
early as during the TPM introduction and initial prepara-
tion stages. Chan et al. (2005) have also found training as
the critical success factor in implementation of total pro-
ductive maintenance in an electronics manufacturing
company.
The top management must endeavor to train and develop
the employee competencies by updating their skill,
knowledge and attitude to enable higher productivity and
achieve highest standards of quality, to eliminate product
defect, equipment failure (breakdowns) and accidents, to
develop multi skilled work force, and to create a sense of
pride and belonging among all employees (Ahuja and
Khamba 2008a). Employee training should focus on
appropriate multi-skills and knowledge (Eti et al. 2004).
Thiagarajan and Zairi (1997) have recommended education
and training as the single most important factor once the
necessary commitment has been assured.
2.8 Integration of TPM goals and objectives
into business plans
In order to realize the true potential of TPM and ensure
successful TPM implementation, TPM goals and objectives
need to be fully integrated into the strategic and business
plans of the organizations, because TPM affects the entire
organization, and is not limited to production. The first
course of action is to establish a strategic direction for
TPM. The transition from a traditional maintenance pro-
gram to TPM requires a significant shift in the way the
production and maintenance functions operate. Rather than
a set of instructions, TPM is a philosophy, the adoption of
which requires a change of attitude by production and
maintenance personnel (Ahuja and Khamba 2008b).
2.9 Motivation
Management must create an environment for the individual
to motivate themselves. Bamber et al. (1999) have found
motivation of management and workforce as a factor
affecting successful implementation of total productive
maintenance in UK manufacturing organizations. Motiva-
tion is the changing behaviour of employee towards work
from negative to positive. The employee should be moti-
vated to participate in maintenance activities.
2.10 Empowerment and encouragement
Empowerment and encouragement are significant enablers
for successful implementation of total productive
maintenance initiatives in the manufacturing organizations
(Davis and Willmott 1999). Employee empowerment is
desirable in order to create excellent commitments
amongst the concerned personnel: for this, management,
within the overall aims of the organisation, must involve
employees in setting challenging targets and specifying
how to achieve them (Eti et al. 2004; Agyris 1998).
Empowerment is an environment in which people have
the ability, the confidence, and the commitment to take
the responsibility and ownership. In such an environment
employees/operators will fully participate in TPM activi-
ties. The employees should be encouraged to take part in
TPM activities.
Patterson et al. (1995) stated that TPM requires
employee empowerment and the attitude that TPM is not a
maintenance department’s program but it’s everyone’s
program. Under TPM, production workers assume owner-
ship of their work area and become responsible for routine
maintenance of machines and equipment. In some organi-
zations, the managers do not trust operators to make any
repairs and adjustments on the machine because they feel
that the expensive equipment will be damaged. In such
cases, the organizations are not ready to implement TPM
programs (Patterson et al. 1995).
Besides these enablers, the eight pillars of TPM (Fig. 2)
will also serve as an effective tool in implementation of
TPM.
Pillar 1: 5S TPM starts with 5S. It is a systematic process
of housekeeping to achieve a serene environment in the
work place involving the employees. Problems cannot be
clearly seen when the work place is unorganized. Cleaning
and organizing the workplace helps the team to uncover
problems. The different S are as represented below:
Japanese term English 5S Features
Seiri Sort Sorting and organizing items as
per frequency of usage
Seiton Systematise Storing the items in organized way
Seisio Sweep Cleaning of workplace to make it
free from dust, dirt etc.
Seiketsu Standardise Maintaining standards for keeping
workplace & machine in neat
and clean condition
Shitsuke Self-discipline Treating 5S as a way of life and
develop self-discipline for
following good housekeeping
disciplines
Making problems visible is the first step of improvement. 5s is a
foundation program before the implementation of TPM (Venkatesh
2007)
Int J Syst Assur Eng Manag
123

Pillar 2: autonomous maintenance This pillar aims to pre-
pare the operators to take care of routine maintenance tasks
which will help to free the core maintenance personnel to
concentrate on high maintenance activities. The operator’s
act of taking care of small maintenance tasks will avoid the
equipment’s from deterioration (Paneerselvam 2010).
Pillar 3: Kaizen The word kaizen means change for better
in Japanese. It is that philosophy that focuses upon con-
tinuous improvement of processes in manufacturing. Kai-
zen focuses on zero losses, cost in reduction in all
resources, improvement of overall plant effectiveness.
Pillar 4: planned maintenance Planned maintenance aims
to have trouble free machines and equipment’s to produce
defect free products to satisfy the customer’s requirement
(Paneerselvam 2010).
Pillar 5: quality maintenance Quality maintenance aims to
maintain the equipment’s in good operating condition such
that highest quality products are delivered to customers
through defect free manufacturing (Paneerselvam 2010).
QM activities is to set equipment conditions that preclude
quality defects, based on the basic concept of maintaining
perfect equipment to maintain perfect quality of products.
The condition is checked and measure in time series to very
that measure values are within standard values to prevent
defects (Venkatesh 2007).
Pillar 6: training It is aimed to have multi-skilled revi-
talized employees whose morale is high and who has eager
to come to work and perform all required functions
effectively and independently. Education is given to
operators to upgrade their skill (Venkatesh 2007).
Pillar 7: office TPM Office TPM mainly aims to improve
the productivity and efficiency in the administrative func-
tions by identifying and eliminating losses in them.
Pillar 8: safety, health and environment Office TPM
mainly aims to improve the productivity and efficiency in
the administrative functions by identifying and eliminating
losses in them.
3 Methodology
A questionnaire-based survey and ISM approach have been
used to achieve the objectives of this research. These
methodologies and their respective results are separately
discussed in the following sections.
3.1 Questionnaire-based survey
The main purpose of the questionnaire-based survey was to
facilitate experts in developing a relationship matrix as a
first step towards developing an ISM-based model. The
questionnaire was designed on a five-point Likert scale and
respondents were asked to indicate the importance of ten
listed enablers on this five-point Likert scale. On this scale,
1 and 5 correspond to ‘very low’ to ‘very high, respec-
tively. The questionnaire had a wide range of research
objectives and involved many questions.
The questionnaire was administered to companies from
Indian manufacturing industries. In total, questionnaires
were sent to 125 Indian companies. Out of the 125 ques-
tionnaires, 35 completed questionnaires were received.
Three questionnaires were incomplete and were discarded
for further analysis. So, only 32 questionnaires were ana-
lyzed. This gives a response rate of 25.6 %. Whereas higher
response rates are better, response rates below 20 % are
extremely undesirable for survey findings (Yu and Cooper
1983). Malhotra and Grover (1998) have suggested a
response rate of 20 % for positive assessment of the sur-
veys. On the basis of responses, the company data of 32
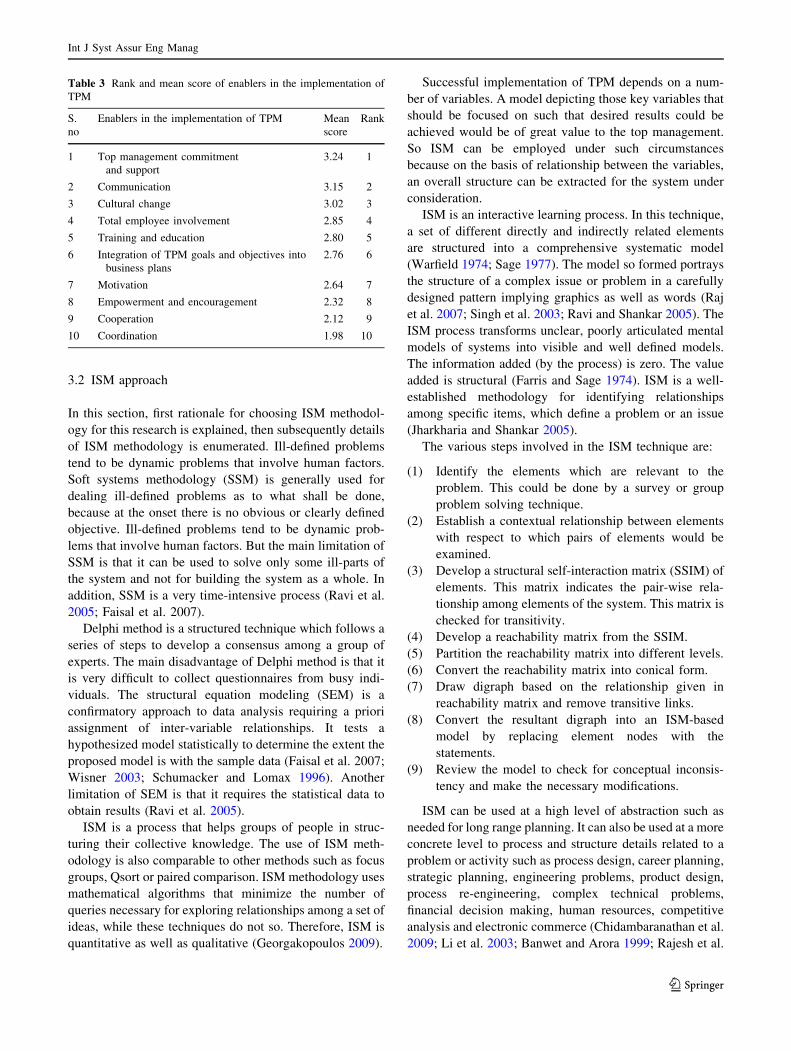
respondents is presented in Table 2 and the enablers are
presented in the decreasing order of their significance in
Table 3.
Fig. 2 Pillars of TPM (Venkatesh 2007)
Table 2 Data of the responding companies
S. no Description of data Range Description
of firms
1 Number of employees Less than 100 5
101–500 22
501–1000 45
1001–3000 15
More than 3000 13
2 Turnover (US $ million) Less than 10 10
10–20 35
20–100 25
100–200 12
200–400 9
More than 400 9
Int J Syst Assur Eng Manag
123
3.2 ISM approach
In this section, first rationale for choosing ISM methodol-
ogy for this research is explained, then subsequently details
of ISM methodology is enumerated. Ill-defined problems
tend to be dynamic problems that involve human factors.
Soft systems methodology (SSM) is generally used for
dealing ill-defined problems as to what shall be done,
because at the onset there is no obvious or clearly defined
objective. Ill-defined problems tend to be dynamic prob-
lems that involve human factors. But the main limitation of
SSM is that it can be used to solve only some ill-parts of
the system and not for building the system as a whole. In
addition, SSM is a very time-intensive process (Ravi et al.
2005; Faisal et al. 2007).
Delphi method is a structured technique which follows a
series of steps to develop a consensus among a group of
experts. The main disadvantage of Delphi method is that it
is very difficult to collect questionnaires from busy indi-
viduals. The structural equation modeling (SEM) is a
confirmatory approach to data analysis requiring a priori
assignment of inter-variable relationships. It tests a
hypothesized model statistically to determine the extent the
proposed model is with the sample data (Faisal et al. 2007;
Wisner 2003; Schumacker and Lomax 1996). Another
limitation of SEM is that it requires the statistical data to
obtain results (Ravi et al. 2005).
ISM is a process that helps groups of people in struc-
turing their collective knowledge. The use of ISM meth-
odology is also comparable to other methods such as focus
groups, Qsort or paired comparison. ISM methodology uses
mathematical algorithms that minimize the number of
queries necessary for exploring relationships among a set of
ideas, while these techniques do not so. Therefore, ISM is
quantitative as well as qualitative (Georgakopoulos 2009).
Successful implementation of TPM depends on a num-
ber of variables. A model depicting those key variables that
should be focused on such that desired results could be
achieved would be of great value to the top management.
So ISM can be employed under such circumstances
because on the basis of relationship between the variables,
an overall structure can be extracted for the system under
consideration.
ISM is an interactive learning process. In this technique,
a set of different directly and indirectly related elements
are structured into a comprehensive systematic model
(Warfield 1974; Sage 1977). The model so formed portrays
the structure of a complex issue or problem in a carefully
designed pattern implying graphics as well as words (Raj
et al. 2007; Singh et al. 2003; Ravi and Shankar 2005). The
ISM process transforms unclear, poorly articulated mental
models of systems into visible and well defined models.
The information added (by the process) is zero. The value
added is structural (Farris and Sage 1974). ISM is a well-
established methodology for identifying relationships
among specific items, which define a problem or an issue
(Jharkharia and Shankar 2005).
The various steps involved in the ISM technique are:
(1) Identify the elements which are relevant to the
problem. This could be done by a survey or group
problem solving technique.
(2) Establish a contextual relationship between elements
with respect to which pairs of elements would be
examined.
(3) Develop a structural self-interaction matrix (SSIM) of
elements. This matrix indicates the pair-wise rela-
tionship among elements of the system. This matrix is
checked for transitivity.
(4) Develop a reachability matrix from the SSIM.
(5) Partition the reachability matrix into different levels.
(6) Convert the reachability matrix into conical form.
(7) Draw digraph based on the relationship given in
reachability matrix and remove transitive links.
(8) Convert the resultant digraph into an ISM-based
model by replacing element nodes with the
statements.
(9) Review the model to check for conceptual inconsis-
tency and make the necessary modifications.
ISM can be used at a high level of abstraction such as
needed for long range planning. It can also be used at a more
concrete level to process and structure details related to a
problem or activity such as process design, career planning,
strategic planning, engineering problems, product design,
process re-engineering, complex technical problems,
financial decision making, human resources, competitive
analysis and electronic commerce (Chidambaranathan et al.
2009; Li et al. 2003; Banwet and Arora 1999; Rajesh et al.
Table 3 Rank and mean score of enablers in the implementation of
TPM
S.
no
Enablers in the implementation of TPM Mean
score
Rank
1 Top management commitment
and support
3.24 1
2 Communication 3.15 2
3 Cultural change 3.02 3
4 Total employee involvement 2.85 4
5 Training and education 2.80 5
6 Integration of TPM goals and objectives into
business plans
2.76 6
7 Motivation 2.64 7
8 Empowerment and encouragement 2.32 8
9 Cooperation 2.12 9
10 Coordination 1.98 10
Int J Syst Assur Eng Manag
123

2007). For complex problem, like the one under consider-
ation, ISM approach has been used to develop a compre-
hensive systematic model. Application of ISM process to
analyze systems and problems in various fields is well
documented in literature as represented in Table 4.
4 An ISM approach for modelling of enablers
The various steps, which lead to the development of ISM
model, are illustrated below.
4.1 Structural self-interaction matrix (SSIM)
Experts, both from industry and academia, have been
consulted in identifying and developing the contextual
relationship among the enablers.
Following four symbols have been used to denote the
direction of the relationship between two enablers (i and j):
• V is used for the relation from enabler i to enabler j (i.e.
if enabler i influences or reaches to enabler j).
• A is used for the relation from enabler j to enabler i (i.e.
if enabler j reaches to enabler i).
• X is used for both direction relations (i.e. if enablers
i and j reach to each other).
• O is used for no relation between two enablers (i.e. if
enablers i and j are unrelated).
Based on this contextual relationship, the SSIM has been
developed. To obtain consensus, the SSIM was discussed
in a group of experts and based on their responses, SSIM
has been finalised and it is presented in Table 5.
4.2 Reachability matrix
The SSIM is transformed into a reachability matrix format
by transforming the information in each entry of the SSIM
into 1s and 0s in the reachability matrix. The substitution of
1s and 0s are as per the following rules:
(1) If the (i, j) entry in the SSIM is V, then the (i, j) entry
in the reachability matrix becomes 1 and the (j, i)
entry becomes 0.
(2) If the (i, j) entry in the SSIM is A, then the (i, j) entry
in the matrix becomes 0 and the (j, i) entry becomes 1.
(3) If the (i, j) entry in the SSIM is X, then the (i, j) entry
in the matrix becomes 1 and the (j, i) entry also
becomes 1.
(4) If the (i, j) entry in the SSIM is O, then the (i, j) entry
in the matrix becomes 0 and the (j, i) entry also
becomes 0.
Table 4 Application of ISM approach for decision making
S. no Name of the authors (year) Application
1 Raj and Attri (2011) TQM barriers
2 Parmod and Banwet (2010) Inhibitors of service supply chain
3 Singh and Kant (2008) Knowledge management barriers
4 Thakkar et al. (2008) Evaluation of supply chain relationships
5 Thakkar et al. (2007) Development of balanced scorecard (BSC) for a real life case company KVIC
6 Qureshi et al. (2007) Logistics outsourcing relationships
7 Faisal et al. (2007a) Supply chain agility enablers
8 Faisal et al. (2007b) Information risks management in supply chains
9 Singh et al. (2007) Advanced manufacturing technologies critical success factors
10 Raj et al. (2007) Flexible manufacturing system enablers
11 Agarwal et al. (2006) Agility of supply chain
12 Faisal et al. (2006) Supply chain risk mitigation
13 Ravi et al. (2005) Productivity improvement of a computer hardware supply chain
14 Ravi and Shankar (2005) Reverse logistics barriers
15 Jharkharia and Shankar (2005) IT enablement in supply chain barriers
16 Bolanos et al. (2005) Decision making process
17 Jharkharia and Shankar (2004) IT enablement in supply chain enablers
18 Singh et al. (2003) Knowledge management in engineering industries
19 Sharma et al. (1995) Waste management in India
20 Mandal and Deshmukh (1994) Vendor selection
21 Saxena et al. (1992) Energy conservation in Indian cement industries
22 Saxena et al. (1990) Energy conservation
Int J Syst Assur Eng Manag
123

Following the above rules, the initial reachability matrix
is prepared and is shown in Table 6.
1*entries are included to incorporate transitivity to fill
the gap, if any, in the opinion collected during development
of structural self-instructional matrix. After incorporating
the transitivity concept as described above, the final
reachability matrix is obtained and is presented in Table 7.
4.3 Partitioning the reachability matrix
The matrix is partitioned, by assessing the reachability and
antecedent sets for each variable (Warfield 1974). The
reachability set consists of the element itself and other
elements, which it may help to achieve, whereas the
antecedent set consists of the element itself and other
elements, which may help achieving it. Thereafter the
intersection of these sets is derived for all the elements.
The elements for which the reachability and the intersec-
tion sets are the same occupy the top level in the ISM
hierarchy. The top-level element in the hierarchy would not
help achieve any other element above its own level. Once
the top-level element is identified, it is separated out from
the other elements. Then, the same process is repeated to
find out the elements in the next level. This process is
continued until the level of each element is found. These
levels help in building the diagraph and the ISM model. In
Table 5 Structural self-
interactive matrix (SSIM)Enablers 10 9 8 7 6 5 4 3 2
1 V V V V X V V V V
2 O V V V A A V V
3 A A A A A A A
4 O O A A A A
5 V V V V A
6 V V O O
7 O X V
8 X O
9 O
Table 6 Initial reachability
matrixEnablers 1 2 3 4 5 6 7 8 9 10
1 1 1 1 1 1 1 1 1 1 1
2 0 1 1 1 0 0 1 1 1 0
3 0 0 1 0 0 0 0 0 0 0
4 0 0 1 1 0 0 0 0 0 0
5 0 1 1 1 1 0 1 1 1 1
6 1 1 1 1 1 1 0 0 1 1
7 0 0 1 1 0 0 1 1 1 0
8 0 0 1 1 0 0 0 1 0 1
9 0 0 1 0 0 0 1 0 1 0
10 0 0 1 0 0 0 0 1 0 1
Table 7 Final reachability
matrixEnablers 1 2 3 4 5 6 7 8 9 10
1 1 1 1 1 1 1 1 1 1 1
2 0 1 1 1 0 0 1 1 1 1*
3 0 0 1 0 0 0 0 0 0 0
4 0 0 1 1 0 0 0 0 0 0
5 0 1 1 1 1 0 1 1 1 1
6 1 1 1 1 1 1 1* 1* 1 1
7 0 0 1 1 0 0 1 1 1 1*
8 0 0 1 1 0 0 0 1 0 1
9 0 0 1 1* 0 0 1 1* 1 0
10 0 0 1 1* 0 0 0 1 0 1
Int J Syst Assur Eng Manag
123

the present case, the ten enablers, along with their reach-
ability set, antecedent set, intersection set and levels, are
presented in Tables 8, 9, 10, 11, 12, 13, 14.
4.4 Development of conical matrix
In this step, a conical matrix is developed by clubbing
together enablers in the same level, across rows and col-
umns of the final reachability matrix (Table 15).
4.5 Development of digraph and ISM model
On the basis of conical matrix, an initial digraph including
transitivity links is obtained. It is generated by nodes and
lines of edges. After removing the indirect links, a final
digraph is developed (Fig. 3). In this development, the top
level enabler is positioned at the top of the digraph and
second level enabler is placed at second position and so on,
until the bottom level is placed at the lowest position in the
digraph. Next, the digraph is converted into an ISM model
by replacing nodes of the elements with statements as
shown in Fig. 4.
5 MICMAC analysis
Matrice d’Impacts croises-multiplication applique an
classment (cross-impact matrix multiplication applied to
Table 8 Iteration 1Enablers Reachability set Antecedent set Intersection set Level
1 1,2,3,4,5,6,7,8,9,10 1,6 1,6
2 2,3,4,7,8,9,10 1,2,5,6 2
3 3 1,2,3,4,5,6,7,8,9,10 3 I
4 3,4 1,2,4,5,6,7,8,9,10 4
5 2,3,4,5,7,8,9,10 1,5,6 5
6 1,2,3,4,5,6,7,8,9,10 1,6 1,6
7 3,4,7,8,9,10 1,2,5,6,7,9 7,9
8 3,4,8,10 1,2,5,6,7,8,9,10 8,10
9 3,4,7,8,9 1,2,5,6,7,9 7,9
10 3,4,8,10 1,2,5,6,7,8,10 8,10
Table 9 Iteration 2Enablers Reachability set Antecedent set Intersection set Level
1 1,2,4,5,6,7,8,9,10 1,6 1,6
2 2,4,7,8,9,10 1,2,5,6 2
4 4 1,2,4,5,6,7,8,9,10 4 II
5 2,4,5,7,8,9,10 1,5,6 5
6 1,2,4,5,6,7,8,9,10 1,6 1,6
7 4,7,8,9,10 1,2,5,6,7,9 7,9
8 4,8,10 1,2,5,6,7,8,9,10 8,10
9 4,7,8,9 1,2,5,6,7,9 7,9
10 4,8,10 1,2,5,6,7,8,10 8,10
Table 10 Iteration 3Enablers Reachability set Antecedent set Intersection set Level
1 1,2,5,6,7,8,9,10 1,6 1,6
2 2,7,8,9,10 1,2,5,6 2
5 2,5,7,8,9,10 1,5,6 5
6 1,2,5,6,7,8,9,10 1,6 1,6
7 7,8,9,10 1,2,5,6,7,9 7,9
8 8,10 1,2,5,6,7,8,9,10 8,10 III
9 7,8,9 1,2,5,6,7,9 7,9
10 8,10 1,2,5,6,7,8,10 8,10 III
Int J Syst Assur Eng Manag
123

classification) is abbreviated as MICMAC. The purpose of
MICMAC analysis is to analyze the drive power and
dependence power of enablers. MICMAC principle is
based on multiplication properties of matrices (Sharma
et al. 1995). It is done to identify the key enablers that drive
the system in various categories. Based on their drive
power and dependence power, the enablers, have been
classified into four categories as follows:
• Autonomous enablers: These enablers have weak drive
power and weak dependence power. They are relatively
disconnected from the system, with which they have
few links, which may be very strong.
Table 11 Iteration 4
Enablers Reachability
set
Antecedent
set
Intersection
set
Level
1 1,2,5,6,7,9 1,6 1,6
2 2,7,9 1,2,5,6 2
5 2,5,7,9 1,5,6 5
6 1,2,5,6,7,9 1,6 1,6
7 7,9 1,2,5,6,7,9 7,9 IV
9 7,9 1,2,5,6,7,9 7,9 IV
Table 12 Iteration 5
Enablers Reachability
set
Antecedent
set
Intersection
set
Level
1 1,2,5,6 1,6 1,6
2 2 1,2,5,6 2 V
5 2,5 1,5,6 5
6 1,2,5,6 1,6 1,6
Table 13 Iteration 6
Enablers Reachability
set
Antecedent
set
Intersection
set
Level
1 1,5,6 1,6 1,6
5 5 1,5,6 5 VI
6 1,5,6 1,6 1,6
Table 14 Iteration 7
Enablers Reachability
set
Antecedent
set
Intersection
set
Level
1 1,6 1,6 1,6 VII
6 1,6 1,6 1,6 VII
Table 15 Conical matrix
Enablers 3 4 9 8 10 7 2 5 1 6 Driver power
3 1 0 0 0 0 0 0 0 0 0 1
4 1 1 0 0 0 0 0 0 0 0 2
9 1 1 1 1 0 1 0 0 0 0 5
8 1 1 0 1 1 0 0 0 0 0 4
10 1 1 0 1 1 0 0 0 0 0 4
7 1 1 1 1 1 1 0 0 0 0 6
2 1 1 1 1 1 1 1 0 0 0 7
5 1 1 1 1 1 1 1 1 0 0 8
1 1 1 1 1 1 1 1 1 1 1 10
6 1 1 1 1 1 1 1 1 1 1 10
Dependence power 10 9 6 8 7 6 4 3 2 2
Fig. 3 Digraph showing levels of TPM enablers
Int J Syst Assur Eng Manag
123

• Linkage enablers: These enablers have strong drive
power as well as strong dependence power. They
enablers are unstable in the fact that any action on these
enablers will have a effect on others and also a
feedback effect on themselves.
• Dependent enablers: These enablers have weak drive
power but strong dependence power.
• Independent enablers: These enablers have strong drive
power but weak dependence power. An enabler with a
very strong drive power, called the ‘key enabler’ falls
into the category of independent or linkage enablers.
This classification is similar to that by Mandal and
Deshmukh (1994). The drive power and dependence power
of enablers is shown in Table 15. The drive power-
dependence power diagram is drawn as shown in Fig. 5.
This Figure has been divided into four clusters. First cluster
includes ‘autonomous enablers’, second cluster includes
‘dependent enablers’, third cluster includes ‘linkage ena-
blers’ and fourth cluster contains ‘independent enablers’.
6 Conclusion and discussion
The major objective of this paper is to identify the enablers
that significantly affect the successful implementation of
TPM in any industry so that management may successfully
implement TPM in their organizations. In this paper, an
ISM-based model has been developed to analyze the
interactions among different TPM enablers. It identifies
the key enablers on which management should focus for
the successful implementation of TPM.
The driver dependence diagram helps to classify various
enablers of TPM implementation. There are no variables in
the autonomous cluster, which indicates no variable can be
considered as disconnected from the whole system and the
management has to pay an attention to all the identified
enablers of TPM implementation.
The next cluster consists of dependent variables like
cultural change, total employee involvement, empowerment
Cultural change
Coordination
Total employee involvement
Empowerment & Encouragement
CooperationMotivation
Communication
Training & Education
Top management commitment & Support
Integration of TPM goals & objectives into business
plans
Fig. 4 Interpretive structural model showing levels of TPM Enablers
Driving Power 10 1,6
9
8 IV 5 III
7 2
6 7
5 9
4 10 8
3 I II
2 4
1 3
1 2 3 4 5 6 7 8 9 10
Dependence power
Fig. 5 Clusters of enablers in
the implementation of TPM
Int J Syst Assur Eng Manag
123

and encouragement, cooperation and coordination. In this
particular cluster, these variables have the least driving
power and have highest dependence and form the topmost
level in the ISM hierarchy. They represent those variables
that are resultant actions for effective implementation of
TPM. The managers should take special care for handling
these enablers.
The next cluster consists of those variables that are
termed as linkage variables like motivation which is
influenced by lower level variables and in turn impacts
other variables in the ISM model. The management should
motivate their employee by empowerment. The employees/
operators should be encouraged for participating TPM
activities. Besides this, management should introduce
reward schemes from time to time to motivate the
employees which will boost the employee’s willingness to
participate in TPM activities.
The last cluster includes independent variables like top
management commitment and support, communication,
training and education and integration of TPM goals and
objectives into business plans. These variables have strong
driving power and weak dependency on other enablers.
They may be treated as the ‘key enablers’ for the successful
implementation of TPM. Management should communi-
cate the concepts, principles of TPM to its entire employee
by forming the policies and through training and education.
To apply TPM concepts successfully to plant-maintenance
activities, the entire workforce must first be convinced that
the top-level management is committed to the programme.
The senior management team should set company-wide
PM policies. The middle management must oversee the
departmental polices and goal-setting and departmental PM
promotional committees. The shop-floor management
should set the PM goals according to team groups’ activ-
ities. Along with this, management should integrate goals
and objectives of TPM into business plans.
The ISM model developed in this paper acts as a tool for
top management to understand/identify the key enablers of
TPM implementation. This model has been developed on
the basis of consensus of experts (both from industry and
academia), the results are quite generic and helpful for top
management to steer efforts towards the successful
implementation of TPM.
Finally, it would be useful to suggest the direction of
future research in this area. In this research, through ISM, a
relationship model among the enablers has been developed.
But this model has not been statistically validated. The
present model can be statistically tested with use of
SEMwhich has the ability to test the validity of such
models. It is, therefore, very interesting to compare ISM
and SEM techniques. SEM can statistically validate an
already developed model but cannot prepare an initial
model, whereas ISM has the capability to provide such an
initial model. Hence due to the complementary nature of
both the techniques, future research may be directed to test
the validity of the proposed ISM model by using the SEM
technique.
References
Agarwal A, Shankar R, Tiwari MK (2006) Modeling agility of supply
chain. Ind Mark Manag 36:443–457
Agyris C (1998) Empowerment: the emperor’s new clothes. Harvard
Bus Rev 76(3):98–105
Ahuja IPS, Khamba JS (2008a) Strategies and success factors for
overcoming challenges in TPM implementation in Indian
manufacturing industry. J Qual Maint Eng 14(2):123–147
Ahuja IPS, Khamba JS (2008b) Total productive maintenance:
literature review and directions. Int J Qual Reliab Manag
25(7):709–756
Badiru AB, Schlegel RE (1994) Project management in computer-
integrated manufacturing implementation. In: Karwowski W,
Salvendy G (eds) Organization and management of advanced
manufacturing. Wiley, New York, pp 255–279
Bamber CJ, Sharp JM, Hides M (1999) Factors affecting successful
implementation of total productive maintenance: a UK manu-
facturing case study perspective. J Qual Maint Eng 5(3):162–181
Banwet DK, Arora R (1999) Enablers and inhibitors of e-commerce
implementation in India-an interpretive structural modelling
(ISM) approach. In: Kanda A et al (eds) Operations management
for global economy challenges and prospects. Phoenix, New
Delhi, pp 332–341
Blanchard BS (1997) An enhanced approach for implementing total
productive maintenance in the manufacturing environment.
J Qual Maint Eng 3(2):69–80
Bolanos R, Fontela E, Nenclares A, Paster P (2005) Using interpretive
structural modeling in strategic decision making groups. Manag
Decis 43(6):877–895
Chan FTS, Lau HCW, Ip RWL, Chan HK, Kong S (2005)
Implementation of total productive maintenance: a case study.
Int J Prod Econ 95:71–94
Chen F (1997) Issue in the continuous improvement process for
preventive maintenance: observations from Honda, Nippondenso
and Toyota. Prod Inventory Manag J 38(4):13–16
Chidambaranathan S, Muralidharan C, Deshmukh SG (2009) Ana-
lyzing the interaction of critical factors of supplier development
using Interpretive Structural Modeling: an empirical study. Int J
Adv Manuf Technol 43:1081–1093
Coetzee JL (1999) A holistic approach to the maintenance problem.
J Qual Maint Eng 5(3):276–280
Dal B, Tugwell P, Greatbanks R (2000) Overall equipment
effectiveness as a measure for operational improvement. Int J
Oper Prod Manag 20(12):1488–1502
Davis R, Willmott P (1999) Total productive maintenance. Alden
Press, Oxford
Eti MC, Ogaji SOT, Probert SD (2004) Implementing total productive
maintenance in Nigerian manufacturing firms. App Energy
79:385–401
Faisal MN, Banwat DK, Shankar R (2006) Supply chain risk
mitigation: modeling the enablers. Buss Process Manag J
12(4):532–552
Faisal MN, Banwat DK, Shankar R (2007a) Supply chain agility:
analysing the enablers. Int J Agile Syst Manag 2(1):76–91
Faisal MN, Banwat DK, Shankar R (2007b) Information risks
management in supply chain: an assessment and mitigation
framework. J Enterp Inf Manag 20(6):677–699
Int J Syst Assur Eng Manag
123

Farris DR, Sage AP (1974) On the use of interpretive structural
modeling for worth assessment. Comp Electr Eng 2:149–174
Georgakopoulos A (2009) Teacher effectiveness examined as a
system: interpretive modelling and facilitation sessions with U.S.
and Japanese students. Int Edu Stud 2(3):60–76
Jeszenka RJ (1993) Breaking through the resistance: achieving TQM
in maintenance. Plant Eng 47:132–133
Jharkharia S, Shankar R (2004) IT-enablement of supply chains:
modelling the enablers. Int J Productivity Perform Manag
53(8):700–712
Jharkharia S, Shankar R (2005) IT-enablement of supply chains:
understanding the barriers. J Enterp Inform Manag 18(1):11–27
Jonsson P, Lesshammar M (1999) Evaluation and improvement of
manufacturing performance measurement systems: the role of
OEE. Int J Oper Prod Manag 19(1):55–78
Lawrence JJ (1999) Use mathematical modelling to give your TPM
implementation effort an extra boost. J Qual Maint Eng
5(1):62–69
Li WL, Humphreys P, Chan LY, Kumaraswamy M (2003) Predicting
purchasing performance: the role of supplier development
programs. J Mater Process Technol 138(1–3):243–249
Maggard BN, Rhyne DM (1992) Total productive maintenance: a
timely integration of production and maintenance. Prod Inven-
tory Manag J 33(4):6–10
Malhotra MK, Grover V (1998) An assessment of survey research in
POM: from constructs to theory. J Oper Manag 16(4):407–425
Mandal A, Deshmukh SG (1994) Vendor selection using interpretive
structural modeling (ISM). Int J Oper Prod Manag 14(6):52–59
Moore R (1997) Combining TPM and reliability-focused mainte-
nance. Plant Eng 51(6):88–90
Mora E (2002) The right ingredients for a successful TPM or lean
implementation. Available at: www.tpmonline.com
Nakajima S (1988) Total productive maintenance. Productivity Press,
London
Nakajima S (1989) TPM development program: implementing total
productive maintenance. Productivity Press, Cambridge
Paneerselvam R (2010) Production and operations management, PHI
learning Private limited
Park KS, Han SW (2001) TPM-total productive maintenance: impact
on competitiveness and a framework for successful implemen-
tation. Hum Factor Ergonomics Manuf 11(4):321–338
Parmod VR, Banwet DK (2010) ISM for the inhibitors of service
supply chain: a case study in a safety health environment and
risk consultancy health centre. Int J Logis Eco Glob
2(2):151–175
Patterson JW, Kennedy WJ, Fredendall LD (1995) Total productive
maintenance is not for this company. Prod Inventory Manag J
36(2):61–64
Patterson JW, Fredendall LD, Kennedy WJ, McGee A (1996)
Adapting total productive maintenance to Asten, Inc. Prod
Inventory Manag J 37(4):32–36
Qureshi MN, Kumar D, Kumar P (2007) Modeling the logistics
outsourcing relationships variables to enhance shippers produc-
tivity and competitiveness in logistics supply chain. Int J Prod
Perform Manag 56(8):689–714
Raj T, Attri R (2011) Identification and modelling of barriers in the
implementation of TQM. Int J Prod Qual Manag 28(2):153–179
Raj T, Shankar R, Suhaib M (2007) An ISM approach for modeling
the enablers of flexible manufacturing system: the case for India.
Int J Prod Res 1–30
Rajesh KS, Suresh KG, Deshmukh SG (2007) Interpretive structural
modelling of factors for improving competitiveness of SMEs. Int
J Prod Qual Manag 2(4):423–440
Ravi V, Shankar R (2005) Analysis of interactions among the barriers
of reverse logistics. Technol Forecast Soc Change 72:1011–1029
Ravi V, Shankar R, Tiwari MK (2005) Productivity improvement of a
computer hardware supply chain. Int J Prod Perform Meas
54(4):239–255
Sage AP (1977) Interpretive structural modeling: methodology for
large scale systems. McGraw-Hill, New York
Saxena JP, Sushil VP, Vrat P (1990) The impact of indirect
relationships in classification of variables: a MICMAC analysis
for energy conservation. Syst Res 7(4):245–253
Saxena JP, Sushil, Vrat P (1992) Scenario building: a critical study of
energy conservation in the Indian cement industry. Technol
Forecast Soc Change 41(2):121–146
Schumacker RE, Lomax RG (1996) A beginner’s guide to structural
equation modelling. Lawrence Erlbaum Associates, Pittsburgh
Sharma HD, Gupta AD, Sushil (1995) The objectives of waste
management in India: a future inquiry. Technol Forecast Soc
Change 48:285–309
Sharma RK, Kumar D, Kumar P (2005) FLM to select suitable
maintenance strategy in process industries using MISO model.
J Qual Maint Eng 11(4):359–374
Singh MD, Kant R (2008) Knowledge management barriers: an
interpretive structural modelling approach. Int J Manag Sci Eng
Manag 3(2):141–150
Singh MD, Shankar R, Narain R, Agarwal A (2003) An interpretive
structural modeling of knowledge management in engineering
industries. J Adv Manag Res 1(1):28–40
Singh RK, Garg SK, Deshmukh SG, Kumar M (2007) Modeling of
critical success factors for implementation of AMTs. J Model
Manag 2(3):232–250
Swanson L (1997) An empirical study of the relationship between
production technology and maintenance management. Int J Prod
Econ 53(2):191–207
Thakkar J, Deshmukh SG, Gupta AD, Shankar R (2007) Development
of score card: an integrated approach of ISM and ANP. Int J Prod
Perform Manag 56(1):25–59
Thakkar J, Kanda A, Deshmukh SG (2008) Evaluation of buyer-
supplier relationships using an integrated mathematical approach
of interpretive structural modeling (ISM) and graph theoretic
approach. J Manuf Technol Manag 19(1):92–124
Thiagarajan T, Zairi M (1997) A review of total quality management
in practice: understanding the fundamentals through examples of
best practice applications: Part 1. TQM Mag 9(4):270–286
Tsang AHC, Chan PK (2000) TPM implementation in China: a case
study. Int J Qual Reliab Manag 17(2):144–157
Tsang AHC, Jardine AKS, Cambell JD, Picknell JV (2000) Reliabil-
ity-centred maintenance: a key to maintenance excellence. Hong
Kong: City University of Hong Kong (internet publication)
Tsuchiya S (1992) Quality maintenance: zero defects through
equipment management. Productivity Press, Oregon
Turbide DA (1995) Japan’s new advantage: total productive main-
tenance. Qual Prog 28(3):121–123
Venkatesh V (2007) An introduction to Total productive maintenance
(TPM). Available at: www.plant-maintenance.com
Warfield JW (1974) Developing interconnected matrices in structural
modelling. IEEE Transac Syst Men Cyber 4(1):51–81
Wisner JD (2003) A structural equation model of supply chain
management strategies and firm performance. J Bus Logist
24(1):1–26
Yu J, Cooper H (1983) A quantitative review of research design
effects on response rates to questionnaires. J Mark Res 36:36–44
Int J Syst Assur Eng Manag
123


