
© Center for Energy Economics
No reproduction, distribution or attribution without permission.
INTRODUCTION TO LNG
An overview on liquefied natural gas (LNG), its properties, the LNG industry,
and safety considerations
Michelle Michot Foss, Ph.D.
Chief Energy Economist and CEE Head
1801 Allen Parkway
Houston, Texas 77019
Tel 713-654-5400 Fax 713-654-5405
www.beg.utexas.edu/energyecon/lng
June 2012
Introduction to LNG - 2 -
Table of Contents INTRODUCTION TO LNG ................................................................................ 1
EXECUTIVE SUMMARY ................................................................................... 3
Introduction ................................................................................................. 5
Overview ..................................................................................................... 6
What Is LNG? ............................................................................................ 6
Does the U.S. Need LNG? ............................................................................ 8
Is LNG a Competitive Source of Natural Gas? ................................................. 9
Brief History of LNG .................................................................................. 10
Composition of Natural Gas and LNG .......................................................... 14
The LNG Value Chain ................................................................................ 15
How Much Does LNG Cost? ........................................................................ 21
Is LNG a Safe Fuel? .................................................................................. 26
APPENDIX 1: CONVERSION TABLE ................................................................ 32
APPENDIX 2: OTHER FUEL TERMINOLOGIES ................................................... 33
APPENDIX 3: GLOSSARY OF TERMS, .............................................................. 36

Introduction to LNG - 3 -
INTRODUCTION TO LNG1
EXECUTIVE SUMMARY This briefing paper is the first in a series of articles that describe the liquefied natural gas (LNG) industry and the growing role LNG may play in the U.S. energy future. This paper’s first edition was published in January 2003. It introduces the reader to LNG and briefly touches on many of the topics relating to the LNG industry. The second and third papers, LNG Safety and Security and The Role of LNG in North American Natural Gas Supply and Demand, followed in October 2003 and September 2004 accordingly. All of these reports, with supplemental information, were compiled in a complete online fact book, Guide to LNG in North America, www.beg.utexas.edu/energyecon/lng.
LNG is the liquid form of the natural gas people use in their homes for cooking and heating. To engage in international LNG trade, energy companies must invest in the LNG value chain, which is a number of different operations that are highly linked and dependent upon one another. Natural gas can be economically produced and delivered to the U.S. as LNG within a price range of about $2.50-3.50 to $4.50-5.50 per million Btu (MMBtu) at Henry Hub in Louisiana, depending largely on shipping cost. (Please refer to APPENDIX 1: CONVERSION TABLE for information on units and measure used in our papers.)
LNG has been safely handled for many years. The industry is not without incidents but it has maintained an enviable safety record, especially over the last 40 years. Worldwide, there are 25 LNG export (liquefaction) terminals, 91 import (regasification) terminals, and 360 LNG ships altogether handling approximately 220 million metric tons of LNG every year. LNG is also used for domestic storage and delivery. There are currently about 260 peakshaving and LNG storage facilities worldwide, some operating since the mid-60s. The U.S. has the largest number of LNG facilities in the world. There are 121 active LNG facilities spread across the U.S. with a higher concentration of the peakshaving and storage facilities located in the northeastern region.
The need for additional natural gas supplies during the late 1990s-2000 time frame, including the reopening of existing LNG facilities at Cove Point, Maryland and Elba Island, Georgia focused public attention on the safety and security of LNG import facilities. The safe and environmentally sound operation of these facilities, both ships and terminals, and the protection of these facilities from terrorist activities or other forms of accident or injury are a concern and responsibility shared by operators as well as federal, state, and local jurisdictions across the U.S. Onshore
1 This publication was supported by a research consortium, Commercial Frameworks for LNG in North America. Sponsors of the consortium were BP Energy Company-Global LNG, BG LNG Services, ChevronTexaco Global LNG, Shell Gas & Power, ConocoPhillips Worldwide LNG, El Paso Global LNG, ExxonMobil Gas Marketing Company, Tractebel LNG North America/Distrigas of Massachusetts. The U.S. Department of Energy-Office of Fossil Energy provides critical support and the Ministry of Energy and Industry, Trinidad & Tobago participates as an observer. The report was prepared by CEE researchers Michelle Michot Foss, Fisoye Delano, Gürcan Gülen, and Dmitry Volkov. Peer reviews were provided by university faculty colleagues and outside experts.
Introduction to LNG - 4 -
LNG import facilities are industrial sites and, as such, are subject to all rules, regulations and environmental standards imposed by the various jurisdictions. These same or similar concerns apply to natural gas storage, pipeline transportation and distribution, and our daily use of natural gas as customers and consumers.

Introduction to LNG - 5 -
INTRODUCTION This briefing paper is the first in a series of articles that describe the liquefied
natural gas (LNG) industry – technology, markets, safety, security and
environmental considerations and the growing role LNG may play in the nation’s
energy future. This paper also introduces the reader to LNG and briefly touches on
many of the topics relating to the LNG industry. The second paper, LNG Safety
and Security, deals with the safety and security aspects of LNG operations in more
detail. A third paper, The Role of LNG in North American Natural Gas Supply
and Demand provides an in-depth analysis of why additional LNG will be needed to
meet U.S. energy demand in the near future. All three papers, plus supplemental
information, are included in a complete fact book, Guide to LNG in North
America.
LNG is the liquid form of the natural gas people use in their homes for cooking and
heating. Natural gas is also used as fuel for generating electricity. Natural gas and
its components are used as raw material to manufacture a wide variety of products,
from fibers for clothing, to plastics for healthcare, computing, and furnishings.
Natural gas makes up about one-fourth of all energy consumed in the United States
each year. The most common use of LNG in the U.S. is for “peakshaving.”
Peakshaving is a way local electric power and gas companies store gas2 for peak
demand that cannot be met via their typical pipeline source. This can occur during
the winter heating season when cold fronts move through or when more natural gas
is needed to generate electric power for air conditioning in the summer months.
The utility companies liquefy pipeline gas when it is abundant and available at off-
peak prices, or they purchase LNG from import terminals supplied from overseas
liquefaction facilities. When gas demand increases, the stored LNG is converted
from its liquefied state back to its gaseous state, to supplement the utility’s pipeline
supplies. LNG is also currently being used as an alternative transportation fuel in
public transit and in vehicle fleets such as those operated by many local natural gas
utilities companies for maintenance and emergencies.
2 We use the term “gas” as shorthand for “natural gas.” In the U.S., we often refer to gasoline, the most heavily used vehicle transportation fuel, as “gas,” but gasoline is manufactured from crude oil, a different fossil fuel that is often found together with natural gas in underground reservoirs.
Introduction to LNG - 6 -
Natural gas comes from reservoirs beneath the earth’s surface. Sometimes it
occurs naturally and is produced by itself (non-associated gas), sometimes it comes
to the surface with crude oil (associated gas), and sometimes it is being produced
constantly such as in landfill gas. Subsurface natural gas is a fossil fuel, meaning
that it is derived from organic material deposited and buried in the earth millions of
years ago. Other fossil fuels are coal and crude oil. Together crude oil and gas
constitute a type of fossil fuel known as “hydrocarbons” because the molecules in
these fuels are combinations of hydrogen and carbon atoms.
The main component of natural gas is methane. Methane is composed of one
carbon and four hydrogen atoms (CH4). When natural gas is produced from the
earth, it includes many other molecules, like ethane (used for manufacturing),
propane (which we commonly use for backyard grills) and butane (used in lighters).
We can find natural gas in the U.S. and around the world by exploring for it in the
earth’s crust and then drilling wells to produce it. Natural gas can be transported
over long distances in pipelines or as LNG in ships across oceans. Natural gas can
be stored until needed in underground caverns and reservoirs or as LNG in
atmospheric tanks. Transportation of LNG by truck takes place in the United States
on a limited basis. Such transportation is more common in countries without a
national pipeline grid but truck transport could grow in the United States if LNG
niche markets, such as LNG vehicular fuel, expand
OVERVIEW
What Is LNG? Liquefied natural gas (LNG) is natural gas that has been cooled to the point that it
condenses to a liquid, which occurs at a temperature of approximately -256oF (-
161oC) and at atmospheric pressure. Liquefaction reduces the volume by
approximately 600 times3 thus making it more economical to transport between
continents in specially designed ocean vessels, whereas traditional pipeline
3 LNG production, shipping, and storage are generally reported in metric tons and cubic meters whereas natural gas is generally presented in standard cubic feet or standard cubic meters. One metric ton of LNG is equivalent to 48.7 thousand cubic feet of gas (Mcf). Note: exact conversion factor depends on gas molecular weight. A conversion table with more units is included in Appendix 1.
Introduction to LNG - 7 -
transportation systems would be less economically attractive and could be
technically or politically infeasible. Thus, LNG technology makes natural gas
available throughout the world.
To make LNG available for use in a country like the U.S., energy companies must
invest in a number of different operations that are highly linked and dependent
upon one another. The major stages of the LNG value chain, excluding pipeline
operations between the stages, consist of the following.
Exploration to find natural gas in the earth’s crust and production of the gas
for delivery to gas users. Most of the time natural gas is discovered during the
search for oil.
Liquefaction to convert natural gas into a liquid state so that it can be
transported in ships.
Shipping the LNG in special purpose vessels.
Storage and Regasification, to convert the LNG stored in specially made
storage tanks, from the liquefied phase to the gaseous phase, ready to be
moved to the final destination through the natural gas pipeline system.
Liquefaction also provides the opportunity to store natural gas for use during high
demand periods in areas where geologic conditions are not suitable for developing
underground storage facilities. In the northeastern part of the U.S., which is a
region lacking in underground storage, LNG is a critical part of the region’s supply
during cold snaps. In regions where pipeline capacity from supply areas can be
very expensive and use is highly seasonal, liquefaction and storage of LNG occurs
during off-peak periods in order to reduce expensive pipeline capacity commitments
during peak periods.4
4 EIA: U.S. LNG Markets and Uses. June 2004.
Introduction to LNG - 8 -
Does the U.S. Need LNG? The demand for natural gas in the U.S. was boosted in the 1980s in part by the
desire to diversify energy resources in the wake of global oil shocks5. Such demand
has continued due to the clear environmental advantages of natural gas over other
fossil fuels and its superior thermal efficiency when used in power generation. End
use customers in the U.S. (residential, commercial, industrial, electric power, and
vehicle transport) consumed about 22 trillion cubic feet or TCF of natural gas in
2011. Even with a rich domestic resource base and abundant supply, imported LNG
plays a key role in helping to balance supply and demand and address seasonal
swings.
Currently, LNG imports account for less than one percent of the total U.S.
consumption of natural gas. There are at least 121 active LNG facilities in the
United States, including marine terminals, storage facilities, and operations
involved in niche markets such as vehicular fuel as shown in the figure below. Most
of these facilities were constructed between 1965 and 1975 and were dedicated to
meeting the storage needs of local utilities. Approximately 55 local utilities own
and operate LNG plants as part of their distribution networks.6 Prior to 2002, four
marine import terminals existed in the continental U.S. Since 2002, eight new
import terminals (including three ship-based offshore systems) plus an onshore
terminal in Atlantic Canada and two in Mexico have been built and put into
operation, and three of the four original import terminals have been expanded.
Information on the U.S. terminals is provided by the U.S. Federal Energy
Regulatory Commission (FERC; http://www.ferc.gov/industries/gas/indus-
act/lng/exist-term.asp and http://www.ferc.gov/industries/gas/indus-act/lng/LNG-
existing.pdf for all North American terminals).
5 Schleede, Glenn R.: Why Would an Electric Utility Want to Increase Dependence on Natural Gas?, Contributed paper in The Case for Natural Gas: edited by Jacqueline Weaver, The Natural Gas Project, University of Houston, 1991. 6 EIA: U.S. LNG Markets and Uses. November 2002.

Introduction to LNG - 9 -
Figure 1. U.S. LNG Facilities7
Is LNG a Competitive Source of Natural Gas? Large reserves of natural gas have been found in areas for which there is no
significant market. Such hydrocarbon reserves are stranded in North and West
Africa (with significant new discoveries in Mozambique); South America and the
Caribbean (Trinidad & Tobago has been one of the most important exporting
countries to the United States); the Middle East (Qatar has become the largest
exporter worldwide); and Indonesia, Malaysia, Northwestern Australia and Alaska.
Natural gas is liquefied at these locations for shipping to countries where no
indigenous supply exists or where pipeline shipments are prohibitive (such as
Japan, Taiwan, Korea, and parts of Europe) and where seasonal or other needs are
7 Source: US LNG Markets and Users: June 2004 update. EIA, 2004. Available at http://www.eia.doe.gov/pub/oil_gas/natural_gas/feature_articles/2004/lng/lng2004.pdf
(12)
Introduction to LNG - 10 -
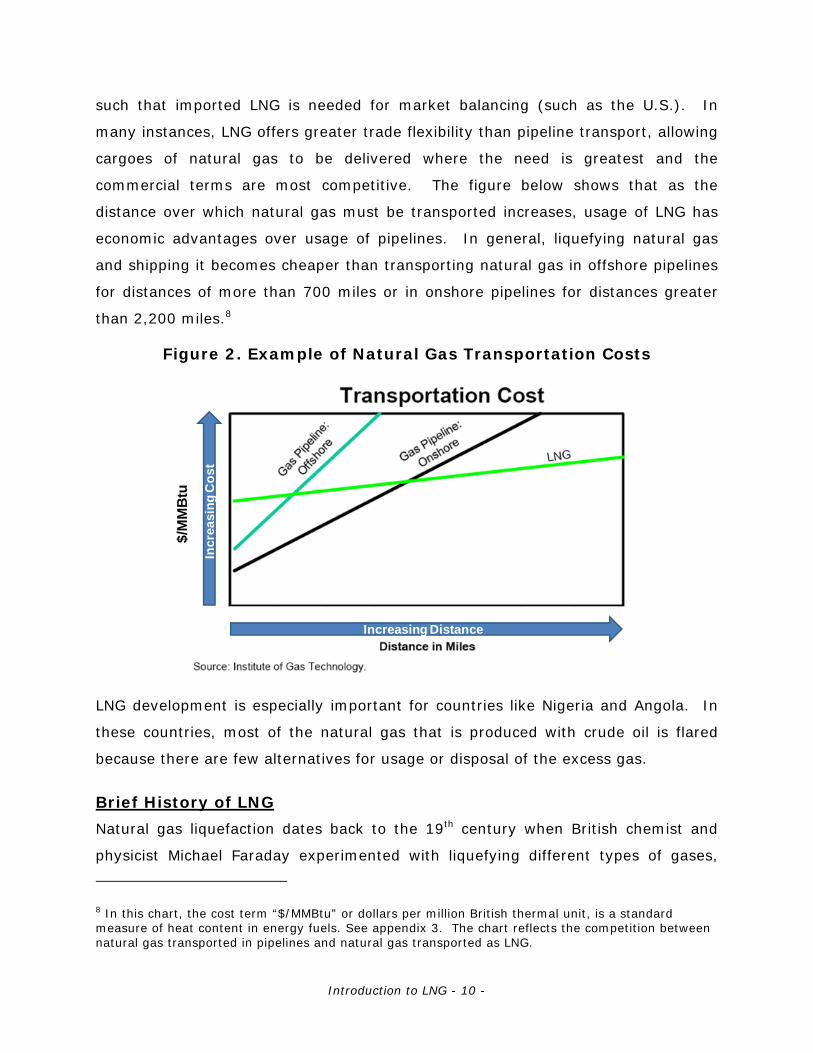
such that imported LNG is needed for market balancing (such as the U.S.). In
many instances, LNG offers greater trade flexibility than pipeline transport, allowing
cargoes of natural gas to be delivered where the need is greatest and the
commercial terms are most competitive. The figure below shows that as the
distance over which natural gas must be transported increases, usage of LNG has
economic advantages over usage of pipelines. In general, liquefying natural gas
and shipping it becomes cheaper than transporting natural gas in offshore pipelines
for distances of more than 700 miles or in onshore pipelines for distances greater
than 2,200 miles.8
Figure 2. Example of Natural Gas Transportation Costs
LNG development is especially important for countries like Nigeria and Angola. In
these countries, most of the natural gas that is produced with crude oil is flared
because there are few alternatives for usage or disposal of the excess gas.
Brief History of LNG Natural gas liquefaction dates back to the 19th century when British chemist and
physicist Michael Faraday experimented with liquefying different types of gases,
8 In this chart, the cost term “$/MMBtu” or dollars per million British thermal unit, is a standard measure of heat content in energy fuels. See appendix 3. The chart reflects the competition between natural gas transported in pipelines and natural gas transported as LNG.
Incr
easi
ng
Co
st
Increasing Distance
$/M
MB
tu
Introduction to LNG - 11 -
including natural gas. German engineer Karl Von Linde built the first practical
compressor refrigeration machine in Munich in 1873. The first commercial
liquefaction plant was built in Cleveland, Ohio, in 1941.9 The LNG was stored in
tanks at atmospheric pressure. The liquefaction of natural gas raised the possibility
of its transportation to distant destinations. In January 1959, the world's first LNG
tanker, The Methane Pioneer, a converted World War ll liberty freighter containing
five, 7000 Bbl aluminum prismatic tanks with balsa wood supports and insulation of
plywood and urethane, carried an LNG cargo from Lake Charles, Louisiana to
Canvey Island, United Kingdom. This event demonstrated that large quantities of
liquefied natural gas could be transported safely across the ocean.
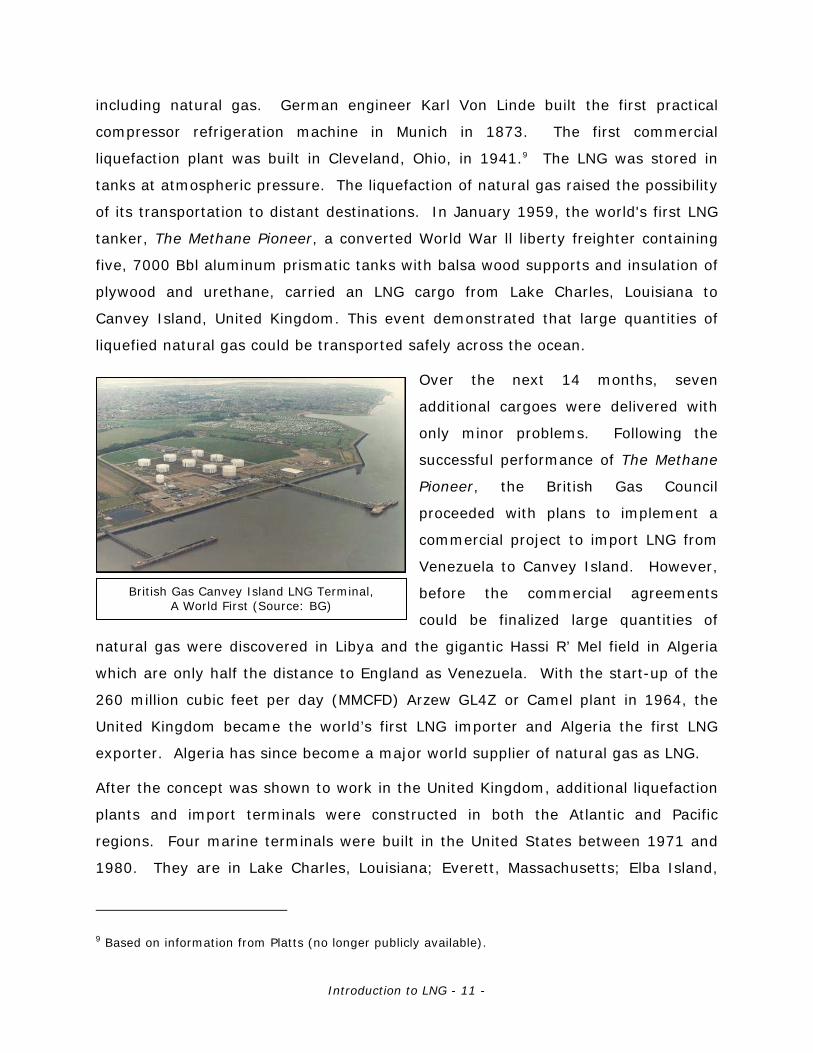
Over the next 14 months, seven
additional cargoes were delivered with
only minor problems. Following the
successful performance of The Methane
Pioneer, the British Gas Council
proceeded with plans to implement a
commercial project to import LNG from
Venezuela to Canvey Island. However,
before the commercial agreements
could be finalized large quantities of
natural gas were discovered in Libya and the gigantic Hassi R’ Mel field in Algeria
which are only half the distance to England as Venezuela. With the start-up of the
260 million cubic feet per day (MMCFD) Arzew GL4Z or Camel plant in 1964, the
United Kingdom became the world’s first LNG importer and Algeria the first LNG
exporter. Algeria has since become a major world supplier of natural gas as LNG.
After the concept was shown to work in the United Kingdom, additional liquefaction
plants and import terminals were constructed in both the Atlantic and Pacific
regions. Four marine terminals were built in the United States between 1971 and
1980. They are in Lake Charles, Louisiana; Everett, Massachusetts; Elba Island,
9 Based on information from Platts (no longer publicly available).
British Gas Canvey Island LNG Terminal, A World First (Source: BG)

Introduction to LNG - 12 -
Georgia; and Cove Point, Maryland. After reaching a peak receipt volume of 253
BCF (billion cubic feet) in 1979, which represented 1.3 percent of U.S. gas demand,
LNG imports declined because a gas surplus developed in North America and price
disputes occurred with Algeria, the sole LNG provider to the U.S. at that time. The
Elba Island and Cove Point receiving terminals were subsequently mothballed in
1980 and the Lake Charles and the Everett terminals suffered from very low
utilization.
The first exports of LNG from the U.S. to Asia occurred in 1969 when Alaskan LNG
was sent to Japan. Indeed, shipment of Alaskan natural gas in the form of LNG to
Tokyo Harbor established one of the premier LNG trade routes. Alaskan LNG is
derived from natural gas produced from fields in the southern portions of the state
of Alaska, liquefied at the Kenai Peninsula LNG plant (one of the oldest,
continuously operated LNG plants in the world), and shipped to Japan. In 1999, the
first Atlantic Basin LNG liquefaction plant in the western hemisphere came on
production in Trinidad. This event, coupled with an increase in demand for natural
gas in the U.S., particularly for power generation, and an increase in U.S. natural
gas prices resulted in a renewed interest in the U.S. market for LNG. As a result,
the two mothballed LNG receiving terminals were reactivated. Elba Island was
reactivated in 2001. In October 2002, the FERC gave approval to Dominion
Resources for its plans to re-open Cove Point LNG facility in 2003.
The figure below shows worldwide growth in LNG since 1970 (including the impact
of soft economic conditions worldwide since 2009).

Introduction to LNG - 13 -
Figure 3. Growth in LNG Global Demand
Strong U.S. natural gas price signals supported a wave of import terminal projects
through the late 2000s. These price signals also supported drilling activity and
success as new supplies were proved up. Proposals for exporting U.S. and
Canadian domestic production emerged in 2011 as supply, including new production
from shale basins, exceeded domestic demand. As of this 2012 update, one LNG
export facility in the U.S. has been approved (Sabine Pass, commissioned in 2008
as a new import terminal), five additional U.S. sights have been proposed, two
projects have been proposed in western Canada (British Columbia), and several
potential projects are under consideration.10 Natural gas development and use, and
10 All LNG project information from the U.S. Federal Energy Regulatory Commission (FERC). See http://www.ferc.gov/industries/gas/indus-act/lng.asp for information. The FERC certifies export facilities, just as it does import facilities. The U.S. Department of Energy (DOE) approves imports and exports of natural gas via pipeline and LNG.
-
50
100
150
200
250
300
MT
PA
Japan South Korea Spain FranceUSA Taiwan Italy TurkeyBelgium Greece Portugal India
Source: Cedigaz, BP Statistical Review of World Energy June 2011

Introduction to LNG - 14 -
LNG in the U.S., North America, and worldwide all look to be dynamic and
changing.11
Composition of Natural Gas and LNG Natural gas is composed primarily of methane, but may also contain ethane,
propane, and heavier hydrocarbons. Small quantities of nitrogen, oxygen, carbon
dioxide, sulfur compounds, and water may also be found in natural gas. The figure
below provides a typical natural gas composition.12
Figure 4. Typical Natural Gas Composition
The liquefaction process requires the removal of some of the non-methane
components such as water and carbon dioxide from the produced natural gas to
prevent them from forming solids when the gas is cooled to about LNG temperature
(-256OF). As a result, LNG is typically made up mostly of methane as shown in the
figure below.
11 CEE researchers are producing new papers and analysis of natural gas market conditions. See Foss, Michelle Michot, The Outlook for U.S. Gas Prices in 2020: Henry Hub at $3 or $10?, 2011, http://www.oxfordenergy.org/2011/12/the-outlook-for-u-s-gas-prices-in-2020-henry-hub-at-3-or-10/ and Foss, United States Natural Gas Prices to 2015, 2007, http://www.oxfordenergy.org/2007/02/united-states-natural-gas-prices-to-2015/. For more information on other CEE research on natural gas and LNG contact us at [email protected]. 12 Danesh, Ali: PVT and Phase Behavior of Petroleum Reservoir Fluids, Elsevier, 1998.
Methane82%
Other19%
Carbon Dioxide
Propane
Butane
Pentane
Nitrogen
Ethane

Introduction to LNG - 15 -
Figure 5. Typical LNG Composition
Examples of LNG composition are shown below.
Figure 6. LNG Composition (Mole Percent)
LNG is odorless, colorless, non-corrosive, and non-toxic. However, as with any
gaseous material besides air and oxygen, the natural gas vaporized from LNG can
cause asphyxiation in an unventilated confinement.
APPENDIX 2: OTHER FUEL TERMINOLOGIES explains the differences between LNG
and other products used in the industry such as Natural Gas Liquids (NGLs),
Compressed Natural Gas (CNG), Liquefied Petroleum Gas (LPG) and Gas-to-Liquids
(GTL).
The LNG Value Chain As noted previously, the LNG value chain is composed of large scale, complex
segments. A logistics supply chain is constituted by the discreet functions of finding
Others 5%
Methane
95%
Source Methane Ethane Propane Butane Nitrogen
Alaska 99.72 0.06 0.0005 0.0005 0.20
Algeria 86.98 9.35 2.33 0.63 0.71
Baltimore Gas & Electric 93.32 4.65 0.84 0.18 1.01
New York City 98.00 1.40 0.40 0.10 0.10
San Diego Gas & Electric 92.00 6.00 1.00 - 1.00
Source: Liquid Methane Fuel Characterization and Safety Assessment Report . Cryogenic Fuels. Inc. Report No. CFI-1600, Dec. 1991
LNG COMPOSITION (Mole Percent)
Introduction to LNG - 16 -
Source: BGSource: BG
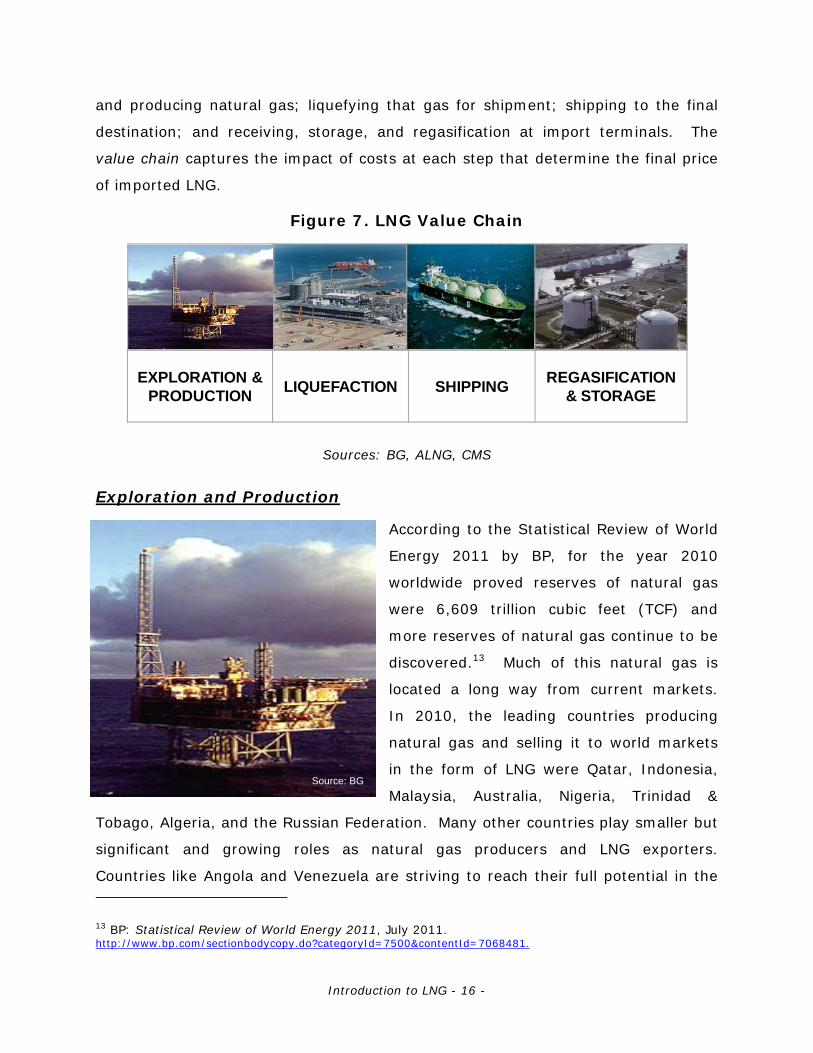
and producing natural gas; liquefying that gas for shipment; shipping to the final
destination; and receiving, storage, and regasification at import terminals. The
value chain captures the impact of costs at each step that determine the final price
of imported LNG.
Figure 7. LNG Value Chain
Sources: BG, ALNG, CMS
Exploration and Production
According to the Statistical Review of World
Energy 2011 by BP, for the year 2010
worldwide proved reserves of natural gas
were 6,609 trillion cubic feet (TCF) and
more reserves of natural gas continue to be
discovered.13 Much of this natural gas is
located a long way from current markets.
In 2010, the leading countries producing
natural gas and selling it to world markets
in the form of LNG were Qatar, Indonesia,
Malaysia, Australia, Nigeria, Trinidad &
Tobago, Algeria, and the Russian Federation. Many other countries play smaller but
significant and growing roles as natural gas producers and LNG exporters.
Countries like Angola and Venezuela are striving to reach their full potential in the
13 BP: Statistical Review of World Energy 2011, July 2011. http://www.bp.com/sectionbodycopy.do?categoryId=7500&contentId=7068481.
EXPLORATION &PRODUCTION
LIQUEFACTION SHIPPINGREGASIFICATION
& STORAGE

Introduction to LNG - 17 -
Source: ALNGSource: ALNG
global LNG marketplace, and countries like Saudi Arabia and Iran, that have vast
reserves of natural gas, could also participate as LNG exporters. As mentioned
above, new export projects in the U.S. and Canada are planned. Some of these
may enter operation as early as 2015.
LNG Liquefaction
Feed gas to the liquefaction plant comes
from the production field. The
contaminants found in produced natural
gas are removed to avoid freezing up and
damaging equipment when the gas is
cooled to LNG temperature (-256oF) and to
meet pipeline specifications at the delivery
point. The liquefaction process can be
designed to purify the LNG to almost 100 percent methane.
The liquefaction process entails cooling the clean feed gas by using refrigerants.
The liquefaction plant may consist of several parallel units (“trains”). The natural
gas is liquefied for shipping at a temperature of approximately -256oF. By
liquefying the gas, its volume is reduced by a factor of 600, which means that LNG
at -256oF uses 1/600th of the space required for a comparable amount of gas at
room temperature and atmospheric pressure.
LNG is a cryogenic liquid. The term “cryogenic” means low temperature, generally
below -100oF. LNG is clear liquid, with a density of about 45 percent the density of
water.
The LNG is stored in double-walled tanks at atmospheric pressure. The storage
tank is really a tank within a tank. The annular space between the two tank walls is
filled with insulation. The inner tank, in contact with the LNG, is made of materials
suitable for cryogenic service and structural loading of LNG. These materials
include 9 percent nickel steel, aluminum, and pre-stressed concrete. The outer
tank is generally made of carbon steel or pre-stressed concrete.
Introduction to LNG - 18 -
Source: BGSource: BG
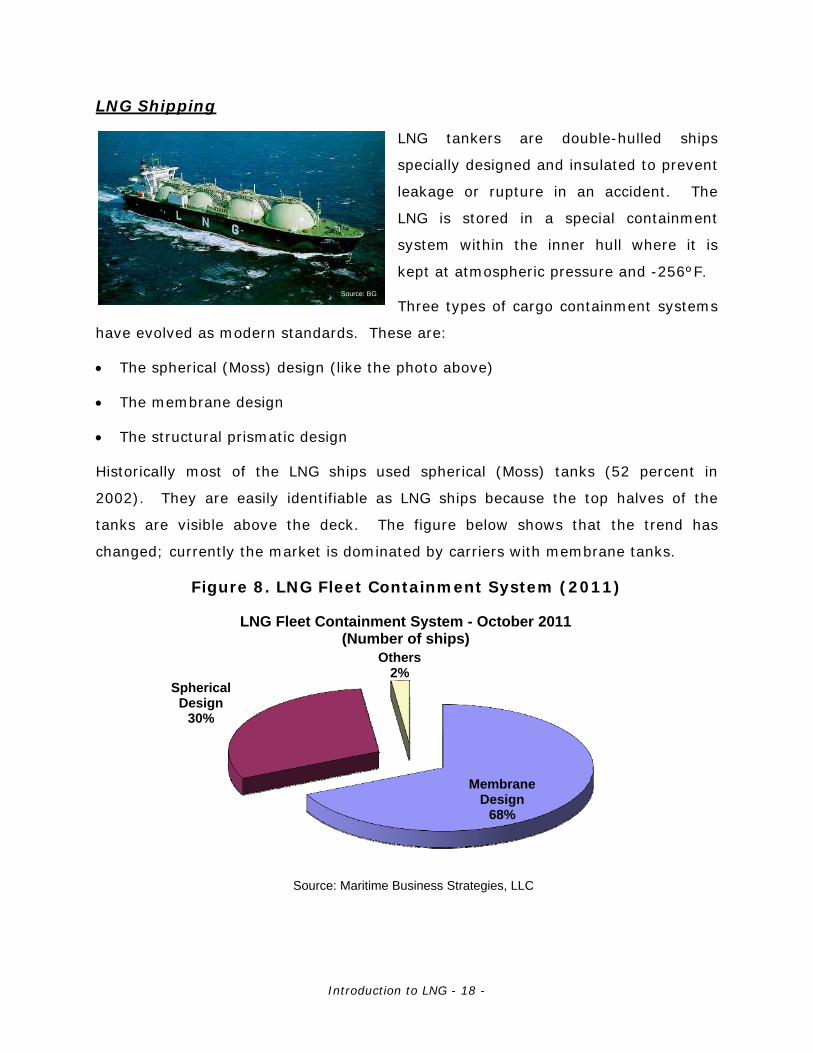
LNG Shipping
LNG tankers are double-hulled ships
specially designed and insulated to prevent
leakage or rupture in an accident. The
LNG is stored in a special containment
system within the inner hull where it is
kept at atmospheric pressure and -256ºF.
Three types of cargo containment systems
have evolved as modern standards. These are:
The spherical (Moss) design (like the photo above)
The membrane design
The structural prismatic design
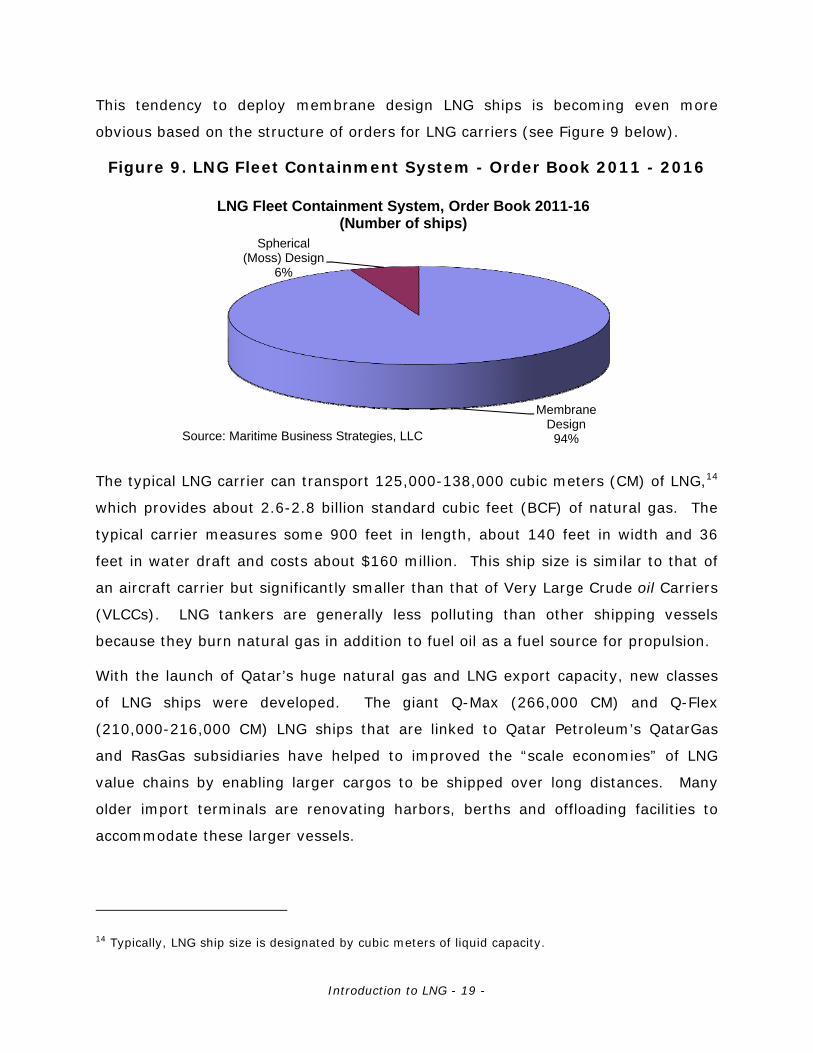
Historically most of the LNG ships used spherical (Moss) tanks (52 percent in
2002). They are easily identifiable as LNG ships because the top halves of the
tanks are visible above the deck. The figure below shows that the trend has
changed; currently the market is dominated by carriers with membrane tanks.
Figure 8. LNG Fleet Containment System (2011)
Membrane Design
68%
Spherical Design
30%
Others2%
LNG Fleet Containment System - October 2011(Number of ships)
Source: Maritime Business Strategies, LLC
Introduction to LNG - 19 -
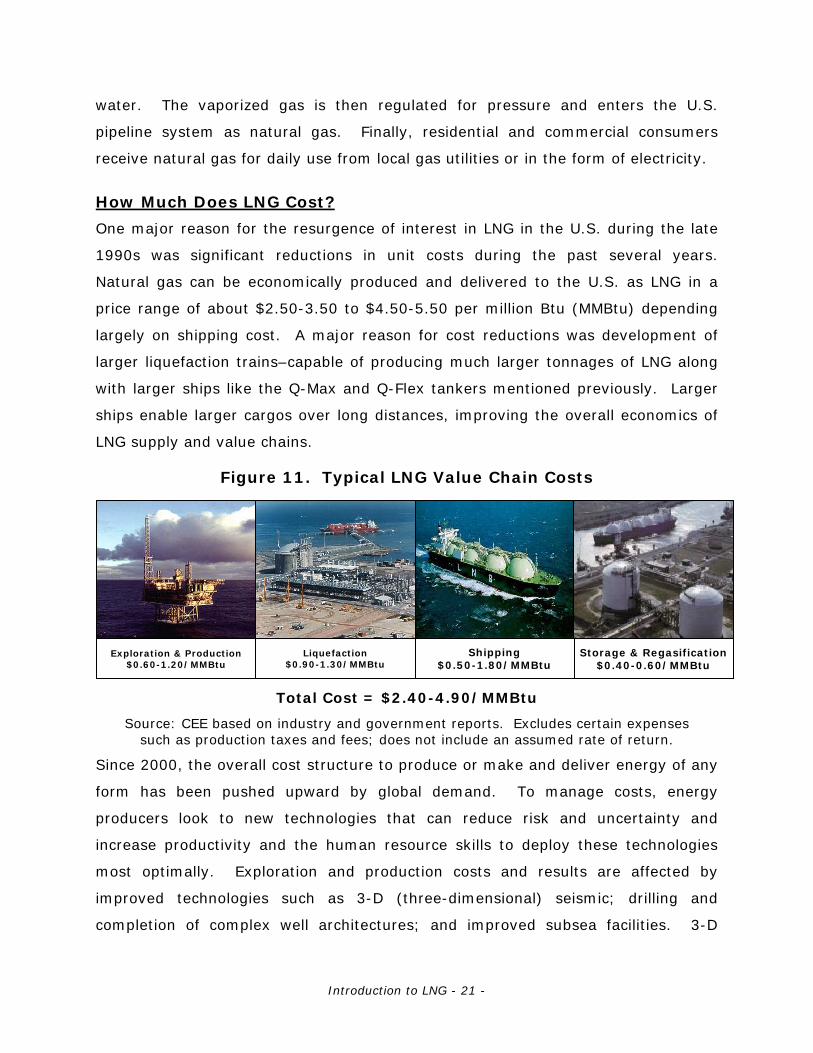
This tendency to deploy membrane design LNG ships is becoming even more
obvious based on the structure of orders for LNG carriers (see Figure 9 below).
Figure 9. LNG Fleet Containment System - Order Book 2011 - 2016
The typical LNG carrier can transport 125,000-138,000 cubic meters (CM) of LNG,14
which provides about 2.6-2.8 billion standard cubic feet (BCF) of natural gas. The
typical carrier measures some 900 feet in length, about 140 feet in width and 36
feet in water draft and costs about $160 million. This ship size is similar to that of
an aircraft carrier but significantly smaller than that of Very Large Crude oil Carriers
(VLCCs). LNG tankers are generally less polluting than other shipping vessels
because they burn natural gas in addition to fuel oil as a fuel source for propulsion.
With the launch of Qatar’s huge natural gas and LNG export capacity, new classes
of LNG ships were developed. The giant Q-Max (266,000 CM) and Q-Flex
(210,000-216,000 CM) LNG ships that are linked to Qatar Petroleum’s QatarGas
and RasGas subsidiaries have helped to improved the “scale economies” of LNG
value chains by enabling larger cargos to be shipped over long distances. Many
older import terminals are renovating harbors, berths and offloading facilities to
accommodate these larger vessels.
14 Typically, LNG ship size is designated by cubic meters of liquid capacity.
Membrane Design
94%
Spherical (Moss) Design
6%
LNG Fleet Containment System, Order Book 2011-16 (Number of ships)
Source: Maritime Business Strategies, LLC

Introduction to LNG - 20 -
The LNG shipping market is expanding. According to Maritime Business
Strategies,15 as of October 2011, there were 360 existing tankers, with 51 on order.
Seven new LNG tankers were ordered in 2010, all using the membrane containment
system.16 About 48 percent of the fleet is less than five years old.
Figure 10. LNG Ships Built 1965-2011
Storage and Regasification
To return LNG to a gaseous state, it is fed into
a regasification plant. On arrival at the
receiving terminal in its liquid state, LNG is
pumped first to a double-walled storage tank,
similar to those used in the liquefaction plant,
at atmospheric pressure, then pumped at high
pressure through various terminal components
where it is warmed in a controlled
environment. The LNG is warmed by passing it
through pipes heated by direct-fired heaters, or
seawater, or through pipes that are in heated
15Maritime Business Strategies, LLC: http://www.coltoncompany.com/. 16 International Group of Liquefied Natural Gas Importers: LNG Industry in 2010.
05
101520253035404550
1965
1967
1969
1971
1973
1975
1977
1979
1981
1983
1985
1987
1989
1991
1993
1995
1997
1999
2001
2003
2005
2007
2009
2011
Num
ber
of L
NG
Shi
ps
Source: Maritime Business Strategies, LLC
Source: CMS
Introduction to LNG - 21 -
water. The vaporized gas is then regulated for pressure and enters the U.S.
pipeline system as natural gas. Finally, residential and commercial consumers
receive natural gas for daily use from local gas utilities or in the form of electricity.
How Much Does LNG Cost? One major reason for the resurgence of interest in LNG in the U.S. during the late
1990s was significant reductions in unit costs during the past several years.
Natural gas can be economically produced and delivered to the U.S. as LNG in a
price range of about $2.50-3.50 to $4.50-5.50 per million Btu (MMBtu) depending
largely on shipping cost. A major reason for cost reductions was development of
larger liquefaction trains–capable of producing much larger tonnages of LNG along
with larger ships like the Q-Max and Q-Flex tankers mentioned previously. Larger
ships enable larger cargos over long distances, improving the overall economics of
LNG supply and value chains.
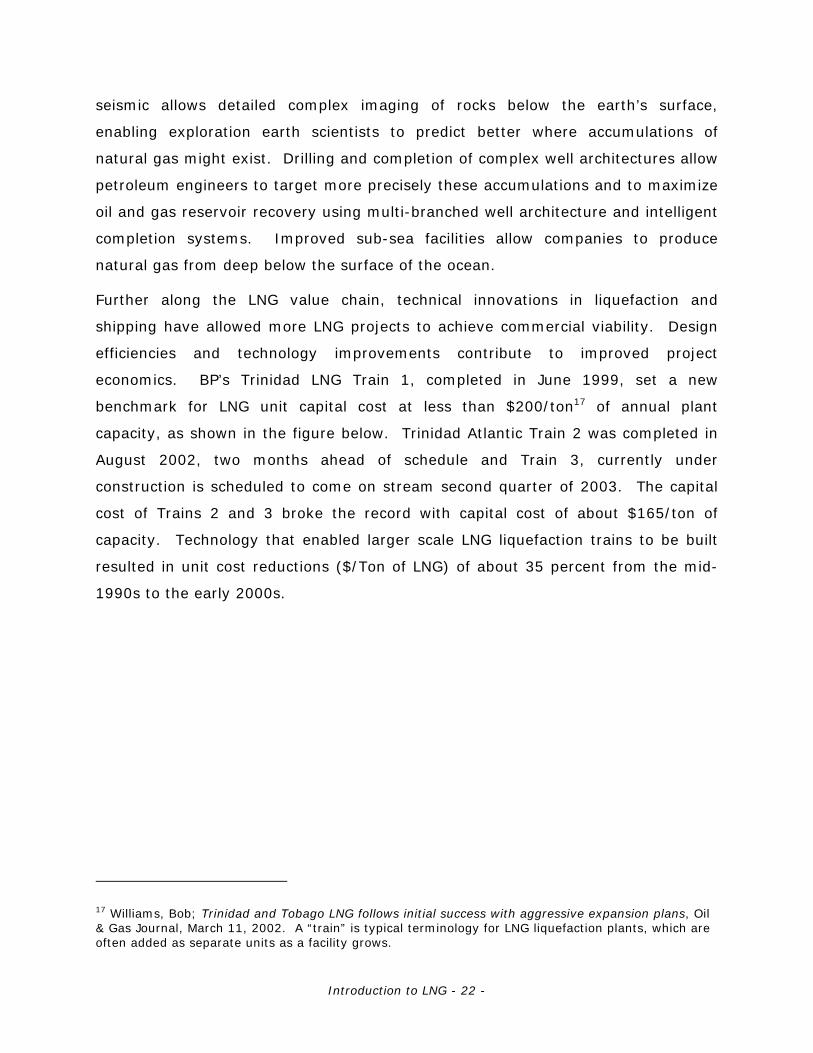
Figure 11. Typical LNG Value Chain Costs
Total Cost = $2.40-4.90/MMBtu
Source: CEE based on industry and government reports. Excludes certain expenses such as production taxes and fees; does not include an assumed rate of return.
Since 2000, the overall cost structure to produce or make and deliver energy of any
form has been pushed upward by global demand. To manage costs, energy
producers look to new technologies that can reduce risk and uncertainty and
increase productivity and the human resource skills to deploy these technologies
most optimally. Exploration and production costs and results are affected by
improved technologies such as 3-D (three-dimensional) seismic; drilling and
completion of complex well architectures; and improved subsea facilities. 3-D
Exploration & Production $0.60-1.20/MMBtu
Liquefaction $0.90-1.30/MMBtu
Shipping $0.50-1.80/MMBtu
Storage & Regasification $0.40-0.60/MMBtu
Introduction to LNG - 22 -
seismic allows detailed complex imaging of rocks below the earth’s surface,
enabling exploration earth scientists to predict better where accumulations of
natural gas might exist. Drilling and completion of complex well architectures allow
petroleum engineers to target more precisely these accumulations and to maximize
oil and gas reservoir recovery using multi-branched well architecture and intelligent
completion systems. Improved sub-sea facilities allow companies to produce
natural gas from deep below the surface of the ocean.
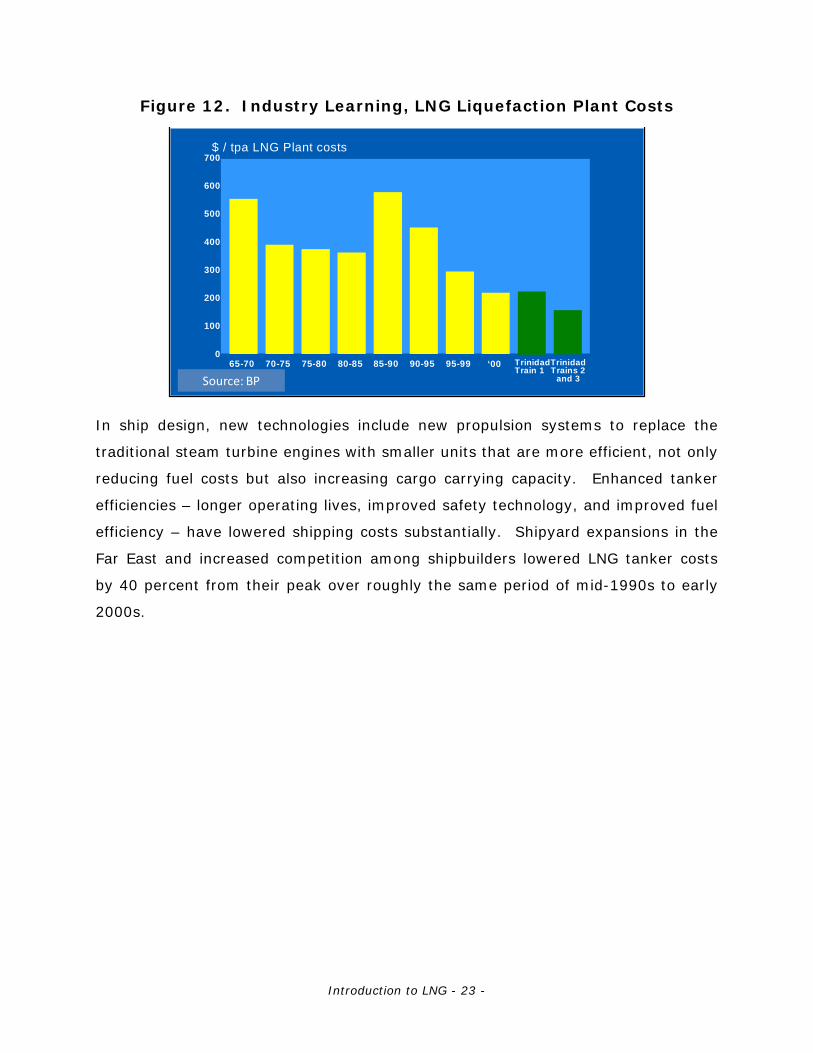
Further along the LNG value chain, technical innovations in liquefaction and
shipping have allowed more LNG projects to achieve commercial viability. Design
efficiencies and technology improvements contribute to improved project
economics. BP’s Trinidad LNG Train 1, completed in June 1999, set a new
benchmark for LNG unit capital cost at less than $200/ton17 of annual plant
capacity, as shown in the figure below. Trinidad Atlantic Train 2 was completed in
August 2002, two months ahead of schedule and Train 3, currently under
construction is scheduled to come on stream second quarter of 2003. The capital
cost of Trains 2 and 3 broke the record with capital cost of about $165/ton of
capacity. Technology that enabled larger scale LNG liquefaction trains to be built
resulted in unit cost reductions ($/Ton of LNG) of about 35 percent from the mid-
1990s to the early 2000s.
17 Williams, Bob; Trinidad and Tobago LNG follows initial success with aggressive expansion plans, Oil & Gas Journal, March 11, 2002. A “train” is typical terminology for LNG liquefaction plants, which are often added as separate units as a facility grows.
Introduction to LNG - 23 -
Figure 12. Industry Learning, LNG Liquefaction Plant Costs
In ship design, new technologies include new propulsion systems to replace the
traditional steam turbine engines with smaller units that are more efficient, not only
reducing fuel costs but also increasing cargo carrying capacity. Enhanced tanker
efficiencies – longer operating lives, improved safety technology, and improved fuel
efficiency – have lowered shipping costs substantially. Shipyard expansions in the
Far East and increased competition among shipbuilders lowered LNG tanker costs
by 40 percent from their peak over roughly the same period of mid-1990s to early
2000s.
0
100
200
300
400
500
600
700
65-70 70-75 75-80 80-85 85-90 90-95 TrinidadTrain 1
Trinidad Trains 2
and 3
95-99 ‘00
$ / tpa LNG Plant costs
Source: BP Source: BP

Introduction to LNG - 24 -
Figure 13. Price Dynamics of Mid-Sized LNG Carriers (1999-2008)
Source: Maritime Business Strategies, LLC; CEE assessments and calculations
Competition among builders also drove down costs for new regasification plants.
Regasification costs fell about 18 percent.18 The result of all these improvements is
that the overall cost of LNG delivery has been reduced by almost 30 percent during
the last 20 years.
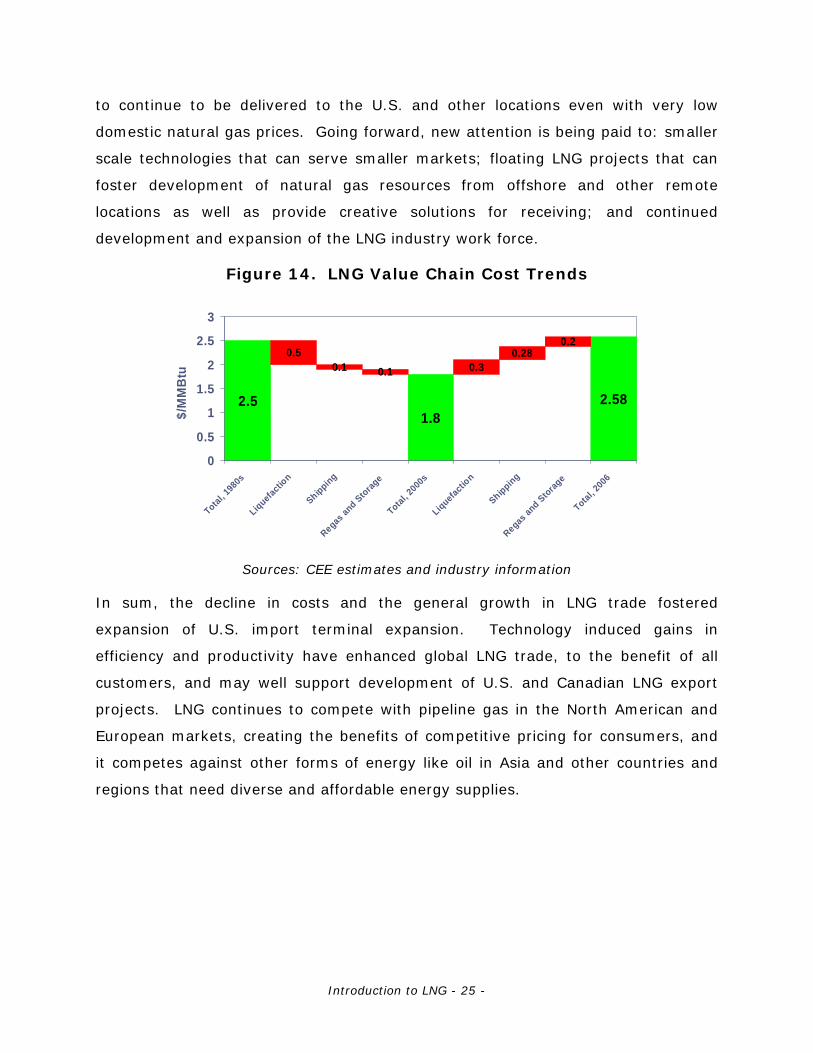
Taken all together, technology and productivity improvements resulted in a 28
percent decline in LNG value chain cost structure between the 1980s and 2000 (see
Figure 14 below). Cost pressures that accompanied strong global economic growth
and persistently high commodity prices through 2007 resulted in a reversal of
gains, but large scale projects continue to have cost and efficiency advantages.
The learning experience accumulated as the industry experienced rapid growth over
the past 20 to 30 years has yielded distinct benefits in improved operations, best
practices, technology adaptation, and human resource skills. This accumulated
experience allows LNG from large scale, low unit cost producing/exporting countries
18 Harmon, Harvey, Vice President, El Paso Global LNG, The Dawn of New Golden Age for LNG, IAEE Houston Meeting, February 2002.
0
50
100
150
200
250
300
350
12/2/1998 4/15/2000 8/28/2001 1/10/2003 5/24/2004 10/6/2005 2/18/2007 7/2/2008
$ M
illi
on
Order Date
Introduction to LNG - 25 -
to continue to be delivered to the U.S. and other locations even with very low
domestic natural gas prices. Going forward, new attention is being paid to: smaller
scale technologies that can serve smaller markets; floating LNG projects that can
foster development of natural gas resources from offshore and other remote
locations as well as provide creative solutions for receiving; and continued
development and expansion of the LNG industry work force.
Figure 14. LNG Value Chain Cost Trends
Sources: CEE estimates and industry information
In sum, the decline in costs and the general growth in LNG trade fostered
expansion of U.S. import terminal expansion. Technology induced gains in
efficiency and productivity have enhanced global LNG trade, to the benefit of all
customers, and may well support development of U.S. and Canadian LNG export
projects. LNG continues to compete with pipeline gas in the North American and
European markets, creating the benefits of competitive pricing for consumers, and
it competes against other forms of energy like oil in Asia and other countries and
regions that need diverse and affordable energy supplies.
2.51.8
2.58
0.1 0.1 0.30.28
0.20.5
0
0.5
1
1.5
2
2.5
3
Total,
1980s
Liquef
actio
n
Shippin
g
Regas and S
tora
ge
Total,
2000s
Liquefa
ctio
n
Shippin
g
Regas and S
tora
ge
Total,
2006
$/M
MB
tu
Introduction to LNG - 26 -
Is LNG a Safe Fuel?19 LNG has been safely handled for many years. The industry is not without incidents,
but it has maintained an enviable safety record, especially over the last 40 years.
There are currently about 200 peakshaving and LNG storage facilities worldwide,20
some operating since the mid-60s. The U.S. has the largest number of LNG
facilities in the world with 121 active LNG facilities spread across the country (see
map in previous Figure 1).
The reopening of existing LNG facilities at Cove Point, MD and Elba Island, GA,
expansions of existing terminals and growth in new LNG import capacity focused
public attention on the safety and security of LNG facilities. The safe and
environmentally sound operation of these facilities, both ships and terminals, and
the protection of these facilities from terrorist activities or other forms of accident
or injury are concerns and responsibilities shared by operators as well as federal,
state, and local jurisdictions across the U.S. Onshore LNG facilities are industrial
sites and, as such, are subject to all rules, regulations and environmental standards
imposed by the various jurisdictions. These same or similar concerns apply to
natural gas storage and pipeline transportation and distribution and our daily use of
natural gas.
A brief overview of the issues is presented here. The CEE briefing paper LNG
Safety and the Environment provides details on the LNG industry safety record and
incidents (see http://www.beg.utexas.edu/energyecon/lng/).
What is the safety record of the LNG industry?
Overall, the LNG industry has an excellent safety record compared to refineries and
other petrochemical plants. Worldwide, there are 25 LNG export (liquefaction)
terminals, 91 import (regasification) terminals, and 360 LNG ships, altogether
handling approximately 220 million metric tons of LNG every year. LNG has been
safely delivered across the ocean for over 40 years. In that time there have been
19 A second briefing paper, LNG Safety and the Environment, will address comprehensively the worldwide safety and security record of the industry as well as the U.S. policy and regulatory safeguards. 20 CH-IV International: Safety History of International LNG Operations, June 2002.
Introduction to LNG - 27 -
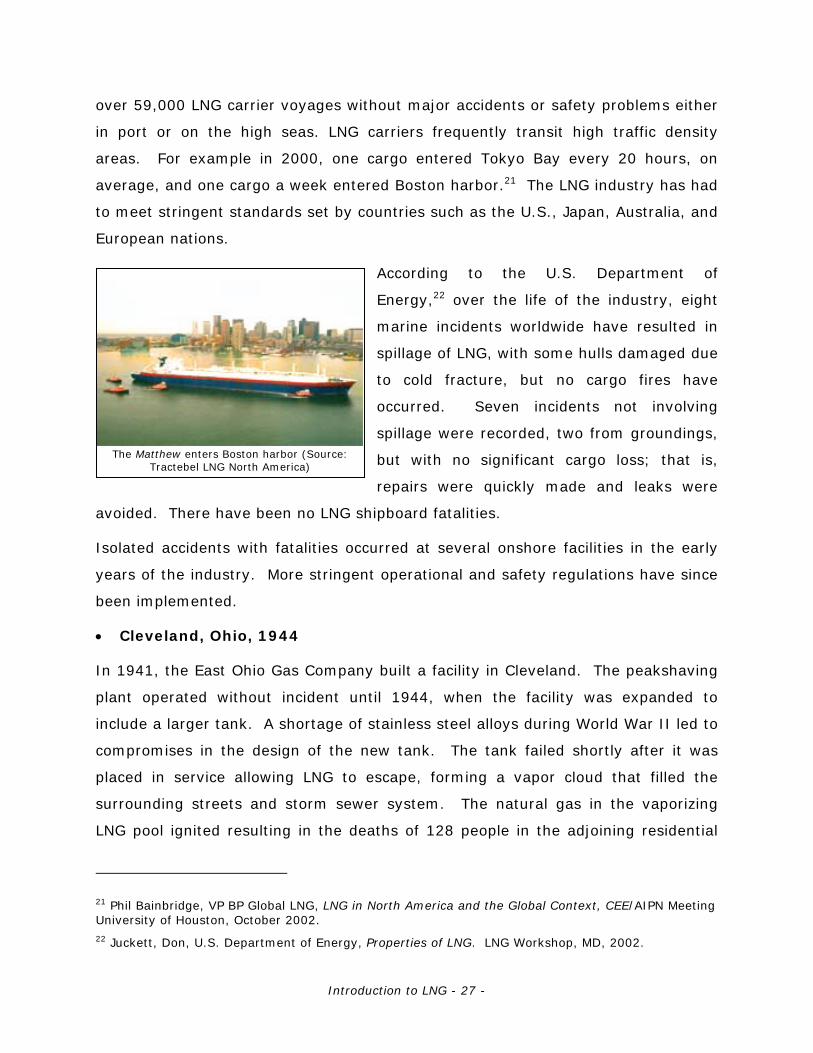
The Matthew enters Boston harbor (Source:
Tractebel LNG North America)
over 59,000 LNG carrier voyages without major accidents or safety problems either
in port or on the high seas. LNG carriers frequently transit high traffic density
areas. For example in 2000, one cargo entered Tokyo Bay every 20 hours, on
average, and one cargo a week entered Boston harbor.21 The LNG industry has had
to meet stringent standards set by countries such as the U.S., Japan, Australia, and
European nations.
According to the U.S. Department of
Energy,22 over the life of the industry, eight
marine incidents worldwide have resulted in
spillage of LNG, with some hulls damaged due
to cold fracture, but no cargo fires have
occurred. Seven incidents not involving
spillage were recorded, two from groundings,
but with no significant cargo loss; that is,
repairs were quickly made and leaks were
avoided. There have been no LNG shipboard fatalities.
Isolated accidents with fatalities occurred at several onshore facilities in the early
years of the industry. More stringent operational and safety regulations have since
been implemented.
Cleveland, Ohio, 1944
In 1941, the East Ohio Gas Company built a facility in Cleveland. The peakshaving
plant operated without incident until 1944, when the facility was expanded to
include a larger tank. A shortage of stainless steel alloys during World War II led to
compromises in the design of the new tank. The tank failed shortly after it was
placed in service allowing LNG to escape, forming a vapor cloud that filled the
surrounding streets and storm sewer system. The natural gas in the vaporizing
LNG pool ignited resulting in the deaths of 128 people in the adjoining residential
21 Phil Bainbridge, VP BP Global LNG, LNG in North America and the Global Context, CEE/AIPN Meeting University of Houston, October 2002. 22 Juckett, Don, U.S. Department of Energy, Properties of LNG. LNG Workshop, MD, 2002.
Introduction to LNG - 28 -
area. The conclusion of the investigating body, the U.S. Bureau of Mines, was that
the concept of liquefying and storing LNG was valid if "proper precautions were
observed."23 A recent report by the engineering consulting firm, PTL,24 concluded
that, had the Cleveland tank been built to current codes, this accident would not
have happened. In fact, LNG tanks properly constructed of 9 percent nickel steel
have never had a crack failure in their 35-year history.
Staten Island, New York, February 1973
In February 1973, an industrial accident unrelated to the presence of LNG occurred
at the Texas Eastern Transmission Company peakshaving plant on Staten Island.
In February 1972, the operators, suspecting a possible leak in the tank, took the
facility out of service. Once the LNG tank was emptied, tears were found in the
Mylar lining. During the repairs, vapors associated with the cleaning process
apparently ignited the Mylar liner. The resultant fire caused the temperature in the
tank to rise, generating enough pressure to dislodge a 6-inch thick concrete roof,
which then fell on the workers in the tank killing 40 people.
The Fire Department of the City of New York report of July 197325 determined the
accident was clearly a construction accident and not an "LNG accident".
In 1998, the New York Planning Board, while re-evaluating a moratorium on LNG
facilities, concluded the following with respect to the Staten Island accident: “The
government regulations and industry operating practices now in place would
prevent a replication of this accident. The fire involved combustible construction
materials and a tank design that are now prohibited. Although the exact causes
may never be known, it is certain that LNG was not involved in the accident and the
surrounding areas outside the facility were not exposed to risk.”26
23 U.S. Bureau of Mines, Report on the Investigation of the Fire at the Liquefaction, Storage, and Regasification Plant of the East Ohio Gas Co., Cleveland, Ohio, October 20, 1944, February 1946. 24 Lewis, James P, Outtrim, Patricia A., Lewis, William W., and Perry, Lui Xin, PTL: LNG, The Basics, Report prepared for BP, May 2001. 25 Fire Department of the City of New York, Report of Texas Eastern LNG Tank Fatal Fire and Roof Collapse, February 10, 1973, July 1973. 26 New York Energy Planning Board, Report on Issues Regarding the Existing New York Liquefied Natural Gas Moratorium, November 1998.
Introduction to LNG - 29 -
Cove Point, Maryland, October 197927
Finally, in October 1979, an explosion occurred within an electrical substation at the
Cove Point, MD receiving terminal. LNG leaked through an inadequately tightened
LNG pump electrical penetration seal, vaporized, passed through 200 feet of
underground electrical conduit, and entered the substation. Since natural gas was
never expected in this building, there were no gas detectors installed in the
building. The natural gas-air mixture was ignited by the normal arcing contacts of
a circuit breaker resulting in an explosion. The explosion killed one operator in the
building, seriously injured a second and caused about $3 million in damages.
This was an isolated accident caused by a very specific set of circumstances. The
National Transportation Safety Board28 found that the Cove Point Terminal was
designed and constructed in conformance with all appropriate regulations and
codes. However, as a result of this accident, three major design code changes
were made at the Cove Point facility prior to reopening. Those changes are
applicable industry-wide.
How will industry ensure safety and security of critical facilities and
shipping activities?
The experience of the LNG industry demonstrates that normal operating hazards
are manageable. No death or serious accident involving an LNG facility has
occurred in the United States since the Cove Point accident. West and Mannan of
Texas A&M University concluded in their paper LNG Safety Practice & Regulation:
From 1944 East Ohio Tragedy to Today’s Safety Record29 that “The worldwide LNG
industry has compiled an enviable safety record based on the diligent industry
safety analysis and the development of appropriate industrial safety regulations and
standards.”
27 The content in this section is taken from CH-IV International Report Safety History of International LNG Operations, June 2002. 28 National Transportation Safety Board Report, Columbia LNG Corporation Explosion and Fire; Cove Point, MD; October 6, 1979, NTSB-PAR-80-2, April 16, 1980. 29 West, H.H. and Mannan, M.S. Texas A&M University: LNG Safety Practice & Regulation: From 1944 East Ohio Tragedy to Today’s Safety Record, AIChE meeting, April 2001.
Introduction to LNG - 30 -
The over 40 years of experience without significant incidents caused by LNG,
liquefaction plants, LNG carriers, cargoes, and regasification facilities reflects the
industry’s commitment to safety and safe engineering and operations.
The terrorist attacks on September 11, 2001 raised critical new security risks and
exposure for consideration, not just for the LNG industry but for all major industrial
activities in the U.S. and worldwide. The LNG industry employs robust containment
systems, proven operational procedures and many other safeguards. During the
last several decades, technologies have advanced rapidly to ensure safer
containment of LNG both during shipping and at onshore facilities.
The CEE safety and security briefing paper details and evaluates safety and security
measures that are currently in use and under consideration, actions by industry and
government to ensure safety and security, and technologies under development by
industry that will reduce the effect LNG facilities may have on local communities.
What are the roles of federal, state and local government agencies
and what are their jurisdictions?
The United States Coast Guard (USCG)30 is responsible for assuring the safety of all
marine operations at the LNG terminals and on tankers in U.S. coastal waters. The
Department of Transportation (DOT)31 regulates LNG tanker operations. The U.S.
Federal Energy Regulatory Commission (FERC)32 is responsible for permitting new
LNG regasification terminals in the U.S. and ensuring safety at these facilities
through inspections and other forms of oversight. In order to maintain a
competitive environment for supply and pricing, the FERC is considering its role
concerning the commercial arrangements by which producers of LNG have access
to U.S. terminals. The FERC’s jurisdiction includes authority for permitting new
long distance natural gas pipelines to be developed in the U.S., as well as for safe
and environmentally sound operation of the overall “interstate” natural gas pipeline
system (pipelines that cross state boundaries). The U.S. Environmental Protection
30 United States Coast Guard (USCG): http://www.uscg.mil/. 31 U.S. Department of Transportation (DOT): http://www.dot.gov/. 32 U.S. Federal Energy Regulatory Commission (FERC): http://www.ferc.gov/.

Introduction to LNG - 31 -
Agency33 and state environmental agencies establish air and water standards with
which the LNG industry must comply. Other federal agencies involved in
environmental protection and safety protection include the U.S. Fish and Wildlife
Service,34 U.S. Army Corps of Engineers35 (for coastal facilities and wetlands), U.S.
Minerals Management Service36 (for offshore activities) and National Oceanic and
Atmospheric Administration37 (for any activities near marine sanctuaries). The U.S.
Department of Energy – Office of Fossil Energy38 helps to coordinate across federal
agencies that have regulatory and policy authority for LNG.
State, county, and local (municipal) agencies play roles to ensure safe and
environmentally sound construction and operation of LNG industry facilities. The
LNG industry is responsible for safe operations and facility security in cooperation
with local police and fire departments.
How can citizens interact with industry and government to learn
more?
The briefing papers produced by the CEE mentioned above and the online Guide to
LNG in North America provides extensive information to public audiences interested
in U.S. energy trends and security; LNG industry and market developments; LNG
safety, security and environmental considerations; and related regulatory and
policy issues. The CEE web site provides links to industry, government and public
information sources. Companies with LNG operations maintain active public
information offices, as do the federal agencies charged with regulatory and policy
oversight.
33 U.S. Environmental Protection Agency (EPA): http://www.epa.gov/. 34 U.S. Fish and Wildlife Service: http://www.fws.gov/. 35 U.S. Army Corps of Engineers: http://www.usace.army.mil/. 36 U.S. Minerals Management Service: http://www.boemre.gov/. 37 U.S. National Oceanic and Atmospheric Administration: http://www.noaa.gov/. 38 U.S. Department of Energy – Office of Fossil Energy: http://www.fe.doe.gov/.

Introduction to LNG - 32 -
APPENDIX 1: CONVERSION TABLE Conversion Units Source: BP Statistical Review of U.S. Energy June 2002
Natural gas (NG) and LNG
To:
1 billion cubic meters NG
1 billion cubic feet NG
1 million tons oil equivalent
1 million tons LNG
1 trillion British thermal units (Btus)
1 million barrels oil equivalent (Boe)
From: Multiply by:
1 billion cubic meters NG 1 35.3 0.90 0.73 36 6.29
1 billion cubic feet NG 0.028 1 0.026 0.021 1.03 0.18
1 million tons oil equivalent 1.111 39.2 1 0.81 40.4 7.33
1 million tons LNG 1.38 48.7 1.23 1 52.0 8.68
1 trillion British thermal units (Btus)
0.028 0.98 0.025 0.02 1 0.17
1 million barrels oil equivalent (Boe)
0.16 5.61 0.14 0.12 5.8 1
Example: To convert FROM 1 million tons of LNG TO billion cubic feet of natural gas
multiply by 48.7 (100 million tons of LNG equals roughly 5000 billion cubic feet of natural
gas).

Introduction to LNG - 33 -
LNG Composition
Others5%
Methane 95%
APPENDIX 2: OTHER FUEL TERMINOLOGIES LNG is often confused with other terminologies such as Natural Gas Liquids (NGLs),
Compressed Natural Gas (CNG), Liquefied Petroleum Gas (LPG), Gas-to-Liquids
(GTL).
LNG is made up of mostly methane
as shown in the figure below. The
liquefaction process requires the
removal of the non-methane
components like carbon dioxide,
water, butane, pentane and heavier
components from the produced
natural gas. LNG is odorless,
colorless, non-corrosive, and non-
toxic. When vaporized it burns only
in concentrations of 5% to 15% when
mixed with air.
Natural gas liquids (NGLs) are made up mostly of molecules that are heavier
than methane. These molecules liquefy more readily than methane. NGLs are the
hydrocarbon molecules that begin with ethane and increase in size as additional
carbon atoms are added. In the U.S.
NGLs are typically extracted during
the processing of natural gas for
industrial uses and in order for the
gas to meet the pipeline
specification. LNG shipped to the
U.S. generally must meet pipeline
heating value specifications, that is,
it must contain only moderate
quantities of NGLs. If LNG is shipped
with NGLs, the NGLs must be
removed upon receipt or blended
with lean gas or nitrogen before the natural gas can enter the U.S. pipeline system.
NGL Composition
Ethane, propane, butane95%
Others5%

Introduction to LNG - 34 -
LPG Composition
Propane and
Butane95%
Others5%
Few locations (only the Lake Charles, Louisiana receiving terminal in the U.S., for
instance) are near processing facilities that can take LNG cargos that are “rich” with
NGLs.
However, the LNG heat content specification in Japan, Korea and other Asian
countries is higher than in the U.S. or Europe. For these countries, NGLs are left in
the LNG and, in some circumstances LPG is added to the vaporized LNG at the
receiving terminal to increase the heat content.
LNG is not the same as Liquefied
Petroleum Gas (LPG). LPG is often
incorrectly called propane. In fact,
LPG is predominantly a mixture of
propane and butane in a liquid state
at room temperatures when under
moderate pressures of less than 200
psig (pounds per square inch gauge
(psig) is a common measure of
pressure). The common
interchanging of the terms LPG and
propane is explained by the fact that in the U.S. and Canada LPG consists primarily
of propane. In many European countries, however, the propane content in LPG can
be lower than 50 per cent.
In Europe, LPG has been used as fuel in light duty vehicles for many years. Many
petrol or gasoline stations have LPG pumps as well as pumps to distribute gasoline.
LPG is highly flammable and must therefore be stored away from sources of ignition
and in a well-ventilated area, so that any leak can disperse safely. A special
chemical, mercaptan, is added to give LPG its distinctive, unpleasant smell so that a
leak can be detected. The concentration of the chemical is such that an LPG leak
can be smelled when the concentration is well below the lower limit of flammability.
Worldwide, LPG is used heavily for domestic purposes such as cooking and heating
water.
Introduction to LNG - 35 -
Methanol
FischerTropschProcess
NaturalGas
Methanol
DME
Gasoline
Middle distillates
Naphtha
LPG
Wax/Lubes
Syngas Production
Source: GTL Taskforce. Dept of Industry, Science and Resources Canberra ACT Australia: June 2001
Source: BP
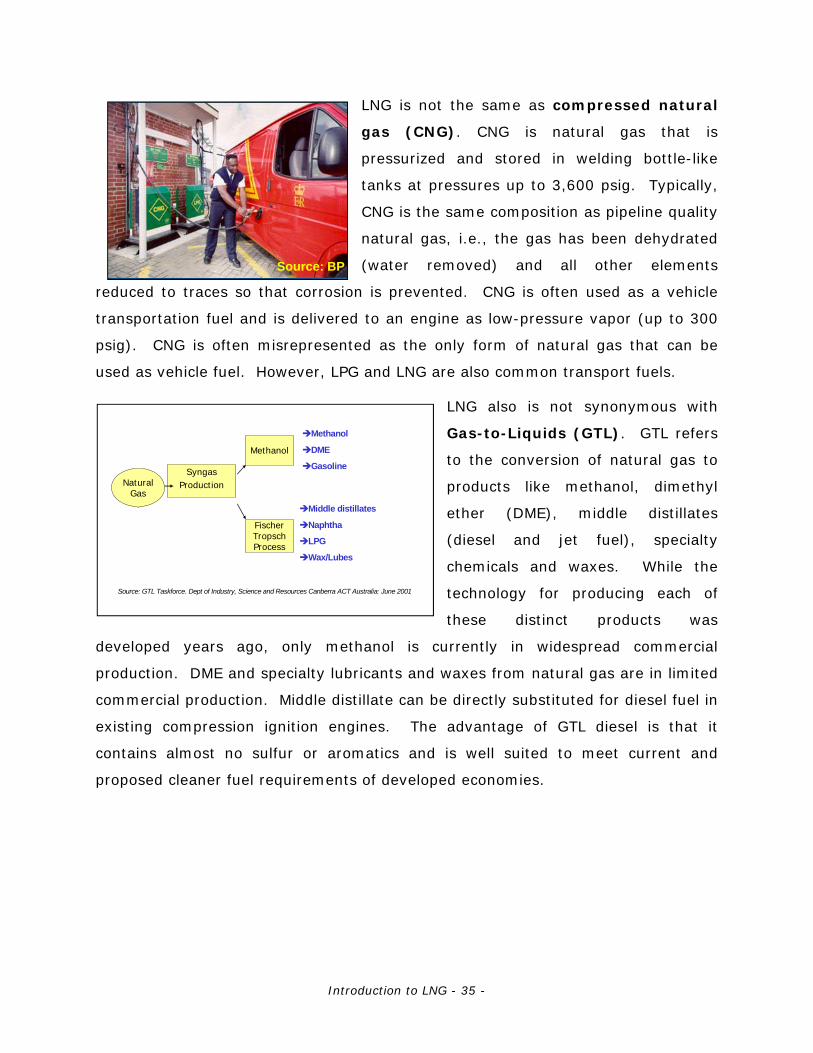
LNG is not the same as compressed natural
gas (CNG). CNG is natural gas that is
pressurized and stored in welding bottle-like
tanks at pressures up to 3,600 psig. Typically,
CNG is the same composition as pipeline quality
natural gas, i.e., the gas has been dehydrated
(water removed) and all other elements
reduced to traces so that corrosion is prevented. CNG is often used as a vehicle
transportation fuel and is delivered to an engine as low-pressure vapor (up to 300
psig). CNG is often misrepresented as the only form of natural gas that can be
used as vehicle fuel. However, LPG and LNG are also common transport fuels.
LNG also is not synonymous with
Gas-to-Liquids (GTL). GTL refers
to the conversion of natural gas to
products like methanol, dimethyl
ether (DME), middle distillates
(diesel and jet fuel), specialty
chemicals and waxes. While the
technology for producing each of
these distinct products was
developed years ago, only methanol is currently in widespread commercial
production. DME and specialty lubricants and waxes from natural gas are in limited
commercial production. Middle distillate can be directly substituted for diesel fuel in
existing compression ignition engines. The advantage of GTL diesel is that it
contains almost no sulfur or aromatics and is well suited to meet current and
proposed cleaner fuel requirements of developed economies.

Introduction to LNG - 36 -
APPENDIX 3: GLOSSARY OF TERMS39,40 TERM DEFINITION
British Thermal Unit (BTU)
A Btu is the amount of heat required to change the temperature of one pound of water one degree Fahrenheit.
Cryogenic Refers to low temperature and low temperature technology. There is no precise temperature for an upper boundary but -100oF is often used.
Density
A description of oil by some measurement of its volume to weight ratio. The industry usually relies on two expressions of oil's volume-weight relationship-specific gravity and API degrees. The larger a specific gravity number and the smaller an API number, the denser the oil.
Fahrenheit degrees (F)
A temperature scale according to which water boils at 212 and freezes at 32 Fahrenheit degrees. Convert to Centigrade degrees (C) by the following formula: (F-32)/1.8= C.
Impoundment Spill control for tank content designed to limit the liquid travel in case of release. May also refer to spill control for LNG piping or transfer operations.
Middle distillates Products heavier than motor gasoline/naphtha and lighter than residual fuel oil. This range includes heating oil, diesel, kerosene, and jet kero.
Mole Percent Mole is a short form of molecular weight. Mole fraction or mole percent is the number of moles of a component of a mixture divided by the total number of moles in the mixture.
MTPA Million Tonnes per Annum. Tonnes or Metric Ton is approximately 2.47 cubic meter of LNG.
MW Molecular Weight
Peakshaving LNG Facility
A facility for both storing and vaporizing LNG intended to operate on an intermittent basis to meet relatively short term peak gas demands. A peakshaving plant may also have liquefaction capacity, which is usually quite small compared to vaporization capacity at such facility.
Stranded Gas Gas is considered stranded when it is not near its customer and a pipeline is not economically justified.
Sweetening Processing to remove sulfur. Hydrodesulfurization, for instance, can produce sweet catfeed. Caustic washing can sweeten sour natural gasolines to make them suitable for motor gasoline blending.
39 Phillips Petroleum Company. 40 Poten & Partners, http://www.poten.com/?URL=ut_glossary.asp.


