
Advances in Computational Design, Vol. 1, No. 1 (2016) 37-60
DOI: http://dx.doi.org/10.12989/acd.2016.1.1.037 37
Copyright © 2016 Techno-Press, Ltd.
http://www.techno-press.com/journals/acd&subpage=7 ISSN: 2383-8477 (Print), 2466-0523 (Online)
Analysis of the dynamical behavior of piezoceramic actuators using piezoelectric isogeometric finite elements
Christian Willberg
Institute of Composite Structures and Adaptive Systems, German Aerospace Center (DLR), Lilienthalplatz 7,
38108 Braunschweig, Germany
(Received August 13, 2015, Revised November 23, 2015, Accepted November 27, 2015)
Abstract. In this paper an electromechanically coupled isogeometric finite element is utilized to analyse
Lamb wave excitation with piezoceramic actuators. An effective actuator design reduces the energy needed
for Lamb wave excitation, which is beneficial if a structural health monitoring system should be applied for
a structure. For a better understanding of the actuator behavior the piezoeceramics are studied both free and
bonded at a structure. The numerical part of the analysis is performed utilizing isogeometric finite elements.
To obtain the optimal performance for the numerical analysis the effect of k-refinement of the isogeometric
element with respect to the convergence is studied and discussed. The optimal numerical setup with the best
convergence rate is proposed and is validated with free piezoeceramic actuators. The validated model is then
utilized to study the impact of actuator shape and adhesive bondline effect to the wave amplitude. The study
shows that simplified analytical equations do not predict the optimal excitation frequencies for all
piezoceramic designs accurately.
Keywords: FEM; isogeometric analysis; piezoelectric; smart structures
1. Introduction
Lamb wave based structural health monitoring systems are one promising approach to monitor
thin walled structures, e.g., aeroplanes Boller et al. (2009), Giurgiutiu (2008). Lamb waves are
ultrasonic waves and therefore interact with damages Mook et al. (2003). They are characterized
by a low geometrical attenuation (1/√r) Su and Ye (2009). Therefore they are promising for
monitoring large areas of light weight CFRP (composite fiber reinforced plastics) structures, e.g.,
wings of airplanes, because it is possible to monitor great distances or surfaces with a relatively
low number of sensors and actuators. However, Lamb waves have complex properties, e.g., they
are dispersive, occur in at least two basic modes (symmetric and anti-symmetric) and under special
conditions these modes can convert into each other. For a conversion between the symmetric and
anti-symmetric mode the wave has to travel through a discontinuity, which is not symmetric to the
center plane of the wave and vice versa Ahmad and Gabbert (2012), Willberg et al. (2012b). Numerous modeling approaches have been developed to describe the complex properties of
Corresponding author, Ph.D., E-mail: [email protected]

Christian Willberg
Lamb waves efficiently, Willberg et al. (2015). One of these approaches is the so called
isogeometric element concept. This concept wants to close the gap between computer aided design
(CAD) and finite element analysis (FEA) to reduce the modeling effort Hughes et al. (2005). The
reduction of the meshing time and an accurate description of the geometry increase the efficiency
of numerical simulations. By assuming accurate so called water-tight geometrical decription from
a CAD tool the isogeometric concept utilizes the functional description of the geometry from the
CAD software (B-splines, NURBS, T-splines, etc.) and reuses them as shape function for the FEA
Cottrell et al. (2009). Assuming that in the near future the application of isogeometric elements
will be common, then also special multi-physics finite elements are required, e.g., for the
simulation of piezoelectric smart structures. The development of an isogeometric piezoelectrical
element has been done by Willberg and Gabbert (2012). It has been shown that this isogeometric
element needs a lower number of degrees of freedom due to its exact geometrical description. For
a dynamic analysis the performance of a two-dimensional isogeometric finite element has been
studied by Willberg et al. (2012a). In this study compared to other higher order approaches
isogoemtric finite elements show better convergences. Therefore, a lower number of degrees-of-
freedom is needed to reach the same accuracy as other higher order element and as result it leads
to an increase in memory efficiency. On the contrary the time integration strategy has to be
improved because, to the authors knowledge, no method for mass matrix diagonalization for
isogeometric elements exists which lead to accurate results for higher frequencies. Adam et al.
(2015) analyzes several lumping strategies, but for greater eigenfrequencies the eigenmodes show
errors and the accuracy decreases. Although the memory cost is lower the computational time is
not reduced compared to spectral finite elements. To understand reason of the better convergence
rate of the isogeometric element the effect of the inter-element-continuity is studied. With the
effective modeling approach the behavior of the actuator due to Lamb wave excitation is studied.
The results are based on the experimental findings of Pohl et al. (2012). The piezoelectrical finite
element is validated with experimental data of several unbounded piezoceramic actuators by
analyzing the eigenfrequencies and eigenmodes. In the last part a two-dimensional analysis is
performed to study the effect of stiffness, geometry and adhesive layer variation.
The paper is structured as following. First, the isogeometric piezoelectric finite element is
derived. Second the effect to the convergence due to k-refinement is analysed. Third, the
experimental findings of Pohl et al. (2012) are briefly introduced to motivate the further analysis.
In the fourth section the paper is concluded.
2. Theoretical background The derivation of the piezomechanical isogeometric finite element has been adopted from
Willberg and Gabbert (2012). In this section the material law, the basic finite element equations
and the non-uniform rational B-spline (NURBS) representation are introduced. The isogeometric
finite element is derived for small deformations and linearized material behavior.
2.1 Isogeometric piezomechanical model Piezoelectric materials are able to transform mechanical deformation in electrical voltage
(direct piezoelectric effect) and vice versa (converse piezoelectric effect). To model a piezoelectric
elastic material in a low voltage range, the linearized piezoelectric constitutive equations are
38

Analysis of the dynamical behavior of piezoceramic actuators using…
sufficient to describe the coupled electromechanical behavior Ikeda (1996). The linearized
piezomechanical material law can be written as
, (1)
. (2)
The parameters ,σ ,ε ,E ,D ,ES d and
e are the mechanical stresses, the mechanical strains,
the electric field, the electrical displacement, the elastic compliance matrix measured at constant
electric field, the piezoelectric coupling matrix and the permittivity measured at constant
mechanical stress, respectively. The mechanical strain is related to the displacement u as uε D ,
where D is the differential operator. The electric field is defined as the gradient of the electrical
potential Φ as
g (3)
Based on this material law the isogeometric finite element formulation can be derived. The
difference to the equally formulated standard finite elements is the NURBS shape functions.
2.1 Isogeometric finite element formulation
The equations of motion of a piezoelectric continuum can be derived using Hamilton's
principle, which states that the motion of the system within the time interval 21 tt , is such that the
variation of action vanishes, i.e., the motion of the system takes the path of stationary action
Marinkovic et al. (2006)
∫
(4)
where
∫ (5)
represents the Lagrangian of the system and includes the kinetic energy as well as the potential
mechanical and electrical energies. The external work W is given as
∫
∫
∑
∫
∑
(6)
and includes all external loads and external electrical charges. The vectors FV, FS1, Fi are given
mechanical loads related to a volume V, to a surface S1 and to an element node (a control point for
an isogeometric element) i, respectively. The scalar values QS1 and Qj are the electric charge
related to a surface S2 and to an element node (a control point for an isogeometric element) j. The
vector u contains the unknown mechanical displacements and Φ describes the unknown
electrical potential. After substituting Eqs. (5) and (6) into Eq. (7) and rearranging the expression
we obtain the variational formulation in the form Samal et al. (2005)
39

Christian Willberg
∫[ ]
∫
∫
∑
∫
∑
(7)
where the vector u is the the acceleration. The material matrices CE=(S
E)
-1 and e=C
Ed are the
elasticity matrix and the matrix of piezoelectric coupling constants, respectively.
When using the finite element approach, a continuous body is discretized in small subdomains.
All displacement and electrical potential fields are approximated within each local domain. The
displacements u and the electrical potential Φ in a local domain (element) can be expressed in
terms of the nodal displacements and the nodal electrical potentials (Ucont, cont) and the matrices
of the mechanical and electrical interpolation functions (Hu, H) as Zienkiewicz and Taylor (2000)
and (8)
This formula is similar to the geometrical description of NURBS shown in Eq. (14). In an
isogeometric element non-uniform rational B-splines (NURBS) are used as shape functions and
the nodal displacements and the nodal electrical potentials correspond to those at the control
points.
The deflections and the electrical potentials at any point of the finite element of the structure
can be obtained using Eq. (8). Substituting Eq. (8) together with Eq. (1) and Eq. (2) into the
variational formulation Eq. (7), results in the discretized form of the equations of motion of a
piezoelectric continuum
(9a)
(9b)
As already mentioned the matrices of the mechanical and electrical interpolation functions (Hu,
H) (see Eq. (8)) contain NURBS as shape functions needed to formulated the isogeometric finite
element. NURBS have several advantages in describing curved geometries Willberg and Gabbert
(2012). They are derivable with a defined non-uniform knot vector V, B-spline basis function Ni, p,
weights parameters wi and control points Pi. A B-spline basis is comprised of piece-wise
polynomials joined with prescribed continuity conditions. To define a B-spline of polynomial
order p in one dimension one needs to understand the notion of a knot vector. A knot vector is a set
of coordinates in a parametric space, written as
[ ] with (10)
where i is the knot index, i=0, 1, ..., ncont+p+1, i is the ith knot and ncont is the total number of
control points Bazilevs (2006). There are various ways to define B-spline basis functions, but for
computer implementation the application of a recurrence formula is the most common way de
Boor (1972). The first order basis functions Ni, 0() of polynomial degree p=0 are
{ if ∈ [ othe wise.
(11)
40

Analysis of the dynamical behavior of piezoceramic actuators using…
The basis functions Ni, p() of higher order p>0 are defined as
(12)
where the indices i and p denote the ith basis function of polynomial order p. Utilizing the B-spline
basis functions Ni, p(), the NURBS basis function Ri() can be defined as
∑
(13)
where wi is a weight corresponding to the i-th B-spline basis function Ni,p. An arbitrary NURBS
curve can be described as Piegl and Tiller (1995)
∑
(14)
The vector X is the position vector of the described curve. Pi are control points in global
cartesian coordinates [x1, x2, x3]. A NURBS curve can be interpreted as projection of a B-spline
curve from 1n to a defined surface in n Cottrell et al. (2009). NURBS are projective
invariant and if the weights are non-negative the curve lays in the convex hull of the control
polygon Bazilevs (2006). This projection is controlled by weight parameters wi. The derivatives of
the NURBS basis functions needed for the finite element formulation are given as Piegl and Tiller
(1995)
(15)
with
∑
(16)
and
. (17)
For a two or three dimensional finite element two or three dimensional NURBS formulation is
needed, given by Cottrell et al. (2009).
3. Influence of the inter-element-continuity to the convergence rate
In previous studies done by Willberg et al. (2012a) the improved convergence rate of
isogeometric finite elements by simulating Lamb waves have been shown.
In this study the Cp-1
-continuous elements have been utilized. In this section the impact of the
inter-element-continuity or k-refinement on the convergence rate is investigated. The setup is equal
to the previous studies done by Willberg et al. (2012a). The model is given in Fig. 1.
The frequency has been chosen as f=477.5 kHz. In this frequency range (for a plate thickness
41

Christian Willberg
Fig. 1 Two-dimensional model with loads and boundary conditions for the convergence study.
Two point forces )2(t)sinsin( 21 nt/FtF ˆ)( and )()( taFtF 12 are applied, with a=1 for the
excitation of a purely symmetric Lamb wave mode (S0) and a=-1 if the anti-symmetric mode (A0)
is considered. The dimensions of the aluminium (see Table 5) plate are : la=100 mm, lb=200 mm,
lp=500 mm, h=2 mm
of h=2 mm) the dispersion, describing the frequency-dependence of both the group and phase
velocity is low for the fundamental Lamb wave modes.
To determine the quality of the finite element solution the time-of-flight tc of the propagating
Lamb wave package between the points A and B is utilized. To get a defined package position a
Hilbert transformation is performed to calculate an envelope at both positions A and B. The
centroids of these envelopes are defined as the position of the wave package Willberg et al.
(2012a). With this definition the time-of-flight computed using the finite element method (tcnum,
type) is compared to the value given by the analytical solution (tcana). Basically using this
methodology the comparison of time-of-flights equals the evaluation of resulting group speeds,
since dispersive effects are almost excluded due to the narrow bandwidth of the excitation signal
and due to the constant distance between the evaluation points. However, the remaining small
dispersive effects enter the analytically (tcana) and numerically (tcnum, type) computed time-of-flight
parameters to an equal extent, hence the presented convergence indicator is able to quantify the
Lamb wave behaviour even for very low orders of the errors magnitude.
(a) A0-mode (b) S0-mode
Fig. 2 Convergence curve of isogeometric elements with C1-continuity (px3=4)
42

Analysis of the dynamical behavior of piezoceramic actuators using…
For the study of the k-refinement convergence effects, the polynomial order in thickness
direction is chosen as px3=4. If a polynomial degree px3=4 keep locking to a minimum and greater
polynomial degrees does not lead for the chosen frequency to an error reduction Willberg et al.
(2012a). Two different inter-element-continuities in x1-direction are chosen; C1- and C
0-continuity.
The C0 -continuity corresponds to the standard finite element inter-element-continuity, meaning
that no jumps in the displacement functions occur.
Fig. 2 shows the result of the convergence test for the C1-continuous isogeometric finite
elements. As reference the convergence curve of the spectral finite elements (SEM) with the
optimal polynomial degree px1=3 (minimal memory effort to reach a 1% error for the time of
flight) is plotted Willberg et al. (2012a). These elements have been chosen because they are
commonly used for higher order Lamb wave simulation. Due to their formulation a lumped mass
matrix is obtained which has advantages for the time-integration Duczek (2014). The convergence
rate for the A0- as well as the S0-mode are lower in comparison to Cp-1
-continuous isogeometric
elements, compare with Willberg et al. (2012a), cf. Fig. 4. They are steady and have no peaks. The
convergence of the isogeometric elements of order px1=3 are almost equal to the reference curve of
SEM of the same order. Due to the difference in polynomial order as expected the accuracy of the
isogeometric element in comparison to the SEM elements is for px1=2 and for the polynomial
degree px1=5 the accuracy is higher compared to the SEM elements. For an equal polynomial
order (px1=3) the accuracy of the isogeometric finite elements are slightly lower compared to the
SEM, but the maximum accuracy is equal for both formulations.
Fig. 3 illustrates the results of the C0-continuous isogeometric elements. The curves are steady
except the peak for px1=3 in the A0-mode curve. This behavior can be attributed to local element
eigenfrequencies and correlate to the peak in the SEM curve Schmicker et al. (2014). Again the
convergence rate of order px1=3 of the A0- and S0-mode is almost similar to the reference SEM
convergence, but the accuracy of the isogeometric finite elements is lower until they reach the
maximum accuracy.
Generally, isogeometric finite elements with a lower inter-element-continuity exhibit worsened
convergence compared to a Cp-1
-continuous element. Also the element eigenfrequency effects
described by Schmicker et al. (2014) occur. The maximum achievable accuracy of lower inter-
element-continuity elements is not improved and equal to Cp-1
-continuous elements. Fig. 4
(a) A0-mode (b) S0-mode
Fig. 3 Convergence curve of isogeometric elements with C0-continuity (px3=4)
43

Christian Willberg
(a) A0-mode (b) S0-mode
Fig. 4 Convergence curve of isogeometric elements with inter-element- different continuity (px1=3, px3=4)
illustrates this conclusion for a polynomial degree of px1=3. For C1 and C
0 inter-element-continuity
no improvement in convergence is reached in comparison to the spectral finite element solution of
equal order.
Therefore, Cp-1
-continuous isogeometric finite elements are to be preferred when dealing with
Lamb wave propagation. This statement agrees with Evans et al. (2009) for a theoretical
approximation analysis which said that a numerical comparison of the classical finite element and
k-refinement methods revealed that the k-method has better approximation properties than the
classical finite element method on a per degree-of-freedom basis, further suggesting that the k-
refinement method is an accurate and robust scheme for approximating solutions to partial
differential equations. These results are consistent with observations made previously based on
discrete Fourier analysis and the numerical solutions of boundary value problems.
4. Actuator behavior
The vibration of a free-free piezoceramic discs is measured and compared with a three-
dimensional isogeometric finite element model solution. The resonance frequencies as well as the
modeshapes (visually) are compared. This analysis is used to validate the three-dimensional IGA
model. The general mode shapes are the same for the coupled and free disc case. The analysis is
motivated by the excitation of Lamb waves. Therefore, a frequency range 10 kHz≤f≤300 kHz is
chosen, because for 2 mm plate thicknesses no higher order Lamb wave modes occur.
The eigenmodes of a general circular plate can be separated in different types. Tangential
modes, which are described by Huang et al. (2004) are excluded here since they have a weak
appearance. Also the thickness modes are not considered. For piezoceramic plates with thicknesses
less than 2 mm considered here they occur at frequencies higher than 1 MHz PIC. These
frequencies are outside the investigated frequency domain 10 kHz≤f≤300 kHz. Only bending and
radial modes are studied in this investigation. If the piezoceramic is applied to a structure these
types of eigenmodes will primarily activate Lamb waves. Moreover, both mode types exist in the
regarded frequency domain where only the two basic Lamb wave modes arise. Fig. 5(a) displays
the used coordinate system and the direction of the polarization of the piezoceramic discs of
44

Analysis of the dynamical behavior of piezoceramic actuators using…
(a) Coordinates of the piezoceramic disc of
diameter d and thickness h
(b) Example for a real piezoceramic disc (d=10
mm, h=0.5 mm, PIC-181)
Fig. 5 Uncoupled piezoceramic disc
Table 1 Comparison of measurement (M.) of free piezoceramics with the isogeometric solution (S.) (1 - PIC-
151, d=10 mm, h=1 mm; 2 - PIC-181, d=10 mm, h=0.5 mm; 3 - PIC-181, d=10 mm, h=2 mm; 5 - PIC-181,
d=16 mm, h=1 mm; 6 - PIC-181, d=16 mm, h=2 mm; 7 - PIC-151, d=40 mm, h=0.5 mm)
S. M. 1[kHz] 2[kHz] 3[kHz] 4[kHz] 5[kHz] 6[kHz] 7[kHz]
M.
28.9 17.7 38.8 59.7 12.9 23.4 -
S. 27.3 16.7 32.4 58.6 12.97 24.7 0.8
M.
58.1 33.2 63.1 109.5 24.3 48.1 1.9
S. 53 32.2 61.4 106.1 24.9 46.4 1.77
M.
63.5 40.1 74.4 123.3 29 55.3 2.05
S. 60.9 38.6 72.1 120.7 29.7 54.1 2.1
M.
106.8 68.1 124 192.1 49.4 90.4 3.7
S. 101.8 66.9 120.6 187.9 51.1 88.6 3.7
M.
117.5 72.5 132.2 199.6 53.2 95.8 4.15
S. 107.3 69.6 125.2 191.3 53.4 91.4 3.9
M.
156.6 103.5 179.7 263.5 74.6 129.8 5.5
S. 147.8 101 175 257.3 76.4 126.1 5.7
M.
192.1 119.6 205.5 295.8 86.5 149 6.9
S. 168.2 115.2 197 276 86.9 140.7 6.6
M.
204.5 128.7 222 - 95.2 161.3 7.6
S. 192.9 126.8 215 301.8 95.5 153.7 7.3
diameter d and thickness h. To measure the eigenfrequencies a linear chirp signal is generated
utilizing the piezoceramic actuator. The piezoceramic disc is mounted on foam (free) and the
45

Christian Willberg
response of the structure is measured at the bottom surface. Fig. 5(b) shows an example of a free
disc made of PIC-181 with the wire and the soldering points at the top surface and a diameter d=10
mm and a thickness h=0.5 mm. The numerical model neglect soldering points and only the pure
circular disc comparable with Fig. 5(a) is modeled.
The eigenfrequencies utilizing the isogeometric finite elements are calculated as
( ) (18)
U is the eigenvector, K is the stiffness matrix and M is the mass matrix. The indices uu, u,
u and denote displacement-displacement, displacement-electrical potential, electrical
potential-displacement and electrical potential-electrical potential, respectively (see Eq. (9a) and
Eq. (9b)).
4.1 Bending modes of the piezoelectric circular plate
Seven piezoceramic discs are studied with different material properties as well as different
geometries. The material properties of PIC-151 and PIC-181 are given in Table 6. The out-of-plane
component of the velocity of the bottom surface of each disc is measured after applying the
external broadband signal. Therefore, no wire or soldering point disturbs the laser beam. Table 1
shows seven measured bending modes compared with an isogeometric finite element solution. The
dominant displacements are in x3-direction. It must be noted that the wire and soldering points
which are illustrated in Fig. 5(b) have only a low influence on the eigendynamic of the discs
Willberg et al. (2009). Therefore, they are not included in the numerical model. Nevertheless, the
results in Table 1 show a good agreement (error is smaller than 10% with respect to the numerical
solution with exception of one result) between the simulations (S.) and the measurements (M.).
The sequence of the mode appearance as well as the mode shapes is similar.
4.2 Radial modes of the piezoelectric circular plate For the comparison of the radial modes with the experimental and the isogeometric results an
analytical solution has been used. The radial eigenfrequencies fj correspond to eigenvalues of the
characteristic equation of the analytical solutions. The eigenvalues are only dependent of the
Poisson’s ratio of the x1-x2-plane 12. For a Poison’s ratio of 12=0.34 the first four eigenvalues zj
are given by Giurgiutiu (2008) as
z1=2.074; z2=5.397; z3=8.576; z4=11.73
With the values of zj the eigenfrequencies fj can be directly calculated as
√
𝜈
𝑧
𝑎 (19)
The experimental identification of the radial modes has been done using 3D scanning laser
vibrometry measurements. An example is shown in Fig. 6. All three spectra and the corresponding
in-plane mode shape are plotted. The graphs show that the in-plane modes also produce
remarkably high secondary out-of-plane components. It has been observed that even in out-of-
plane spectra measured with a 1D vibrometer radial mode peaks are to be observed (cf. Fig. 6(c)).
46

Analysis of the dynamical behavior of piezoceramic actuators using…
(a) u1-displacement (b) u2-displacement
(c) u3-displacement (d) Measured mode shape 𝑢 𝑎𝑔 √𝑢
𝑢 ;
f=222 kHz
Fig. 6 3D measurement of a piezoceramic (d=10 mm, h=0.5 mm, PIC-181)
(a) Radial mode 1 (b) Radial mode 2
Fig. 7 First in-plane eigenmode of the analytical solution Table 2 of an undisturbed piezoceramic
In those cases it is not possible to correlate a fundamental bending mode shape shown in Table 1
(and higher ones too) to the measured peaks. The isogeometric simulations show that many
47

Christian Willberg
bending modes coexist around the higher resonance frequencies of the first radial mode. This is
also validated by the experimental results. A splitting of the mode types by 1D (out-of-plane)
measurements is not possible. If the in-plane components are observed, the mode shape of an in-
plane mode can be seen (cf. Fig. 6(d)). Fig. 7 shows the eigenform of the eigenfrequencies plotted
in Table 2. Due to ideal symmetry for the numerical or analytical model two modes with the same
frequency exists, cf. Fig. 7. Because, knowing the in-plane spectra are sometimes not enough to identify the radial
eigenfrequencies without a doubt, additional measurements have been done. Following Huang et
al. (2004) only in-plane and thickness modes cause resonance peaks in the spectrum of electrical
impedance. The resonance values obtained by the impedance measurements are given by Pohl et
al. (2012). The analytical as well as the isogeometric finite element solution determine all first
radial modes correctly. Moreover, as Eq. (19) states, a change of the height of the piezoceramic
disc has no influence on the resonance frequencies. Both, the experiments and the isogeometric
finite element results show such behavior.
4.3 Vibration of the coupled piezoceramic actuator The design of a piezoceramic patch actuator for structural health monitoring applications
should guarantee a most effective Lamb wave generation. According to Kessler et al. (2002) and
Su et al. (2006) the most effective generation of Lamb waves is accomplished, if the actuator
length or diameter d, respectively, is related to the wave length in the following manner
. . (20)
describes the wavelength of the regarded Lamb wave mode and n is an arbitrary integer n=0, 1,
2, …). To investigate the resonance effects a CFRP plate with a [(0/90)_f/+45/-45/(0/90)f]Sym layup
Table 2 Comparison of the experimental data (3D vibrometry and impedance measurements) with the
analytic solution of the radial eigenfrequencies
Diameter
[mm] Material
Height
[mm]
Analytical
[kHz]
Numerical
[kHz]
3D vibrometer
[kHz]
Impedance
[kHz]
10 PIC-151 1 190.77 192.9 195 195
40 PIC-151 0.5 47.69 48.4 - 49
10 PIC-181 0.5 228.32 233.7 222 225
10 PIC-181 1 228.32 233 225 224
10 PIC-181 2 228.32 230.3 224 223
Table 3 Optimal frequencies for Lamb mode generation in a CFRP plate up to 500 kHz in 0°-direction
Willberg et al. (2013)
n [m] f of A0 [kHz] f of S0 [kHz]
0 0.0200 40.7 276
1 0.0067 186 >500
2 0.0040 335 >500
3 0.0029 480 >500
48

Analysis of the dynamical behavior of piezoceramic actuators using…
and a plate thickness of 2 mm is examined. Table 3 shows the first four optimal wavelengths for
this CFRP plate. The values are determined using Eq. (20) in combination with the measured
dispersion curves to get the frequencies which are corresponded to the wavelengths Pohl et al.
(2012). The experimental investigation has been done between 0 and 500 kHz. Only one optimal
excitation frequency of the S0-mode and three for the A0-mode are within the considered frequency
range.
Circular shaped piezoceramic actuators with three different heights (0.5 mm, 1 mm, 2 mm) and
a diameter d=10 mm are glued on the CFRP plate. A linear swept-frequency cosine signal is used
to excite Lamb waves with multiple frequencies. Two measurements are performed for each
piezoceramic. First the surface of the ceramic is scanned to gain the frequency response of the
ceramic. The second measurement measures the CFRP plate. The measurement has been done
avoiding reflections from the edges. By taking the wave numbers of the A0- and S0- mode it
ispossible to plot the frequency response spectra of each mode. Therefore, a 3D FFT is performed
on the data of the measured C-scan of the laser vibrometer to detect the temporal periodicities
(frequencies) and the spatial periodicities (wave numbers) of the propagating signals Alleyne and
Cawley (1991). In doing so the separated frequency amplitude curve can be determined.
(a) S0-mode spectra (b) A0-mode spectra
(c) Spectra of piezoceramic disc
Fig. 8 Spectra for the Lamb wave modes for a CFRP plate and different piezocermic discs - Type 1 (d=10
mm, h=0.5 mm), Type 2 (d=10 mm, h=1 mm) and Type 3 (d=10 mm, h=2 mm)
49

Christian Willberg
(a) Phase velocity (b) Group velocity
Fig. 9 Dispersion curves of CFRP plate with a [(0/90)_f/+45/-45/ (0/90)f]Sym layup Ahmad (2011)
If Eq. (20) holds the A0-mode experiences a first maximum at 40.7 kHz and the S0-mode at 276
kHz. The experimental results are displayed in Fig. 8(a)-8(c). The noise in the S0-mode spectra are
caused by the great wavelength and the small displacement in x3-direction. The different curves
from Fig. 8 show a close relation between the resonances of the piezoelectric actuators and the
spectra of the Lamb wave modes. The frequencies corresponding to certain values of Lamb wave
wavelength for the CFRP plate have been derived from Eq. (20) and are given in Table 3 for
frequencies up to 500 kHz both for the S0- and A0-mode, cf. Fig. 9 for the corresponding
dispersion curves. Comparing the measured resonance frequencies (Fig. 8) with the calculated data
from Table 3 it can be concluded that Eq. (20) cannot be applied for thicker piezoceramic
actuators. For example for a frequency of f=335 kHz an optimal excitation for the A0-mode should
occur. Only the type 1 piezoceramic shows a maximum. It is evident that the eigenfrequencies of
the actuator in connection with the structure have a major impact on the excited Lamb wave
amplitudes. The assumption that an optimal excitation of Lamb modes occurs if the diameter of
the piezoceramic disk is one half of an integer number of the wavelengths does not hold under any
circumstance Pohl et al. (2012). Only for thin ceramics it can be confirmed that the lowest
eigenfrequency calculated with Eq. (20) coincides with the measurements. In all other cases no
agreement with measurements could be observed, meaning that the application of Eq. (20) to
estimate optimal excitation frequencies cannot be recommended.
For SHM systems the application of higher frequencies are preferable due to an improved
resolution and a better ability to detect damages. The resonances play a major role in the excitation
of Lamb waves. For thicker piezoceramics it is the dominant effect which influences the
amplitudes of the excited Lamb waves Ha (2010), Mohamed et al. (2011). This effect can be used
to reduce the input energy of the actuators. The adhesive layer as mentioned before shifts the
position of the resonances. Therefore, a tuning of the optimal frequency should be applied to
receive an optimal excitation.
4.4 Influence parameters to the Lamb wave excitation
The experiments have shown that the resonances of the coupled piezoceramic actuator have a
50
Analysis of the dynamical behavior of piezoceramic actuators using…
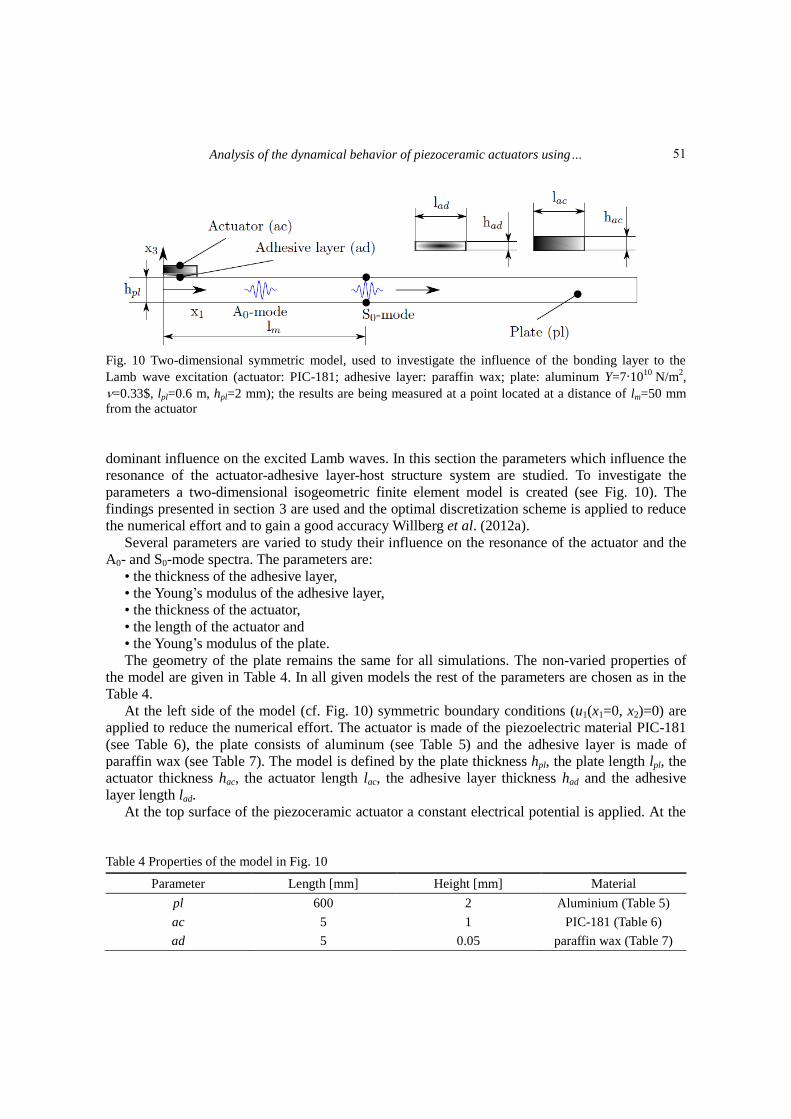
Fig. 10 Two-dimensional symmetric model, used to investigate the influence of the bonding layer to the
Lamb wave excitation (actuator: PIC-181; adhesive layer: paraffin wax; plate: aluminum Y=7∙1010
N/m2,
=0.33$, lpl=0.6 m, hpl=2 mm); the results are being measured at a point located at a distance of lm=50 mm
from the actuator
dominant influence on the excited Lamb waves. In this section the parameters which influence the
resonance of the actuator-adhesive layer-host structure system are studied. To investigate the
parameters a two-dimensional isogeometric finite element model is created (see Fig. 10). The
findings presented in section 3 are used and the optimal discretization scheme is applied to reduce
the numerical effort and to gain a good accuracy Willberg et al. (2012a).
Several parameters are varied to study their influence on the resonance of the actuator and the
A0- and S0-mode spectra. The parameters are:
• the thickness of the adhesive layer,
• the Young’s modulus of the adhesive layer,
• the thickness of the actuator,
• the length of the actuator and
• the Young’s modulus of the plate.
The geometry of the plate remains the same for all simulations. The non-varied properties of
the model are given in Table 4. In all given models the rest of the parameters are chosen as in the
Table 4.
At the left side of the model (cf. Fig. 10) symmetric boundary conditions (u1(x1=0, x2)=0) are
applied to reduce the numerical effort. The actuator is made of the piezoelectric material PIC-181
(see Table 6), the plate consists of aluminum (see Table 5) and the adhesive layer is made of
paraffin wax (see Table 7). The model is defined by the plate thickness hpl, the plate length lpl, the
actuator thickness hac, the actuator length lac, the adhesive layer thickness had and the adhesive
layer length lad.
At the top surface of the piezoceramic actuator a constant electrical potential is applied. At the
Table 4 Properties of the model in Fig. 10
Parameter Length [mm] Height [mm] Material
pl 600 2 Aluminium (Table 5)
ac 5 1 PIC-181 (Table 6)
ad 5 0.05 paraffin wax (Table 7)
51

Christian Willberg
bottom surface of the actuator the electrical potential is set to zero. A broad-band excitation signal
(linear chirp)
𝜙 ��sin [ (
) ] (21)
is used. The start frequency f0 and end frequency f1 are chosen as f0=10 kHz and f1=500 kHz. The
time is given as t1=1/f0.
The displacements of the top surface of the piezoceramic actuator and the displacements of a
top (x3=+hpl/2) and a bottom (x3=-hpl/2) node of the plate in a distance lm=50 mm are monitored.
The average displacement of the top surface of the piezoceramic is used to determine the spectrum
of the applied actuator. The displacements of the top and bottom node of the plate are used to
separate the two Lamb modes from each other without performing a 2D FFT. After applying a FFT
to the time-dependent data, three spectra are gained similar to Fig. 8.
Fig. 11(a)-Fig. 11(c) show the simulated u3-displacement spectra of the two-dimensional model
of the two basic Lamb wave modes and the piezoceramic actuator. The model is defined as
illustrated in Fig. 10 and Table 4 without varied parameter. As illustrated in the experimental
investigation in the previous section there is a dominant coupling between the actuator
eigendynamic and the excited Lamb waves. As in the experiments the A0-mode is strongly
influenced by the low frequency peaks in the piezoceramic spectrum. This is an indicator for the
existence of bending modes in this frequency domain. As shown in the previous section these
eigenmodes have a greater influence on the A0-mode than on the S0 one. On the other side, the first
in-plane eigenmode (radial mode for circular shaped actuators in 3D) at f=237 kHz has a strong
impact to the symmetric S0-mode which leads to a high peak in the spectrum on the symmetric
mode.
All of the described effects occur (occurrence of in-plane and bending modes of piezoceramic
actuators) in each cutting plane perpendicular to the surface of the plate. Therefore, it can be said
that the general properties of the coupled actuator-structure system in comparison of the numerical
and experimental results can be described by a simple two-dimensional model.
(a) S0-mode spectrum (b) A0-mode spectrum
Fig. 11 Spectra of u3-displacement of the two-dimensional model without parameter variation
52

Analysis of the dynamical behavior of piezoceramic actuators using…
(c) Spectrum of piezoceramic disc
Fig. 11 Spectra of u3-displacement of the two-dimensional model without parameter variation
4.4.1 Influence of the adhesive layer The impact of the adhesive layer to the coupling between an actuator and a structure is well
known for thin piezoceramic patches. If a patch actuator is glued to the surface of a structure the so
called “shear lag” effect can be observed. The “shear lag” is caused by an adhesive layer of finite
thickness between the actuator and the host structure (see Fig. 12). The excitation signal from the
actuator is transmitted to the structure through interfacial shear stresses within the bonding layer
for the most part Sohn and Lee (2010). The “shear lag” causes a reduction of shear strain transfer
between the PZT actuator and the host structure. With a lower shear modulus and a thicker
adhesive layer, the “shear lag” effect becomes more pronounced. As a result, the signal amplitude
is reduced significantly if the resonance effects play a minor role Ha (2009). Due to this effect the
effective length of a piezoelectric actuator is smaller than the actual length. Consequently, it can be
assumed, that only a fraction of the actual surface of a piezoelectric actuator contributes to the
strain transfer. Thus, correction factors have to be applied in order to account for the “shear lag”
effect. Based on analytical models (e.g., Euler-Bernoulli beam theory)
Correction factors for various problems assuming the application of thin piezoceramics (≈0.2
mm) only have been derived in Crawley and de Luis (1987), Giurgiutiu (2008), Sirohi and Chopra
(2000).
For thicker piezoceramics the resonances of the coupled actuator-structure system play a more
important role and superimpose the “shear lag”' effect. Moreover, the assumptions made by the
Euler-Bernoulli beam theory are not fulfilled in the case of thick ceramics and the correction
Fig. 12 Schematic representation of the “shear lag” effect
53

Christian Willberg
factors can be overestimated. Therefore, two parameters of the adhesive layer are varied to study
their influence to the first resonance of the S0-mode.
The A0-mode spectrum has no clear first resonance peak caused by the first in-plane mode of
the piezoceramic. This mode is influenced by the bending modes as well as the in-plane modes.
Because, both modes are affected differently by a parameter variation the analysis has been shown
that the equal resonance peak of the A0-mode is harder to find for the variations compared to the
S0-mode spectra, cf. Fig. 11(a). Therefore, the movement of the resonance peak in the A0-mode
spectrum caused by the in-plane mode is hard to determine and no analysis of this spectrum has
been done.
Adhesive layer thickness: The adhesive layer thickness had is varied between
𝜇m… 𝜇m. The change in the first resonance frequency as well as the amplitude of this
excitation frequency is observed for the S0-mode. Fig. 13(a) shows the frequency of the first peak
in the S0-mode spectrum as a function of the adhesive layer height. The frequency decreases for a
greater adhesive layer thickness. As illustrated before, for the experimental model in Fig. 8 and the
numerical model in Fig. 11, there is a connection between the dynamic behavior of the
piezoceramic actuator and the spectra of the two Lamb wave modes. Because the coupled actuator-
structure system becomes softer the resonance frequencies of the actuator shift to a lower
frequencies.
The amplitude of the resonance peak increases (see Fig. 13(b)). This disagrees with the “shear
lag” effect, which states that higher thicknesses lead to a reduction in the amplitudes of the excited
Lamb wave modes. The amplitude curve is not steady because near the first in-plane
eigenfrequency other peaks occur. The in-plane mode is superposed by bending modes. Both mode
types are influenced differently by the adhesive layer height and depending on how similar the
resonance frequencies of both mode types are, the amplitudes increase or decrease. However, only
great changes ( 𝜇m or more) in the adhesive layer thickness lead to a noticeable change in
frequency and amplitude. Therefore, the adhesive layer thickness could be used in the design
process to alter the eigenfrequencies of the piezoceramic actuator. Small variations (<10%
thickness variation) caused by the production process are negligible from the original design.
(a) Frequency of the first resonance peak (b) Amplitude of the first resonance peak
Fig. 13 Influence of the thickness had of the adhesive layer to the frequency and to the amplitude of the
S0-mode
54

Analysis of the dynamical behavior of piezoceramic actuators using…
(a) Frequency of the first resonance peak (b) Amplitude of the first resonance peak
Fig. 14 Influence of the Young’s modulus Yad of the adhesive layer to the amplitude of the S0-mode
Adhesive layer stiffness: The adhesive layers Young’s modulus Yad is varied between 0.5⋅109
N/m2...3300⋅10
9 N/m
2. The lower bound correlates to 50% of the Young’s modulus of paraffin and
the upper bound of the Young’s modulus correlates to epoxy, which is typically used to glue
piezoceramics irreversible to structures. The influence of the stiffness change in the adhesive layer
to the frequency of the first peak in the S0-mode spectrum is illustrated in Fig. 14(a). For higher
Young’s moduli the first resonance peak shifts to higher frequencies. The results show that the
Young’s modulus of different adhesive layers (epoxy or paraffin) does not change the frequency of
the first peak drastically.
Fig. 14(b) shows the amplitude of the first peak in the S0-mode spectrum as a function of the
Young’s modulus of the adhesive layer. Higher Young’s moduli cause a reduction in amplitude.
This behavior disagrees with the “shear lag” effect and underline that for thicker piezoceramics the
eigendynamic superimposes the “shear lag” effect Ha (2010), Willberg et al. (2013). Variations of
the material properties of the adhesive layer do not seem to influence the first resonance frequency
drastically. Therefore, changes in the material properties due to temperature variations and/or
variations caused by a variance in the production process are negligible in the design process.
In summary one can say that the “shear lag” correction factor based on the assumption of the
Euler-Bernoulli beam theory does not work correctly in resonance regions of the actuator to
predict the amplitude losses caused by adhesive layer changes. Therefore, more detailed analyses
are needed.
4.4.2 Influence of the actuator geometry After studying the influence of the adhesive layer on the Lamb wave excitation the impact of
the actuator geometry is observed. Firstly, the length is studied and secondly the thickness of the
actuator.
Actuator length: The piezoceramic actuator length lac is varied between 2 mm…16 mm. The
influence of this variation on the first resonance frequency is illustrated in Fig. 15(a). There is
approximately a 1/d correlation (analytical) between the length of the actuator and the first peak in
the S0-mode spectrum caused by the first radial eigenfrequency of the piezoceramic actuator. This
coincides with the behavior of the radial eigenfrequencies of the a free circular disc in Eq. (19).
55

Christian Willberg
(a) Frequency of the first resonance peak (b) Amplitude of the first resonance peak
Fig. 15 Influence of the length lac of the adhesive layer to the amplitude of the S0-mode
(a) Frequency of the first resonance peak (b) Amplitude of the first resonance peak
Fig. 16 Influence of the thickness hac of the adhesive layer to the amplitude of the S0-mode
The value of the u3-displacement illustrated in Fig. 15(b) first increases and for lengths lac>9 mm
decreases.
This behavior could be explained as a result of superposition of the first radial and a bending
mode. Both modes are differently influenced by extending the length of the actuator; 1/d for the
radial mode and 1/d2 for the bending modes Pohl et al. (2012). For lengths between 7 mm and 10
mm the frequency of a lower order bending mode correlates with the first radial mode. The
optimal diameter calculated with Eq. (20) optimal diameter for the actuator does not agree with the
results. That is to say, the changes in the actuator length strongly influence the dynamic behavior.
But also here small changes due to the production process can be neglected (variation<10%).
Actuator thickness:
The piezoceramic actuator thickness hac is varied between 0.1 mm…3 mm. In Fig. 16(a) the
frequency as a function of the actuator thickness is plotted. Changes in the thickness has a low
influence the resonance frequency (compared to a change of the length) of the radial eigenmode as
56

Analysis of the dynamical behavior of piezoceramic actuators using…
(a) Frequency of the first resonance peak (b) Amplitude of the first resonance peak
Fig. 17 Influence of the Young’s modulus Ypl of the plate to the amplitude of the S0-mode
Eq. (19) stated for the free elastic disc, except the strong decrease between 0.2 mm and 0.6 mm.
Experimental and numerical investigations of the free piezoceramic disc show that the
eigenfrequencies for thicker piezoceramics are higher. In this research the frequency of the first
peak of the S0-mode spectrum is considered. If a bending mode moves near a radial mode, both
modes superpose each other and lead to higher amplitudes. The first peak is shifted to lower
frequency regions.
The amplitudes of the peaks in the S0-mode spectrum are plotted in Fig. 16(b). For thicker
piezoceramics the amplitudes increase. The S0-mode is dominantly excited by shear stresses.
Therefore, a higher bending stiffness due to the greater actuator thickness leads to a better shear
stress transfer into the structure. Moreover, the bending modes are influenced by the greater
bending stiffness. The frequency of the lower order bending modes shifts to higher frequencies.
The superposed resonances lead then to higher amplitudes as one can see in Fig. 16(b).
4.4.3 Influence of the plate stiffness In this section the influence of the plate stiffness is investigated. The Young’s modulus of the
plate Ypl is varied between 5⋅109…2.1⋅10
11 N/m
2. The density is constant and chosen as alu=2700
kg/m3. Fig. 17(a) shows the frequency of the first peak of the S0-mode spectrum as a function of
the variation of the Young’s modulus. The frequency changes between 200 kHz and 244 kHz
without any noticeable connection to the change of the plates Young’s modulus. The amplitudes
behavior of the first peak of the S0-mode is plotted in Fig. 17(b). For very low a Young’s modulus
the amplitude is high. In that case the resistance to a deformation of the plate is lower and thus
higher amplitudes are possible. In contrast to the frequency behavior in Fig. 17(a) there is a
coupling between the amplitude reduction and the plate stiffness, except for a small variation
between Ypl=2…2.5⋅1011
N/m2.
5. Conclusions
The paper presented the analysis of dynamic effects of piezoceramic actuators due to Lamb
wave excitation. To perform this analysis in an effective way isogeometric finite elements have
been utilized. It has been shown that a k-refinement causes the better convergence of the elements
57

Christian Willberg
compared to an equal order spectral finite element. Therefore, the conclusion is to use the highest
possible continuity to reduce the numerical effort.
The analysis of the dynamic actuator effects have shown, that for coupled piezoceramics the
optimal excitation assumption stated by Kessler et al. (2002) is not valid for thicker piezoceramics.
To obtain an optimal actuator design a numerical study has been performed. Various parameters
have been varied to take the effect of geometry and adhesive bondline into account. The variation
of the adhesive layer thickness shows that only great thickness changes influence the position of
the first peak in the S0-mode spectrum noticeably. Therefore, this parameter could be used to adapt
the position of the first peak. However, small variation in the adhesive layer thickness barely
influences the position of the peak and thickness variations during the production process do not
have to be taken into account for the design. The Young’s modulus of the adhesive layer has a low
impact on the first peak in the S0-mode spectrum as well as to the corresponding amplitude. Small
variations of the material properties of the adhesive layer during the production process or caused
by temperature variations do not change the dynamical behavior of the piezoceramic actuator
significantly. The variation of the actuator length shows that for longer patches the frequency of
the first peak in the S0-mode spectrum decreases. This correlates with the analytical formulation of
the radial eigenfrequency of a circular disc. The corresponding amplitudes increase and decrease.
The bending and the radial mode of the piezoceramic are differently influenced by changing the
length of the actuator. Therefore, for a specific frequency both modes superimpose. As a result the
amplitudes of the excited S0-mode are increased. An optimal energy efficient actuator design tries
to superimpose both resonances.
The variation of the thickness of the actuator shows that the optimal Lamb wave excitation is
not only dependent on the length of the actuator. For greater thicknesses the frequency of the first
maxima of the symmetric mode is reduced. The amplitude of this maximum increases for a greater
thickness. This numerical result agrees with the experimental findings and disagrees with “shear
lag” predictions. The resonances of the actuator have a great impact on the excited Lamb wave
mode. This effect covers the “shear lag” effect and is more dominant in influencing Lamb wave
amplitudes than the adapted length proposed by Giurgiutiu (2008). The variation of the plate
Young’s modulus shows that the position of the first peak in the S0-mode spectrum is dominantly
influenced by the piezoceramic source. The amplitudes, except for soft plates (Ypl<1011
N/m2),
show only small variations.
In summary the design of an optimal shaped piezoceramic actuator (working in resonance)
could be made for a fixed adhesive layer and a given plate material. Small changes in the adhesive
layer, actuator geometry and plate stiffness do not dominantly change the behavior of the
piezoceramic source.
References
Adam, C., Bouabdallah, S., Zarroug, M. and Maitournam, H. (2015), “Stable time step estimates for
NURBS-based explicit dynamics”, Comput. Meth. Appl. Mech. Eng., 295(581-605), doi:
http://dx.doi.org/10.1016/j.cma.2015.03.017.
Ahmad, Z.A.B. and Gabbert, U. (2012), “Simulation of Lamb wave reflections at plate edges using the semi-
analytical finite element method”, Ultrasonics, 52(7), 815-820.
Ahmad, Z.A.B. (2011), “Numerical Simulations of Lamb waves in plates using a semi-analytical finite
element method”, Ph.D. thesis, Otto-von-Guericke-University of Magdeburg, Fortschritt-Berichte VDI
Reihe 20, Nr. 437, Düsseldorf: VDI Verlag, ISBN:978-3-18-343720-7.
58

Analysis of the dynamical behavior of piezoceramic actuators using…
Alleyne, D. and Cawley, P. (1991), “A two-dimensional Fourier transform method for the measurement of
propagating multimode signals”, J. Acoust. Soc. Am., 89(3), 1159-1168.
Bazilevs, Y. (2006), “Isogeometric analysis of turbulence and fluid-structure interaction”, Ph.D. thesis, The
University of Texas at Austin.
Boller, C., Chang, F.-K. and Fijino, Y. (2009), Encyclopedia of Structural Health Monitoring, John Wiley &
Sons, ISBN-10: 0470058226.
Cottrell, J.A., Hughes, T.J.R. and Bazilevs, Y. (2009), Isogeometric analysis: Toward integration of CAD
and FEA, John Wiley & Sons, ISBN-10: 0470748737.
Crawley, E.F. and de Luis, J. (1987), “Use of piezoelectric actuators as elements of intelligent structures”,
AIAA J., 25(10), 1373-1385.
de Boor, C. (1972), “On calculating with B-splines”, J. Approx. Theory, 6(1), 50-62.
Duczek, S. (2014), “Higher order finite elements and the fictitious domain concept for wave propagation
analysis”, Ph.D. thesis, Otto-von-Guericke-University of Magdeburg, Fortschritt-Berichte VDI Reihe 20,
Nr. 458, Dusseldorf: VDI Verlag, ISBN: 978-3-18-345820-2.
Evans, J.A., Bazilevs, Y., Babuska, I. and Hughes, T.J.R. (2009), “n-Widths, sup-infs, and optimality ratios
for the k-version of the isogeometric finite element method”, Comput. Meth. Appl. Mech. Eng., 198(21),
1726-1741.
Giurgiutiu, V. (2008), Structural Health Monitoring with Piezoelectric Wafer Active Sensors, Academic
Press (Elsevier), ISBN-13: 978-0-12-088760-6.
Ha, S. (2009), “Modeling Lamb wave propagation induced by adhesively bonded PZTs on thin plates”,
Ph.D. thesis, Stanford University, California, USA.
Ha, S. (2010), “Adhesive interface layer effects in PZT-induced Lamb wave propagation”, Smart Mater.
Struct., 19(2), 025006.
Huang, C.-H., Lin, Y.-C. and Ma, C.-C. (2004), “Theoretical analysis and experimental measurement of
resonant vibration of piezoceramic circular plates”, IEEE Trans. Ultrasonic., Ferroelect., Freq. Control,
51(1), 12-24.
Hughes, T.J.R., Cottrell, J.A. and Bazilevs, Y. (2005), “Isogeometric analysis: CAD, finite elements,
NURBS, exact geometry and mesh refinement”, Comput. Meth. Appl. Mech. Eng., 194(39), 4135-4195.
Ikeda, T. (1996), Fundamentals of piezoelectricity, Oxford science publications, Oxford University Press,
ISBN 9780198564607.
Kessler, S., Spearing, M. and Atallab, M. (2002), “In-situ damage detection of composites structures using
Lamb wave methods”, In Proceedings of the First European Workshop on Structural Health Monitoring,
10-12 July 2002 Paris France.
Marinkovic, D., Köppe, H. and Gabbert, U. (2006), “Numerically efficient finite element formulation for
modeling active composite laminates”, Mech. Adv. Mater. Struct., 13(5), 379-392.
Mohamed, R., Demer, D.L. and Masson, P. (2011), “A parametric study of piezoelectric thickness effect on
the generation of fundamental Lamb modes”, Hlth. Monit. Struct. Biol. Syst., Proceedings of SPIE Vol.
7984.
Mook, G., Pohl, J. and Michel, F. (2003), “Non-destructive characterization of smart CFRP structures”,
Smart Mater. Struct., 12(6), 997-1004.
PI Ceramic GmbH, Lederhose - GERMANY (2011), http://www.piceramic.com/index.php.
Piegl, L. and Tiller, W. (1995), The NURBS Book, Springer, ISBN: 3-540-55069-0.
Pohl, J., Willberg, C., Gabbert, U. and Mook, G. (2012), “Theoretical analysis and experimental
determination of the dynamic behaviour of piezoceramic actuators for SHM”, Exp. Mech., 51(4), 429-438.
Samal, M.K., Seshu, P., Parashar, S., von Wagner, U., Hagedorn, P., Dutta, B.K. and Kushwaha, H.S.
(2005), “A finite element model for nonlinear behaviour of piezoceramics under weak electric fields”,
Finit. Element. Anal. Des., 41(15), 1464-1480.
Schmicker, D., Duczek, S., Liefold, S. and Gabbert, U. (2014), “Wave propagation analysis using high-order
finite element methods: Spurious oscillations excited by internal element eigenfrequencies”, Technische
Mechanik, 34(2), 51-71.
Sirohi, J. and Chopra, I. (2000), “Fundamental understanding of piezoelectric strain sensors”, J. Intellig.
59

Christian Willberg
Mater. Syst. Struct., 11(4), 246-257.
Sohn, H. and Lee, S.J. (2010), “Lamb wave tuning curve calibration for surface-bonded piezoelectric
Transducers”, Smart Mater. Struct., 19(1), 015007.
Su, Z. and Ye, L. (2009), Identification of Damage Using Lamb Waves: From Fundamentals to
Applications, Springer, ISBN: 978-1-84882-783-7.
Su, Z., Ye, L. and Lu, Y. (2006), “Guided Lamb waves for identification of damage in composite structures:
A review”, J. Sound Vib., 295(3), 753-780.
Willberg, C. (2013), “Development of a new isogeometric finite element and its application for Lamb wave
based structural health”, Ph.D. thesis, Otto-von-Guericke-University of Magdeburg, Fortschritt-Berichte
VDI Reihe 20, Nr. 446, Dusseldorf: VDI Verlag, ISBN: 978-3-18-344620-9.
Willberg, C. and Gabbert, U. (2012), “Development of a three-dimensional piezoelectric isogeometric finite
element for smart structure applications”, Acta Mechanica, 223(8), 1837-1850.
Willberg, C., Vivar-Perez, J.M., Ahmad, Z. and Gabbert, U. (2009), “Simulation of piezoelectric induced
Lamb wave motion in plates”, In Proceedings of the 7th International Workshop on Structural Health
Monitoring 2009: From System Integration to Autonomous Systems, 2299-2307.
Willberg, C., Duczek, S., Vivar-Perez, J.M., Schmicker, D. and Gabbert, U. (2012a), “Comparison of
different higher order finite element schemes for the simulation of Lamb waves”, Comput. Meth. Appl.
Mech. Eng., 241, 246-261.
Willberg, C., Koch, S., Mook, G., Gabbert, U. and Pohl, J. (2012b), “Continuous mode conversion of Lamb
waves in CFRP plates”, Smart Mater. Struct., 21(7), 1-9.
Willberg, C., Duczek, S. and Gabbert, U. (2013), “Increasing the scanning range of Lamb wave based SHM
systems by optimizing the actuator sensor design”, CEAS Aeronaut. J., 4(1), 87-98.
Willberg, C., Duczek, S., Vivar-Perez, J.M. and Ahmad, Z.A.B. (2015), “Simulation methods for guided
wave-based structural health monitoring: A review”, Appl. Mech. Rev., 67(1), 010803.
Zienkiewicz, O.C. and Taylor, R. (2000), The Finite Element Method, Volume 1: Basis, Butterworth-
Heinemann, ISBN: 0 7506 5049 4.
CC
60


