
Available online at
http://www.anpad.org.br/bar
BAR, Rio de Janeiro, v. 14, n. 4,
art. 1, e170036, 2017 http://dx.doi.org/10.1590/1807-7692bar2017170036
Analysts’ Consensus and Target Price Accuracy: A Study in Latin
America
Rafael Moreira Antônio1
Luciana Cardoso Siqueira Ambrozini1
Rafael Confetti Gatsios1
Vinícius Medeiros Magnani1
Universidade de São Paulo1
Received 3 May 2017; received in revised form 21 September 2017; accepted 25 September 2017;
first published online 14 November 2017.
Editor’s note. Paulo Sergio Ceretta served as Action Editor for this article.

R. M. Antônio, L. C. S. Ambrozini, R. C. Gatsios, V. M. Magnani 2
BAR, Rio de Janeiro, v. 14, n. 4, art. 1, e170036, 2017 www.anpad.org.br/bar
Abstract
Market analysts, by means of issuance of their opinions (earnings per share, target prices, and recommendations),
have been the object of several earlier studies. Previous literature identifies analysts as information intermediaries
between companies and investors, and identifies their role in reducing the information asymmetry. This study
investigates whether the estimated standard deviations of price-target shares issued by capital market analysts are
informative, and ascertains whether it is possible to identify smaller errors in analysts’ forecasts from the
verification of the consensus among them. The study is carried out in Latin American countries, and relies on a
database of 23,367 estimates of target-price shares during the period from October 2010 to January 2017. It also
takes into account the number of analysts who issued the estimates, the company market value, and the government
effectiveness between the countries. The results indicate that the greater the consensus (smaller standard
deviation), the smaller the forecast errors. Thus, the standard deviation of target-price estimates presents an informative tool to investors about forecast accuracy. Another important result shows that the greater the
government effectiveness, the greater the forecast accuracy of target-price estimates issued by the analysts.
Key words: target-price shares; market analysts; forecasts.

Analysts’ Consensus and Target Price Accuracy 3
BAR, Rio de Janeiro, v. 14, n. 4, art. 1, e170036, 2017 www.anpad.org.br/bar
Introduction
The information provided by analysts concerning bonds and securities are used by the market
participants in their investment decisions. The literature of this field reports a significant market reaction to analysts’ forecasts (e.g., Demiroglu & Ryngaert, 2010; Li & You, 2015). In this respect, results which
indicate a significant association between the excess of returns regarding the recommendation issuance
and the recommendation level are presented. Other studies in the field, such as the ones carried out by Barber, Lehavy, McNichols and Trueman (2001); Brav and Lehavy (2003); Stickel (1995); and Womack
(1996), suggest that target prices are significantly associated with excess returns in the period of the
event.
Analysts’ decision to follow and assess a company is associated with the incentives related to the
maximization of their reputation, the optimization of the reaction of the agents who use their reports (i.e.
managers and investors), and also with the value maximization of their analyses, since the majority of the models take for granted that their payments are linked to one or more of these incentives. Therefore,
analysts prefer to cover companies whose investors tend to react strongly to their forecasts, specially
companies which present a greater volume of shares traded (Beyer, Cohen, Lys, & Walter, 2010).
Moreover, each forecast type (earnings forecast, share and target-price recommendations) is an
enhancement to newsletters for the explanation of price movement (Beyer et al., 2010). However, Hansen (2015) highlights that empirical studies on how analysts create value by means of their activities,
and their effects on company value, keep evolving.
In order to corroborate, Li and You (2015) note that analysts’ forecasts add value to the companies analyzed, even though the way this value is created is not clear. Therefore, it is appropriate to discuss
the relationship between analysts’ consensus and market reaction.
On the other hand, Gul and Lundholm (1995) identified evidence that managers of financial resources tend to choose their portfolios based on the choices of other managers and financial market
agents, since from this perspective analysts’ forecasts tend follow the direction of others, thereby creating consensus in the estimates.
Nevertheless, Clement and Tse (2005) argue that the forecasts which originate from consensus present lower accuracy, and they also reflect less private information relevant to the analysts. For these
authors, the behavior of tendency to consensus reflects concerns related not only to the analyst’s career,
but also to his or her abilities to produce idiosyncratic information, which may generate asymmetrical
information for the market.
From the reputation and strategic forecasting theories, Huang, Krishnan, Shon and Zhou (2017)
argue that there is a tradeoff between analysts’ reputation and their strategic decisions when they make available the information they process. Thus, when making this information available, if their concern
in maintaining their reputation is stronger than their strategic and competitive decisions, the forecast
content may be degraded, and just the categorical and standard information is given to the market. On the other hand, Huang et al. (2017) argue that the forecasts adjusted by the consensus tendency present
less bias than individual forecasts, a finding which contradicts Clement and Tse’s (2005).
According to Yezegel (2015), analysts review their recommendations towards earnings surprise, which is measured based on their own estimates and consensus, since the relationship between pricing
of earnings and responsiveness to the analysts’ recommendations suggest that analysts contribute to
market efficiency. Nevertheless, this author argues that the analysts lend greater weight to consensus expectations than to their own forecasts.
When considering target prices, Bilinski, Lyssimachou and Walker (2013) observed that, in studies on analysts’ traits, reputation aspects and tendency to consensus also apply to the analyses
regarding the accuracy of target prices. The authors highlight that analysts who produced better past

R. M. Antônio, L. C. S. Ambrozini, R. C. Gatsios, V. M. Magnani 4
BAR, Rio de Janeiro, v. 14, n. 4, art. 1, e170036, 2017 www.anpad.org.br/bar
forecasts for target prices, who have experience in forecasting, who follow a greater number of
companies, who are experts in a country’s market, and who are employed by large brokerage firms, tend
to produce target prices with greater accuracy.
Several studies analyzed the relationship between accuracy and consensus, taking into account
several signs embedded in the consensus (e.g., Clement & Tse, 2005; Huang, Krishnan, Shon, & Zhou,
2017). However, it is discussed in the literature that the target price presents relevant predictive and informational power (Bilinski, Lyssimachou, & Walker, 2013; Da & Schaumburg, 2011), which is used
in this paper as a construct for analysis of the consensus effects in the market.
Therefore, considering the economic and reputation incentives that lead analysts to be inclined toward consensus, this paper intends to expand the discussion of the consequences of the effect of
consensus in the market, discussing specifically the effects on target prices. To this end, we seek to answer the following research question: When there is greater consensus among analysts on share target
prices, is the forecast error smaller?
A major contribution of this paper evidences that analysts’ consensus is an informative item for investors and users of this information. In addition, the results indicate that the greater the effectiveness
of government, the greater the mean accuracy of target price estimates issued by analysts.
Another aspect that reinforces the contribution of this study concerns the breadth of the countries (Latin America) and the period (2010 to 2017) that we analyze. It is important to emphasize that
investing in stocks is an alternative for investors who often do not understand the stock market, and follow analysts’ forecasts.
The work is organized in 6 sections. Following this introduction is a literature review of the studies on the consensus among analysts, and their forecasts and their effects on the stock market. Third
section presents the justification of the hypotheses, while Fourth section describes the methodology
aspects and the research tools which were used. Fifth section is a discussion and analyses of the results
found, while Sixth section offers final considerations of the research and of the whole work developed. A bibliographic reference is found at the end of the paper.
Literature Review
Consensus
The consensus tendency refers to the tendency of different agents, who make individual decisions,
to act similarly at the same time. Theoretically, two main reasons for such behavior are presented: the
individuals tend towards consensus or act in a similar way due to the fact that they have correlated
information, or because they are subject to an incentive structure which encourages imitation (Clement & Tse, 2005; Jegadeesh & Kim, 2010; Trueman, 1994).
Gul and Lundholm (1995) highlight that, in several situations, economic agents tend to underpin their decisions with the decision of other agents. The authors present a model in which the agents choose
a share and the time to act, demonstrating that their decisions cluster according to the information
distribution among themselves. Thus, the passage of time allows the first agent to anticipate some information from the second one, based on previous experiences.
When considering the context of the analysts’ actions, Guttman (2010) states that when obtaining
different private or relatively similar information in terms of accuracy (both initially and over time), analysts issue their forecast simultaneously, or at the same moment they would have issued them if other
analysts had not been present, broadening the discussion of tendency to consensus outside the time
factor.
Analysts’ Consensus and Target Price Accuracy 5
BAR, Rio de Janeiro, v. 14, n. 4, art. 1, e170036, 2017 www.anpad.org.br/bar
In these terms, aspects such as incentive structure and reputation tend to promote consensus based on the nature of their career and compensation system (Clement & Tse, 2005; Hong, Kubik, & Solomon,
2000; Scharfstein & Stein, 1990). Considering that the analysts’ actions are reflected in the market behavior, analyses which assess the market interpretation of the relationship with consensus becomes
relevant (Jegadeesh & Kim, 2010; Yezegel, 2015).
However, the literature has provided different results about the effects of consensus in the market. First, Clement and Tse (2005) argue that forecasts which do not follow the consensus are more complete
and provide more relevant and complete information. The authors point out that the tendency to provide
independent earnings increases when analysts are characterized by having experience providing forecasts with accuracy, by the size of the brokerage firm, by the analyst’s experience, and by the
reduction of the number of sectors the analysts cover, which corroborates the theory which relates
independent forecasts and issues of career and ability.
For these authors, monitoring of the consensus by analysts can reduce the information transmitted
by their individual forecasts in cases where the use of private information is not totally applied when
carrying out or reviewing forecasts, as they aim to just be close to the mean average.
On the other hand, Huang et al. (2017), with a database of analysts’ forecasts from 1990 to 2010,
argue that when adding multiple signs, the consensus tends to be more informative than the sum of individual parts. The authors observed that 60% of the analysts of their sample tend to act towards the
prevailing consensus. This tendency is directed by economic factors.
Jegadeesh and Kim (2010) observed that the market reactions to analysts’ recommendations are stronger when such recommendations move away from the consensus of share recommendations than
when they move towards it. The authors point out that even analysts from the most reputable brokerage
firms also present greater tendency to consensus. This paper also confirmed that the consensus effects tend to be greater for assessment lowering compared to assessment raising, which indicates that analysts
are more reluctant to diverge from the consensus when they have to convey negative information.
This latter result agrees with Huang et al. (2017) with regard to the effects that analysts’ information may have on their reputation and strategic matters, mainly concerning negative information
which is out of consensus.
Considering the contradictory effects of consensus accuracy indicated in the literature, the effects
of the consensus in the market are reviewed in the following section.
Consensus, forecasts, and effects in the securities market
The literature suggests that analysts provide useful information to the market, contributing to the
reduction of information asymmetry among investors (Bowen, Chen, & Cheng, 2008; Bradley, Clarke, Lee, & Ornthanalai, 2014; Gu & Wu, 2003), and the market reaction is positive when analysts begin
coverage of a company (Demiroglu & Ryngaert, 2010; Li & You, 2015).
Several studies indicate the market reactions to analysts’ forecasts. Li and You (2015) studied the reactions of the shares of publicly-held companies when analysts begin and finish a company’s
coverage. The authors test returned evidences from three value sources created by the analysts: (a) more
monitoring of the company; (b) reduction of information asymmetry; and (c) greater demand for a company’s shares. The authors observed indications that the analysts create value by increasing of
demand, but not by monitoring or reduction of information asymmetry, even if they add new
information.
Muslu, Rebello and Xu (2014) highlight that analysts’ coverage is an information deployment
channel which can increase the correlated movement between shares to a significant extent. Nevertheless, the information generated by the analysts may contain biases motivated by economic

R. M. Antônio, L. C. S. Ambrozini, R. C. Gatsios, V. M. Magnani 6
BAR, Rio de Janeiro, v. 14, n. 4, art. 1, e170036, 2017 www.anpad.org.br/bar
incentives, such as the increase of traded volume (Beyer et al., 2010; Bradshaw, 2004; Bradshaw,
Brown, & Huang, 2013; Bradshaw, Drake, Myers, & Myers, 2012).
The existence of analysts’ tendency to consensus while carrying out share recommendations is documented in the literature, despite presenting contradictory results regarding the market reactions in
share prices, or even the accuracy of target price issuance (Asquith, Mikhail, & Au, 2005; Jegadeesh &
Kim, 2010; Trueman, 1994).
Among the information generated by analysts, Bilinski et al. (2013) highlight that the target prices
reflect the estimate they make for the level of a company share price for a 12-month period, providing more easily-understood information for investment decisions. The authors observed that, on average,
the accuracy of target prices is greater than the accuracy of share price forecast, and is correct or exceeds
accuracy in 74.5% of the cases, and also presents superiority to other pricing measures, such as those obtained from the price-profit index of the sector and the return of market price of the 12 preceding
months.
Da and Schaumburg (2011) used the target price as a predictor of share mispricing variation in a sector. Bilinski et al. (2013) point out that the target price reflects market expectations, and the forecasts
related to them are higher than the forecasts based on price past performance (i.e. realized returns).
When considering the consensus effects on forecasts, Asquith, Mikhail and Au (2005) reported that 54.3% of the prices predicted by a North American brokerage firm from 1997 to 1999 were reached
by the share price by the end of the 12-month period, but the proportion of hits of target price decreased in the absence of consensus.
However, evidence about target prices is limited and often contradictory, providing results which highlight the potential relationship between earnings per share (EPS) and target price accuracy, while
other studies note that the low accuracy of target prices is greater for those which predict strong price
increases, for bigger companies, and for companies with greater coverage (Bilinski et al., 2013; Gleason
& Mills, 2008).
Barber et al. (2001) demonstrate that investors who are willing to buy and sell, thereby incurring
transaction costs, would be better off buying stocks of companies which present a consensus of more favorable recommendations, and selling stocks of the ones with less favorable ratings.
In this regard, Bilinski et al. (2013) point out that aspects which consider the analysts’ traits and persistent abilities in issuing target prices with greater accuracy have not been approached in the
literature. Taking into account the premise of the literature on economic incentives and reputation which
considers traits and abilities as factors which motivate, or not, following the consensus, the relationship
between the target price and the consensus is discussed in this paper.
Foundations for the Hypothesis
The tendency to follow consensus (herd tendency) is a result of agents seeking to obtain the cost
of imitating the prevailing forecast, while its opposite is to make a forecast without biases based on
available information (Huang et al., 2017). Such observation is consistent with the perspective that,
when following the consensus, the analysts tend to be in accordance with their economic incentives
mentioned by Beyer, Cohen, Lys and Walter (2010), such as reputation maintenance.
The market effects of following the consensus are documented, now and then, in a contradictory
way. Barber et al. (2001) highlight that investors can obtain abnormal gross return of 75 base points per month (0.75%) when following a strategy of purchasing shares which are highly recommended by
analysts and selling those which are less recommended. This return decreases if the investors do not

Analysts’ Consensus and Target Price Accuracy 7
BAR, Rio de Janeiro, v. 14, n. 4, art. 1, e170036, 2017 www.anpad.org.br/bar
rebalance their portfolios daily or delay acting on changes in the consensus recommendations of the
analysts.
On the other hand, Trueman (1994) argues that the behavior of consensus tendency reduces idiosyncratic information provided by individual forecasts, reducing the informational level of
consensus estimates.
The literature notes that when trying to improve their reputation, analysts present a greater tendency to consensus, protecting themselves from the risk of generating forecasts with little accuracy.
In this perspective it is considered that analysts, who are rational agents dealing with economic incentives, tend to consensus, delivering forecasts with less accuracy (Hong et al., 2000; Scharfstein &
Stein, 1990; Trueman, 1994). From these theoretical arguments, and aiming to answer the research
question of the paper, we propose the following hypothesis:
𝑯𝟎: The greater the consensus among the analysts, the lesser the forecast error of target prices.
On the other hand, Clement and Tse (2005) observed that forecasts which do not follow the consensus (i.e. bold forecasts) presented greater accuracy, while the reviews of forecasts based on
consensus are strongly linked to the errors of earnings forecast. From this perspective, it is argued that
the relationship between the information type provided by analysts (forecasts and reviews), and the fact they follow - or not - the consensus, can present different results regarding accuracy.
According to the literature, errors in analysts’ forecasts can originate when processing and interpreting the available information, leading to forecasts with less accuracy (Hong et al., 2000; Ke &
Yu, 2006). Thus, the behavior of following the consensus can lead to information asymmetry, favoring
errors of target prices, which leads to the alternative hypothesis:
𝑯𝒂: The greater the consensus among analysts, the greater the forecast error of target prices.
Methodology
To answer the research problem presented and to assess the study hypotheses, this paper uses data
from the Thomson Reuters Eikon® platform (a private database with access by subscription) and the
Worldwide Governance Indicators database (http://info.worldbank.org/governance/wgi/#home).
The analysis period is from October 2010 to January 2017, using monthly data from the publicly-held companies in Latin American countries listed in the data platform and followed by analysts (which
have at least one forecast for the period). The countries and number of companies that we analyze in the study are shown in Table 1. Here we see that the greatest data concentration is in countries with more
developed capital markets: Brazil, Chile, Peru, Mexico, and Argentina. Nonetheless, the study presents
a wide data distribution in different Latin American countries.
Table 1
Countries and Number of Companies
Countries Number of Companies
Anguilla 3
Antigua and Barbuda 2
Argentina 95
Bahamas 3
Continues

R. M. Antônio, L. C. S. Ambrozini, R. C. Gatsios, V. M. Magnani 8
BAR, Rio de Janeiro, v. 14, n. 4, art. 1, e170036, 2017 www.anpad.org.br/bar
Table 1 (continued)
Countries Number of Companies
Barbados 4
Belize 3
Bolivia 30
Brazil 416
Cayman Islands 62
Chile 220
Colombia 77
Costa Rica 7
Curaçao 2
Dominican Republic 2
Ecuador 31
Guatemala 1
Jamaica 47
Mexico 151
Nicaragua 1
Panama 7
Peru 210
Puerto Rico 11
Saint Lucia 1
Sint Maarten 1
Trinidad and Tobago 22
Turks and Caicos Islands 1
Uruguay 1
Venezuela 37
Virgin Islands (British) 23
Virgin Islands (United States) 3
Total 1474
During the period analyzed, the study covered 1,474 companies for a total of 147,400
observations. Due to the lack of data for the interest variables of the study, the final sample of the work amounts to 23,367 observations. The lack of data is due to different reasons, such as lack of information,
or capital closing or bankruptcy of the company in the period, and it is important to note that there are
target price forecasts of 27,766 months for the sample. This indicates that there are companies that are not followed by any analyst (in addition, some months do not have data of the explanatory variables,
and we are left with 23,367 observations). For the data analysis and construction of models, we used the
statistics program STATA®.
We developed and tested the models (1) and (2) in this study. The major findings of the study are presented in the results section.

Analysts’ Consensus and Target Price Accuracy 9
BAR, Rio de Janeiro, v. 14, n. 4, art. 1, e170036, 2017 www.anpad.org.br/bar
|𝑇𝑃 𝑚𝑒𝑑𝑖𝑎𝑛𝑘,𝑡 / 𝑃𝑟𝑖𝑐𝑒 𝐶𝑙𝑜𝑠𝑒𝑘,𝑡| = 𝛼 + 𝛽1 𝐶𝑜𝑛𝑠𝑒𝑛𝑠𝑢𝑠𝑘,𝑡 + 𝛽2 𝐶𝑘,𝑡 + 𝜀𝑘,𝑡 (1)
|𝑇𝑃 𝑎𝑣𝑒𝑟𝑎𝑔𝑒𝑘,𝑡 / 𝑃𝑟𝑖𝑐𝑒 𝐶𝑙𝑜𝑠𝑒𝑘,𝑡| = 𝛼 + 𝛽1 𝐶𝑜𝑛𝑠𝑒𝑛𝑠𝑢𝑠𝑘,𝑡 + 𝛽2 𝐶𝑘,𝑡 + 𝜀𝑘,𝑡 (2)
In which 𝑇𝑃 𝑚𝑒𝑑𝑖𝑎𝑛𝑘,𝑡 and 𝑇𝑃 𝑎𝑣𝑒𝑟𝑎𝑔𝑒𝑘,𝑡 represent the median and the average of target-price
estimates issued by analysts, for the company k at the moment t respectively. 𝑃𝑟𝑖𝑐𝑒 𝐶𝑙𝑜𝑠𝑒𝑘,𝑡 is the share
close price of company k at the moment t (these dependent variables are in agreement with Bilinski et
al., 2013, which used TP/P). The vector C is the vector composed of the variables (a) number of
estimates included in the consensuses; (b) the company’s market capitalization; and (c) government effectiveness of company k at the moment t.
The research interest variable is represented by Consensus, which is the standard deviation of the estimates included in the analysts’ target price forecasts for company k at the moment t. It is worth
highlighting that in this research, the term consensus has two key meanings for the understanding of the
tests: (a) consensus represents the average of the analysts’ estimates for a certain company; and (b)
consensus as the interest variable is represented by a low standard deviation of the estimates which indicates that the analysts’ opinion did not present much variability for the company.
The choice of the control variables aims to isolate the analysis proposed in the paper: therefore, variables referring to the number of analysts (forecasts), company size, and the government
effectiveness variable were used to isolate the macroeconomic differences among the countries. The
indicator Government Effectiveness reflects the perceptions on the quality of public services, public functions, independence from political pressures, the development and implementation of policies, and
the credibility of the government’s commitment to the policies developed.
The choice of the government effectiveness variable rather than other variables of the Worldwide Governance Indicators database was by means of the analysis of the multicollinearity table of this
information, since the use of more than one of these variables would lead to a multicollinearity problem
in the model.
Table 2 shows variables and their justification for inclusion in vector C.
Table 2
Characteristics Considered as Variables in the Models
Variable Justification
Number of Estimates
It represents the number of analysts which issued the target price consensual forecast in the period, and which was previously adopted by
Bilinski et al. (2013). For these authors the number of analysts following
a company shows competition among analysts.
Company’s Market Value
(Millions)
It represents the company size and seeks to capture the quality of this
accounting information provided to the market. This variable was
previously used by Moshirian, Ng and Wu (2009). For these authors, large
companies present a better information environment than smaller companies.
Government Effectiveness
Reflects the perceptions of the quality of public services, public functions, independence from political pressures, the development and
implementations of policies, and the credibility of the government
commitment to the policies developed. This analysis was similarly used
by Bilinski et al. (2013). We emphasize that these authors used some
variables to capture institutional and regulatory variances that may affect
the accuracy average of analysts. The variables were: index of disclosure,
enforcement of accounting standards, ownership concentration, and they
also included the origin of the country’s legal system.

R. M. Antônio, L. C. S. Ambrozini, R. C. Gatsios, V. M. Magnani 10
BAR, Rio de Janeiro, v. 14, n. 4, art. 1, e170036, 2017 www.anpad.org.br/bar
In the paper, we used panel data with fixed and random effects. Panel data is understood as the observation of different units in different moments of time (Wooldridge, 2008). The general model for
this methodology is represented by Equation (3).
𝑌𝑗,𝑡 = 𝛽0 + 𝛽1𝑥1𝑗,𝑡 + 𝛽𝑛𝑥𝑘𝑗,𝑡 + 𝑒𝑗,𝑡 (3)
In Equation (3), the subscript i represents the different individuals, and the subscript t denotes the
time period analyzed. 𝑌𝑖,𝑡, represents the dependent variable, 𝛽0 𝑖,𝑡 refers to the intercept value, 𝛽𝑘 the
angular coefficient of the k covariate of the model, and 𝑒𝑖,𝑡 the forecast error.
According to Wooldridge (2008), the models in panel data are used because they present the possibility of working with a greater quantity of data, combining the methodologies of cross-section and
time-series analyses, with a greater number of degrees of freedom and accuracy of the estimators.
The fundamental articulation between models (1) and (2) and the general panel data model -
Equation (3) - allow working with a larger quantity of data (23,367 observations and seven years), with
a combination of methodologies (cross-section and time-series), and give us greater accuracy of the estimators. This provides greater robustness to the models (1) and (2).
For the drafting of the model, the results of the heteroscedasticity tests (Wald Test), serial autocorrelation test (Woolridge Test), as well as Hausman and Chow tests were assessed. The use of the
tests aims to assure the robustness of the paper results.
After presenting the theoretical framework and the research methodology, the results of the study are presented in the next section. This will outline the descriptive statistics of the variables that we use
in the models and the results that we find for models (1) and (2), which consider the standard deviation
of the target-price estimates as additional information to investors, and which we consider, in this study, as a consensus of the analysts’ estimates.
Result Analysis
Table 3 shows the descriptive statistics of the variables that we use in the models. We present the
values of average, standard deviation, minimum, and maximum.
The values indicate that the average and the median of the consensus show values similar to the statistics presented, suggesting similar results for models (1) and (2) that we report in this study.
Nonetheless, we can see high variability of the standard deviation of the estimates. Regarding the
number of estimates, Table 3 indicates that the minimum number of estimates is 2, otherwise the calculation of the variable is not possible. The company market value also presents high variability,
since companies from different countries are assessed in this paper, and in this sample the countries have
different levels of economic development. Finally, the government effectiveness variable also reflects this variability in the sample analyzed.
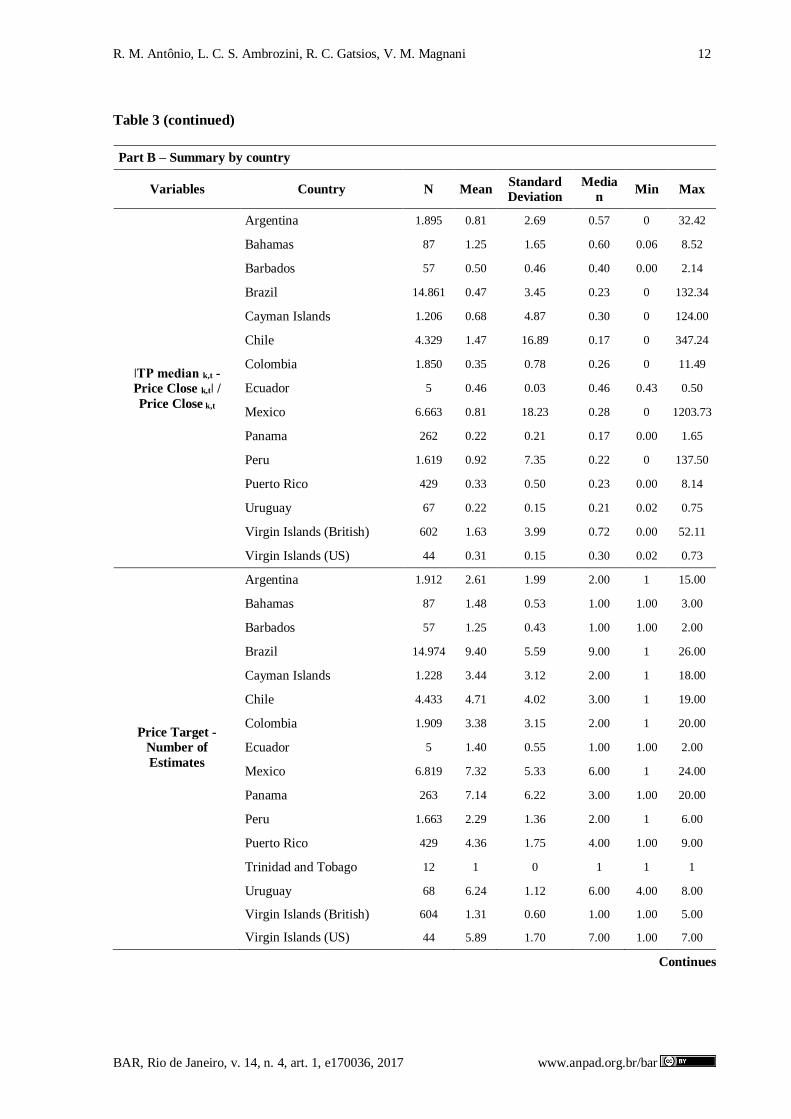
We can see in Table 3 (Part B) the variables summary by country. The countries that report most errors in target prices are the Virgin Islands (British), Chile, and the Bahamas. Uruguay and Panama are
those countries with the least errors. Brazil reports on average a large number of analysts expressing
opinions, and it is also the country that presents the lowest consensus among analysts.

Analysts’ Consensus and Target Price Accuracy 11
BAR, Rio de Janeiro, v. 14, n. 4, art. 1, e170036, 2017 www.anpad.org.br/bar
Table 3
Descriptive Statistics
Part A - Summary
Variable Average
Standard
Deviation Min. Max.
TP Median 1.048154 2.184276 0.0006188 133.3372
TP Average 1.065001 2.192467 0.0006188 133.3372
Estimate standard deviation 4.571413 35.06394 0.00002 1205.479
Number of Estimates 8.136517 5.161338 2 26
Company’s Market Value
(Millions) 6020.00 15200.00 3.93 247000.00
Government Effectiveness 57.77295 12.66455 42.58373 86.60287
Part B – Summary by country
Variables Country N Mean Standard
Deviation Median Min Max
ǀTP mean k,t - Price
Close k,tǀ / Price
Close k,t
Argentina 1.895 0.81 2.69 0.57 0 32.42
Bahamas 87 1.25 1.65 0.60 0.06 8.52
Barbados 57 0.50 0.46 0.40 0.00 2.14
Brazil 14.861 0.49 3.46 0.23 0 132.34
Cayman Islands 1.205 0.70 5.01 0.31 0 124.00
Chile 4.329 1.48 16.89 0.17 0 347.24
Colombia 1.850 0.35 0.78 0.26 0 11.49
Ecuador 5 0.46 0.03 0.46 0.43 0.50
Mexico 6.663 0.82 18.23 0.28 0 1203.73
Panama 262 0.22 0.21 0.17 0.00 1.65
Peru 1.619 0.93 7.35 0.23 0 137.50
Puerto Rico 429 0.32 0.45 0.24 0.00 7.06
Uruguay 68 0.25 0.17 0.23 0.00 0.86
Virgin Islands (British) 602 1.62 3.99 0.71 0.00 52.11
Virgin Islands (US) 44 0.32 0.13 0.32 0.03 0.65
Continues
R. M. Antônio, L. C. S. Ambrozini, R. C. Gatsios, V. M. Magnani 12
BAR, Rio de Janeiro, v. 14, n. 4, art. 1, e170036, 2017 www.anpad.org.br/bar
Table 3 (continued)
Part B – Summary by country
Variables Country N Mean Standard
Deviation
Media
n Min Max
ǀTP median k,t -
Price Close k,tǀ /
Price Close k,t
Argentina 1.895 0.81 2.69 0.57 0 32.42
Bahamas 87 1.25 1.65 0.60 0.06 8.52
Barbados 57 0.50 0.46 0.40 0.00 2.14
Brazil 14.861 0.47 3.45 0.23 0 132.34
Cayman Islands 1.206 0.68 4.87 0.30 0 124.00
Chile 4.329 1.47 16.89 0.17 0 347.24
Colombia 1.850 0.35 0.78 0.26 0 11.49
Ecuador 5 0.46 0.03 0.46 0.43 0.50
Mexico 6.663 0.81 18.23 0.28 0 1203.73
Panama 262 0.22 0.21 0.17 0.00 1.65
Peru 1.619 0.92 7.35 0.22 0 137.50
Puerto Rico 429 0.33 0.50 0.23 0.00 8.14
Uruguay 67 0.22 0.15 0.21 0.02 0.75
Virgin Islands (British) 602 1.63 3.99 0.72 0.00 52.11
Virgin Islands (US) 44 0.31 0.15 0.30 0.02 0.73
Price Target -
Number of
Estimates
Argentina 1.912 2.61 1.99 2.00 1 15.00
Bahamas 87 1.48 0.53 1.00 1.00 3.00
Barbados 57 1.25 0.43 1.00 1.00 2.00
Brazil 14.974 9.40 5.59 9.00 1 26.00
Cayman Islands 1.228 3.44 3.12 2.00 1 18.00
Chile 4.433 4.71 4.02 3.00 1 19.00
Colombia 1.909 3.38 3.15 2.00 1 20.00
Ecuador 5 1.40 0.55 1.00 1.00 2.00
Mexico 6.819 7.32 5.33 6.00 1 24.00
Panama 263 7.14 6.22 3.00 1.00 20.00
Peru 1.663 2.29 1.36 2.00 1 6.00
Puerto Rico 429 4.36 1.75 4.00 1.00 9.00
Trinidad and Tobago 12 1 0 1 1 1
Uruguay 68 6.24 1.12 6.00 4.00 8.00
Virgin Islands (British) 604 1.31 0.60 1.00 1.00 5.00
Virgin Islands (US) 44 5.89 1.70 7.00 1.00 7.00
Continues

Analysts’ Consensus and Target Price Accuracy 13
BAR, Rio de Janeiro, v. 14, n. 4, art. 1, e170036, 2017 www.anpad.org.br/bar
Table 3 (continued)
Part B – Summary by country
Variables Country N Mean Standard
Deviation
Media
n Min Max
Price Target -
Standard Deviation
Argentina 1.298 1.77 5.41 0.09 0 38.62
Bahamas 34 0.42 0.25 0.30 0.20 1.50
Barbados 14 0.14 0.07 0.12 0.05 0.24
Brazil 13.860 6.18 43.02 0.82 0 1205.4
8
Cayman Islands 761 2.56 3.26 1.38 0 17.81
Chile 3.172 0.55 1.22 0.12 0 17.50
Colombia 1.123 0.42 0.36 0.34 0 1.72
Ecuador 2 2.18 0.00 2.18 2.18 2.18
Mexico 5.619 2.68 22.84 0.18 0 489.22
Panama 236 5.50 5.10 3.40 0.03 22.69
Peru 985 0.88 1.55 0.13 0 8.56
Puerto Rico 410 3.81 5.59 2.29 0.21 33.00
Uruguay 68 1.89 1.17 1.93 0.43 6.36
Virgin Islands (British) 142 3.82 6.82 0.68 0.02 40.19
Virgin Islands (US) 42 3.13 0.98 3.08 1.00 5.05
The analysts are seen as information intermediaries and as responsible for reducing informational asymmetry, as pointed out by Bowen, Chen and Cheng (2008), Gu and Wu (2003), and Bradley, Clarke,
Lee and Ornthanalai (2014). Given this, the role of analysts as informational intermediaries becomes
relevant as investment in the stock market becomes popular and is poorly understood by many investors.
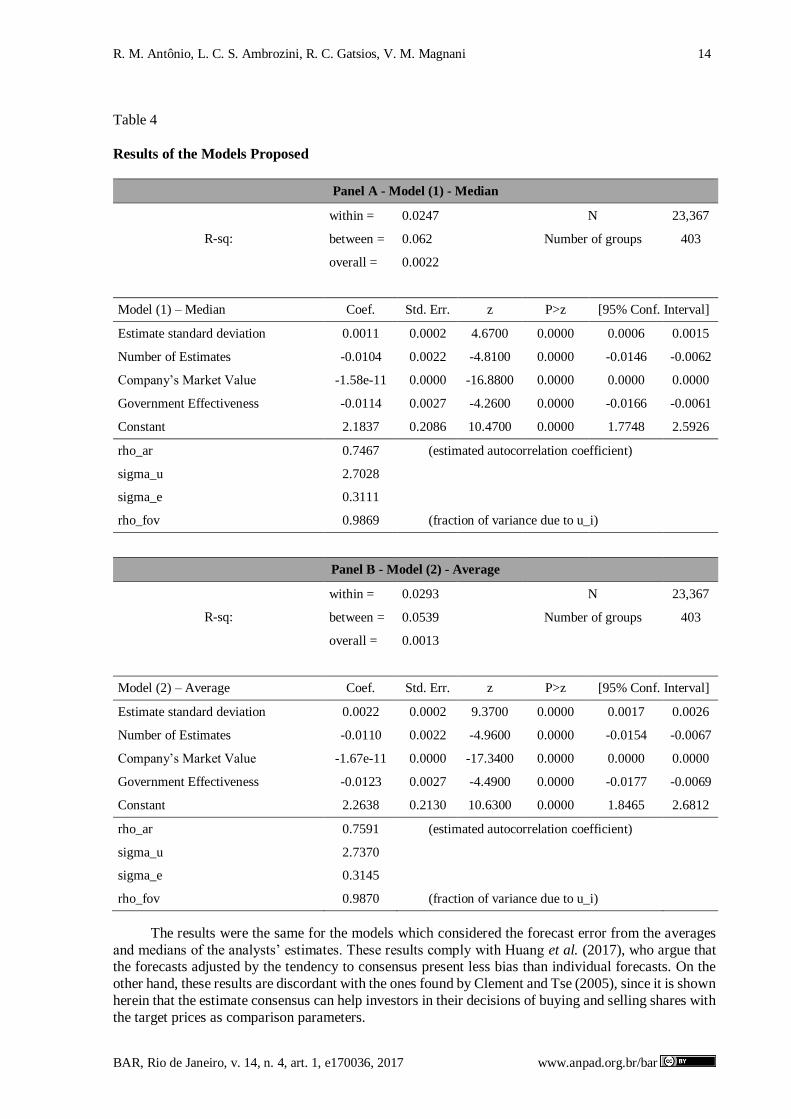
The results of the models which we develop and test in this study based on the median (1) and average (2) of the forecasts are presented in Table 4. We expect the consensus forecast variable to be
smaller for the largest errors in analysts’ estimates; that is, there will be a greater standard deviation for larger errors. First, in Table 4 we report the results of the models (1) and (2), which show that the greater
the standard deviation of the target prices issued by the analysts (the lesser the consensus), the greater
the forecast error. We can see that the relationship between the absolute errors of the forecasts are positively related to the standard deviation of the estimates (the results consider 1% to be statistically
significant). We contribute to the literature by showing that analysts’ consensus is informative and can
be used by investors.
R. M. Antônio, L. C. S. Ambrozini, R. C. Gatsios, V. M. Magnani 14
BAR, Rio de Janeiro, v. 14, n. 4, art. 1, e170036, 2017 www.anpad.org.br/bar
Table 4
Results of the Models Proposed
Panel A - Model (1) - Median
R-sq:
within = 0.0247 N 23,367
between = 0.062 Number of groups 403
overall = 0.0022
Model (1) – Median Coef. Std. Err. z P>z [95% Conf. Interval]
Estimate standard deviation 0.0011 0.0002 4.6700 0.0000 0.0006 0.0015
Number of Estimates -0.0104 0.0022 -4.8100 0.0000 -0.0146 -0.0062
Company’s Market Value -1.58e-11 0.0000 -16.8800 0.0000 0.0000 0.0000
Government Effectiveness -0.0114 0.0027 -4.2600 0.0000 -0.0166 -0.0061
Constant 2.1837 0.2086 10.4700 0.0000 1.7748 2.5926
rho_ar 0.7467 (estimated autocorrelation coefficient)
sigma_u 2.7028
sigma_e 0.3111
rho_fov 0.9869 (fraction of variance due to u_i)
Panel B - Model (2) - Average
R-sq:
within = 0.0293 N 23,367
between = 0.0539 Number of groups 403
overall = 0.0013
Model (2) – Average Coef. Std. Err. z P>z [95% Conf. Interval]
Estimate standard deviation 0.0022 0.0002 9.3700 0.0000 0.0017 0.0026
Number of Estimates -0.0110 0.0022 -4.9600 0.0000 -0.0154 -0.0067
Company’s Market Value -1.67e-11 0.0000 -17.3400 0.0000 0.0000 0.0000
Government Effectiveness -0.0123 0.0027 -4.4900 0.0000 -0.0177 -0.0069
Constant 2.2638 0.2130 10.6300 0.0000 1.8465 2.6812
rho_ar 0.7591 (estimated autocorrelation coefficient)
sigma_u 2.7370
sigma_e 0.3145
rho_fov 0.9870 (fraction of variance due to u_i)
The results were the same for the models which considered the forecast error from the averages
and medians of the analysts’ estimates. These results comply with Huang et al. (2017), who argue that the forecasts adjusted by the tendency to consensus present less bias than individual forecasts. On the
other hand, these results are discordant with the ones found by Clement and Tse (2005), since it is shown
herein that the estimate consensus can help investors in their decisions of buying and selling shares with
the target prices as comparison parameters.

Analysts’ Consensus and Target Price Accuracy 15
BAR, Rio de Janeiro, v. 14, n. 4, art. 1, e170036, 2017 www.anpad.org.br/bar
In the tests carried out, there was a need for heteroscedasticity correction (Wald Test) and serial autocorrelation of the model (Wooldridge Test). Thus, the results presented are robust to
heteroscedasticity and with serial autocorrelation correction of the data. According to the robust Hausman test and the Chow test, the models presented are of panel data with random effect, and the
results are summarized in Table 4.
Table 4 shows low r², which can be explained by the fact that there are other factors, such as characteristics of analysts, companies, sectors, and macroeconomic context, that can influence analysts’
prediction errors. The literature on market analysts shows similar results in relation to the square r² of
the models. In this paper, we consider some variables that can influence the errors (a limitation of the results that we present). Bilinski et al. (2013), for example, used 25 independent variables separated
into: (a) analyst and broker characteristics, (b) institutional and regulatory characteristics, (c) TP and
EPS forecast characteristics, (d) firm characteristics, and (e) other controls to obtain an r² of 31.87%.
In order to obtain statistical validity of the model, we performed additional tests on the correlation
between the explanatory variables of the model, in order to guarantee the absence of multicollinearity
between them. Table 5 shows the results of the correlation matrix and the Variance Inflation Factor (VIF) test. The results of the correlation matrix and the VIF test do not indicate a multicollinearity
problem among the explanatory variables of the models.
Table 5
Multicollinearity
Matrix Correlation
Estimate standard
deviation
Number of Estimates Company’s
Market Value Government Effectiveness
Estimate standard deviation 1
Number of Estimates 0.0389 1
Company’s Market Value -0.0161 0.2469 1
Government Effectiveness -0.043 -0.2111 -0.0168 1
VIF Test
VIF - Average Model VIF - Median Model
Estimate standard deviation 1.12 1.12
Number of Estimates 1.07 1.07
Company’s Market Value 1.05 1.05
Government Effectiveness 1 1
Means VIF 1.06 1.06
Bilinski et al. (2013) point out that analysts have a differential and persistent ability to issue accurate target prices, and that the institutional and regulatory differences among the countries affect
this accuracy. Due to this remark, we include in the model an indicator able to measure the institutional and regulatory differences of the countries, which is the government effectiveness metric available at
the Worldwide Governance Indicators site.
About government effectiveness, we expect analysts to produce more accurate target prices for firms in countries with high government effectiveness. The results indicated that the greater the

R. M. Antônio, L. C. S. Ambrozini, R. C. Gatsios, V. M. Magnani 16
BAR, Rio de Janeiro, v. 14, n. 4, art. 1, e170036, 2017 www.anpad.org.br/bar
government effectiveness, the greater the forecast accuracy of the target price estimates issued by the
analysts (we report a negative relationship - statistically significant at 1% - between forecast errors and
government effectiveness). This result complies with what was observed before by Bilinski et al. (2013).
Other aspects influence the accuracy of target price estimates issued by the analysts, such as the
size of company monitored by the analyst, and the number of analysts following it, that is the number
of estimates issued for a single company. We expect that the larger the company, the lower the analysts’ prediction error - we use proxy size of the companies for the quality of the disclosed information as
suggested by Moshirian et al. (2009). With regard to the number of analysts, our expectation is that the
higher the number of analysts the better the forecast and consequently the lower the error.
We analyzed both aspects, and the results indicate that the bigger the company and the greater the
number of estimates, the more accurate the analysts’ forecasts. Table 4 shows the negative relationships between the size of the companies, the number of analysts, and errors in the forecasts.
For Bradshaw (2004), previous studies have examined the implications of accounting information
for analysts, and how they facilitate the flow of such information in markets. In our results, we corroborate the point that in smaller companies there is less estimate accuracy, as already pointed by
Moshirian et al. (2009), who highlight that bigger companies are known for presenting an information
environment superior to smaller companies. Moreover, Moshirian et al. (2009) highlight that investors face severe transaction costs in smaller shares, and consequently are less likely to hold shares of small
companies.
It is worth highlighting that all the results that we report are statistically significant at 1%, which provides consistency to the results that we present. However, there are other factors capable of
influencing the analysts’ average accuracy.
Final Considerations
Market analysts, by issuing their opinions (earnings per share, target prices, and
recommendations), have been the object of several previous studies. The previous literature points to analysts as information intermediaries who act between companies and investors, and as one of the
responsible agents for reducing information asymmetry. Some studies observed that target prices are
significantly associated with exceeding returns in the period of the event (e.g., Barber, Lehavy,
McNichols, & Trueman, 2001; Brav & Lehavy, 2003; Stickel, 1995; Womack, 1996).
Considering both the relevance of stock target prices to the market, and the controversies
regarding the individual forecasts and consensus (e.g., Clement & Tse, 2005; Huang et al., 2017), it was observed that the consensus forecasts present less bias if compared to individual forecasts.
Therefore, this study checks whether consensus among analysts is a factor which can lead to a smaller forecast error, and whether it is informative to use the estimate standard deviation of target
prices. Based on that, the following hypothesis is set and tested: the greater the consensus among the
analysts, the smaller the forecast errors of target prices.
This paper brings evidence that the greater the consensus (smaller standard deviation), the smaller
the forecast errors are. Thus, the estimate standard deviation of target prices presented informative power
to investors about the estimate accuracy. Moreover, the fewer the number of analysts who issue an opinion about a certain company, the greater the forecast error, and the smaller the company size, the
greater the error too. Our results indicate that company size and analysts’ accuracy they are related, as
has already been pointed out by Moshirian et al. (2009), who highlight that bigger companies are known for presenting an information environment superior to smaller companies.

Analysts’ Consensus and Target Price Accuracy 17
BAR, Rio de Janeiro, v. 14, n. 4, art. 1, e170036, 2017 www.anpad.org.br/bar
Another important finding is related to government effectiveness. Our results indicate that the greater the government effectiveness, the greater the forecast accuracy of target price estimates issued
by analysts. This result complies with what was observed previously by Bilinski et al. (2013). We used this variable as a proxy to capture and differentiate the economic, regulatory, and information quality
contexts of the countries that we analyze, and this approach enables us to construct more precise
estimates about the institutional characteristics of the countries - in particular due to the
internationalization of investments.
Our analysis contributes to enhancing the understanding about the average accuracy of the target
prices issued by analysts. Investment in stocks is an alternative for investors who often not understand the stock market and follow analysts’ forecasts. Therefore, the results show that analysts’ consensus is
an informational item for investors, and that the effectiveness of the government contributes to lower
errors in these estimates.
Limitations and Suggestions
The results of this study are limited to the period considered (2010 to 2017), to the Latin American
business context, and with the explanatory variables that we use. There are other factors capable of influencing the analysts’ average accuracy, so we suggest that other variables can be included in the
model, such as internalization of companies, levels of corporate governance, and others.
References
Asquith, P., Mikhail, M. B., & Au, A. S. (2005). Information content of equity analyst reports. Journal
of Financial Economics, 75(2), 245-282. https://doi.org/10.1016/j.jfineco.2004.01.002
Barber, B., Lehavy, R., McNichols, M., & Trueman, B. (2001). Can investors profit from the prophets? Security analyst recommendations and stock returns. The Journal of Finance, 56(2), 531-563.
https://doi.org/10.1111/0022-1082.00336
Beyer, A., Cohen, D. A., Lys, T. Z., & Walther, B. R. (2010). The financial reporting environment:
Review of the recent literature. Journal of Accounting and Economics, 50(2), 296-343.
https://doi.org/10.1016/j.jacceco.2010.10.003
Bilinski, P., Lyssimachou, D., & Walker, M. (2013). Target price accuracy: International evidence. The
Accounting Review, 88(3), 825-851. https://doi.org/10.2308/accr-50378
Bowen, R. M., Chen, X., & Cheng, Q. (2008). Analyst coverage and the cost of raising equity capital:
Evidence from underpricing of seasoned equity offerings. Contemporary Accounting Research, 25(3), 657-700. https://doi.org/10.1506/car.25.3.1
Bradley, D., Clarke, J., Lee, S., & Ornthanalai, C. (2014). Are analysts’ recommendations informative? Intraday evidence on the impact of time stamp delays. The Journal of Finance, 69(2), 645-673.
https://doi.org/10.1111/jofi.12107
Bradshaw, M. T. (2004). How do analysts use their earnings forecasts in generating stock recommendations?. The Accounting Review, 79(1), 25-50.
https://doi.org/10.2308/accr.2004.79.1.25
Bradshaw, M. T., Brown, L. D., & Huang, K. (2013). Do sell-side analysts exhibit differential target price forecasting ability?. Review of Accounting Studies, 18(4), 930-955.
https://doi.org/10.1007/s11142-012-9216-5

R. M. Antônio, L. C. S. Ambrozini, R. C. Gatsios, V. M. Magnani 18
BAR, Rio de Janeiro, v. 14, n. 4, art. 1, e170036, 2017 www.anpad.org.br/bar
Bradshaw, M. T., Drake, M. S., Myers, J. N., & Myers, L. A. (2012). A re-examination of analysts’ superiority over time-series forecasts of annual earnings. Review of Accounting Studies, 17(4),
944-968. https://doi.org/10.1007/s11142-012-9185-8
Brav, A., & Lehavy, R. (2003). An empirical analysis of analysts’ target prices: Short-term
informativeness and long-term dynamics. The Journal of Finance, 58(5), 1933-1967.
https://doi.org/10.1111/1540-6261.00593
Clement, M. B., & Tse, S. Y. (2005). Financial analyst characteristics and herding behavior in
forecasting. The Journal of Finance, 60(1), 307-341. https://doi.org/10.1111/j.1540-6261.2005.00731.x
Da, Z., & Schaumburg, E. (2011). Relative valuation and analyst target price forecasts. Journal of Financial Markets, 14(1), 161-192. https://doi.org/10.1016/j.finmar.2010.09.001
Demiroglu, C., & Ryngaert, M. (2010). The first analyst coverage of neglected stocks. Financial Management, 39(2), 555-584. https://doi.org/10.1111/j.1755-053x.2010.01084.x
Gleason, C. A., & Mills, L. F. (2008). Evidence of differing market responses to beating analysts’ targets
through tax expense decreases. Review of Accounting Studies, 13(2/3), 295-318. https://doi.org/10.1007/s11142-007-9066-8
Gul, F., & Lundholm, R. (1995). Endogenous timing and the clustering of agents’ decisions. Journal of Political Economy, 103(5), 1039-1066. https://doi.org/10.1086/262012
Guttman, I. (2010). The timing of analysts’ earnings forecasts. The Accounting Review, 85(2), 513-545. https://doi.org/10.2308/accr.2010.85.2.513
Gu, Z., & Wu, J. S. (2003). Earnings skewness and analyst forecast bias. Journal of Accounting and Economics, 35(1), 5-29. https://doi.org/10.1016/s0165-4101(02)00095-2
Hansen, R. S. (2015). What is the value of sell-side analysts? Evidence from coverage changes – A
discussion. Journal of Accounting and Economics, 60(2), 58-64. https://doi.org/10.1016/j.jacceco.2015.08.005
Hong, H., Kubik, J. D., & Solomon, A. (2000). Security analysts’ career concerns and herding of earnings forecasts. The Rand Journal of Economics, 31(1), 121-144.
https://doi.org/10.2307/2601032
Huang, R., Krishnan, M. M., Shon, J., & Zhou, P. (2017). Who herds? Who doesn’t? Estimates of analysts’ herding propensity in forecasting earnings. Contemporary Accounting Research, 34(1),
374-399. https://doi.org/10.1111/1911-3846.12236
Jegadeesh, N., & Kim, W. (2010). Do analysts herd? An analysis of recommendations and market reactions. The Review of Financial Studies, 23(2), 901-937. https://doi.org/10.1093/rfs/hhp093
Ke, B., & Yu, Y. (2006). The effect of issuing biased earnings forecasts on analysts’ access to management and survival. Journal of Accounting Research, 44(5), 965-999.
https://doi.org/10.1111/j.1475-679x.2006.00221.x
Li, K. K., & You, H. (2015). What is the value of sell-side analysts? Evidence from coverage initiations
and terminations. Journal of Accounting and Economics, 60(2), 141-160. https://doi.org/10.1016/j.jacceco.2015.08.006
Moshirian, F., Ng, D., & Wu, E. (2009). The value of stock analysts’ recommendations: Evidence from
emerging markets. International Review of Financial Analysis, 18(1), 74-83. https://doi.org/10.1016/j.irfa.2008.11.001

Analysts’ Consensus and Target Price Accuracy 19
BAR, Rio de Janeiro, v. 14, n. 4, art. 1, e170036, 2017 www.anpad.org.br/bar
Muslu, V., Rebello, M., & Xu, Y. (2014). Sell-side analyst research and stock comovement. Journal of Accounting Research, 52(4), 911-954. https://doi.org/10.1111/1475-679x.12057
Scharfstein, D. S., & Stein, J. C. (1990). Herd behavior and investment. The American Economic Review, 80(3), 465-479.
Stickel, S. E. (1995). The anatomy of the performance of buy and sell recommendations. Financial Analysts Journal, 51(5), 25-39. https://doi.org/10.2469/faj.v51.n5.1933
Trueman, B. (1994). Analyst forecasts and herding behavior. The Review of Financial Studies, 7(1), 97-124. https://doi.org/10.1093/rfs/7.1.97
Womack, K. L. (1996). Do brokerage analysts’ recommendations have investment value?. The Journal of Finance, 51(1), 137-167. https://doi.org/10.1111/j.1540-6261.1996.tb05205.x
Wooldridge, J. M. (2008). Introdução à econometria: Uma abordagem moderna. São Paulo: Cengage Learning.
Yezegel, A. (2015). Why do analysts revise their stock recommendations after earnings announcements?
Journal of Accounting and Economics, 59(2), 163-181. https://doi.org/10.1016/j.jacceco.2015.01.001
Authors’ Profiles
Rafael Moreira Antônio
Av. Bandeirantes, 3900, 14040-900, Ribeirão Preto, SP, Brazil. E-mail address: [email protected]. http://orcid.org/0000-0003-1116-808X Luciana Cardoso Siqueira Ambrozini Av. Bandeirantes, 3900, 14040-900, Ribeirão Preto, SP, Brazil. E-mail address: [email protected] Rafael Confetti Gatsios Av. Bandeirantes, 3900, 14040-900, Ribeirão Preto, SP, Brazil. E-mail address: [email protected]
Vinícius Medeiros Magnani Av. Bandeirantes, 3900, 14040-900, Ribeirão Preto, SP, Brazil. E-mail address: [email protected]


