
ANALYTICAL MODEL FOR NON-UNIFORM CORROSION-INDUCED 1
CONCRETE CRACKING 2
3
Shangtong Yang1, Kefei Li2 and Chun-Qing Li3* 4
1 Department of Civil and Environmental Engineering, University of Strathclyde, Glasgow, G1 5
1XJ, United Kingdom. 6
2 Department of Civil Engineering, Tsinghua University, Beijing, 100084, China. 7
3 School of Civil, Environmental and Chemical Engineering, RMIT University, GPO Box 8
2476, Melbourne 3001, Australia. 9
10
ABSTRACT 11
Corrosion-induced concrete cracking is one of the major deterioration mechanisms for 12
reinforced concrete structures. Evidently, the corrosion process is not uniform along the 13
circumference of the reinforcement. To model the stress distribution in concrete and determine 14
the initiation of concrete cracking, a realistic non-uniform corrosion model needs to be 15
developed. In this paper, a time-dependent corrosion model, producing non-uniform expansion 16
to concrete, is first established. The stresses in concrete are then formulated through the 17
employment of complex functions. The time to initiation of concrete cracking is determined 18
and related to a number of material, geometric and corrosion parameters. The derived analytical 19
model is verified by comparing the results with those from experimental tests in literature. It 20
can be concluded that this model is one of very few analytical models that can determine the 21
stresses in concrete caused by non-uniform corrosion of reinforcement in concrete. 22
23
KEYWORDS: Durability-related properties; Fracture & fracture mechanics; Cracks & 24
cracking. 25
26
* Corresponding author. Tel: +61 3 9925 2181. Email: [email protected]

- 2 -
INTRODUCTION 28
Corrosion of reinforcement is a significant problem affecting the durability of reinforced 29
concrete (RC) structures. Practical experience and experimental observations (Andrade et al., 30
1993, Li, 2003, Otsuki et al., 2000) suggest that corrosion affected RC structures deteriorate 31
faster in terms of serviceability (e.g., cracking or deflection) than safety (e.g., strength). 32
Consequently, corrosion can lead to premature deterioration of RC structures, causing concrete 33
cracking, delaminating and de-bonding. For example, only 4% to 5% degree of corrosion (in 34
terms of steel mass loss) can cause serviceability failure of RC structures as defined by 35
corrosion-induced crack width (El Maaddawy et al., 2005). Moreover, the maintenance and 36
repair costs for corrosion induced deterioration in RC bridges in the United States have been 37
reported more than $5 billion per year (Koch et al., 2002). 38
39
Realising the significance of the problem, considerable research has been conducted during the 40
last few decades. Early work mainly focused on uniform corrosion along the circumference of 41
the reinforcing rebar in concrete (Liu and Weyers, 1998). This was probably because most 42
experiments on producing corrosion in reinforced concrete employed impressed current 43
technique; such an accelerated corrosion method controls the corrosion rate, hence the degree 44
of corrosion, by adjusting the current and/or the time of interval applied to the reinforcement. 45
As such, the corrosion generated by the impressed current method is in a uniform manner along 46
the rebar. Meanwhile, almost all of the analytical and numerical studies assume a uniform 47
corrosion expansion exerting between the reinforcement and its surrounding concrete. Under 48
the corrosion expansion, concrete has been often modelled as a thick-wall cylinder (Bazant, 49
1979, Pantazopoulou and Papoulia, 2001, Li et al., 2006). Liu and Weyers (1998) proposed an 50
analytical solution for the time to surface cracking by presuming concrete linear elastic and the 51

- 3 -
uniform corrosion development. This analytical model has soon been improved by a number of 52
researchers, e.g., (Pantazopoulou and Papoulia, 2001, Li et al., 2006, Bhargava et al., 2006), 53
who considered concrete as a quasi-brittle material, i.e., the fracture property of concrete being 54
included in the models. These models can well address the corrosion-induced cracking 55
behaviour, covering time to cracking initiation, time to surface cracking, surface crack width, 56
etc. However, the limitation is that only uniform boundary condition can be applied to the 57
formulation of the stress and strain in concrete. 58
59
More recently, modelling of corrosion-induced cracking of concrete has been focused on 60
non-uniform corrosion progression at the interface between reinforcement and concrete. Due to 61
the fact that chlorides, as well as moisture and oxygen, penetrates to the depth of the 62
reinforcement at different rates on different sides of the concrete, it is very rare to have a 63
uniform and general corrosion on the reinforcement. It has been reported (González et al., 64
1995) that the pitting caused localized deterioration is equivalent to about four to eight times 65
that of the reinforcement under overall corrosion. To study the non-uniform corrosion caused 66
structural deterioration, numerical approach, mainly finite element method (FEM), has played a 67
dominating role (Jang and Oh, 2010, Pan and Lu, 2012, Zhao et al., 2011, Du et al., 2014). Jang 68
and Oh (2010) considered a few of non-uniform distributions of corrosion products and 69
simulated the stress states in concrete accordingly. Pan and Lu (2012) modelled the 70
non-uniform corrosion caused crack propagation in concrete with FEM and the concrete as a 71
heterogeneous material. Du et al. (2014) employed damage plasticity model to simulate the 72
concrete cracking under non-uniform corrosion induced expansion. A number of parameters 73
were investigated on their effects to the surface cracking. Zhao et al. (2011) proposed a 74
Gaussian distribution for the non-uniform corrosion caused displacement and simulated the 75
cracking behaviour of concrete by smeared crack model. Literature review suggests (1) the 76
- 4 -
distribution of the non-uniform corrosion caused expansion has seldom been based on 77
experimental test results but more on assumptions and; (2) no model has been developed in 78
relating concrete cracking to some basic parameters for the non-uniform corrosion, e.g., 79
corrosion rate. As pointed out in (Zhao et al., 2011), this is probably because there is an absence 80
of reliable data which can characterize the actual non-uniform formation and expansion of the 81
corrosion products. 82
83
Yuan and Ji (2009) conducted the accelerated corrosion tests on reinforced concrete samples in 84
an artificial environmental chamber and obtained a non-uniform corrosion distribution along 85
the interface between reinforcement and concrete. In their findings, only a half of the 86
reinforcement, facing concrete cover, was corroded and the corrosion caused expansion was in 87
a semi-elliptical shape. Amongst limited experimental data, the non-uniform distribution 88
derived from Yuan and Ji (2009) can provide the reasonable inputs for modelling the 89
non-uniform corrosion caused concrete cracking. Moreover, although numerical approaches 90
are more powerful in terms of solving a wider range of problems, analytical solutions are more 91
accurate and convenient for the practical application. It would be, therefore, ideal to have an 92
analytical model on non-uniform corrosion induced cracking of concrete. In the analytical 93
model, some key material and corrosion parameters, e.g., corrosion rate, can be related to the 94
structural behaviour, e.g., time to cracking. However, the non-uniform stress distribution, along 95
the hoop direction of the concrete cylinder, requires complex functions to be used in the 96
analytical formulation. In this case, concrete can only be treated as an elastic material, with 97
cracking initiation being modelled. The initiation of cracking in concrete marks the start of the 98
structural deterioration of reinforced concrete structures. After that the structure usually 99
degrades faster and reaches to limit states quickly. 100

- 5 -
This paper attempts to develop an analytical model for non-uniform corrosion induced concrete 101
cracking. A time-dependent non-uniform corrosion model is first derived, based on realistic 102
experimental results from literature. A cracking model is then formulated by using the complex 103
functions to account for the non-uniform stress distribution on concrete. A number of material, 104
geometric and corrosion parameters are considered in the analytical model. The initiation of the 105
concrete cracking is determined as a function of its service time. 106
107
RESEARCH SIGNIFICANCE 108
Although considerable research has been conducted on modelling corrosion-induced concrete 109
cracking problems, very few models have been proposed based on non-uniform corrosion of 110
reinforcement in concrete. Amongst these available models for non-uniform corrosion, most 111
employed numerical approaches while almost none on an analytical manner. However, it has 112
become a widely accepted fact that the corrosion of reinforced concrete is normally not 113
uniform. For accurate prediction of cracking caused by corrosion, it is necessary to consider 114
non-uniform corrosion expansion in the formulation of stress and strain in the concrete solid. It 115
is therefore imperative to derive a rational model for corrosion-induced concrete cracking to 116
achieve the cost effectiveness in the asset management of reinforced concrete structures. To the 117
best knowledge of the authors, this paper represents the first attempt in the analytical 118
formulation of time-dependent non-uniform corrosion induced concrete cracking. 119
120
NON-UNIFORM CORROSION MODEL 121
Concrete with an embedded bar subjected to an internal pressure at the interface between the 122
bar and concrete can be modelled as a thick-wall cylinder (Bazant, 1979, Pantazopoulou and 123
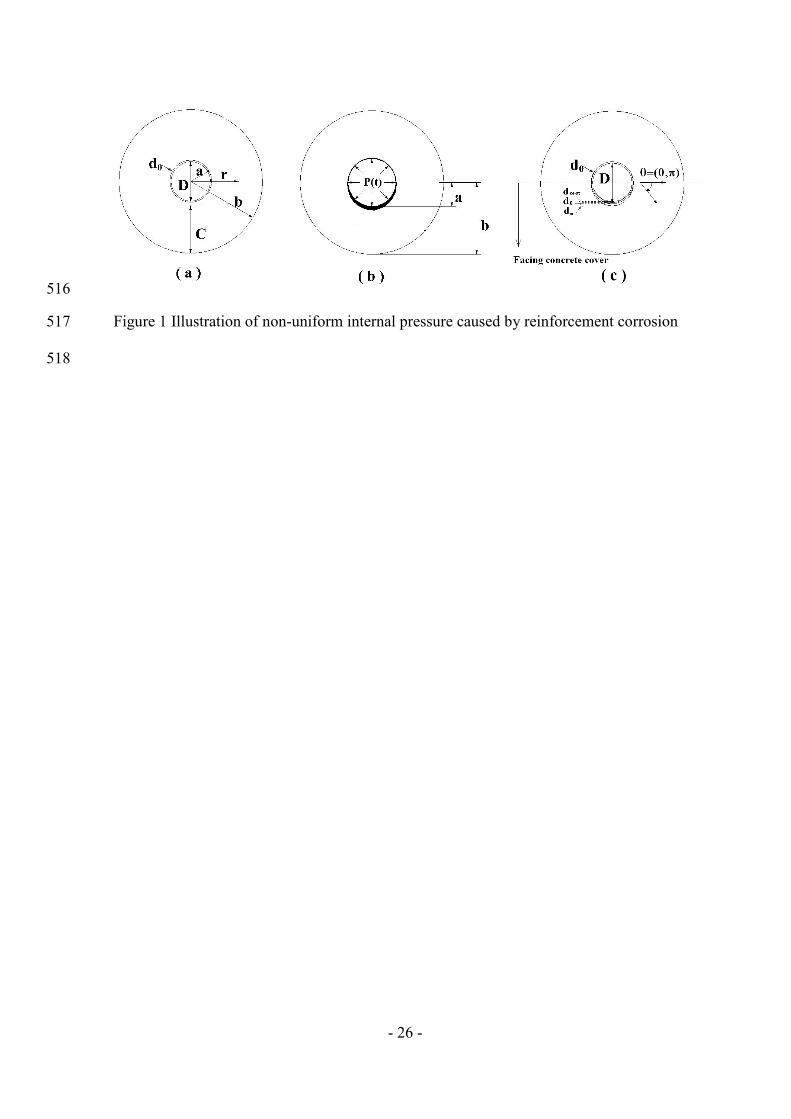
Papoulia, 2001, Tepfers, 1979). This is schematically shown in Figure 1(a), where D is the 124
- 6 -
diameter of the bar; 0d is the thickness of the annular layer of concrete pores at the interface 125
between the bar and concrete; and C is the concrete cover. Usually 0d is constant once 126
concrete has hardened. The inner and outer radii of the cylinder are 02/ dDa and 127
02/ dDCb . 128
129
The corrosion products (mainly ferrous and ferric hydroxides, Fe(OH)2 and Fe(OH)3) occupy a 130
few times more space than the original steel. The corrosion products first fill in the annular 131
pores in concrete around the reinforcing bar, with thickness 0d , but normally do not produce 132
stresses in concrete. As corrosion propagates in concrete, a band of corrosion products forms, as 133
shown in Figure 1(b). If the reinforcement corrosion is a uniform process along the 134
circumference of the reinforcing bar, the band becomes a circular ring which causes uniform 135
expansive pressure on the concrete cylinder (Li et al., 2006). However, this is usually not 136
realistic as discussed earlier. It has been found that (Yuan and Ji, 2009), the front of corrosion 137
products for the half of rebar facing concrete cover is in a semi-elliptical shape, while corrosion 138
of the opposite half of rebar is negligibly small and can be neglected. 139
140
141
The total amount of corrosion products tWrust can be assumed to distribute around the bar, 142
occupying three parts as shown in Figure 1(c): the semi-elliptical band of corroded steel with 143
maximum thickness stcod , the porous circular band 0d and the semi-elliptical rust band with 144
maximum thickness md . It should be noted that the semi-major axis for the semi-ellipse of 145
corrosion front is mddD 02/ . tWrust can thus be expressed as follows: 146
147
msrust WWWtW 0 (1) 148
149
- 7 -
Where sW is the amount of rust replacing the corroded steel, 0W is the amount of rust filling the 150
porous band 0d and mW is the amount of rust in the band md . sW , 0W and mW can be derived 151
respectively as follows: 152
153
st
rustrustrusts WW
(2) 154
155
2
000
ddDW rust
(3) 156
157
mrust
mrustm ddD
dD
ddD
dD
W
0
2
0002222222
(4) 158
159
rust is the molecular weight of steel divided by the molecular weight of corrosion products. It 160
varies from 0.523 to 0.622 according to different types of corrosion products (Liu and Weyers, 161
1998). rust is the density of corrosion products. 162
163
By substituting Equations (2-4) into Equations (1), it becomes: 164
165
mm
st
rust
rust
rust dddD
dDdtW
0
2
002
12
(5) 166
167
By neglecting the second order of small quantities, i.e., mdd0 and 2
0d , md can be derived as 168
follows: 169
170
0214
dD
Wtd
st
rust
rust
rustm
(6) 171
172
tdm in Equation (6) is the maximum corrosion-induced expansion along the interface to the 173
concrete cylinder under which the stress will be initiated in the cylinder. tdm determines the 174
- 8 -
shape of the semi-ellipse which is the boundary condition of the concrete cylinder in deriving 175
stresses and strains in concrete. 176
177
In Equation (6), tWrust is related to the corrosion rate of the steel rebar and can be expressed as 178
(Liu and Weyers, 1998): 179
180
0
( ) 2 0.105(1/ ) ( )
t
rust rust corrW t Di t dt (7) 181
where corri is the corrosion current density in 2/cmA , which is widely used as a measure of 182
corrosion rate. 183
184
The units of the parameters in Equations (1-7) need to keep consistent. For the clarification and 185
also the convenience of readers, the units are specified in Table 1. 186
187
To determine the displacement boundary condition of the concrete cylinder, the function of the 188
semi-ellipse of the corrosion front needs to be derived. It is known that, in rectangular 189
coordinate system, the function for an ellipse can be expressed as follows: 190
12
2
2
2
SL A
x
A
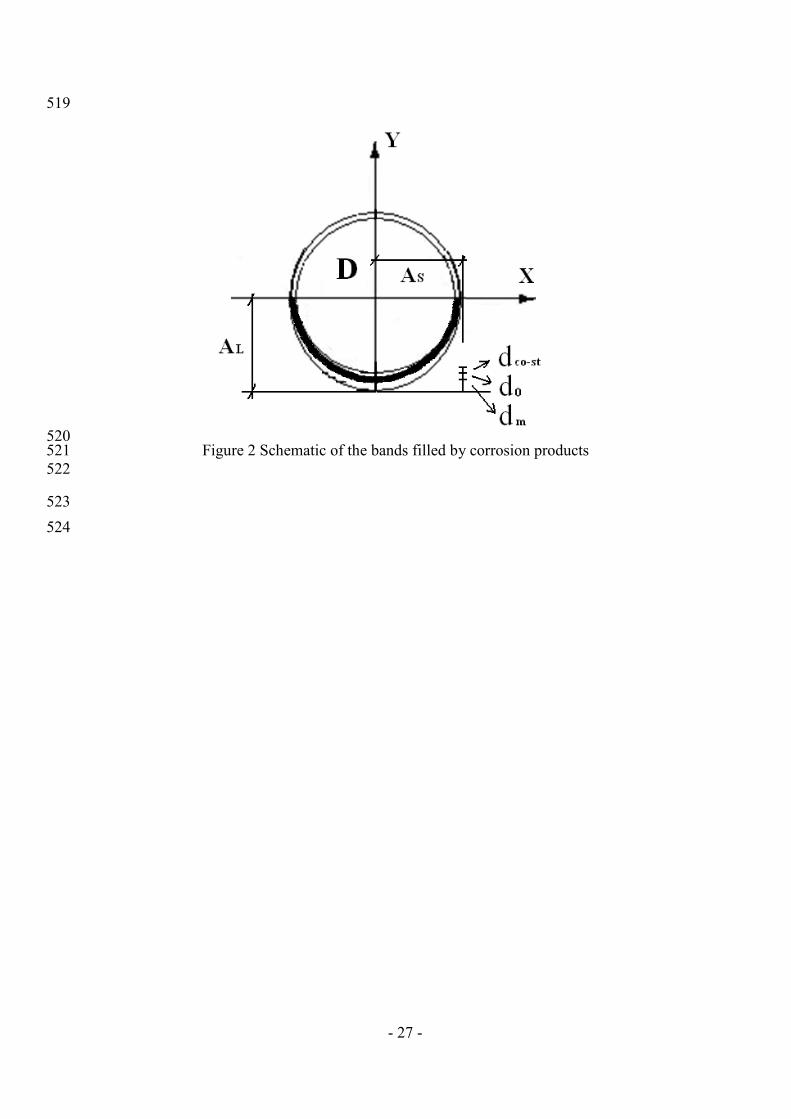
y (8) 191
where LA is the half length of major axis and SA is the half length of the minor axis for an 192
ellipse, as shown in Figure 2. The bottom half of the circular band 0d is shaded for easier 193
recognition of the three bands, e.g., stcod , 0d and md . Based on the geometry in Figure 2, 194
LA and SA can be obtained, i.e., mL ddDA 02/ and 02/ dDAS . 195
196
Transforming to a polar coordinate system, Equation (8) can be rewritten as follows, 197
198
- 9 -
2222 cossin LS
SL
AA
AAr
(9) 199
200
Substituting LA and SA in the above equation, 201
202
2
0
2
0
00
cos21642
222
mm
m
ddDddD
dDddDr
(10) 203
204
The displacement boundary condition of the concrete cylinder t, can therefore be derived, 205
with md substituted in Equation (6): 206
0
2
000
2
0
000
2cos2
142
123242
2418
2
, dD
dD
tWdDd
D
tWdD
dDdD
tWdD
t
st
rust
rust
rust
st
rust
rust
rust
st
rust
rust
rust
207
(11) 208
where 0 . 209
210
CONCRETE CRACKING MODEL 211
As discussed, the concrete is modelled as a thick wall cylinder. In polar coordinate system, the 212
stress components in plane stress/strain elastic body can be expressed in terms of two arbitrary 213
complex functions z and z (Sadd, 2005) as follows: 214
zzr
''2 (12) 215
i
rr ezzzi 2'''22 (13) 216
where r is the radial stress component, is the hoop stress component and r is the shear 217
stress component. 218
219
Solving the Equations (12) and (13) the individual stress components can be derived as follows, 220

- 10 -
ii
r ezezzz 2'2'''2Re (14) 221
ii ezezzz 2'2'''2Re (15) 222
ii
r ezezz 2'2''Im (16) 223
224
The solution to the complex functions z and z relies on solving the boundary conditions 225
of the hollow circular cylinder. There are two types of boundary conditions that can be 226
formulated, i.e., stress boundary condition and displacement boundary condition. These 227
conditions can be expressed as follows: 228
ziFzzzz ' for stress boundary condition (17) 229
zGzzzz 2' for displacement boundary condition (18) 230
where zF is the resultant force exerting on a boundary, G is the shear modulus, is the 231
displacement exerting on a boundary. 43 for plane strain problem and
1
3 for 232
plane stress problem, while is the Poisson’s ratio. 233
234
As discussed, the expansive mechanism is modelled as displacement boundary condition to the 235
inner circle of the concrete cylinder. The inner boundary condition can be expressed as follows, 236
tzGzzzz ,2 111
'
11 , iaez 1 (19) 237
The outer boundary is the surface of the concrete cover. Therefore, the stress condition can be 238
formulated as follows, 239
0222
'
22 ziFzzzz , ibez 2 (20) 240
241

- 11 -
According to Laurent’s Theorem, each complex potential can be expressed as a power series, 242
reducing the stress and/or displacement boundary problems to sets of simultaneous linear 243
equations in the coefficients of the two power series (MuSkhelishvili, 1953). 244
n
n zz
(21) 245
n
n zz
(22) 246
where bza . Substituting Equations (21) and (22) into the stress boundary condition, i.e., 247
Equation (20), it becomes 248
02
1
222
n
n
n
n
n
n zznzz , for ibez 2 (23) 249
For the sake of simplifying Equation (23), both sides of the equation are multiplied by 250
ime ( m = 0 or integer), followed by integration with respect to from 0 to 2 . The boundary 251
condition (Equation 23) then becomes: 252
02
0
2
0
112
0
deebdeebnbedeeb iminn
n
imnin
n
iiminn
n (24) 253
It can be mathematically proved that, 02
0
dein if n is an integer or 2 if 0n . Therefore 254
Equation (24) can be simplified as follows: 255
02 222 mmm
m bmb (25) 256
Similarly, by substituting the power series, the inner displacement boundary condition, i.e., 257
Equation (19), becomes, 258
tGzznzzn
n
n
n
n
n ,21
1
111
, for iaez 1 (26) 259

- 12 -
Substituting iaez 1 , multiplying ime and integrating with respect to from 0 to 2 , 260
Equation (26) can be simplified as follows: 261
2
02
22 ,2 detGa
ama imm
mmm
m (27) 262
By combining Equation (25) and (27), m and m can be derived. 263
222222222
2
0
222222
0
222
2
,,2
bammbaba
detGabadetGabam
mmmm
immmmmi
m
m
(28) 264
22
2
0
21212 ,
ba
detGaba immm
mm
m
(29) 265
266
To solve m and m with regards to the integrals in Equations (28) and (29), t, , i.e., 267
Equation (11), needs to be expanded to Fourier series as follows (MuSkhelishvili, 1953): 268
ik
k
keAt
, (30) 269
where
2
0,
2
1detA ik
k . 270
271
It is difficult to derive the explicit integrated form of series coefficients kA ; however, those 272
coefficients can be determined by numerical integration once all the other parameters are 273
evaluated. 274
275
Substituting Equations (30) into Equations (28) and (29), 276

- 13 -
222222222
2
0
22222
0
2222
2
2
bammbaba
deAGabadeAGabam
mmmm
mki
k
mmmmki
k
m
m
277
(31) 278
22
2
0
21212
ba
deAGaba mki
k
mm
mm
m
(32) 279
Since 02
0
dein if n is an integer or 2 if 0n , m and m can be determined. 280
222222222
2222
2
222
2
222
bammbaba
GAabaGAabam
mmmm
m
mmm
m
m
m
(33) 281
22
21212 2
ba
GAaba m
mm
mm
m
(34) 282
where m is an integer or 0. The Fourier coefficients kA can be numerically determined in 283
MatLab and therefore m and m are solved. By substituting m and m into Equations (21) 284
and (22), the stress components, i.e., r , and r , can be calculated from Equations (14) – 285
(16). 286
287
WORKED EXAMPLE 288
To demonstrate the application of the derived model, a numerical example is undertaken on a 289
reinforced concrete beam originally investigated in (Li, 2003). The corrosion was achieved via 290
saltwater spray in a customer designed environmental chamber. The values of basic variables of 291
the structure and corrosion are shown in Table 2. 292
293
- 14 -
With these values of the basic variables, first of all, the corrosion caused expansion 294
(displacement) can be obtained. tdm in Equation (6), defining the shape of the inner 295
displacement boundary condition of the concrete cylinder, is illustrated as a function of service 296
time (10 years), shown in Figure 3. Such a development of corrosion expansion is based on the 297
assumption that the corrosion rate corri is time-dependent and equal to 0.3686ln(t)+1.1305 298
A/cm2 (Li, 2003). The inset in Figure 3 represents an enlarged picture showing the initial 299
progression of the corrosion products. It can be seen that the maximum displacement tdm 300
starts to increase from zero at around 0.2 year, which is then followed by gradual increase in the 301
subsequent lifetime. Once tdm is obtained, the whole inner boundary condition of the 302
concrete cylinder, represented by Equation (11), can be determined. 303
304
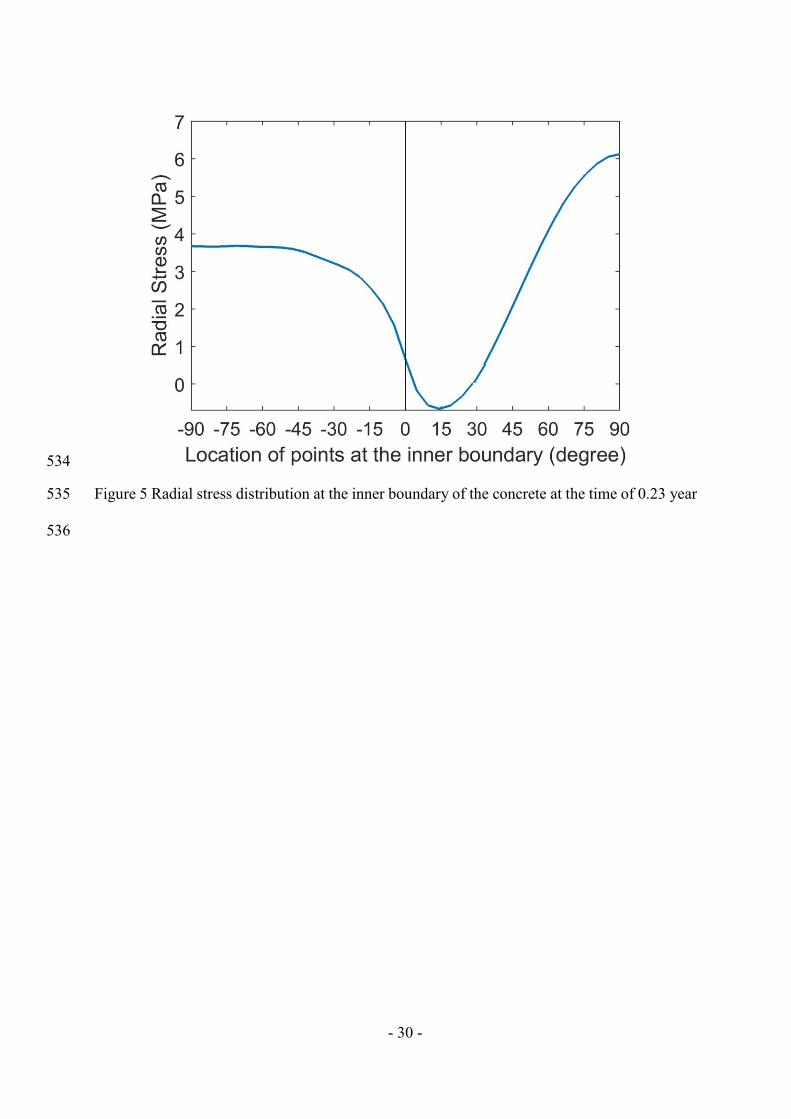
Under the non-uniform expansion caused by reinforcement corrosion, the stresses can be 305
calculated from Equations (14) – (16). Figures 4 and 5 show the hoop and radial stresses, 306
respectively, at the inner boundary of the concrete cylinder at 0.23 year. As illustrated in Figure 307
1 – c, the point of zero degree is located at the right middle of the inner boundary, with [0, 308
2/ ] represents the top right quarter and [0, 2/ ] represents the bottom right quarter, of the 309
concrete cylinder. The whole cylinder is symmetric against the y-axis, as shown in Figure 2. It 310
can be seen that the hoop stress changes along the inner boundary, most of which is under 311
tension. It has been found the highest hoop stress occurs at the location close to 15o. This is the 312
location where the crack is initiated. Although most of the concrete is in tension, a small part of 313
the concrete cylinder, from 80o to 90o, is under mild compression in the hoop direction. It is 314
worth to mention that the maximum displacement tdm of the elliptical shape of the boundary 315
condition is added at the location of 90o. The combined tension and compression distribution of 316
hoop stress is quite different than previous findings by assuming uniform corrosion expansion 317
- 15 -
where the hoop stresses of the concrete are all in tension, e.g., in (Li and Yang, 2011). Under the 318
non-uniform expansion, the point at 90o location appears to have the largest radial and 319
compressive stress. At the region around 15o the radial stress is in tension. It is very interesting 320
to find, under the non-uniform corrosion expansion, the 90o location is in compression in both 321
hoop and radial directions, whilst the 15o location is in tension in both directions. It should be 322
noted that the positive hoop stress in Figure 4 represents tensile stress while the positive radial 323
stress in Figure 5 represents compressive stress. 324
325
VALIDATION OF THE DEVELOPED MODEL 326
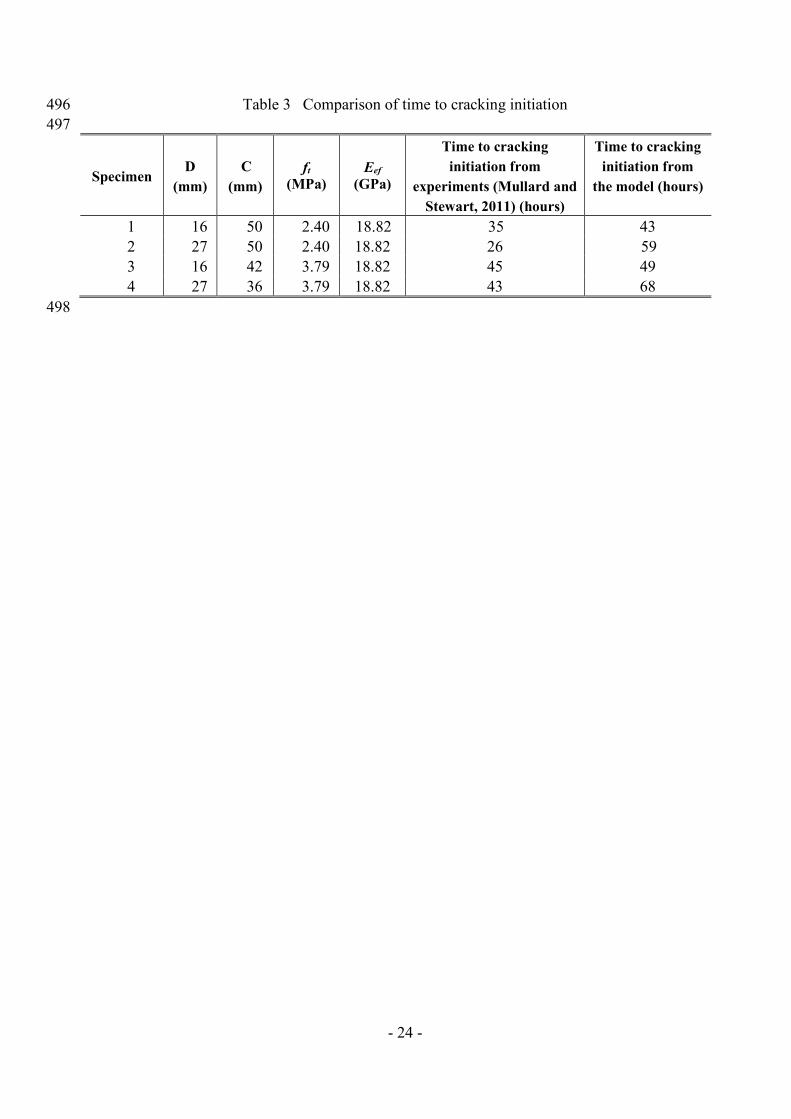
The derived model is verified by comparing the time to cracking initiation of the model and the 327
experimental results from literature. According to the literature searched, almost all the test data 328
regarding the time to cracking initiation are based on uniform corrosion development by 329
electric current method for accelerated corrosion. For the limited experimental research on 330
non-uniform corrosion by utilizing artificial environmental chamber with salt spray function, 331
no data on time to cracking initiation was provided. In light of comparing the derived model 332
with the test results, a special case of uniform corrosion was solved based on the developed 333
model. The stresses were then computed by the derived analytical equations and the time to 334
cracking initiation was determined, according to given tensile strength of the concrete. The 335
values for all inputs were made the same between the analytical model and the experiment. The 336
corrosion rate corri is time-dependent in this model; but for the purpose of comparison, 337
2/100 cmAicorr was used as was applied in the test (Mullard and Stewart, 2011). The 338
comparison to the experimental results is shown in Table 3. The results from the analytical 339
model and the experimental tests are in reasonable agreement. Further, it is interesting to find 340
that all the modelled times to cracking initiation are larger than the experimental ones. This is 341

- 16 -
probably because the assumption of the ITZ in the model, i.e., it is totally stress-free when the 342
corrosion products are filling the band of ITZ. In fact, however, the filling of the corrosion 343
products in the porous ITZ can cause pressure. As a result, such an assumption of the ITZ will 344
underestimate the pressure induced by corrosion. The effect of the thickness 0d of the ITZ will 345
be elaborated in the following section and illustrated in Figure 8. 346
347
ANALYSIS AND DISCUSSION 348
Corrosion rate, normally expressed as corrosion current density corri , has been considered one 349
of the key factors affecting the durability of reinforced concrete structures. A number of 350
researchers have been working on developing realistic models for the corrosion rate; in the 351
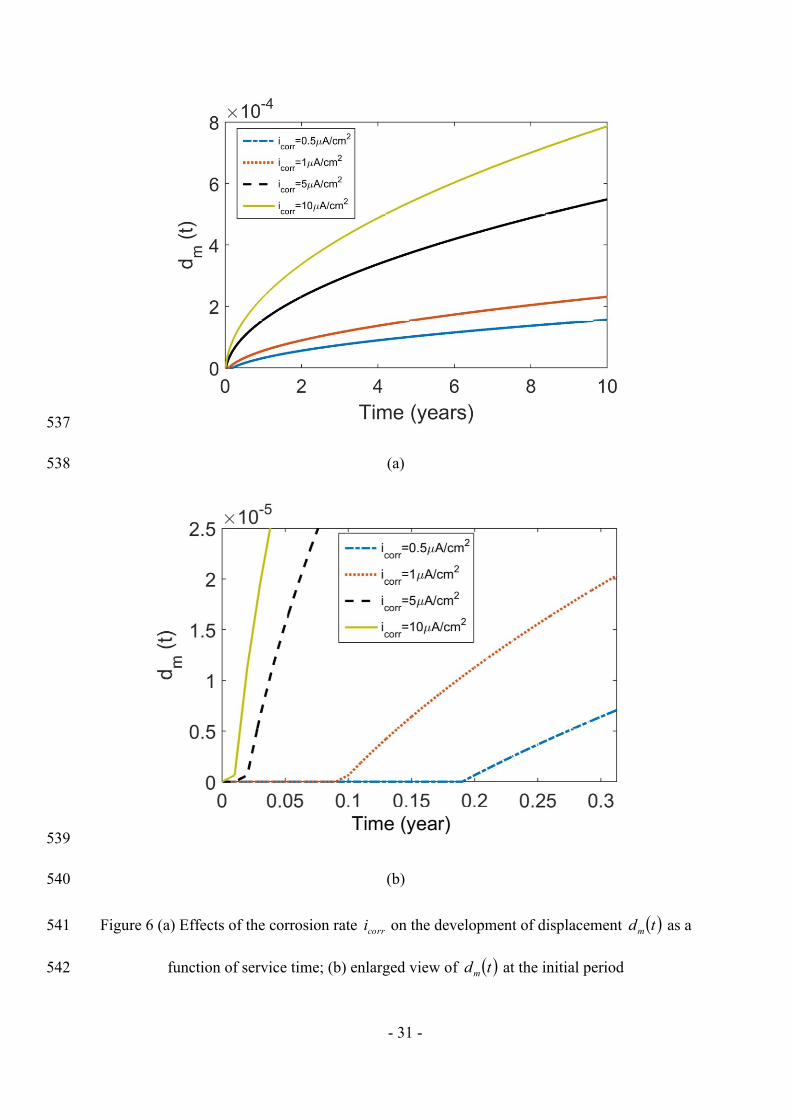
worked example, a time-dependent corrosion rate was employed. To investigate the effects of 352
the corrosion rate on the corrosion caused expansion, i.e., tdm , 4 constants corrosion rates are 353
used, i.e., 2/5.0 cmAicorr , 2/0.1 cmAicorr , 2/5 cmAicorr and 2/10 cmAicorr , as 354
presented in Figure 6(a). These corrosion rates are believed to have covered a wide range of 355
actual corrosion states of reinforced concrete structures. It can be seen that, as expected, the 356
increase of the corrosion rate will cause the increase of expansive displacement to the concrete. 357
The long-term effect is significant; for example, as the corrosion rate grows up to 10 times, the 358
10-year maximum displacement tdm could be increased to about 3.5 times. Such an increase 359
magnitude in the displacement boundary condition is crucial to the stress development in the 360
concrete cylinder. Nevertheless, the short-term effect is more sensitive, as shown in Figure 361
6(b). The corrosion rate 2/10 cmAicorr causes immediate form and progression of the rust 362
band at 0.01 year, whilst the pushing over of the rust band to the concrete cylinder is delayed to 363
0.19 year for the corrosion rate 2/5.0 cmAicorr . Further, the initial slope of the development 364

- 17 -
of tdm is considerably steeper for higher corrosion rates. This means the initiation of cracking 365
might be very sensitive to the corrosion rate. 366
367
Figure 7 shows the development of tdm as the diameter of the reinforcing rebar changes. 368
When the diameter of the rebar increases from 12mm to 20mm, the time to the initial 369
progression of tdm is delayed slightly, i.e., 0.06 year. The long-term development of tdm 370
against the service time is also reduced as the diameter of rebar increases. This proves that, for 371
the same corrosion rate, larger size of rebar favours the corrosion caused expansion and hence 372
delays the cracking initiation of the concrete. 373
374
Figure 8 demonstrates the effects of the ITZ thickness on the accumulation of the corrosion 375
products. Three reasonable values of thickness are selected for the calculation of tdm . As 376
expected, the increase of the ITZ thickness can delay the occurrence of the expansive 377
displacement. This is mainly because in this paper the porous ITZ is assumed to fully 378
accommodate the corrosion products; as a result, the process of the accumulation of corrosion 379
products in ITZ, does not cause any stress or displacement. In Figure 8, it has been found that 380
the effect of ITZ thickness on the initial stage of tdm progression is quite considerable, with 381
the delay of roughly 83% from 0.18 year to 0.33 year for med 6120 and med 6200 , 382
respectively. However, the long-term effects on tdm seems not very significant. 383
384
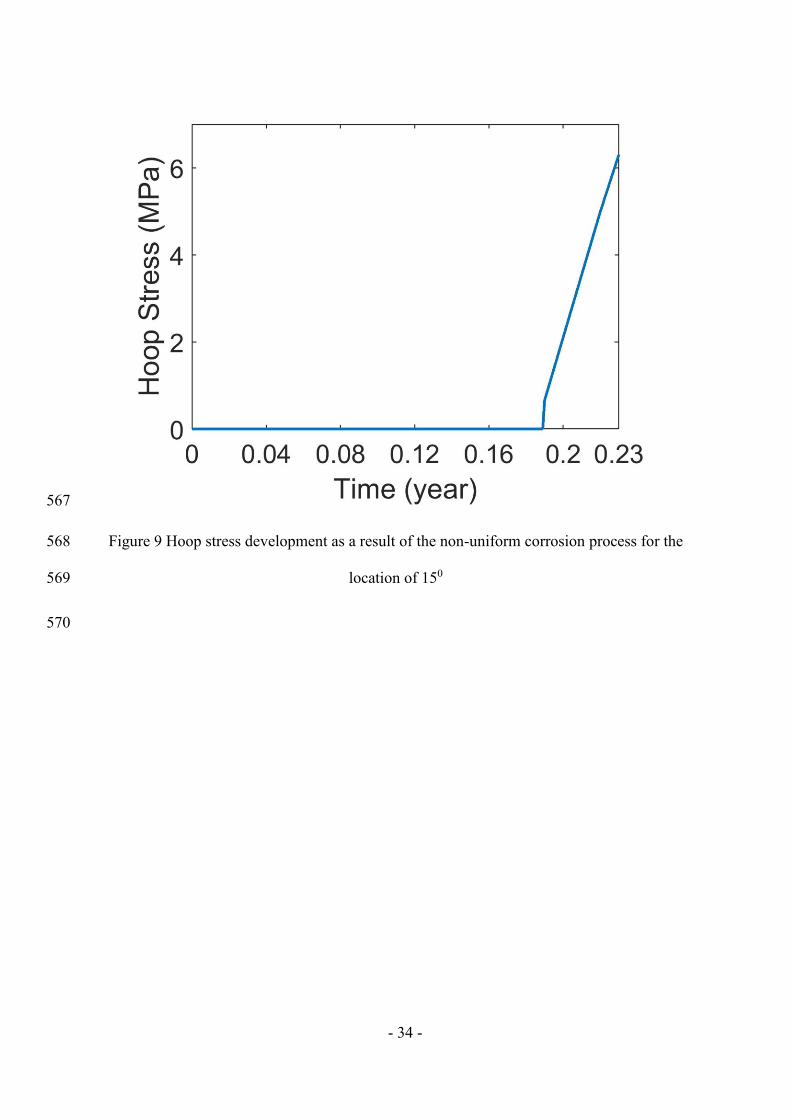
Figure 4 has shown the maximum tensile stress occurs at the location of around 150, as a result 385
of the non-uniform corrosion expansion modelled. It is therefore worth to plot the hoop stress 386
- 18 -
development history of this point. Figure 9 presents the hoop stress development as a function 387
of service time for the point of 15o. The hoop stress for this point keeps constantly zero until 388
0.19 year which is followed by a very quick increase up to about 6MPa at 0.23 year. Most 389
concrete will be cracked at such a level of tensile stress. The initial period of 0.19 year mainly 390
represents the time for corrosion products propagating into the porous ITZ. Moreover, the 391
initial 0.23 year represents for the initiation of cracking which marks the start of structural 392
degradation. 393
394
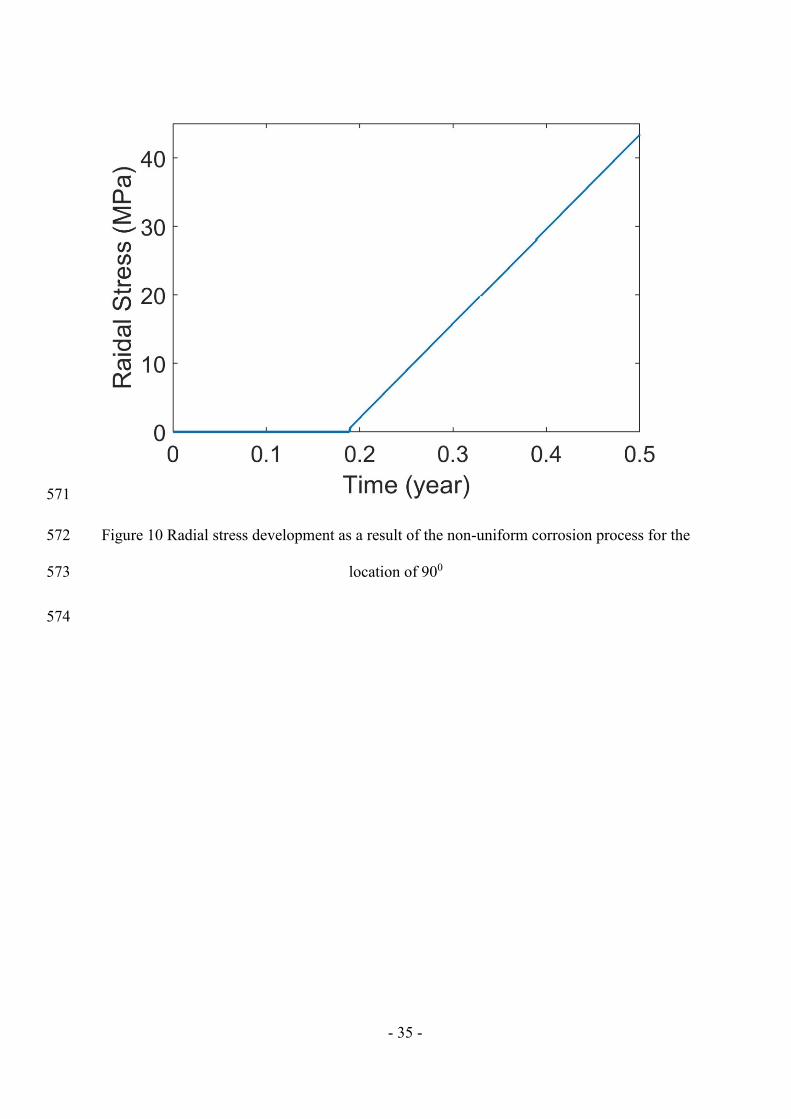
Figure 10 shows the radial stress development for the point of 90o under the derived 395
non-uniform corrosion model. This point is where the maximum displacement tdm is applied 396
and the maximum compressive stress occurs. Although the main failure type of this problem is 397
fracture which is caused by tension, Figure 10 could be useful as to indicating the extent of 398
compression at the time of cracking initiation. 399
400
By knowing the tensile strength of concrete ft , the time to cracking initiation can be obtained. 401
This is based on the failure criterion of the tensile stress reaches the tensile strength of concrete. 402
As specified in Table 2, ft =5.725MPa is used in this study; hence the effect of corrosion rate on 403
the time to initiation of cracking can be determined, as shown in Figure 11. Four corrosion rates 404
are considered and fitted curve (R2=1) was produced according to these four points. It can be 405
seen that for minor corrosion extent, e.g., corri is between 2/5.0 cmA and about 2/0.3 cmA , 406
the time to cracking initiation is very sensitive to the corrosion rate; however, when corri is 407
larger than 2/0.3 cmA , the change in time to initiation of cracking is very small. 408
409
- 19 -
CONCLUSIONS 410
In the paper, the stresses in concrete, subjected to non-uniform corrosion of the reinforcement, 411
have been formulated. The non-uniform stress distribution was analytically solved by using the 412
complex functions. The displacement boundary condition applied to the concrete cylinder was 413
derived as a function of the time-dependent corrosion rate. Further, the time to initiation of 414
concrete cracking has been determined based on the model developed, given values of the key 415
material and corrosion parameters. It has been demonstrated that the developed analytical 416
model can simulate the stresses in concrete caused by non-uniform corrosion and predict the 417
time to cracking initiation. The model has also been partially verified due to the limitation of 418
available test data on non-uniform corrosion directly. The developed model can be practically 419
used by industrial engineers and asset managers for their decision-making in regards to 420
corrosion induced concrete cracking problems. 421
422
ACKNOWLEDGEMENT 423
Financial support from European Commission via the Marie Curie IRSES project GREAT 424
under FP7-PEOPLE-2013-IRSES-612665, Scottish Funding Council GRPe for early career 425
researcher exchanges and Australian Research Council under DP140101547, LP150100413 426
and DP170102211 is gratefully acknowledged. 427
428

- 20 -
REFERENCES 429
Andrade C, Alonso C and Molina FJ (1993) Cover cracking as a function of bar corrosion: part 430 I-experimental test. Materials and Structures 26: 453-464. 431
Bazant ZP (1979) Physical model for steel corrosion in concrete sea structures - theory. Journal 432 of the Structural Division-ASCE 105: 1137-1153. 433
Bhargava K, Ghosh AK, Mori Y and Ramanujam S (2006) Model for cover cracking due to 434 rebar corrosion in RC structures. Engineering Structures 28: 1093-1109. 435
Du YX, Jin WL and Zhang R (2014) Modeling the cracking of cover concrete due to 436 non-uniform corrosion of reinforcement. Corrosion Science, 89, 189-202. 437
EL Maaddawy, T, Soudki K and Topper T (2005) Analytical model to predict nonlinear 438 flexural behavior of corroded reinforced concrete beams. ACI Structural Journal 102: 439 550-559. 440
González, JA, Andrade C, Alonso C and Feliu S (1995) Comparison of rates of general 441 corrosion and maximum pitting penetration on concrete embedded steel reinforcement. 442 Cement and Concrete Research 25: 257-264. 443
Jang, BS and Oh BH (2010) Effects of non-uniform corrosion on the cracking and service life 444 of reinforced concrete structures. Cement and Concrete Research 40: 1441-1450. 445
Koch, GH, Brongers MPH, Thompson NG, Virmani YP and Payer JH (2002) Corrosion cost 446 and preventive strategies in the United States. Federal Highway Administration, United 447 States. 448
Li, CQ (2003) Life cycle modelling of corrosion affected concrete structures - propagation. 449 ASCE Journal of Structural Engineering 129: 753-761. 450
Li, CQ, Melchers RE and Zheng JJ (2006) Analytical model for corrosion-induced crack width 451 in reinforced concrete structures. ACI Structural Journal 103: 479-487. 452
Li CQ and Yang ST (2011) Prediction of concrete crack width under combined reinforcement 453 corrosion and applied load. ASCE Journal of Engineering Mechanics 137: 722-731. 454
Liu Y and Weyers RE (1998) Modelling the time-to-corrosion cracking in chloride 455 contaminated reinforced concrete structures. ACI Materials Journal 95: 675-681. 456
Mullard JA, and Stewart MG (2011) Corrosion-induced cover cracking: new test data and 457 predictive models. ACI Structural Journal 108: 71-79. 458
Muskhelishvili NI (1953) Some basic problems of the mathematical theory of elasticity, 459 Holland, P. Noordhoff Ltd. 460
Otsuki N, Miyazato S, Diola NB and Suzuki H (2000) Influences of bending crack and 461 water-cement ratio on chloride-induced corrosion of main reinforcing bars and stirrups. 462 ACI Materials Journal 97: 454-464. 463
Pan T and Lu Y (2012) Stochastic modeling of reinforced concrete cracking due to nonuniform 464 corrosion: FEM-based cross-scale analysis. ASCE Journal of Materials in Civil 465 Engineering 24(6): 698-706. 466
Pantazopoulou SJ and Papoulia KD (2001) Modeling cover cracking due to reinforcement 467 corrosion in RC structures. ASCE Journal of Engineering Mechanics 127: 342-351. 468
Sadd MH (2005) Elasticity: theory, application and numerics, USA, Elsevier 469 Butterworth-Heinemann. 470
Tepfers R (1979) Cracking of concrete cover along anchored deformed reinforcing bars. 471 Magazine of Concrete Research 31: 3-12. 472
Yuan Y and Ji Y (2009) Modeling corroded section configuration of steel bar in concrete 473 structure. Construction and Building Materials 23: 2461-2466. 474
Zhao Y, Karimi AR, Wong HS, Hu B, Buenfeld NR and Jin W (2011) Comparison of uniform 475 and non-uniform corrosion induced damage in reinforced concrete based on a Gaussian 476 description of the corrosion layer. Corrosion Science 53: 2803-2814. 477
478
- 21 -
LIST OF TABLES 479
1. Units of the parameters 480
2. Values of basic variables used in cracking computation 481
3. Comparison of time to cracking initiation 482
483
484
485

- 22 -
486
Table 1 Units of the parameters 487
488
Parameter Unit
0/ dD mm
strust / 3/ mkg
rust n.a.
msrust WWWW /// 0 mmmg /
tdm m
icorr 2/A cm
t year
489
490

- 23 -
491 Table 2 Values of basic variables used in cracking computation 492
493
Symbol Values Sources
C
D
d0
Eef
ft
corri
rust
G
rust
st
31 mm
12 mm
12.5 m
18.82 GPa
5.725 MPa
0.3686ln(t)+1.1305 A/cm2
0.57
0.18
)]1(2/[ E
3600 kg/m3
7850 kg/m3
Li (2003)
Li (2003)
Liu and Weyers (1998)
Li (2003)
Li (2003)
Li (2003)
Liu and Weyers (1998)
Liu and Weyers (1998)
Timoshenko and Goodier (1970)
Liu and Weyers (1998)
Liu and Weyers (1998)
494
495
- 24 -
Table 3 Comparison of time to cracking initiation 496
497
Specimen D
(mm)
C
(mm)
ft
(MPa)
Eef
(GPa)
Time to cracking
initiation from
experiments (Mullard and
Stewart, 2011) (hours)
Time to cracking
initiation from
the model (hours)
1 16 50 2.40 18.82 35 43
2 27 50 2.40 18.82 26 59
3 16 42 3.79 18.82 45 49
4 27 36 3.79 18.82 43 68
498
- 25 -
LIST OF FIGURES 499
1. Illustration of non-uniform internal pressure caused by reinforcement corrosion 500
2. Schematic of the bands filled by corrosion products 501
3. tdm as a function of service time 502
4. Hoop stress distribution at the inner boundary of the concrete at the time of 0.23 year 503
5. Radial stress distribution at the inner boundary of the concrete at the time of 0.23 year 504
6. (a) Effects of the corrosion rate corri on the development of displacement tdm as a 505
function of service time; (b) enlarged view of tdm at the initial period 506
7. Effects of the diameter of the rebar D on the progression of tdm 507
8. Effects of the thickness of the ITZ on the progression of tdm 508
9. Hoop stress development as a result of the non-uniform corrosion process for the location of 509
15o 510
10. Radial stress development as a result of the non-uniform corrosion process for the location 511
of 90o 512
11. Time to the initiation of concrete cracking as a function of the corrosion rate 513
514
515
- 26 -
516
Figure 1 Illustration of non-uniform internal pressure caused by reinforcement corrosion 517
518
- 27 -
519
520 Figure 2 Schematic of the bands filled by corrosion products 521
522
523
524

- 28 -
525
Figure 3 tdm as a function of service time 526
527
528
529
530

- 29 -
531
Figure 4 Hoop stress distribution at the inner boundary of the concrete at the time of 0.23 year 532
533
- 30 -
534
Figure 5 Radial stress distribution at the inner boundary of the concrete at the time of 0.23 year 535
536
- 31 -
537
(a) 538
539
(b) 540
Figure 6 (a) Effects of the corrosion rate corri on the development of displacement tdm as a 541
function of service time; (b) enlarged view of tdm at the initial period 542

- 32 -
543
544
545
546
547
548
549
550
551
552
Figure 7 Effects of the diameter of the rebar D on the progression of tdm 553
554

- 33 -
555
556
557
558
559
560
561
562
563
564
Figure 8 Effects of the thickness of the ITZ on the progression of tdm 565
566
- 34 -
567
Figure 9 Hoop stress development as a result of the non-uniform corrosion process for the 568
location of 150 569
570
- 35 -
571
Figure 10 Radial stress development as a result of the non-uniform corrosion process for the 572
location of 900 573
574

- 36 -
575
Figure 11 Time to the initiation of concrete cracking as a function of the corrosion rate 576
577
578
![[UNIFORM INTERNATIONAL WILLS ACT] [UNIFORM PROBATE … 1977 Final.pdf · [uniform international wills act] [uniform probate code, ... richard v. wellman, ... richard kearney, department](https://cdn.vdocument.in/doc/165x107/5aa0144e7f8b9a0d158da985/uniform-international-wills-act-uniform-probate-1977-finalpdfuniform-international.jpg)


