
ANCHORAGE ZONE DESIGN FOR PRETENSIONED BULB-TEE BRIDGE GIRDERS IN VIRGINIA
By
Eric D. Crispino
Thesis submitted to the faculty of the
Virginia Polytechnic Institute and State University
in partial fulfillment of the requirements for the degree of
MASTER OF SCIENCE
In
CIVIL ENGINEERING
Approved:
Dr. Thomas E. Cousins Dr. Carin L. Roberts-Wollmann
Dr. Rodney T. Davis
March 1, 2007
Blacksburg, Virginia
Keywords: Anchorage Zone, Pretensioned Bridge Girder, Strut-and-Tie Model

ANCHORAGE ZONE DESIGN FOR PRETENSIONED BULB-TEE BRIDGE GIRDERS IN VIRGINIA
by
Eric D. Crispino
ABSTRACT
Precast/Prestressed concrete girders are commonly used in bridge construction in
the United States. The application and diffusion of the prestress force in a pretensioned
girder causes a vertical tension force to develop near the end of the beam. Field surveys
of the beam ends of pretensioned bridge girders indicate that many of the PCBT beams
used in the Commonwealth of Virginia develop cracks within the anchorage zone region.
The lengths and widths of these cracks range from acceptable to poor and in need of
repair. Field observations also indicate deeper cross sections, very heavily prestressed
sections, and girders with lightweight concrete tend to be most susceptible to crack
formation.
This research examined a new strut-and-tie based design approach to the
anchorage zone design of the PCBT bridge girders used in Virginia. Case study girders
surveyed during site visits are discussed and used to illustrate the nature of the problem
and support the calibration of the strut-and-tie based model. A parametric study was
conducted using this proposed design model and the results of this study were
consolidated into anchorage zone design tables. The results of the parametric study were
compared to the results obtained using existing anchorage zone design models,
international bridge codes, and standard anchorage zone details used by other states. A
set of new standard details was developed for the PCBT girders which incorporates
elements of the new design approach and is compatible with the anchorage zone design
aids.
A 65 ft PCBT-53 girder was fabricated to verify the new strut-and-tie based
design model. This girder contained anchorage zone details designed with the new
model. The new anchorage zone details were successful at controlling the development
of anchorage zone cracks. The new design approach is recommended for implementation
by the Virginia Department of Transportation.

Acknowledgements
I would like to thank the members of my committee for the opportunity to
conduct this research. Dr. Rodney Davis provided with me endless insight on the nature
of the problem and was always available to assist me with questions. Dr. Wollmann and
Dr. Cousins provided me with excellent mentorship not only in these research aspects,
but in the classroom as well. My sincerest gratitude goes to all of you. This research was
possible thanks to the support of the Virginia Transportation Research Council. Over the
course of this research project I have had the opportunity to work with several members
of this outstanding organization. I extend my gratitude to Dr. Ozyildirim, Bernard
Kassner, and Bill Ordel. I was fortunate to have the dedicated support of Ben Dymond,
Dennis Huffman, and Brett Farmer, who were all crucial to the success of this project.
My wife Amy provided me with unlimited support over these last two years. You
have read through all of my work and offered constructive suggestions no matter how
foreign the topics may have been to you. My children, Patrick and Anna, have given me
numerous reasons for study breaks and moments of joy during this journey. Finally I
would like to thank the Civil and Mechanical Engineering Department at West Point for
providing me the opportunity to educate and train the leaders of tomorrow.
iii

Table Of Contents Chapter 1. Introduction ....................................................................................................... 1
1.1 Background......................................................................................................... 1
1.1.1 Prestressed Concrete Overview .................................................................. 1
1.1.2 Anchorage Zone Definition ........................................................................ 2
1.1.3 Anchorage Zone Cracking .......................................................................... 2
1.1.4 Serviceability and Structural Issues ............................................................ 4
1.1.5 Anchorage Zone Crack Control Methods ................................................... 6
1.2 Objectives and Scope.......................................................................................... 7
1.3 Organization of Thesis........................................................................................ 8
Chapter 2. Literature Review.............................................................................................. 9
2.1 Introduction......................................................................................................... 9
2.2 Current AASHTO Provisions ............................................................................. 9
2.3 International Bridge Code Provisions............................................................... 10
2.3.1 Canadian Bridge Code .............................................................................. 10
2.3.2 Australian Bridge Code............................................................................. 10
2.4 Analytical Methods........................................................................................... 11
2.4.1 General...................................................................................................... 11
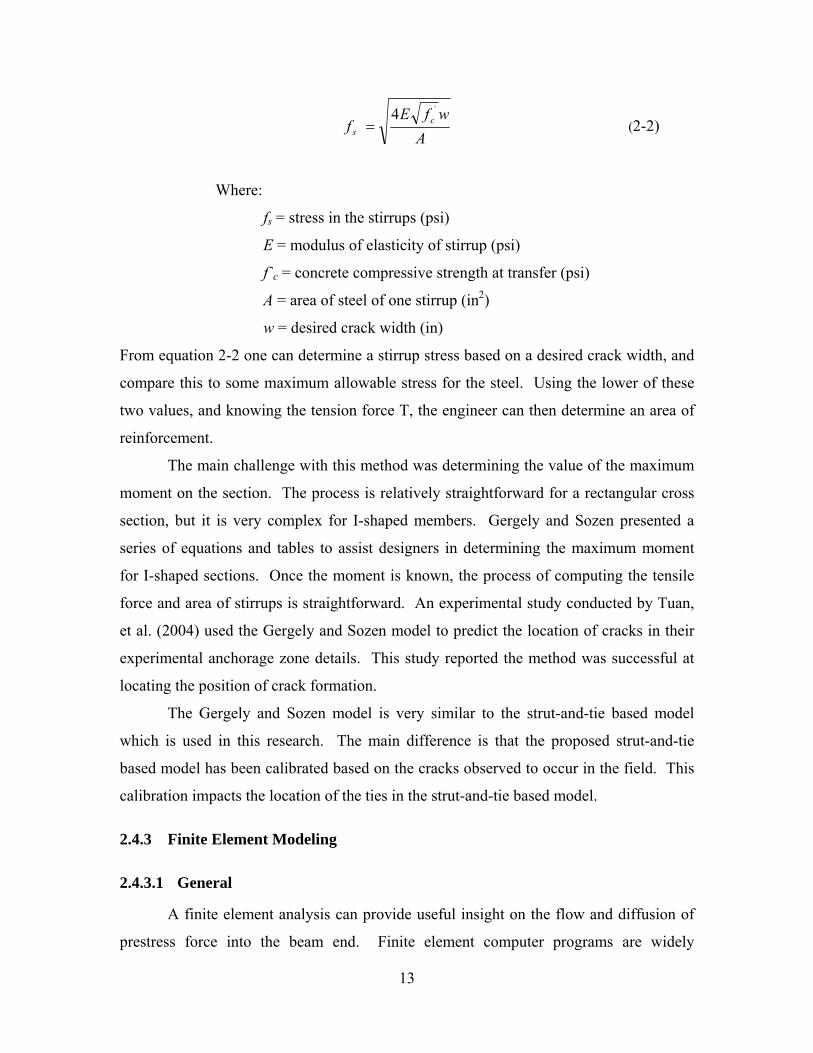
2.4.2 Gergely and Sozen Cracked Beam Model ................................................ 11
2.4.3 Finite Element Modeling .......................................................................... 13
2.4.4 Strut-and-Tie Modeling ............................................................................ 15
2.5 Experimental Methods ...................................................................................... 19
2.5.1 General...................................................................................................... 19
2.5.2 Marshall and Mattock (1962).................................................................... 20
2.5.3 Tuan, et al. (2004)..................................................................................... 21
2.6 Proposed Model for Anchorage Zone Design .................................................. 25
2.6.1 General...................................................................................................... 25
2.6.2 Method ...................................................................................................... 25
2.7 Summary of Literature Review......................................................................... 28
Chapter 3. Development of Design Aids and Standard Details........................................ 29
3.1 Introduction....................................................................................................... 29
iv
3.2 Beam End Case Studies .................................................................................... 29
3.2.1 General Field Observations....................................................................... 29
3.2.2 Fair Beam Ends......................................................................................... 30
3.2.3 Poor Beam Ends........................................................................................ 32
3.2.4 Poor Beam End With Repairs ................................................................... 35
3.2.5 Drop-in Girders and Pier Segments .......................................................... 36
3.2.6 Summary of Field Observations ............................................................... 39
3.3 New Design Model Theory and Goals.............................................................. 39
3.3.1 General...................................................................................................... 39
3.3.2 Calibration of the Strut-and-Tie Model .................................................... 40
3.3.3 Acceptable Crack Widths and Crack Lengths .......................................... 42
3.4 Design Example ................................................................................................ 43
3.4.1 Overview................................................................................................... 43
3.4.2 PCBT-77 Design Example Using Strut-and-Tie Models.......................... 43
3.5 Parametric study................................................................................................ 48
3.5.1 Parametric Study Assumptions ................................................................. 48
3.5.2 Parametric Study Procedure...................................................................... 49
3.5.3 Parametric Study Results .......................................................................... 51
3.5.4 Development of Design Tables................................................................. 55
3.5.5 Example Using Design Tables.................................................................. 57
3.5.6 Alternate Strut-and-Tie Design Model ..................................................... 58
3.5.7 Parametric Study Results Compared to Other Design Methods............... 60
3.5.8 Parametric Study Results Compared to Other Bridge Design Codes ....... 64
3.5.9 Parametric Study Results Compared to Case Study Girders .................... 67
3.6 Development of New Standard Details for VDOT........................................... 69
3.6.1 Overview of New Details.......................................................................... 69
3.6.2 Comparison of New Details to Other State Standard Details ................... 73
3.7 Conclusions....................................................................................................... 77
Chapter 4. Experimental Testing and Results................................................................... 79
4.1 Overview........................................................................................................... 79
4.2 Design of Experimental Anchorage Zone Details ............................................ 79
v
4.3 Testing Procedure ............................................................................................. 83
4.3.1 Instrumentation ......................................................................................... 83
4.3.2 Fabrication of Test PCBT-53.................................................................... 87
4.3.3 Test Procedures......................................................................................... 89
4.4 Results and Discussion ..................................................................................... 91
4.4.1 General...................................................................................................... 91
4.4.2 Anchorage Zone Crack Pattern at Transfer .............................................. 91
4.4.3 Strain Gage Readings at Transfer ............................................................. 94
4.4.4 Crack Condition when Placed on Supports ............................................ 101
4.4.5 Crack Condition after Deck Placement................................................... 101
4.5 Conclusions from Experimental Test.............................................................. 102
Chapter 5. Conclusions and Recommendations.............................................................. 103
5.1 Summary ......................................................................................................... 103
5.2 Conclusions..................................................................................................... 104
5.3 Recommendations........................................................................................... 105
References....................................................................................................................... 108
Appendix A. Calculations for PCBT-77 Case Study Girder .......................................... 110
Appendix B. Parametric Study Sample Girders and Results.......................................... 118
Appendix C. End Zone Design Tables ........................................................................... 136
Appendix D. Derivation for Alternate Strut-and-Tie Model .......................................... 145
Appendix E. Calculations for PCBT-53 Experimental Girder ....................................... 147
Vita.................................................................................................................................. 155
vi
List of Figures
Figure 1-1. Common crack pattern in PCBT anchorage zone ........................................... 4
Figure 1-2. Photo of a repaired 95 in. PCEF bulb-tee girder from Davis, et al. (2005) .... 5
Figure 1-3. End cracking in a splice girder pier segment .................................................. 6
Figure 2-1. Gergely and Sozen cracked section model.................................................... 12
Figure 2-2. Load path method for developing a strut-and-tie model............................... 16
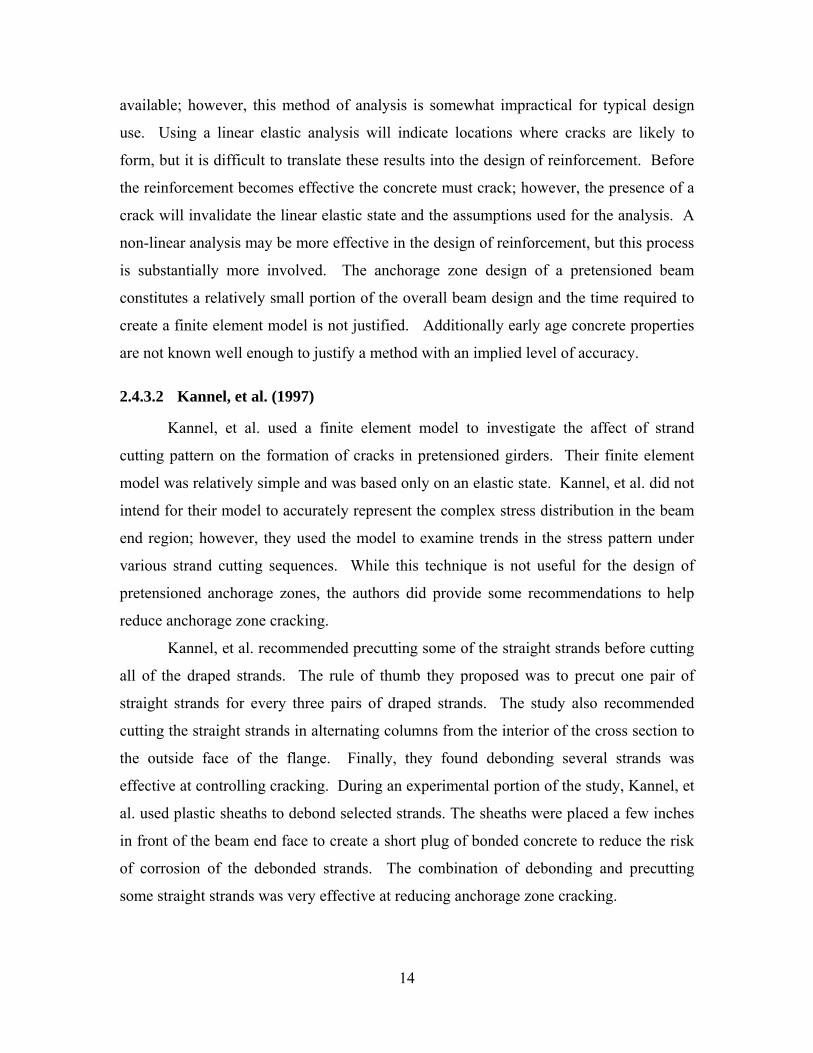
Figure 2-3. Strut-and-tie model for pretensioned beam end ............................................ 18
Figure 2-4. Example of experimental details developed by Tuan, et al. (2004).............. 23
Figure 2-5. Proposed design stress distribution in end zone reinforcement by Tuan, et al.
(2004)................................................................................................................................ 24
Figure 2-6. Strut-and-tie models proposed by Davis, et al. (2005).................................. 26
Figure 2-7. Results of parametric study by Davis, et al. (2005) ...................................... 27
Figure 3-1. PCBT-53 anchorage zone case study – fair condition .................................. 31
Figure 3-2. PCBT-61 anchorage zone case study – fair condition .................................. 32
Figure 3-3. PCBT-77 anchorage zone case study – poor condition ................................ 33
Figure 3-4. PCBT-77 anchorage zone – poor condition.................................................. 34
Figure 3-5. 95.5 in. PBCT beam ends with repairs. Photograph from Davis, et al. (2005)
........................................................................................................................................... 36
Figure 3-6. Drop in girder with anchorage zone cracking ............................................... 37
Figure 3-7. Anchorage zone cracking observed in deep haunched girders ..................... 38
Figure 3-8. Anchorage zone cracking of in-service haunched girder and “drop-in” girder
(photograph by Rodney T. Davis) .................................................................................... 38
Figure 3-9. Calibration of the proposed strut-and-tie based model ................................. 41
Figure 3-10. Beam end with stress distribution and prestress forces............................... 44
Figure 3-11. Lower strut-and-tie model example ............................................................ 45
Figure 3-12. Upper strut-and-tie model example............................................................. 46
Figure 3-13. Results of both strut-and-tie models ........................................................... 46
Figure 3-14. Example of proposed stirrup detailing ........................................................ 47
Figure 3-15. Force in T1 and T2 for PCBT-61, NWC, ½ in. diameter strand................. 51
Figure 3-16. Force in T1 and T2 for PCBT-69, NWC, 0.6 in. diameter strands ............. 52
Figure 3-17. Required bursting resistance, PCBT-61, LWC, ½ in. strand ...................... 54
vii
Figure 3-18. Required bursting resistance, PCBT-85, LWC, 0.6 in. strand .................... 54
Figure 3-19. Alternate strut-and-tie model ...................................................................... 59
Figure 3-20. Design Method Comparison, PCBT-45, NWC, 34 ½ in. strands ............... 61
Figure 3-21. Design Method Comparison, PCBT-77, NWC, 34 0.6 in. strands ............. 61
Figure 3-22. Design method comparison, PCBT-93, LWC, 46 ½ in. strands ................. 62
Figure 3-23. Design code comparison, PCBT-45, NWC, ½ in. strand............................ 65
Figure 3-24. Design code comparison, PCBT-77, NWC, 0.6 in. strand.......................... 66
Figure 3-25. Design code comparison, PCBT-93, LWC, ½ in. strand ............................ 67
Figure 3-26. Proposed stirrup types ................................................................................. 71
Figure 3-27. Anchorage zone elevation – simple span beam end.................................... 72
Figure 3-28. Anchorage zone elevation – end diaphragm ............................................... 73
Figure 3-29. Standard detail comparison – PCBT-69, NWC, 44 ½ in. strands............... 74
Figure 3-30. Standard detail comparison – PCBT-69, NWC, 32 0.6 in. strands............. 75
Figure 3-31. Standard detail comparison – PCBT-77 and PCBT-85, NWC, 46 ½ in.
strands ............................................................................................................................... 76
Figure 3-32. Standard detail comparison – PCBT-77 and PCBT-85, NWC, 32 0.6 in.
strands ............................................................................................................................... 77
Figure 4-1. Cross sections of test girder .......................................................................... 80
Figure 4-2. Reinforcement details for experimental PCBT-53 girder ............................. 81
Figure 4-3. Strain gage layout at 12 ksi anchorage zone ................................................. 83
Figure 4-4. Strain gage layout – 18 ksi anchorage zone .................................................. 84
Figure 4-5. Strain gages installed at the 12 ksi anchorage zone ...................................... 86
Figure 4-6. Strain gages installed at the 18 ksi anchorage zone ...................................... 87
Figure 4-7. Slump test on batch of LWSCC concrete ..................................................... 88
Figure 4-8. Girder steam curing on October 25, 2006..................................................... 89
Figure 4-9. Test girder lifted from casting bed on October 25, 2006 .............................. 90
Figure 4-10. Crack pattern in the 12 ksi anchorage zone after lifting ............................. 92
Figure 4-11. Crack pattern in the 18 ksi anchorage zone after lifting ............................. 93
Figure 4-12. 12 ksi anchorage zone – gages in lower portion of web ............................. 96
Figure 4-13. 12 ksi anchorage zone – gages in upper portion of web ............................. 96
Figure 4-14. 18 ksi anchorage zone – gages in lower portion of web ............................. 97
viii

Figure 4-15. 18 ksi anchorage zone – gages in upper portion of the web ....................... 97
Figure 4-16. Distribution of tensile stress over the anchorage zone after lifting – 12 ksi
end..................................................................................................................................... 99
Figure 4-17. Distribution of tensile stress over the anchorage zone after lifting – 18 ksi
end................................................................................................................................... 101
ix

List of Tables Table 2-1. Results of parametric study conducted by Castrodale, et al. (2002) .............. 18
Table 3-1. Tension force comparison for PCBT-77 girders with ½ in. strand and 0.6 in.
strand................................................................................................................................. 53
Table 3-2. PCBT-61, Normal weight concrete, Beam End Design Table....................... 56
Table 3-3. Anchorage zone design example comparison ................................................ 57
Table 3-4. Sample girders used in design method comparison ....................................... 60
Table 3-5. Comparison of stirrup area within h/4 for case study girders and design tables
........................................................................................................................................... 68
Table 3-6. Comparison of stirrup area between h/4 and 3h/4 for case study girders and
design tables...................................................................................................................... 68
Table 4-1. Summary of anchorage zone details............................................................... 82
Table 4-2. Concrete material properties on October 25, 2006......................................... 88
Table 4-3. Status of strain gages at transfer..................................................................... 94
Table B-1. Sample girders - PCBT-29, NWC, ½ in. strand .......................................... 118
Table B-2. Sample girders - PCBT-37, NWC, ½ in. strand .......................................... 119
Table B-3. Sample girders - PCBT-45, NWC, ½ in. strand .......................................... 120
Table B-4. Sample girders – PCBT-45, NWC, 0.6 in. strand........................................ 120
Table B-5. Sample girders – PCBT-53, NWC, ½ in. strand.......................................... 121
Table B-6. Sample girders – PCBT-53, NWC, 0.6 in. strand........................................ 121
Table B-7. Sample girders – PCBT-61, NWC, ½ in. strand.......................................... 122
Table B-8. Sample girders – PCBT-61, NWC, 0.6 in. strand........................................ 122
Table B-9. Sample girders – PCBT-69, NWC, ½ in. strand.......................................... 123
Table B-10. Sample girders – PCBT-69, NWC, 0.6 in. strand...................................... 123
Table B-11. Sample girders – PCBT-77, NWC, ½ in. strand........................................ 124
Table B-12. Sample girders – PCBT-77, NWC, 0.6 in. strand...................................... 124
Table B-13. Sample girders – PCBT-85, NWC, ½ in. strand........................................ 125
Table B-14. Sample girders – PCBT-85, NWC, 0.6 in. strand...................................... 125
Table B-15. Sample girders – PCBT-93, NWC, ½ in. strand........................................ 126
Table B-16. Sample girders – PCBT-93, NWC, 0.6 in. strand...................................... 126
Table B-17. Sample girders – PCBT-28, LWC, ½ in. strand ........................................ 127
x
Table B-18. Sample girders – PCBT-37, LWC, ½ in. strand ........................................ 128
Table B-19. Sample girders – PCBT-45, LWC, ½ in. strand ........................................ 129
Table B-20. Sample girders – PCBT-45, LWC, 0.6 in. strand ...................................... 129
Table B-21. Sample girders – PCBT-53, LWC, ½ in. strand ........................................ 130
Table B-22. Sample girders – PCBT-53, LWC, 0.6 in. strand ...................................... 130
Table B-23. Sample girders – PCBT-61, LWC, ½ in. strand ........................................ 131
Table B-24. Sample girders – PCBT-61, LWC, 0.6 in. strand ...................................... 131
Table B-25. Sample girders – PCBT-69, LWC, ½ in. strand ........................................ 132
Table B-26. Sample girders – PCBT-69, LWC, 0.6 in. strarnd..................................... 132
Table B-27. Sample girders – PCBT-77, LWC, ½ in. strand ........................................ 133
Table B-28. Sample girders – PCBT-77, LWC, 0.6 in. strand ...................................... 133
Table B-29. Sample girders – PCBT-85, LWC, ½ in. strand ........................................ 134
Table B-30. Saple girders – PCBT-85, LWC, 0.6 in. strand ......................................... 134
Table B-31. Sample girders – PCBT-93, LWC, ½ in. strand ........................................ 135
Table B-32. Sample girders – PCBT-93, LWC, 0.6 in. strand ...................................... 135
Table C-1. PCBT-29, Normal Weight Concrete, Beam End Design Table .................. 136
Table C-2. PCBT-29, Light Weight Concrete, Beam End Design Table ...................... 136
Table C-3. PCBT-37, Normal Weight Concrete, Beam End Design Table .................. 137
Table C-4. PCBT-37, Light Weight Concrete, Beam End Design Table ...................... 137
Table C-5. PCBT-45, Normal Weight Concrete, Beam End Design Table .................. 138
Table C-6. PCBT-45, Light Weight Concrete, Beam End Design Table ...................... 138
Table C-7. PCBT-53, Normal Weight Concrete, Beam End Design Table .................. 139
Table C-8. PCBT-53, Light Weight Concrete, Beam End Design Table ...................... 139
Table C-9. PCBT-61, Normal Weight Concrete, Beam End Design Table .................. 140
Table C-10. PCBT-61, Light Weight Concrete, Beam End Design Table .................... 140
Table C-11. PCBT-69, Normal Weight Concrete, Beam End Design Table ................ 141
Table C-12. PCBT-69, Light Weight Concrete, Beam End Design Table .................... 141
Table C-13. PCBT-77, Normal Weight Concrete, Beam End Design Table ................ 142
Table C-14. PCBT-77, Light Weight Concrete, Beam End Design Table .................... 142
Table C-15. PCBT-85, Normal Weight Concrete, Beam End Design Table ................ 143
Table C-16. PCBT-85, Light Weight Concrete, Beam End Design Table .................... 143
xi

Table C-17. PCBT-93, Normal Weight Concrete, Beam End Design Table ................ 144
Table C-18. PCBT-93, Light Weight Concrete, Beam End Design Table .................... 144
xii
Chapter 1. Introduction
1.1 Background
1.1.1 Prestressed Concrete Overview
The principle concept behind prestressed concrete is simple: preload a member in
such a manner to eliminate or reduce tensile stresses that would occur under anticipated
service loads. This idea was first proposed in the United States as early as 1886;
however, it was the French engineer Eugene Freyssinet who made prestressed concrete
become a reality in the 1930s with numerous advances that are still commonly used today
in the prestressed concrete industry (Nilson 1987). In addition to reducing service load
stresses, prestressed concrete has other advantages. Cracks can be eliminated or limited
to a desired degree and deflections can be controlled. These factors result in improved
serviceability of the structure. Prestressed concrete also enables the economical use of
high strength concrete and high strength steel. As a result, span length can be increased
and smaller and lighter members can be used. Prestressed concrete has a wide range of
applications and new uses continue to evolve.
Prestressed concrete is generally grouped into two categories: pretensioned and
post-tensioned. During the construction of a pretensioned concrete member, a
prestressing strand is stretched between two permanent abutments. Then forms are
placed about the tensioned strands and concrete is poured into the forms. As the concrete
cures it bonds to the steel. When the concrete reaches a specified compressive strength
the strands are cut, typically with an acetylene torch, which permanently transfers the
force in the steel to the concrete. During the construction of a post-tensioned concrete
member, hollow conduits are placed in the forms before concrete is poured. After the
member has been cast and the concrete reaches a specified compressive strength,
prestressing strands or rods are placed in the hollow conduits. These steel elements are
anchored at one end of the member and tensioned at the other to some specified stress
level. Later the steel may be permanently bonded to the inside of the conduit by
pumping grout through the conduit.
1

1.1.2 Anchorage Zone Definition
An anchorage zone refers to the region of the structure in which the prestress force
is transferred from the prestressing steel to the concrete and distributed more widely to
the member. In post-tensioned structures the anchorage zone is subdivided into the local
zone and general zone. The local zone refers to the volume of concrete surrounding and
immediately ahead of a mechanical anchorage device which transfers the prestress force
to the member. The general zone is the region in which the prestress force spreads out
into a linear stress distribution over the entire cross section of the member. The local
zone is subjected to very high compressive stresses. These compressive stresses
propagate into the member in a curved pattern until a linear stress distribution develops at
a distance approximately equal to the member height. As these compressive stresses
change direction, tensile stresses develop normal to the axis of the prestress force. These
tensile stresses, known as bursting stresses, can be large enough to cause cracking in the
member.
In pretensioned structures the local zone term is not applicable since these members
do not contain a mechanical anchorage device. The prestress force is introduced
gradually by bond between the steel and concrete over a distance known as the transfer
length. This force creates compressive stresses which propagate into the member in a
curved pattern until a linear stress distribution results. Just as in post-tensioned concrete
members the dispersion of the prestress force causes tensile stresses to develop normal to
the direction of the prestress force. The stress conditions for pretensioned beams are
usually less severe than those for post-tensioned beams because the prestress force is
introduced gradually; however, the tensile stresses which develop are often large enough
to cause cracks in the member. The relatively thin webs of I-shaped girders in particular
are very vulnerable to the development of cracks from the prestress force.
1.1.3 Anchorage Zone Cracking
Field surveys of the beam ends of numerous pretensioned bridge girders indicate
that many of the precast bulb-tee (PCBT) beams used in the Commonwealth of Virginia
develop cracks within the anchorage zone region. The lengths and widths of these cracks
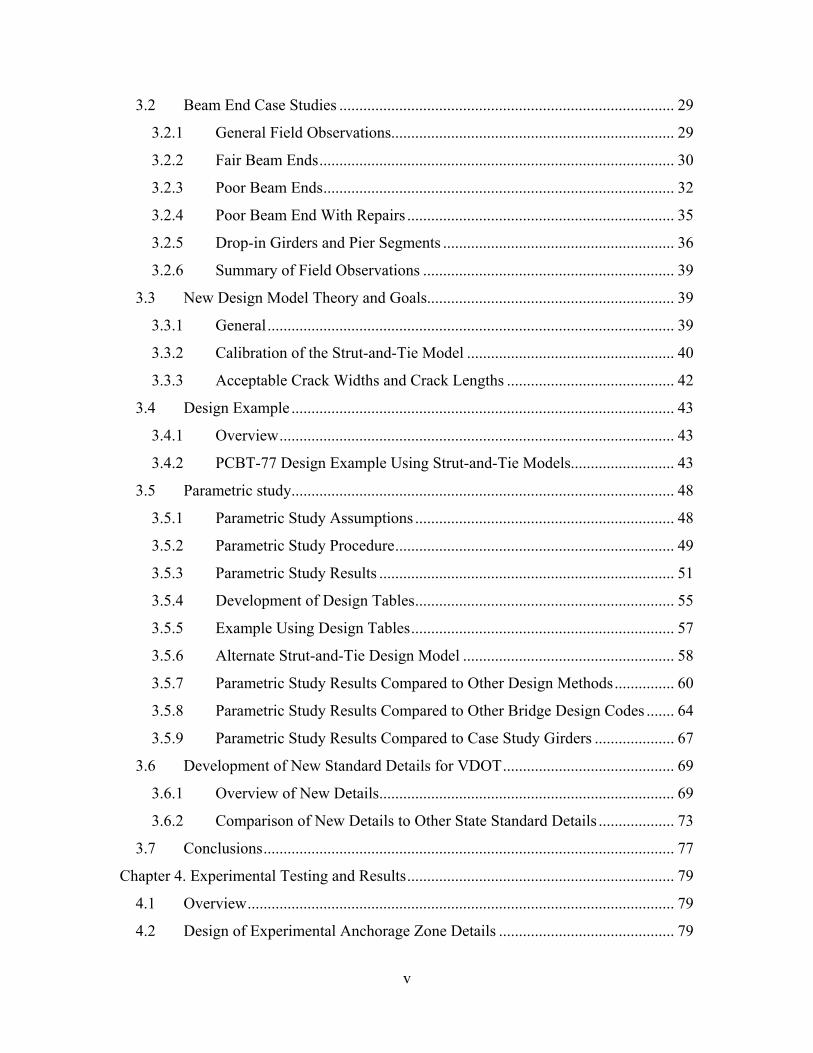
range from acceptable to poor and in need of repair. A diagram of a typical crack pattern
2

in a PCBT anchorage zone is shown in Figure 1-1. It is common for a horizontal crack to
develop at the intersection between the bottom flange and the web. This crack may
extend longitudinally 12 to 18 in. into the beam. It is also very common for a diagonal
crack to develop in the upper portion of the web. This crack will generally start several
inches in from the end of the beam; close to the location where the harped strands first
enter the web region and will extend on a downward angle. In many cases this diagonal
crack may extend several feet into the girder. Occasionally additional horizontal cracks
develop throughout the depth of the web.
Cracks such as those shown in Figure 1-1 generally form at the time of prestress
release or within a few days of release. The diagonal crack will typically form as the
member is lifted off the precast bed. During the lifting process the self weight of the
girder is acting on the lifting provisions located several feet in from the end of the beam
which enables cracks to open and propagate further. As the self weight acts on the lifting
provision it is removed from the general zone which eliminates the clamping action that
helps prevent cracks from propagating. Field observations indicate deeper cross sections
tend to be more susceptible to crack formation than shallow cross sections. Additionally,
beams cast with lightweight concrete tend to display more cracks due to the reduced
tensile strength of the lightweight concrete and reduced modulus of elasticity. The
cracking shown in Figure 1-1 represents a worst case scenario. Some beams may
develop one crack or none at all while in extreme cases several cracks may form as
shown in Figure 1-1.
The general zone of a prestressed bridge girder is a region of complex stress
behavior. This region has a very high negative moment caused by the prestress force
which creates shear distortion of the girder web. This shear distortion is evident from
field observations of girders which have anchorage zone cracking as shown in Figure 1-1.
From these observations it has been noted that there is also slip along the crack lines in
girders with extensive anchorage zone cracking problems. This slippage suggests the
stirrups crossing these cracks are carrying tension force and shear force (or dowel action)
as well.
3

h
h
Figure 1-1. Common crack pattern in PCBT anchorage zone
1.1.4 Serviceability and Structural Issues
The presence of cracks in an anchorage zone can be important to the serviceability
of the beam. If the crack widths are large enough, moisture can penetrate the section and
lead to corrosion of the reinforcement. In some cases a beam end may be enclosed in a
cast-in-place diaphragm limiting the exposure to moisture and the cracks may not be a
cause for concern. In other cases the beam end may remain exposed to de-icing salts and
moisture throughout the service life of the member. An example of such a condition
would be a beam end that is adjacent to an expansion joint within a bridge. Beams in
bridges which are located in marine environments must be held to a higher standard with
respect to beam end cracking, than beams in inland bridges due to the corrosive nature of
the salt water.
Repair of these cracks can be costly and time consuming and few repair options
exist. One commonly used method of crack repair is epoxy injection. During this
procedure an epoxy solution is injected into the crack and on the surface of the member
along the length of the crack. This type of crack repair; however, can detract from the
appearance of the member when it is applied, is expensive, and can result in production
4

delays. A photo of a repaired PCBT girder which had severe end cracking is shown in
Figure 1-2.
Figure 1-2. Photo of a repaired 95 in. PCEF bulb-tee girder from Davis, et al. (2005)
The cracks shown in Figure 1-1 and Figure 1-2 will typically not pose a problem
to the structural performance of the girder. If a girder with this type of cracking is used
in a simply supported structure, or a simply supported structure made continuous for live
load a diagonal compressive strut carrying the shear force to the bearing should intersect
these cracks. The additional dead load from the deck may also help to close these cracks.
Cracking in the beam end region requires attention if the cracks are very close to the
strands or cross the path of the strands. In this case the cracking may reduce the bond of
the steel to the concrete and will affect the transfer of prestress force from the steel to the
concrete.
Another scenario for concern is cracking in the ends of haunched girders used for
spliced girder applications. Cracks in this situation may open and close under normal
service conditions which would be detrimental to the performance of the structure. An
illustration of a haunched girder with cracking is shown in Figure 1-3. Cracking in the
ends of the drop-in girders is also a cause for concern as these cracks may also open and
close under service load.
5

From an ownership and inspection standpoint it is highly desirable to have only
minimal crack formation. This will allow the structure to achieve the highest possible
rating when it is new and first enters service. This will also ensure that anchorage zone
cracks do not become an issue which must be monitored periodically.
Figure 1-3. End cracking in a splice girder pier segment
1.1.5 Anchorage Zone Crack Control Methods
It is important to control the formation of anchorage zone cracks during the design
phase by providing adequate vertical reinforcement. The presence of vertical
reinforcement will most likely not eliminate cracking, but it can control the widths and
lengths of the cracks. Current bridge design specifications prescribe a minimum area of
reinforcement; however, field experience in Virginia suggests this minimum is not
sufficient to control cracks in many of the large PCBT girders used by the Virginia
Department of Transportation (VDOT).
Another method to control crack formation is to debond some number of strands
near the end of the beam. Debonding some strands distributes the transfer of prestress
force to the concrete over a greater length. Currently no method exists to determine the
amount of debonding needed to control cracking. Debonding may also affect the shear
capacity of the member and debonded strands may be vulnerable to corrosion. Applying
a vertical pretension force at the end of a girder would eliminate the formation of
6

anchorage zone cracks, but this technique is not an economical solution (Castrodale, et al.
2002). Given the relatively small region vulnerable to these cracks, the most practical
solution is to provide enough mild steel reinforcement placed in such a manner to ensure
the crack lengths and widths are controlled even if the concrete quality at the beam end is
slightly lower than anticipated. The cost of additional reinforcement in the anchorage
zone is offset by the advantages for the owner.
A variety of methods have been developed to predict the magnitude of the tensile
force at the beam end and enable a designer to develop appropriate reinforcement details.
These methods include both experimental and analytical solutions. A recent study
conducted by Davis, et al. (2005) proposed a strut-and-tie based analytical model,
calibrated from field observations of VDOT PCBT girders to control crack widths and
lengths. This new model served as the basis for this research project.
1.2 Objectives and Scope
The main objective of this project was to develop a series of design tables for the
anchorage zones of the VDOT PCBT girders. To achieve this goal, a parametric study
was conducted using over 270 sample PCBT girders of varying size and prestress force
arrangement and magnitude. The results of the parametric study were consolidated into
anchorage zone design tables. Additionally the results of the parametric study were
compared to other design models, international bridge codes, and to case study girders
surveyed during visits to precast manufacturing facilities.
The second objective of this project was to verify the strut-and-tie based model and
operational stress recommendations proposed by Davis, et al. (2005) for use in the
anchorage zone design of VDOT PCBT bridge girders through a full scale test. To
accomplish this objective, a 65 ft PCBT-53 girder was constructed using anchorage zone
reinforcement details designed with the new model. The stirrups within the anchorage
zone were instrumented to measure stirrup strains, and to verify the strut-and-tie model
calibration. The crack patterns of these anchorage zones were recorded and compared to
the anchorage zone crack patterns of multiple case study PCBT girders designed in
accordance with current specifications.
7
The final objective was to develop new standard details for the anchorage zones of
the VDOT PCBT girders. The new standard details were developed to incorporate
elements of the new design model, to control crack formation in the anchorage zone,
facilitate potential deck removal or replacement, and to improve field safety for workers
during bridge construction. Comparisons of the new VDOT standard details and standard
details used by others states were also made. These stirrup details and anchorage zone
details are recommended for incorporation in the VDOT standard details for bridges.
1.3 Organization of Thesis
Chapter 2 presents a literature review of previous analytical and experimental
methods developed for the design of pretensioned anchorage zones. An overview of
strut-and-tie modeling is also included. Chapter 3 presents a series of case studies used to
illustrate the calibration of the proposed strut-and-tie model. This chapter then outlines
the procedure for the parametric study and presents the results. The results of the
parametric study are incorporated into design tables for girders with normal weight
concrete and girders with lightweight concrete. Finally Chapter 3 discusses the new
standard details for VDOT and provides comparisons of the proposed details to details
used by other states. Chapter 4 explains the experimental design, instrumentation,
fabrication, and testing of the full scale bridge girder and analysis of the beam
performance. The final chapter provides conclusions and recommendations for
anchorage zone design and future research.
8

Chapter 2. Literature Review
2.1 Introduction
A combination of analytical and experimental research has been conducted to
develop methods to control cracking in the anchorage zone of pretensioned concrete
beams. These various studies have proposed design methods to determine the
reinforcement requirement in the beam end region. As pretensioned concrete gained
popularity in the United States during the 1950’s and 1960’s, designers began to take
note of the horizontal cracks in the ends of these girders. This problem was first
addressed in an experimental study conducted by Marshall and Mattock in 1962. Since
this study other researchers have employed strut-and-tie models, finite element analysis,
and experimental research programs to attempt to control anchorage zone crack widths
and crack lengths in pretensioned bridge girders.
2.2 Current AASHTO Provisions
Article 5.10.10.1 in the AASHTO LRFD Bridge Design Specifications (AASHTO,
2004) addresses the design of the anchorage zone in pretensioned concrete girders. This
specification requires the placement of enough vertical reinforcement in the end zone to
resist a force equivalent to at least 4 percent of the total prestress force at transfer. The
maximum working stress in the stirrups is limited to 20 ksi and the specification requires
the steel to be evenly distributed within a distance equal to 25 percent of the member
height, h. The AASHTO Standard Specifications for Highway Bridges (AASHTO, 2003)
contains almost the same requirement. Article 9.22.1 in this document requires the same
area of reinforcement, but specifies this steel be evenly distributed within a distance equal
to 25 percent of the member effective depth. Currently the Virginia Department of
Transportation is in the process of converting from the AASHTO Standard Specifications
for Highway Bridges to the AASHTO LRFD Bridge Design Specifications; however, the
impact on anchorage zone design will be minimal.
The use of a stirrup working stress of 24 ksi has been proposed, but has not been
approved (Castrodale, et al. 2002). Tuan, et al. (2004) recommended increasing the stress
9

limit to 30 ksi or even 36 ksi following proper experimental justification. These two
stress limits are sometimes used for crack control during flexural design. Using a higher
working stress limit would result in larger crack widths when the tensile stress in the
beam end is large enough to cause cracking.
2.3 International Bridge Code Provisions
2.3.1 Canadian Bridge Code
The Canadian Highway Bridge Design Code (CHBDC, 2000) discusses
reinforcement design for pretensioned anchorage zones in section 8.16.3.2. This section
provides Equation 2-1 for computing a required area of anchorage zone reinforcement.
ys
pust f
FA
φ08.0
≥ (2-1)
Where:
Fpu = Total specified breaking strength of tendons, N
φs = Resistance factor for reinforcing bars, 0.9 for stirrups
fy = Specified yield strength of reinforcing bars, MPa
The Canadian Highway Bridge Design Code (CHBDC, 2000) specifies the area of steel
computed with Equation 2-1 shall be uniformly distributed over a distance equal to 0.25h
from the end of the member. This provision is approximately equivalent to providing a
bursting resistance of 3.95 percent of the jacking force and using a stirrup working stress
of 20 ksi.
2.3.2 Australian Bridge Code
The Australian Standard for Bridge Design (Australian Standard, 2005) addresses
anchorage zones in pretensioned members in section 12.2.7. These provisions are almost
identical to the AASHTO LRFD provisions. The maximum stress in the stirrups allowed
by the Australian Code is 150 MPa which is equal to 21.8 ksi. This difference results in a
very slightly smaller area of vertical reinforcement than that required by AASHTO
LRFD. The Australian Standard for Bridge Design recommends distributing the
reinforcement over the same distance as AASHTO LRFD.
10

2.4 Analytical Methods
2.4.1 General
The stress distribution in the anchorage zone of a pretensioned beam is
complicated and can depend on several factors such as the location of prestress force, the
magnitude of prestress force, the transfer length, the quantity and arrangement of stirrups,
presence of cracks, and the size of the beam cross section. Several authors have used
analytical methods such as the cracked beam model, finite element analysis, and strut-
and-tie models to approximate this stress distribution.
2.4.2 Gergely and Sozen Cracked Beam Model
Gergely and Sozen (1967) presented an analytical method to design the transverse
reinforcement to restrain anchorage zone cracks. The method outlined in the study was
based on the equilibrium conditions of a cracked anchorage zone and proposed a method
for estimating the position of the first crack. The Gergely and Sozen method assumed
that the end region of a prestressed member will have a horizontal crack. With this
assumption the authors then analyzed the forces needed to maintain equilibrium within
the cracked section.
A free body diagram of a cracked end zone section is shown in Figure 2-1. The
beam end, base, and horizontal crack define the boundaries of the free body diagram
shown in Figure 2-1 (a). The distance at which the stress distribution caused by the
prestress force becomes linear defines the total length of the free body diagram. The
forces acting on the free body diagram are shown in Figure 2-1 (b). The applied prestress
force P creates a linear stress distribution at a distance L from the beam end. When a
horizontal crack forms at a height c from the base of the beam, a moment and a shear
force develop on the top surface of the free body diagram. A resisting moment M
develops from the tensile force T in the reinforcement and the compression force C in the
concrete to maintain equilibrium.
11

e
h
c
T
P
MC
c
L
L
(a)
V
Longitudinal web crack
Figure 2-1. Gergely and Sozen cracked section model.
As the height of the free body diagram c changes, the magnitude of the resisting
moment also changes. The height c which corresponds to the maximum moment on the
section represents the location where the first longitudinal crack is most likely to form.
By computing the maximum moment, a designer can determine the forces T and C by
estimating a distance between these two forces. The tensile force, T, is located at the
center of the anchorage zone stirrup group. The compressive force, C, will act some
place between the end of the crack and the end of the free body diagram. Since knowing
the exact length of the crack is difficult, Gergely and Sozen positioned this force at a
distance h from the end face of the beam which represented an upper limit on the distance
between the force T and C.
The Gergely and Sozen study also presented a method to control crack widths.
Using bond-slip relationships developed from experimental research, Gergely and Sozen
presented Equation 2-2 for the limit on the stress in the stirrups to obtain a desired crack
width.
12
A
wfEf c
s
`4= (2-2)
Where:
fs = stress in the stirrups (psi)
E = modulus of elasticity of stirrup (psi)
f`c = concrete compressive strength at transfer (psi)
A = area of steel of one stirrup (in2)
w = desired crack width (in)
From equation 2-2 one can determine a stirrup stress based on a desired crack width, and
compare this to some maximum allowable stress for the steel. Using the lower of these
two values, and knowing the tension force T, the engineer can then determine an area of
reinforcement.
The main challenge with this method was determining the value of the maximum
moment on the section. The process is relatively straightforward for a rectangular cross
section, but it is very complex for I-shaped members. Gergely and Sozen presented a
series of equations and tables to assist designers in determining the maximum moment
for I-shaped sections. Once the moment is known, the process of computing the tensile
force and area of stirrups is straightforward. An experimental study conducted by Tuan,
et al. (2004) used the Gergely and Sozen model to predict the location of cracks in their
experimental anchorage zone details. This study reported the method was successful at
locating the position of crack formation.
The Gergely and Sozen model is very similar to the strut-and-tie based model
which is used in this research. The main difference is that the proposed strut-and-tie
based model has been calibrated based on the cracks observed to occur in the field. This
calibration impacts the location of the ties in the strut-and-tie based model.
2.4.3 Finite Element Modeling
2.4.3.1 General
A finite element analysis can provide useful insight on the flow and diffusion of
prestress force into the beam end. Finite element computer programs are widely
13
available; however, this method of analysis is somewhat impractical for typical design
use. Using a linear elastic analysis will indicate locations where cracks are likely to
form, but it is difficult to translate these results into the design of reinforcement. Before
the reinforcement becomes effective the concrete must crack; however, the presence of a
crack will invalidate the linear elastic state and the assumptions used for the analysis. A
non-linear analysis may be more effective in the design of reinforcement, but this process
is substantially more involved. The anchorage zone design of a pretensioned beam
constitutes a relatively small portion of the overall beam design and the time required to
create a finite element model is not justified. Additionally early age concrete properties
are not known well enough to justify a method with an implied level of accuracy.
2.4.3.2 Kannel, et al. (1997)
Kannel, et al. used a finite element model to investigate the affect of strand
cutting pattern on the formation of cracks in pretensioned girders. Their finite element
model was relatively simple and was based only on an elastic state. Kannel, et al. did not
intend for their model to accurately represent the complex stress distribution in the beam
end region; however, they used the model to examine trends in the stress pattern under
various strand cutting sequences. While this technique is not useful for the design of
pretensioned anchorage zones, the authors did provide some recommendations to help
reduce anchorage zone cracking.
Kannel, et al. recommended precutting some of the straight strands before cutting
all of the draped strands. The rule of thumb they proposed was to precut one pair of
straight strands for every three pairs of draped strands. The study also recommended
cutting the straight strands in alternating columns from the interior of the cross section to
the outside face of the flange. Finally, they found debonding several strands was
effective at controlling cracking. During an experimental portion of the study, Kannel, et
al. used plastic sheaths to debond selected strands. The sheaths were placed a few inches
in front of the beam end face to create a short plug of bonded concrete to reduce the risk
of corrosion of the debonded strands. The combination of debonding and precutting
some straight strands was very effective at reducing anchorage zone cracking.
14

2.4.4 Strut-and-Tie Modeling
2.4.4.1 General
The strut-and-tie model is another useful tool in the analysis of members with a
complex stress distribution such as a pretensioned beam end. In a pretensioned
anchorage zone the normal assumption for beam theory that plane sections remain plane
is not applicable. This type of region is commonly referred to as a disturbed zone or D-
region. A strut-and-tie model is a truss model of a D-region made up of struts
(compression members) and ties (tension members) connected together at nodes. The
compressive forces in the truss are carried by concrete struts and the tensile forces are
carried by ties made of mild reinforcement and/or prestresssing steel. The truss model is
capable of transferring forces from the D-region at the end of the beam, to the region of
the beam where normal beam theory assumptions are applicable. Normally, the length of
a D-region for a pretensioned beam end is equal to the total depth of the member. At this
length it is assumed that the stress distribution has become linear, and therefore the plane
sections remain plane assumption for beam theory is applicable.
An extensive study of strut-and-tie modeling was completed by Schlaich, et al.
(1987). This study presented the load path method for developing strut-and-tie models.
This method is illustrated in Figure 2-2, which represents a deep beam with a uniformly
distributed load applied. In the load path method, stress contours from an elastic analysis
are overlaid on the section in Figure 2-2(a). As the forces flow through the member, the
contours show that tensile stresses form along the bottom of the member, and
compressive stresses form within the member as shown in Figure 2-2(b). The struts and
ties of the truss model can be placed near the centroids of these tensile and compressive
stresses. The result is the strut and tie model of the member in Figure 2-2(c). The
longitudinal struts which exit the model are equal to the applied load and the model
satisfies equilibrium. This same model, if rotated 90°, is similar to the scenario within a
pretensioned beam anchorage zone.
15

P
F F FFF
P
T
C
FF
F F
C
T
(a) (b) (c)
Figure 2-2. Load path method for developing a strut-and-tie model
A strut-and-tie model represents a strength limit state. This implies that the
concrete has no tensile capacity. For a given scenario, a variety of strut-and-tie models
can be developed. A designer is free to pick the arrangement of the truss model, but
some models may yield more conservative results than others. In general, the
arrangement of the truss model should follow the flow of elastic force through a section.
A designer must be aware however, that when a section begins to crack, the elastic model
begins to lengthen. To determine the best arrangement of the strut-and-tie model, a
designer must also imagine the flow of forces through a cracked section to ensure the
reinforcement is placed properly. A strut-and-tie model must be in equilibrium with all
applied loads and reactions; however, a strut-and-tie model does not have to satisfy
compatibility. To ensure that crack widths do not become too large, limits are often
placed on the stress in the steel.
This type of analysis is commonly used in the design of post-tensioned anchorage
zones. The main difference between a post-tensioned anchorage zone and a pretensioned
anchorage zone is the method in which the prestress force is applied. In a post-tensioned
anchorage zone the prestress forces are applied directly to the concrete at the beam end
face by a bearing plate. In a pretensioned anchorage zone the prestress force is applied
gradually over the transfer length to the concrete through the bond between the prestress
strand and the surrounding concrete. In a strut-and-tie model for a pretensioned beam
end the prestress force is assumed to act as a point load on the end surface of the member.
This assumption causes strut-and-tie models to typically yield conservative results for
16

pretensioned anchorage zone design. Despite these conservative results, a strut-and-tie
model is a valid method to select the quantity and placement of reinforcement within the
beam end to provide adequate strength. Stress limits can also be imposed on the
reinforcement to control crack lengths and widths.
2.4.4.2 Castrodale, et al. (2002)
Castrodale, et al. presented a strut-and-tie model to estimate the tension force which
develops in the beam end of a pretensioned girder at release. The model was designed to
analyze girders with draped strands. The authors applied this model to several girder
designs and found the results to suggest that the AASHTO LRFD design requirements for
pretensioned anchorage zones may be inadequate for some beams.
The geometry of the strut-and-tie model developed by Castrodale, et al. shown in
Figure 2-3, was arranged to reflect the requirements in the 1998 edition of AASHTO
LRFD Section 5.10.10.1. The older edition of AASHTO LRFD required the anchorage
zone reinforcement be placed within h/5 (or 0.2h) from the end of the girder. Based on
this requirement, the center of the reinforcement was located at 0.1h which corresponds
to the placement of the tie in Figure 2-3. Castrodale, et al. assumed the remainder of the
D region from 0.2h to h to be in compression. As a result, the compression strut is placed
in the center of this compression region at a distance of 0.5h from the tie. This strut and
tie model ignored the effect of transfer length and applied the prestress force to the end of
the beam as a concentrated force. It also applied the prestress force from the draped
strands (P1) horizontally, even though it was slightly inclined.
17
CTh
P1
P2
P1
P2
P1
P2
0.4h0.5h0.1h
h
D Region
Figure 2-3. Strut-and-tie model for pretensioned beam end
After setting the geometry for the strut-and-tie model, Castrodale, et al. analyzed 20
sample girders of varying cross section. By computing the force in the tie, the authors
determined an area of steel required to resist cracking. The authors assumed a working
stress for the steel during this analysis of 20 ksi. A sample of the results from the
parametric study is shown in Table 2-1. Table 2-1. Results of parametric study conducted by Castrodale, et al. (2002)
Girder Total strands
# Draped Strands
# Straight Strands
Prestress force (k)
T (k)
T/Prestress force (%)
Type II 30 12 18 930 45.8 4.93 Type II 14 6 8 434 47.7 11.0 Type IV 68 18 50 2,988 145 4.84 Type IV 32 8 24 1,406 163 11.6 Type VI 80 20 60 3,515 209 5.96 Type VI 40 10 30 1,758 203 11.5 PCI BT-54 40 12 28 1,758 127 7.23 PCI BT-54 20 6 14 879 94.4 10.7 PCI BT-72 40 12 28 1,758 176 10.0 PCI BT-72 20 6 14 879 111 12.6 NEBT 1400 54 12 42 2,373 142 5.98 NEBT 1400 26 6 20 1,143 113 9.86 NEBT 1800 54 12 42 2,373 197 8.28 NEBT 1800 26 6 20 1,143 129 11.3
18
The results of this analysis showed the magnitude of the tensile force to be quite
high in most cases. The ratio of the tensile force to the total prestress force varied from
4.84 percent to 12.6 percent suggesting the current requirement in AASHTO LRFD of a
ratio of 4 percent is inadequate. The area of steel required to resist some of these large
tension forces would be impossible to provide when using an average working stress of
20 ksi. The results also showed that shallow sections tend to have lower tensile forces
suggesting they would be less susceptible to cracking. The authors recognized the results
of this model were probably overly conservative and recommended further calibration of
the model to better represent actual beam performance.
Castrodale, et al. also used their model to examine various strategies for
controlling anchorage zone cracks. These strategies included lowering the height of the
draped strands, reducing the number of draped strands, debonding several strands, and
using a wider spacing of strands at the end of the girder. By applying one or several of
these strategies, they used the strut-and-tie model to evaluate the effect on the magnitude
of the tension force. While all of these strategies proved successful at reducing the
tensile force, they could also affect other aspects of the overall girder design such as the
shear capacity. Castrodale, et al. concluded their model would produce very conservative
results when used to predict the reinforcement requirement to control anchorage zone
cracking. They also concluded this simple strut-and-tie model was useful at evaluating
various strategies to control cracking.
One of the main shortcomings of this strut-and-tie model is that the vertical strut
is placed very close to the beam end. This very short model gives a high area of
reinforcement required near the end of the beam. This arrangement does not reflect the
true stress distribution in the anchorage zone when the member begins to crack. As
cracks develop in the anchorage zone, the length of the general zone begins to lengthen
and the bars are not properly distributed to control crack propagation.
2.5 Experimental Methods
2.5.1 General
Measuring the complex stress distribution in the anchorage zone of a pretensioned
beam is challenging. Several studies have attempted to measure strains in the concrete
19
and reinforcement in the anchorage zone to develop a method to predict the location and
magnitude of the tension force. The design methods which are discussed in the next two
sections were developed from experimental studies and have proven successful in
controlling crack formation in some cases.
2.5.2 Marshall and Mattock (1962)
Marshall and Mattock conducted one of the earliest experimental investigations
into the tensile stresses in the anchorage zones of pretensioned girders at transfer. The
study proposed an equation for the design of stirrups to restrict the formation of
horizontal cracks. The test program consisted of two series of tests. The first series
measured the concrete stresses in the anchorage zones of ten pretensioned girders without
stirrups, and the second series measured the strain in the stirrups at the end of 25
pretensioned girders.
The test girders were all less than 25 in. deep which is relatively small in
comparison to girders typically used today in bridge construction. During the first test
series, strain gages were mounted on the girder surface after the forms were removed.
The gages measured vertical tension strain in the concrete over the end region of the
girder. The second series of test girders contained stirrups. Strain gages attached to the
stirrups measured the vertical tension strains. Using these strains the authors computed
the total stirrup force.
From the results of the experimental program, Marshall and Mattock proposed
Equation 2-3 to compute the amount of reinforcement to control cracking.
ts
t lh
fTA 021.0= (2-3)
Where:
At = area of stirrup reinforcement (in2)
T = total prestress force (k)
fs = maximum working stress in the stirrups (ksi)
h = member depth (in)
lt = transfer length (in)
20
Marshall and Mattock recommended distributing the area of steel computed with
Equation 2-3 uniformly over a length equal to h/5 measured from the end face of the
girder and placing the first stirrup as close to the end face as possible.
The study suggested that Equation 2-3 is applicable for a range of values such that
h/lt ≤ 2. As the ratio of h/lt increases beyond 2, then Equation 2-3 produces conservative
results. Assuming a transfer length of 50 times the strand diameter and a girder with ½
in. diameter strands, then this equation would be applicable for girders 50 in. deep or
smaller. Out of the nine standard bulb-tee cross sections used in Virginia, six are larger
than 50 in. As a result, Equation 2-3 is not particularly useful for the design of modern
day bridge girders in its current form. The provisions for pretensioned anchorage zone
design presented in both AASHTO LRFD and AASHTO Standard Specifications for
Highway Bridges appear to be a simplified form of Equation 2-3. By taking the h/lt ratio
as a constant value of 2, then the equation simplifies to 4 percent of the total prestress
force divided by some maximum working stress. Finally, Equation 2-3 was developed
from tests on girders which all had two groups of strands, one near the top of the beam
and one near the bottom. For beams with other end-loading conditions, such as strands
grouped near mid-depth, Equation 2-3 could yield misleading results.
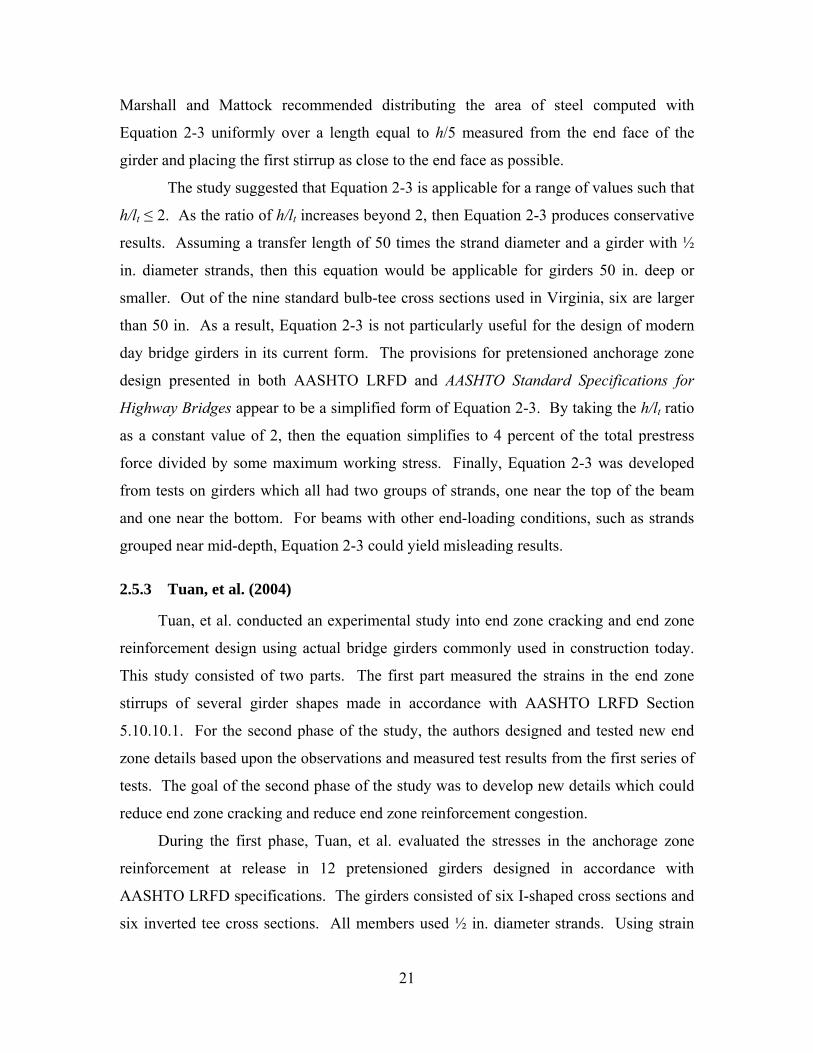
2.5.3 Tuan, et al. (2004)
Tuan, et al. conducted an experimental study into end zone cracking and end zone
reinforcement design using actual bridge girders commonly used in construction today.
This study consisted of two parts. The first part measured the strains in the end zone
stirrups of several girder shapes made in accordance with AASHTO LRFD Section
5.10.10.1. For the second phase of the study, the authors designed and tested new end
zone details based upon the observations and measured test results from the first series of
tests. The goal of the second phase of the study was to develop new details which could
reduce end zone cracking and reduce end zone reinforcement congestion.
During the first phase, Tuan, et al. evaluated the stresses in the anchorage zone
reinforcement at release in 12 pretensioned girders designed in accordance with
AASHTO LRFD specifications. The girders consisted of six I-shaped cross sections and
six inverted tee cross sections. All members used ½ in. diameter strands. Using strain
21
gages mounted on stirrups in the anchorage zone, the study measured strain in the
reinforcement as the strands were released. The results showed the first stirrup had the
highest strain, and the strain rapidly decreased as the distance from the end face
increased. The strain had totally dissipated at a distance approximately equal to the
girder depth from the end face. The maximum stress in any stirrup in the end zone was
less than the allowable working stress of 20 ksi prescribed in AASHTO LRFD. Using
the sum of the forces in the anchorage zone reinforcement, Tuan, et al. estimated the total
tension force in the beam end to be approximately 2 percent of the prestressing force.
The beams in this phase typically had several small horizontal cracks in the web which
extended longitudinally 8 to 12 in. into the beam.
Based on the results and observations from the first portion of the study, the authors
developed new end zone details. The new details were designed from a working stress of
20 ksi in the steel, and the anchorage zone reinforcement was designed to resist only 2
percent of the prestress force. This reinforcement was distributed over a distance of h/8
from the beam end. The new reinforcement detail used for an I-shaped member is shown
in Figure 2-4. The detail included grade 60 deformed bars welded to a steel plate on the
bottom of the girder. Small steel plates were also welded to the tops of the deformed bars
to help provide enough anchorage. Strain gages were applied in a manner similar to the
first phase, and strains were recorded during the release process.
22
77"
A A
Elevation
Deformed barsgrade 60
Steel plate 1/2" x 1-1/2" x 4"welded to bars
Deformed bars weldedto base plate
Steel plate 1/2" x 12" x 2-4"A36
Deformed bars weldedto plate
8 studs 1/2" dia x 5"
Steel plate1/2" x 12" x 2-4"
End of Girder
1"
Section A-A
Figure 2-4. Example of experimental details developed by Tuan, et al. (2004)
The strains measured using the new details were smaller than the strains from the
first test phase. While cracking still occurred in the girders with the new details, the
crack lengths were smaller. The tensile strain distribution over the anchorage zone length
followed the same trend as the authors observed in the first test phase, with the first bar
having the highest strain. The tensile stress in the stirrups varied from 0.4 to 25.8 ksi.
From these results, Tuan, et al. developed a relationship between stirrup stress and the
distance from the member end. This relationship is presented graphically in Figure 2-5.
23

0
5
10
15
20
0 0.25 0.5 0.75 1
Distance from end/Girder height
Des
ign
Stee
l Stre
ss (k
si)
Figure 2-5. Proposed design stress distribution in end zone reinforcement by Tuan, et al. (2004)
Tuan, et al. estimated the total tensile force in the stirrups based upon the tensile
stress distribution in the beam end. For stirrups which were not instrumented the authors
used linear regression to predict the stress for these bars. The ratio of the tension force to
the prestress force for girders from both tests ranged from 0.69 to 3.02 percent. Based on
these findings, the authors proposed Equation 2-4 to determine the total area of steel
required to resist cracking.
s
is f
PA 04.0= (2-4)
Where:
As = total area of reinforcement (in2)
Pi = initial prestress force before release (k)
fs = limit for the steel stress (ksi)
The study recommended placing 50 percent of the area of steel computed with
Equation 2-4 within a distance of h/8 from the member end. The authors also
recommended using bars welded to the bearing plate within this region as done in the
detail shown in Figure 2-4. Finally, they recommended evenly distributing the
remainder of the steel over a distance between h/8 and h/2 from the end. Beyond this
zone, reinforcement shall be provided as required by the shear design. Although the area
of steel from Equation 2-4 is the same as required currently by AASHTO LRFD, the
24

arrangement of the steel and the study found new detailing proved better at controlling
cracks.
The anchorage zone cracks in this study were well controlled. It is standard
practice in Nebraska to us a gradual release with hydraulic jacks as opposed to flame
cutting strands. The authors believed this practice is important to minimize end zone
cracking. The average compressive strength of the concrete at transfer was 7,560 psi for
the experimental girders in phase two and the average modulus of elasticity at transfer
was 5,040 ksi. These values are somewhat higher than the typical values for girders
manufactured in Virginia which would also help minimize anchorage zone cracking. The
study did not discuss if cracks opened or propagated further when the girder was lifted
from the casting bed which is something that has been frequently observed in Virginia.
2.6 Proposed Model for Anchorage Zone Design
2.6.1 General
Davis, et al. (2005) presented a strut-and-tie based model to use for the design of
pretensioned anchorage zones. Using case studies of actual bridge girders cast for the
Virginia Department of Transportation, the authors calibrated the locations of the struts
and ties in the model. From these case studies, Davis, et al. concluded that a group of
dense reinforcement placed close to the beam end will not be able to control the diagonal
cracks that will form in the beam web of the VDOT PCBT girders. They also concluded
that the vertical stiffness of the reinforcement was directly related to crack widths as well
as the length of the general zone. The basic design process involves using two strut-and-
tie models which are solved separately. One strut-and-tie model is arranged to control
cracks at the bulb-to-web interface typically observed in VDOT’s PCBT girders. The
second strut-and-tie model is arranged to control the formation of diagonal cracks in the
web which also commonly form in VDOT PCBT girders.
2.6.2 Method
A generic layout of the strut-and-tie models is shown in Figure 2-6. These two
models only consider the forces due to the prestress force. Self weight and the effect of
the reaction are neglected to represent the worst case of when the beam is lifted from the
25

casting bed. The force from the lower strand group is found from integrating the stress
over the strand area and is applied as an external force to the beam end. The force in the
upper strand group is computed the same way. It is also applied as an external force to
the beam end and is assumed to act horizontally, even though it is slightly inclined due to
the draping. The locations and magnitudes of the resultant forces are computed by
performing a transformed section analysis at a distance equal to h from the beam end, and
integrating the concrete stress over the concrete area. Once the resultant forces are
located, the magnitude of the tension force is computed by summing the moments about
points A and B for the upper and lower models respectively. If the analysis is completed
correctly, the unbalanced moment is the same in the upper and lower strut-and-tie model.
P1
P1T1
T1
T2
T2
P2
P2
h/4
h
3h/4
A
Bh
or h_web/3
Figure 2-6. Strut-and-tie models proposed by Davis, et al. (2005)
The tension force from the upper strut-and-tie model is assumed to act uniformly
over a length equal to 3h/4. This distance is based upon the lengths of diagonal cracks
observed in numerous case studies of PCBT girders made by VDOT. The tension force
in the lower strut-and-tie model is assumed to act evenly over a length of h/4 for small
depth sections, and hweb/3 for larger depth sections, which is also based upon field
observations. To compute the area of reinforcement, the authors recommended three
options for the working stress in the steel. For normal weight concrete beams in non-
26

aggressive environments, Davis, et al. recommended a stress of 18 ksi. For lightweight
concrete beams or girders exposed to saltwater environments the authors recommended a
stress of 12 ksi based upon the tensile strength of lightweight concrete being
approximately 20 percent less than that of normal weight concrete and based upon
lightweight concrete having a lower modulus of elasticity. Finally for extreme cases,
such as splice girder ends, they proposed a stress of 8 ksi. These operating stress levels
were selected in order to ensure crack widths were less than 0.012 in. after transfer.
Davis, et al. conducted an initial parametric study using Virginia PCBT girders
and the proposed strut-and-tie model. The parametric study found that in short beams,
the reinforcement requirement near the beam end is very close to the current requirement
of 4 percent of the total prestress force. In larger depth beams, the requirement near the
beam end was closer to 5 percent of the total prestress force. Most notably, the study
suggested that the stirrup requirement away from the beam end ranged between 4 to 5
percent of the prestress force for larger depth beams. This finding is important as larger
depth beams and higher prestress forces become more common and based on the
extensive diagonal cracking noted in these beams. The results from this parametric study
are shown graphically in Figure 2-7.
Force in Vertical Beam End Reinforcement
0123456789
10
0 20 40 60 80 100
Depth of Virginia Bulb-T (in.)
Perc
enta
ge o
f Pja
ck fr
om A
ll St
rand
s
Reinf. Within 0.33hof beam end
All beam end reinf.Within 0.75 h ofbeam end
Figure 2-7. Results of parametric study by Davis, et al. (2005)
27
2.7 Summary of Literature Review
This chapter has summarized previous research conducted on pretensioned
anchorage zones. While a large volume of work has been conducted on post-tensioned
anchorage zones, relatively little work has been done on pretensioned anchorage zones.
This is due primarily to the fact that the prestress force is introduced gradually in a
pretensioned anchorage zone and the magnitude of the tension force near the beam end is
smaller. Nevertheless, the research outlined above suggests that the current provisions
for pretensioned anchorage zone design are inadequate and perhaps outdated. This
research will attempt to verify a new design method for the anchorage zones of VDOT’s
standard PCBT girders.
28

Chapter 3. Development of Design Aids and Standard Details
3.1 Introduction
This chapter begins with a presentation of case study girders surveyed during
several trips to a precast yard in Virginia. These case studies illustrate some of the
deficiencies of anchorage zones in girders designed with the current AASHTO LRFD
provisions. The theory and goals of the proposed model are discussed and a design
example is completed using the full strut-and-tie based model. The next portion of this
chapter discusses the procedure and results from the parametric study which was
conducted using this model. The results from the parametric study were consolidated
into anchorage zone design tables, and these tables are compared to other design models,
international bridge codes, and to the case study girders. The last portion of the chapter
discusses how the aspects of the proposed design model are incorporated into new
standard anchorage zone details for Virginia. The new details for Virginia are compared
to the standard details used by several states throughout the country.
3.2 Beam End Case Studies
3.2.1 General Field Observations
To begin this research several trips were made to Bayshore Concrete Products
Corporation (Bayshore) located in Cape Charles, VA. This facility manufactures many
of the PCBT girders for bridges used throughout Virginia. During the visits to this
facility, the ends of numerous PCBT girders were studied to measure crack lengths and
crack widths. In general the PCBT-37, 45, 53, and 61 girders displayed minimal
anchorage zone cracking when designed in accordance with AASHTO LRFD provisions,
and the larger girders such as the PCBT-77 and 93 displayed a high level of cracking.
The PCBT-69 and 85 girders were not observed during the site visits; however, it can be
assumed they would perform similarly to the other large girders.
Crack widths were measured using a crack comparator card. All of the girders
observed had been hand rubbed with a mortar mixture to minimize surface defects. The
cracks in the end region, however, were still visible and the widths could be reasonably
29

estimated with a crack comparator. The length of the cracks were also measured and
recorded. Photographs of the girders were taken and are shown in the following sections.
The cracks in the photographs have been highlighted for emphasis.
3.2.2 Fair Beam Ends
The girder shown in Figure 3-1 is a 53 in. bulb-tee with 44, ½ in. strands with six
of the strands harped. The total prestress force was 1,368 kips at the time the strands
were tensioned. The crack pattern shown in Figure 3-1 was typical of eight other beams
with the same magnitude of prestress force and stirrup arrangement. The area of vertical
reinforcement within a distance of h/4 from the end of the girder was 3.1 in2 and this
region was free of cracks. A diagonal crack formed near the top flange-web interface
several inches in from the end of the beam and extended a length of almost 60 percent of
the girder height. The widest portion of this crack measured approximately 0.010 in.
This crack width would be acceptable for most bridge girders not exposed to salt water
environments.
This case study illustrates that the dense reinforcement close to the beam end
required by AASHTO LRFD, will not control diagonal cracks that can form in the web.
It also suggests that the length of the general zone is longer than h/4 and the vertical
reinforcement for the anchorage zone should extend farther into the beam. This girder
was classified as fair because of the length of the diagonal crack. It is desired for any
diagonal cracks which develop near the top flange to terminate within h/2. Diagonal
cracks which terminate within h/2 often tighter and are less of a concern to bridge
inspectors. The diagonal crack in this girder was not repaired.
30

Pjack = 1368 k
Figure 3-1. PCBT-53 anchorage zone case study – fair condition
The girder shown in Figure 3-2 is a 107 ft long PCBT-61 which contained a total
of 48, ½ in. diameter strands. Forty of the strands were straight and 8 strands were
harped. The top row of harped strands was raised to 8-¾ in. below the surface of the top
flange at the beam end. The total prestress force at the time the strands were tensioned
was 1,490 kips. The stirrup detail at the beam end was robust. Within a length of h/4
from the beam end, seven No. 4 stirrups were provided at 2 in. spacing for a stirrup area
of 2.8 in2.
Figure 3-2 shows the cracks which formed in the girder. This cracking was
typical of four other girders with the same prestress pattern and stirrup arrangement also
studied. A diagonal crack opened and extended longitudinally into the beam for a length
of almost 50 percent of the beam height. This crack formed close to the harped strands
and extended on a downward angle slightly steeper than these strands. The diagonal
crack did not appear to cross the path of the harped strands. The presence of the two
columns of holes near the beam end created stress concentrations and most likely
contributed to this crack propagation. Additionally, the harped strands in this girder were
not raised to full height at the beam end which resulted in a slightly larger eccentricity of
the prestress force. This factor was also likely to have contributed to crack development
and propagation. Two horizontal cracks formed in the lower portion of the web. The
31
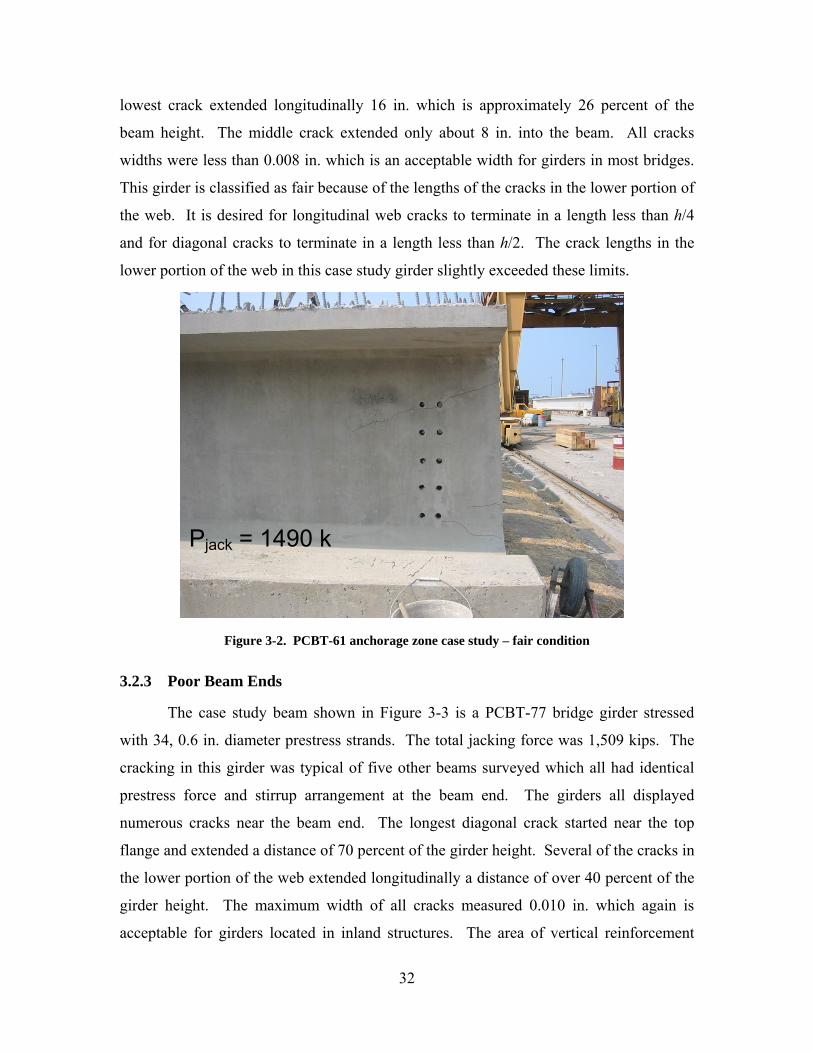
lowest crack extended longitudinally 16 in. which is approximately 26 percent of the
beam height. The middle crack extended only about 8 in. into the beam. All cracks
widths were less than 0.008 in. which is an acceptable width for girders in most bridges.
This girder is classified as fair because of the lengths of the cracks in the lower portion of
the web. It is desired for longitudinal web cracks to terminate in a length less than h/4
and for diagonal cracks to terminate in a length less than h/2. The crack lengths in the
lower portion of the web in this case study girder slightly exceeded these limits.
Pjack = 1490 k
Figure 3-2. PCBT-61 anchorage zone case study – fair condition
3.2.3 Poor Beam Ends
The case study beam shown in Figure 3-3 is a PCBT-77 bridge girder stressed
with 34, 0.6 in. diameter prestress strands. The total jacking force was 1,509 kips. The
cracking in this girder was typical of five other beams surveyed which all had identical
prestress force and stirrup arrangement at the beam end. The girders all displayed
numerous cracks near the beam end. The longest diagonal crack started near the top
flange and extended a distance of 70 percent of the girder height. Several of the cracks in
the lower portion of the web extended longitudinally a distance of over 40 percent of the
girder height. The maximum width of all cracks measured 0.010 in. which again is
acceptable for girders located in inland structures. The area of vertical reinforcement
32
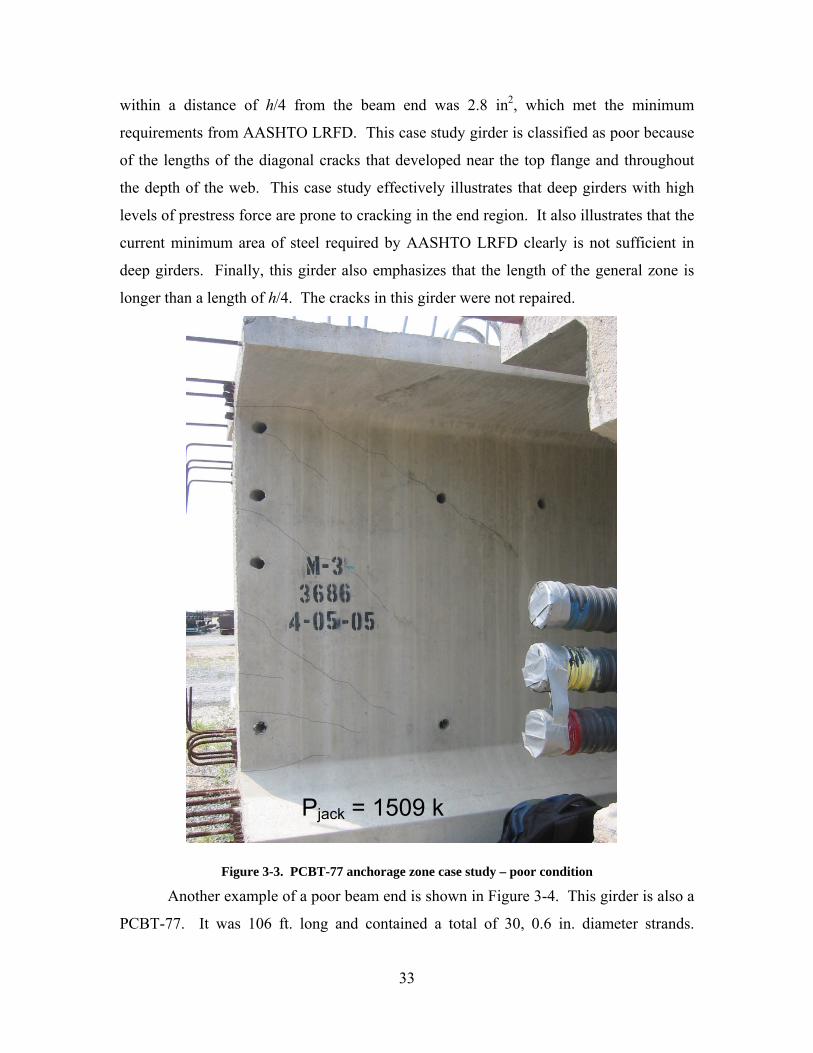
within a distance of h/4 from the beam end was 2.8 in2, which met the minimum
requirements from AASHTO LRFD. This case study girder is classified as poor because
of the lengths of the diagonal cracks that developed near the top flange and throughout
the depth of the web. This case study effectively illustrates that deep girders with high
levels of prestress force are prone to cracking in the end region. It also illustrates that the
current minimum area of steel required by AASHTO LRFD clearly is not sufficient in
deep girders. Finally, this girder also emphasizes that the length of the general zone is
longer than a length of h/4. The cracks in this girder were not repaired.
Figure 3-3. PCBT-77 anchorage zone case study – poor condition
Another example of a poor beam end is shown in Figure 3-4. This girder is also a
PCBT-77. It was 106 ft. long and contained a total of 30, 0.6 in. diameter strands.
Pjack = 1509 k
33
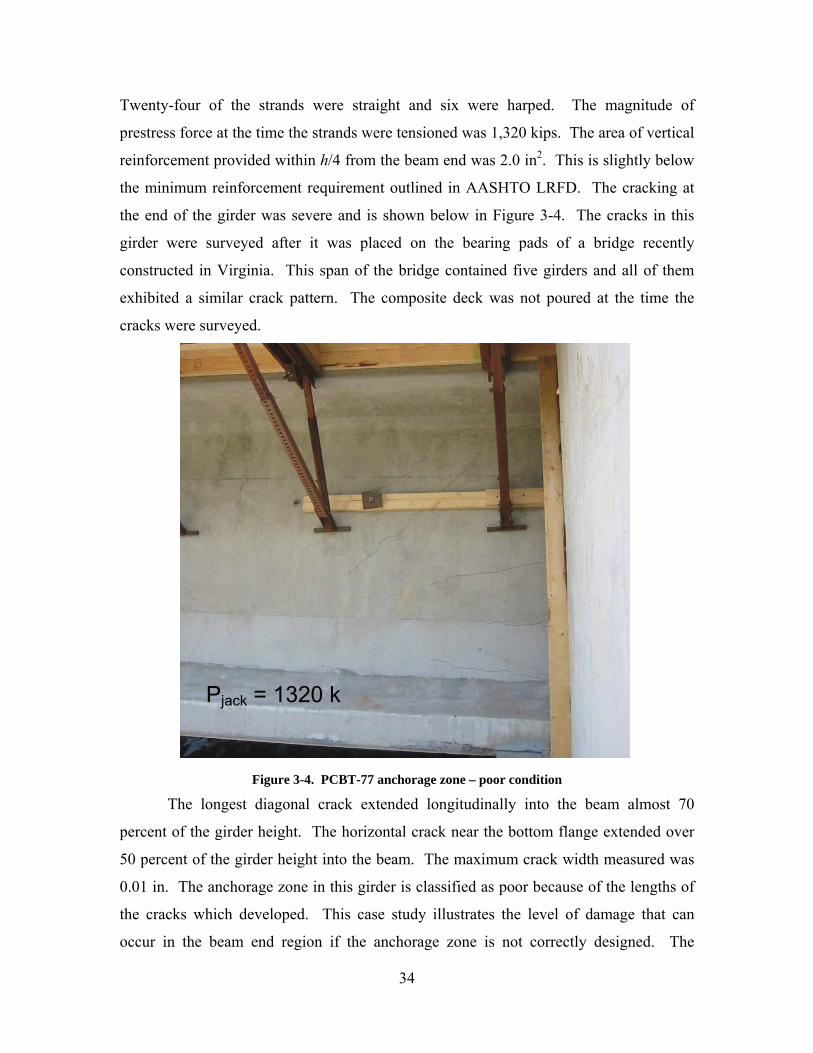
Twenty-four of the strands were straight and six were harped. The magnitude of
prestress force at the time the strands were tensioned was 1,320 kips. The area of vertical
reinforcement provided within h/4 from the beam end was 2.0 in2. This is slightly below
the minimum reinforcement requirement outlined in AASHTO LRFD. The cracking at
the end of the girder was severe and is shown below in Figure 3-4. The cracks in this
girder were surveyed after it was placed on the bearing pads of a bridge recently
constructed in Virginia. This span of the bridge contained five girders and all of them
exhibited a similar crack pattern. The composite deck was not poured at the time the
cracks were surveyed.
Pjack = 1320 k
Figure 3-4. PCBT-77 anchorage zone – poor condition
The longest diagonal crack extended longitudinally into the beam almost 70
percent of the girder height. The horizontal crack near the bottom flange extended over
50 percent of the girder height into the beam. The maximum crack width measured was
0.01 in. The anchorage zone in this girder is classified as poor because of the lengths of
the cracks which developed. This case study illustrates the level of damage that can
occur in the beam end region if the anchorage zone is not correctly designed. The
34
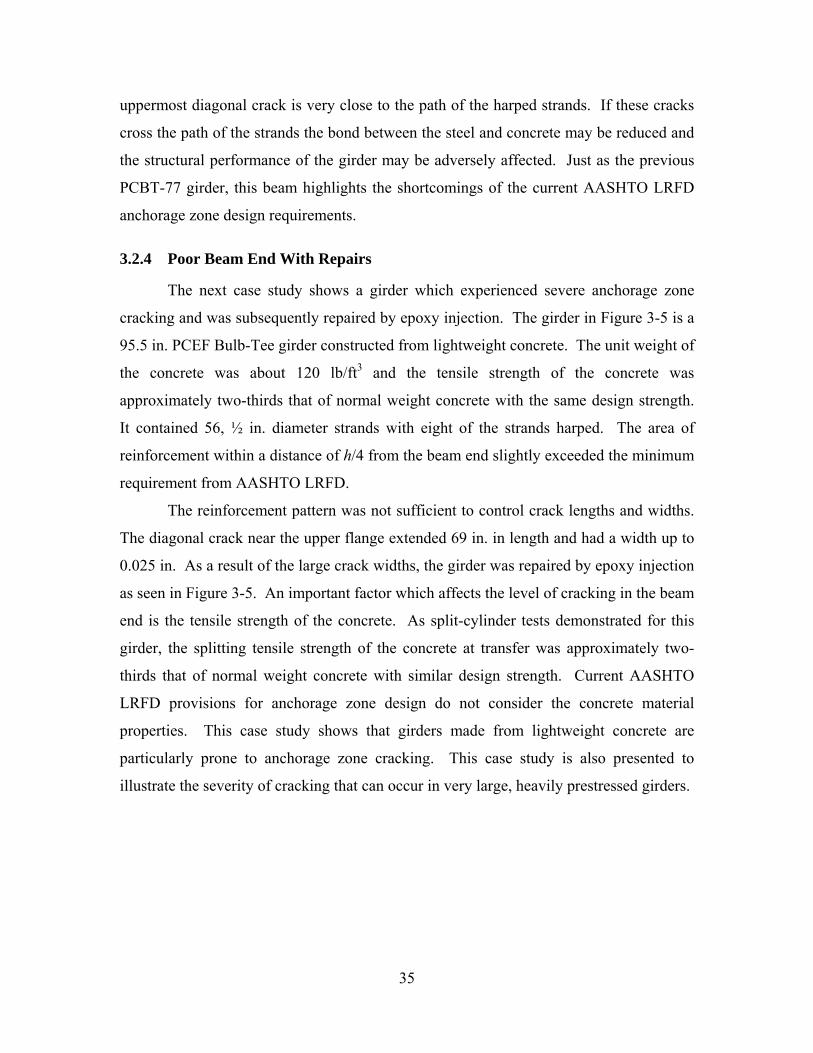
uppermost diagonal crack is very close to the path of the harped strands. If these cracks
cross the path of the strands the bond between the steel and concrete may be reduced and
the structural performance of the girder may be adversely affected. Just as the previous
PCBT-77 girder, this beam highlights the shortcomings of the current AASHTO LRFD
anchorage zone design requirements.
3.2.4 Poor Beam End With Repairs
The next case study shows a girder which experienced severe anchorage zone
cracking and was subsequently repaired by epoxy injection. The girder in Figure 3-5 is a
95.5 in. PCEF Bulb-Tee girder constructed from lightweight concrete. The unit weight of
the concrete was about 120 lb/ft3 and the tensile strength of the concrete was
approximately two-thirds that of normal weight concrete with the same design strength.
It contained 56, ½ in. diameter strands with eight of the strands harped. The area of
reinforcement within a distance of h/4 from the beam end slightly exceeded the minimum
requirement from AASHTO LRFD.
The reinforcement pattern was not sufficient to control crack lengths and widths.
The diagonal crack near the upper flange extended 69 in. in length and had a width up to
0.025 in. As a result of the large crack widths, the girder was repaired by epoxy injection
as seen in Figure 3-5. An important factor which affects the level of cracking in the beam
end is the tensile strength of the concrete. As split-cylinder tests demonstrated for this
girder, the splitting tensile strength of the concrete at transfer was approximately two-
thirds that of normal weight concrete with similar design strength. Current AASHTO
LRFD provisions for anchorage zone design do not consider the concrete material
properties. This case study shows that girders made from lightweight concrete are
particularly prone to anchorage zone cracking. This case study is also presented to
illustrate the severity of cracking that can occur in very large, heavily prestressed girders.
35

Pjack = 1740 k
Figure 3-5. 95.5 in. PBCT beam ends with repairs. Photograph from Davis, et al. (2005)
3.2.5 Drop-in Girders and Pier Segments
The final case study shown in Figure 3-6 is a 95.5 in. lightweight bulb-tee girder
used as a “drop-in” segment in a splice girder bridge. This girder was lightly stressed
with 16, 0.6 in. diameter strands to provide a jacking force of 656 kips. The member had
no harped strands. The vertical reinforcement within h/4 from the beam end was 1.24 in2.
As Figure 3-6 shows, several longitudinal cracks developed in the web of the girder.
These cracks were measured to be 0.010 in. or less and extended a length of almost 30
percent of girder height. Also, it is important to note the proximity of these cracks to the
post tensioning ducts. This case study girder is classified as poor because of the lengths
of the horizontal cracks which developed. This case study again illustrates the
shortcomings in the current AASHTO LRFD provisions when applied to deep girders.
36

Pjack = 656 k
Figure 3-6. Drop in girder with anchorage zone cracking
Pier segments with anchorage zone cracking are also an area of concern. During
site visits to Bayshore, diagonal and horizontal cracks were observed on deep haunched
girders as shown in Figure 3-7. Cracking of this type could be detrimental to girder
strength. When a girder with this type of cracking is in service, tension must cross the
crack. As a result the crack could open and close as traffic crosses the bridge.
An example of this exact type of problem is shown in Figure 3-8. This
photograph shows the connection between a pier segment and a drop in girder from a
project recently completed in Virginia. The pier segment rests on the pier bent and is in
the right hand portion of the photograph. A drop in girder is on the left portion of the
photograph. The cracking at the ends of these two girders is clear in the photograph and
have not been highlighted for emphasis. It was observed that these cracks open and close
under traffic loads as evident from flaking along the crack edges.
37

Figure 3-7. Anchorage zone cracking observed in deep haunched girders
Figure 3-8. Anchorage zone cracking of in-service haunched girder and “drop-in” girder
(photograph by Rodney T. Davis)
38

3.2.6 Summary of Field Observations
As these case studies illustrate, anchorage zone cracking in VDOT PCBT girders is
a common problem and additional research is required. The requirements outlined in the
AASHTO LRFD specifications are not sufficient to control crack formation in most large
girders. Horizontal cracks were typically seen to form at the bottom flange-web interface
and extend longitudinally up to 25 percent of the girder height. Diagonal cracks would
frequently develop several inches in from the end of the beam and would propagate
longitudinally as far as 75 percent of the girder height. Anchorage zones in deep girders
developed the most cracks and anchorage zones in girders such as the PCBT-61 and the
smaller sections usually performed adequately when designed by AASHTO LRFD.
Girders which have too little reinforcement at the end often have longer and worse
diagonal cracking. Girders which have ample reinforcement near the end, may have little
cracking within the first few inches, but diagonal cracking may still develop.
3.3 New Design Model Theory and Goals
3.3.1 General
The basic goal of this new strut-and-tie based design approach is to provide enough
stirrup area, correctly distributed within the anchorage zone, to provide a path for the
vertical forces and distortional tensile stresses to follow without causing excessive
anchorage zone cracking. This will reduce concerns from inspectors and owners as
girders are placed into service. It is clear from the field observations that many of the
girder ends designed with AASHTO LRFD do not provide sufficient vertical resistance to
control cracking. Additionally, the region of dense reinforcement within h/4 will not
provide enough resistance to control the formation and propagation of diagonal cracks in
the upper portion of the web since this crack will typically form several inches from the
end of the beam (between h/8 and h/4). This new design model will consider the region
from h/4 to 3h/4 as part of the anchorage zone. Current provisions do not consider this
region as part of the anchorage zone, however; field observations suggest this region is
highly affected by the diffusion of the prestress force. The following section will relate
39

the field observations from the previous case studies to the calibration of the strut-and-tie
model.
3.3.2 Calibration of the Strut-and-Tie Model
The basic layout of the strut-and-tie models are shown in Figure 3-9. The
placement of the vertical struts and ties within the upper and lower strut-and-tie models
was developed from the field observations made in the beginning of this chapter. In the
lower strut-and-tie model, the tie is centered at a distance of h/8 from the end of the
beam. The reinforcement for this force is uniformly distributed over a distance of h/4
from the beam end. This placement relates to the observation that horizontal cracks
within the web typically extended out a distance of 25 percent of the total girder depth.
In the upper strut-and-tie model, the tie is centered at a distance of 3h/8 from the end of
the beam. The reinforcement for this force is uniformly distributed over a distance of
3h/4 from the beam end. The placement of this tie relates to the observation of diagonal
cracks in the upper portion of the web that may extend out to a distance of 75 percent of
the total girder depth as seen in lightly reinforced beams. This calibration will dictate the
stirrup density or distribution in the anchorage zone.
40

P1
P1T1
T1
T2T2
P2
P2
h/4
h
3h/4
h
Figure 3-9. Calibration of the proposed strut-and-tie based model
The placement of the vertical compression strut in both the upper and lower strut-
and-tie model is at a distance equal to the girder height from the end of the beam. This is
a very important calibration of the model as the location of this strut will greatly
influence the magnitude of the forces in the ties. If the vertical strut was located too close
to the beam end, the magnitude of the force and subsequently the area of reinforcement
will become too high and the anchorage zone would not be feasible to fabricate. It will
also result in more reinforcement than necessary and at the wrong place. If this strut was
placed too far from the beam end, the resulting area of steel will be too low to properly
control crack lengths and widths. By placing the vertical compression strut at a distance
equal to h from the beam end, the magnitude of the tension force for girders around 50 in.
or less in height obtained by using the model was similar to bursting resistance computed
in section 5.10.10.1 in AASHTO LRFD. This corresponded to field observations in
which smaller girders tended to perform adequately when designed according to the
current AASHTO LRFD provisions.
Another aspect of the model calibration was the selection of the stirrup working
stresses. The selected working stress will affect the area of steel required to resist the
41

tension force and will affect the crack widths and lengths. A maximum working stress of
20 ksi has traditionally been used for both AASHTO Standard Specifications and
AASHTO LRFD. The new design model proposes a stepped approach to selecting a
working stress.
For girders with normal weight concrete, located in non-aggressive environments
a working stress of 18 ksi is proposed. A working stress of 12 ksi is proposed for girders
with lightweight concrete and normal weight concrete girders in overpass structures
which are exposed to de-icing salts spraying up from the road below, and normal weight
concrete girders located in marine environments. These working stresses are selected for
simplicity since the splitting tensile strength of lightweight concrete is less than normal
weight concrete and the modulus of elasticity is usually two-thirds the modulus of
elasticity of normal weight concrete. Finally, the new design approach proposes a
working stress of 8 ksi for splice girders or lightweight concrete beams in aggressive or
marine environments. This scaled approach to the working stress selection allows
flexibility for the designer to customize the anchorage zone design for various conditions.
The working stress which is selected will affect the distribution of the vertical
reinforcement and therefore the length of the general zone.
3.3.3 Acceptable Crack Widths and Crack Lengths
The calibration of the strut-and-tie models discussed in the previous two paragraphs
was based on field observation and was selected to ensure the design method will reliably
produce beam ends with cracks below a specific level. The goal of this model is to
ensure that longitudinal web cracks will terminate within a length of 25 percent of the
girder height and diagonal web cracks will terminate within a length of 50 percent of the
girder height. These lengths are acceptable to bridge inspectors and are considered
normal.
Acceptable crack widths for a girder depend upon the environment in which the
girder will be exposed over the service life. The type of structure in which a girder is
placed will also affect the environmental exposure of the girder. For example a girder
end which is enclosed in a cast-in-place diaphragm will not be exposed to de-icing
chemicals from the road deck, but may be exposed to de-icing chemical from below if it
42
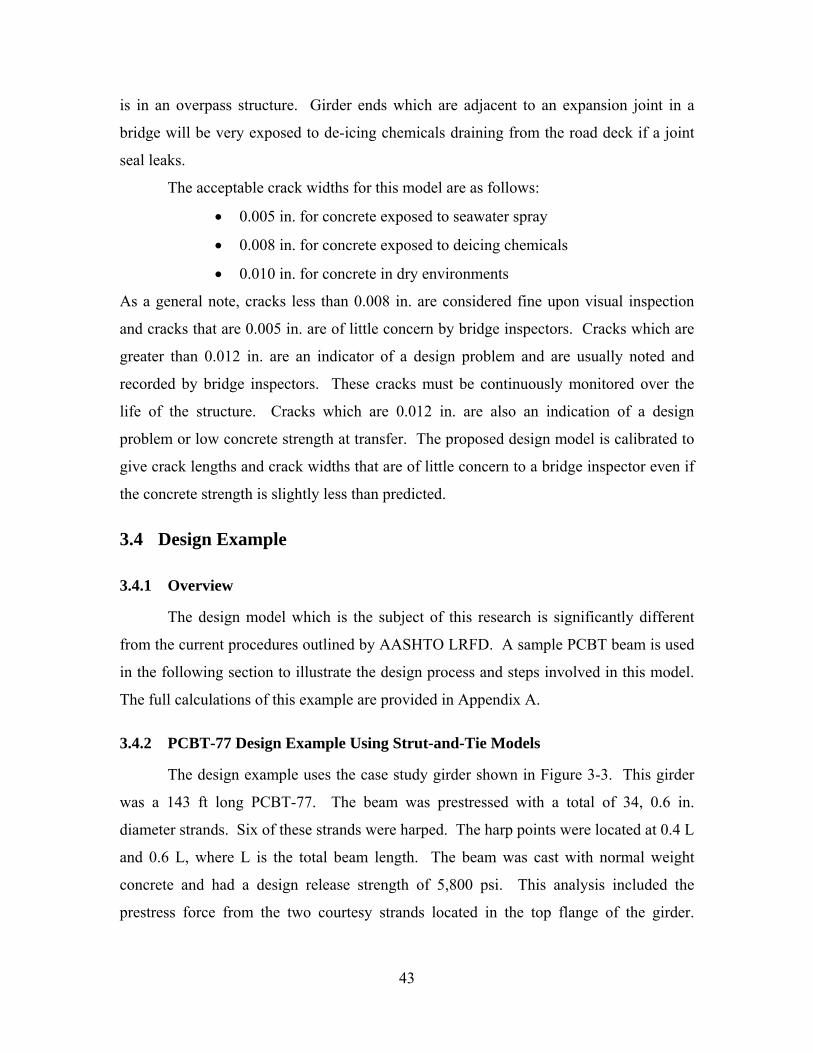
is in an overpass structure. Girder ends which are adjacent to an expansion joint in a
bridge will be very exposed to de-icing chemicals draining from the road deck if a joint
seal leaks.
The acceptable crack widths for this model are as follows:
• 0.005 in. for concrete exposed to seawater spray
• 0.008 in. for concrete exposed to deicing chemicals
• 0.010 in. for concrete in dry environments
As a general note, cracks less than 0.008 in. are considered fine upon visual inspection
and cracks that are 0.005 in. are of little concern by bridge inspectors. Cracks which are
greater than 0.012 in. are an indicator of a design problem and are usually noted and
recorded by bridge inspectors. These cracks must be continuously monitored over the
life of the structure. Cracks which are 0.012 in. are also an indication of a design
problem or low concrete strength at transfer. The proposed design model is calibrated to
give crack lengths and crack widths that are of little concern to a bridge inspector even if
the concrete strength is slightly less than predicted.
3.4 Design Example
3.4.1 Overview
The design model which is the subject of this research is significantly different
from the current procedures outlined by AASHTO LRFD. A sample PCBT beam is used
in the following section to illustrate the design process and steps involved in this model.
The full calculations of this example are provided in Appendix A.
3.4.2 PCBT-77 Design Example Using Strut-and-Tie Models
The design example uses the case study girder shown in Figure 3-3. This girder
was a 143 ft long PCBT-77. The beam was prestressed with a total of 34, 0.6 in.
diameter strands. Six of these strands were harped. The harp points were located at 0.4 L
and 0.6 L, where L is the total beam length. The beam was cast with normal weight
concrete and had a design release strength of 5,800 psi. This analysis included the
prestress force from the two courtesy strands located in the top flange of the girder.
43
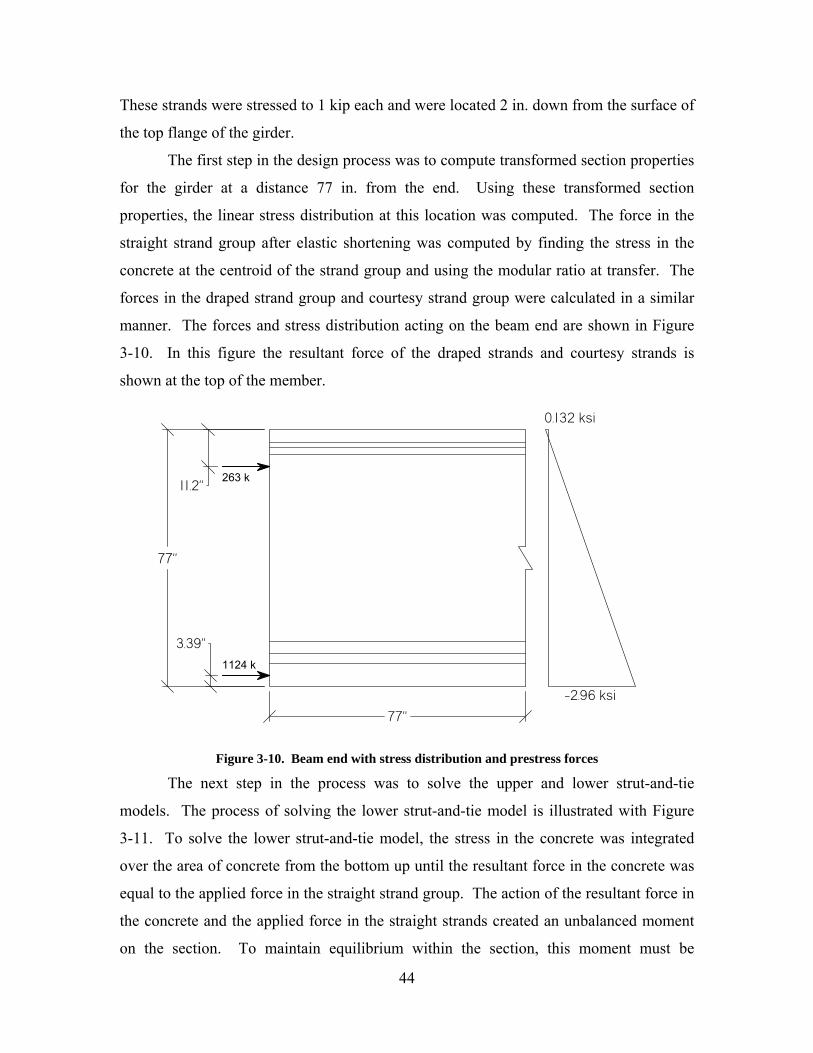
These strands were stressed to 1 kip each and were located 2 in. down from the surface of
the top flange of the girder.
The first step in the design process was to compute transformed section properties
for the girder at a distance 77 in. from the end. Using these transformed section
properties, the linear stress distribution at this location was computed. The force in the
straight strand group after elastic shortening was computed by finding the stress in the
concrete at the centroid of the strand group and using the modular ratio at transfer. The
forces in the draped strand group and courtesy strand group were calculated in a similar
manner. The forces and stress distribution acting on the beam end are shown in Figure
3-10. In this figure the resultant force of the draped strands and courtesy strands is
shown at the top of the member.
-2.96 ksi
0.132 ksi
77"
77"
11.2"
3.39"
1124 k
263 k
Figure 3-10. Beam end with stress distribution and prestress forces
The next step in the process was to solve the upper and lower strut-and-tie
models. The process of solving the lower strut-and-tie model is illustrated with Figure
3-11. To solve the lower strut-and-tie model, the stress in the concrete was integrated
over the area of concrete from the bottom up until the resultant force in the concrete was
equal to the applied force in the straight strand group. The action of the resultant force in
the concrete and the applied force in the straight strands created an unbalanced moment
on the section. To maintain equilibrium within the section, this moment must be
44
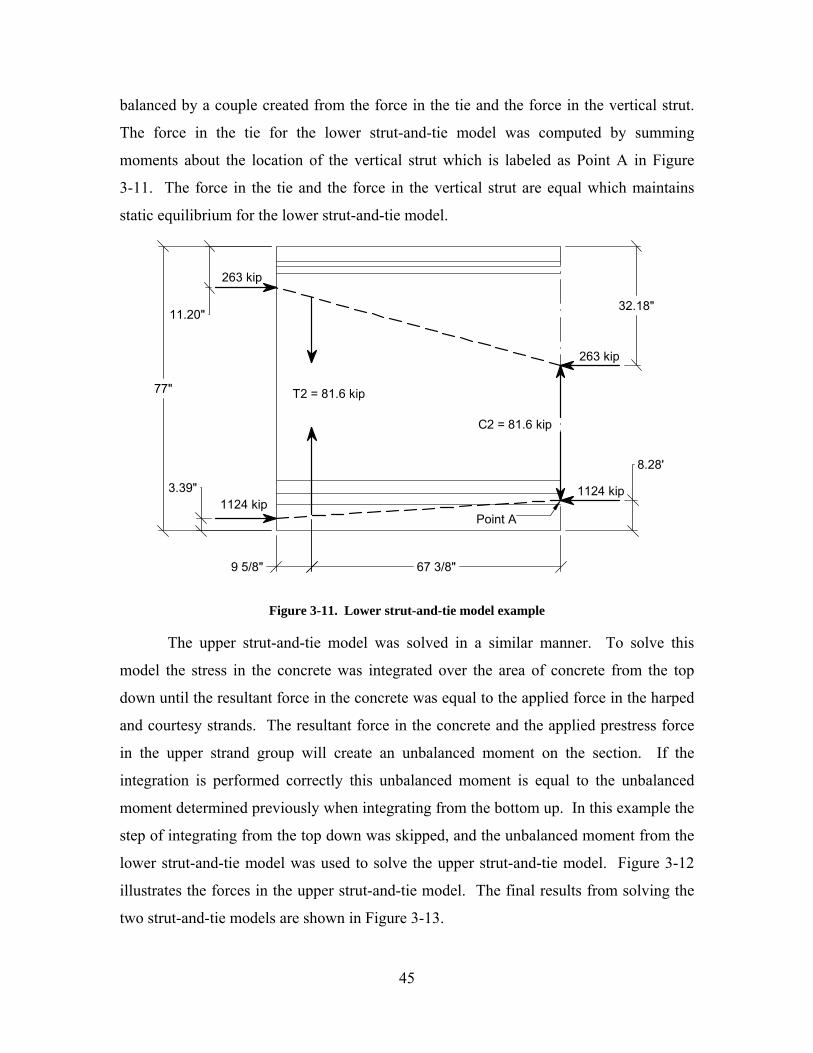
balanced by a couple created from the force in the tie and the force in the vertical strut.
The force in the tie for the lower strut-and-tie model was computed by summing
moments about the location of the vertical strut which is labeled as Point A in Figure
3-11. The force in the tie and the force in the vertical strut are equal which maintains
static equilibrium for the lower strut-and-tie model.
1124 kip3.39" 1124 kip
77" T2 = 81.6 kip
C2 = 81.6 kip
Point A
9 5/8" 67 3/8"
8.28"
11.20"
263 kip
263 kip
32.18"
Figure 3-11. Lower strut-and-tie model example
The upper strut-and-tie model was solved in a similar manner. To solve this
model the stress in the concrete was integrated over the area of concrete from the top
down until the resultant force in the concrete was equal to the applied force in the harped
and courtesy strands. The resultant force in the concrete and the applied prestress force
in the upper strand group will create an unbalanced moment on the section. If the
integration is performed correctly this unbalanced moment is equal to the unbalanced
moment determined previously when integrating from the bottom up. In this example the
step of integrating from the top down was skipped, and the unbalanced moment from the
lower strut-and-tie model was used to solve the upper strut-and-tie model. Figure 3-12
illustrates the forces in the upper strut-and-tie model. The final results from solving the
two strut-and-tie models are shown in Figure 3-13.
45

1124 kip3.39" 1124 kip
77"
T1 = 114 kipC1 = 114 kip
Point A
28 7/8" 48 1/8"
8.28"
11.20"
263 kip
263 kip
32.18"
Figure 3-12. Upper strut-and-tie model example
1124 kip1124 kip
8.28"3.39"
77"
263 kip
261 kip
11.12"32.18"
67 3/8"
48 1/8"
T1 = 114 kip
T2 = 81.6 kipT2 = 81.6 kip
T1 = 114 kip
Figure 3-13. Results of both strut-and-tie models
46
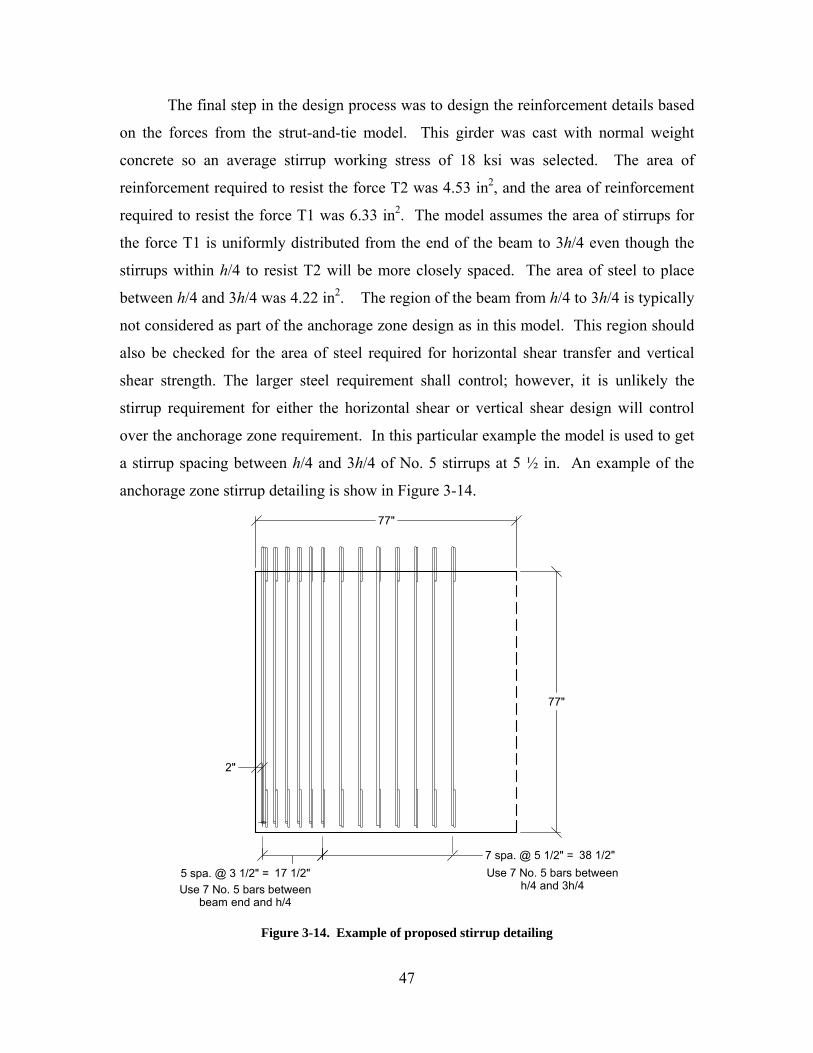
The final step in the design process was to design the reinforcement details based
on the forces from the strut-and-tie model. This girder was cast with normal weight
concrete so an average stirrup working stress of 18 ksi was selected. The area of
reinforcement required to resist the force T2 was 4.53 in2, and the area of reinforcement
required to resist the force T1 was 6.33 in2. The model assumes the area of stirrups for
the force T1 is uniformly distributed from the end of the beam to 3h/4 even though the
stirrups within h/4 to resist T2 will be more closely spaced. The area of steel to place
between h/4 and 3h/4 was 4.22 in2. The region of the beam from h/4 to 3h/4 is typically
not considered as part of the anchorage zone design as in this model. This region should
also be checked for the area of steel required for horizontal shear transfer and vertical
shear strength. The larger steel requirement shall control; however, it is unlikely the
stirrup requirement for either the horizontal shear or vertical shear design will control
over the anchorage zone requirement. In this particular example the model is used to get
a stirrup spacing between h/4 and 3h/4 of No. 5 stirrups at 5 ½ in. An example of the
anchorage zone stirrup detailing is show in Figure 3-14.
17 1/2"5 spa. @ 3 1/2" =38 1/2"7 spa. @ 5 1/2" =
2"
77"
77"
Use 7 No. 5 bars betweenbeam end and h/4
Use 7 No. 5 bars betweenh/4 and 3h/4
Figure 3-14. Example of proposed stirrup detailing
47

The details developed using this design approach result in a significantly greater
area of stirrups compared to the details in the actual case study beam shown in Figure
3-3. In the actual case study girder, the region between the beam end and h/4 contained a
stirrup area of 2.8 in2. The example detail in Figure 3-14 contains 4.34 in2 within this
same region. This design provides a vertical resistance of 5.22 percent of the jacking
force.
In the case study girder the region between h/4 and 3h/4 contained a stirrup area
of 2.8 in2. The example detail in Figure 3-14 contains 4.34 in2 in this region. It is clear
from the photograph of the anchorage zone cracking in this case study, the area of
stirrups provided was not sufficient to control the cracks. The new design model results
in a 55 percent increase in the stirrup area in the region from the end to h/4 and a 55
percent increase from h/4 to 3h/4 compared to the original stirrup detail. By using No. 5
stirrups as opposed to No. 4 stirrups used in the original design, a stirrup spacing can be
used which will provide adequate clear spacing to ensure good concrete consolidation.
3.5 Parametric study
The primary objective of this research project was to develop a simplified approach
to beam end design to use for most typical PCBT applications in Virginia. To
accomplish this objective, two parametric studies using the proposed design model were
conducted. One parametric study included members cast with normal weight concrete,
and the second study included members cast with lightweight concrete. The results from
these two parametric studies were consolidated into design aids to provide designers a
quick method to determine the area of stirrups to use within the anchorage zone of the
beam. The following sections discuss the assumptions, procedures, and results from the
two parametric studies.
3.5.1 Parametric Study Assumptions
Several assumptions about material properties were made before conducting the
parametric study. For all sample beams in the study, the release strength of the concrete
was assumed to be 5,500 psi. The unit weight of the normal weight concrete was taken to
be 150 lb/ft3 and the unit weight of the lightweight concrete was assumed to be 120 lb/ft3.
Together, the unit weight of the concrete and release strength affect the modulus of
48

elasticity of the concrete at transfer. The modulus of elasticity of the concrete at transfer
was computed using Equation 3-1.
`5.133 cici fwE = (3-1)
Where:
Eci = modulus of elasticity at transfer in psi
w = unit weight of concrete in lb/ft3
f`ci = compressive strength of concrete at release in psi
The modulus of elasticity of the prestress steel was assumed to be 28,000 ksi.
This value affects the modular ratio which was used in computing transformed section
properties as part of the analysis. The ultimate strength of the prestress steel was 270 ksi,
and the initial stress in the strand at the time of tensioning was 0.75fpu or 202.5 ksi. The
prestress force applied in the courtesy strands was also considered in the models for the
parametric studies. A total of 1 kip per strand was assumed to act in each of the four
courtesy strands located in the top flange of the girder. This resulted in 4 kips of force in
addition to the force applied by the straight and harped strands. The parametric study
included girders with ½ in. strand and 0.6 in. strand. Girders in the parametric study
which contained ½ in. strand also included ½ in. diameter courtesy strands. Girders
which used 0.6 in. strand had 0.6 in. diameter courtesy strands. The harping points for all
draped strands were assumed to be at 0.4 L and 0.6 L, where L was the total length of the
beam. The model assumes that there are no debonded strands.
One final assumption pertained to the strand pattern of the sample beams for the
parametric study. The top row of harped strands was raised to a height 2 in. below the
surface of the top flange of the girder. At the beam end, each row available for prestress
strands was filled from the bottom up. The number of pairs of harped strands was equal
to the number of rows filled at the bottom of the beam. All holes for the prestress strands
were located on a 2 in. center-to-center spacing.
3.5.2 Parametric Study Procedure
The lightweight and normal weight concrete parametric studies looked at sample
girders of all nine PCBT cross sections used by VDOT. For each cross section shape, the
design model was applied to multiple girders of varying length and level of prestress
49

force. The span-to-depth ratio of the sample girders varied from 15 to 20. For each
shape, as the lengths of the sample girders increased, the level of prestress force also
increased. The maximum number of ½ in. diameter strands which would fit in the PCBT
bottom flange was 48. For the PCBT-29 and PCBT-37 cross sections, the model was run
for sample beams with ½ in. diameter strands only. For the PCBT-45 through PCBT-93
cross sections, the model was run for sample girders with both ½ in. and 0.6 in. strands.
For these sections there was some overlap in prestress force between the sample girders
with ½ in. strands and the sample girders with 0.6 in. strands.
The number of harped strands was determined by the allowable stresses at transfer
in the top and bottom of the beam. This check neglected any loss of prestress force
caused by steel relaxation between tensioning and prestress release. The allowable
stresses at transfer were computed using transformed section properties and the jacking
force. The stresses were computed at the harping point in the extreme tension fiber and
extreme compression fiber of the member. The computed stresses were compared to the
allowable concrete stress limits in section 5.9.4 of AASHTO LRFD.
An Excel spreadsheet was developed which could execute the computations
required to solve the strut-and-tie models. Using the spreadsheet, the girder section
properties, material properties of the concrete and steel, and strand pattern could be input.
The spreadsheet automatically computed the transformed section properties at the harping
point and at a section located a distance h from the beam end; and the tension and
compression stresses in the top and bottom at these locations. Using the Goal Seek
function in Excel, the integration of concrete stress was performed and the strut-and-tie
models could be solved quickly.
The beam end design model was applied to a total of 134 sample beams for the
normal weight concrete parametric study, and 137 test beams for the lightweight concrete
parametric study. The end results of each analysis were the forces in the ties for both
strut-and-tie models. This information was converted into an area of steel using the
stirrup working stress appropriate for the type of concrete. The forces in the ties were
also expressed as a percentage of the jacking force for comparison purposes. The results
for each sample girder were recorded and another sample girder was analyzed. A
50

comprehensive list of all sample girders used in the parametric study is included in
Appendix B.
3.5.3 Parametric Study Results
The parametric study showed that as the magnitude of the prestress force acting
on a particular section increased, the tension forces T1 and T2 would also increase in a
generally linear fashion up to a certain level of prestress force and would then begin to
decrease. A sample of this relationship is shown in Figure 3-15 for the portion of the
parametric study which examined normal weight, PCBT-61 girders with ½ in. strand.
This figure is representative of the results for all cross sections with normal weight and
lightweight concrete and ½ in. strand. The point at which the tension forces began to
decrease varied for each section and depended on the number of strands in the girder. In
many of the sections with 0.6 in. diameter strands this turn over point was never achieved
and the plot increased in a generally linear fashion over the entire range of force analyzed
as shown in Figure 3-16.
0
20
40
60
80
600 800 1000 1200 1400 1600
Pjack (k)
Tens
ion
(k)
T1 T2
Figure 3-15. Force in T1 and T2 for PCBT-61, NWC, ½ in. diameter strand
51

0
20
40
60
80
100
120
1000 1200 1400 1600 1800
Pjack (k)
Tens
ion
(k)
T1 T2
Figure 3-16. Force in T1 and T2 for PCBT-69, NWC, 0.6 in. diameter strands
The relationship between the tension forces and prestress force is intuitive. As the
magnitude of the applied prestress force increases, it is reasonable to expect a greater
vertical tension force to develop from the diffusion of this force. As the number of
strands increases, eventually the bottom flange will become full. When this occurs, then
the centroid of the prestress force will be higher in the cross section and the force will not
have as great of a vertical distance over which to diffuse. This accounts for the slight
decrease in tension force when a very high prestress force was applied such as in Figure
3-15.
The eccentricity of the prestress force is an important factor in the magnitude of
the forces in the ties. It was observed that sample girders with the same cross section and
same magnitude of prestress force provided by ½ in. strand and 0.6 in. strand would have
a significantly higher tension force when the prestress was provided with 0.6 in. strand.
Table 3-1 shows the tension forces T1 and T2 for the PCBT-77 with 48 ½ in. diameter
strands and 34 0.6 in. diameters strands. The overall prestress force provided by the two
strand patterns is almost the same; however, the tension forces from the strut-and-tie
models are different. The increase in the tension forces between the ½ in. strand girder
and the 0.6 in. strand girder is about 19 percent. This example illustrates that girders with
52
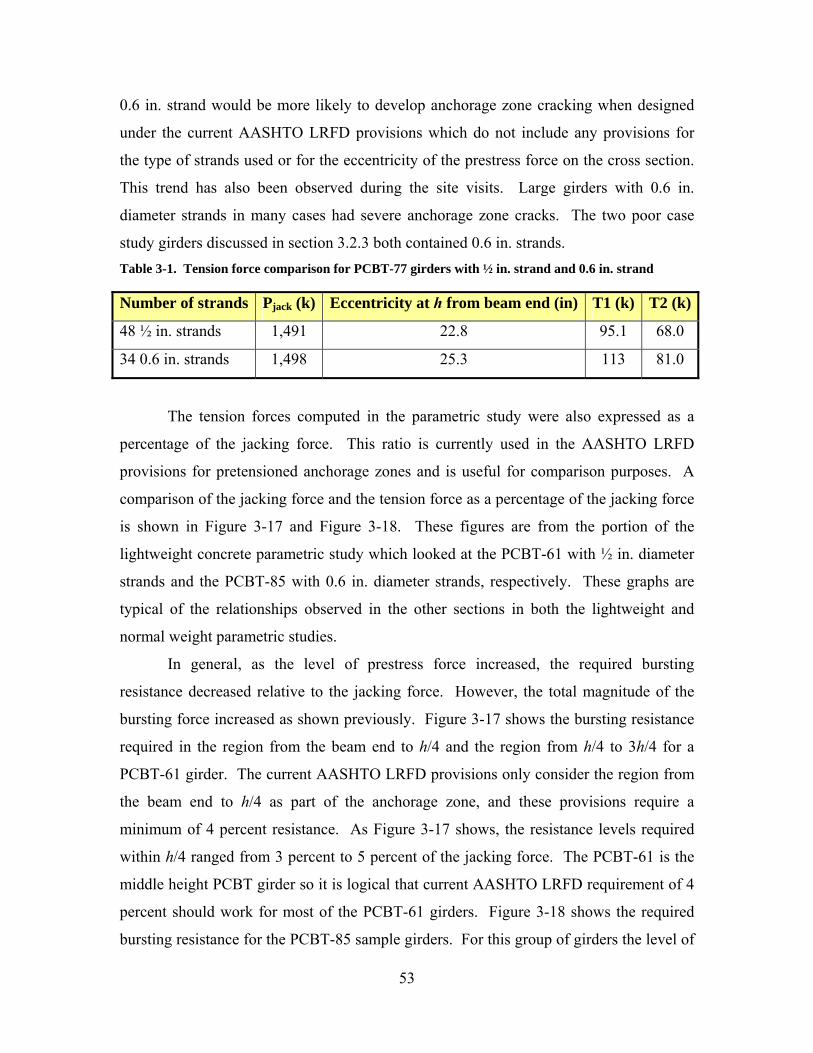
0.6 in. strand would be more likely to develop anchorage zone cracking when designed
under the current AASHTO LRFD provisions which do not include any provisions for
the type of strands used or for the eccentricity of the prestress force on the cross section.
This trend has also been observed during the site visits. Large girders with 0.6 in.
diameter strands in many cases had severe anchorage zone cracks. The two poor case
study girders discussed in section 3.2.3 both contained 0.6 in. strands. Table 3-1. Tension force comparison for PCBT-77 girders with ½ in. strand and 0.6 in. strand
Number of strands Pjack (k) Eccentricity at h from beam end (in) T1 (k) T2 (k)
48 ½ in. strands 1,491 22.8 95.1 68.0
34 0.6 in. strands 1,498 25.3 113 81.0
The tension forces computed in the parametric study were also expressed as a
percentage of the jacking force. This ratio is currently used in the AASHTO LRFD
provisions for pretensioned anchorage zones and is useful for comparison purposes. A
comparison of the jacking force and the tension force as a percentage of the jacking force
is shown in Figure 3-17 and Figure 3-18. These figures are from the portion of the
lightweight concrete parametric study which looked at the PCBT-61 with ½ in. diameter
strands and the PCBT-85 with 0.6 in. diameter strands, respectively. These graphs are
typical of the relationships observed in the other sections in both the lightweight and
normal weight parametric studies.
In general, as the level of prestress force increased, the required bursting
resistance decreased relative to the jacking force. However, the total magnitude of the
bursting force increased as shown previously. Figure 3-17 shows the bursting resistance
required in the region from the beam end to h/4 and the region from h/4 to 3h/4 for a
PCBT-61 girder. The current AASHTO LRFD provisions only consider the region from
the beam end to h/4 as part of the anchorage zone, and these provisions require a
minimum of 4 percent resistance. As Figure 3-17 shows, the resistance levels required
within h/4 ranged from 3 percent to 5 percent of the jacking force. The PCBT-61 is the
middle height PCBT girder so it is logical that current AASHTO LRFD requirement of 4
percent should work for most of the PCBT-61 girders. Figure 3-18 shows the required
bursting resistance for the PCBT-85 sample girders. For this group of girders the level of
53

bursting resistance required within h/4 ranged from approximately 4.75 percent to 5.5
percent of the jacking force. This suggests the current minimum requirement of 4 percent
resistance will be insufficient to control cracks in deep girders which corresponds directly
to the field observations already highlighted.
0%
1%
2%
3%
4%
5%
6%
600 800 1000 1200 1400 1600
Pjack (k)
Perc
ent o
f Pja
ck
Stirrups within h/4 Stirrups within h/4 to 3h/4
Figure 3-17. Required bursting resistance, PCBT-61, LWC, ½ in. strand
0%
1%
2%
3%
4%
5%
6%
1000 1200 1400 1600 1800 2000 2200
Pjack (k)
Perc
ent o
f Pja
ck
Stirrups within h/4 Stirrups within h/4 to 3h/4
Figure 3-18. Required bursting resistance, PCBT-85, LWC, 0.6 in. strand
54

The relationship in Figure 3-18 and Figure 3-17 is important when considering the
design of girders that are used as drop in segments. These girders typically have a very
low level of prestress force and by the trend in Figure 3-18 the required bursting
resistance would be a very high percent of Pjack. Consider for example the PCBT-93 with
16 0.6 in. diameter strands that is used as a drop in girder discussed in section 3.2.5. The
bursting resistance required for this girder within h/4 from the end of the beam would be
approximately 7.8 percent of Pjack. This value seems very high when compared to the
current minimum of 4 percent; however, since the level of prestress force is so low for
this girder, providing a bursting resistance of 7.8 percent Pjack would still result in a
reasonable spacing of stirrups.
3.5.4 Development of Design Tables
The results of the parametric study were used to develop anchorage zone design
tables for all nine PCBT cross section shapes used by VDOT. Several attempts were first
made to develop design equations through linear regression and the graphs in Figure
3-17, Figure 3-18, and from similar graphs for the other cross sections. It was found that
the equations from the linear regression were different for each cross section. Based on
this it was decided to create design tables for each cross section rather than develop a
different design equation for each shape. The design tables provide the area of stirrups
required within h/4 from the end and between h/4 and 3h/4. These areas were directly
obtained through the results of the sample girders in the parametric study. A sample
anchorage zone design table is shown in Table 3-2 for PCBT-61 girders with normal
weight concrete. Tables for all PCBT cross sections are included in Appendix C.
As shown in Figure 3-15 the tension forces began to decrease as the prestress
force increased beyond a certain level for the sample girders which contained ½ in.
diameter strands. In developing the anchorage zone design tables, the tension forces
obtained from the strut-and-tie analysis were divided by the appropriate working stress
for the given type of concrete to determine the steel required to resist these forces. At
high levels of prestress force where the tension forces began to decrease, the required
stirrup areas in each region of the anchorage zone also decreased. For the anchorage
zone design tables, however, the area of steel was not decreased at the high prestress
55
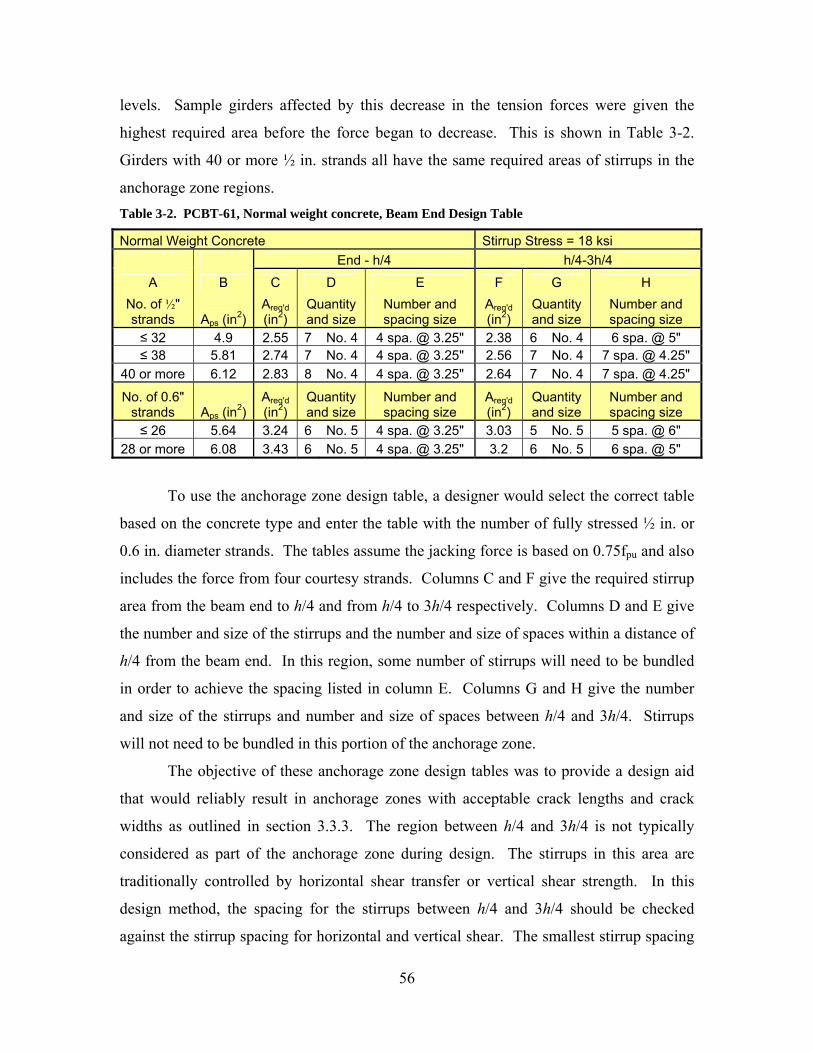
levels. Sample girders affected by this decrease in the tension forces were given the
highest required area before the force began to decrease. This is shown in Table 3-2.
Girders with 40 or more ½ in. strands all have the same required areas of stirrups in the
anchorage zone regions. Table 3-2. PCBT-61, Normal weight concrete, Beam End Design Table
Normal Weight Concrete Stirrup Stress = 18 ksi End - h/4 h/4-3h/4
A B C D E F G H No. of ½" strands Aps (in2)
Areq'd (in2)
Quantity and size
Number and spacing size
Areq'd (in2)
Quantity and size
Number and spacing size
≤ 32 4.9 2.55 7 No. 4 4 spa. @ 3.25" 2.38 6 No. 4 6 spa. @ 5" ≤ 38 5.81 2.74 7 No. 4 4 spa. @ 3.25" 2.56 7 No. 4 7 spa. @ 4.25"
40 or more 6.12 2.83 8 No. 4 4 spa. @ 3.25" 2.64 7 No. 4 7 spa. @ 4.25"
No. of 0.6" strands Aps (in2)
Areq'd (in2)
Quantity and size
Number and spacing size
Areq'd (in2)
Quantity and size
Number and spacing size
≤ 26 5.64 3.24 6 No. 5 4 spa. @ 3.25" 3.03 5 No. 5 5 spa. @ 6" 28 or more 6.08 3.43 6 No. 5 4 spa. @ 3.25" 3.2 6 No. 5 6 spa. @ 5"
To use the anchorage zone design table, a designer would select the correct table
based on the concrete type and enter the table with the number of fully stressed ½ in. or
0.6 in. diameter strands. The tables assume the jacking force is based on 0.75fpu and also
includes the force from four courtesy strands. Columns C and F give the required stirrup
area from the beam end to h/4 and from h/4 to 3h/4 respectively. Columns D and E give
the number and size of the stirrups and the number and size of spaces within a distance of
h/4 from the beam end. In this region, some number of stirrups will need to be bundled
in order to achieve the spacing listed in column E. Columns G and H give the number
and size of the stirrups and number and size of spaces between h/4 and 3h/4. Stirrups
will not need to be bundled in this portion of the anchorage zone.
The objective of these anchorage zone design tables was to provide a design aid
that would reliably result in anchorage zones with acceptable crack lengths and crack
widths as outlined in section 3.3.3. The region between h/4 and 3h/4 is not typically
considered as part of the anchorage zone during design. The stirrups in this area are
traditionally controlled by horizontal shear transfer or vertical shear strength. In this
design method, the spacing for the stirrups between h/4 and 3h/4 should be checked
against the stirrup spacing for horizontal and vertical shear. The smallest stirrup spacing
56
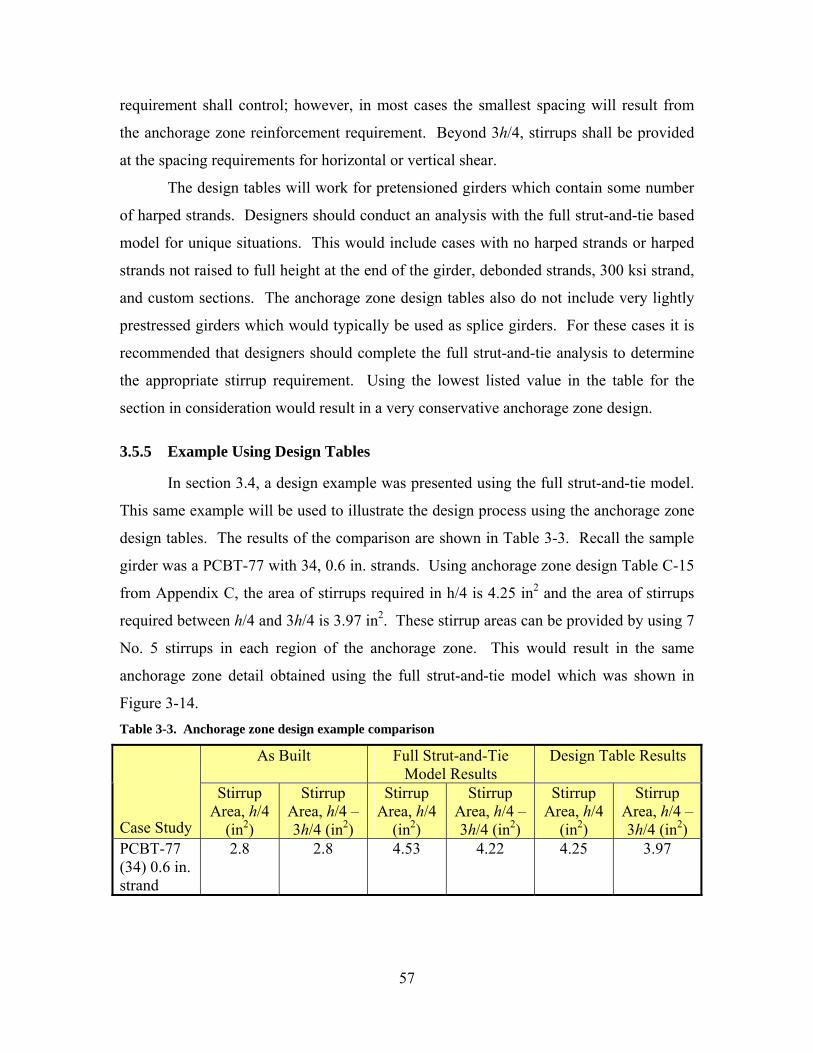
requirement shall control; however, in most cases the smallest spacing will result from
the anchorage zone reinforcement requirement. Beyond 3h/4, stirrups shall be provided
at the spacing requirements for horizontal or vertical shear.
The design tables will work for pretensioned girders which contain some number
of harped strands. Designers should conduct an analysis with the full strut-and-tie based
model for unique situations. This would include cases with no harped strands or harped
strands not raised to full height at the end of the girder, debonded strands, 300 ksi strand,
and custom sections. The anchorage zone design tables also do not include very lightly
prestressed girders which would typically be used as splice girders. For these cases it is
recommended that designers should complete the full strut-and-tie analysis to determine
the appropriate stirrup requirement. Using the lowest listed value in the table for the
section in consideration would result in a very conservative anchorage zone design.
3.5.5 Example Using Design Tables
In section 3.4, a design example was presented using the full strut-and-tie model.
This same example will be used to illustrate the design process using the anchorage zone
design tables. The results of the comparison are shown in Table 3-3. Recall the sample
girder was a PCBT-77 with 34, 0.6 in. strands. Using anchorage zone design Table C-15
from Appendix C, the area of stirrups required in h/4 is 4.25 in2 and the area of stirrups
required between h/4 and 3h/4 is 3.97 in2. These stirrup areas can be provided by using 7
No. 5 stirrups in each region of the anchorage zone. This would result in the same
anchorage zone detail obtained using the full strut-and-tie model which was shown in
Figure 3-14. Table 3-3. Anchorage zone design example comparison
As Built Full Strut-and-Tie Model Results
Design Table Results
Case Study
Stirrup Area, h/4
(in2)
Stirrup Area, h/4 – 3h/4 (in2)
Stirrup Area, h/4
(in2)
Stirrup Area, h/4 – 3h/4 (in2)
Stirrup Area, h/4
(in2)
Stirrup Area, h/4 – 3h/4 (in2)
PCBT-77 (34) 0.6 in. strand
2.8 2.8 4.53 4.22 4.25 3.97
57

3.5.6 Alternate Strut-and-Tie Design Model
An alternate strut-and-tie anchorage zone design model is presented in this section
which has been calibrated to produce very similar results to the proposed design model.
The alternate strut-and-tie model shown in Figure 3-19 was developed to produce
required stirrup areas which closely match those from the design tables, and adhere to the
fundamental theories used in strut-and-tie modeling. One of the problems with the
proposed strut-and-tie based model design approach is that the upper and lower strut-and-
tie models are solved independently. Even though there is some overlapping between the
ties in the upper and lower models, neither model considers the presence of the other
when they are solved. (Dr. Carin L. Roberts-Wollmann, office conversation, January 12,
2007)
The strut-and-tie model shown in Figure 3-19 is a true double-tie, strut-and-tie
model of an anchorage zone. From the results of the parametric study and the
development of the design tables, it was clear that the required stirrup area within h/4 and
between h/4 and 3h/4 are always very similar. In many cases, the number of stirrups in
the two anchorage zone regions will be the same. From this observation, the angles in the
ties in the model in Figure 3-19 are set so that the forces T1 and T2 are equal. The
location of the compression strut is placed at a distance of 3h/4 from the beam end as
opposed to a distance h. This calibration is necessary to ensure this alternate strut-and-tie
model provides the same results as the proposed model.
58
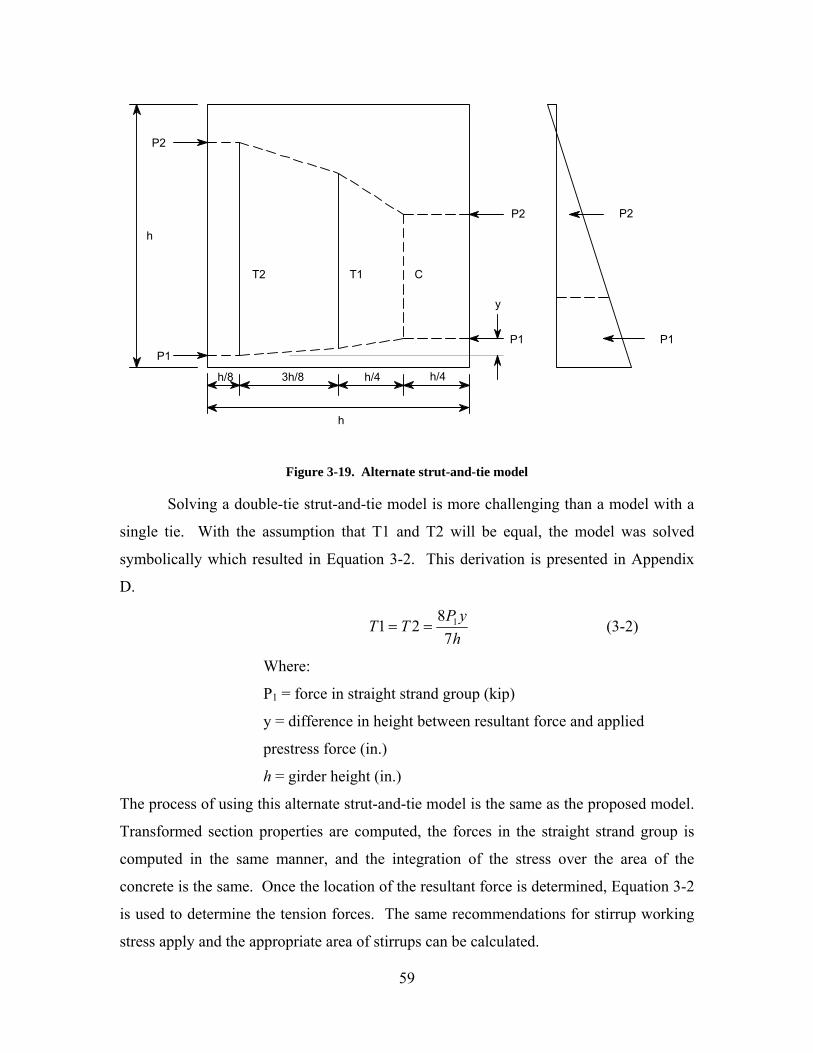
P2
P1
T2 T1 C
P2
P1
h/8 3h/8 h/4 h/4
h
h
P1
P2
y
Figure 3-19. Alternate strut-and-tie model
Solving a double-tie strut-and-tie model is more challenging than a model with a
single tie. With the assumption that T1 and T2 will be equal, the model was solved
symbolically which resulted in Equation 3-2. This derivation is presented in Appendix
D.
hyPTT
7821 1== (3-2)
Where:
P1 = force in straight strand group (kip)
y = difference in height between resultant force and applied
prestress force (in.)
h = girder height (in.)
The process of using this alternate strut-and-tie model is the same as the proposed model.
Transformed section properties are computed, the forces in the straight strand group is
computed in the same manner, and the integration of the stress over the area of the
concrete is the same. Once the location of the resultant force is determined, Equation 3-2
is used to determine the tension forces. The same recommendations for stirrup working
stress apply and the appropriate area of stirrups can be calculated.
59
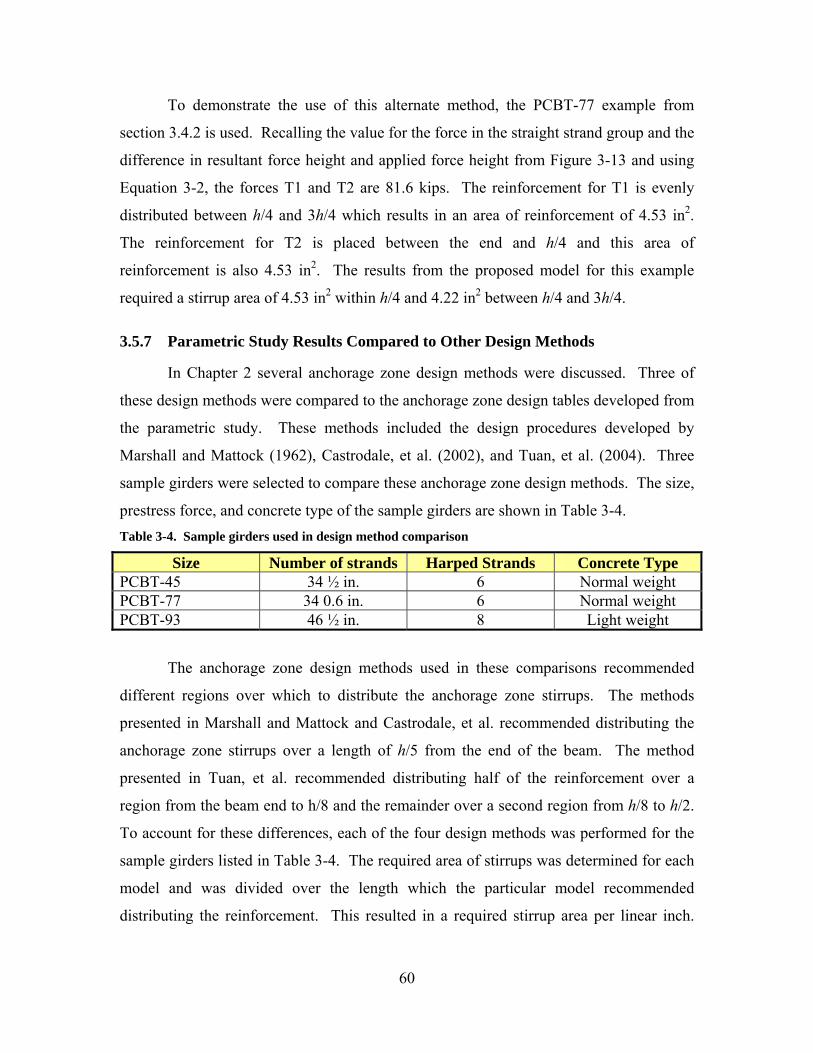
To demonstrate the use of this alternate method, the PCBT-77 example from
section 3.4.2 is used. Recalling the value for the force in the straight strand group and the
difference in resultant force height and applied force height from Figure 3-13 and using
Equation 3-2, the forces T1 and T2 are 81.6 kips. The reinforcement for T1 is evenly
distributed between h/4 and 3h/4 which results in an area of reinforcement of 4.53 in2.
The reinforcement for T2 is placed between the end and h/4 and this area of
reinforcement is also 4.53 in2. The results from the proposed model for this example
required a stirrup area of 4.53 in2 within h/4 and 4.22 in2 between h/4 and 3h/4.
3.5.7 Parametric Study Results Compared to Other Design Methods
In Chapter 2 several anchorage zone design methods were discussed. Three of
these design methods were compared to the anchorage zone design tables developed from
the parametric study. These methods included the design procedures developed by
Marshall and Mattock (1962), Castrodale, et al. (2002), and Tuan, et al. (2004). Three
sample girders were selected to compare these anchorage zone design methods. The size,
prestress force, and concrete type of the sample girders are shown in Table 3-4. Table 3-4. Sample girders used in design method comparison
Size Number of strands Harped Strands Concrete Type PCBT-45 34 ½ in. 6 Normal weight PCBT-77 34 0.6 in. 6 Normal weight PCBT-93 46 ½ in. 8 Light weight
The anchorage zone design methods used in these comparisons recommended
different regions over which to distribute the anchorage zone stirrups. The methods
presented in Marshall and Mattock and Castrodale, et al. recommended distributing the
anchorage zone stirrups over a length of h/5 from the end of the beam. The method
presented in Tuan, et al. recommended distributing half of the reinforcement over a
region from the beam end to h/8 and the remainder over a second region from h/8 to h/2.
To account for these differences, each of the four design methods was performed for the
sample girders listed in Table 3-4. The required area of stirrups was determined for each
model and was divided over the length which the particular model recommended
distributing the reinforcement. This resulted in a required stirrup area per linear inch.
60
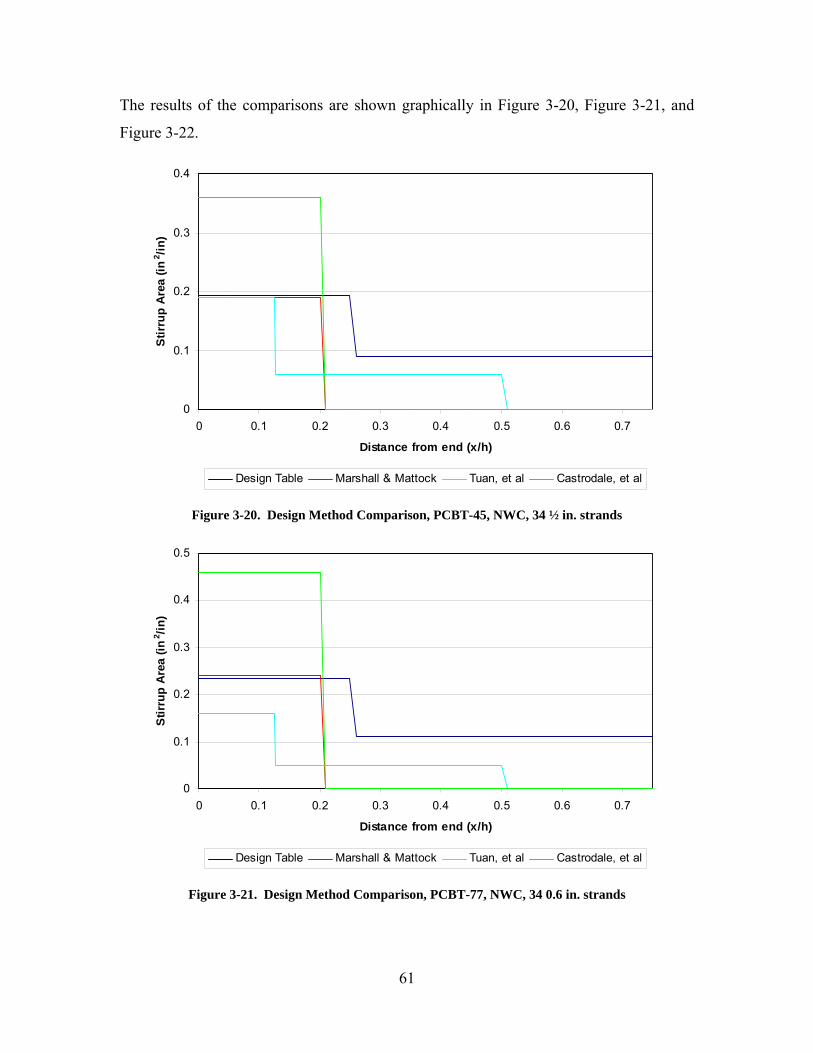
The results of the comparisons are shown graphically in Figure 3-20, Figure 3-21, and
Figure 3-22.
0
0.1
0.2
0.3
0.4
0 0.1 0.2 0.3 0.4 0.5 0.6 0.7
Distance from end (x/h)
Stir
rup
Are
a (in
2 /in)
Design Table Marshall & Mattock Tuan, et al Castrodale, et al
Figure 3-20. Design Method Comparison, PCBT-45, NWC, 34 ½ in. strands
0
0.1
0.2
0.3
0.4
0.5
0 0.1 0.2 0.3 0.4 0.5 0.6 0.7
Distance from end (x/h)
Stir
rup
Are
a (in
2 /in)
Design Table Marshall & Mattock Tuan, et al Castrodale, et al
Figure 3-21. Design Method Comparison, PCBT-77, NWC, 34 0.6 in. strands
61
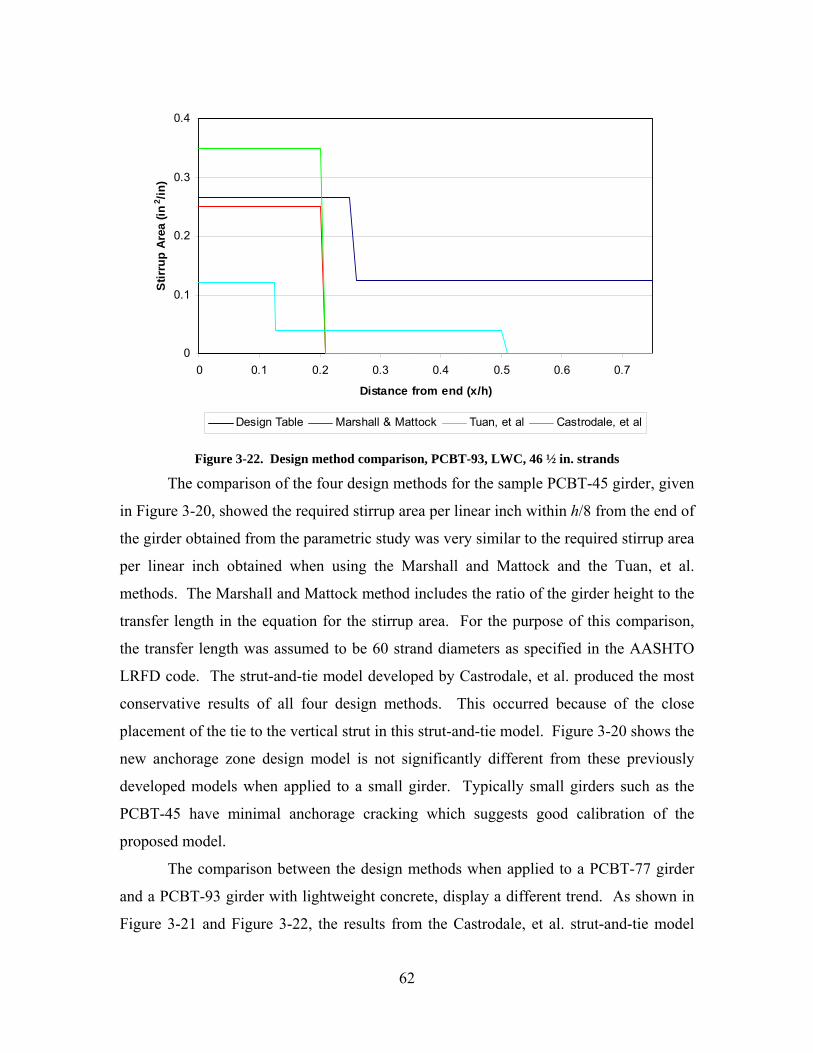
0
0.1
0.2
0.3
0.4
0 0.1 0.2 0.3 0.4 0.5 0.6 0.7
Distance from end (x/h)
Stirr
up A
rea
(in2 /in
)
Design Table Marshall & Mattock Tuan, et al Castrodale, et al
Figure 3-22. Design method comparison, PCBT-93, LWC, 46 ½ in. strands
The comparison of the four design methods for the sample PCBT-45 girder, given
in Figure 3-20, showed the required stirrup area per linear inch within h/8 from the end of
the girder obtained from the parametric study was very similar to the required stirrup area
per linear inch obtained when using the Marshall and Mattock and the Tuan, et al.
methods. The Marshall and Mattock method includes the ratio of the girder height to the
transfer length in the equation for the stirrup area. For the purpose of this comparison,
the transfer length was assumed to be 60 strand diameters as specified in the AASHTO
LRFD code. The strut-and-tie model developed by Castrodale, et al. produced the most
conservative results of all four design methods. This occurred because of the close
placement of the tie to the vertical strut in this strut-and-tie model. Figure 3-20 shows the
new anchorage zone design model is not significantly different from these previously
developed models when applied to a small girder. Typically small girders such as the
PCBT-45 have minimal anchorage cracking which suggests good calibration of the
proposed model.
The comparison between the design methods when applied to a PCBT-77 girder
and a PCBT-93 girder with lightweight concrete, display a different trend. As shown in
Figure 3-21 and Figure 3-22, the results from the Castrodale, et al. strut-and-tie model
62

again resulted in the highest concentration of stirrup area for reasons previously
discussed. The results from the proposed model and the Marshall and Mattock method
are similar for the PCBT-77 and PCBT-93; however, for both of these sample girders, the
Marshall and Mattock method would produce conservative results according to the
recommendations in their 1962 study. In this study Marshall and Mattock stated that
their design equation would produce conservative results when the ratio of the girder
height to the transfer length exceeded 2. Assuming a 60 strand diameter transfer length,
this ratio would equal 2.1 for the beam in Figure 3-21 and 3.1 for the beam in Figure
3-22. The results from the proposed model were significantly higher than the results
obtained from the Tuan, et al. method for both sample girders.
The Castrodale, et al. strut-and-tie model and the design table method result in a
similar stirrup area required near the beam end for the lightweight PCBT-93 girder. The
total stirrup area required within h/5 from the Castrodale, et al. model was 6.5 in2, and the
total stirrup area required within h/4 from the design table was 6.16 in2. The Castrodale,
et al. model results tend to be very conservative for most girders; however, in this case
with a very deep girder made with lightweight concrete the results are relatively close to
the design table method. It should be noted, that the Castrodale, et al. model places all of
the anchorage zone reinforcement within h/5 and from field observations, a dense region
of stirrups at the very end of the girder will not control the formation of diagonal web
cracks.
Although the results from the proposed model for the comparison with the PCBT-
77 sample girder and PCBT-93 sample girder showed a high required stirrup area in the
anchorage zone, it is believed this level of reinforcement is necessary to control
anchorage zone cracking. As the case studies in section 3.2 illustrate, large girders with
high levels of prestress force tend to develop numerous anchorage zone cracks. These
cracks tend to be very long and may also be very wide and require additional repair work.
The cost of providing several additional stirrups at each end of the girder is almost
negligible in comparison to the overall cost of a large girder and is significantly less than
the cost of repairing a damaged anchorage zone with epoxy injection. Also, lifetime
inspection is greatly complicated when damage is noted and must be monitored.
63

A main concern with providing additional stirrups in the anchorage zone is
creating too much congestion which would lead to poor consolidation of the concrete.
This concern can be overcome by using larger diameter stirrups, such as No. 5 bars, and
by bundling some stirrups between the end and h/4. The stirrups between h/4 and 3h/4
should typically not need to be bundled to achieve a reasonable spacing. Field
observations indicate that heavy anchorage zone reinforcement has a negligible influence
on the quality of casting. Bundled No. 5 bars spaced at 3-½ in. allow for plenty of
clearance for internal vibration.
3.5.8 Parametric Study Results Compared to Other Bridge Design Codes
Design provisions from AASHTO LRFD, the Australian Bridge Design Code,
and the Canadian Highway Bridge Design Code were presented in section 2.3. These
design codes were applied to the sample girders from the portions of the parametric study
that analyzed PCBT-45 girders with ½ in. strand and normal weight concrete, PCBT-77
girders with normal weight concrete and 0.6 in. strand, and PCBT-93 girders with
lightweight concrete and ½ in. strand. The results were compared to the results from the
proposed design model. All three of these design codes require the anchorage zone
reinforcement to be placed within h/4 from the end of the girder and do not consider the
region between h/4 and 3h/4 as part of the anchorage zone. For this comparison only the
stirrup area required within h/4 obtained from the proposed model was used for the
following graphs. These three comparisons are shown in Figure 3-23, Figure 3-24 and
Figure 3-25.
Figure 3-23 illustrates the comparison between the three design code provisions
and the proposed model for the sample PCBT-45 girders with ½ in. strand and normal
weight concrete from the parametric study. Typical PCBT-45 girders cast in Virginia
would have a level of prestress which would fall in the middle to the upper range of this
figure. In this region there is very little difference in the area of stirrups required within
h/4 between the three design codes and the proposed model. The area of steel required
by the proposed model between h/4 and 3h/4 is slightly less than the area required within
h/4. The AASHTO LRFD and Australian Bridge Design Code have almost identical
provisions, except for a different stirrup working stress. The Australian Code allows for a
64
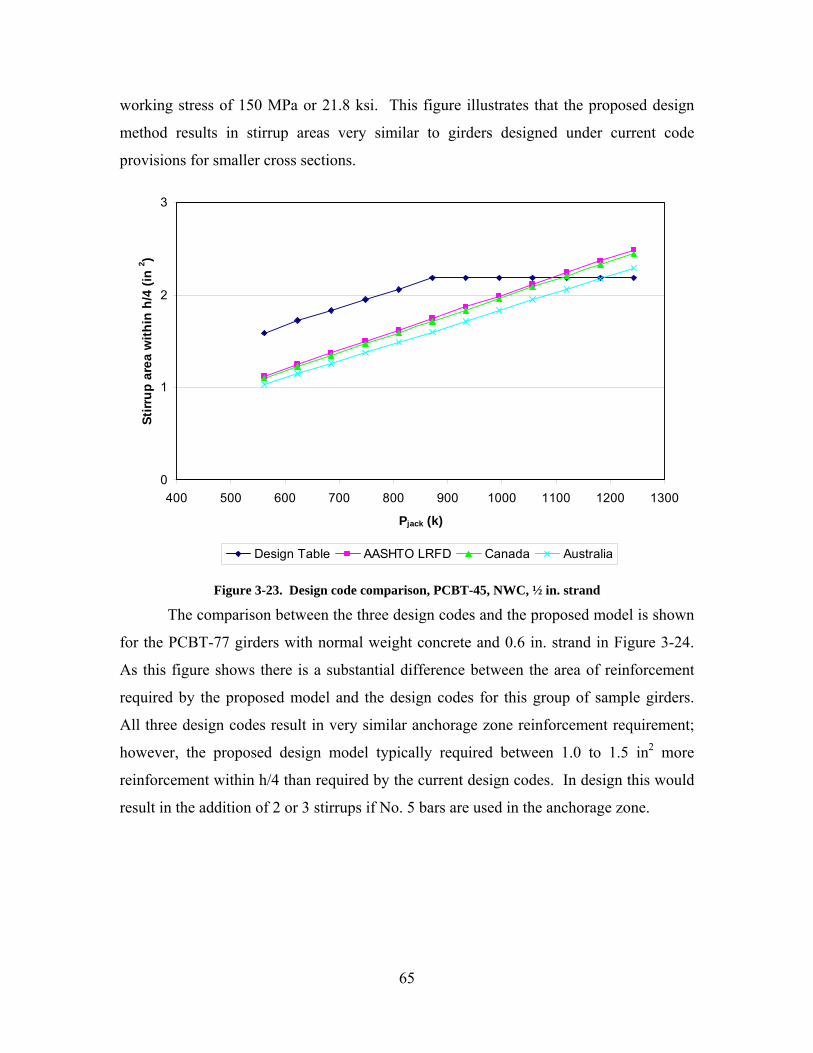
working stress of 150 MPa or 21.8 ksi. This figure illustrates that the proposed design
method results in stirrup areas very similar to girders designed under current code
provisions for smaller cross sections.
0
1
2
3
400 500 600 700 800 900 1000 1100 1200 1300
Pjack (k)
Stirr
up a
rea
with
in h
/4 (i
n2 )
Design Table AASHTO LRFD Canada Australia
Figure 3-23. Design code comparison, PCBT-45, NWC, ½ in. strand
The comparison between the three design codes and the proposed model is shown
for the PCBT-77 girders with normal weight concrete and 0.6 in. strand in Figure 3-24.
As this figure shows there is a substantial difference between the area of reinforcement
required by the proposed model and the design codes for this group of sample girders.
All three design codes result in very similar anchorage zone reinforcement requirement;
however, the proposed design model typically required between 1.0 to 1.5 in2 more
reinforcement within h/4 than required by the current design codes. In design this would
result in the addition of 2 or 3 stirrups if No. 5 bars are used in the anchorage zone.
65
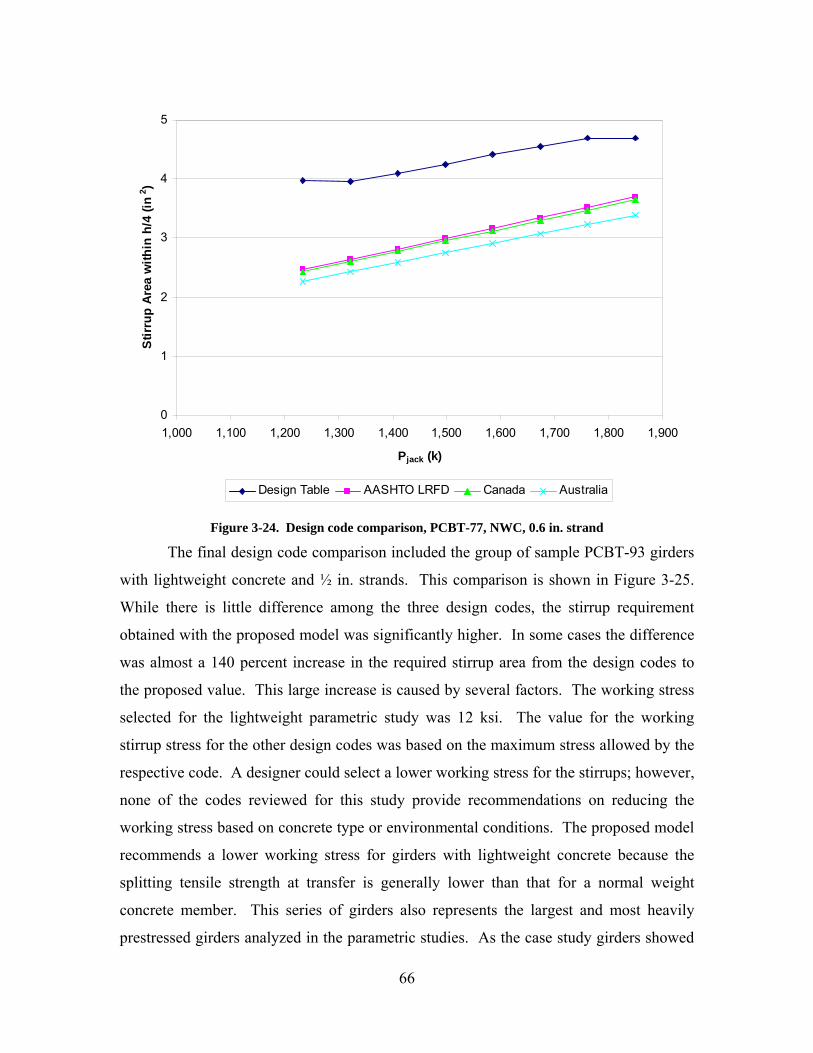
0
1
2
3
4
5
1,000 1,100 1,200 1,300 1,400 1,500 1,600 1,700 1,800 1,900
Pjack (k)
Stir
rup
Area
with
in h
/4 (i
n2 )
Design Table AASHTO LRFD Canada Australia
Figure 3-24. Design code comparison, PCBT-77, NWC, 0.6 in. strand
The final design code comparison included the group of sample PCBT-93 girders
with lightweight concrete and ½ in. strands. This comparison is shown in Figure 3-25.
While there is little difference among the three design codes, the stirrup requirement
obtained with the proposed model was significantly higher. In some cases the difference
was almost a 140 percent increase in the required stirrup area from the design codes to
the proposed value. This large increase is caused by several factors. The working stress
selected for the lightweight parametric study was 12 ksi. The value for the working
stirrup stress for the other design codes was based on the maximum stress allowed by the
respective code. A designer could select a lower working stress for the stirrups; however,
none of the codes reviewed for this study provide recommendations on reducing the
working stress based on concrete type or environmental conditions. The proposed model
recommends a lower working stress for girders with lightweight concrete because the
splitting tensile strength at transfer is generally lower than that for a normal weight
concrete member. This series of girders also represents the largest and most heavily
prestressed girders analyzed in the parametric studies. As the case study girders showed
66

in section 3.2, the large, heavily prestressed girders typically displayed the most severe
anchorage zone cracking. It is reasonable to expect that a significantly greater area of
reinforcement would be required for these girders in comparison to current anchorage
zone designs.
0
2
4
6
8
1,000 1,100 1,200 1,300 1,400 1,500 1,600
Pjack (k)
Stirr
up a
rea
with
in h
/4 (i
n2 )
Design Table AASHTO LRFD Canada Australia
Figure 3-25. Design code comparison, PCBT-93, LWC, ½ in. strand
3.5.9 Parametric Study Results Compared to Case Study Girders
The results from the parametric study were compared to the case study girders
presented in section 3.2. A comparison was made between the actual area of stirrups
placed within h/4 in each case study girder and the stirrup area required by the
appropriate design table for a girder with the same number of strands. This comparison is
shown in Table 3-5. A second comparison was made between the actual area of stirrups
within h/4 and 3h/4 in the case study girders and the area required in this region
according to the appropriate design tables. This comparison is shown in Table 3-6.
67

Table 3-5. Comparison of stirrup area within h/4 for case study girders and design tables
Case Study Girder
Rating of cracking within h/4
Actual Stirrup Area
(in2)
Design Table Required Stirrup
Area (in2)
Required/ Actual
PCBT-53 Acceptable 3.1 2.44 0.77 PCBT-61 Acceptable 2.8 2.83 1.01 PCBT-77 (34 0.6 in. strands)
Unacceptable 2.8 3.92 1.40
PCBT-77 (30 0.6 in. strands)
Unacceptable 2.0 3.69 1.85
PCBT-93 Unacceptable 3.47 6.10 1.76 Table 3-6. Comparison of stirrup area between h/4 and 3h/4 for case study girders and design tables
Case Study Girder
Rating of cracking within h/4 - 3h/4
Actual Stirrup Area (in2)
Design Table Required Stirrup
Area (in2)
Required/ Actual
PCBT-53 Unacceptable 1.6 2.28 1.43 PCBT-61 Acceptable 3.2 2.64 0.82 PCBT-77 (34 0.6 in. strands)
Unacceptable 2.8 3.97 1.42
PCBT-77 (30 0.6 in. strands)
Unacceptable 2.4 3.70 1.54
PCBT-93 Unacceptable Unknown 5.69 N/A
Two of the case study girders examined had an acceptable level of cracks within a
length of h/4 from the end of the beam. The ratio of the required stirrup area from the
design table to the actual stirrup area for the PCBT-53 and PCBT-61 case study girders
was ≤ 1.0 which would suggest that these girders had adequate vertical resistance in this
region of the anchorage zone. It is important to note that if these girders were redesigned
using the proposed design tables, the actual area of stirrup provided may be slightly
higher than the value in the fourth column of Table 3-5 based on the size and number of
bars selected. The other three case study girders had unacceptable cracking within h/4,
and as Table 3-5 shows, the ratio of the required stirrup area from the design table and the
actual stirrup area provided was ≥ 1.0 for these girders. This suggests these girders did
not have sufficient vertical resistance in h/4 to properly control the lengths of the cracks.
68

All of the case study girders experienced some diagonal cracking. The PCBT-61
case study girder was the only beam in which the diagonal crack terminated within an
acceptable length of h/2. Table 3-6 shows the ratio of the required stirrup area to the
actual stirrup area was 0.82 for this girder, which would indicate this girder was
adequately designed. The remainder of the case study girders had cracking which
extended well beyond h/2 and the areas of reinforcement required by the design tables
were all significantly higher than the areas provided. Due to the extensive cracking
which may extend out to 75 percent of the height of the girder in some cases, the results
in Table 3-6 indicate the length of the region affected by the diffusion of prestress force is
greater than h/4. To control the propagation of the diagonal web cracking seen in the
VDOT PCBT girders, a dense region of stirrups is needed between h/4 and 3h/4. The
proposed design process was specifically calibrated to ensure adequate reinforcement is
provided in this region to control the propagation of these diagonal cracks.
A comparison was also conducted for the “drop-in” girder shown in section 3.2.5.
The area of reinforcement provided in this girder within h/4 was 1.24 in2. The full strut-
and-tie model analysis was performed on this girder. The area of reinforcement required
within h/4 obtained from the model was 4.34 in2. The area of reinforcement provided in
the girder from h/4 to 3h/4 was 2.48 in2 and the corresponding required area obtained
from the strut-and-tie model was 4.05 in2. The stirrup requirements from the proposed
model are much greater than the area provided; however, cracking in the end region of
this girder could adversely affect the structural performance of the member. Providing
the additional area of reinforcement would not significantly increase the cost of the girder
or add significant congestion to the end region and is necessary to limit the formation of
these cracks.
3.6 Development of New Standard Details for VDOT
3.6.1 Overview of New Details
Standard details were developed for VDOT which incorporate the aspects of the
proposed design model. The standard details were developed to be used in conjunction
with the design tables given in Appendix C. To include elements of the design model,
the end of the girder was divided into two regions. One region of the anchorage zone
69
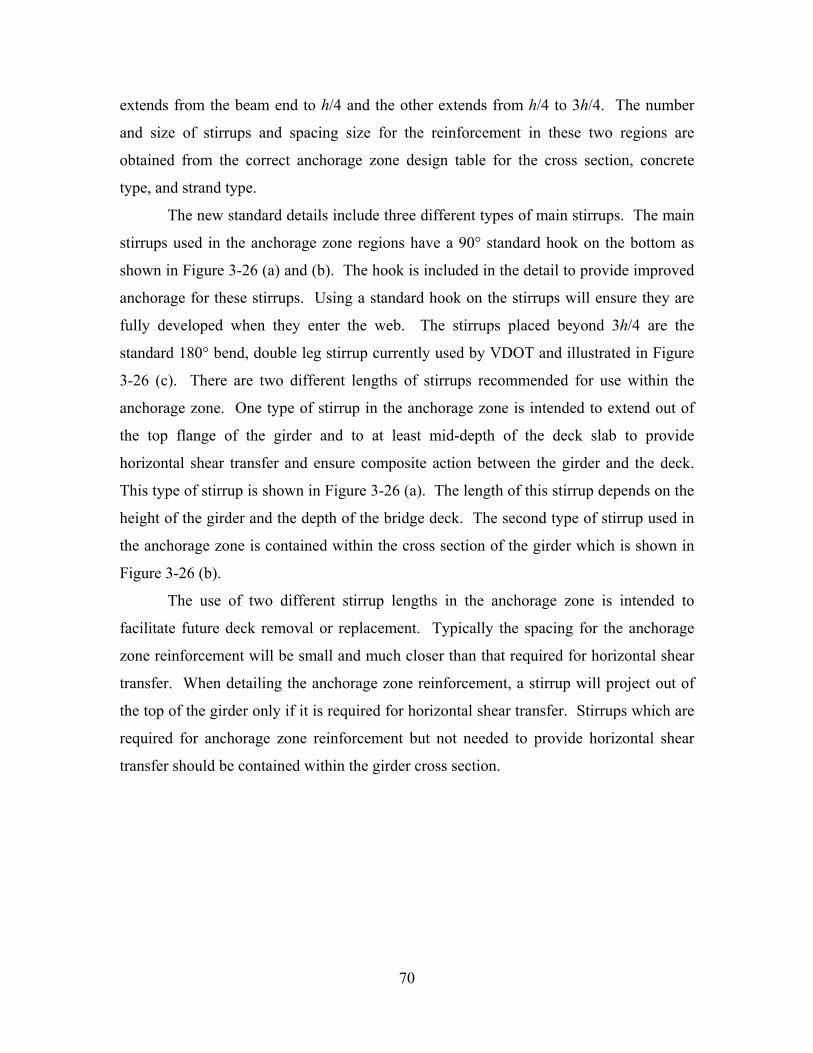
extends from the beam end to h/4 and the other extends from h/4 to 3h/4. The number
and size of stirrups and spacing size for the reinforcement in these two regions are
obtained from the correct anchorage zone design table for the cross section, concrete
type, and strand type.
The new standard details include three different types of main stirrups. The main
stirrups used in the anchorage zone regions have a 90° standard hook on the bottom as
shown in Figure 3-26 (a) and (b). The hook is included in the detail to provide improved
anchorage for these stirrups. Using a standard hook on the stirrups will ensure they are
fully developed when they enter the web. The stirrups placed beyond 3h/4 are the
standard 180° bend, double leg stirrup currently used by VDOT and illustrated in Figure
3-26 (c). There are two different lengths of stirrups recommended for use within the
anchorage zone. One type of stirrup in the anchorage zone is intended to extend out of
the top flange of the girder and to at least mid-depth of the deck slab to provide
horizontal shear transfer and ensure composite action between the girder and the deck.
This type of stirrup is shown in Figure 3-26 (a). The length of this stirrup depends on the
height of the girder and the depth of the bridge deck. The second type of stirrup used in
the anchorage zone is contained within the cross section of the girder which is shown in
Figure 3-26 (b).
The use of two different stirrup lengths in the anchorage zone is intended to
facilitate future deck removal or replacement. Typically the spacing for the anchorage
zone reinforcement will be small and much closer than that required for horizontal shear
transfer. When detailing the anchorage zone reinforcement, a stirrup will project out of
the top of the girder only if it is required for horizontal shear transfer. Stirrups which are
required for anchorage zone reinforcement but not needed to provide horizontal shear
transfer should be contained within the girder cross section.
70

(a) (b) (c)
BS0401
BS0403
BS0402
BS0404 BS0405
BS0402
BS0401
Figure 3-26. Proposed stirrup types
Another change to the reinforcement detailing pertained to the confinement
reinforcement. The current VDOT standard detail uses confinement reinforcement which
is open at the top. The new confinement reinforcement detail is crossed at the top as
illustrated in Figure 3-26 (a) and (b). This detail is added to help control the cracks
which frequently develop at the second fillet between the bottom flange and web. The
current VDOT standard detail includes two No. 5 longitudinal bars in the bottom flange
which are recommended for removal and are not shown in this detail. These bars are
unnecessary and will absorb prestress force which is intended to enter the concrete. The
cross section views shown in Figure 3-26 all include four courtesy strands in the top
flange. These strands should be stressed to 1 kip each and will assist the fabricators in
tying the reinforcement cage.
An elevation view of the standard detail of the anchorage zone is shown in Figure
3-27 and Figure 3-28. The beam end shown in Figure 3-27 is the typical detail which
would be used for girders in simple spans or girder ends at expansion joints. The beam
end shown in Figure 3-28 is the typical detail for girder ends which are enclosed in cast-
in-place diaphragms in spans made continuous for live load. Both beam end elevations
have two regions called out which correspond to the two regions of the design model. It
is recommended that the first stirrup at the end of the beam always consist of a pair of
bundled stirrups.
71
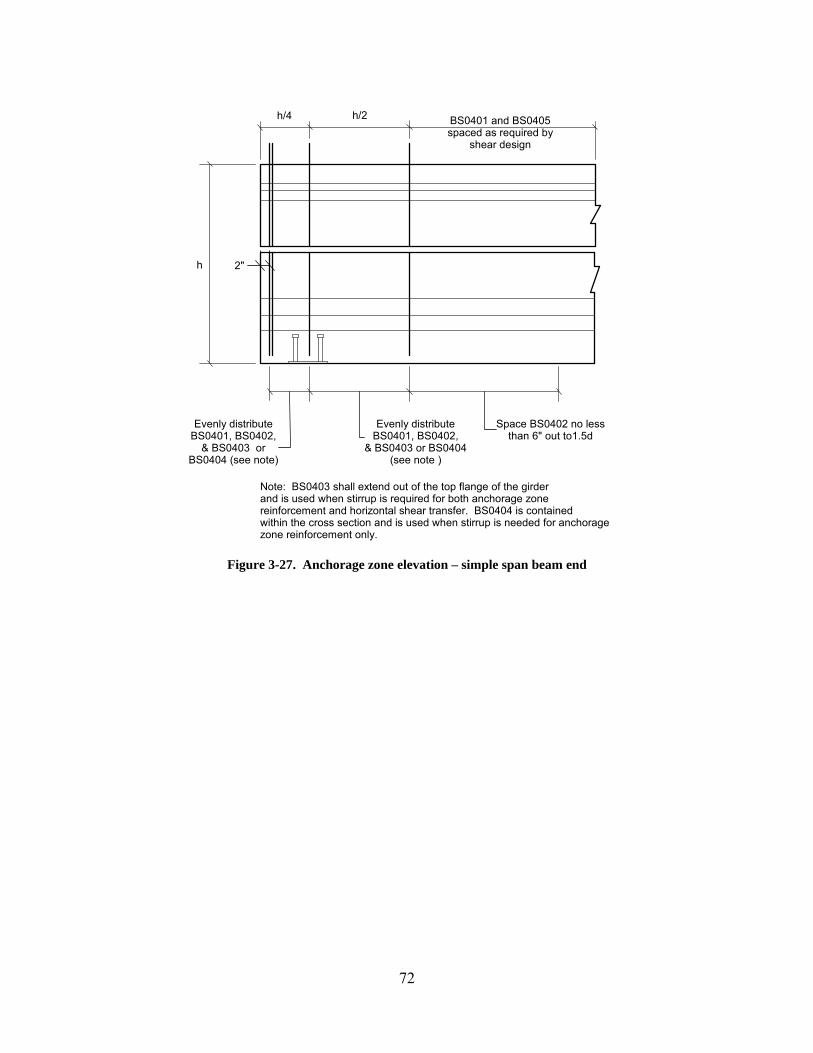
h/4 h/2
2"
Evenly distributeBS0401, BS0402,
& BS0403 or BS0404(see note )
Evenly distributeBS0401, BS0402,
& BS0403 orBS0404 (see note)
Space BS0402 no lessthan 6" out to1.5d
BS0401 and BS0405spaced as required by
shear design
Note: BS0403 shall extend out of the top flange of the girderand is used when stirrup is required for both anchorage zonereinforcement and horizontal shear transfer. BS0404 is containedwithin the cross section and is used when stirrup is needed for anchoragezone reinforcement only.
h
Figure 3-27. Anchorage zone elevation – simple span beam end
72
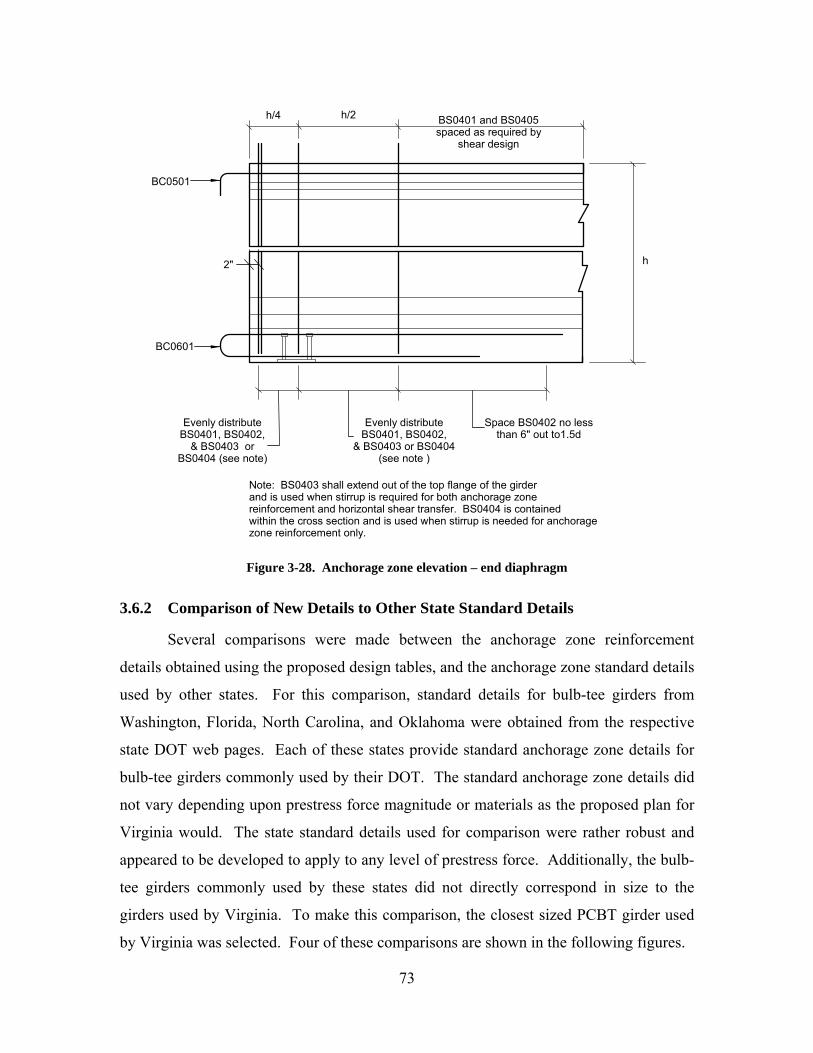
h/4 h/2
2"
Evenly distributeBS0401, BS0402,
& BS0403 or BS0404(see note )
Evenly distributeBS0401, BS0402,
& BS0403 orBS0404 (see note)
Space BS0402 no lessthan 6" out to1.5d
BS0401 and BS0405spaced as required by
shear design
Note: BS0403 shall extend out of the top flange of the girderand is used when stirrup is required for both anchorage zonereinforcement and horizontal shear transfer. BS0404 is containedwithin the cross section and is used when stirrup is needed for anchoragezone reinforcement only.
h
BC0601
BC0501
Figure 3-28. Anchorage zone elevation – end diaphragm
3.6.2 Comparison of New Details to Other State Standard Details
Several comparisons were made between the anchorage zone reinforcement
details obtained using the proposed design tables, and the anchorage zone standard details
used by other states. For this comparison, standard details for bulb-tee girders from
Washington, Florida, North Carolina, and Oklahoma were obtained from the respective
state DOT web pages. Each of these states provide standard anchorage zone details for
bulb-tee girders commonly used by their DOT. The standard anchorage zone details did
not vary depending upon prestress force magnitude or materials as the proposed plan for
Virginia would. The state standard details used for comparison were rather robust and
appeared to be developed to apply to any level of prestress force. Additionally, the bulb-
tee girders commonly used by these states did not directly correspond in size to the
girders used by Virginia. To make this comparison, the closest sized PCBT girder used
by Virginia was selected. Four of these comparisons are shown in the following figures.
73

0
1
2
3
4
NC BT-72
FL BT-72
WA W74
G1
OK BT-72
AASHTO (44) ½
"
PCBT-69 (4
4) ½"
Stirr
up A
rea
(in2 )
h/4h/4-3h/4
Figure 3-29. Standard detail comparison – PCBT-69, NWC, 44 ½ in. strands
Figure 3-29 shows a comparison between the standard anchorage detail for the 72
in. bulb-tee girder used by North Carolina, Florida, and Oklahoma, a 74 in. bulb-tee
girder used by Washington, and the required stirrup area for a PCBT-69 with 44, ½ in.
strands designed with the proposed anchorage zone tables. This figure shows the
required stirrup area within h/4 using the proposed design tables for this sample girder is
slightly less than the area of stirrups within h/4 used in Florida, Washington, and
Oklahoma. The required stirrup area for this sample girder within h/4 is the same as that
currently used in the North Carolina BT-72. All states in this comparison would place
more stirrups within h/4 than is required by current AASHTO LRFD provisions. Figure
3-29 also shows that North Carolina, Washington, and Florida currently place a large area
of stirrups between h/4 and 3h/4. The required stirrup area for the PCBT-69 from h/4 to
3h/4 using the anchorage zone design tables is similar to what these states already use in
their standard details. Also note that Oklahoma does not place a very large area of
stirrups in this region according to their standard detail.
74
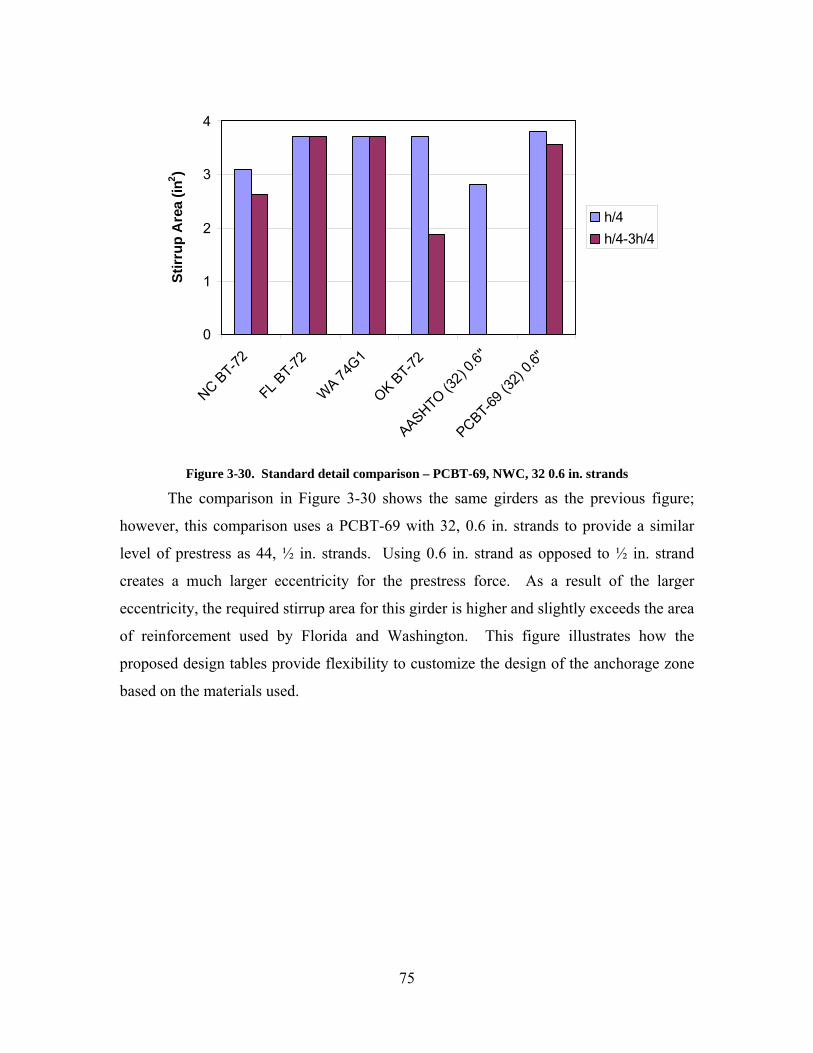
0
1
2
3
4
NC BT-72
FL BT-72
WA 74G1
OK BT-72
AASHTO (32) 0
.6"
PCBT-69 (3
2) 0.6
"
Stirr
up A
rea
(in2 )
h/4h/4-3h/4
Figure 3-30. Standard detail comparison – PCBT-69, NWC, 32 0.6 in. strands
The comparison in Figure 3-30 shows the same girders as the previous figure;
however, this comparison uses a PCBT-69 with 32, 0.6 in. strands to provide a similar
level of prestress as 44, ½ in. strands. Using 0.6 in. strand as opposed to ½ in. strand
creates a much larger eccentricity for the prestress force. As a result of the larger
eccentricity, the required stirrup area for this girder is higher and slightly exceeds the area
of reinforcement used by Florida and Washington. This figure illustrates how the
proposed design tables provide flexibility to customize the design of the anchorage zone
based on the materials used.
75

0
1
2
3
4
5
6
FL BT-78
WA 74G1
WA 83G
OK BT-72
AASHTO (46) ½
"
PCBT-77 (4
6) ½"
PCBT-85 (4
6) ½"
Stirr
up A
rea
(in2 )
h/4h/4-3h/4
Figure 3-31. Standard detail comparison – PCBT-77 and PCBT-85, NWC, 46 ½ in. strands
Figure 3-31 is a comparison of several of the larger girders used by Florida,
Washington, Oklahoma, and the Virginia PCBT-77 and PCBT-85. This comparison
shows when these girders are used with ½ in. strands the area of reinforcement required
by the design tables is similar to the Florida BT-78 and Washington 74G1. Once again,
all states designs exceeded the AASHTO LRFD minimum stirrup requirement. Figure
3-32 compares the same girders as Figure 3-31 but the Virginia PCBT-77 and PCBT-85
have 0.6 in. strands in this example. This figure shows that the required stirrup area for
the PCBT-77 and PCBT-85, when 0.6 in strands are used, is slightly greater than the
areas used in the BT-78 and 74G1, but still less than the stirrup area used in the
Washington 83G.
76
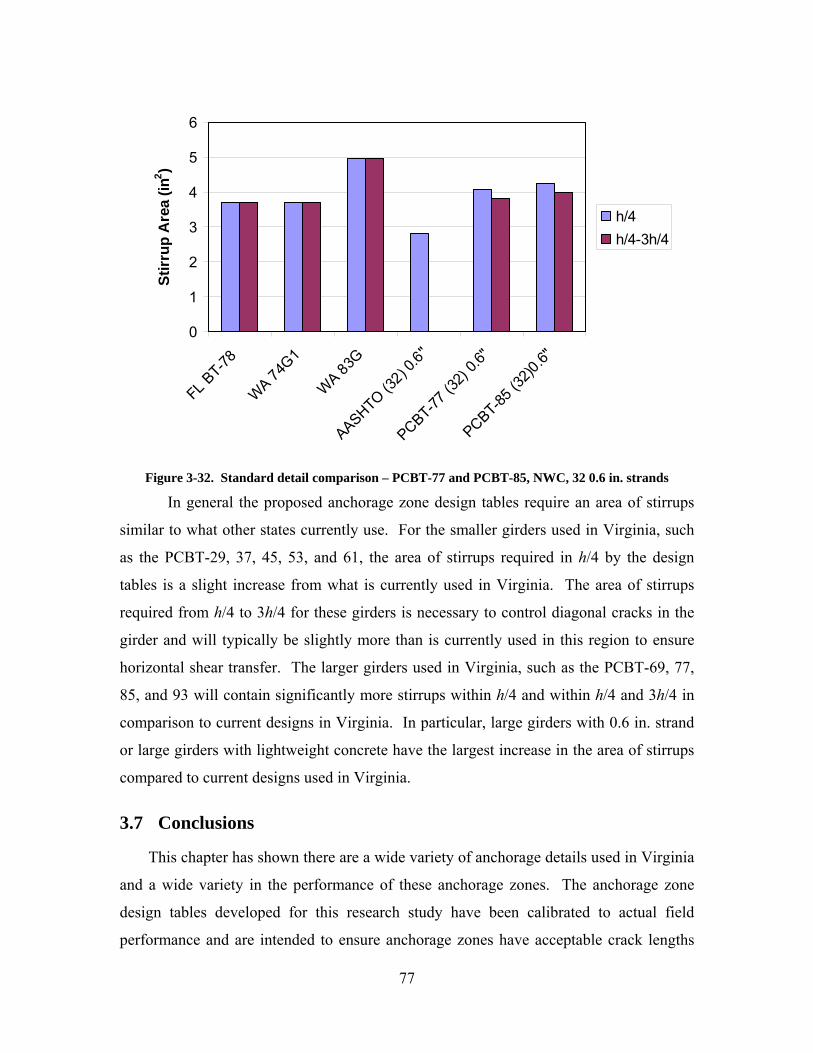
0
1
2
3
4
5
6
FL BT-78
WA 74G1
WA 83G
AASHTO (32) 0
.6"
PCBT-77 (3
2) 0.6
"
PCBT-85 (3
2)0.6"
Stirr
up A
rea
(in2 )
h/4h/4-3h/4
Figure 3-32. Standard detail comparison – PCBT-77 and PCBT-85, NWC, 32 0.6 in. strands
In general the proposed anchorage zone design tables require an area of stirrups
similar to what other states currently use. For the smaller girders used in Virginia, such
as the PCBT-29, 37, 45, 53, and 61, the area of stirrups required in h/4 by the design
tables is a slight increase from what is currently used in Virginia. The area of stirrups
required from h/4 to 3h/4 for these girders is necessary to control diagonal cracks in the
girder and will typically be slightly more than is currently used in this region to ensure
horizontal shear transfer. The larger girders used in Virginia, such as the PCBT-69, 77,
85, and 93 will contain significantly more stirrups within h/4 and within h/4 and 3h/4 in
comparison to current designs in Virginia. In particular, large girders with 0.6 in. strand
or large girders with lightweight concrete have the largest increase in the area of stirrups
compared to current designs used in Virginia.
3.7 Conclusions
This chapter has shown there are a wide variety of anchorage details used in Virginia
and a wide variety in the performance of these anchorage zones. The anchorage zone
design tables developed for this research study have been calibrated to actual field
performance and are intended to ensure anchorage zones have acceptable crack lengths
77

and widths. It is not likely that details developed with the anchorage zone design tables
will completely eliminate anchorage zone cracking, but they will offer a significant
improvement over current design practices in Virginia. The anchorage zone constitutes a
relatively small portion of the overall design. The design tables developed for this
research provide a quick means to complete this aspect of the design and ensure reliable
performance. Using the full anchorage zone strut-and-tie model is recommended for
girders not covered by the design tables.
78

Chapter 4. Experimental Testing and Results
4.1 Overview
An experimental 65 ft PCBT-53 bridge girder was fabricated in October 2006 to
verify the new anchorage zone design model. As part of an on-going research project
conducted by the Innovative Bridge Research and Construction Program, the girder was
cast with lightweight self-consolidating concrete (SCC) and then tested at Virginia Tech.
Experimental anchorage zone details were developed for each end of the beam to
compare cracking at transfer. This girder was later used in a test to quantify the shear
strength of lightweight SCC. For this test a 7 ft. wide, 9 in. deep deck was added to the
top of the girder.
The anchorage zone details at each end of the beam were designed using the
proposed strut-and-tie anchorage zone model. At one end of the beam a stirrup working
stress of 12 ksi was selected, which corresponded to the recommendations of the model
discussed in section 3.3.2 for girders with lightweight concrete. This end will be referred
to as the 12 ksi anchorage zone for the remainder of the chapter. At the other end, a
working stress of 18 ksi was selected in the design of the stirrups. This end will be
referred to as the 18 ksi anchorage zone throughout this chapter. The design process,
testing, and results of the testing are presented in the following paragraphs.
4.2 Design of Experimental Anchorage Zone Details
The PCBT-53 test girder was pretensioned with 32 ½ in. strands. Six of the strands
were harped at the end of the girder. The harping points for the strands were located 30
in. from the center line of the girder. The release strength of the concrete used in the
design of the anchorage zones was 5,500 psi and the unit weight was assumed to be 120
lb/ft3. In the design of the anchorage zone details the force from four courtesy strands
located in the top flange was considered. These strands were each stressed to 4 kips. In
Virginia, the courtesy strands are typically only tensioned with 1 kip of force, but in order
to reduce the tensile stresses in the top flange of the girder at transfer a higher force was
used for this experiment. A cross section view of the test girder is shown in Figure 4-1.
79
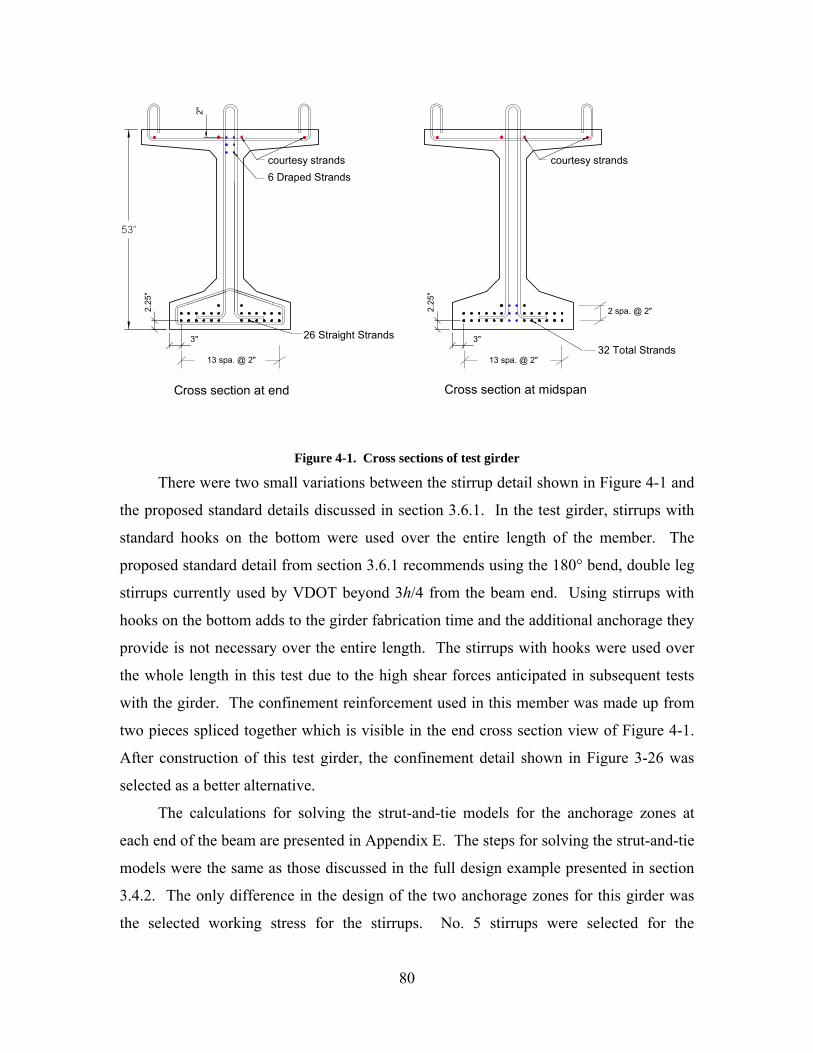
Cross section at end
2.25
"
3"32 Total Strands
Cross section at midspan
2.25
"
3" 26 Straight Strands
6 Draped Strandscourtesy strands
2"
courtesy strands
13 spa. @ 2" 13 spa. @ 2"
2 spa. @ 2"
53"
Figure 4-1. Cross sections of test girder
There were two small variations between the stirrup detail shown in Figure 4-1 and
the proposed standard details discussed in section 3.6.1. In the test girder, stirrups with
standard hooks on the bottom were used over the entire length of the member. The
proposed standard detail from section 3.6.1 recommends using the 180° bend, double leg
stirrups currently used by VDOT beyond 3h/4 from the beam end. Using stirrups with
hooks on the bottom adds to the girder fabrication time and the additional anchorage they
provide is not necessary over the entire length. The stirrups with hooks were used over
the whole length in this test due to the high shear forces anticipated in subsequent tests
with the girder. The confinement reinforcement used in this member was made up from
two pieces spliced together which is visible in the end cross section view of Figure 4-1.
After construction of this test girder, the confinement detail shown in Figure 3-26 was
selected as a better alternative.
The calculations for solving the strut-and-tie models for the anchorage zones at
each end of the beam are presented in Appendix E. The steps for solving the strut-and-tie
models were the same as those discussed in the full design example presented in section
3.4.2. The only difference in the design of the two anchorage zones for this girder was
the selected working stress for the stirrups. No. 5 stirrups were selected for the
80
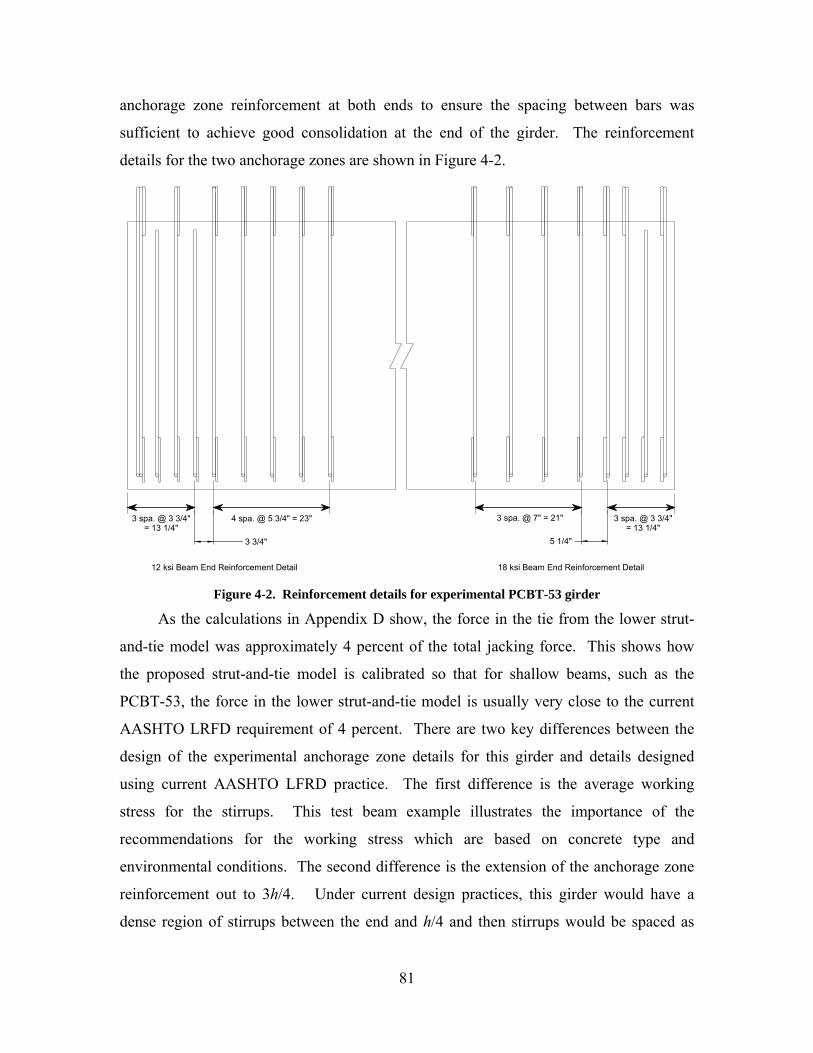
anchorage zone reinforcement at both ends to ensure the spacing between bars was
sufficient to achieve good consolidation at the end of the girder. The reinforcement
details for the two anchorage zones are shown in Figure 4-2.
3 spa. @ 3 3/4"= 13 1/4"
3 spa. @ 7" = 21"
5 1/4"3 3/4"
3 spa. @ 3 3/4"= 13 1/4"
4 spa. @ 5 3/4" = 23"
12 ksi Beam End Reinforcement Detail 18 ksi Beam End Reinforcement Detail Figure 4-2. Reinforcement details for experimental PCBT-53 girder
As the calculations in Appendix D show, the force in the tie from the lower strut-
and-tie model was approximately 4 percent of the total jacking force. This shows how
the proposed strut-and-tie model is calibrated so that for shallow beams, such as the
PCBT-53, the force in the lower strut-and-tie model is usually very close to the current
AASHTO LRFD requirement of 4 percent. There are two key differences between the
design of the experimental anchorage zone details for this girder and details designed
using current AASHTO LFRD practice. The first difference is the average working
stress for the stirrups. This test beam example illustrates the importance of the
recommendations for the working stress which are based on concrete type and
environmental conditions. The second difference is the extension of the anchorage zone
reinforcement out to 3h/4. Under current design practices, this girder would have a
dense region of stirrups between the end and h/4 and then stirrups would be spaced as
81

required for horizontal or vertical shear. As field observations have shown, a dense
region of reinforcement in h/4 may not be sufficient to control the formation of diagonal
cracks in the upper web region.
The difference in the stirrup area between the two anchorage zones is rather small.
Table 4-1 provides a summary of the required stirrup area and number of stirrups used in
each anchorage zone. This table shows that the 12 ksi anchorage zone contained only
two more stirrups than the 18 ksi anchorage zone. It is also important to note that both
anchorage zones exceed the minimum stirrup requirement from AASHTO LRFD within
the distance between the beam end and h/4. The 18 ksi anchorage zone contained one
more stirrup between the beam end and h/4 compared to what AASHTO LRFD design
practice would require in this region. Table 4-1. Summary of anchorage zone details
Anchorage Zone
Required Stirrup Area (in2) end – h/4
Qty of No. 5 bars
Required Stirrup Area (in2) h/4-3h/4
Qty of No. 5 bars
12 ksi 3.36 5 3.14 5 18 ksi 2.24 4 2.09 4
The stirrups used in the test girder included a standard hook on the bottom as
illustrated in Figure 4-2. In both ends of the beam, short stirrups were used in locations
where reinforcement was needed in the anchorage zone, but was not needed for
horizontal shear transfer between the girder and the composite deck. The minimum
stirrup spacing required for horizontal shear transfer at the end of the girder was 7 in. In
the 18 ksi anchorage zone, the spacing of the stirrups between h/4 and 3h/4 exceeded this
spacing limit for horizontal shear transfer, and as a result the smaller spacing limit
controlled. It is not typical that the spacing requirement for horizontal shear transfer will
control in this region; however, in this particular case the spacing requirement for
horizontal shear transfer did control due to the high shear forces expected when the girder
was later tested to failure for a subsequent research project.
82
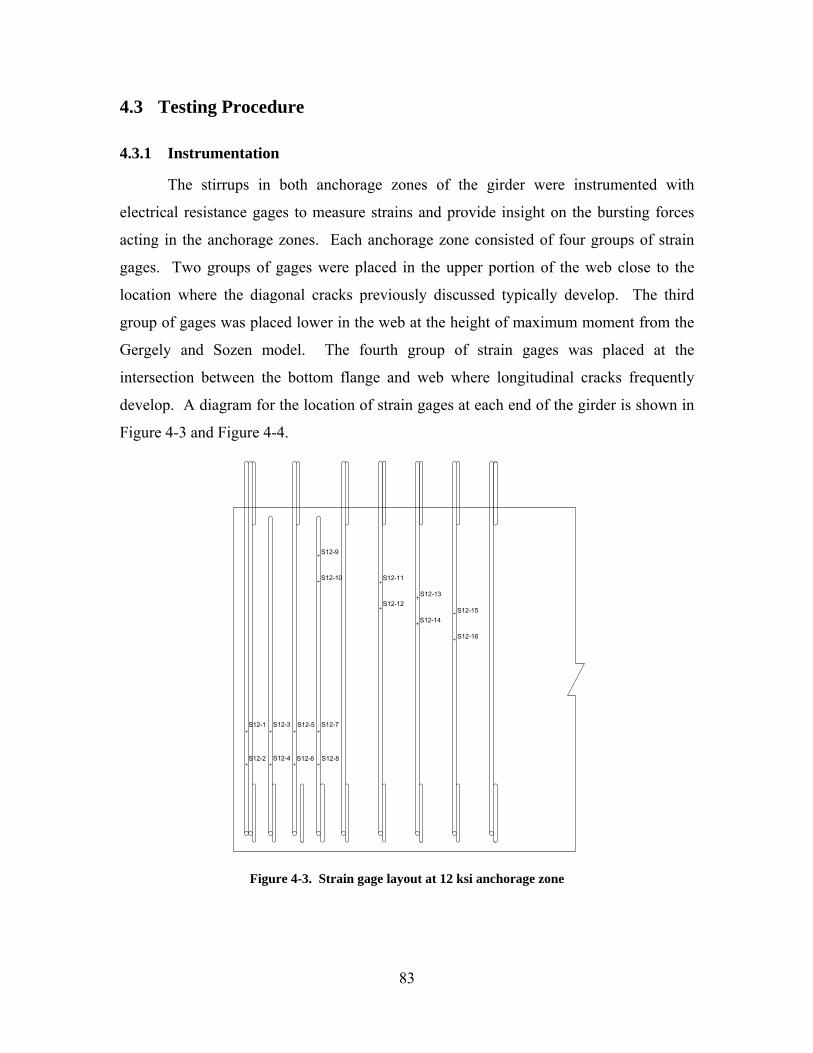
4.3 Testing Procedure
4.3.1 Instrumentation
The stirrups in both anchorage zones of the girder were instrumented with
electrical resistance gages to measure strains and provide insight on the bursting forces
acting in the anchorage zones. Each anchorage zone consisted of four groups of strain
gages. Two groups of gages were placed in the upper portion of the web close to the
location where the diagonal cracks previously discussed typically develop. The third
group of gages was placed lower in the web at the height of maximum moment from the
Gergely and Sozen model. The fourth group of strain gages was placed at the
intersection between the bottom flange and web where longitudinal cracks frequently
develop. A diagram for the location of strain gages at each end of the girder is shown in
Figure 4-3 and Figure 4-4.
S12-1
S12-2
S12-3
S12-4
S12-5
S12-6
S12-7
S12-8
S12-9
S12-10 S12-11
S12-12S12-13
S12-14S12-15
S12-16
Figure 4-3. Strain gage layout at 12 ksi anchorage zone
83

S18-1
S18-2
S18-3S18-5S18-7
S18-4S18-6S18-8
S18-9
S18-10
S18-11
S18-12S18-13
S18-15S18-14
S18-16S18-17
S18-18
Figure 4-4. Strain gage layout – 18 ksi anchorage zone
The strain gages were numbered sequentially, and they were each given a prefix
of either S12 or S18. The “S” in the prefix denotes that the instrument was used to
measure strain. (Additional instruments were placed in the girder for the shear tests
conducted at a later date) The “12” or “18” in the prefix refers to either the 12 ksi
anchorage zone or the 18 ksi anchorage zone of the girder. The CEA-06-125UN-350-P2
strain gages were purchased from Vishay Micro-Measurements. These gages included
pre-attached 10 ft. lead wires which greatly reduced the application time. The gages were
mounted to the stirrups using Vishay Micro-Measurements M-Bond 200 and protected
with the M-Coat F protective coating system.
The stirrups were instrumented in the Virginia Tech Structures Laboratory a few
weeks prior to casting the beam. Bayshore Concrete Products Corp. (Bayshore) provided
uncoated, grade 60 stirrups which were bent to the correct shape. Before each gage was
applied, a section of the stirrup was grinded and sanded smooth at the gage location. The
strain gages were then applied to the stirrups and protected in accordance with the
manufacturer’s recommendations. A total of 36 strain gages were applied to the stirrups
84

at the laboratory. These stirrups were brought to Bayshore on October 23, 2006, and
installed in the appropriate locations within the girder. After installing the stirrups, the
lead wires from the strain gages were spliced with longer wires and attached to the data
acquisition system located at midspan of the girder.
A CP23X Micrologger made by Campbell Scientific Inc. (Campbell) was used to
collect data from the strain gages during transfer and to collect long-term data from the
thermocouples and vibrating wire gages installed in the girder for subsequent tests. This
system operates on a user-provided program which specifies which channels to read and
the frequency of the readings. The Campbell program was prepared and tested at the
Structures Laboratory a few weeks prior to casting to ensure it was working properly.
The Campbell was initially programmed to take readings from all instruments at 1 minute
intervals from the morning the girder was cast until shortly after transfer when the girder
was lifted from the casting bed. After the girder was lifted, the Campbell was
reprogrammed and the frequency of readings was adjusted to a 90 minute interval. The
Campbell was placed in an environmentally resistant box at the precast yard and the lead
wires from the instrumentation were passed through two access holes in the box.
Throughout all of the testing the Campbell was powered by a solar panel.
The strain gages (and other instruments) were connected to the Campbell in the
field on October 23, 2006. After the system was installed, each strain gage was tested
with a voltmeter to ensure it had the correct resistance of 350 Ohms. During this test it
was discovered that six of the strain gages were not working correctly. Four of these six
strain gages were severely damaged during the process of placing the stirrups in position
within the girder. Efforts were made to troubleshoot the other two gages which were not
functioning correctly but the gages could not be fixed before fabrication began.
Photographs of the strain gages installed in their final positions in the girder are shown in
Figure 4-5 and Figure 4-6.
The original instrumentation plan also called for twelve strain gages to be applied
in the field on the prestress strand. These gages were to be placed on strands at h/4, h/2,
and 3h/4 at each end to help quantify the length of the general zone. Placing these gages
in a field environment proved challenging and was not successful. It is believed that due
to the low temperatures in the field on October 23, there was not enough heat for the
85
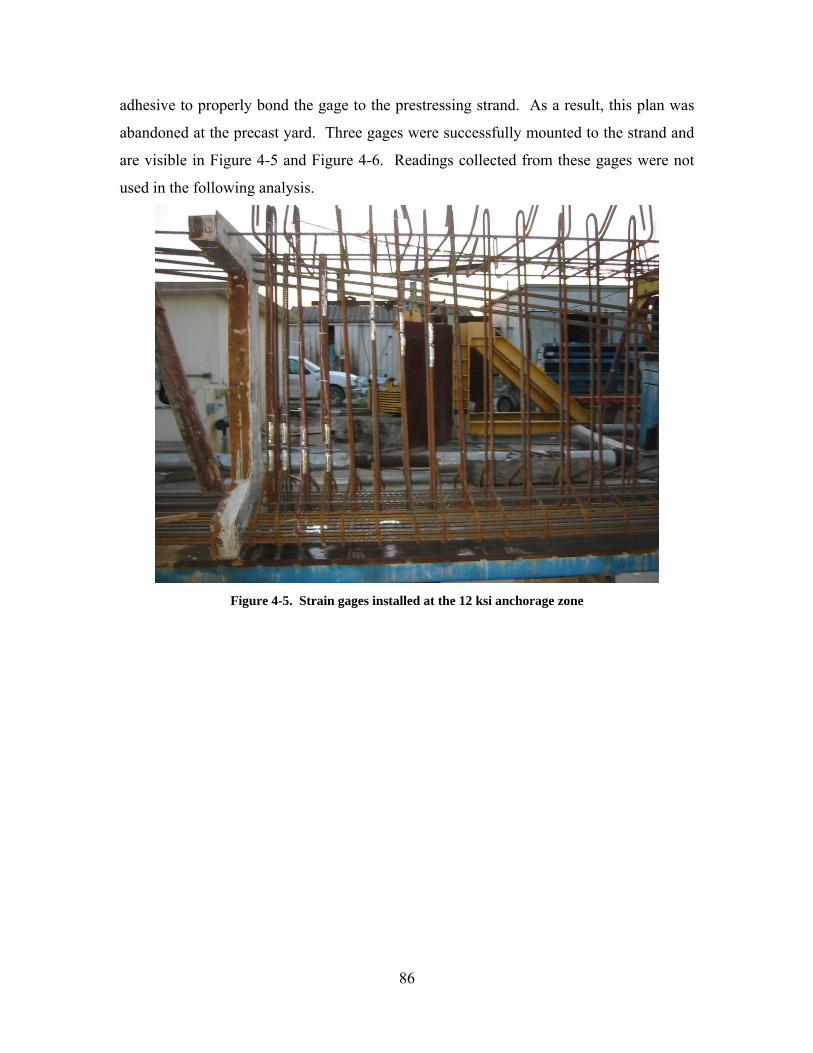
adhesive to properly bond the gage to the prestressing strand. As a result, this plan was
abandoned at the precast yard. Three gages were successfully mounted to the strand and
are visible in Figure 4-5 and Figure 4-6. Readings collected from these gages were not
used in the following analysis.
Figure 4-5. Strain gages installed at the 12 ksi anchorage zone
86

Figure 4-6. Strain gages installed at the 18 ksi anchorage zone
4.3.2 Fabrication of Test PCBT-53
Concrete was poured for the test girder during the afternoon of October 24, 2006.
This was one of the first attempts by Bayshore to construct a beam with high
performance lightweight SCC and the process of getting the mix correct took several
hours. A total of three ready-mix trucks were rejected before the mix was finally
accepted. Prior to placing concrete in the formwork, workers from Bayshore performed a
slump test and measured the concrete unit weight and percent air content. Figure 4-7
shows the slump test being performed on a trial batch of concrete.
87

Figure 4-7. Slump test on batch of LWSCC concrete
The concrete pour took approximately one hour to complete. The SCC required a
minimal amount of external vibration on the formwork. Workers provided some internal
vibration with pencil vibrators from the walkway on top of the girder. The beam was
covered with blankets after the concrete was placed and steam cured overnight. Figure
4-8 shows the girder steam curing on the morning of October 25. At 8:40 a.m. on
October 25, a modulus of elasticity test, a compression test, and a split cylinder test were
performed on concrete samples. The results of these tests are given in Table 4-2. This
first test showed the concrete had already exceeded the design release strength of 5,500
psi and at this time the decision was made to turn off the steam and remove the
formwork. These same tests were performed a second time three hours later during
transfer and the results from this set of material tests are also listed in Table 4-2. Table 4-2. Concrete material properties on October 25, 2006
Test Time f`ci (psi) Eci (ksi) fct (psi) 8:40 a.m. 7,752 3,550 558 11:30 a.m. 8,917 3,640 626
88

Figure 4-8. Girder steam curing on October 25, 2006
After the forms were removed, the strands were flame cut with an acetylene torch.
The strands were cut at both ends of the girder simultaneously. The top row of courtesy
strands was cut first, followed by the harped strands, and straight strands. The process of
cutting all strands took almost three hours. The test beam was located at one end of a
casting bed which was over 200 ft long. There were no other girders being fabricated in
the same casting bed. When strands were cut at the long free end they would become
very tangled, and workers would remove the tangled strands periodically, causing the
transfer process to proceed very slowly. After all the strands were cut the girder was
lifted and then returned to the same position in the casting bed until it was transported to
the Virginia Tech Structures Laboratory on December 13, 2006.
4.3.3 Test Procedures
Anchorage zone cracking develops almost immediately after transfer and cracks
often open and propagate further while the girder is lifted. The boundary conditions on
the anchorage zone are the most severe during the lifting process. Combine these
boundary conditions with early age concrete, and the girder is very likely to crack during
89

this process. When the girder is being lifted, the self-weight of the girder is acting on the
lifting devices which are often located several feet inward from the end of the girder. For
this test, a special lifting device was designed which did not require additional steel
placed in the web of the girder. This lifting device was developed and used to prevent
interference with the shear tests which were later performed on the girder. A photograph
of the girder being lifted from the casting bed is shown in Figure 4-9.
Figure 4-9. Test girder lifted from casting bed on October 25, 2006
The testing procedure for the anchorage zone model consisted of a visual
inspection of the cracking in the ends during transfer and after the girder was lifted from
the casting bed. The anchorage zones were also visually inspected 50 days after transfer
when the girder arrived at the Structures Laboratory and once again after the 7 ft wide
deck was poured on the girder. The cracks in the two anchorage zones were marked on
the girder and measured with a crack comparator card.
An important component in this test was the initial lift from the casting bed.
During this first movement, the girder is most vulnerable because the prestress force is
the highest, since long term prestress losses have not started, and the concrete is relatively
weak. Bayshore had planned to leave the girder in the casting bed until it was transported
90
to Virginia Tech, but since lifting the girder was necessary to verify the anchorage zone
model, they agreed to lift the girder briefly. The readings from the strain gages were
monitored throughout casting, transfer, and the first lift of the girder. After the girder
was lifted, the data acquisition system was adjusted to take readings every 90 minutes
and the strain gage readings were recorded throughout the life of the gages.
4.4 Results and Discussion
4.4.1 General
The difference in performance between the two anchorage zones was visibly
noticeable. There was significantly more cracking in the anchorage zone designed with a
stirrup working stress of 18 ksi which was expected. The readings from the strain gages
also showed higher strains in the stirrups at the 18 ksi anchorage zone. The strain gage
data showed a region of high strains where diagonal cracks typically develop. The
following sections present and discuss these results.
4.4.2 Anchorage Zone Crack Pattern at Transfer
4.4.2.1 12 ksi Anchorage Zone
The photographs in Figure 4-10 show both faces of the 12 ksi anchorage zone and
the level of cracking which developed after transfer. The photographs were taken after
the girder was lifted from the casting bed and set back down. This anchorage zone
performed very well and the level of cracking would be considered acceptable in
accordance with the criteria outlined in section 3.3.3. The cracks were very fine and the
largest crack width measured was 0.003 in. This crack width is well below an acceptable
width for almost any environmental conditions to which the girder could be exposed. As
Figure 4-10 shows, a horizontal crack developed at the bottom flange-to-web interface.
This crack extended longitudinally for approximately 9 in., which is about 17 percent of
the girder height. This crack length is within the crack length limits discussed in section
3.3.3. The cracks at this end developed as the girder was lifted from the casting bed. No
cracks were observed to develop in this anchorage zone during the three hour process of
cutting the strands.
91

Figure 4-10. Crack pattern in the 12 ksi anchorage zone after lifting
4.4.2.2 18 ksi Anchorage Zone
The anchorage zone designed with a stirrup working stress of 18 ksi did not meet
the acceptable crack levels discussed in section 3.3.3. Photographs of both faces of this
anchorage zone are shown in Figure 4-11. These photographs were also taken after the
girder was first lifted from the casting bed. As Figure 4-11 illustrates, the cracking in this
anchorage zone was much more pronounced. The largest crack width measured on this
end was 0.005 in. This size crack width would be acceptable for any exposure condition.
The lengths of the cracks which developed in this end of the girder did not meet the limits
given in section 3.3.3. A diagonal crack opened near the top flange, several inches in
from the end of the girder. The crack extended longitudinally 37 in., or 70 percent of the
girder height. The acceptable crack length of a diagonal crack is 50 percent of the girder
height. Several smaller horizontal cracks also developed lower in the web. The longest
of these cracks extended longitudinally 15 in., or 28 percent of the girder height. This
also exceeds the limitations on crack lengths discussed in section 3.3.3. In this anchorage
zone all cracks also developed during the lifting process.
92

Figure 4-11. Crack pattern in the 18 ksi anchorage zone after lifting
4.4.2.3 Material Properties at Transfer
A set of compression, split cylinder, and modulus of elasticity tests were
performed on cylinders at 11:30 a.m. as workers were beginning to cut the strands on
October 25, 2006. The results from these tests were provided in Table 4-2. The average
compressive strength of the concrete at this time was 8,900 psi, which was significantly
higher than the 5,500 psi used in the anchorage zone design. However, the higher
compressive strength has little influence on the performance of the anchorage zones.
More important to the performance of the anchorage zones was the tensile
strength of the concrete. The splitting tensile strength measured during transfer was 626
psi. The theoretical modulus of rupture of the concrete for the design release strength
using the AASHTO LRFD material properties for sand lightweight concrete was 469 psi.
This suggests that cracking could have been more extensive at both ends of the girder if
the strands were cut earlier in the day. The theoretical modulus of rupture of the concrete
for the measured compressive strength was 597 psi. This indicates that the mix of
lightweight concrete used in this girder had a relatively high tensile strength. The
theoretical modulus of rupture for normal weight concrete with the same release strength
was 717 psi which was approximately 14.5 percent greater than the measured splitting
tensile strength of the concrete in the girder. These values would suggest that the tensile
93
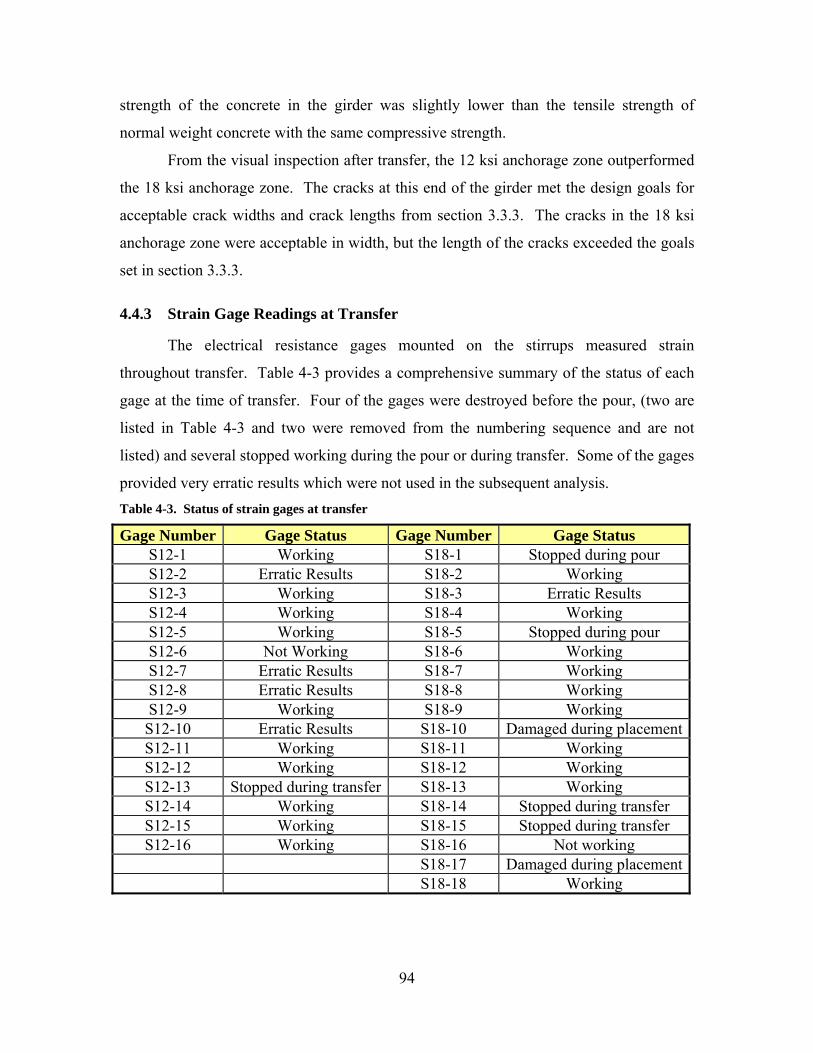
strength of the concrete in the girder was slightly lower than the tensile strength of
normal weight concrete with the same compressive strength.
From the visual inspection after transfer, the 12 ksi anchorage zone outperformed
the 18 ksi anchorage zone. The cracks at this end of the girder met the design goals for
acceptable crack widths and crack lengths from section 3.3.3. The cracks in the 18 ksi
anchorage zone were acceptable in width, but the length of the cracks exceeded the goals
set in section 3.3.3.
4.4.3 Strain Gage Readings at Transfer
The electrical resistance gages mounted on the stirrups measured strain
throughout transfer. Table 4-3 provides a comprehensive summary of the status of each
gage at the time of transfer. Four of the gages were destroyed before the pour, (two are
listed in Table 4-3 and two were removed from the numbering sequence and are not
listed) and several stopped working during the pour or during transfer. Some of the gages
provided very erratic results which were not used in the subsequent analysis. Table 4-3. Status of strain gages at transfer
Gage Number Gage Status Gage Number Gage Status S12-1 Working S18-1 Stopped during pour S12-2 Erratic Results S18-2 Working S12-3 Working S18-3 Erratic Results S12-4 Working S18-4 Working S12-5 Working S18-5 Stopped during pour S12-6 Not Working S18-6 Working S12-7 Erratic Results S18-7 Working S12-8 Erratic Results S18-8 Working S12-9 Working S18-9 Working S12-10 Erratic Results S18-10 Damaged during placementS12-11 Working S18-11 Working S12-12 Working S18-12 Working S12-13 Stopped during transfer S18-13 Working S12-14 Working S18-14 Stopped during transfer S12-15 Working S18-15 Stopped during transfer S12-16 Working S18-16 Not working
S18-17 Damaged during placement S18-18 Working
94
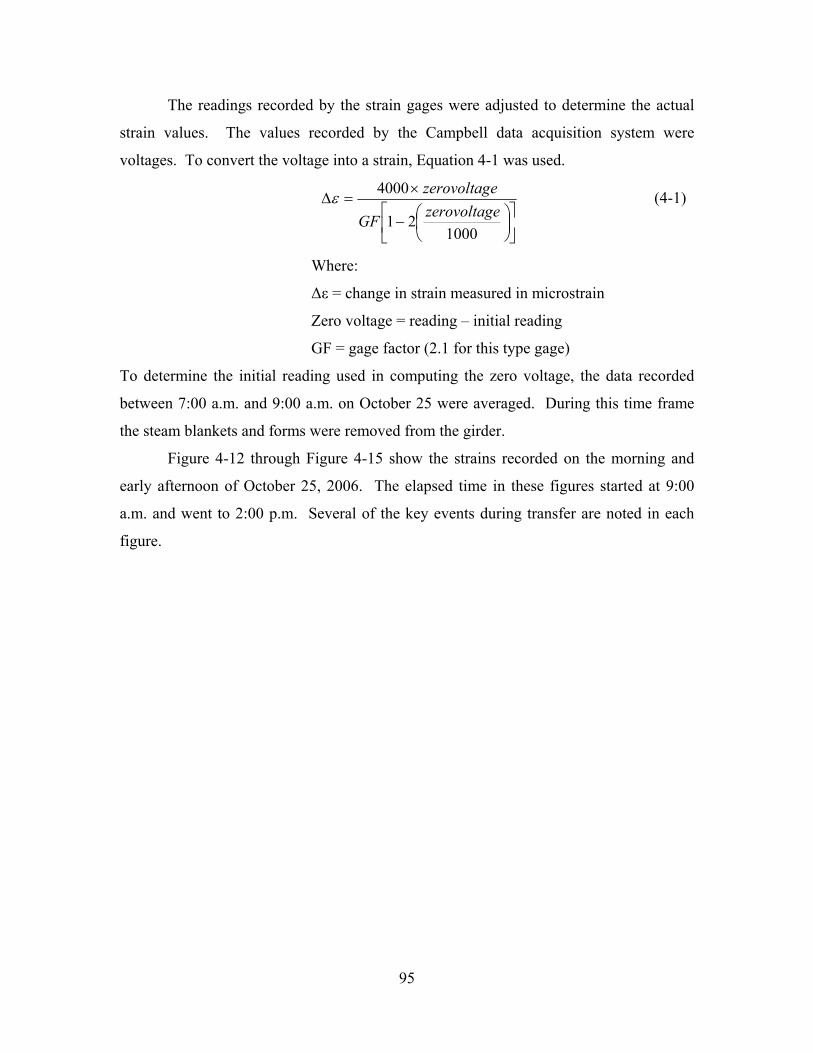
The readings recorded by the strain gages were adjusted to determine the actual
strain values. The values recorded by the Campbell data acquisition system were
voltages. To convert the voltage into a strain, Equation 4-1 was used.
⎥⎦
⎤⎢⎣
⎡⎟⎠⎞
⎜⎝⎛−
×=Δ
100021
4000ezerovoltagGF
ezerovoltagε (4-1)
Where:
Δε = change in strain measured in microstrain
Zero voltage = reading – initial reading
GF = gage factor (2.1 for this type gage)
To determine the initial reading used in computing the zero voltage, the data recorded
between 7:00 a.m. and 9:00 a.m. on October 25 were averaged. During this time frame
the steam blankets and forms were removed from the girder.
Figure 4-12 through Figure 4-15 show the strains recorded on the morning and
early afternoon of October 25, 2006. The elapsed time in these figures started at 9:00
a.m. and went to 2:00 p.m. Several of the key events during transfer are noted in each
figure.
95
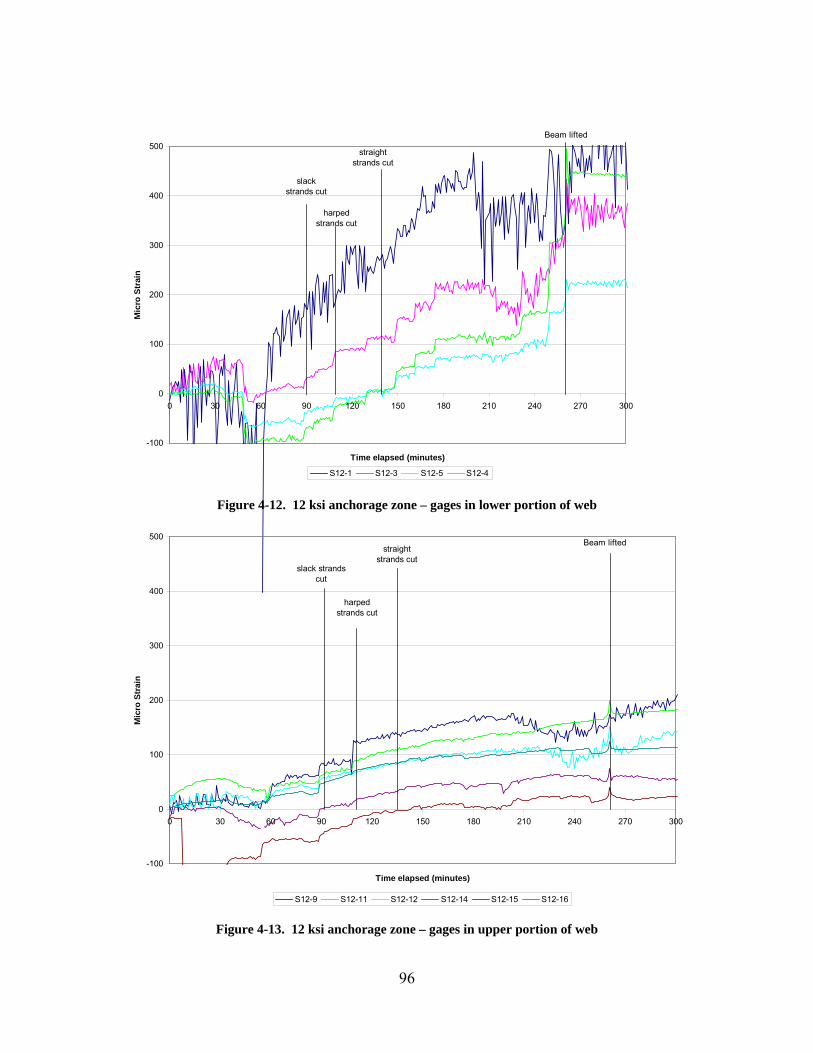
-100
0
100
200
300
400
500
0 30 60 90 120 150 180 210 240 270 300
Time elapsed (minutes)
Mic
ro S
trai
n
S12-1 S12-3 S12-5 S12-4
slack strands cut
harped strands cut
straight strands cut
Beam lifted
Figure 4-12. 12 ksi anchorage zone – gages in lower portion of web
-100
0
100
200
300
400
500
0 30 60 90 120 150 180 210 240 270 300
Time elapsed (minutes)
Mic
ro S
trai
n
S12-9 S12-11 S12-12 S12-14 S12-15 S12-16
slack strands cut
harped strands cut
straight strands cut
Beam lifted
Figure 4-13. 12 ksi anchorage zone – gages in upper portion of web
96

-100
0
100
200
300
400
500
0 30 60 90 120 150 180 210 240 270 300
Time elapsed (minutes)
Mic
ro S
trai
n
S18-2 S18-4 S18-6 S18-7 S18-8
slack strands cut
harped strands cut
straight strands cut
beam lifted
Figure 4-14. 18 ksi anchorage zone – gages in lower portion of web
-100
0
100
200
300
400
500
0 30 60 90 120 150 180 210 240 270 300
Time elapsed (minutes)
Mic
ro S
trai
n
S18-9 S18-11 S18-12 S18-13 S18-18
slack strands cut
harped strands cut
straight strands cut
beam lifted
Figure 4-15. 18 ksi anchorage zone – gages in upper portion of the web
97
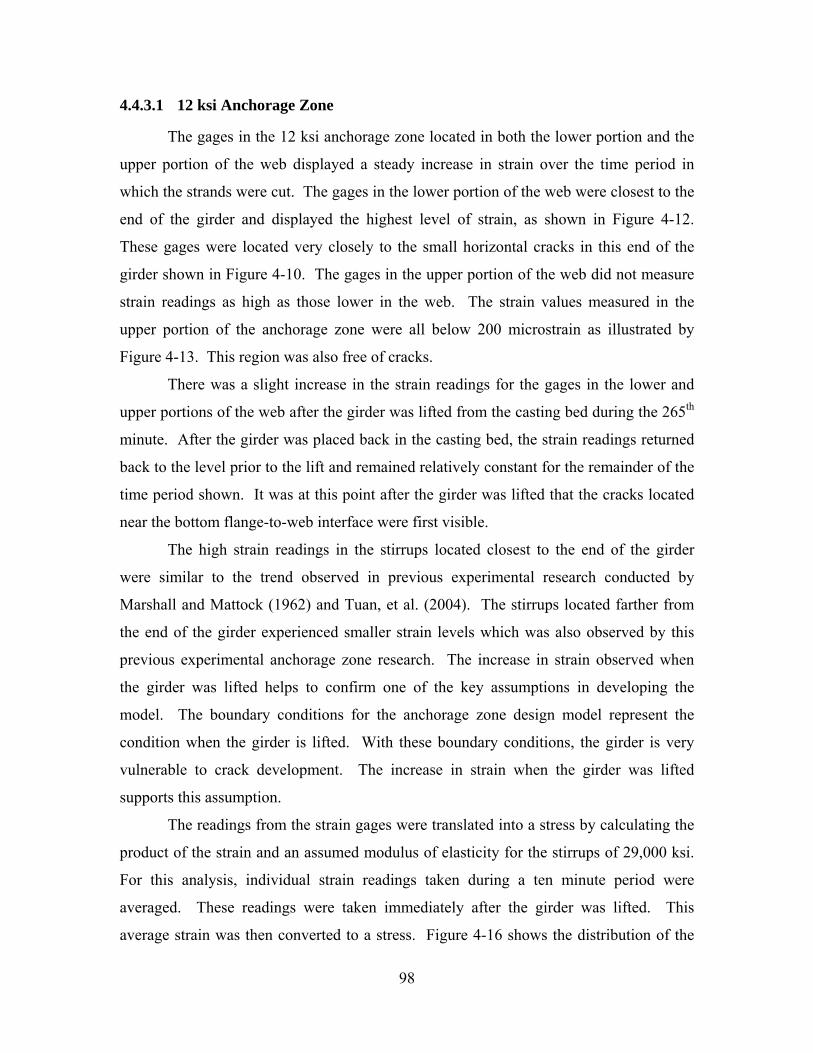
4.4.3.1 12 ksi Anchorage Zone
The gages in the 12 ksi anchorage zone located in both the lower portion and the
upper portion of the web displayed a steady increase in strain over the time period in
which the strands were cut. The gages in the lower portion of the web were closest to the
end of the girder and displayed the highest level of strain, as shown in Figure 4-12.
These gages were located very closely to the small horizontal cracks in this end of the
girder shown in Figure 4-10. The gages in the upper portion of the web did not measure
strain readings as high as those lower in the web. The strain values measured in the
upper portion of the anchorage zone were all below 200 microstrain as illustrated by
Figure 4-13. This region was also free of cracks.
There was a slight increase in the strain readings for the gages in the lower and
upper portions of the web after the girder was lifted from the casting bed during the 265th
minute. After the girder was placed back in the casting bed, the strain readings returned
back to the level prior to the lift and remained relatively constant for the remainder of the
time period shown. It was at this point after the girder was lifted that the cracks located
near the bottom flange-to-web interface were first visible.
The high strain readings in the stirrups located closest to the end of the girder
were similar to the trend observed in previous experimental research conducted by
Marshall and Mattock (1962) and Tuan, et al. (2004). The stirrups located farther from
the end of the girder experienced smaller strain levels which was also observed by this
previous experimental anchorage zone research. The increase in strain observed when
the girder was lifted helps to confirm one of the key assumptions in developing the
model. The boundary conditions for the anchorage zone design model represent the
condition when the girder is lifted. With these boundary conditions, the girder is very
vulnerable to crack development. The increase in strain when the girder was lifted
supports this assumption.
The readings from the strain gages were translated into a stress by calculating the
product of the strain and an assumed modulus of elasticity for the stirrups of 29,000 ksi.
For this analysis, individual strain readings taken during a ten minute period were
averaged. These readings were taken immediately after the girder was lifted. This
average strain was then converted to a stress. Figure 4-16 shows the distribution of the
98
stress in the stirrups over the length of the anchorage zone. The maximum stirrup stress
in the anchorage zone ranged from 13.8 ksi to 0.68 ksi. The stress values calculated from
the measured strains were almost all less than the assumed average working stress of 12
ksi used in this design. Only the first stirrup experienced a stress higher than 12 ksi. The
low stress values suggest the actual total bursting force in the anchorage zone is less than
the bursting force predicted with the design model.
0
2
4
6
8
10
12
14
16
0 0.1 0.2 0.3 0.4 0.5 0.6 0.7
Distance from end (x/h)
Stre
ss (k
si)
Experimental Readings Figure 4-16. Distribution of tensile stress over the anchorage zone after lifting – 12 ksi end
4.4.3.2 18 ksi Anchorage Zone
The strains measured in the stirrups in the 18 ksi anchorage zone displayed a
different trend. Figure 4-14 and Figure 4-15 show that the strain was very small and
changed very little while the strands were cut. There was a very large and sudden
increase in the strain in the stirrups when the girder was lifted. After the girder was
placed back on the casting bed, the strain decreased slightly and then remained constant.
The strain that remained after the girder was lifted was relatively high. The strain in the
gages located in the lower portion of the web ranged from 150 to 400 microstrain, with
the gage located closest to the end experiencing the highest strain. The gages located in
99

the upper portion of the web measured strains which varied from 0 to 300 microstrain.
The gage located farthest from the end recorded the lowest strain reading. The cracks in
this anchorage zone all developed at the time the girder was lifted. This sudden increase
in the strain when the girder was lifted serves to confirm the assumption for the design
model discussed previously.
The large strains measured by the gages in the upper portion of the web in the 18
ksi anchorage zone show that large tensile forces can exist in this region. The gages in
this area of the anchorage zone were located between h/4 and 3h/4. The three gages
which measured the highest strains in this group were S18-9, S18-11, and S18-13, which
were located at 0.25h, 0.35h, and 0.48h respectively. These readings support the field
observations which demonstrated that the region between h/4 and 3h/4 was highly
affected by the diffusion of the prestress force into the girder. These readings also
support including this region of the girder as part of the anchorage zone design.
The strain readings from the gages in this anchorage zone were also translated
into stresses. The distribution of the stresses in the anchorage zone is shown in Figure
4-17. The stresses in these stirrups ranged from 11.8 ksi to 0.38 ksi. The stress values
did not decrease smoothly as the distance from the end increased as illustrated in Figure
4-16. In this anchorage zone, the stresses decreased within h/4 but then increased at the
distance where the diagonal cracks developed. The stresses in this anchorage zone were
all below the average working stress assumed in the design phase, which indicates the
actual bursting force was lower than that predicted by the design model. This is
expected, since strut-and-tie models tend to produce conservative results.
100
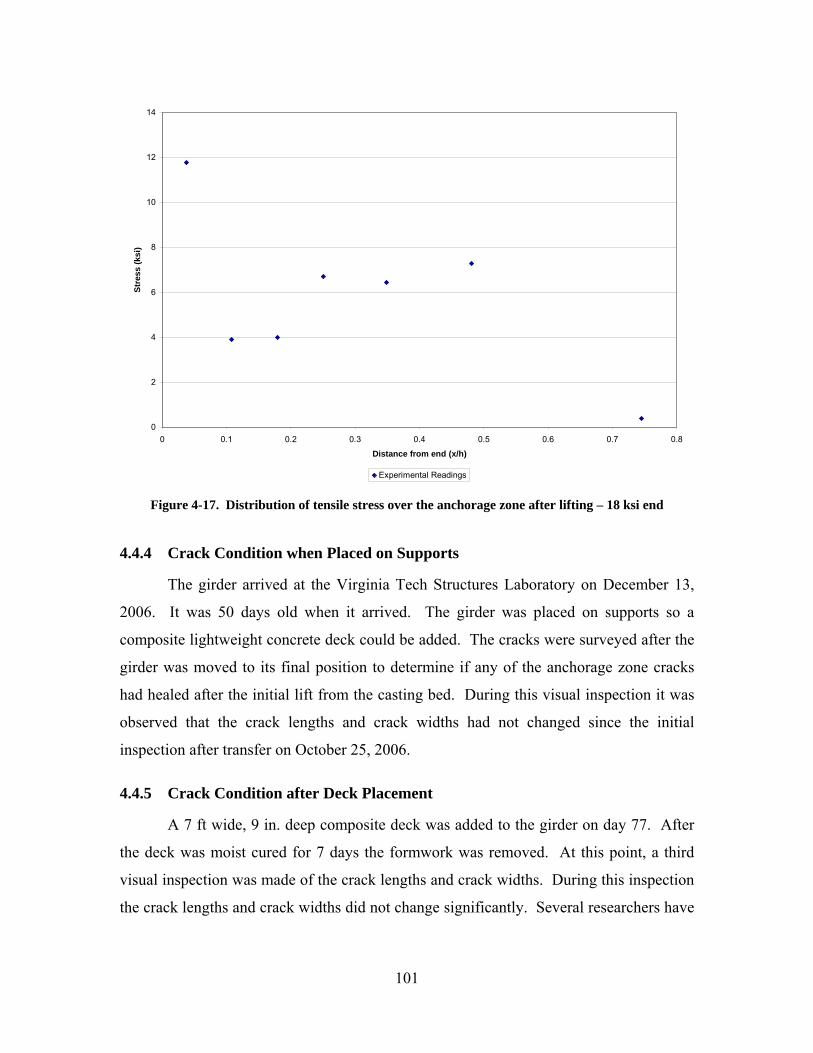
0
2
4
6
8
10
12
14
0 0.1 0.2 0.3 0.4 0.5 0.6 0.7 0.8
Distance from end (x/h)
Stre
ss (k
si)
Experimental Readings Figure 4-17. Distribution of tensile stress over the anchorage zone after lifting – 18 ksi end
4.4.4 Crack Condition when Placed on Supports
The girder arrived at the Virginia Tech Structures Laboratory on December 13,
2006. It was 50 days old when it arrived. The girder was placed on supports so a
composite lightweight concrete deck could be added. The cracks were surveyed after the
girder was moved to its final position to determine if any of the anchorage zone cracks
had healed after the initial lift from the casting bed. During this visual inspection it was
observed that the crack lengths and crack widths had not changed since the initial
inspection after transfer on October 25, 2006.
4.4.5 Crack Condition after Deck Placement
A 7 ft wide, 9 in. deep composite deck was added to the girder on day 77. After
the deck was moist cured for 7 days the formwork was removed. At this point, a third
visual inspection was made of the crack lengths and crack widths. During this inspection
the crack lengths and crack widths did not change significantly. Several researchers have
101

suggested the addition of self weight from the deck will close the cracks in the anchorage
zone, but this did not occur in this case.
4.5 Conclusions from Experimental Test
The goal of this test was to verify the design model for use in the VDOT PCBT
girders. The girder was instrumented in order to confirm some of the assumptions and
calibrations for the proposed anchorage zone model. Based on the visual comparison of
the two anchorage zones and the data recorded by the embedded strain gages, the new
anchorage zone design approach was successful.
The working stress recommendations outlined in section 3.3.2 provide flexibility
to customize the anchorage zone design based on material properties of the concrete and
environmental conditions. In this test, one anchorage zone was designed with a 12 ksi
working stress which matched the recommended working stress for lightweight concrete
members. This anchorage zone had an acceptable level of cracking. The other anchorage
zone used an 18 ksi working stress and the stirrup detail at this end exceeded the
minimum anchorage zone reinforcement required by AASHTO LRFD. The cracking at
this end of the girder, however, was not within the acceptable limits for this model.
The data recorded by the strain gages confirmed several assumptions of the design
model. First, the region affected by the diffusion of the prestress force extends beyond
h/4, which is the length that has traditionally been considered in the anchorage zone
design for pretensioned members. These results showed that a significant tension force
was present between h/4 and 3h/4 in the 18 ksi anchorage zone. The strain gage data also
confirmed the assumption to neglect the reaction and self weight in the strut-and-tie
models. The act of lifting the girder shortly after transfer increased the strain in the
stirrups. This strain increase was very sudden and large in the 18 ksi anchorage zone and
this end of the girder experienced a large level of cracking. The increase in strain the 12
ksi anchorage zone was present but was less dramatic.
102

Chapter 5. Conclusions and Recommendations
5.1 Summary
Field observations of PCBT girders have shown that many of the girders used in
Virginia develop cracks in the anchorage zone. The lengths and widths of the anchorage
zone cracks vary from acceptable to poor and in need of repair. The field surveys have
shown that the current AASHTO LRFD minimum anchorage zone reinforcement
requirement is usually adequate for shallow girders. Deep girders, heavily prestressed
girders, and girders cast with lightweight concrete, however, typically develop numerous
cracks in the anchorage zone when designed to meet AASHTO LRFD minimum
standards. The cracks in the anchorage zone are primarily a serviceability concern,
although in a few cases these cracks may also be a structural concern. The cracks in the
anchorage zone are also a concern from an ownership and inspection standpoint. Heavily
cracked anchorage zones will need to be monitored closely over the service life of the
structure and can be a burden for the owner.
Several experimental and analytical studies have been conducted to determine a
design approach for anchorage zones in pretensioned girders. Davis, et al. (2005)
proposed a new procedure which was based on two strut-and-tie models of the anchorage
zone. The geometries of the strut-and-tie models were calibrated based on field
observations of numerous PCBT girders. The proposed design approach also allowed for
customization of the anchorage zone design based on environmental conditions and
material considerations. The goal of this model was to reliably produce anchorage zones
with a minimal level of cracking. This new anchorage zone design model served as the
basis for this thesis.
This research had three objectives. The first objective was to develop design aids
for the anchorage zones of the VDOT PCBT girders. To achieve this objective a
parametric study was conducted using the anchorage zone design model proposed by
Davis, et al. The results of this parametric study were consolidated into anchorage zone
design tables which cover all nine PCBT cross sections used by VDOT. Design tables
were created for girders with lightweight and normal weight concrete. The second
103
objective was to conduct a full scale experimental test of the proposed anchorage zone
design model. This test was used to verify this design approach for application by
VDOT. A 65 ft long PCBT-53 girder with experimental anchorage zone reinforcement
details was constructed from lightweight SCC to support this test. The final objective
was to develop new anchorage zone standard details for VDOT which incorporate the
elements of this design model and are compatible with the anchorage zone design aids.
5.2 Conclusions
The following conclusions are made based on the analytical and experimental
portions of this research.
• For typical PCBT girders 61 in. or less in height, stressed with ½ in. strand,
and cast with normal weight concrete, the area of reinforcement required
within h/4 will slightly increase from current practice in Virginia. In many
cases the slight increase in the required reinforcement area will not result in
the addition of more stirrups.
• For typical PCBT girders taller than 61 in., stressed with ½ in. strand, and cast
with normal weight concrete, the area of reinforcement required within h/4
will increase from current practice by one to three stirrups depending on the
size of the stirrups selected for the anchorage zone reinforcement.
• All PCBT girders cast with lightweight concrete, girders subjected to harsh
environmental conditions, or girders stressed with 0.6 in. strand will require
significantly more stirrups within h/4 compared to current practice in Virginia.
To ensure good consolidation of the concrete and to reduce anchorage zone
congestion, bundled stirrups will typically be needed in the anchorage zone
for girders in these categories.
• For all girders, the area of reinforcement required between h/4 and 3h/4 is
always slightly less than that required within h/4. As a general rule, the same
number of stirrups placed within h/4 should be placed between h/4 and 3h/4 to
properly control the development of diagonal cracks in the upper portion of
the web.
104

• The anchorage zone details developed with these design aids are very similar
to the standard details for similar sized girders used by the North Carolina,
Florida, and Washington Departments of Transportation.
• The full-size, experimental lightweight PCBT-53 girder showed the anchorage
zone detail designed in accordance with the recommendations of the proposed
model had a very small amount of cracking. The anchorage zone detail
designed with a working stress of 18 ksi had a large amount of cracking which
would not be considered acceptable by the standards of this model.
• Readings from the instrumentation during the full scale test served to verify
several of the assumptions used in creating the model.
• There was a significant tensile force between h/4 and 3h/4 which suggested
the region affected by the diffusion of the prestress force is longer than h/4
This region located beyond h/4 should be considered in the design of the
anchorage zone reinforcement.
• Lifting the girder places the self weight dead load on the lifting provision.
Removing this reaction from the anchorage zone causes an increase in the
tension in the stirrups and can lead to crack development or crack
propagation.
5.3 Recommendations
Based upon the extent of cracking observed in the girders of many anchorage
zones manufactured for VDOT, the anchorage zone design tables and new standard
details should be implemented as soon as possible. Several bridge projects in Virginia
which have been initiated since this research began have already included anchorage
zones details redesigned with this approach. The overall cost of several additional
stirrups at each end of the beam is minimal, and this design procedure can has proven
effective at reducing anchorage zone cracking.
Further research should focus on developing evaluation criteria for the
acceptance, repair, or rejection of girders with anchorage zone cracking. While this
design method will reduce cracking, it is not likely to completely eliminate anchorage
zone cracking. Therefore, guidelines should be established to describe which anchorage
105

zone cracks should be accepted and which should be repaired or rejected. Some simple
guidelines were developed and used for this research; however, a more comprehensive
manual is needed to outline acceptable cracks based on final boundary conditions of the
in-place girder and environmental conditions. For cracks that do develop, guidelines are
needed to describe the appropriate type of repair, if necessary. Finally, clear rejection
criteria should also be developed so that owners and fabricators can recognize problems
immediately and take action before future beams are cast for a project.
Future research must also focus on quality control issues in precast facilities
throughout the nation. Many of the girders used for projects in Virginia are cast at two or
three different precast yards. Variability in the manufacturing procedures can be a factor
which exacerbates anchorage zone cracking. For example, girders located at the end of a
casting line could have wind blowing directly on one anchorage zone which may hinder
the curing process. Also, different manufacturers use different release techniques. The
girders observed in these field surveys were all flame cut with an acetylene torch. Other
states, such as Nebraska, use a gradual release. Research is needed to relate the release
method to the magnitude of cracking. Finally, an investigation into the tensile strength of
concrete at release is needed. The precast yards observed in this research conduct
compression tests on concrete cylinders before transfer, but do not conduct split cylinder
tensile tests. The development of tensile strength in early age concrete will have a large
impact on anchorage zone cracking.
Changes to the AASHTO LRFD provisions for anchorage zone reinforcement are
needed. The changes should include stress limit recommendations based on the materials
used and the environmental conditions. Changes to the code should also address large,
heavily prestressed girders which are becoming more common in today’s bridge
construction industry. As rejection criteria are established for crack development, code
changes are absolutely necessary since many of the girders observed in this research
which developed cracks did meet current code standards. This can put precasters in very
difficult and confusing situations.
A final aspect of future research should focus on long-term monitoring of the
performance and durability of bridges containing girders with anchorage zone cracks.
Structures that contain girders that have been repaired should also be studied to determine
106

the long-term performance and durability of the repair method. This future research
should focus on monitoring changes to cracks once the structure is completed and
subjected to live loads. These findings will be helpful to the development of the
evaluation, repair, and rejection criteria.
107
References
AASHTO (1998). AASHTO LRFD Bridge Design Specifications, Second Edition with 2001 Interims, American Association of State Highway and Transportation Officials, Washington, DC.
AASHTO (2004). AASHTO LRFD Bridge Design Specifications, Third Edition with
2006 Interims, American Association of State Highway and Transportation Officials, Washington, DC.
AASHTO (2003). Standard Specifications for Highway Bridges, 17th Edition, American
Association of State Highway and Transportation Officials, Washington, DC. ACI (2005). Building Code Requirements for Structural Concrete, ACI 318-05,
American Concrete Institute, Farmington Hills, Michigan. Australian Standard (2005). Australian Bridge Design Code, Section 5: Concrete.
AS5100.5-2004. Sydney, Austrailia. Canadian Standard Association (CSA). 2000. Canadian Highway Bridge Design Code:
A National Standard of Canada. CAN/CSA-S6-00. Toronto, ON, Canada: CSA. Castrodale, R. W., Lui, A., and White, C. D., (2002). “Simplified Analysis of Web
Splitting in Pretensioned Concrete Girders.” Proceedings, PCI/FHWA/NCBC Concrete Bridge Conference, Nashville, TN, October 6-9.
Davis, R. T., Buckner, D. C., and Ozyildirim, C., (2005). “Serviceability-Based Design
Method for Vertical Beam End Reinforcement.” Proceedings, PCI National Bridge Conference, Palm Springs, CA, October 16-19.
Foster, S. J., and Rogowsky, D. M. (1997). “Bursting Forces in Concrete Panels
Resulting from In-plane Concentrated Loads,” Magazine of Concrete Research, Vol. 49, No. 180, pp. 231-180.
Gergely, P. and Sozen, M. A. (1967). “Design of Anchorage Zone Reinforcement in
Prestressed Concrete Beams,” PCI Journal, Vol. 12, No. 2, pp. 63-75. Hengprathanee, S. (2004). “Linear and Nonlinear Finite Element Analyses of Anchorage
Zones in Post-Tensioned Concrete Structures,” Doctor of Philosophy Dissertation, Virginia Polytechnic and State University, Blacksburg, Virginia.
Kannel, J., French, C., and Stolarski, H. (1997). “Release Methodology of Strands to
Reduce End Cracking in Pretensioned Concrete Girders,” PCI Journal, Vol. 42, No. 1, pp. 42-54.
108
Manual for the Evaluation and Repair of Precast, Prestressed Concrete Bridge Products, Precast/Prestressed Concrete Institute, Chicago, Illinois, 2006.
Marshall, W. T., and Mattock, A. H. (1962). “Control of Horizontal Cracking in the
Ends of Pretensioned Prestressed Concrete Girders,” PCI Journal, Vol. 7, No. 5, pp. 56-74.
Naito, C. J., Parent, G., and Brunn, G. (2006). “Performance of Bulb-Tee Girders Made
with Self-Consolidating Concrete,” PCI Journal, Vol. 51, No. 6, pp. 72-85. Nilson, A. H. (1987). Design of Prestressed Concrete. John Wiley and Sons, New York. “North Carolina Department of Transportation Structure Design Unit.”
<http://www.ncdot.org/doh/preconstruct/highway/structur/strstandards/pdf/> (January 12, 2007).
O’Hagan, D. “Structures Design Office – 2005.2 English Standard Drawings 3/17/05.”
<http://www.dot.state.fl.us/structures/CADD/standards/2005.2Standards/standards.htm> (January 12, 2007).
Oklahoma Department of Transportation. “Bridge Design Standards Drawings – State
Bridges.” <http://www.okladot.state.ok.us/bridge/bridge99/sbindex.htm> (January 12, 2007).
Plesha, J. (2002). “Washington State Department of Transportation Bridge Standard
Drawings.” <http://www.wsdot.wa.gov/eesc/bridge/drawings/> (January 12, 2007).
Schlaich, J., Schafer, K., and Jennewein M., (1987). “Toward a Consistent Design of
Structural Concrete,” PCI Journal, Vol. 32, No. 3, pp. 74-150. Tuan, C. Y., Yehia, S. A., Jongpitaksseel, N., and Tadros, M., K. (2004). “End Zone
Reinforcement for Pretensioned Concrete Girders,” PCI Journal, Vol. 49, No. 3, pp. 68-82.
Virginia Department of Transportation. (2006). “Volume V – Part 4: Prestressed
Concrete Beam Standards.” <http://www.vdot.virginia.gov/business/bridge-v5p4.asp> (January 12, 2007).
Wollmann, G. P. and Roberts-Wollmann, C. L. (2000). Anchorage Zone Design, Reprint
of Chapter VIII, Post-Tensioning Manual, 6th Ed., Post-Tensioning Institute.
109

Appendix A. Calculations for PCBT-77 Case Study Girder
Virginia PCBT-77 Bridge Girder Data Depth of girder h = 77 in. Area of girder Ac = 970.7 in2
Height of centroid yb = 37.67 in. Moment of inertia I = 788700 in4
Girder self weight wo = 1011 lb/ft Girder Length L = 143 ft Girder Dimensions
47"4"
32"
7"
9"3"
3 1/2"3 1/2"
7"18"
2"/2"
2"
77"
Girder cross section at end
2 courtesy strands
6 harped strands
28 straight strands
2 1/2"
2"
All strands spaced 2" center-center
3"
110
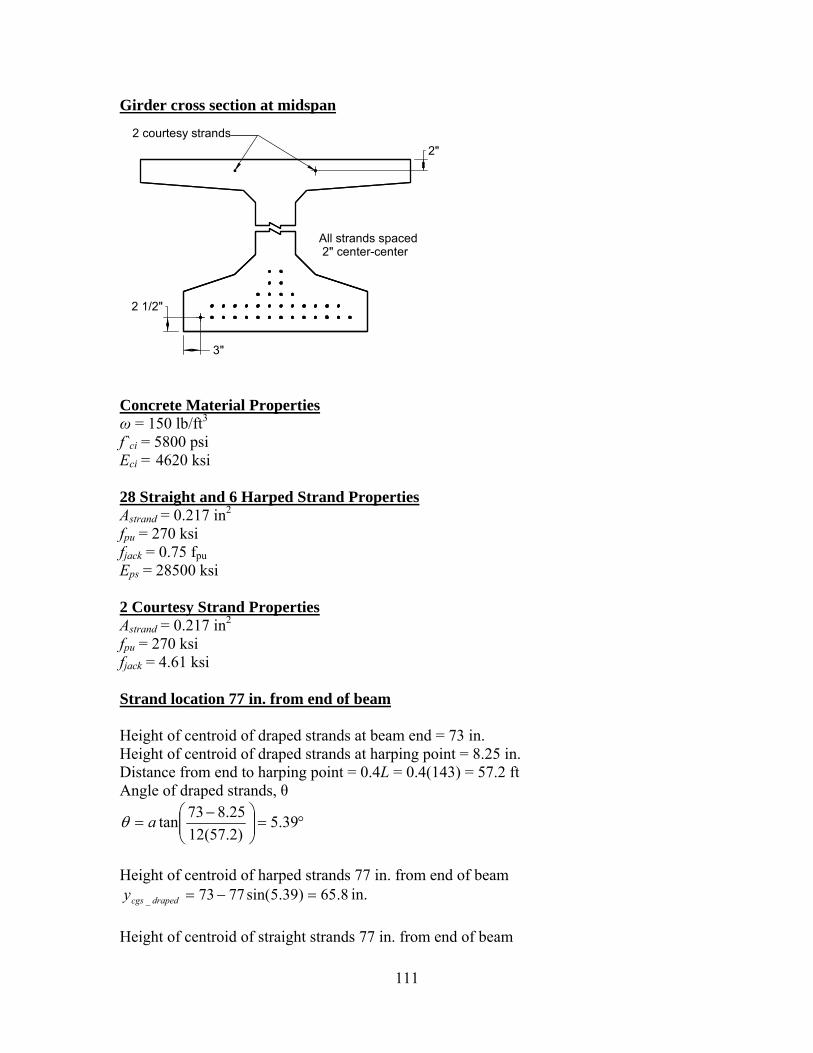
Girder cross section at midspan
2 courtesy strands
2 1/2"
2"
All strands spaced 2" center-center
3"
Concrete Material Properties ω = 150 lb/ft3
f`ci = 5800 psi Eci = 4620 ksi 28 Straight and 6 Harped Strand Properties Astrand = 0.217 in2
fpu = 270 ksi fjack = 0.75 fpuEps = 28500 ksi 2 Courtesy Strand Properties Astrand = 0.217 in2
fpu = 270 ksi fjack = 4.61 ksi Strand location 77 in. from end of beam Height of centroid of draped strands at beam end = 73 in. Height of centroid of draped strands at harping point = 8.25 in. Distance from end to harping point = 0.4L = 0.4(143) = 57.2 ft Angle of draped strands, θ
°=⎟⎟⎠
⎞⎜⎜⎝
⎛ −= 39.5
)2.57(1225.873tanaθ
Height of centroid of harped strands 77 in. from end of beam
8.65)39.5sin(7773_ =−=drapedcgsy in. Height of centroid of straight strands 77 in. from end of beam
111

39.328
)25.6(2)25.4(12)25.2(14_ =
++=harpedcgsy in.
Height of centroid of courtesy strands 77 in. from end of beam
73_ =courtesycgsy in. Properties of all prestressing steel 77 in. from end of beam Area (in2) yb (in) Io (in4) Pjack (k) 2 courtesy strands 0.434 75 0 2 6 harped strands 1.30 65.8 3.47 264 28 straight strands 6.08 3.39 9.42 1230 Total = 1496 kip Transformed section properties for section 77 in. from end of beam Section modulus at transfer, ni
17.6462028500
===ci
psi E
En
At (in2) yb (in) Atyb (in2) At(yb-yt)2 (in4) Iot (in4) It (in4) Concrete 970.7 37.67 36,570 621 788,700 789,321Courtesy Strands 2.24 75 168 3,257 0 3,257 Harped Strands 6.72 65.8 443 5,633 17.94 5,651 Straight Strands 31.41 3.39 106.5 35,208 48.7 35,257
Total = 1,011 Total = 37,280 Total = 833,486
87.36011,1280,37
==ty in. from bottom of beam
Sample calculations for highlighted values
72.6)30.1)(117.6()1( _ =−=−= harpedpsit AnA in2
94.17)47.3)(117.6()1( _ =−=−= harpedoiot InI in4
Stresses from prestress force for section 77 in. from end of beam
112

t
tstraightbtstraightharpedbtharpedcourtesybtcourtesy
t
TOTjackbot I
yyyPyyPyyPA
Pf
)]()()([ ____ −+−+−+=
486,83387.36)]39.387.36(1230)8.6587.36(264)7587.36(2[
011,1496,1 −−−−−−
+−
=botf
96.2−=botf ksi
t
tstraightbtstraightharpedbtharpedcourtesybtcourtesy
t
TOTjacktop I
hyyyPyyPyyPA
Pf
))](()()([ ____ −−+−+−+=
486,833)7787.36)](39.387.36(1230)8.6587.36(264)7587.36(2[
011,1496,1 −−−−−−−
+−
=topf
132.0=topf ksi
113

Force in the strand groups after transfer
)]([75.0 __ bottop
straightbbotipustraightcg ff
hy
fnff −++=
1.185)]96.2132.0(7739.396.2[17.6)270(75.0_ =++−+=straightcgf ksi
1124)217.0)(28(1.185 ==straightP kip
)]([75.0 __ bottop
harpedbbotipuharpedcg ff
hy
fnff −++=
5.200)]96.2132.0(77
8.6596.2[17.6)270(75.0_ =++−+=harpedcgf ksi
1.261)217.0)(6(5.200 ==harpedP kip
)]([ __ bottop
courtesybbotijackcourtesycg ff
hy
fnff −++=
93.4)]96.2132.0(777596.2[17.661.4_ =++−+=courtesycgf ksi
14.2)217.0)(2(93.4 ==courtesyP kip
Integrate stress over concrete area from bottom of girder up until resultant force in concrete equals the applied force in the straight strand group (1124 kip)
Height
(in) Width (in)
Stress (ksi)
Force (kip)
yb (in)
yb · Force (in-kip)
Σ Force (kip)
0 32 -2.96 0 0 0 0 7 32 -2.68 -632 3.44 -2,175 -632 10 14 -2.56 -180.8 8.49 -1,535 -812.8
13.5 7 -2.42 -91.5 11.7 -1,071 -904.3 28.3 7 -1.82 -220 20.6 -4,532 -1,124
Σ = -9,311 Sample calculations for highlighted values
632)07(2
)68.296.2(2
)3232(−=−
−−+=Force kip
114

44.3)96.268.2(3
]96.2)68.2(2)[07(=
++−
=by in.
Find location of the resultant force in the concrete
28.8124,1311,9
tan_ =−−
=tresulby in.
Unbalanced internal moment
straightstraightbtresulb PyyM )( _tan_ −=
5496)1124)(39.328.8( =−=M in-k Note: Integrating the stress over concrete area from top of girder down, will produce the same unbalanced moment within the section Solve the strut and tie models
1124 kip1124 kip
8.28"3.39"
77"
263 kip
261 kip
11.12"32.18"
67 3/8"
48 1/8"
T1 = 114 kip
T2 = 81.6 kipT2 = 81.6 kip
T1 = 114 kip
114125.48
54961 ==T kip 6.81
375.675496
2 ==T kip
115

Design the reinforcement Select an average operating stress for stirrups based on concrete type and environment fs = 18 ksi Area of steel required for lower strut and tie model
53.418
6.812 ===s
s fTA in2
Select 7 No. 5 bars uniformly distributed over h/4 Area of steel required for upper strut and tie model
33.618
1141 ===s
s fTA in2
Note: The model assumes this area of steel is uniformly distributed from the end of the girder to 3h/4 even though the area of stirrup reinforcement within h/4 will be more densely spaced. Area of steel required from h/4 to 3h/4
22.475.0
)5.0(33.6)5.0(75.033.6
=== hh
As in2
Select 7 No. 5 bars uniformly distributed from h/4 to 3h/4 Note: The area of steel required from h/4 to 3h/4 shall be compared to the area of steel required in this region for horizontal shear transfer and the larger requirement will control.
116
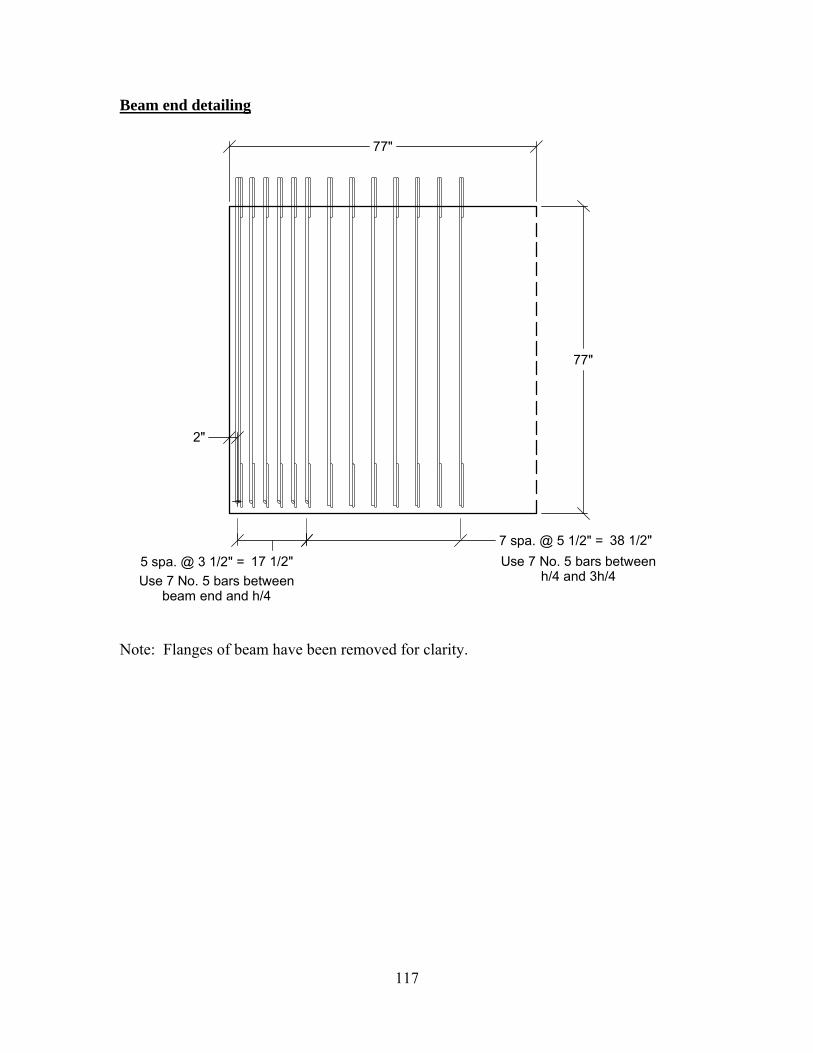
Beam end detailing
117
17 1/2"5 spa. @ 3 1/2" =38 1/2"7 spa. @ 5 1/2" =
2"
77"
77"
Use 7 No. 5 bars betweenbeam end and h/4
Use 7 No. 5 bars betweenh/4 and 3h/4
Note: Flanges of beam have been removed for clarity.
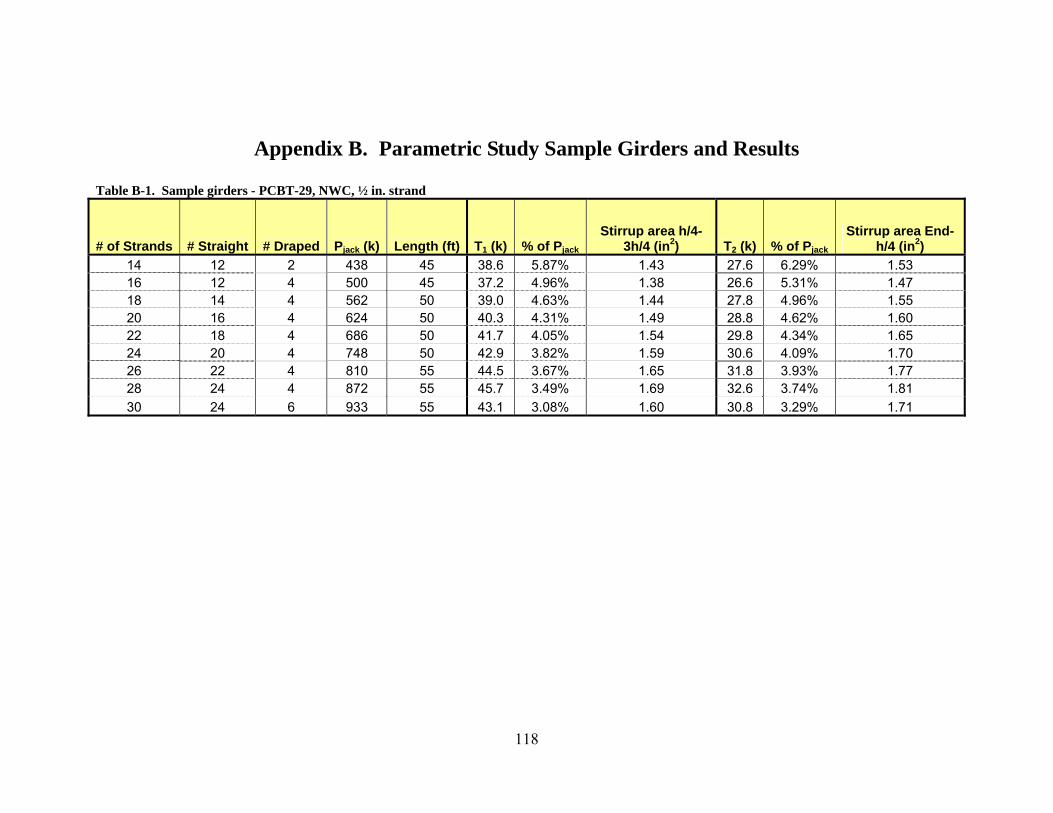
Appendix B. Parametric Study Sample Girders and Results Table B-1. Sample girders - PCBT-29, NWC, ½ in. strand
# of Strands # Straight # Draped Pjack (k) Length (ft) T1 (k) % of Pjack
Stirrup area h/4-3h/4 (in2) T2 (k) % of Pjack
Stirrup area End-h/4 (in2)
14 12 2 438 45 38.6 5.87% 1.43 27.6 6.29% 1.53 16 12 4 500 45 37.2 4.96% 1.38 26.6 5.31% 1.47 18 14 4 562 50 39.0 4.63% 1.44 27.8 4.96% 1.55 20 16 4 624 50 40.3 4.31% 1.49 28.8 4.62% 1.60 22 18 4 686 50 41.7 4.05% 1.54 29.8 4.34% 1.65 24 20 4 748 50 42.9 3.82% 1.59 30.6 4.09% 1.70 26 22 4 810 55 44.5 3.67% 1.65 31.8 3.93% 1.77 28 24 4 872 55 45.7 3.49% 1.69 32.6 3.74% 1.81 30 24 6 933 55 43.1 3.08% 1.60 30.8 3.29% 1.71
118
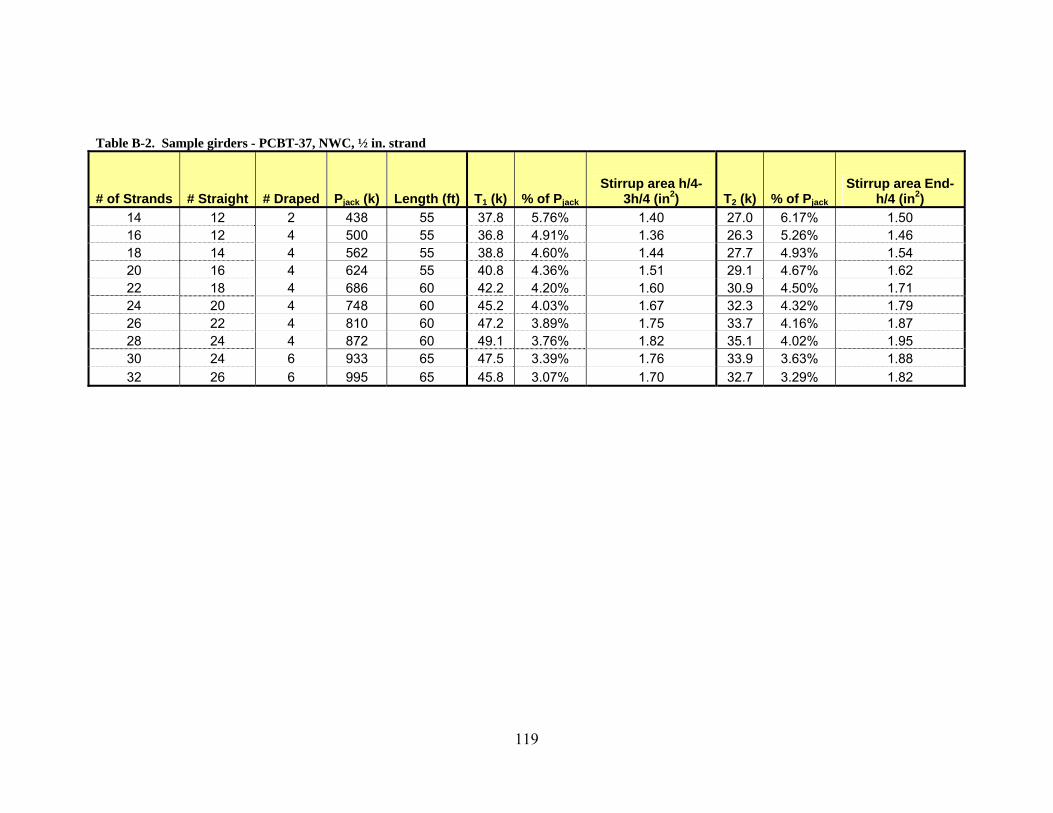
Table B-2. Sample girders - PCBT-37, NWC, ½ in. strand
# of Strands # Straight # Draped Pjack (k) Length (ft) T1 (k) % of Pjack
Stirrup area h/4-3h/4 (in2) T2 (k) % of Pjack
Stirrup area End-h/4 (in2)
14 12 2 438 55 37.8 5.76% 1.40 27.0 6.17% 1.50 16 12 4 500 55 36.8 4.91% 1.36 26.3 5.26% 1.46 18 14 4 562 55 38.8 4.60% 1.44 27.7 4.93% 1.54 20 16 4 624 55 40.8 4.36% 1.51 29.1 4.67% 1.62 22 18 4 686 60 42.2 4.20% 1.60 30.9 4.50% 1.71 24 20 4 748 60 45.2 4.03% 1.67 32.3 4.32% 1.79 26 22 4 810 60 47.2 3.89% 1.75 33.7 4.16% 1.87 28 24 4 872 60 49.1 3.76% 1.82 35.1 4.02% 1.95 30 24 6 933 65 47.5 3.39% 1.76 33.9 3.63% 1.88 32 26 6 995 65 45.8 3.07% 1.70 32.7 3.29% 1.82
119

Table B-3. Sample girders - PCBT-45, NWC, ½ in. strand
# of Strands # Straight # Draped Pjack (k) Length (ft) T1 (k) % of Pjack
Stirrup area h/4-3h/4 (in2) T2 (k) % of Pjack
Stirrup area End-h/4 (in2)
18 14 4 562 65 40.1 4.76% 1.49 28.7 5.10% 1.59 20 16 4 624 70 43.4 4.64% 1.61 31.0 4.97% 1.72 22 18 4 686 70 46.2 4.49% 1.71 33.0 4.82% 1.84 24 20 4 748 70 49.0 4.37% 1.81 35.0 4.68% 1.94 26 22 4 810 70 51.8 4.26% 1.92 37.0 4.57% 2.06 28 24 4 872 75 54.9 4.20% 2.03 39.2 4.50% 2.18 30 24 6 933 75 53.1 3.79% 1.97 37.9 4.06% 2.11 32 26 6 995 75 52.8 3.54% 1.96 37.7 3.79% 2.10 34 28 6 1057 75 52.6 3.32% 1.95 37.6 3.55% 2.09 36 30 6 1119 75 51.7 3.08% 1.92 37.0 3.30% 2.05 38 32 6 1181 80 52.8 2.98% 1.96 37.7 3.19% 2.09 40 34 6 1243 80 52.7 2.82% 1.95 37.6 3.03% 2.09
Table B-4. Sample girders – PCBT-45, NWC, 0.6 in. strand
# of Strands # Straight # Draped Pjack (k) Length (ft) T1 (k) % of Pjack
Stirrup area h/4-3h/4 (in2) T2 (k) % of Pjack
Stirrup area End-h/4 (in2)
22 18 4 971 75 63.8 4.38% 2.36 45.6 4.69% 2.53 24 20 4 1059 75 67.3 4.24% 2.49 48.1 4.54% 2.67 26 22 4 1147 75 70.7 4.11% 2.62 50.5 4.41% 2.81 28 24 4 1234 80 74.6 4.03% 2.76 53.3 4.32% 2.96 30 24 6 1322 80 72.3 3.65% 2.68 51.7 3.91% 2.87 32 26 6 1410 80 71.6 3.38% 2.65 51.1 3.62% 2.84
120

Table B-5. Sample girders – PCBT-53, NWC, ½ in. strand
# of Strands # Straight # Draped Pjack (k) Length (ft) T1 (k) % of Pjack
Stirrup area h/4-3h/4 (in2) T2 (k) % of Pjack
Stirrup area End-h/4 (in2)
24 20 4 748 80 52.7 4.70% 1.95 37.6 5.03% 2.09 26 22 4 810 85 56.0 4.61% 2.07 40.0 4.95% 2.23 28 24 4 872 85 59.3 4.53% 2.19 42.3 4.86% 2.35 30 24 6 933 85 57.7 4.12% 2.14 41.2 4.42% 2.29 32 26 6 995 85 58.5 3.92% 2.17 41.8 4.20% 2.32 34 28 6 1057 90 59.9 3.78% 2.22 42.8 4.05% 2.38 36 30 6 1119 90 60.7 3.62% 2.25 43.4 3.88% 2.41 38 32 6 1181 90 61.5 3.47% 2.28 44.0 3.72% 2.44 40 34 6 1243 90 59.1 3.17% 2.19 42.2 3.40% 2.35 42 34 8 1305 90 59.9 3.06% 2.22 42.8 3.28% 2.38 44 36 8 1367 90 58.3 2.85% 2.16 41.7 3.05% 2.32
Table B-6. Sample girders – PCBT-53, NWC, 0.6 in. strand
# of Strands # Straight # Draped Pjack (k) Length (ft) T1 (k) % of Pjack
Stirrup area h/4-3h/4 (in2) T2 (k) % of Pjack
Stirrup area End-h/4 (in2)
22 18 4 971 85 67.4 4.63% 2.50 48.2 4.96% 2.67 24 20 4 1059 90 72.3 4.55% 2.68 51.6 4.88% 2.87 26 22 4 1147 90 76.5 4.45% 2.83 54.6 4.77% 3.04 28 24 4 1234 90 80.6 4.35% 2.98 57.6 4.66% 3.20 30 24 6 1322 90 78.7 3.97% 2.92 56.2 4.25% 3.12 32 26 6 1410 90 79.4 3.75% 2.94 56.7 4.02% 3.15
121
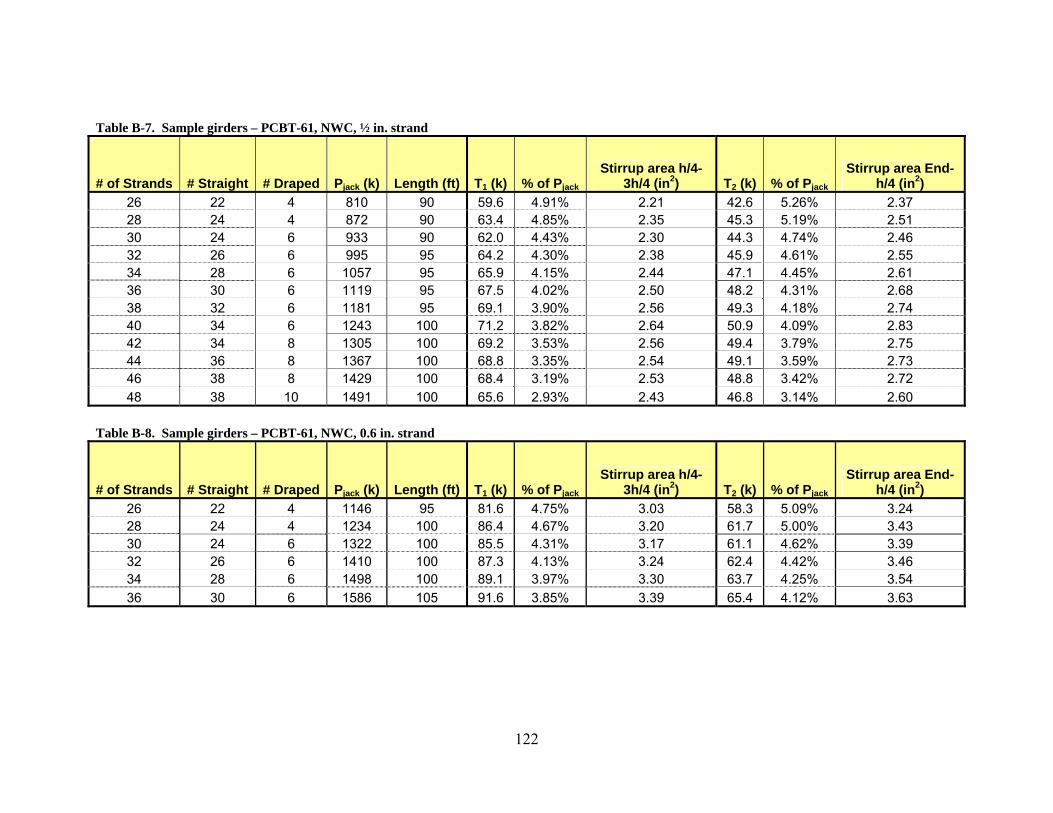
Table B-7. Sample girders – PCBT-61, NWC, ½ in. strand
# of Strands # Straight # Draped Pjack (k) Length (ft) T1 (k) % of Pjack
Stirrup area h/4-3h/4 (in2) T2 (k) % of Pjack
Stirrup area End-h/4 (in2)
26 22 4 810 90 59.6 4.91% 2.21 42.6 5.26% 2.37 28 24 4 872 90 63.4 4.85% 2.35 45.3 5.19% 2.51 30 24 6 933 90 62.0 4.43% 2.30 44.3 4.74% 2.46 32 26 6 995 95 64.2 4.30% 2.38 45.9 4.61% 2.55 34 28 6 1057 95 65.9 4.15% 2.44 47.1 4.45% 2.61 36 30 6 1119 95 67.5 4.02% 2.50 48.2 4.31% 2.68 38 32 6 1181 95 69.1 3.90% 2.56 49.3 4.18% 2.74 40 34 6 1243 100 71.2 3.82% 2.64 50.9 4.09% 2.83 42 34 8 1305 100 69.2 3.53% 2.56 49.4 3.79% 2.75 44 36 8 1367 100 68.8 3.35% 2.54 49.1 3.59% 2.73 46 38 8 1429 100 68.4 3.19% 2.53 48.8 3.42% 2.72 48 38 10 1491 100 65.6 2.93% 2.43 46.8 3.14% 2.60
Table B-8. Sample girders – PCBT-61, NWC, 0.6 in. strand
# of Strands # Straight # Draped Pjack (k) Length (ft) T1 (k) % of Pjack
Stirrup area h/4-3h/4 (in2) T2 (k) % of Pjack
Stirrup area End-h/4 (in2)
26 22 4 1146 95 81.6 4.75% 3.03 58.3 5.09% 3.24 28 24 4 1234 100 86.4 4.67% 3.20 61.7 5.00% 3.43 30 24 6 1322 100 85.5 4.31% 3.17 61.1 4.62% 3.39 32 26 6 1410 100 87.3 4.13% 3.24 62.4 4.42% 3.46 34 28 6 1498 100 89.1 3.97% 3.30 63.7 4.25% 3.54 36 30 6 1586 105 91.6 3.85% 3.39 65.4 4.12% 3.63
122

Table B-9. Sample girders – PCBT-69, NWC, ½ in. strand
# of Strands # Straight # Draped Pjack (k) Length (ft) T1 (k) % of Pjack
Stirrup area h/4-3h/4 (in2) T2 (k) % of Pjack
Stirrup area End-h/4 (in2)
30 24 6 935 105 67.4 4.81% 2.50 48.1 5.15% 2.68 32 26 6 997 105 69.7 4.67% 2.59 49.8 5.00% 2.77 34 28 6 1059 110 72.6 4.58% 2.69 51.9 4.90% 2.88 36 30 6 1121 110 74.9 4.46% 2.78 53.5 4.78% 2.98 38 32 6 1183 110 77.2 4.36% 2.87 55.1 4.67% 3.07 40 34 6 1245 110 79.4 4.26% 2.95 56.7 4.56% 3.15 42 34 8 1307 115 78.5 4.01% 2.91 56.1 4.29% 3.11 44 36 8 1369 115 79.0 3.85% 2.93 56.4 4.12% 3.13 46 38 8 1431 115 79.4 3.71% 2.95 56.7 3.97% 3.16 48 38 10 1493 115 77.2 3.45% 2.86 55.2 3.70% 3.07
Table B-10. Sample girders – PCBT-69, NWC, 0.6 in. strand
# of Strands # Straight # Draped Pjack (k) Length (ft) T1 (k) % of Pjack
Stirrup area h/4-3h/4 (in2) T2 (k) % of Pjack
Stirrup area End-h/4 (in2)
28 24 4 1236 115 93.9 5.06% 3.48 65.1 5.43% 3.73 30 24 6 1324 115 92.9 4.68% 3.44 66.4 5.02% 3.69 32 26 6 1412 115 95.7 4.53% 3.55 69.4 4.85% 3.80 34 28 6 1500 115 98.5 4.38% 3.65 70.4 4.70% 3.92 36 30 6 1588 115 101 4.25% 3.75 72.3 4.56% 4.02 38 32 6 1676 115 104 4.14% 3.85 74.3 4.43% 4.12
123
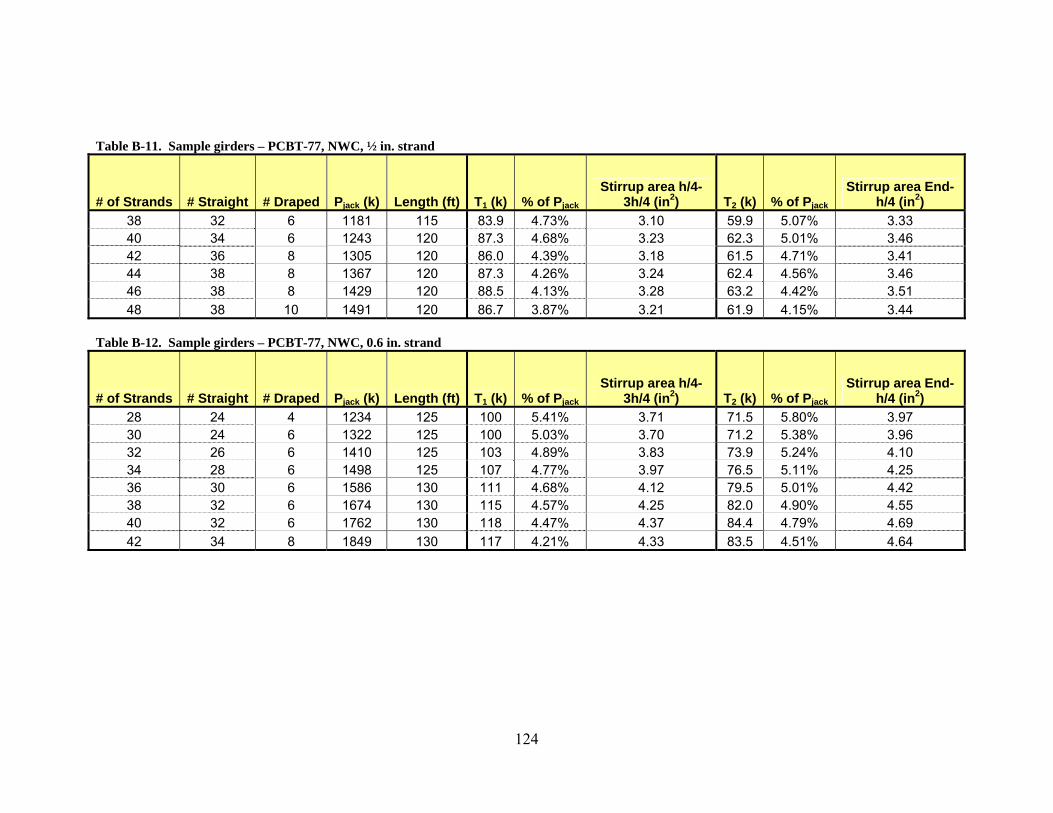
Table B-11. Sample girders – PCBT-77, NWC, ½ in. strand
# of Strands # Straight # Draped Pjack (k) Length (ft) T1 (k) % of Pjack
Stirrup area h/4-3h/4 (in2) T2 (k) % of Pjack
Stirrup area End-h/4 (in2)
38 32 6 1181 115 83.9 4.73% 3.10 59.9 5.07% 3.33 40 34 6 1243 120 87.3 4.68% 3.23 62.3 5.01% 3.46 42 36 8 1305 120 86.0 4.39% 3.18 61.5 4.71% 3.41 44 38 8 1367 120 87.3 4.26% 3.24 62.4 4.56% 3.46 46 38 8 1429 120 88.5 4.13% 3.28 63.2 4.42% 3.51 48 38 10 1491 120 86.7 3.87% 3.21 61.9 4.15% 3.44
Table B-12. Sample girders – PCBT-77, NWC, 0.6 in. strand
# of Strands # Straight # Draped Pjack (k) Length (ft) T1 (k) % of Pjack
Stirrup area h/4-3h/4 (in2) T2 (k) % of Pjack
Stirrup area End-h/4 (in2)
28 24 4 1234 125 100 5.41% 3.71 71.5 5.80% 3.97 30 24 6 1322 125 100 5.03% 3.70 71.2 5.38% 3.96 32 26 6 1410 125 103 4.89% 3.83 73.9 5.24% 4.10 34 28 6 1498 125 107 4.77% 3.97 76.5 5.11% 4.25 36 30 6 1586 130 111 4.68% 4.12 79.5 5.01% 4.42 38 32 6 1674 130 115 4.57% 4.25 82.0 4.90% 4.55 40 32 6 1762 130 118 4.47% 4.37 84.4 4.79% 4.69 42 34 8 1849 130 117 4.21% 4.33 83.5 4.51% 4.64
124
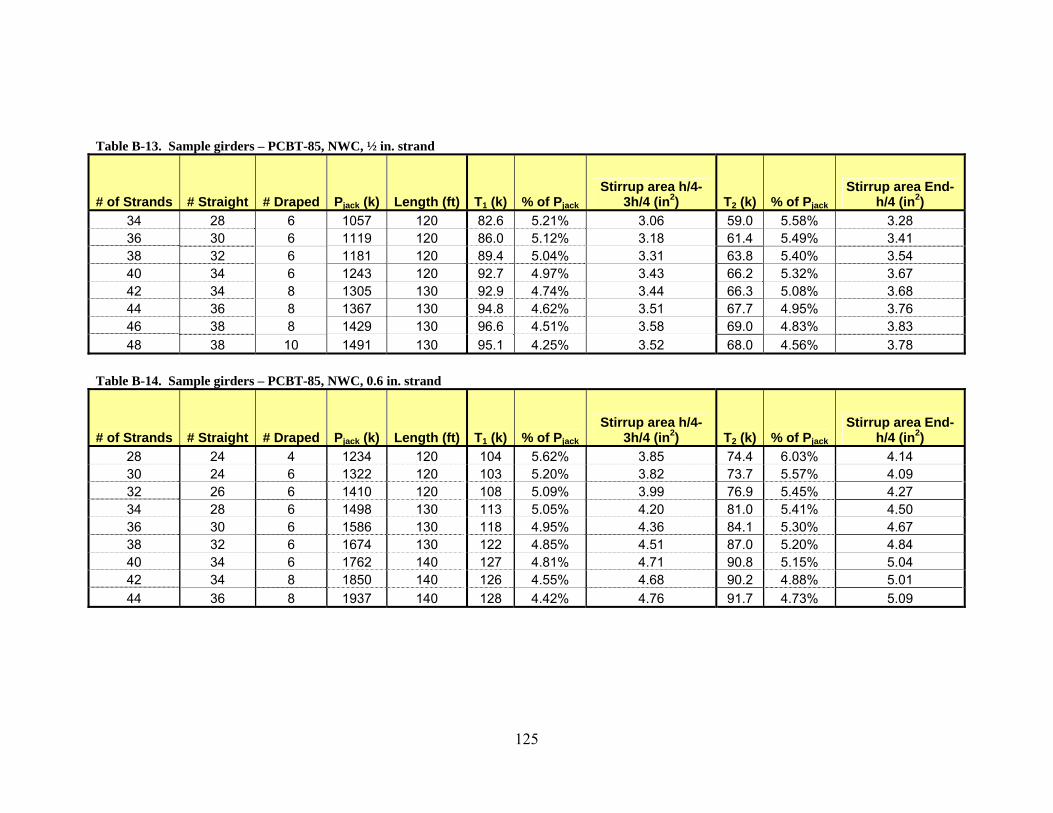
Table B-13. Sample girders – PCBT-85, NWC, ½ in. strand
# of Strands # Straight # Draped Pjack (k) Length (ft) T1 (k) % of Pjack
Stirrup area h/4-3h/4 (in2) T2 (k) % of Pjack
Stirrup area End-h/4 (in2)
34 28 6 1057 120 82.6 5.21% 3.06 59.0 5.58% 3.28 36 30 6 1119 120 86.0 5.12% 3.18 61.4 5.49% 3.41 38 32 6 1181 120 89.4 5.04% 3.31 63.8 5.40% 3.54 40 34 6 1243 120 92.7 4.97% 3.43 66.2 5.32% 3.67 42 34 8 1305 130 92.9 4.74% 3.44 66.3 5.08% 3.68 44 36 8 1367 130 94.8 4.62% 3.51 67.7 4.95% 3.76 46 38 8 1429 130 96.6 4.51% 3.58 69.0 4.83% 3.83 48 38 10 1491 130 95.1 4.25% 3.52 68.0 4.56% 3.78
Table B-14. Sample girders – PCBT-85, NWC, 0.6 in. strand
# of Strands # Straight # Draped Pjack (k) Length (ft) T1 (k) % of Pjack
Stirrup area h/4-3h/4 (in2) T2 (k) % of Pjack
Stirrup area End-h/4 (in2)
28 24 4 1234 120 104 5.62% 3.85 74.4 6.03% 4.14 30 24 6 1322 120 103 5.20% 3.82 73.7 5.57% 4.09 32 26 6 1410 120 108 5.09% 3.99 76.9 5.45% 4.27 34 28 6 1498 130 113 5.05% 4.20 81.0 5.41% 4.50 36 30 6 1586 130 118 4.95% 4.36 84.1 5.30% 4.67 38 32 6 1674 130 122 4.85% 4.51 87.0 5.20% 4.84 40 34 6 1762 140 127 4.81% 4.71 90.8 5.15% 5.04 42 34 8 1850 140 126 4.55% 4.68 90.2 4.88% 5.01 44 36 8 1937 140 128 4.42% 4.76 91.7 4.73% 5.09
125
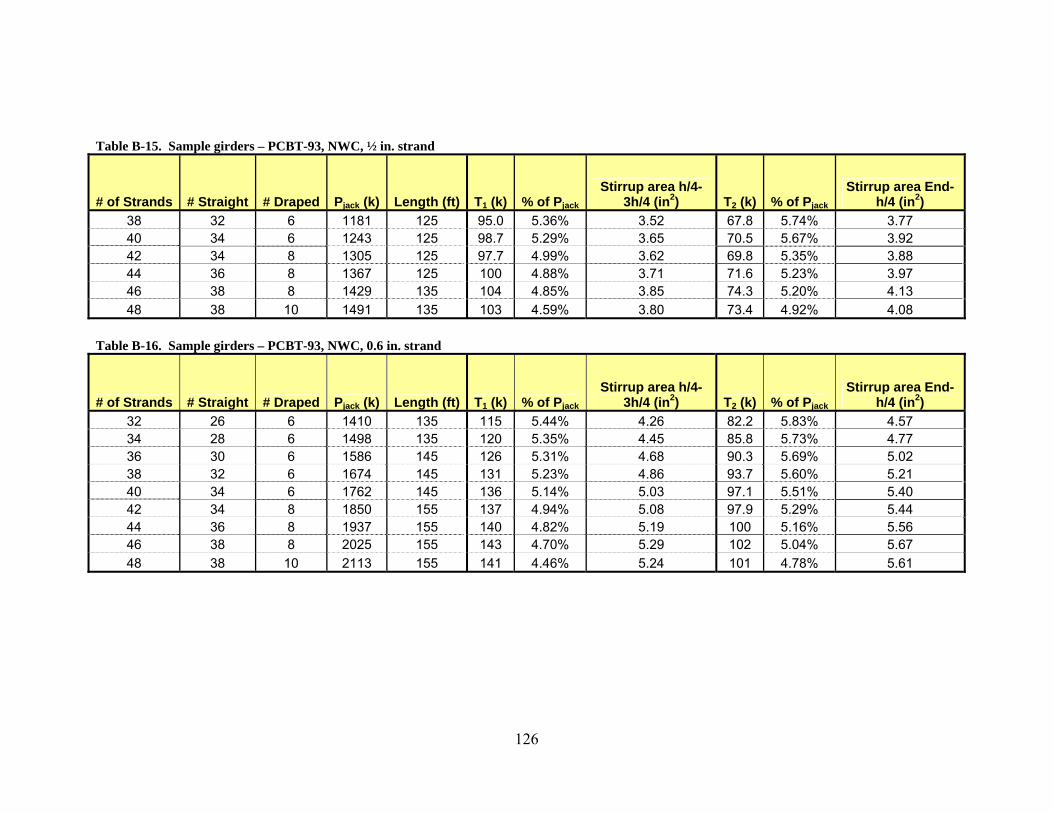
Table B-15. Sample girders – PCBT-93, NWC, ½ in. strand
# of Strands # Straight # Draped Pjack (k) Length (ft) T1 (k) % of Pjack
Stirrup area h/4-3h/4 (in2) T2 (k) % of Pjack
Stirrup area End-h/4 (in2)
38 32 6 1181 125 95.0 5.36% 3.52 67.8 5.74% 3.77 40 34 6 1243 125 98.7 5.29% 3.65 70.5 5.67% 3.92 42 34 8 1305 125 97.7 4.99% 3.62 69.8 5.35% 3.88 44 36 8 1367 125 100 4.88% 3.71 71.6 5.23% 3.97 46 38 8 1429 135 104 4.85% 3.85 74.3 5.20% 4.13 48 38 10 1491 135 103 4.59% 3.80 73.4 4.92% 4.08
Table B-16. Sample girders – PCBT-93, NWC, 0.6 in. strand
# of Strands # Straight # Draped Pjack (k) Length (ft) T1 (k) % of Pjack
Stirrup area h/4-3h/4 (in2) T2 (k) % of Pjack
Stirrup area End-h/4 (in2)
32 26 6 1410 135 115 5.44% 4.26 82.2 5.83% 4.57 34 28 6 1498 135 120 5.35% 4.45 85.8 5.73% 4.77 36 30 6 1586 145 126 5.31% 4.68 90.3 5.69% 5.02 38 32 6 1674 145 131 5.23% 4.86 93.7 5.60% 5.21 40 34 6 1762 145 136 5.14% 5.03 97.1 5.51% 5.40 42 34 8 1850 155 137 4.94% 5.08 97.9 5.29% 5.44 44 36 8 1937 155 140 4.82% 5.19 100 5.16% 5.56 46 38 8 2025 155 143 4.70% 5.29 102 5.04% 5.67 48 38 10 2113 155 141 4.46% 5.24 101 4.78% 5.61
126
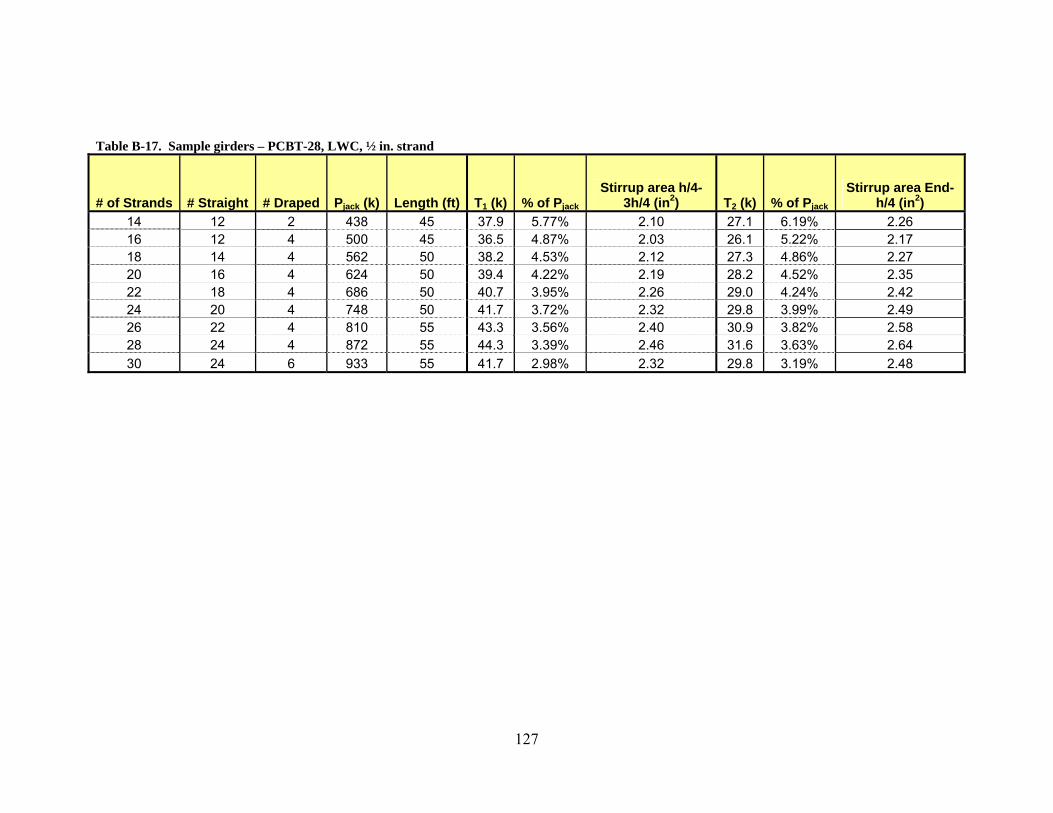
Table B-17. Sample girders – PCBT-28, LWC, ½ in. strand
# of Strands # Straight # Draped Pjack (k) Length (ft) T1 (k) % of Pjack
Stirrup area h/4-3h/4 (in2) T2 (k) % of Pjack
Stirrup area End-h/4 (in2)
14 12 2 438 45 37.9 5.77% 2.10 27.1 6.19% 2.26 16 12 4 500 45 36.5 4.87% 2.03 26.1 5.22% 2.17 18 14 4 562 50 38.2 4.53% 2.12 27.3 4.86% 2.27 20 16 4 624 50 39.4 4.22% 2.19 28.2 4.52% 2.35 22 18 4 686 50 40.7 3.95% 2.26 29.0 4.24% 2.42 24 20 4 748 50 41.7 3.72% 2.32 29.8 3.99% 2.49 26 22 4 810 55 43.3 3.56% 2.40 30.9 3.82% 2.58 28 24 4 872 55 44.3 3.39% 2.46 31.6 3.63% 2.64 30 24 6 933 55 41.7 2.98% 2.32 29.8 3.19% 2.48
127

Table B-18. Sample girders – PCBT-37, LWC, ½ in. strand
# of Strands # Straight # Draped Pjack (k) Length (ft) T1 (k) % of Pjack
Stirrup area h/4-3h/4 (in2) T2 (k) % of Pjack
Stirrup area End-h/4 (in2)
14 12 2 438 55 37.2 5.67% 2.07 26.6 6.08% 2.22 16 12 4 500 55 36.2 4.83% 2.01 25.8 5.17% 2.15 18 14 4 562 55 38.0 4.51% 2.11 27.2 4.84% 2.27 20 16 4 624 55 39.9 4.27% 2.22 28.5 4.57% 2.38 22 18 4 686 60 42.3 4.11% 2.35 30.2 4.40% 2.51 24 20 4 748 60 44.1 3.93% 2.45 31.5 4.21% 2.62 26 22 4 810 60 45.9 3.78% 2.55 32.8 4.05% 2.73 28 24 4 872 60 47.7 3.65% 2.65 34.1 3.91% 2.84 30 24 6 933 65 46.1 3.29% 2.56 32.9 3.52% 2.74 32 26 6 995 65 44.4 2.97% 2.46 31.7 3.18% 2.64
128
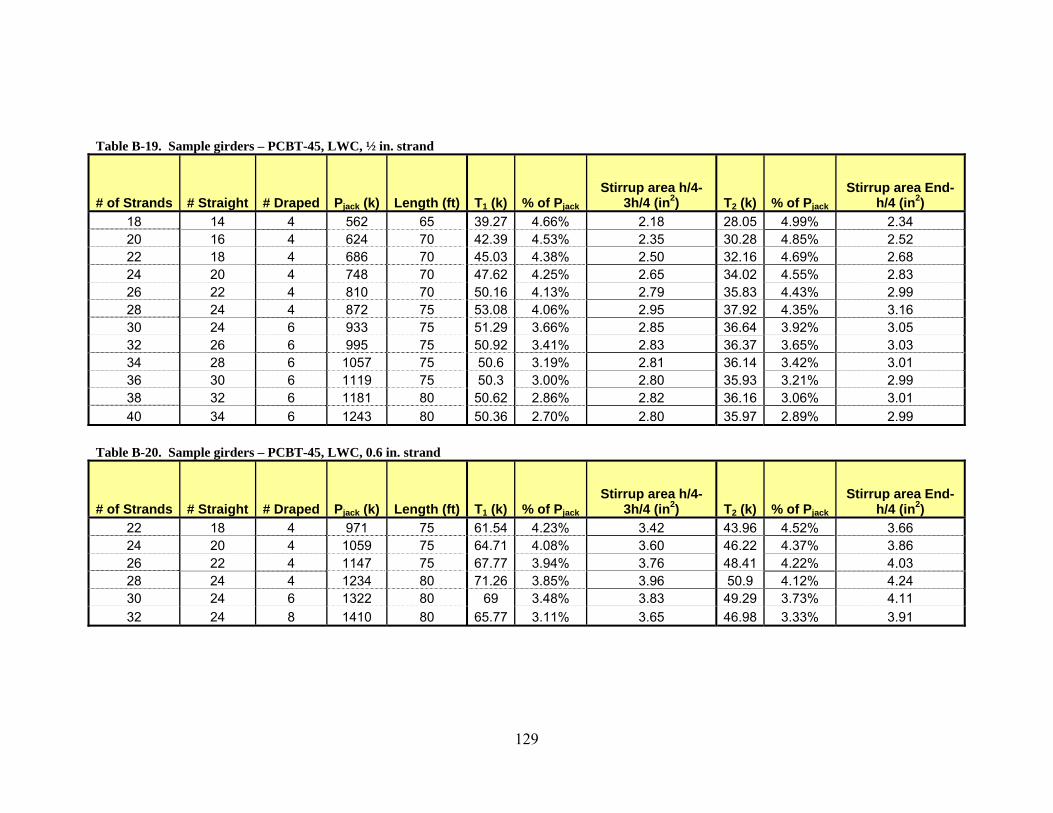
Table B-19. Sample girders – PCBT-45, LWC, ½ in. strand
# of Strands # Straight # Draped Pjack (k) Length (ft) T1 (k) % of Pjack
Stirrup area h/4-3h/4 (in2) T2 (k) % of Pjack
Stirrup area End-h/4 (in2)
18 14 4 562 65 39.27 4.66% 2.18 28.05 4.99% 2.34 20 16 4 624 70 42.39 4.53% 2.35 30.28 4.85% 2.52 22 18 4 686 70 45.03 4.38% 2.50 32.16 4.69% 2.68 24 20 4 748 70 47.62 4.25% 2.65 34.02 4.55% 2.83 26 22 4 810 70 50.16 4.13% 2.79 35.83 4.43% 2.99 28 24 4 872 75 53.08 4.06% 2.95 37.92 4.35% 3.16 30 24 6 933 75 51.29 3.66% 2.85 36.64 3.92% 3.05 32 26 6 995 75 50.92 3.41% 2.83 36.37 3.65% 3.03 34 28 6 1057 75 50.6 3.19% 2.81 36.14 3.42% 3.01 36 30 6 1119 75 50.3 3.00% 2.80 35.93 3.21% 2.99 38 32 6 1181 80 50.62 2.86% 2.82 36.16 3.06% 3.01 40 34 6 1243 80 50.36 2.70% 2.80 35.97 2.89% 2.99
Table B-20. Sample girders – PCBT-45, LWC, 0.6 in. strand
# of Strands # Straight # Draped Pjack (k) Length (ft) T1 (k) % of Pjack
Stirrup area h/4-3h/4 (in2) T2 (k) % of Pjack
Stirrup area End-h/4 (in2)
22 18 4 971 75 61.54 4.23% 3.42 43.96 4.52% 3.66 24 20 4 1059 75 64.71 4.08% 3.60 46.22 4.37% 3.86 26 22 4 1147 75 67.77 3.94% 3.76 48.41 4.22% 4.03 28 24 4 1234 80 71.26 3.85% 3.96 50.9 4.12% 4.24 30 24 6 1322 80 69 3.48% 3.83 49.29 3.73% 4.11 32 24 8 1410 80 65.77 3.11% 3.65 46.98 3.33% 3.91
129

Table B-21. Sample girders – PCBT-53, LWC, ½ in. strand
# of Strands # Straight # Draped Pjack (k) Length (ft) T1 (k) % of Pjack
Stirrup area h/4-3h/4 (in2) T2 (k) % of Pjack
Stirrup area End-h/4 (in2)
18 14 4 562 80 41.3 4.90% 2.29 29.5 5.25% 2.46 20 16 4 624 80 44.6 4.77% 2.48 31.9 5.11% 2.66 22 18 4 686 80 47.9 4.66% 2.66 34.2 4.99% 2.85 24 20 4 748 80 51.1 4.56% 2.84 36.5 4.88% 3.04 26 22 4 810 85 54.7 4.50% 3.04 39.1 4.83% 3.26 28 24 4 872 85 57.8 4.42% 3.21 41.3 4.73% 3.44 30 24 6 933 85 56.2 4.02% 3.13 40.2 4.30% 3.34 32 26 6 995 85 56.9 3.81% 3.16 40.7 4.08% 3.38 34 28 6 1057 90 58.2 3.67% 3.23 41.6 3.93% 3.46 36 30 6 1119 90 58.9 3.51% 3.27 42.0 3.76% 3.51 38 32 6 1181 90 59.5 3.36% 3.31 42.5 3.60% 3.54 40 34 6 1243 90 60.2 3.23% 3.35 43.0 3.46% 3.58 42 34 8 1305 90 57.7 2.95% 3.21 41.2 3.16% 3.44 44 36 8 1367 90 56.2 2.74% 3.12 40.1 2.94% 3.35
Table B-22. Sample girders – PCBT-53, LWC, 0.6 in. strand
# of Strands # Straight # Draped Pjack (k) Length (ft) T1 (k) % of Pjack
Stirrup area h/4-3h/4 (in2) T2 (k) % of Pjack
Stirrup area End-h/4 (in2)
22 18 4 971 85 66.1 4.54% 3.67 47.2 4.87% 3.94 24 20 4 1059 90 70.2 4.42% 3.90 50.1 4.73% 4.17 26 22 4 1147 90 74.0 4.31% 4.12 52.9 4.61% 4.40 28 24 4 1234 90 77.8 4.20% 4.32 55.6 4.50% 4.63 30 24 6 1322 90 75.9 3.83% 4.22 54.2 4.10% 4.52 32 26 6 1410 90 76.4 3.61% 4.24 54.5 3.87% 4.55
130

Table B-23. Sample girders – PCBT-61, LWC, ½ in. strand
# of Strands # Straight # Draped Pjack (k) Length (ft) T1 (k) % of Pjack
Stirrup area h/4-3h/4 (in2) T2 (k) % of Pjack
Stirrup area End-h/4 (in2)
26 22 4 810 90 58.3 4.80% 3.24 41.6 5.14% 3.47 28 24 4 872 90 61.8 4.73% 3.44 44.2 5.07% 3.68 30 24 6 933 90 60.5 4.32% 3.36 43.2 4.63% 3.60 32 26 6 995 95 62.5 4.19% 3.48 44.7 4.49% 3.72 34 28 6 1057 95 64.0 4.04% 3.56 45.7 4.33% 3.82 36 30 6 1119 95 65.5 3.90% 3.64 46.8 4.18% 3.90 38 32 6 1181 95 66.9 3.78% 3.72 47.8 4.05% 3.99 40 34 6 1243 100 68.9 3.69% 3.82 49.2 3.96% 4.10 42 34 8 1305 100 66.9 3.42% 3.72 47.8 3.66% 3.98 44 36 8 1367 100 66.4 3.24% 3.69 47.4 3.47% 3.95 46 38 8 1429 100 65.9 3.07% 3.66 47.1 3.29% 3.92 48 38 10 1491 100 63.1 2.82% 3.50 45.1 3.02% 3.75
Table B-24. Sample girders – PCBT-61, LWC, 0.6 in. strand
# of Strands # Straight # Draped Pjack (k) Length (ft) T1 (k) % of Pjack
Stirrup area h/4-3h/4 (in2) T2 (k) % of Pjack
Stirrup area End-h/4 (in2)
26 22 4 1146 95 79.1 4.60% 4.39 56.5 4.93% 4.71 28 24 4 1234 100 84.1 4.54% 4.67 60.1 4.87% 5.01 30 24 6 1322 100 82.6 4.16% 4.58 59.0 4.46% 4.91 32 26 6 1410 100 84.2 3.98% 4.68 60.1 4.27% 5.02 34 28 6 1498 100 85.7 3.82% 4.77 61.3 4.09% 5.11 36 28 8 1586 105 84.1 3.53% 4.67 60.1 3.79% 5.01
131
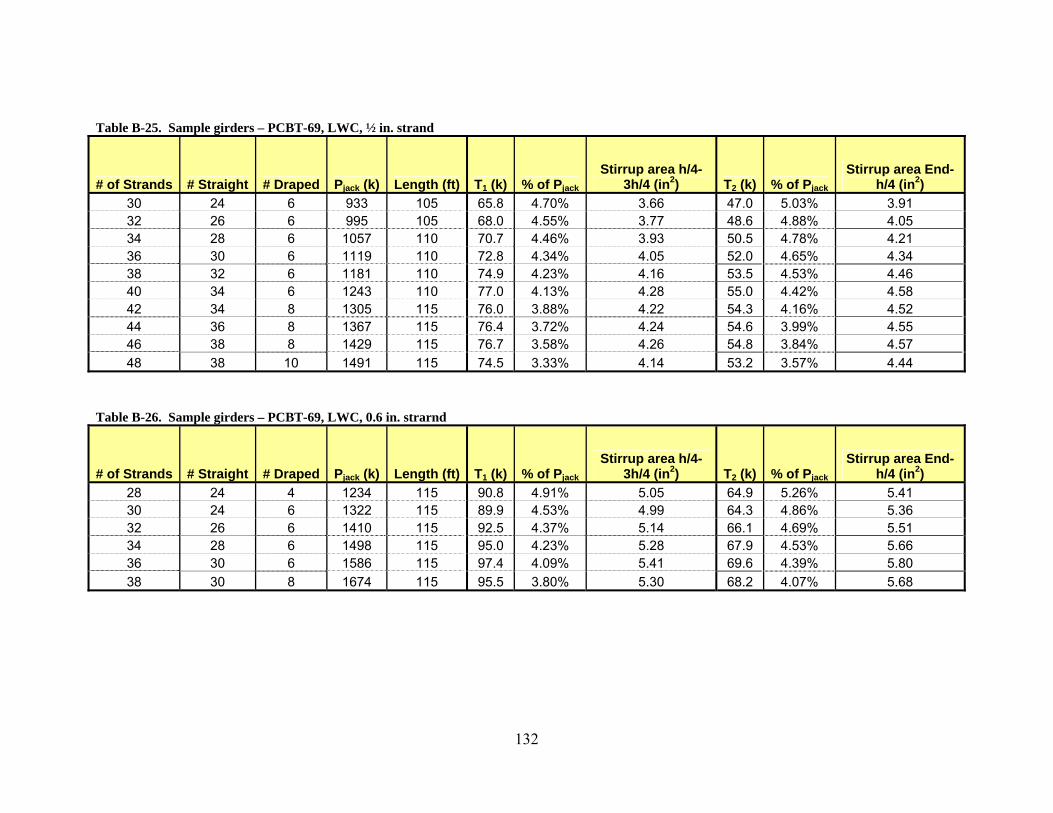
Table B-25. Sample girders – PCBT-69, LWC, ½ in. strand
# of Strands # Straight # Draped Pjack (k) Length (ft) T1 (k) % of Pjack
Stirrup area h/4-3h/4 (in2) T2 (k) % of Pjack
Stirrup area End-h/4 (in2)
30 24 6 933 105 65.8 4.70% 3.66 47.0 5.03% 3.91 32 26 6 995 105 68.0 4.55% 3.77 48.6 4.88% 4.05 34 28 6 1057 110 70.7 4.46% 3.93 50.5 4.78% 4.21 36 30 6 1119 110 72.8 4.34% 4.05 52.0 4.65% 4.34 38 32 6 1181 110 74.9 4.23% 4.16 53.5 4.53% 4.46 40 34 6 1243 110 77.0 4.13% 4.28 55.0 4.42% 4.58 42 34 8 1305 115 76.0 3.88% 4.22 54.3 4.16% 4.52 44 36 8 1367 115 76.4 3.72% 4.24 54.6 3.99% 4.55 46 38 8 1429 115 76.7 3.58% 4.26 54.8 3.84% 4.57 48 38 10 1491 115 74.5 3.33% 4.14 53.2 3.57% 4.44
Table B-26. Sample girders – PCBT-69, LWC, 0.6 in. strarnd
# of Strands # Straight # Draped Pjack (k) Length (ft) T1 (k) % of Pjack
Stirrup area h/4-3h/4 (in2) T2 (k) % of Pjack
Stirrup area End-h/4 (in2)
28 24 4 1234 115 90.8 4.91% 5.05 64.9 5.26% 5.41 30 24 6 1322 115 89.9 4.53% 4.99 64.3 4.86% 5.36 32 26 6 1410 115 92.5 4.37% 5.14 66.1 4.69% 5.51 34 28 6 1498 115 95.0 4.23% 5.28 67.9 4.53% 5.66 36 30 6 1586 115 97.4 4.09% 5.41 69.6 4.39% 5.80 38 30 8 1674 115 95.5 3.80% 5.30 68.2 4.07% 5.68
132
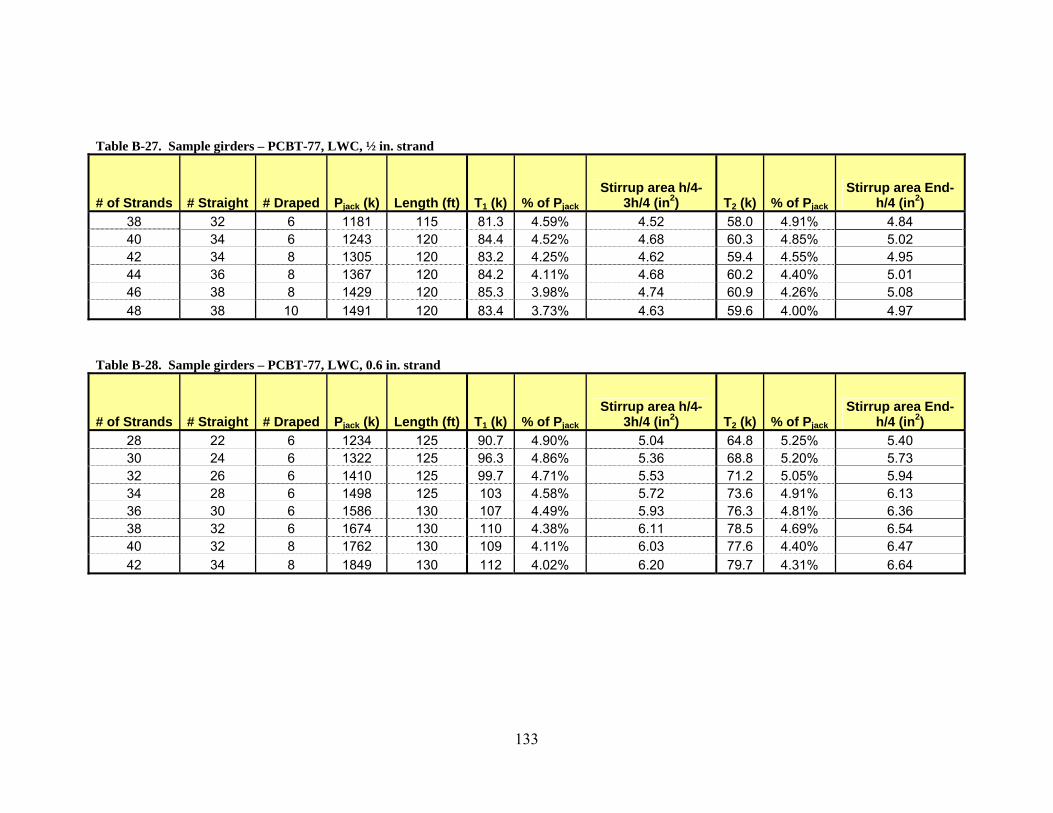
Table B-27. Sample girders – PCBT-77, LWC, ½ in. strand
# of Strands # Straight # Draped Pjack (k) Length (ft) T1 (k) % of Pjack
Stirrup area h/4-3h/4 (in2) T2 (k) % of Pjack
Stirrup area End-h/4 (in2)
38 32 6 1181 115 81.3 4.59% 4.52 58.0 4.91% 4.84 40 34 6 1243 120 84.4 4.52% 4.68 60.3 4.85% 5.02 42 34 8 1305 120 83.2 4.25% 4.62 59.4 4.55% 4.95 44 36 8 1367 120 84.2 4.11% 4.68 60.2 4.40% 5.01 46 38 8 1429 120 85.3 3.98% 4.74 60.9 4.26% 5.08 48 38 10 1491 120 83.4 3.73% 4.63 59.6 4.00% 4.97
Table B-28. Sample girders – PCBT-77, LWC, 0.6 in. strand
# of Strands # Straight # Draped Pjack (k) Length (ft) T1 (k) % of Pjack
Stirrup area h/4-3h/4 (in2) T2 (k) % of Pjack
Stirrup area End-h/4 (in2)
28 22 6 1234 125 90.7 4.90% 5.04 64.8 5.25% 5.40 30 24 6 1322 125 96.3 4.86% 5.36 68.8 5.20% 5.73 32 26 6 1410 125 99.7 4.71% 5.53 71.2 5.05% 5.94 34 28 6 1498 125 103 4.58% 5.72 73.6 4.91% 6.13 36 30 6 1586 130 107 4.49% 5.93 76.3 4.81% 6.36 38 32 6 1674 130 110 4.38% 6.11 78.5 4.69% 6.54 40 32 8 1762 130 109 4.11% 6.03 77.6 4.40% 6.47 42 34 8 1849 130 112 4.02% 6.20 79.7 4.31% 6.64
133
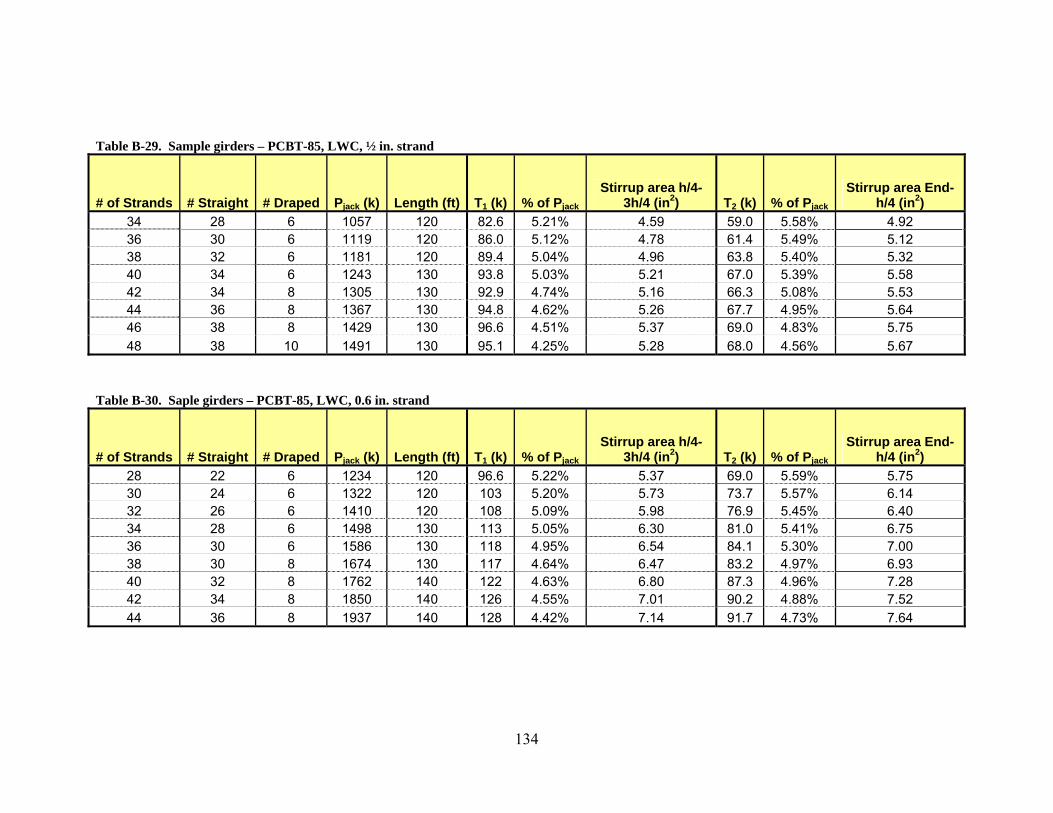
Table B-29. Sample girders – PCBT-85, LWC, ½ in. strand
# of Strands # Straight # Draped Pjack (k) Length (ft) T1 (k) % of Pjack
Stirrup area h/4-3h/4 (in2) T2 (k) % of Pjack
Stirrup area End-h/4 (in2)
34 28 6 1057 120 82.6 5.21% 4.59 59.0 5.58% 4.92 36 30 6 1119 120 86.0 5.12% 4.78 61.4 5.49% 5.12 38 32 6 1181 120 89.4 5.04% 4.96 63.8 5.40% 5.32 40 34 6 1243 130 93.8 5.03% 5.21 67.0 5.39% 5.58 42 34 8 1305 130 92.9 4.74% 5.16 66.3 5.08% 5.53 44 36 8 1367 130 94.8 4.62% 5.26 67.7 4.95% 5.64 46 38 8 1429 130 96.6 4.51% 5.37 69.0 4.83% 5.75 48 38 10 1491 130 95.1 4.25% 5.28 68.0 4.56% 5.67
Table B-30. Saple girders – PCBT-85, LWC, 0.6 in. strand
# of Strands # Straight # Draped Pjack (k) Length (ft) T1 (k) % of Pjack
Stirrup area h/4-3h/4 (in2) T2 (k) % of Pjack
Stirrup area End-h/4 (in2)
28 22 6 1234 120 96.6 5.22% 5.37 69.0 5.59% 5.75 30 24 6 1322 120 103 5.20% 5.73 73.7 5.57% 6.14 32 26 6 1410 120 108 5.09% 5.98 76.9 5.45% 6.40 34 28 6 1498 130 113 5.05% 6.30 81.0 5.41% 6.75 36 30 6 1586 130 118 4.95% 6.54 84.1 5.30% 7.00 38 30 8 1674 130 117 4.64% 6.47 83.2 4.97% 6.93 40 32 8 1762 140 122 4.63% 6.80 87.3 4.96% 7.28 42 34 8 1850 140 126 4.55% 7.01 90.2 4.88% 7.52 44 36 8 1937 140 128 4.42% 7.14 91.7 4.73% 7.64
134
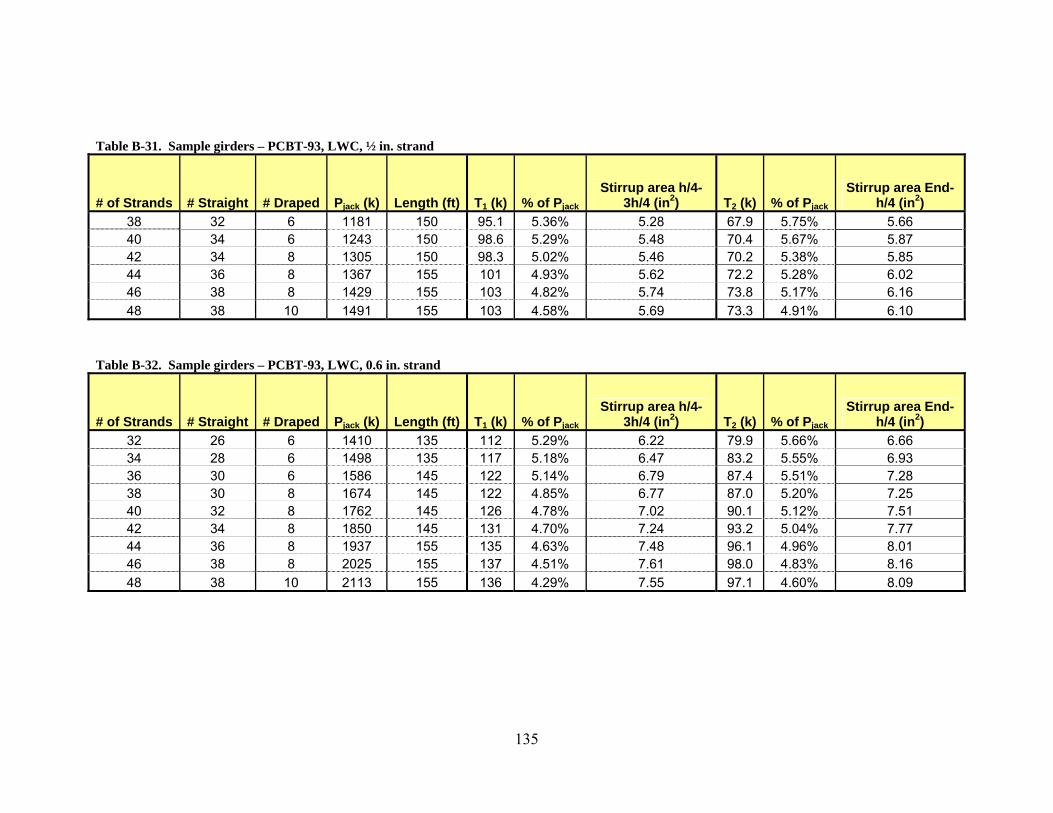
135
Table B-31. Sample girders – PCBT-93, LWC, ½ in. strand
# of Strands # Straight # Draped Pjack (k) Length (ft) T1 (k) % of Pjack
Stirrup area h/4-3h/4 (in2) T2 (k) % of Pjack
Stirrup area End-h/4 (in2)
38 32 6 1181 150 95.1 5.36% 5.28 67.9 5.75% 5.66 40 34 6 1243 150 98.6 5.29% 5.48 70.4 5.67% 5.87 42 34 8 1305 150 98.3 5.02% 5.46 70.2 5.38% 5.85 44 36 8 1367 155 101 4.93% 5.62 72.2 5.28% 6.02 46 38 8 1429 155 103 4.82% 5.74 73.8 5.17% 6.16 48 38 10 1491 155 103 4.58% 5.69 73.3 4.91% 6.10
Table B-32. Sample girders – PCBT-93, LWC, 0.6 in. strand
# of Strands # Straight # Draped Pjack (k) Length (ft) T1 (k) % of Pjack
Stirrup area h/4-3h/4 (in2) T2 (k) % of Pjack
Stirrup area End-h/4 (in2)
32 26 6 1410 135 112 5.29% 6.22 79.9 5.66% 6.66 34 28 6 1498 135 117 5.18% 6.47 83.2 5.55% 6.93 36 30 6 1586 145 122 5.14% 6.79 87.4 5.51% 7.28 38 30 8 1674 145 122 4.85% 6.77 87.0 5.20% 7.25 40 32 8 1762 145 126 4.78% 7.02 90.1 5.12% 7.51 42 34 8 1850 145 131 4.70% 7.24 93.2 5.04% 7.77 44 36 8 1937 155 135 4.63% 7.48 96.1 4.96% 8.01 46 38 8 2025 155 137 4.51% 7.61 98.0 4.83% 8.16 48 38 10 2113 155 136 4.29% 7.55 97.1 4.60% 8.09

Appendix C. End Zone Design Tables Table C-1. PCBT-29, Normal Weight Concrete, Beam End Design Table Normal Weight Concrete Stirrup Stress = 18 ksi
End - h/4 h/4-3h/4 A B C D E F G H
No. of ½" strands Aps (in2)
Areq'd (in2)
Quantity and size
Number and spacing size
Areq'd (in2)
Quantity and size
Number and spacing size
20 or less 3.06 1.60 4 No. 4 2 spa. @ 2.5" 1.49 4 No. 4 4 spa. @ 3.75" 22 or more 3.37 1.65 5 No. 4 2 spa. @ 2.5" 1.54 4 No. 4 5 spa. @ 3" Table C-2. PCBT-29, Light Weight Concrete, Beam End Design Table Light Weight Concrete Stirrup Stress = 12 ksi End - h/4 h/4-3h/4
A B C D E F G H No. of ½" strands Aps (in2)
Areq'd (in2)
Quantity and size
Number and spacing size
Areq'd (in2)
Quantity and size
Number and spacing size
22 or less 3.37 2.42 4 No. 5 2 spa. @ 2.5" 2.26 4 No. 5 4 spa. @ 3.75" 24 or more 3.67 2.49 5 No. 5 2 spa. @ 2.5" 2.32 4 No. 5 4 spa. @ 3.75"
136

Table C-3. PCBT-37, Normal Weight Concrete, Beam End Design Table Normal Weight Concrete Stirrup Stress = 18 ksi End - h/4 h/4-3h/4
A B C D E F G H
No. of ½" strands Aps (in2)
Areq'd (in2)
Quantity and size
Number and spacing size
Areq'd (in2)
Quantity and size
Number and spacing size
≤ 18 2.75 1.54 4 No. 4 2 spa. @ 3.5" 1.44 4 No. 4 4 spa. @ 4.5" ≤ 22 3.37 1.71 5 No. 4 2 spa. @ 3.5" 1.60 4 No. 4 4 spa. @ 4.5"
24 or more 3.06 1.62 5 No. 4 2 spa. @ 3.5" 1.51 5 No. 4 5 spa. @ 3.75" Table C-4. PCBT-37, Light Weight Concrete, Beam End Design Table Light Weight Concrete Stirrup Stress = 12 ksi End - h/4 h/4-3h/4
A B C D E F G H
No. of ½" strands Aps (in2)
Areq'd (in2)
Quantity and size
Number and spacing size
Areq'd (in2)
Quantity and size
Number and spacing size
≤ 20 3.06 2.38 4 No. 5 2 spa. @ 3.5" 2.22 4 No. 5 4 spa. @ 4.5" ≤ 24 3.67 2.62 5 No. 5 2 spa. @ 3.5" 2.45 4 No. 5 4 spa. @ 4.5"
26 or more 3.98 2.73 5 No. 5 2 spa. @ 3.5" 2.55 5 No. 5 5 spa. @ 3.75"
137

Table C-5. PCBT-45, Normal Weight Concrete, Beam End Design Table Normal Weight Concrete Stirrup Stress = 18 ksi End - h/4 h/4-3h/4
A B C D E F G H No. of ½" strands Aps (in2)
Areq'd (in2)
Quantity and size
Number and spacing size
Areq'd (in2)
Quantity and size
Number and spacing size
≤ 24 3.67 1.94 5 No. 4 3 spa. @ 3" 1.81 5 No. 4 5 spa. @ 4.5" 26 3.98 2.06 6 No. 4 3 spa. @ 3" 1.92 5 No. 4 5 spa. @ 4.5"
28 or more 4.28 2.18 6 No. 4 3 spa. @ 3" 2.03 6 No. 4 6 spa. @ 3.75"
No. of 0.6" strands Aps (in2)
Areq'd (in2)
Quantity and size
Number and spacing size
Areq'd (in2)
Quantity and size
Number and spacing size
≤ 22 4.77 2.53 5 No. 5 3 spa. @ 3" 2.36 4 No. 5 4 spa. @ 5.5" 24 or more 5.21 2.67 5 No. 5 3 spa. @ 3" 2.49 5 No. 5 5 spa. @ 4.5" Table C-6. PCBT-45, Light Weight Concrete, Beam End Design Table Light Weight Concrete Stirrup Stress = 12 ksi End - h/4 h/4-3h/4
A B C D E F G H No. of ½" strands Aps (in2)
Areq'd (in2)
Quantity and size
Number and spacing size
Areq'd (in2)
Quantity and size
Number and spacing size
≤ 20 3.06 2.52 5 No. 5 3 spa. @ 3" 2.35 4 No. 5 4 spa. @ 5.5" ≤ 26 3.98 2.99 5 No. 5 3 spa. @ 3" 2.79 5 No. 5 5 spa. @ 4.5"
28 or more 4.28 3.16 6 No. 5 3 spa. @ 3" 2.95 5 No. 5 5 spa. @ 4.5"
No. of 0.6" strands Aps (in2)
Areq'd (in2)
Quantity and size
Number and spacing size
Areq'd (in2)
Quantity and size
Number and spacing size
≤ 22 4.77 3.66 6 No. 5 3 spa. @ 3" 3.42 6 No. 5 6 spa. @ 3.75" ≤ 26 5.64 4.03 7 No. 5 3 spa. @ 3" 3.76 7 No. 5 7 spa. @ 3.25"
28 or more 6.08 4.24 7 No. 5 3 spa. @ 3" 3.96 7 No. 5 7 spa. @ 3.25"
138
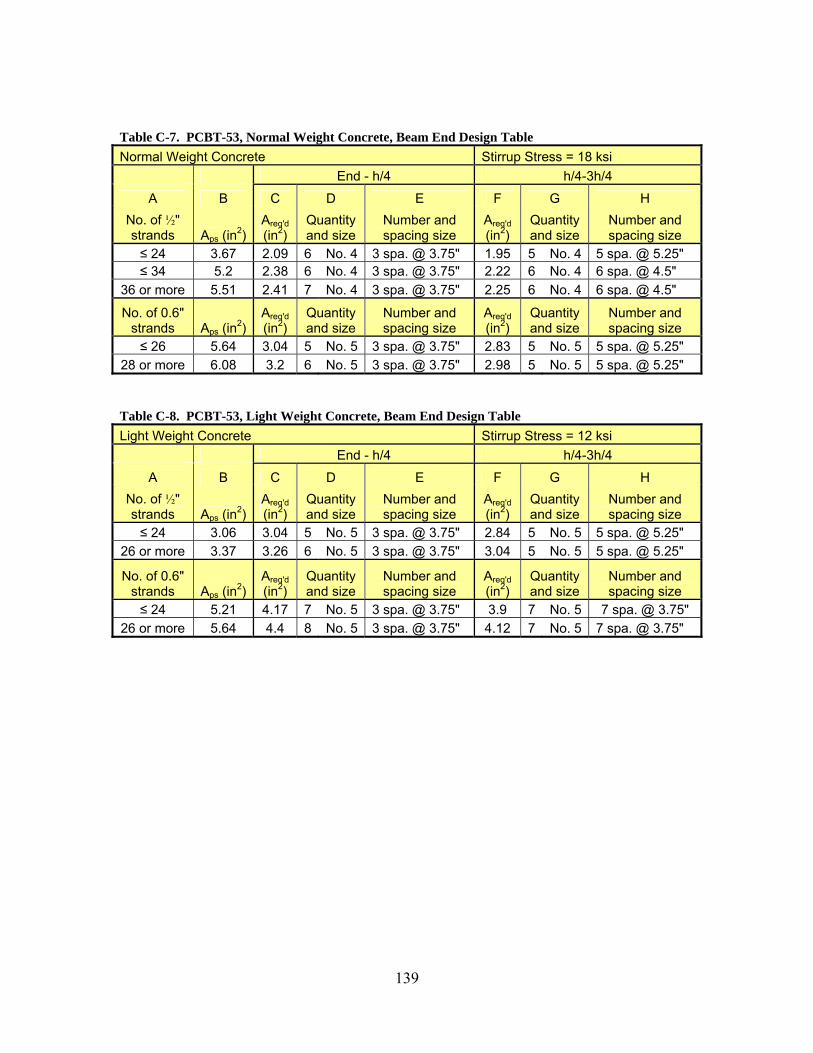
Table C-7. PCBT-53, Normal Weight Concrete, Beam End Design Table Normal Weight Concrete Stirrup Stress = 18 ksi End - h/4 h/4-3h/4
A B C D E F G H No. of ½" strands Aps (in2)
Areq'd (in2)
Quantity and size
Number and spacing size
Areq'd (in2)
Quantity and size
Number and spacing size
≤ 24 3.67 2.09 6 No. 4 3 spa. @ 3.75" 1.95 5 No. 4 5 spa. @ 5.25" ≤ 34 5.2 2.38 6 No. 4 3 spa. @ 3.75" 2.22 6 No. 4 6 spa. @ 4.5"
36 or more 5.51 2.41 7 No. 4 3 spa. @ 3.75" 2.25 6 No. 4 6 spa. @ 4.5"
No. of 0.6" strands Aps (in2)
Areq'd (in2)
Quantity and size
Number and spacing size
Areq'd (in2)
Quantity and size
Number and spacing size
≤ 26 5.64 3.04 5 No. 5 3 spa. @ 3.75" 2.83 5 No. 5 5 spa. @ 5.25" 28 or more 6.08 3.2 6 No. 5 3 spa. @ 3.75" 2.98 5 No. 5 5 spa. @ 5.25" Table C-8. PCBT-53, Light Weight Concrete, Beam End Design Table Light Weight Concrete Stirrup Stress = 12 ksi End - h/4 h/4-3h/4
A B C D E F G H No. of ½" strands Aps (in2)
Areq'd (in2)
Quantity and size
Number and spacing size
Areq'd (in2)
Quantity and size
Number and spacing size
≤ 24 3.06 3.04 5 No. 5 3 spa. @ 3.75" 2.84 5 No. 5 5 spa. @ 5.25" 26 or more 3.37 3.26 6 No. 5 3 spa. @ 3.75" 3.04 5 No. 5 5 spa. @ 5.25"
No. of 0.6" strands Aps (in2)
Areq'd (in2)
Quantity and size
Number and spacing size
Areq'd (in2)
Quantity and size
Number and spacing size
≤ 24 5.21 4.17 7 No. 5 3 spa. @ 3.75" 3.9 7 No. 5 7 spa. @ 3.75" 26 or more 5.64 4.4 8 No. 5 3 spa. @ 3.75" 4.12 7 No. 5 7 spa. @ 3.75"
139

Table C-9. PCBT-61, Normal Weight Concrete, Beam End Design Table Normal Weight Concrete Stirrup Stress = 18 ksi End - h/4 h/4-3h/4
A B C D E F G H No. of ½" strands Aps (in2)
Areq'd (in2)
Quantity and size
Number and spacing size
Areq'd (in2)
Quantity and size
Number and spacing size
≤ 32 4.9 2.55 7 No. 4 4 spa. @ 3.25" 2.38 6 No. 4 6 spa. @ 5" ≤ 38 5.81 2.74 7 No. 4 4 spa. @ 3.25" 2.56 7 No. 4 7 spa. @ 4.25"
40 or more 6.12 2.83 8 No. 4 4 spa. @ 3.25" 2.64 7 No. 4 7 spa. @ 4.25"
No. of 0.6" strands Aps (in2)
Areq'd (in2)
Quantity and size
Number and spacing size
Areq'd (in2)
Quantity and size
Number and spacing size
≤ 26 5.64 3.24 6 No. 5 4 spa. @ 3.25" 3.03 5 No. 5 5 spa. @ 6" 28 or more 6.08 3.43 6 No. 5 4 spa. @ 3.25" 3.2 6 No. 5 6 spa. @ 5" Table C-10. PCBT-61, Light Weight Concrete, Beam End Design Table Light Weight Concrete Stirrup Stress = 12 ksi End - h/4 h/4-3h/4
A B C D E F G H No. of ½" strands Aps (in2)
Areq'd (in2)
Quantity and size
Number and spacing size
Areq'd (in2)
Quantity and size
Number and spacing size
≤ 32 4.9 3.72 6 No. 5 4 spa. @ 3.25" 3.48 6 No. 5 6 spa. @ 5" ≤ 38 5.81 3.99 7 No. 5 4 spa. @ 3.25" 3.72 6 No. 5 6 spa. @ 5"
40 or more 6.12 4.1 7 No. 5 4 spa. @ 3.25" 3.82 7 No. 5 7 spa. @ 4.25"
No. of 0.6" strands Aps (in2)
Areq'd (in2)
Quantity and size
Number and spacing size
Areq'd (in2)
Quantity and size
Number and spacing size
≤ 26 5.64 4.71 8 No. 5 4 spa. @ 3.25" 4.39 8 No. 5 8 spa. @ 3.75" 28 or more 6.08 5.01 9 No. 5 4 spa. @ 3.25" 4.67 8 No. 5 8 spa. @ 3.75"
140

Table C-11. PCBT-69, Normal Weight Concrete, Beam End Design Table Normal Weight Concrete Stirrup Stress = 18 ksi End - h/4 h/4-3h/4
A B C D E F G H No. of ½" strands Aps (in2)
Areq'd (in2)
Quantity and size
Number and spacing size
Areq'd (in2)
Quantity and size
Number and spacing size
≤ 32 4.9 2.77 7 No. 4 4 spa. @ 3.75" 2.59 7 No. 4 7 spa. @ 5" ≤ 36 5.51 2.98 8 No. 4 4 spa. @ 3.75" 2.78 7 No. 4 7 spa. @ 5"
38 or more 5.81 3.07 8 No. 4 4 spa. @ 3.75" 2.87 8 No. 4 8 spa. @ 4.25"
No. of 0.6" strands Aps (in2)
Areq'd (in2)
Quantity and size
Number and spacing size
Areq'd (in2)
Quantity and size
Number and spacing size
≤ 34 7.38 3.92 7 No. 5 4 spa. @ 3.75" 3.65 6 No. 5 6 spa. @ 5.75" 36 or more 7.81 4.02 7 No. 5 4 spa. @ 3.75" 3.75 7 No. 5 7 spa. @ 5" Table C-12. PCBT-69, Light Weight Concrete, Beam End Design Table Light Weight Concrete Stirrup Stress = 12 ksi End - h/4 h/4-3h/4
A B C D E F G H No. of ½" strands Aps (in2)
Areq'd (in2)
Quantity and size
Number and spacing size
Areq'd (in2)
Quantity and size
Number and spacing size
≤ 30 4.59 3.91 7 No. 5 4 spa. @ 3.75" 3.66 6 No. 5 6 spa. @ 5.75" ≤ 36 5.51 4.34 7 No. 5 4 spa. @ 3.75" 4.05 7 No. 5 7 spa. @ 5"
38 or more 5.81 4.46 8 No. 5 4 spa. @ 3.75" 4.16 7 No. 5 7 spa. @ 5"
No. of 0.6" strands Aps (in2)
Areq'd (in2)
Quantity and size
Number and spacing size
Areq'd (in2)
Quantity and size
Number and spacing size
≤ 32 6.94 5.51 9 No. 5 4 spa. @ 3.75" 5.14 9 No. 5 9 spa. @ 3.75" 34 or more 7.38 5.66 10 No. 5 4 spa. @ 3.75" 5.28 9 No. 5 9 spa. @ 3.75"
141

Table C-13. PCBT-77, Normal Weight Concrete, Beam End Design Table Normal Weight Concrete Stirrup Stress = 18 ksi End - h/4 h/4-3h/4
A B C D E F G H No. of ½" strands Aps (in2)
Areq'd (in2)
Quantity and size
Number and spacing size
Areq'd (in2)
Quantity and size
Number and spacing size
≤ 42 6.43 3.41 9 No. 4 5 spa. @ 3.5" 3.18 8 No. 4 8 spa. @ 4.75" 44 or more 6.73 3.46 9 No. 4 5 spa. @ 3.5" 3.24 9 No. 4 9 spa. @ 4.25"
No. of 0.6" strands Aps (in2)
Areq'd (in2)
Quantity and size
Number and spacing size
Areq'd (in2)
Quantity and size
Number and spacing size
≤ 30 6.51 3.96 7 No. 5 5 spa. @ 3.5" 3.7 6 No. 5 5 spa. @ 6.5" ≤ 34 7.38 4.25 7 No. 5 5 spa. @ 3.5" 3.97 7 No. 5 7 spa. @ 5.5" ≤ 38 8.25 4.55 8 No. 5 5 spa. @ 3.5" 4.25 7 No. 5 7 spa. @ 5.5"
40 or more 8.68 4.69 8 No. 5 5 spa. @ 3.5" 4.37 8 No. 5 8 spa. @ 4.75" Table C-14. PCBT-77, Light Weight Concrete, Beam End Design Table Light Weight Concrete Stirrup Stress = 12 ksi End - h/4 h/4-3h/4
A B C D E F G H No. of ½" strands Aps (in2)
Areq'd (in2)
Quantity and size
Number and spacing size
Areq'd (in2)
Quantity and size
Number and spacing size
≤ 42 6.43 4.95 8 No. 5 5 spa. @ 3.5" 4.62 8 No. 5 8 spa. @ 4.75" 44 or more 6.73 5.01 9 No. 5 5 spa. @ 3.5" 4.68 8 No. 5 8 spa. @ 4.75"
No. of 0.6" strands Aps (in2)
Areq'd (in2)
Quantity and size
Number and spacing size
Areq'd (in2)
Quantity and size
Number and spacing size
≤ 28 6.08 5.4 9 No. 5 5 spa. @ 3.5" 5.04 9 No. 5 9 spa. @ 4.25" ≤ 34 7.38 6.13 10 No. 5 5 spa. @ 3.5" 5.72 10 No. 5 10 spa. @ 3.75"
36 or more 7.81 6.36 11 No. 5 5 spa. @ 3.5" 5.93 10 No. 5 10 spa. @ 3.75"
142

Table C-15. PCBT-85, Normal Weight Concrete, Beam End Design Table Normal Weight Concrete Stirrup Stress = 18 ksi End - h/4 h/4-3h/4
A B C D E F G H No. of ½" strands Aps (in2)
Areq'd (in2)
Quantity and size
Number and spacing size
Areq'd (in2)
Quantity and size
Number and spacing size
≤ 38 5.81 3.54 9 No. 4 5 spa. @ 3.75" 3.31 9 No. 4 9 spa. @ 4.75" 40 or more 6.12 3.67 10 No. 4 5 spa. @ 3.75" 3.43 9 No. 4 9 spa. @ 4.75"
No. of 0.6" strands Aps (in2)
Areq'd (in2)
Quantity and size
Number and spacing size
Areq'd (in2)
Quantity and size
Number and spacing size
≤ 32 6.94 4.27 7 No. 5 5 spa. @ 3.75" 3.99 7 No. 5 7 spa. @ 6" ≤ 38 8.25 4.84 8 No. 5 5 spa. @ 3.75" 4.51 8 No. 5 8 spa. @ 5.25"
44 or more 9.55 5.09 9 No. 5 5 spa. @ 3.75" 4.76 8 No. 5 8 spa. @ 5.25" Table C-16. PCBT-85, Light Weight Concrete, Beam End Design Table Light Weight Concrete Stirrup Stress = 12 ksi End - h/4 h/4-3h/4
A B C D E F G H No. of ½" strands Aps (in2)
Areq'd (in2)
Quantity and size
Number and spacing size
Areq'd (in2)
Quantity and size
Number and spacing size
≤ 42 6.43 5.53 9 No. 5 5 spa. @ 3.75" 5.16 9 No. 5 9 spa. @ 4.75" 44 or more 6.73 5.64 10 No. 5 5 spa. @ 3.75" 5.26 9 No. 5 9 spa. @ 4.75"
No. of 0.6" strands Aps (in2)
Areq'd (in2)
Quantity and size
Number and spacing size
Areq'd (in2)
Quantity and size
Number and spacing size
≤ 30 6.51 6.14 10 No. 5 5 spa. @ 3.75" 5.73 10 No. 5 10 spa. @ 4.25" ≤ 34 7.38 6.75 11 No. 5 5 spa. @ 3.75" 6.3 11 No. 5 11 spa. @ 3.75"
40 or more 8.68 7.28 12 No. 5 5 spa. @ 3.75" 6.8 11 No. 5 11 spa. @ 3.75"
143
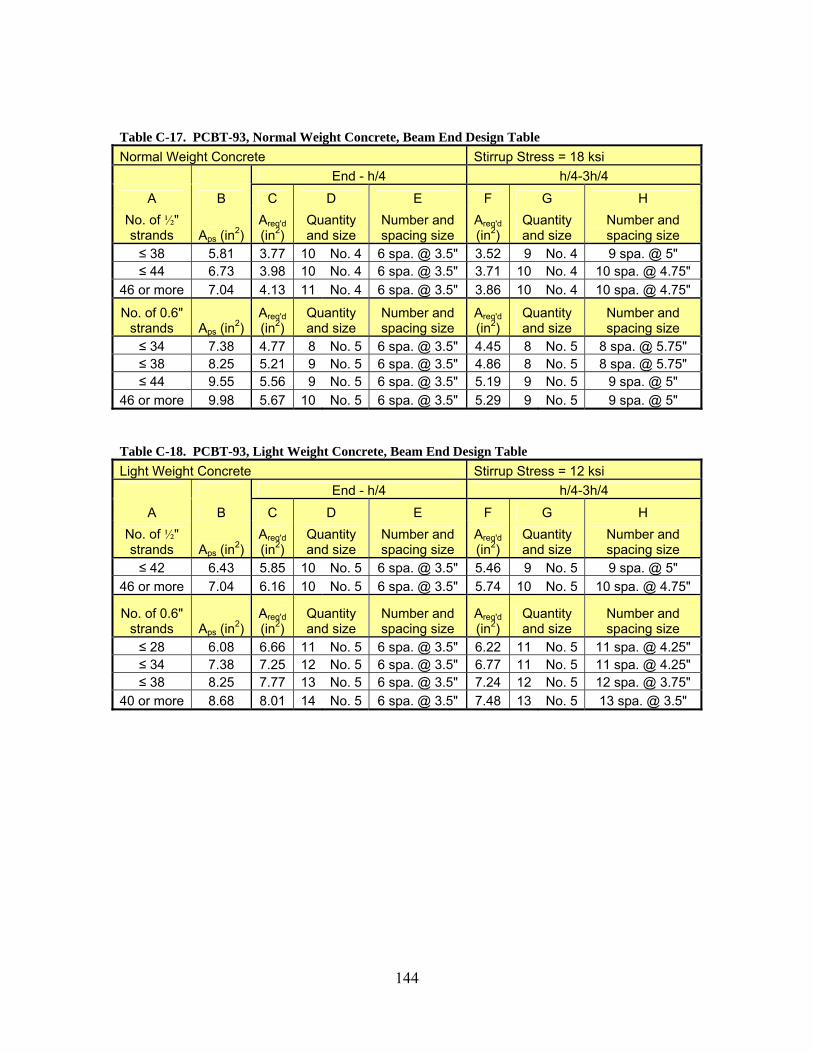
Table C-17. PCBT-93, Normal Weight Concrete, Beam End Design Table Normal Weight Concrete Stirrup Stress = 18 ksi End - h/4 h/4-3h/4
A B C D E F G H No. of ½" strands Aps (in2)
Areq'd (in2)
Quantity and size
Number and spacing size
Areq'd (in2)
Quantity and size
Number and spacing size
≤ 38 5.81 3.77 10 No. 4 6 spa. @ 3.5" 3.52 9 No. 4 9 spa. @ 5" ≤ 44 6.73 3.98 10 No. 4 6 spa. @ 3.5" 3.71 10 No. 4 10 spa. @ 4.75"
46 or more 7.04 4.13 11 No. 4 6 spa. @ 3.5" 3.86 10 No. 4 10 spa. @ 4.75"
No. of 0.6" strands Aps (in2)
Areq'd (in2)
Quantity and size
Number and spacing size
Areq'd (in2)
Quantity and size
Number and spacing size
≤ 34 7.38 4.77 8 No. 5 6 spa. @ 3.5" 4.45 8 No. 5 8 spa. @ 5.75" ≤ 38 8.25 5.21 9 No. 5 6 spa. @ 3.5" 4.86 8 No. 5 8 spa. @ 5.75" ≤ 44 9.55 5.56 9 No. 5 6 spa. @ 3.5" 5.19 9 No. 5 9 spa. @ 5"
46 or more 9.98 5.67 10 No. 5 6 spa. @ 3.5" 5.29 9 No. 5 9 spa. @ 5" Table C-18. PCBT-93, Light Weight Concrete, Beam End Design Table Light Weight Concrete Stirrup Stress = 12 ksi End - h/4 h/4-3h/4
A B C D E F G H No. of ½" strands Aps (in2)
Areq'd (in2)
Quantity and size
Number and spacing size
Areq'd (in2)
Quantity and size
Number and spacing size
≤ 42 6.43 5.85 10 No. 5 6 spa. @ 3.5" 5.46 9 No. 5 9 spa. @ 5" 46 or more 7.04 6.16 10 No. 5 6 spa. @ 3.5" 5.74 10 No. 5 10 spa. @ 4.75"
No. of 0.6" strands Aps (in2)
Areq'd (in2)
Quantity and size
Number and spacing size
Areq'd (in2)
Quantity and size
Number and spacing size
≤ 28 6.08 6.66 11 No. 5 6 spa. @ 3.5" 6.22 11 No. 5 11 spa. @ 4.25" ≤ 34 7.38 7.25 12 No. 5 6 spa. @ 3.5" 6.77 11 No. 5 11 spa. @ 4.25" ≤ 38 8.25 7.77 13 No. 5 6 spa. @ 3.5" 7.24 12 No. 5 12 spa. @ 3.75"
40 or more 8.68 8.01 14 No. 5 6 spa. @ 3.5" 7.48 13 No. 5 13 spa. @ 3.5"
144
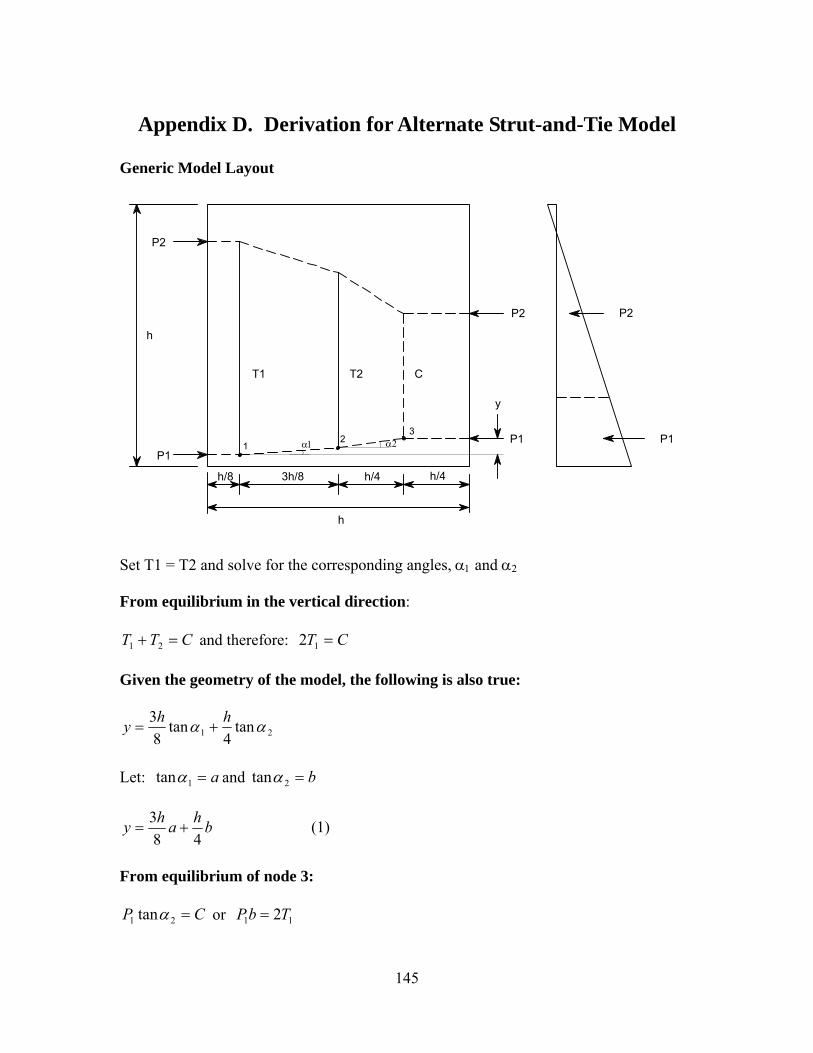
Appendix D. Derivation for Alternate Strut-and-Tie Model Generic Model Layout
P2
P1
T1 T2 C
P2
P1
h/8 3h/8 h/4 h/4
h
h
P1
P2
y
α2α13
21
Set T1 = T2 and solve for the corresponding angles, α1 and α2
From equilibrium in the vertical direction:
CTT =+ 21 and therefore: CT =12 Given the geometry of the model, the following is also true:
21 tan4
tan8
3 αα hhy +=
Let: a=1tanα and b=2tanα
bhahy48
3+= (1)
From equilibrium of node 3:
CP =21 tanα or 11 2TbP =
145

Which simplifies to:
21
1bPT = (2)
From equilibrium of node 1:
111 tanαPT = This simplifies to: (3) aPT 11 = Equation (3) can be re-written:
1
11tan
PTa ==α
Setting equation (2) and (3) equal to each other:
ba =2 Insert this into equation (1) and simplify:
1
1
87
87
PhThay ==
Solve for T1:
hyPTT
78 1
21 ==
146
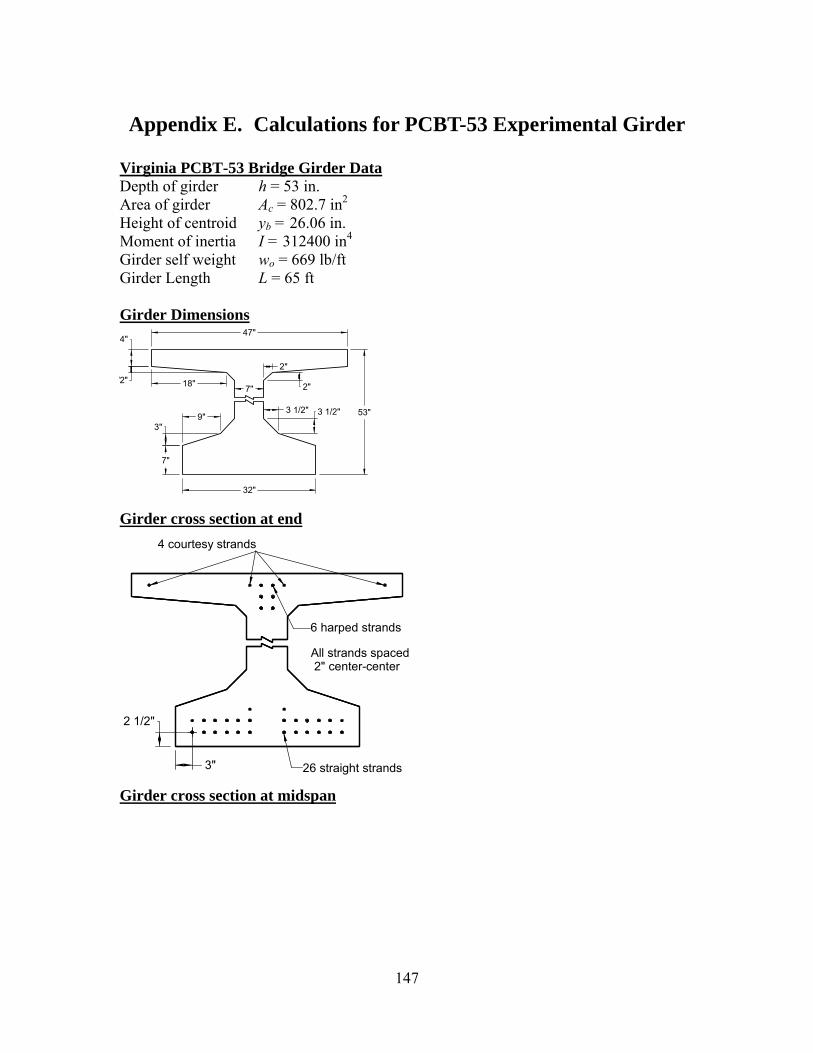
Appendix E. Calculations for PCBT-53 Experimental Girder
Virginia PCBT-53 Bridge Girder Data Depth of girder h = 53 in. Area of girder Ac = 802.7 in2
Height of centroid yb = 26.06 in. Moment of inertia I = 312400 in4
Girder self weight wo = 669 lb/ft Girder Length L = 65 ft Girder Dimensions
47"4"
32"
7"
9"3"
3 1/2"3 1/2"
7"18"
2"/2"
2"
53"
Girder cross section at end
4 courtesy strands
6 harped strands
26 straight strands
All strands spaced 2" center-center
2 1/2"
3"
Girder cross section at midspan
147

4 courtesy strands
2 1/2"
3"
All strands spaced 2" center-center
Concrete Material Properties ω = 120 lb/ft3
f`ci = 5,500 psi Eci = 3,217 ksi 26 Straight and 6 Harped Strand Properties Astrand = 0.153 in2
fpu = 270 ksi fjack = 0.75 fpuEps = 28,500 ksi 4 Courtesy Strand Properties Astrand = 0.153 in2
fpu = 270 ksi fjack = 26.2 ksi Strand location 53 in. from end of beam Height of centroid of harped strands at beam end = 49 in. Height of centroid of harped strands at harping point = 4.25 in. Distance from end to harping point = 32.5 ft – 2.5 ft = 30 ft Angle of draped strands, θ
°=⎟⎟⎠
⎞⎜⎜⎝
⎛ −= 09.7
)30(1225.449tanaθ
Height of centroid of harped strands 53 in. from end of beam
4.42)09.7sin(5349_ =−=drapedcgsy in. Height of centroid of straight strands 53 in. from end of beam
48.326
)25.6(2)25.4(12)25.2(12_ =
++=harpedcgsy in.
148

Height of centroid of courtesy strands 53 in. from end of beam
51_ =courtesycgsy in. Properties of all prestressing steel 53 in. from end of beam Area (in2) yb (in) Io (in4) Pjack (k) 4 courtesy strands 0.612 51 0 16 6 harped strands 0.918 42.4 2.45 186 26 straight strands 3.98 3.48 6.21 806 Total = 1,008 kip Transformed section properties for section 53 in. from end of beam Section modulus at transfer, ni
86.8321728500
===ci
psi E
En
At (in2) yb (in) Atyb (in2) At(yb-yt)2 (in4) Iot (in4) It (in4) Concrete 802.7 26.06 20,920 252 312,400 312,652Courtesy Strands 4.81 51 245 3,128 0 3,128 Harped Strands 7.22 42.4 306 2,062 19.3 2,081 Straight Strands 31.3 3.48 109 15,180 48.8 15,229
Total = 846 Total = 21,580 Total = 333,090
5.25846
580,21==ty in. from bottom of beam
Sample calculations for highlighted values
22.7)918.0)(186.8()1( _ =−=−= harpedpsit AnA in2
3.19)45.2)(186.8()1( _ =−=−= harpedoiot InI in4
Stresses from prestress force for section 53 in. from end of beam
t
tstraightbtstraightharpedbtharpedcourtesybtcourtesy
t
TOTjackbot I
yyyPyyPyyPA
Pf
)]()()([ ____ −+−+−+=
149

090,3335.25)]48.35.25(806)4.425.25(186)515.25(16[
846008,1 −−−−−−
+−
=botf
28.2−=botf ksi
t
tstraightbtstraightharpedbtharpedcourtesybtcourtesy
t
TOTjacktop I
hyyyPyyPyyPA
Pf
))](()()([ ____ −−+−+−+=
090,333)535.25)](48.35.25(806)4.425.25(186)515.25(16[
846008,1 −−−−−−−
+−
=topf
019.0−=topf ksi
150

Force in the strand groups after transfer
)]([75.0 __ bottop
straightbbotipustraightcg ff
hy
fnff −++=
184)]28.2019.0(5348.328.2[86.8)270(75.0_ =+−+−+=straightcgf ksi
731)153.0)(26(184 ==straightP kip
)]([75.0 __ bottop
harpedbbotipuharpedcg ff
hy
fnff −++=
198)]28.2019.0(53
4.4228.2[86.8)270(75.0_ =+−+−+=harpedcgf ksi
182)153.0)(6(198 ==harpedP kip
)]([ __ bottop
courtesybbotijackcourtesycg ff
hy
fnff −++=
3.25)]28.2019.0(535128.2[86.82.26_ =+−+−+=courtesycgf ksi
5.15)153.0)(4(3.25 ==courtesyP kip
Integrate stress over concrete area from bottom of girder up until resultant force in concrete equals the applied force in the straight strand group (731 kip)
Height
(in) Width (in)
Stress (ksi)
Force (kip)
yb (in)
yb · Force (in-kip)
Σ Force (kip)
0 32 -2.28 0 0 0 0 7 32 -1.98 -477 3.42 -1630 -477 10 14 -1.85 -132 8.48 -1120 -609
13.5 7 -1.70 -65.3 11.7 -764 -674 18.5 7 -1.49 -56.2 16.0 -896 -731
Σ = -4410 Sample calculations for highlighted values
477)07(2
)98.128.2(2
)3232(−=−
−−+=Force kip
151

42.3)98.128.2(3
]28.2)98.1(2)[07(=
++−
=by in.
Find location of the resultant force in the concrete
03.6731
4410tan_ =
−−
=tresulby in.
Unbalanced internal moment
straightstraightbtresulb PyyM )( _tan_ −=
1864)731)(48.303.6( =−=M in-k Note: Integrating the stress over concrete area from top of girder down, will produce the same unbalanced moment within the section Solve the strut and tie models
731 kip 731 kip
198 kip
198 kip
T1 = 56.5 kip
T2 = 40.4 kip T2 = 40.4 kip
T1 = 56.5 kip
46.38"
33.13"
9.92"
3.48" 6.04"
19.5"
3.561.33
18641 ==T kip 2.40
4.461864
2 ==T kip
152

Design the reinforcement Control anchorage zone – stirrup working stress = 18 ksi fs = 18 ksi Area of steel required for lower strut and tie model
23.218
2.402 ===s
s fTA in2
Select 4 No. 5 bars uniformly distributed over h/4, As_provided = 2.48 in2
Area of steel required for upper strut and tie model
13.318
3.561 ===s
s fTA in2
Note: The model assumes this area of steel is uniformly distributed from the end of the girder to 3h/4 even though the area of stirrup reinforcement within h/4 will be more densely spaced. Area of steel required from h/4 to 3h/4
09.275.0
)5.0(13.3)5.0(75.013.3
=== hh
As in2
Select 4 No. 5 bars uniformly distributed from h/4 to 3h/4, As_provided = 2.48 in2
Note: The spacing for 4 No. 5 bars between h/4 and 3h/4 is 8.83 in. which exceeds the minimum spacing in this region for horizontal shear transfer of 7 in. The minimum spacing for stirrups for horizontal shear transfer will control. Experimental anchorage zone – stirrup working stress = 12 ksi fs = 12 ksi Area of steel required for lower strut and tie model
35.312
2.402 ===s
s fTA in2
Select 5 No. 5 bars uniformly distributed over h/4, As_provided = 3.1 in2
Area of steel required for upper strut and tie model
153

69.412
3.561 ===s
s fTA in2
Note: The model assumes this area of steel is uniformly distributed from the end of the girder to 3h/4 even though the area of stirrup reinforcement within h/4 will be more densely spaced. Area of steel required from h/4 to 3h/4
13.375.0
)5.0(69.4)5.0(75.069.4
=== hh
As in2
Select 5 No. 5 bars uniformly distributed from h/4 to 3h/4, As_provided = 3.1 in2
Beam end detailing
3 spa. @ 3 3/4"= 13 1/4"
3 spa. @ 7" = 21"
5 1/4"3 3/4"
3 spa. @ 3 3/4"= 13 1/4"
4 spa. @ 5 3/4" = 23"
12 ksi Beam End Reinforcement Detail 18 ksi Beam End Reinforcement Detail
Note: Flanges of beam have been removed for clarity.
154

Vita
Eric D. Crispino is a native of Southington, Connecticut. He received his commission
from the United States Military Academy in May 1998 and holds a Bachelor of Science
degree in Civil Engineering.
Eric’s first assignment was as a Troop Fire Support Officer with Howitzer Battery, 1st
Squadron, 3rd Armored Cavalry Regiment at Fort Carson, Colorado in January 1999. He
also served as a Battery Fire Direction Officer, Platoon Leader, Executive Officer, and as
the Squadron Adjutant. Following this tour at Fort Carson, Eric attended the Captain’s
Career Course at Fort Sill, Oklahoma.
In October 2002, Eric was assigned to the 3rd Battalion, 6th Field Artillery at Fort Drum,
New York. He served as the Battalion Fire Direction Officer and deployed to JRTC in
December 2002. He then served as the Battalion Fire Support officer for 2nd Battalion,
22nd Infantry where he deployed to Operation Enduring Freedom IV. On 5 February
2004, Eric took command of Charlie Battery at Orgun-E, Afghanistan. The battery
redeployed to Fort Drum in May 2004 and began the transformation process. As part of
this transformation the battery was redesignated as Alpha Battery and moved to the new
platoon-based battery concept.
In 2005, Eric accepted a position as an instructor within the Civil and Mechanical
Engineering Department at West Point, NY. In preparation for this assignment he
completed studies at Virginia Polytechnic and State University from 2005 to 2007 where
he received a Master of Science degree in Civil Engineering.
Eric is married to the former Amy White of Southington, Connecticut. They have a son,
Patrick, age 4 and a daughter, Anna, age 10 months.
155


