
Atmos. Chem. Phys., 2, 293–306, 2002www.atmos-chem-phys.org/acp/2/293/ Atmospheric
Chemistryand Physics
Redistribution of trace gases by convective clouds – mixed-phaseprocesses
Y. Yin, K. S. Carslaw, and D. J. Parker
Institute for Atmospheric Science, School of the Environment, University of Leeds, Leeds, UK
Received: 10 May 2002 – Published in Atmos. Chem. Phys. Discuss.: 24 June 2002Revised: 18 October 2002 – Accepted: 21 October 2002 – Published: 29 October 2002
Abstract. The efficiency of gas transport to the free andupper troposphere in convective clouds is investigated inan axisymmetric dynamic cloud model with detailed micro-physics. In particular, we examine the sensitivity of gastransport to the treatment of gas uptake by different ice hy-drometeors. Two parameters are used to describe this uptake.The gas retention coefficient defines the fraction of dissolvedgas that is retained in an ice particle upon freezing, whichincludes also the riming process. We also define a gas burialefficiency defining the amount of gas entrapped in ice crys-tals growing by vapour diffusion. Model calculations are per-formed for continental and maritime clouds using a completerange of gas solubilities, retention coefficients and burial ef-ficiencies. The results show that the magnitude of the gas re-tention coefficient is much more important for gas transportin maritime clouds than in continental clouds. The cause ofthis difference lies in the different microphysical processesdominating the formation and evolution of hydrometeors inthe two cloud types. For highly soluble gases, the amountof gas transported to the free troposphere in maritime cloudsfalls approximately linearly by a factor of 12 as the reten-tion coefficient is varied between 0 and 1. Gas transport isrelatively insensitive to the magnitude of the gas burial effi-ciency. However, the burial efficiency strongly controls theconcentration of trace gases inside anvil ice crystals, whichsubsequently form cirrus clouds.
1 Introduction
Convective cloud transport is a primary mechanism for mov-ing trace gas species from the boundary layer to the freetroposphere or even lower stratosphere (e.g. Chatfield andCrutzen, 1984; Dickerson et al., 1987; Prather and Jacob,1997; Barth et al., 2001; Yin et al., 2001). In our previous
Correspondence to:Y. Yin ([email protected])
paper (Yin et al., 2001) we developed a spectral treatment ofgas scavenging within a two-dimensional cloud model to in-vestigate trace gas vertical redistribution in precipitating con-tinental and maritime clouds without ice formation. The sim-ulations revealed a clear pattern of behaviour depending ongas solubility. The transport of low solubility gases (with ef-fective Henry’s law constantsH ∗ < 103 mol dm−3 atm−1)was found to be essentially identical to that of an insolubletracer. All highly soluble gases (H ∗ > 106 mol dm−3 atm−1)were also found to behave in a nearly identical way to eachother, independent of their solubility. On the other hand, thetransport of moderately soluble gases (H ∗ between 103 and106 mol dm−3 atm−1) depends on the precise value ofH ∗.
In this study we extend the treatment of gas scavenging toinclude ice-phase particles with special attention being paidto the mass transfer between different hydrometeor types in-duced by drop-ice interactions. Besides dissolution of the gasinto liquid drops, scavenging of a gas in ice- or mixed-phaseclouds involves two additional processes: the direct uptakeof the gas by ice particles and transfer of dissolved gas be-tween the aqueous phase and ice phase due to freezing andriming.
Extensive laboratory and field studies have been con-ducted by others to investigate the uptake by ice particlesof some chemical species found in clouds, including HNO3,SO2, HCl, HBr, H2O2 (e.g. Sommerfeld and Lamb, 1986;Clapsaddle and Lamb, 1989; Valdez et al., 1989; Mitra et al.,1990; Conklin et al., 1993; Conklin and Bales, 1993; Diehlet al., 1995; Santachiara et al., 1995; Zondlo et al., 1997;Diehl et al., 1998; Hudson et al., 2001; Clegg and Abbatt,2001). These studies show that the gas uptake depends onmany factors, including partial pressure, temperature, sur-face acidity, and even whether the ice phase is growing ornot (e.g. Diehl et al., 1995; Clegg and Abbatt, 2001). How-ever, due to the lack of a theoretical framework to prop-erly describe the contributions from these factors, it is dif-ficult to include this process into cloud chemistry models.
c© European Geosciences Union 2002

294 Yin et al.: Trace gas transport in mixed-phase convective clouds
In an idealized simulation using a global chemical transportmodel, Crutzen and Lawrence (2000) investigated the sensi-tivity of trace gas removal by the ice particles by introducingice-phase Henry’s Law constantsHi,x (‘ i’ stands for “ice”),which were assumed to be proportional to the gas-liquid sol-ubility (Hi,x = riH
∗x , whereri ≤ 1), and found that inclu-
sion of ice uptake essentially extended the vertical region ofgas scavenging.
During formation and growth of ice phase hydrometeorsvia freezing or riming, trace chemical species originally inthe aqueous phase may be excluded or retained in the grow-ing ice phase particles. The retention coefficient (Rc in thisstudy), which is the ratio of the concentration of solute re-tained in the ice phase to that in the parent liquid phase,has been measured by many investigators (e.g. Lamb et al.,1987; Iribarne et al., 1990; Snider et al., 1992; Santachiaraet al., 1995).Rc values range from 0.01 to unity, dependingon the trace species, but sometimes differentRc values werealso reported for the same species. For example, Lamb etal. (1987) observed that the entrapped fraction of SO2 wasstrongly temperature dependent and ranged from about 0.01near 0◦C to more than 0.12 at−20◦C. On the other hand,Iribarne et al. (1990) reported an average valueRc = 0.62 in-dependent of temperature and SO2 concentration. In anotherexperiment for highly soluble gases such as HCl, HNO3, andH2O2, Iribarne and Pyshnov (1990) measuredRc of aboutunity, but a value of only 0.3 was observed for H2O2 bySnider et al. (1992) in natural clouds.
Voisin et al. (2000) performed in-cloud field measure-ments to study the scavenging processes of acidic gases andammonia in mixed-phase clouds. These authors found thatstrong acids are well retained in rime ice. For these species,riming is the main process that determines the compositionof the snowflake. At lower solubility, the authors found thatriming is still important but gas uptake during the growth ofsnowflakes cannot be neglected.
Mari et al. (2000) examined the transport and scaveng-ing of several gas species, including CO, CH3OOH, CH2O,H2O2, HNO3, and SO2, in tropical deep convection, using aone-dimensional entraining/detraining plume model. Theynoticed that while both HNO3 and H2O2 were efficientlyscavenged in the lower (warm) part of the cloud, H2O2 wasreleased as the cloud froze due to the low retention efficiencyduring riming.
In a numerical simulation of the fate of soluble gases inmid-latitude convection, Barth et al. (2001) considered twoextreme cases for the interaction of the gas with cloud hy-drometeors. The first case assumed that the dissolved gas inthe cloud water or rain completely degassed when the parenthydrometeor was converted to ice-phase hydrometeors. Thesecond case assumed that the dissolved tracer was retained inthe ice-phase particles. They found that when soluble trac-ers were degassed, both low and high solubility tracers weretransported to the upper troposphere. When tracers were re-tained in ice hydrometeors, the highly soluble tracers were
not ultimately transported to the upper troposphere, but in-stead were precipitated out of the upper troposphere by snowand hail.
In this study, numerical simulations are performed tounderstand how gas transport in mixed-phase precipitatingclouds is influenced by hydrometeor transformations and up-take of gases by ice-phase particles. For this purpose, thespectral treatment of gas scavenging in Yin et al. (2001) hasbeen extended to include ice-phase hydrometeors and incor-porated into an axisymmetric non-hydrostatic cloud modelwith detailed microphysics. As in our previous study, wedo not restrict our simulations to specific gases under spe-cific conditions. Rather, we examine clouds formed on bothcontinental and maritime aerosol spectra and use a completerange of gas solubilities, retention coefficients and uptake ef-ficiencies on to ice particles. We take this approach in orderto understand the overall importance of the ice phase in gastransport and, in particular, the implications of gas-ice inter-action parameters being poorly constrained by experimentsand theory.
A brief description of the model is given in Sect. 2, fol-lowed by the initial conditions for the simulations and de-sign of the numerical experiments in Sect. 3. In Sect. 4, themain results are presented, and discussions and summariesare given in Sect. 5.
2 Model description
2.1 The model dynamics and microphysics
The dynamic framework and microphysical processes ofan axisymmetric nonhydrostatic anelastic convective cloudmodel developed by Reisin et al. (1996) were used in thisstudy and will be only briefly described here. The improvedcalculation of some of the microphysical processes such asdrop nucleation, and immersion freezing of drops, presentedby Yin et al. (2000), were also introduced. In the model, a setof dynamic equations were solved for the vertical and radialvelocity, the pressure perturbation, the virtual potential tem-perature perturbation, the specific humidity perturbation, thespecific concentration of aerosols, the specific number andmass for each type of cloud particles in a spectral bin, andconcentration of activated ice nuclei.
The warm microphysical processes included are: nucle-ation of drops, condensation and evaporation, collision–coalescence, and binary breakup (Low and List kernel). Theice microphysical processes included are: ice nucleation (de-position, condensation-freezing, contact nucleation, and im-mersion freezing), ice multiplication, deposition and sub-limation of ice, ice–ice and ice–drop interactions, meltingof ice particles, and sedimentation of drops and ice parti-cles. All these microphysical processes are formulated andsolved using the method of Multi-Moments (Tzivion et al.,1987; Reisin et al., 1996). Four species of hydrometeor are
Atmos. Chem. Phys., 2, 293–306, 2002 www.atmos-chem-phys.org/acp/2/293/

Yin et al.: Trace gas transport in mixed-phase convective clouds 295
freezing
crystal growth
riming
melting
sublimation
gas exchangewith droplets(kinetically controlled)
Fraction (1-Rc) of dissolved gasreleased into gas phase(instantaneous)
Gas diffusion to crystal surface. Fraction β of collisionsretained by crystal (buried)
Fraction (1-Rc) of gas in dropletsreleased into gas phase(instantaneous)
Gas released to gas phaseat a rate proportional toevaporation of water
Gas-liquidkinetic exchangeresumed
Rc is the 'retention coefficient'
β is the 'burial coefficient'
Fig. 1. Schematic of gas interaction with different hydrometeorsused in this study.
considered: drops, ice crystals, graupel particles and aggre-gates (snowflakes). The density of the graupel is assumedto be 0.4 g cm−3, while the ice crystal density varies from0.9 g cm−3 for the smallest particles, down to 0.45 g cm−3
for the biggest. The density for the aggregates is fixed at0.2 g cm−3. Each particle species is divided into 34 binswith mass doubling for adjacent bins (mk+1 = 2mk, k =
1, · · · 34). The masses at the beginning of the first bin andthe end of last bin for both liquid and solid phases are0.1598×10−13 and 0.17468×10⁻³ kg, which correspond todrop diameters of 3.125 and 8063µm, and ice particle di-ameters of 3.23754 and 8540µm, respectively. Aerosols aredivided into 67 bins with the minimum radius of 0.0041µm.The domain in the model is 12 km in the vertical and 6 kmin the radial direction. The grid size is 150 m and 300 m, re-spectively, in the radial and vertical direction. A time stepof 2.5 s is used for condensation/evaporation of drops or de-position/sublimation of ice particles, 0.1 s for gas absorption,and 5 s for all other processes.
To simulate the evolution of trace gases in the air and inhydrometeors, the dynamic and microphysical equations arealso applied to the mixing ratio of a gas speciesi in the air,Ma,i , and the mixing ratio in hydrometeors,Mh,i . Theseequations are given as
∂Ma,i
∂t= Fq
(Ma,i
)− D
(Ma,i
)
+
(∂Ma,i
∂t
)uptake
+
(∂Ma,i
∂t
)micro
(1)
and
∂Mh,i,k
∂t= Fq
(Mh,i,k
)− D
(Mh,i,k
)+
(∂Mh,i,k
∂t
)uptake
+
(∂Mh,i,k
∂t
)micro
(2)
where the subscriptk denotes the particle spectral bin num-ber. The termsD andFq represent the advective and turbu-lent transfer operators. The variation of these functions withlocation is implied. Also, the terms with subscripts “uptake”and “micro” represent mass transfer of chemical species be-tween the gas phase and condensed phase due to uptake ofgases by drops and ice particles, and that between differentparticle species due to microphysical processes.
2.2 Mass transfer between gas and hydrometeors
2.2.1 Gas interaction with droplets
The rate of mass transfer between gas phase and aqueousphase for chemical speciesi and a group of aqueous dropswith radius ofr and number concentration ofNr (per moleof air) is calculated using the following kinetic equation
dMd,i,r
dt=
3ηDg,iNSh,i
RT r2
(VrNrPi −
Md,i,r
H ∗
i
), (3)
whereMd,i,r is the molar mixing ratio with respect to airof gas speciesi inside drops with radiusr, H ∗ is the effec-tive Henry’s law constant of speciesi, R is the universal gasconstant,T is the temperature,Dg,i is the diffusivity of gasspeciesi in air, Vr is the volume of drops with radiusr, Pi isthe partial pressure of gas speciesi in the environment,NSh,i
is the mass ventilation coefficient (Sherwood number), andη
is a factor to account for the free-molecular effect on the masstransfer rate. This equation has the analytical solution
Md,i,r̄k (τ +1τ) = A(τ)+[Md,i,r̄k (τ )−A(τ)] exp(B1τ),(4)
where1τ is the time step (0.1 s) for gas dissolution, and
A(τ) =4
3πr̄3
k NkPi(τ )H ∗
i , B = −3Dg,iNSh,iη
r̄2k RT H ∗
i
. (5)
2.2.2 Freezing of droplets and gas retention
The model treatment of gas interaction with ice hydromete-ors is shown in Fig. 1. When droplets freeze, a fractionRc
of the gas is retained by the ice crystal and(1− Rc) releasedto the gas phase. The partitioning of the gas between the gasand ice phase is assumed to be instantaneous. The gas se-questered by the ice crystal is assumed to be fully retained;that is, no equilibrium is set up between the concentration ofgas in the crystal and the gas phase. This is a valid assump-tion due to the slow diffusion of the gas through the crystal.
www.atmos-chem-phys.org/acp/2/293/ Atmos. Chem. Phys., 2, 293–306, 2002

296 Yin et al.: Trace gas transport in mixed-phase convective clouds
-60�
-40� -20� 0� 20 40Temperature (� oC)
1000900800700
600
500
400
300
200P
ress
ure
(hP
a)
�
(a)
10� -4 10� -3 10� -2 10� -1 10� 0 10� 1
Supersaturation (%)�
10-6
10-4
10-2
100
102
104
Cum
ulat
ive
Num
ber
(cm
�
-3)
Continental�
Maritime
(b)
Fig. 2. (a)Initial profiles of temperature (solid line) and dew point temperature (dashed line), and(b) CCN spectra used in the present work.
In this study, we perform five modeling simulations, eachfor clouds formed on continental and maritime aerosol spec-tra, with the gas retention coefficient,Rc, ranging from 0.0 to1.0. The extreme case with retention coefficient equal to 0.0means that the dissolved gas is transferred completely to thegas phase when a hydrometeor freezes. In the other extremecase ofRc = 1, the dissolved gas mass is retained fully bythe resultant ice hydrometeor.
2.2.3 Gas scavenging during growth of ice crystals byvapour diffusion
Trace species can also be transferred into ice hydrometeorsfrom the gas phase. Ice crystals in a convective cloud areoften growing rapidly, so the concept of an equilibrium cov-erage of the ice surface with a trace gas is not appropriate.Rather, it is likely that trace gas molecules transiently at-tached to the ice surface will quickly become buried by sev-eral monolayers of deposited vapour or by rimed droplets,and will be released to the gas phase only when the ice parti-cle evaporates again.
Given the uncertainty in the physical processes that lead togas uptake in this way, we have included in the model a singleparameter, the burial coefficient (β), that describes differentefficiencies of gas trapping in growing ice hydrometeors. Avalue of β = 1 assumes that all trace gas molecules thatdiffuse to the growing crystal surface become buried, while alower value ofβ implies that a fraction of the gas moleculesthat strike the crystal become buried and a fraction (1− β)remain in the gas phase.
The practical implementation of the burial coefficient inthe model is simply to varyαw, the mass accommodationcoefficient, which appears in the equation describing the flux
of trace gas to the ice surface. This is a simplification, andthere may be circumstances where in realityβ 6= αw. Theburial coefficient is likely to be close to 1 for species that ad-sorb strongly on the surface of a static ice surface. Stronglyadsorbing molecules have a long residence time on the sur-face before desorption, so are likely to suffer burial by watermolecules or rime whenever ice hydrometeors are growing.Strongly adsorbing molecules are likely to have high burialcoefficients and high accommodation coefficients. Gaseshaving a weak interaction with the ice surface and whichdesorb at a rate comparable to the deposition rate of watermolecules are likely to have low burial coefficients and lowaccommodation coefficients. However, even a weakly ad-sorbing molecule with a low accommodation coefficient on astatic ice surface could have a large burial coefficient in caseswhere the riming rate or deposition rate of water moleculesis very high. Conversely, highly adsorbing molecules couldhave low burial efficiencies in cases where ice crystals aregrowing very slowly, such as in the anvil cirrus.
As a sensitivity test we vary the fraction of molecules thatbecome permanently buried by varyingβ between 0 and 1.We note that further experimental work needs to be done inorder to parameterise gas uptake for a wide range of ice par-ticle growth rates, strengths of gas interaction with static icesurfaces, ice forms, etc.
2.2.4 Riming
Riming causes ice crystals to grow by accretion and freez-ing of supercooled water droplets. When riming occurs, thefractionRc of the chemical species in the accreting droplet isretained in the rimed ice particle and a fraction(1 − Rc) isreleased to the gas phase.
Atmos. Chem. Phys., 2, 293–306, 2002 www.atmos-chem-phys.org/acp/2/293/

Yin et al.: Trace gas transport in mixed-phase convective clouds 297
2.2.5 Sublimation and melting
When ice hydrometeors sublime we assume that the buriedtrace gas is released to the gas phase at a rate proportionalto the mass of water evaporated. The gas is assumed to beuniformly distributed through the particle, thus we do notretain information on the radial distribution of the buried gas.
Upon melting, the buried gas mass is retained in thenew droplet and used to calculate a liquid phase concentra-tion. Gas-liquid mass transfer is then calculated as for otherdroplets.
3 Initial conditions and numerical experiments
3.1 Initial conditions
Numerical experiments were performed for continental andmaritime conditions. For both cases an artificial thermody-namic profile representative of typical conditions was used.The profile produces a cloud with a base at 8–10◦C (1.5–1.8 km) and a top at−25◦C (7.0 km). For initialization, awarm bubble that produced a 2◦C perturbation was appliedfor one time step att = 0 in a region with radial distance of450 m, at a height of 600 m. Therefore, the cloud simulatedin this study may be representative of an isolated convectivecloud or one of the growing cells in a more complicated con-vective cloud system.
The number concentration of aerosols large enough to actas cloud condensation nuclei (CCN) distinguishes the mar-itime and continental clouds. The CCN are assumed to becomposed of ammonium sulfate, regardless of size, and theCCN concentrations are assumed to decrease exponentiallywith altitude with a scale height of 2.5 km (according toPruppacher and Klett, 1997). The initial profiles of temper-ature, dew point temperature, and CCN spectra are shown inFig. 2.
Because the main purpose of these simulations is to esti-mate to what extent the gases from the boundary layer canbe transported to the free atmosphere and upper troposphere,the initial trace gas mixing ratio was arbitrarily assumed to be1 ppbv and to be homogeneously distributed in the boundarylayer, with a height of 1.5 km.
3.2 Numerical experiments
Numerical experiments were conducted to test the sensitiv-ity of gas transport to the value of retention coefficient (Rc
= 0, 0.25, 0.5, 0.75, and 1.0) and gas burial efficiency ingrowing ice crystals (β = 0, 0.01, 0.1, and 1.0). The experi-ments were repeated for the maritime and continental cloudtypes for a range of gas solubilities (11 species with effec-tive Henry’s law constantH ∗ between 0 and 109 mol dm−3
atm−1). The simulations are listed in Table 1. Because wedid not include concurrent gas phase chemical reactions inour model, all changes to the gas phase chemical species
Table 1. List of numerical experiments conducted for the continen-tal (C1–C9) and maritime (M1–M9) cases. The burial coefficient,β, is the fraction of gas molecular collisions on a growing ice crystalthat results in uptake. The retention coefficient,Rc, is the fractionof gas retained by a hydrometeor upon freezing. See Sect. 3.2 formore details.
Runs Burial RetentionCoefficient (β) Coefficient (Rc)
C1, M1 0 1.0C2, M2 0 0.75C3, M3 0 0.5C4, M4 0 0.25C5, M5 0 0.0C6, M6 0.01 1.0C7, M7 0.1 1.0C8, M8 1.0 1.0C9, M9 0.1 0.0
are induced by dynamical transport, dissolution, scavenging,or exclusion of chemical species due to freezing of drops.In addition, it should also be borne in mind that the simu-lated maritime cloud differs from the continental cloud onlyin terms of the initial CCN spectrum. Therefore, the ‘conti-nental’/‘maritime’ cloud in this study refers only to the cloudwith the ‘continental’/‘maritime’ CCN distribution.
4 Results
4.1 Evolution of the cloud structure and precipitation
Figure 3 shows the time evolution of the cloud physical prop-erties (maximum values of water content, number concen-trations of the different hydrometeors, vertical velocity, andrainfall rate). Figures 4 and 5 show the spatial distributions ofwind field, water content and number concentration of eachhydrometeor for the continental and maritime clouds. In bothcases, the clouds begin to form after 8 min of simulation,and reach their peak updrafts 12 min later. While the max-imum liquid water content (LWC), which mainly depends onthe initial thermodynamic conditions, is similar in these twocases, the number concentration of drops as well as the prop-erties of ice phase particles are quite different. The higherdroplet concentration in the continental case leads to strongercompetition for available water vapor during drop growth viadiffusion and therefore restricts the size of cloud droplets.As a consequence, drop growth by the collision-coalescenceprocess is less efficient in the continental case. In contrast,the droplets in the maritime cloud reach sizes required forefficient collision-coalescence comparably faster than thosein the continental case. The differences in the evolution ofwater drops significantly influence characteristics of the icephase hydrometeors. In the continental case, drops remain
www.atmos-chem-phys.org/acp/2/293/ Atmos. Chem. Phys., 2, 293–306, 2002

298 Yin et al.: Trace gas transport in mixed-phase convective clouds
0�
20 40 600
1
2
3
4
5
6
Max
. LW
C (
g kg
�-1
)
continentalmaritime
(a)
0�
20 40 600
200
400
600
800
1000
Max
. Dro
p C
once
ntra
tion
(cm
�
-3)
(b)
0�
20 40 600.0
0.2
0.4
0.6
0.8
1.0
Max
. Ice
Cry
stal
Con
tent
(g
kg-1
)
(c)
0�
20 40 600
10
20
30
40
50
60
Max
. Con
c. o
f Ic
e C
ryst
al (
l
�
-1)
(d)
0�
20 40 600
1
2
3
4
5
Max
. Gra
upel
Con
tent
(g
kg
�
-1)
(e)
0�
20 40 600
2
4
6
8
10
Max
. Gra
upel
Con
cent
rati
on (
l
�
-1)
(f)
0�
20 40 60Time (min)
0
5
10
15
Max
. Ver
tica
l Vel
ocit
y (m
s
�
-1)
(g)
0�
20 40 60Time (min)
0
20
40
60
80
100
120
Max
. Rai
nfal
l Rat
e (m
m h
-1)
(h)
Fig. 3. Time-evolution of the maximum values of(a) liquid water content (LWC),(b) number concentration of drops,(c) water content ofice crystals,(d) number concentration of ice crystals,(e) water content of graupel particles,(f) number concentration of graupel particles,(g) vertical velocity, and(h) rainfall rate in the continental (blue curves), and maritime (red curves) cases.
small when they are lifted to the freezing level, and there-fore, more drops are frozen to small graupel particles and icecrystals (in the model frozen drops are transferred to ice crys-tals if their radii are smaller than 100µm, otherwise, they aretransferred to graupel particles). On the other hand, the mar-
itime case produces more larger graupel particles because ofthe larger drop sizes and thus promotes the collection pro-cess, leading to more rapid depletion of the droplets and to ahigher supersaturation. This in turn promotes ice formationthrough vapor deposition and condensation-freezing, and can
Atmos. Chem. Phys., 2, 293–306, 2002 www.atmos-chem-phys.org/acp/2/293/
Yin et al.: Trace gas transport in mixed-phase convective clouds 299
Specific Mass�
0� 1� 2�
3�
4�0
2
4
6
8
10H
eigh
t (k
m)
�
0.01�0.10�1.00
-28
-24
-20�-16�-12 -8�
-4�0�4�
8�12�16�
20�24
Drop�
Graup.Crys.
Max: 3.61 g kg� -1
Max: 0.00 g kg-1
Max: 0.00 g kg� -1
Max W: 12.2 m s� -1 Time: 24 min
Number Concentration�
0� 1� 2�
3�
4�
Radial Distance (km)�
0
2
4
6
8
10
Hei
ght
(km
)
�
1� 10�100�
0.1�1.0�5.0�
-28
-24
-20!-16"-12#-8$
-4�0%4&
8'1216�
20�24(
DropGraup.Crys.
Max: 579. cm-3
Max: 0.00 l� -1
Max: 17.0 l-1
Max W: 12.2 m s-1 Time: 24 min
Specific Mass�
0� 1� 2�
3�
4�0
2
4
6
8
10
0.010.10)0.01*0.10+
1.00,
0.01-0.10.
-28/
-240
-201-16
-122-83
-44054
68
7128169
20:24
Drop�
Graup.Crys.
Max: 1.16 g kg� -1
Max: 1.67 g kg-1
Max: 0.17 g kg� -1
Max W: 3.94 m s� -1 Time: 40 min
Number Concentration�
0� 1� 2�
3�
4�
Radial Distance (km)�
0
2
4
6
8
10
1;
1<
100.05=
0.50>[email protected]
-28B
-24
-20C-16D-12E-8F
-440G4
H8
I1216J
20K24
DropGraup.Crys.
Max: 43.3 cm-3
Max: 1.37 l� -1
Max: 17.0 l-1
Max W: 3.94 m s-1 Time: 40 min
Specific Mass�
0� 1� 2�
3�
4�0
2
4
6
8
10
0.01
L
0.01M
0.10N
0.01O0.10P
-28Q
-24
-20
-16R-12S-8T
-4U0
V4
8W12X16
2024
Drop�
Graup.Crys.
Max: 0.06 g kg� -1
Max: 0.22 g kg-1
Max: 0.60 g kg� -1
Max W: -7.2 m s� -1 Time: 64 min
Number Concentration�
0� 1� 2�
3�
4�
Radial Distance (km)�
0
2
4
6
8
10
1Y
0.05Z
0.50[
0.1\1.0]
5.0^
-28_
-24`
-20
-16R-12a-8b
-4
0c4
8d1216
2024
DropGraup.Crys.
Max: 2.66 cm-3
Max: 1.03 l� -1
Max: 8.81 l-1
Max W: -7.2 m s-1 Time: 64 min
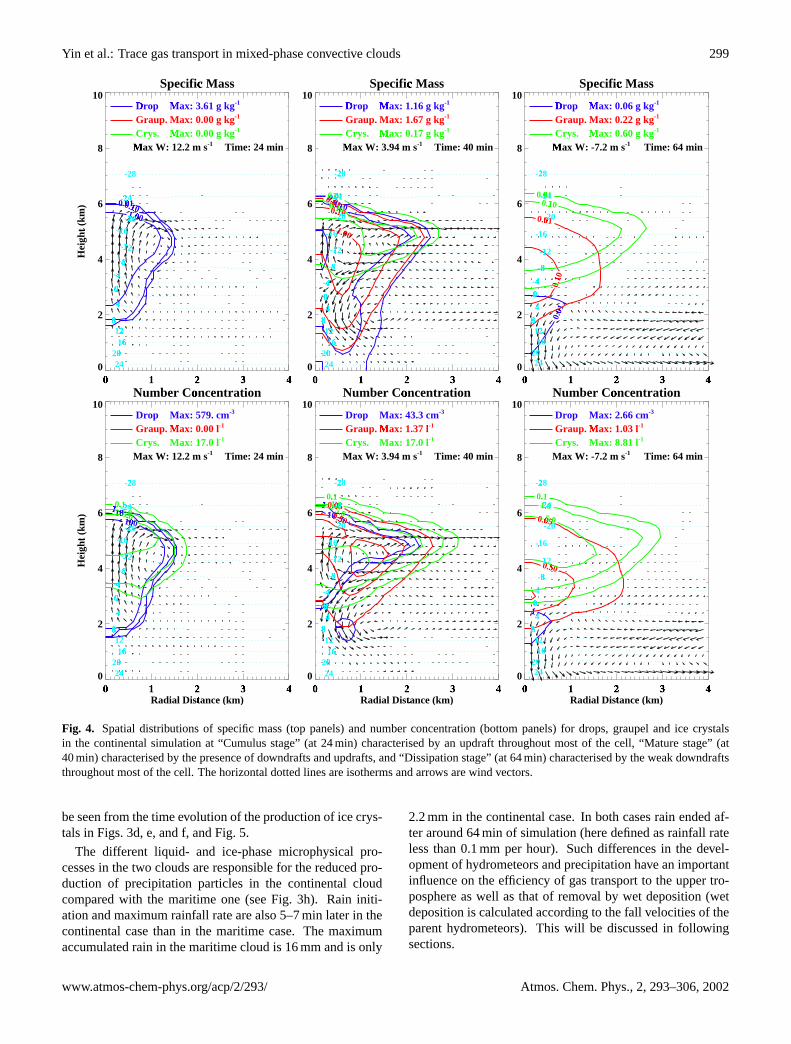
Fig. 4. Spatial distributions of specific mass (top panels) and number concentration (bottom panels) for drops, graupel and ice crystalsin the continental simulation at “Cumulus stage” (at 24 min) characterised by an updraft throughout most of the cell, “Mature stage” (at40 min) characterised by the presence of downdrafts and updrafts, and “Dissipation stage” (at 64 min) characterised by the weak downdraftsthroughout most of the cell. The horizontal dotted lines are isotherms and arrows are wind vectors.
be seen from the time evolution of the production of ice crys-tals in Figs. 3d, e, and f, and Fig. 5.
The different liquid- and ice-phase microphysical pro-cesses in the two clouds are responsible for the reduced pro-duction of precipitation particles in the continental cloudcompared with the maritime one (see Fig. 3h). Rain initi-ation and maximum rainfall rate are also 5–7 min later in thecontinental case than in the maritime case. The maximumaccumulated rain in the maritime cloud is 16 mm and is only
2.2 mm in the continental case. In both cases rain ended af-ter around 64 min of simulation (here defined as rainfall rateless than 0.1 mm per hour). Such differences in the devel-opment of hydrometeors and precipitation have an importantinfluence on the efficiency of gas transport to the upper tro-posphere as well as that of removal by wet deposition (wetdeposition is calculated according to the fall velocities of theparent hydrometeors). This will be discussed in followingsections.
www.atmos-chem-phys.org/acp/2/293/ Atmos. Chem. Phys., 2, 293–306, 2002

300 Yin et al.: Trace gas transport in mixed-phase convective clouds
Specific Mass�
0� 1� 2�
3�
4�0
2
4
6
8
10H
eigh
t (k
m)
�
0.01�0.10�1.00
0.01
0.10�
-28
-24�-20
-16�-12�-8�
-4�0�4�
8�12�16�
20�24
Drop�
Graup.Crys.
Max: 3.84 g kg� -1
Max: 0.44 g kg-1
Max: 0.01 g kg� -1
Max W: 13.4 m s� -1 Time: 24 min
Number Concentration�
0� 1� 2�
3�
4�
Radial Distance (km)�
0
2
4
6
8
10
Hei
ght
(km
)
�
1�10�
0.05�0.50�
0.1 1.0!
5.0"
-28#
-24$-20
-16%-12&-8'
-4(0)4�
8�1216*
20+24,
DropGraup.Crys.
Max: 81.5 cm-3
Max: 1.22 l� -1
Max: 30.0 l-1
Max W: 13.4 m s-1 Time: 24 min
Specific Mass�
0� 1� 2�
3�
4�0
2
4
6
8
10
0.01-
0.10.
0.10/0.010
0.101
1.002
0.0130.104
-285
-246
-207-168-129-8:
-4;0
<
4=
8>12
1620 24
Drop�
Graup.Crys.
Max: 2.24 g kg� -1
Max: 4.34 g kg-1
Max: 0.20 g kg� -1
Max W: -16. m s� -1 Time: 40 min
Number Concentration�
0� 1� 2�
3�
4�
Radial Distance (km)�
0
2
4
6
8
10
1?
1@
10
0.050.50A
1.00B
0.1C1.0D5.0E
-28
-246
-207-16F-12G-8H
-4I0
J
4K
8L12M16
20 24
DropGraup.Crys.
Max: 29.0 cm-3
Max: 1.81 l� -1
Max: 33.0 l-1
Max W: -16. m s-1 Time: 40 min
Specific Mass�
0� 1� 2�
3�
4�0
2
4
6
8
10
0.01N
0.01O
0.01P0.10Q
-28R
-24S
-20T-16U-12V-8W
-4
0X
4
8Y12Z16
20[24
Drop�
Graup.Crys.
Max: 0.04 g kg� -1
Max: 0.13 g kg-1
Max: 0.62 g kg� -1
Max W: -8.0 m s� -1 Time: 64 min
Number Concentration�
0� 1� 2�
3�
4�
Radial Distance (km)�
0
2
4
6
8
10
1\
0.05]
0.50
^
0.1_1.0`5.0a-28b
-24
-20
-16
-12V-8c
-4d0
e
4f
8g1216
2024
DropGraup.Crys.
Max: 1.73 cm-3
Max: 0.67 l� -1
Max: 18.4 l-1
Max W: -8.0 m s-1 Time: 64 min
Fig. 5. Spatial distributions of specific mass (top panels) and number concentration (bottom panels) for drops, graupel and ice crystalsin the maritime simulation at “Cumulus stage” (at 24 min) characterised by an updraft throughout most of the cell, “Mature stage” (at40 min) characterised by the presence of downdrafts and updrafts, and “Dissipation stage” (at 64 min) characterised by the weak downdraftsthroughout most of the cell. The horizontal dotted lines are isotherms and arrows are wind vectors.
4.2 The effect of retention coefficient on gas redistribution
Figure 6 shows how the total gas transport depends on thegas solubility (H ∗) and retention coefficient (Rc). The resultsare presented as integrated total species masses (gas plus allhydrometeor phases) over the entire cloud outflow region,which is all air above 4 km altitude (a gas molar mass of 50 gmol−1 is assumed, though absolute gas amounts are not asimportant as relative amounts). The results are shown for
the maritime and continental clouds at 64 min, which is afterrainfall has ceased. As an example of one particular pointon these contour plots, Fig. 7 shows the time evolution of gasabundance in different hydrometeors forH ∗ = 107 mol dm−3
atm−1 andRc = 1. In the following discussion we examinethe effect of changes inRc andH ∗ on gas transport in themaritime case and then compare the maritime and continentalcases.
Gas solubility in liquid hydrometeors and gas retention
Atmos. Chem. Phys., 2, 293–306, 2002 www.atmos-chem-phys.org/acp/2/293/

Yin et al.: Trace gas transport in mixed-phase convective clouds 301
10� 0 10
� 2 10� 4 10
� 6 10� 8
H* (mol dm� -3 atm-1)
0.0
0.2
0.4
0.6
0.8
1.0
Ret
enti
on C
oeff
icie
nt
�
Total Species Mass above 4 km�
1.5
�
2.5
�
3.5
�
4.5
�5.5
�
5.5
6.5
6.5�
7.5�
7.5
8.5
�
8.5�
9.5�
(a) maritimeMax: 9.87 kg
�Min: 0.84 kg
10� 0 10
� 2 10� 4 10
� 6 10� 8
H* (mol dm� -3 atm-1)
0.0
0.2
0.4
0.6
0.8
1.0
Ret
enti
on C
oeff
icie
nt
�
Total Species Mass above 4 km�3.5�
4.0
�
4.5
�
5.0
�
5.5
�6.0
�
6.0�6.5�
6.5�
(b) continentalMax: 7.30 kg
�Min: 3.28 kg
Fig. 6. Spatially integrated total species masses (gas plus all hydrometeor phases) above 4 km (the main cloud outflow region) as a functionof gas solubility and retention coefficient after 64 min of simulation of(a) the maritime case and(b) the continental case. The gas burialcoefficientβ = 0.
Table 2. Integrated trace gas mass (kg) removed by wet deposition in the continental (C1–C9) and maritime (M1–M9) clouds. Only resultsfor gases with effective Henry’s law constants of 0, 104, and 107 mol dm−3 atm−1, representative of insoluble, moderately soluble, andhighly soluble gases, respectively, are shown here. Detailed definitions of these cases are given in Table 1.
Runs H∗= 0 104 107 Runs H∗
= 0 104 107
C1 0.0 0.69 1.81 M1 0.0 3.30 10.22C2 0.0 0.66 1.67 M2 0.0 2.88 9.32C3 0.0 0.63 1.55 M3 0.0 2.57 8.30C4 0.0 0.61 1.43 M4 0.0 2.31 7.05C5 0.0 0.59 1.31 M5 0.0 2.11 5.48C6 0.02 0.79 1.83 M6 0.33 4.06 10.14C7 0.02 0.79 1.85 M7 0.33 4.05 10.36C8 0.02 0.79 1.86 M8 0.33 4.05 10.44C9 0.02 0.68 1.36 M9 0.26 2.83 5.80
upon freezing both lead to a decrease in total gas mass inthe outflow region (Fig. 6a). However, the effect of changesin one of these quantities depends on the value chosen forthe other. ForRc = 0, changes in gas solubility (H ∗) havevery little effect on gas transport. In this case, the transport ofeven highly soluble gases is similar to that of insoluble gasesbecause gas expulsion from ice hydrometeors means that inlarge parts of the cloud the gas is present largely in the gasphase. (It should be noted that after expulsion from the ice,the gas dissolves into the remaining supercooled drops. Thishappens during most of the cloud lifetime and has been in-dicated in the previous study of Barth et al. (2001) (see theirFig. 11). But after 64 min, as can be seen in Figs. 4 and 5,there is very little liquid water left in the region above 4 km,therefore, most of the tracer expelled from ice particles ispresent in the gas phase.)
The sensitivity of gas transport toH ∗ increases asRc in-creases. For 100% gas retention upon freezing (Rc = 1),the gas mass in the outflow region is a factor 12 lower for ahighly soluble gas than for an insoluble gas in the maritimecloud.
Changes inRc have little effect on the transport of low andmoderately soluble gases but have a significant effect on thetransport of highly soluble gases. For example, forH ∗
= 104
mol dm−3 atm−1 increasingRc from 0 to 1 leads to only a20% decrease in gas transport but forH ∗ > 106 gas trans-port decreases by a factor of 10. The effect of changes inRc are approximately the same for all gas solubilities greaterthan 106 mol dm−3 atm−1 because this value ofH ∗ repre-sents complete partitioning into the liquid phase before iceformation.
The continental clouds (Fig. 6b) show much less sensitiv-
www.atmos-chem-phys.org/acp/2/293/ Atmos. Chem. Phys., 2, 293–306, 2002

302 Yin et al.: Trace gas transport in mixed-phase convective clouds
0�
20�
40�
60�0
2
4
6
8
Hei
ght
(km
)
�
Gas-phase Fraction�
0�
20�
40�
60�0
2
4
6
8
Hei
ght
(km
)
�
Liquid-phase Fraction�
0�
20�
40�
60�0
2
4
6
8
Hei
ght
(km
)
�
Ice-phase Fraction�
0.01�0.10�
1.00�
0�
20�
40�
60�
Time (min)
0
2
4
6
8
Hei
ght
(km
)
�
Total Fraction
0�
20�
40�
60�0
2
4
6
8
Gas-phase Fraction�1102030
�
40�
50
60
7080
�
90�
100
0�
20�
40�
60�0
2
4
6
8
Liquid-phase Fraction�1102030
�
4050
60
7080
�
90�
100
0�
20�
40�
60�0
2
4
6
8
Ice-phase Fraction�
0.01 0.10�
0.01�
0.1�
1
10
20
30�
40�
50
0�
20�
40�
60�
Time (min)
0
2
4
6
8
Total Fraction11020
�
30�
40�
50
60
70�
80�
90�
100
C1 (species: H*=107) M1 (species: H*=107)
Fig. 7. Time-evolution of a soluble tracer (H∗= 107 mol dm−3 atm−1) in the main updraft core (center of the cloud) of the continental
cloud (left column) and maritime cloud (right column) with gas burial coefficientβ = 0 and retention coefficientRc = 1 (cases C1 and M1).The species abundance is expressed as percentages of the initial boundary layer mixing ratio. The tracer abundance in ice crystals (blacksolid contours) is over-plotted on that in graupel (filled colour contours). The black dotted lines are isolines of 10−3 g kg−1 condensed waterfor liquid-phase, ice-phase, and total water content.
ity to changes inRc andH ∗ than the maritime clouds. For ex-ample, for highly soluble gases (H ∗ > 106 mol dm−3 atm−1)a change inRc from 0 to 1 leads to a factor 10 decrease in gastransport for the maritime cloud but only a factor 2 decreasefor the continental cloud. Also, forRc = 1, the decrease in
gas transport for a highly soluble gas compared with an in-soluble gas is a factor of 12 for the maritime cloud but onlya factor of 2 for the continental cloud.
The much greater sensitivity of gas transport to gas sol-ubility and retention for the maritime cloud compared with
Atmos. Chem. Phys., 2, 293–306, 2002 www.atmos-chem-phys.org/acp/2/293/

Yin et al.: Trace gas transport in mixed-phase convective clouds 303
10� 0 10
� 2 10� 4 10
� 6 10� 8
H* (mol dm� -3 atm-1)
0.001
0.01
0.1
1.0
Bur
ial E
ffic
ienc
y
Total Species Mass above 4 km�
1.00�
2.00�
3.00� 4.0
0�
5.00�
6.00�
7.007.10
7.20
�
7.30
�(a) maritimeMax: 7.45 kg
Min: 0.75 kg
10� 0 10
� 2 10� 4 10
� 6 10� 8
H* (mol dm� -3 atm-1)
0.001
0.01
0.1
1.0
Bur
ial E
ffic
ienc
y
Total Species Mass above 4 km�
3.50�4.00�4.50�
5.00�5.30�5.40�
5.50
�
5.60�5.70�
5.80�
(b) continentalMax: 5.83 kgMin: 3.11 kg
Fig. 8. Spatially integrated total species masses (gas plus all hydrometeor phases) above 4 km (the main cloud outflow region) as a functionof gas solubility and burial coefficient after 64 min of simulation of(a) the maritime case and(b) the continental case. The gas retentioncoefficientRc = 1.
the continental cloud reflects differences in the microphysi-cal processes, and in particular development of precipitationparticles (Fig. 7). The main difference between the maritimeand continental simulations is apparent in the trace gas abun-dance in the ice crystals and graupel particles: much more ofthe gas is present in graupel particles in the maritime case,which is consistent with the much higher graupel mass (seeSect. 4.1). The much more efficient precipitation processesoccurring in the maritime cloud lead to efficient removal ofthe gas retained in large hydrometeors, and account for thelarge sensitivity of gas vertical transport to the choice ofRc
and H ∗. The higher efficiency of precipitation formationin the maritime cloud is also reflected in the amount of gaswashed out (Table 2).
Closer inspection of the model data also shows that in thecontinental case the slight increase in integrated trace gasmasses for gas solubility higher than 107 mol dm−3 atm−1
results from both gas and condensed phase material in theupper cloud layers. With an increase in gas solubility, moredissolved gas left in the condensed phase remains in the out-flow region even after rain. We speculate that this accountsfor the difference in characteristics from the maritime casein which most of the dissolved gas in the condensed phase iswashed out.
4.3 The effect of gas scavenging by ice particles on gas re-distribution
Gas scavenging here means the uptake and burial of tracegases by growing ice particles, and their release only upon iceparticle evaporation or sublimation and is distinct from gasretention upon freezing, as discussed in the previous section.
Similar to Fig. 6, Fig. 8 shows the variation with gas sol-
ubility and burial coefficient of the integrated total speciesmasses (gas plus all hydrometeor phases) above 4 km altitudeover the entire cloud outflow region. The results are shownfor the maritime and continental clouds at 64 min, and theretention coefficient (Rc) in both figures is 1. These figuresindicate that the efficiency of gas scavenging has little effecton gas transport except for relatively insoluble gases. Forsoluble gases, transport is dominated by uptake into droplets,for which gas retention upon freezing is then the determin-ing factor. This is generally consistent with the field mea-surements by Voisin et al. (2000) and can be explainedby the fact that high solubility species such as strong acidsare mainly present in the aqueous phase when riming oc-curs. Insoluble gases, however, are present largely in the gasphase in the cloud core, so their transport depends on the as-sumed uptake efficiency into growing ice crystals. However,even with highly efficient uptake into ice crystals (burial ef-ficiency,β = 1) the effect on gas concentrations in the cloudoutflow region is relatively small. For example, for a moder-ately soluble gas withH ∗ = 104 mol dm−3 atm−1, changingβ from 0 to 1 reduces the total gas abundance in the outflowregion by only 30% (compared with a factor of 12 changecaused by changingRc from 0 to 1).
Although the efficiency of gas uptake into growing crys-tals is not important for overall gas transport, it is impor-tant in determining the gas concentration in ice particles thatmay subsequently form cirrus clouds. Figure 9 shows the gasabundance in ice particles and graupel particles for cases C1(with β = 0) and C8 (withβ = 1.0). In each caseRc = 1.0.Ice particles dominate the hydrometeor population at the topof the cloud outflow region (see Figs. 4 and 5) and changingβ from 0 to 1 increases the gas abundance in these ice par-ticles by almost two orders of magnitude for the moderately
www.atmos-chem-phys.org/acp/2/293/ Atmos. Chem. Phys., 2, 293–306, 2002

304 Yin et al.: Trace gas transport in mixed-phase convective clouds
0�
20�
40�
60�
Time (min)
0
2
4
6
8
Hei
ght
(km
)
�
Ice-phase Fraction�
C1 (species: H*=104)
0.01�
0.01�
0.10�
0�
20�
40�
60�
Time (min)
0
2
4
6
8
Ice-phase Fraction�
C8 (species: H*=104)
0.01�
0.01
0.10
0.10
�
0.50�
0.50
1.00
1.00�
5.00�10.00
0.01�
0.1�
0.5�
1
4
7
10
Fig. 9. The effect of gas burial in growing ice crystals on the abundance of a trace gas in ice crystals and graupel in a continental cloud.Results are shown as the time-evolution of a moderately soluble tracer (H∗
= 104 mol dm−3 atm−1) in the main updraft core (or at thecenter of the cloud) for gas burial coefficientβ = 0 (case C1, left column) andβ = 1 (case C8, right column). The species abundance isexpressed as percentages of the initial boundary layer mixing ratio. The tracer abundance in ice crystals (black solid lines) is over-plotted onthat in graupel (filled colour contours). The black dotted line is the isoline of ice-phase water content = 10−3 g kg−1. In both cases the gasretention coefficientRc = 1.
0�
20�
40�
60�
Time (min)
0
2
4
6
8
Hei
ght
(km
)
�
Ice-phase Fraction�
C7 (species: H*=107mol dm-3 atm-1)
0.01�
0.01�
0.10�
0.10
0.50�
0�
20�
40�
60�
Time (min)
0
2
4
6
8
Ice-phase Fraction�
C9 (species: H*=107mol dm-3 atm-1)
0.01�
0.01�
0.10
0.10
0.501.00�
0.01�
0.1�
0.5�
1
4
7
10
Fig. 10.The effect of gas retention coefficient on the abundance of soluble tracers in ice crystals and graupel in the continental case. Resultsare shown as the time-evolution of a highly soluble (H∗
= 107 mol dm−3 atm−1) tracer with moderate burial coefficient (β = 0.1) inthe main updraft core (or at the center of the cloud) for retention coefficientRc = 1 (case C7, left column) andRc = 0 (case C9, rightcolumn). The species abundance is expressed as percentages of the initial boundary layer mixing ratio. The tracer abundance in ice crystals(black solid lines) is over-plotted on that in graupel (filled colour contours). The black dotted line is the isoline of ice-phase water content =10−3 g kg−1.
soluble gas (H ∗ = 104 mol dm−3 atm−1). In contrast, thechanges calculated for the highly soluble gas (not shown) arenegligible. However, if the soluble tracer is degassed uponfreezing (orRc = 0) and then scavenged by rapidly growingice particles (high burial coefficient), then the gas abundancein ice crystals can be increased by a factor of 2 even for ahighly soluble gas withH ∗
= 107 mol dm−3 atm−1(Fig. 10).In this case the gas abundance in graupel is significantly re-duced, especially for the highly soluble tracer.
It is also worth noting that while gas uptake by ice in-creases the abundance of that tracer in the ice phase, theamount deposited by precipitation on the surface remains es-sentially unchanged due to the fact that the low solubilitytracers are released to the gas phase once their ice-phase car-riers fall below the 0◦C level and begin to melt (see Table 2).
It should be stressed that these simulations represent upperand lower limits to the likely partitioning of gases into grow-ing ice crystals. It is unlikely that any gases will becomeburied in growing ice crystals with 100% efficiency. How-ever, moderately soluble gases (in this caseH ∗ = 104 moldm−3 atm−1) are likely to become buried in growing crys-tals to some extent, and in such cases accurate knowledge ofburial efficiencies will be important.
5 Conclusions
The Yin et al. (2001) model has been extended to include icephase microphysics and trace gas transport. In representingthese processes we have reduced the problem, for a given
Atmos. Chem. Phys., 2, 293–306, 2002 www.atmos-chem-phys.org/acp/2/293/

Yin et al.: Trace gas transport in mixed-phase convective clouds 305
cloud evolution, to a three-dimensional parameter space ofgas solubility (H ∗), retention coefficient (Rc), and burial ef-ficiency (β), acting to define the transport properties of a gasin a given cloud. The behaviour of the model as these param-eters are varied has been explored for two idealised clouds –maritime and continental – and in each case, the variation oftransport withH ∗, Rc andβ has been quantified.
The results show that the magnitude of total gas amounttransported to the upper troposphere is controlled by gas sol-ubility and gas retention coefficient. Gas transport is mostsensitive to the value of retention coefficient when the sol-ubility is high and, similarly, is most sensitive to solubilityfor high retention coefficients. Knowledge of the gas reten-tion coefficient is more important for maritime clouds thancontinental clouds, with a high retention coefficient leadingto higher wet removal of soluble tracers, according to therainfall rate in the cloud. In the extreme case with all thedissolved gas being released from liquid drops upon freezing(Rc = 0), even the highly soluble gases can be transported tothe free atmosphere and upper troposphere. This is consis-tent with the results of Barth et al. (2001), although differentthermodynamic conditions are used for intialization of thesimulations.
We have found that the total gas transport is relatively in-sensitive to direct gas uptake by growing ice particles (thegas burial efficiency). However, the burial efficiency stronglycontrols the concentration of trace gases inside anvil ice crys-tals, which subsequently form cirrus clouds.
The results obtained with this cloud model are now quiteexhaustive, in that they represent all the key transport pro-cesses. A number of other processes, notably reactive chem-istry, are not yet described. It is important at this stage to testthe model results against observational data.
Our results also indicate where gaps in our understand-ing of basic physical processes could impact our ability topredict gas transport in mixed-phase clouds. For example,defining the gas retention coefficient of a highly soluble gas(H ∗ > 106 mol dm−3 atm−1) in the range 0.5–1.0 allowsthe gas transport to be defined only to within a factor of 4for a maritime cloud. However, for a moderately soluble gas(H ∗
∼ 104 mol dm−3 atm−1) the uncertainty in gas transportwould be less than a factor of 2.
We have also highlighted the need for a physical represen-tation of gas uptake into ice hydrometeors that accounts forthe rate at which the particles are growing.
Acknowledgements.This research was conducted within theproject “Particles in the Upper Troposphere and Lower Stratosphereand Their Role in the Climate System” (PARTS) funded by the Eu-ropean Commission, and the Upper Troposphere – Lower Strato-sphere (UTLS-Ozone) thematic programme funded by the U.K.Natural Environment Research Council (NERC). We thank Prof.Zev Levin for kindly allowing us to use the axisymmetric cloudmodel. The helpful comments given by Drs. M. Barth, C. Mari,and S. Kreidenweis are also highly appreciated.
References
Barth, M. C., Stuart, A. L., and Skamarock, W. C.: Numerical sim-ulations of the July 10 Stratospheric-Tropospheric Experiment:Radiation, Aerosols, and Ozone/Deep Convection storm: Re-distribution of soluble tracers, J. Geophys. Res., 106, 12 381–12 400, 2001.
Chatfield, R. B., and Crutzen, P. J.: Sulfur dioxide in the remoteoceanic air: Cloud transport of reactive precursors, J. Geophys.Res., 89, 7111–7132, 1984.
Clapsaddle, C. and Lamb, D.: Sorption behavior of SO2 on ice attemperature between -30◦C and -5◦C, Geophys. Res. Lett., 16,1173–1176, 1989.
Clegg, S. M. and Abbatt J. P. D.: Uptake of gas-phase SO2 andH2O2 by ice surface: dependence on partial pressure, tempera-ture, and surface acidity, J. Phys. Chem., 105, 6630–6636, 2001.
Conklin, M. H. and Bales, R. C.: SO2 uptake on ice sphere: Liq-uid nature of the ice-air interface, J. Geophys. Res., 98, 16 844–16 851, 1993.
Conklin, M. H., Sommerfeld, R. A., Layrd, S. K., and Villinski,J. E.: Sulfur dioxide reactions on ice surface: implications fordry deposition to snow, J. Atmos. Environ., 27A, 159–166, 1993.
Crutzen, P. J. and Lawrence, M. G.: The impact of precipitationscavenging on the transport of trace gases: A 3-dimensionalmodel sensitivity study, J. Atmos. Chem., 37, 81–112, 2000.
Dickerson, R. R., Huffman, G. J., Luke, W. T., et al.: Thunder-storms: An important mechanism in the transport of air pollu-tants, Science, 235, 460–465, 1987.
Diehl, K., Mitra, S. K., and Pruppacher, H. R.: A laboratory studyof the uptake of HNO3 and HCl vapor by snow crystals and icespheres at temperature between 0 and−40◦C, Atmos. Environ.,29A, 975–981, 1995.
Diehl, K., Mitra, S. K., and Pruppacher, H. R.: A laboratory studyon the uptake of HCl, HNO3, and SO2 gas by ice crystals andthe effect of these gases on the evaporation rate of the crystals,Atmos. Res., 47/48, 235–244, 1998.
Hudson, P. K., Foster, K. L., Tolbert, M. A., et al.: HBr uptake onice: Uptake coefficient, H2O/HBr hydrate formation, and H2Odesorption kinetics, J. Phys. Chem., 105, 694–702, 2001.
Iribarne, J. V. and Pyshnov, T.: The effect of freezing on the com-position of supercooled droplets — I. Retention of HCl, HNO3,and NH3, J. Atmos. Environ., 24A, 383–387, 1990.
Iribarne, J. V., Pyshnov, T., and Naik, B.: The effect of freezing onthe composition of supercooled droplets — II. Retention of SO2,J. Atmos. Environ., 24A, 389–395, 1990.
Lamb, D. and Blumenstein, R.: Measurement of the entrapmentof sulfur dioxide by rime ice, Atmos. Environ., 21, 1765–1772,1987.
Mari, C., Jacob, D. J., and Bechtold, P.: Transport and scavengingof soluble gases in a deep convective cloud, J. Geophys. Res.,105, 22 255–22 267, 2000.
Mitra, S. K., Barth, S., and Pruppacher, H. R.: A laboratory studyon the scavenging of SO2 by snow crystals, Atmos. Environ.,24A, 2307–2312, 1990.
Prather, M. J. and Jacob, D. J.: A persistent imbalance in HOx andNOx photochemistry of the upper troposphere driven by deeptropical convection, Geophys. Res. Lett., 24, 3189–3192, 1997.
Pruppacher, H. R. and Klett, J. D.: Microphysics of Clouds andPrecipitation, D. Reidel, pp. 714, 1997.
www.atmos-chem-phys.org/acp/2/293/ Atmos. Chem. Phys., 2, 293–306, 2002
306 Yin et al.: Trace gas transport in mixed-phase convective clouds
Reisin, T., Levin, Z., and Tzivion, S.: Rain production in convectiveclouds as simulated in an axisymmetric model with detailed mi-crophysics. Part I: Description of the model, J. Atmos. Sci., 53,497–519, 1996.
Santachiara, G., Frodi, F., and Vivarelli, F.: Scavenging of SO2 andHCl during growth of ice crystals by vapour diffusion, Atmos.Environ., 29, 983–987, 1995.
Snider, J. R., Montague, D. C., and Vali, G.: hydrogen peroxideretention in rime ice, J. Geophys. Res., 97, 7569–7578, 1992.
Sommerfeld, R. A. and Lamb, D.: Preliminary measurements ofSO2 adsorbed on ice, Geophys. Res. Lett., 13, 349–351, 1986.
Tzivion, S., Feingold, G., and Levin, Z.: A efficient numerical so-lution to the stochastic collection equation, J. Atmos. Sci., 44,3139–3149, 1987.
Valdez, M. P., Dawson, G. A., and Bales, R. C.: Sulfur dioxide in-corporation into ice depositing from the vapor, J. Geophys. Res.,
94, 1095–1103, 1989.Voisin, D., Legrand, M., and Chaumerliac, N.: Scavenging of acidic
gases (HCOOH, CH3COOH, HNO3, HCl, and SO2) and ammo-nia in mixed liquid-solid water clouds at the puy de Dome moun-tain (France), J. Geophys. Res., 105, 6817-6835, 2000.
Yin, Y., Levin, Z., Reisin, T. G., and Tzivion, S.: The effects of giantcloud condensation nuclei on the development of precipitation inconvective clouds – A numerical study, Atmos. Res., 53, 91–116,2000.
Yin, Y., Parker, D. J., and Carslaw, K. S.: Simulation of trace gasredistribution by convective clouds – Liquid phase processes, At-mos. Chem. Phys., 1, 19–36, 2001.
Zondlo, M. A., Barone, S. B., and Tolbert, M. A.: Uptake of HNO3on ice under upper tropospheric conditions, Geophys. Res. Lett.,24, 1391–1394, 1997.
Atmos. Chem. Phys., 2, 293–306, 2002 www.atmos-chem-phys.org/acp/2/293/


