Download - ANNUAL REPORT ATFM OPERATIONS - atfmaai.aero

ANNUAL REPORT
ATFM OPERATIONS (Jan 2018 to Dec 2018)
CENTRAL COMMAND CENTER, C-ATFM, DELHI
ANNUAL REPORT – JAN’18 TO DEC’18
CCC-CATFM/2019/01/07 Page 1 of 25
Contents
Executive Summary .................................................................................................................................................... 3
Introduction ............................................................................................................................................................ 6
Traffic Scenario ....................................................................................................................................................... 6
ATFM Measures: ..................................................................................................................................................... 8
Analysis Period ........................................................................................................................................................ 8
Data source ............................................................................................................................................................. 8
ATFM Parameters ................................................................................................................................................... 9
1. ATFM Program Impact .................................................................................................................................. 11
1.1 ATFM Scenario .......................................................................................................................................... 11
1.2 Affected Flight Statistics ........................................................................................................................... 12
1.3 Inference ................................................................................................................................................... 12
2. ATFM Ground Delay ...................................................................................................................................... 13
2.1 ATFM Delay statistics ................................................................................................................................ 13
2.2 Inference ................................................................................................................................................... 14
3. ATFM Compliance Measurement ................................................................................................................. 15
3.1 Overall Compliance ................................................................................................................................... 15
3.2 ATFM Slot Adherence distribution ........................................................................................................... 16
3.3 CTOT Adherence rate of Airline Operators .............................................................................................. 17
3.4 CTOT Adherence rate by FMPs (Region wise) .......................................................................................... 18
3.5 CTOT Adherence rate - Airport wise ........................................................................................................ 18
3.7 Inference ................................................................................................................................................... 20
4. Air Delay ........................................................................................................................................................ 21
4.1 Inference ................................................................................................................................................... 22
5. Challenges ......................................................................................................................................................... 23
5.1 System related issues ............................................................................................................................... 23
5.2 Operational Issues .................................................................................................................................... 24

ANNUAL REPORT – JAN’18 TO DEC’18
CCC-CATFM/2019/01/07 Page 2 of 25
List of Figures:
Figure 1-Traffic Trend –Delhi ...................................................................................................................................... 6
Figure 2-Traffic trend-Mumbai ................................................................................................................................... 7
Figure 3-Traffic Trend-Bengaluru ............................................................................................................................... 7
Figure 4-Month-wise ATFM measures ....................................................................................................................... 8
Figure 5 - ATFM Scenario .......................................................................................................................................... 11
Figure 6 - Affected Flight Statistics ........................................................................................................................... 12
Figure 7 - ATFM Ground Delay Distribution ............................................................................................................. 13
Figure 8 – Month wise Average ATFM Delay ........................................................................................................... 14
Figure 9 - Overall Compliance................................................................................................................................... 15
Figure 10 - ATFM Slot Adherence ............................................................................................................................. 16
Figure 11 - ATFM Slot Adherence ............................................................................................................................. 16
Figure 12 - ATFM Departure Slot Adherence – Month wise ................................................................................... 17
Figure 13 - Overall Compliance Chart of Airline Operators ..................................................................................... 17
Figure 14 - FIR wise Compliance Chart of FMPs ....................................................................................................... 18
Figure 15- Airport Wise Compliance Chart - Mumbai Region ................................................................................. 18
Figure 16 - Airport Wise Compliance Chart - Delhi Region ...................................................................................... 19
Figure 17 - Airport Wise Compliance Chart - Chennai Region ................................................................................. 19
Figure 18 - Airport Wise Compliance Chart - Kolkata Region .................................................................................. 20
Figure 19 - Difference between AET & System EET (Air delay) for CTOT complied & non-complied aircraft ....... 21
Figure 20 - Cumulative Air Delay .............................................................................................................................. 22

ANNUAL REPORT – JAN’18 TO DEC’18
CCC-CATFM/2019/01/07 Page 3 of 25
Executive Summary
Airports Authority of India has implemented Central Air Traffic Flow Management (CATFM) in
India on 27th April’17 vide AIP supplement 25/2017 wherein six (6) major airports i.e. Delhi,
Mumbai, Chennai, Kolkata, Bengaluru and Hyderabad are consistently monitored for any
demand capacity imbalance. In case of any imbalance, ATFM measures like Ground Stop or
Ground Delay programs are implemented to regulate traffic to the constrained Airport.
The C-ATFM implementation process broadly consists of three phases
The focus in Phase I operations is towards airport demand-capacity analysis and applying ATFM
measures such as GDP/GSP. In Phase-I, only Domestic arrivals to constrained Airports are
regulated and the departures from the constrained Airport are regulated through the Airport
CDM.
In Phase II operations, the C-ATFM system will develop procedures for handling airspace
capacity issues. ATFM measures such as Route balancing, Fix balancing, Sector balancing,
Miles-in-Trail, Minutes-in-Trail will be available for application as needed.
The C-ATFM system and ACDM systems integration operational trials are in progress. It is
planned to gradually bring the various ACDM airports into the C-ATFM network over the next
year.
Phase III implementation involves cross border application of ATFM measures and integration
with Regional ATFM systems.
In its present phase-I implementation, the C-ATFM system network architecture consists of a
Central Command Center (CCC), supported by 36 (thirty six) Flow Management Positions
(FMP), located at 6 major Area Control Centers (ACC) and 30 (thirty) other major airports,
which includes 8 (eight) Defence airports also.
During the Year 2018, 351 (Three Hundred Fifty one) times ATFM measures were applied for
Delhi; 203(Two Hundred Three) number of times ATFM measures were applied for Mumbai
and 54(Fifty Four) times for Bengaluru. CCC had applied measures to address imbalances
occurring due to various reasons like airspace closure, non-availability of airport infra-
structures (Runway), NAV-AIDs (ILS etc.) & inherent imbalance in flight scheduling etc. Flow
measures were initiated for Delhi primarily to regulate imbalance created due to inefficient
scheduling during peak hours. However, in Mumbai and Bengaluru the main reason for
initiating ATFM measures was to address Demand Capacity Imbalance arising due to runway
closure.
Major achievements and activities of CCC during the year 2018 are highlighted below:
In an endeavor to increase ATFM operational awareness, CCC has conducted several training
programs in 2018, for all the stakeholders i.e. ANSPs, Airline operators, Airport operators &
Defence officers. A total of 694 ATCOs, 30 Airline personnel, 22 AOCC personnel & 197 Defence
officers were trained in the last two years.

ANNUAL REPORT – JAN’18 TO DEC’18
CCC-CATFM/2019/01/07 Page 4 of 25
Some best practices of the industry like “Stand-Up briefing twice a day in CCC”, “continuous
monitoring of applied CDM (w.r.t. compliance rate, CDM prediction accuracy & traffic flow)”,
“recording of hourly Demand of three major ACC airports” and “preparation of CDM
worksheet” have been adopted in CCC. A pre-programed EXCEL tool ‘Manual Slot Allocator’
developed in-house by CCC officers, was also introduced for manually allocating revised CTOTs.
The accuracy and currency of ‘Flight details’ & ‘Air Space data’ in SKYFLOW has improved with
active coordination with stakeholders. Constant efforts are being made to fine tune the ATFM
Operational procedures by plugging the loopholes brought to the knowledge of CCC through
regular feedback from stakeholders. CCC also carried out the exercise on collection & analysis
of data on “Early departure / Arrival to 3 constrained airports (Delhi, Mumbai &
Bengaluru)”.The outcome of the analysis was presented to MoCA.
CCC officers were actively involved in ICAO Regional working Group / Task force, Slot Allocation
meeting (Winter 2018-19). ATFM Dte. also hosted ATFM SG/8 meeting at Delhi in May 2018.
ATFM officers from CCC also visited ATSCC, FAA in USA and also participated in various ATFM
conferences, meetings & training programs.
ATFM documents like ‘Operations Hand book’; SOPs for Operational Supervisor, Air Space
Management (APM), Flight Plan Management (FPM), Traffic Flow Management (TFM),
Collaborative Decision Making (CDM) & Operability management (OPM) were reviewed and
amended by CCC officers prior to the ICVM audit. CCC hosted USOAP auditors and other
delegations from Indian Statistical Institute, DGCA official of GCAA, UAE, IAF technical officers
from MIT, Pune; officials from IIIT-Hyderabad; Honeywell engineers & ADB-SAFE GATE officials.
All visiting dignitaries were appreciative of India’s initiative in the field of ATFM.
ATFM SKYFLOW system software was upgraded to include Phase 2 functionalities. ATFM web
portal is also being developed. CCC officers were trained on these new functionalities.
Presently, testing of these phase 2 features in operational environment and web portal is in
progress.
ATFM in Indian Scenario, faces many challenging tasks ahead. Some of the important
Operational challenges for improvement in ATFM performance output are: -
approval of “Common Business Rule (CBR)” and Signing of “Letter of Agreement (LoA)”
with the stakeholders for proactive participation/continuous sharing of data &
information;
Incorporating ATFM requirements like “filing of FPLs at least 6 hour in advance and
timely initiation of CHG/DLA/CNL through AFTN messages” in AIP, for better accuracy
& currency of flight data;
also to encourage participation & to meet high expectations of stakeholder
“preference to CTOT complied flights over CTOT non-complied flights in tactical ATC
operational environment” and
‘Promulgation of new ATFM rules/regulations’ etc. to address current ATFM
performance problem.

ANNUAL REPORT – JAN’18 TO DEC’18
CCC-CATFM/2019/01/07 Page 5 of 25
Some immediate technical challenges are: –
“customization of SKYFLOW as per Indian aviation scenario” (by addressing RFCs)
“concept/design/implementation of IFPS”;
“24X7 technical support for SKYFLOW”;
“ATFM-ACDM integration” and
“Translocation of CCC from present to new location” in phased manner.
Finally, New C-ATFM building is ready at Vasant Kunj. The translocation & operationalization
of CCC at new location, without any disruption to ongoing operations, with present manpower
constraints and ensuring the availability of all required logistics at new location before shifting,
are immediate administrative challenges.
ANNUAL REPORT – JAN’18 TO DEC’18
CCC-CATFM/2019/01/07 Page 6 of 25
Annual ATFM Operations Report (Jan 2018 – Dec 2018)
Introduction Airports Authority of India (AAI), in accordance with ICAO guidelines has implemented
Central Air Traffic Flow Management (CATFM). The C-ATFM system network architecture
consists of a Central Command Center (CCC), supported by 36 (thirty six) Flow Management
Positions (FMP), located at 6 major Area Control Centers (ACC) and 30 (thirty) other major
airports, which includes 8 (eight) Defence airports also.
C-ATFM in India is being implemented in phased manner, broadly in three phases. ATFM phase-
I regular operation commenced from 27th April, 2017 vide AIP supplement 25/2017. During
phase-I operation the Demand-Capacity scenario of six (6) major ACCs airports i.e. Delhi,
Mumbai, Chennai, Kolkata, Bengaluru and Hyderabad, is regulated by applying appropriate
ATFM measures available in phase I i.e. Ground Delay & Airport Stop programs. Presently,
ATFM measures are applied only to Domestic arrivals to constrained Airports.
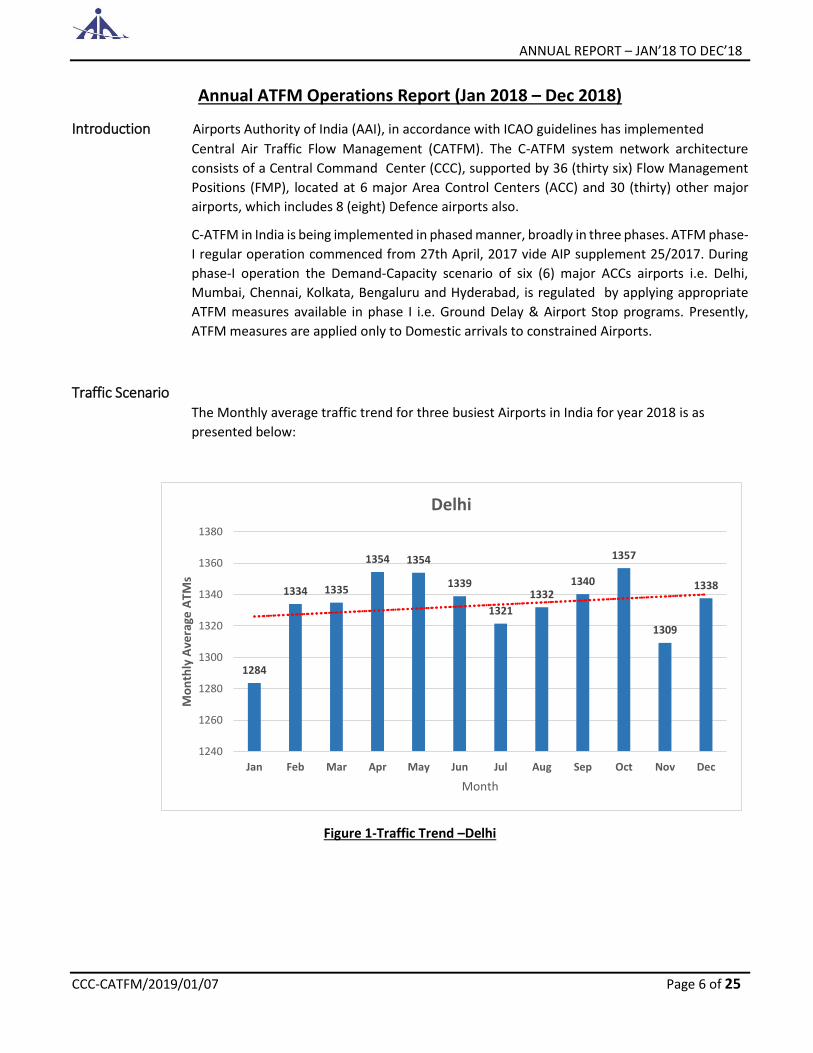
Traffic Scenario The Monthly average traffic trend for three busiest Airports in India for year 2018 is as
presented below:
Figure 1-Traffic Trend –Delhi
1284
1334 1335
1354 1354
1339
1321
13321340
1357
1309
1338
1240
1260
1280
1300
1320
1340
1360
1380
Jan Feb Mar Apr May Jun Jul Aug Sep Oct Nov Dec
Mo
nth
ly A
vera
ge A
TMs
Month
Delhi

ANNUAL REPORT – JAN’18 TO DEC’18
CCC-CATFM/2019/01/07 Page 7 of 25
Figure 2-Traffic trend-Mumbai
Figure 3-Traffic Trend-Bengaluru
Delhi Airport recorded a maximum of 42061 total movements in the Month of October whereas
Mumbai recorded the maximum ATM of 28600 and in the month of December 2018. Bengaluru
Airport recorded a highest average ATM of 704 in the month of December’18.
NOTE: Air Traffic Movement (ATM) = Arrivals + Departures
900
920 920
905911
904
869865
891899
924 923
830
840
850
860
870
880
890
900
910
920
930
Jan Feb Mar Apr May Jun Jul Aug Sep Oct Nov Dec
Mo
nth
ly A
vera
ge A
TMs
Month
Mumbai
601610 612
622
643653
633
648 653
687 691704
540
560
580
600
620
640
660
680
700
720
Jan Feb Mar Apr May Jun Jul Aug Sep Oct Nov Dec
Mo
nth
ly A
vera
ge A
TMs
Month
Bengaluru

ANNUAL REPORT – JAN’18 TO DEC’18
CCC-CATFM/2019/01/07 Page 8 of 25
ATFM Measures: During the Year 2018, 351 (Three Hundred Fifty one) times ATFM measures were applied for
Delhi; 203(Two Hundred Three) number of times ATFM measures were applied for Mumbai
and 54(Fifty Four) times for Bengaluru. It has been observed that usually the ATFM measures
were initiated to resolve imbalance created by inherent scheduling problem followed by
imbalance generated by planned runway closures.
Figure 4-Month-wise ATFM measures
Analysis Period 1st Jan 2018 – 31st Dec 2018
Data source SKYFLOW, Delhi Automation system, Airport CDM data Mumbai and Bengaluru, Mumbai
Automation system & feedback from stakeholders.
Data from SKYFLOW system and FMPs has been used for analysis. Where required, Delhi and
Mumbai Automation System data and Bengaluru AOCC/ACDM data has been used to augment
the available data. Flights with complete data i.e. ATOT(actual take off time), ATA(actual time
of arrival), etc. are only taken into consideration. Out of the total domestic arrivals for which
CTOTs(calculated take off time) were issued, 92.2% data has been considered for Compliance
measurement. Rest 7.8% data include domestic arrivals that did not operate and flights with
incomplete required information.
6 8 92
11
33
71
5954
3541
2214
53
1117
29
72
8 1020
25
75 5 5 4 5 4 6 4 6 6 2 2
0
20
40
60
80
Jan Feb Mar Apr May Jun Jul Aug Sep Oct Nov DecNo
. of
ATF
M m
eas
ure
s
Month
Month wise ATFM measures (2018)
Delhi Mumbai Bengaluru

ANNUAL REPORT – JAN’18 TO DEC’18
CCC-CATFM/2019/01/07 Page 9 of 25
ATFM Parameters
1. ATFM Program Impact
- ATFM Scenario
(An overview of traffic scenario within CDM scenarios, representing the ratio of
International traffic & domestic traffic to the constrained Airport.)
- Affected Flight statistics
[An insight of participating traffic in the scenario i.e. pie chart of the domestic arrivals
to constrained airport affected by ATFM measures (given delay by the Airport Delay
Program) and that of domestic arrivals not affected by ATFM measures (not given any
delay) within the CDM scenario.]
2. ATFM Ground delay
(ATFM ground delay defined as CTOT-ETOT)
i.e. Calculated take off time- Estimated take off time
- Total ATFM delay distribution
(Value in minutes representing total ATFM delay)
- Total flights affected
(Flight count in numerical value)
- Average ATFM delay
(Total ATFM delay for twelve months / total number of domestic flights)
- Maximum ATFM delay
(Maximum ATFM ground delay assigned by the system in the last twelve months)
- ATFM delay distribution in the band
(No delay, 0-5, 6-10; 11-15; 16-20; >20 minutes)
(An overview of ground delay distribution in the different time bands)
3. ATFM Compliance Measurement
- Overall compliance rate
(Defined as monthly ATFM departure slot adherence rate of regulated flights. Flights
having ATOT within the ATFM Slot Tolerance Window (STW) of CTOT i.e. -5 to +10
minutes of CTOTs, are considered as compliant flights)

ANNUAL REPORT – JAN’18 TO DEC’18
CCC-CATFM/2019/01/07 Page 10 of 25
- ATFM departure slot adherence distribution
(An overview of regulated flight departures inside an ATFM slot tolerance window
[ASTW], before ASTW & after ASTW)
- CTOT Adherence rate of Airline operators
(An overview of CTOT compliance rate of various Airline operators)
- CTOT Adherence rate of Regions
(An overview of CTOT compliance rate of 4 FIRs)
- CTOT Adherence rate of Airports within different Regions
(An overview of CTOT compliance rate of Airports within 4 FIRs)
4. Air delay statistics
{Air delay defined as difference between Actual elapsed time (AET) & estimated
elapsed time(EET), where EET can be obtained from FPL or (CLDT-CTOT) and AET can
be obtained from (ALDT-ATOT)}
- Distribution of (AET-EET) w.r.t. Compliant & non-compliant flights
(<=-30; -29 to -20; -19 to -10; -9 to -1; 0-10; 11-20; 21-30 & >31minutes)
(An overview of Air delay distribution in the different time bands
- Cumulative distribution of difference (AET-EET)

ANNUAL REPORT – JAN’18 TO DEC’18
CCC-CATFM/2019/01/07 Page 11 of 25
1. ATFM Program Impact
Data in this section helps to assess the impact of ATFM measure on overall flight operations in ATFM scenario &
the extent of flights involved. Analysis provides:
- Picture of overall traffic mixture in the ATFM scenarios for twelve months and the percentage of participating
flights to constrained airport.
- Percentage of participating flights given ATFM delay & its impact on overall flights in ATFM scenario.
1.1 ATFM Scenario
Total Flights 77204
International arrivals 7720
International departures 6628
Domestic arrivals 33552
Domestic departures 29304
Table-1
Figure 5 - ATFM Scenario
Within the CDM Scenario ,domestic departures from the constrained Airport are regulated through Airport
CDM. International Arrivals and Departures are exempted from ATFM measures. Only Domestic Arrivals to the
constrained airport are participating.
7720, 10%
33552, 43%
6628, 9%
29304, 38%
ATFM Scenario
International Arrivals Domestic Arrivals International Departures Domestic Departures

ANNUAL REPORT – JAN’18 TO DEC’18
CCC-CATFM/2019/01/07 Page 12 of 25
1.2 Affected Flight Statistics
Total affected flights in scenario (Domestic Arrivals to constrained Airport)
33552
Total Domestic Arrivals with ATFM delay 29671
Total Domestic Arrivals with zero ATFM delay 3881
Table-2
Figure 6 - Affected Flight Statistics
1.3 Inference
1. Out of the total arrivals captured to the constrained Airport during the CDM scenario (table-1), only 81.3%
of flights i.e. Domestic arrivals are participating.
2. Out of these Domestic Arrivals, 88% of flights were assigned ATFM ground delay & 12% of flights were not
assigned any ATFM delay (Figure-6).
3. Out of the total arrivals in ATFM scenario, only 71.9% of flights (domestic Arrivals with ATFM delay) are
affected by ATFM measures.
29671, 88%
3881, 12%
Affected Flight Statistics
Delayed flights Non-delayed flights

ANNUAL REPORT – JAN’18 TO DEC’18
CCC-CATFM/2019/01/07 Page 13 of 25
2. ATFM Ground Delay
Data analysis of this section provides insight into the impact of ATFM measure i.e. Ground delay. The
study of delay distribution will provide seriousness of the capacity constraint.
2.1 ATFM Delay statistics
Total affected flights in scenario (Domestic Arrivals) 33552
Total ATFM Delay (CTOT-ETOT) 489529 minutes (8158hrs:49mins)
Average ATFM Delay for affected flights 15 minutes
Maximum ATFM Delay 114 minutes
Table-3
Note:
*𝑨𝒗𝒆𝒓𝒂𝒈𝒆 𝑨𝑻𝑭𝑴 𝑫𝒆𝒍𝒂𝒚 =𝑻𝒐𝒕𝒂𝒍 𝑨𝑻𝑭𝑴 𝑫𝒆𝒍𝒂𝒚
𝑻𝒐𝒕𝒂𝒍 𝑫𝒐𝒎𝒆𝒔𝒕𝒊𝒄 𝑨𝒓𝒓𝒊𝒗𝒂𝒍𝒔
Figure 7 - ATFM Ground Delay Distribution
3881
5078 5591 5478
4663
8861
11.6
15.116.7 16.3
13.9
26.4
0.0
5.0
10.0
15.0
20.0
25.0
30.0
No delay 1-5min 6-10 min 11-15 min 16-20 min >20 min
0
1000
2000
3000
4000
5000
6000
7000
8000
9000
10000
% o
f fl
igh
ts
Delay Time
Flig
ht
Co
un
t
ATFM Ground Delay Distribution
Flight count % flights

ANNUAL REPORT – JAN’18 TO DEC’18
CCC-CATFM/2019/01/07 Page 14 of 25
Figure 8 – Month wise Average ATFM Delay
2.2 Inference
1. Among the total affected flights, 11.6% of flights, were not given any ATFM delay.(Figure-7)
2. Among the total affected flights, 31.8% of flights, were given ATFM delay up to 10 minutes.
3. Among the total affected flights, 30.2% of flights were given ATFM delay in the range of 11 to 20 minutes.
4. Among the total affected flights, 26.4% of flights were given ATFM delay of more than 20 minutes.
5. Average ATFM delay is highest in Month of May when ground Stop measures were applied to resolve
imbalance and congestion due to bad weather in Delhi.(Figure-8)
16 1711
14
25
1115 13 13 13 14 13
0
5
10
15
20
25
30A
vera
ge A
TFM
de
lay
(min
ute
s)
Month
Monthwise Average ATFM Delay
Average delay

ANNUAL REPORT – JAN’18 TO DEC’18
CCC-CATFM/2019/01/07 Page 15 of 25
3. ATFM Compliance Measurement
Data in this section helps to assess the actual situation achieved at the constrained airport.
Analysis provides:
- Overall picture of flights operating within compliance window.
- Overview of regulated flight departures within ATFM slot tolerance window (ASTW), before ASTW & after ASTW
- Compliance rate Airline Operator wise , Region wise, Station wise within different Regions and Reasons for Non-Compliance
3.1 Overall Compliance
Total Flights (Domestic arrivals) 33552
Flights with complete data (ATOT) 30927
Flights with incomplete data/ Flights Not Operated
2625
Compliant 22950
Non-Compliant 7977
Table-4
Figure 9 - Overall Compliance
NOTE: Flights with required data (i.e. ATOT) are only considered for compliance measurement
22950, 74%
7977, 26%
Overall Compliance
Compliance Non-compliance

ANNUAL REPORT – JAN’18 TO DEC’18
CCC-CATFM/2019/01/07 Page 16 of 25
3.2 ATFM Slot Adherence distribution
ATFM Slot tolerance window (ASTW) is -5 to + 10 minutes of CTOT. The aircraft departing within this
window shall be considered adhering to ATFM slots i.e. compliant flights.
Flight departing before 5 minutes & after 10 minutes of CTOT shall be considered out of ATFM slot
tolerance window & accordingly termed as Non-Compliant i.e. before / after ASTW departures
respectively.
Figure 10 - ATFM Slot Adherence
Figure 11 - ATFM Slot Adherence
9%
74%
17%
0%
10%
20%
30%
40%
50%
60%
70%
80%
Before ASTW Within ASTW After ASTW
ATFM slot adherence
1960745
8055
10540
4355
1485
3787
6.32.4
26.0
34.1
14.1
4.8
12.2
0.0
5.0
10.0
15.0
20.0
25.0
30.0
35.0
40.0
< = -10 min -9 to -6 min -5 to -1 min 0 to 5 min 6 to 10 min 11 to 15 min >15 min
0
2000
4000
6000
8000
10000
12000
% f
ligh
ts
Slot time band
Nu
mb
er
of
flig
hts
ATFM slot adherence
Flight Count Percentage

ANNUAL REPORT – JAN’18 TO DEC’18
CCC-CATFM/2019/01/07 Page 17 of 25
Figure 12 - ATFM Departure Slot Adherence – Month wise
3.3 CTOT Adherence rate of Airline Operators
Figure 13 - Overall Compliance Chart of Airline Operators
573
2074
809 701
1240
1765
32743088 3059
25072651
1209
476
1174
343241
665 602
960787 715 652
859
503
55
6470
74
65
75 77 80 81 7976
71
0
10
20
30
40
50
60
70
80
90
0
500
1000
1500
2000
2500
3000
3500
Ad
he
ren
ce r
ate
(%
)
No
. of
flig
hts
Month
ATFM Departure Slot Adherence - Monthwise
Flights within STW Flights outside STW Adherence rate
6252
8205
6992
2623 2543 2370
966
4425
6472
5222
1807 1919 1857
767
71
79
75
69
7578 79
62
64
66
68
70
72
74
76
78
80
82
0
1000
2000
3000
4000
5000
6000
7000
8000
9000
% c
om
plia
nce
Air India Indigo Jetairways Goair Spicejet Vistara Air Asia
No
. of
flig
hts
Overall Compliance Chart of Airline Operators
Total flights Compliant % compliant

ANNUAL REPORT – JAN’18 TO DEC’18
CCC-CATFM/2019/01/07 Page 18 of 25
3.4 CTOT Adherence rate by FMPs (Region wise)
Figure 14 - FIR wise Compliance Chart of FMPs
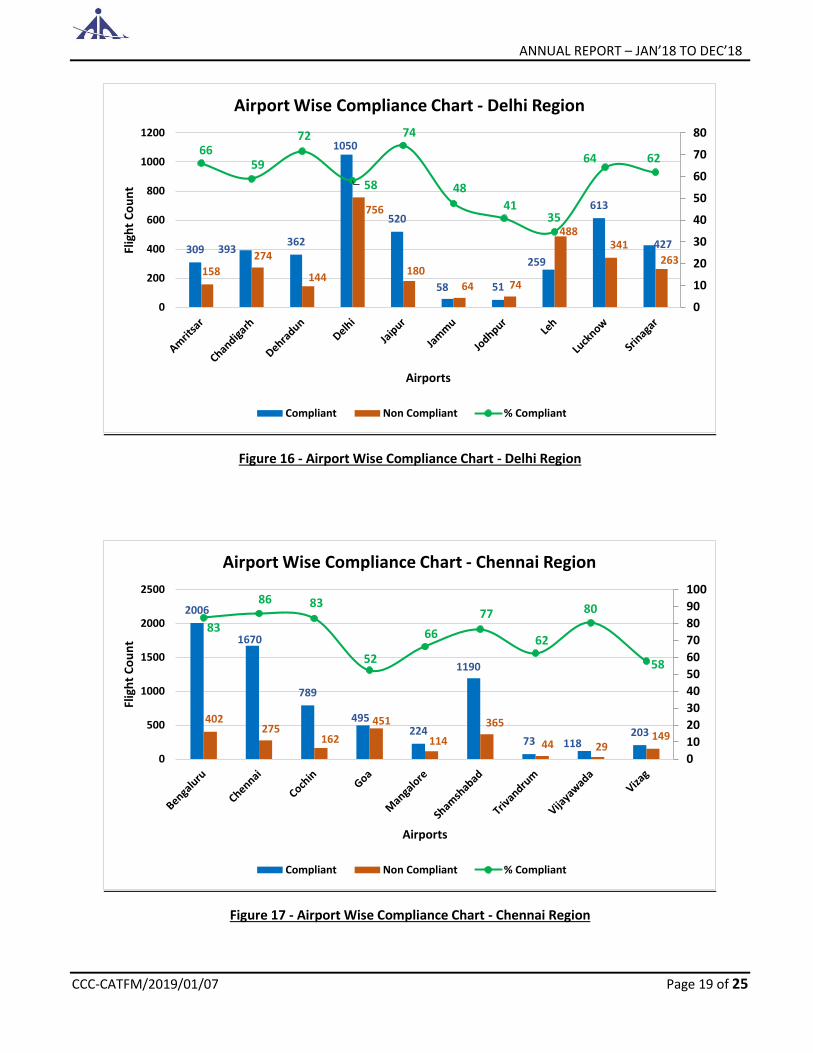
3.5 CTOT Adherence rate - Airport wise
Figure 15- Airport Wise Compliance Chart - Mumbai Region
885
70319
496
41
2788
651 658
134 248 167 191321
19 51 82 23
435
98 22934 45 51 52
7379
86 86
6487
87
74
8085
77
79
0102030405060708090100
0
500
1000
1500
2000
2500
3000
Flig
ht
Co
un
t
Airports
Airport Wise Compliance Chart - Mumbai Region
Compliant Non Compliant % Compliant
9210
8263
7379
5975
7048 6821
42854796
77%82%
58%
80%
0%
10%
20%
30%
40%
50%
60%
70%
80%
90%
Chennai FIR Mumbai FIR Delhi FIR Kolkata FIR
0
1000
2000
3000
4000
5000
6000
7000
8000
9000
10000
% C
OM
PLI
AN
T
NO
. OF
FLIG
HTS
FIR wise Compliance Chart of FMPs
Total flights Compliant % compliant
ANNUAL REPORT – JAN’18 TO DEC’18
CCC-CATFM/2019/01/07 Page 19 of 25
Figure 16 - Airport Wise Compliance Chart - Delhi Region
Figure 17 - Airport Wise Compliance Chart - Chennai Region
309 393362
1050
520
58 51
259
613
427
158
274
144
756
180
64 74
488341
263
6659
72
58
74
48
4135
64 62
0
10
20
30
40
50
60
70
80
0
200
400
600
800
1000
1200Fl
igh
t C
ou
nt
Airports
Airport Wise Compliance Chart - Delhi Region
Compliant Non Compliant % Compliant
2006
1670
789
495224
1190
73 118203
402275
162
451
114
365
44 29149
83
86 83
52
66
77
62
80
58
0
10
20
30
40
50
60
70
80
90
100
0
500
1000
1500
2000
2500
Flig
ht
Co
un
t
Airports
Airport Wise Compliance Chart - Chennai Region
Compliant Non Compliant % Compliant

ANNUAL REPORT – JAN’18 TO DEC’18
CCC-CATFM/2019/01/07 Page 20 of 25
Figure 18 - Airport Wise Compliance Chart - Kolkata Region
3.7 Inference
1. Out of the total domestic arrivals with complete data in ATFM scenario, 74% flights are compliant. (Figure-
9)
2. Indigo, Spice jet, Vistara , Jet Airways and Air Asia airlines have a compliance rate of more than average
recorded 74% compliance. (Figure13)
3. Within the Indian FIRs, Mumbai region is having highest compliance rate of 82% whereas Delhi region is
the lowest with compliance rate of 58%. (Figure-14)
113
538512
1516
554463 461 495
46125 164
376
13650 72 139
71
8176 80 80
9086
78
0
10
20
30
40
50
60
70
80
90
100
0
200
400
600
800
1000
1200
1400
1600Fl
igh
t C
ou
nt
Airports
Airport Wise Compliance Chart - Kolkata Region
Compliant Non Compliant % Compliant

ANNUAL REPORT – JAN’18 TO DEC’18
CCC-CATFM/2019/01/07 Page 21 of 25
4. Air Delay Air delay can be computed by comparing flights’ Actual Elapse Time (AET) against Estimated Elapse Time
(EET). EET can be obtained from flight plans or by calculating (CLDT – CTOT), whereas AET can be obtained
from the difference between actual landing time (ALDT) and actual take-off time (AET = ALDT – ATOT).
Therefore, Air delay = AET-EET
This data provides effectiveness of ATFM program in facilitating traffic flow into the constrained airport
(without excessive delay)
In most months of the report, EET was obtained by calculating CLDT-CTOT (SKYFLOW system), as it is
cumbersome to extract EET from FPL of each flight. Since April 2018, EET is extracted from RPL/FPL.
Distribution of difference between AET & system EET
AET-EET min (time band)
<= -10
-9 to -6 -5 to -1 0 to 5 6 to 10 11 to 15 16 to 20 21 to 25 26 to 30 >30
Compliant
Flt. count 883 828 2426 6040 4015 2768 1990 1341 869 1706
% flight 3.9 3.6 10.6 26.4 17.6 12.1 8.7 5.9 3.8 7.4
Non-compliant
Flt. count 533 312 710 1634 1112 897 712 538 386 1039
% flight 6.8 4 9 20.8 14.1 11.4 9 6.8 4.9 13.2
Table-5
NOTE:
1. ATOTs have been taken from feedback received from FMPs.
2. ALDTs have been taken from Delhi automation data, Bengaluru AOCC and Mumbai Airport CDM
Figure 19 - Difference between AET & System EET (Air delay) for CTOT complied & non-complied aircraft
3.93.6
10.6
26.4
17.6
12.18.7
5.93.8
7.46.8
4 9
20.8
14.111.4
9
6.84.9
13.2
0
5
10
15
20
25
30
<=-10 -9 to -6 -5 to -1 0 to 5 6 to 10 11 to 15 16 to 20 21 to 25 26 to 30 > 30
Per
cen
tage
Air Delay in Minutes
Difference between AET & System EET (Air delay) for CTOT complied & non-complied aircraft
Complied Non Complied

ANNUAL REPORT – JAN’18 TO DEC’18
CCC-CATFM/2019/01/07 Page 22 of 25
Figure 20 - Cumulative Air Delay
4.1 Inference
- 74.2% of compliant flights have AET, not more than 15 minutes, than system EET.(Figure-20)
- 66.1% of non-compliant flights have AET, not more than 15 minutes than system EET.
- 25.8% of compliant flights faced delay of more than 15 minutes.
- 33.9% of non-compliant flights faced delay more than 15 minutes.
3.9 7.5
18.1
44.5
62.1
74.2
82.988.8
92.6100
6.810.8
19.840.6
54.7
66.1
75.181.9
86.8
100
0
10
20
30
40
50
60
70
80
90
100
< = -10 -9 to -6 -5 to -1 0 to 5 6 to 10 11 to 15 16 to 20 21 to 25 26 to 30 > 30
Pe
rce
nta
ge
Air Delay in Minutes
Cumulative Air Delay
Complied Non complied

ANNUAL REPORT – JAN’18 TO DEC’18
CCC-CATFM/2019/01/07 Page 23 of 25
5. Challenges
5.1 System related issues 1. “Watch Hours“ of all the Airports is entered in the system. However, the system does not consider these watch
hours while issuing CTOTs and issues CTOTs beyond the watch hours of the Airport.
2. “Partial Update” feature of updating the demand in tactical environment leads to large delays to a new FPL or
any “CHG” message received for any FPL (irrespective of the change , e.g. an aircraft type, route, EOBT change
etc. is likely to affect the profile of the aircraft, whereas a change in navigation capability, squawk change does
not have any influence on the profile)
3. System creates different flight Profiles depending on filed FPL. For International flights the system reads the
Estimated elapse time till our Indian FIR boundary for profile generation.
Wrong profile is generated for flights entering Indian airspace via “ANSOS”,”IBITA” etc.
All this reflects the flights at wrong timings as compared to their actual entry into the constrained Airport.
4. Departure and Arrival messages received through AFTN by ATS automation system are at times, rejected by
the SKYFLOW system(due synchronization issue). In such cases, SKYFLOW system will not be able to update the
flight plan information for the concerned flights. SKYFLOW is also capturing the wrong ATOT because of
multiple departure messages received. (issue already raised to ATECH) .The surveillance system at bigger
airports capture departures from the satellite stations after the flight has passed through a particular altitude.
In absence of “DEP” messages from these stations, the system wrongly updates the ATOT as the time it is picked
up by a surveillance unit.
5. In some instances, for the flights activated by “COR” the system is not populating the ATOT field though
corresponding “DEP” messages have been received.
6. After using "APPLY” feature to a CDM scenario, Delay messages (DLA) are being sent by SKYFLOW system
resulting in revision of EOBT of the delayed flight in ATS automation system .This is incorrect, as the initiation
of a DLA message is the prerogative of the originator. The issue is already taken up with ATECH.
7. The system does not have any feature to put independently Airport Arrival rate (AAR) and Airport Departure
rate (ADR) to regulate the demand against the practiced capacity.
8. System functionalities are limited to balancing demand against capacity of an individual Aerodrome. In case of
two constrained Airports with overlapping timings, the SKYFLOW system Algorithm may not be able to give
an acceptable solution. (refer ATECH e-mail dated 28th April, 2017).
9. Once the CDM is applied , the system does not update the CDM Scenario. Lack of dynamic update presents
stale demand information through the CDM.

ANNUAL REPORT – JAN’18 TO DEC’18
CCC-CATFM/2019/01/07 Page 24 of 25
5.2 Operational Issues
1. The present means of communicating the application of ATFM measures is through instant messaging
followed by an email addressed to all stations. This has proved to be an inefficient means of information
broadcast as many stations are unaware of the measures till CTOTs are actually passed to them from the
main FMP units.
2. The existing means of CTOT dissemination by FMPs to different ATS units and ATCs within their jurisdiction
leads to delays in timely dissemination of CTOTs for ensuring compliance. The Airline operators are also
falling short in their responsibility of sharing the CTOTs received with their Air crew.
3. FMPs installed at Defence and few satellite Airports have been trained on ATFM “SKYFLOW” but still have
CTOT accessibility issues. Information sharing regarding commencement of ATFM measures and ADP is still
an issue with these stations.
4. A lead in time of at least 3 hours is required for preparation of CDM, in order to disseminate CTOTs at least
2 hours prior to EOBT. Airports with flying time of more than 2 and half hours face the difficulty in
dissemination of the CTOT information to Airlines in time for CTOT compliance. This leads to non-compliance
of CTOT timings, as with passengers on board the flights, it becomes difficult for Airlines to comply with the
CTOT restriction.
5. Airlines are preponing their EOBTs with ATC by filing a fresh FPL with revised EOBT. These FPLs do not enter
the “SKYFLOW” system due to the presence of duplicate RPL in SKYFLOW with differing EOBT. Such flights
take off for constrained Airport without a valid CTOT.
6. The RPLs and FPLs in SKLYFLOW get annulled after 120 minutes of their EOBT in absence of timely origination
of “DLA” messages by airlines, This leads to display of wrong demand in the System. Any CDM prepared for
post Fog or post disruption will reflect wrong demand until and unless the Airlines amend their flight
intentions by generating appropriate AFTN message addressed to VIDPCTFM.
7. SKYFLOW system is not receiving DEP messages from all the domestic and international Airports. In such
cases, the demand is not correctly reflected for a constrained Airport.
8. Tactical ATFM measures implemented by ATC of constrained Airport in addition to ATFM measures enforced
is not communicated to CCC in time, leading to confusion and conflicting instructions for Airline operators.
Tactical ATFM measures initiated by constrained Airport cannot be incorporated in the SKYFLOW system
which causes wrong depiction of demand.
9. Requests for revised CTOT has increased but the airlines are still not updating their flight intent in SKYFLOW
by originating an appropriate AFTN message addressed to VIDPCTFM. Genuine requests for revision of slot
allocation are handled manually by CCC as there is no provision of revision of CTOT in SKYFLOW system after
the use of " APPLY " feature. This leads to over delivery of flights to a constrained Airport during such hours.
The slots vacated cannot be assigned to others through the system. This leads to under delivery during that
period. SKYFLOW system does not have facility of dynamic CTOT allocations. (refer ATECH e-mail dated 28th
July, 2017)

ANNUAL REPORT – JAN’18 TO DEC’18
CCC-CATFM/2019/01/07 Page 25 of 25
10. Due to lack of understanding at many Airports, flights following ATFM Ground delay for a constrained Airport
are held on ground and made to depart within their CTOT tolerance window whereas flights which are
actually planned to operate after the ATFM Scenario period to the same constrained Airport are not
restricted at all.
11. Many operators mostly non-scheduled operators and Military flights are not filing their FPLs, three (03) hours
prior to their EOBTs leading to wrong demand prediction.
12. The flights given exemption(accommodated in the CDM with no delay) on operational grounds are at times
not following the allotted CTOT (which is same as filed EOBT plus default taxi time). It is essential for all
stakeholders to note that these exempted flights are accorded priority over others but even these flights
need to adhere to the issued CTOT, within the permissible tolerance window of minus 5 to plus 10 minutes.
13. Increasing number of exemption requests on various reasons like VIPs on board, FDTL, watch hour
restrictions, Sunset restrictions , operational Constraints etc. leads to undue delays to other flights. This
problem becomes grave when the constrained Airport has a grid lock lasting for more than an hour.
14. The RPLs received from Airlines on fortnightly basis does help CCC in strategic decision making. Very few
domestic airlines share their “No ops” information or send an associated AFTN CNL or CHG message. As
SKYFLOW utilizes, RPL for Demand projection, absence of correct information leads to wrong demand
prediction.
In some cases, the EOBT filed in RPLs with CCC and FPL filed on the day does not match leading to long error
queues.
15. The CDMs prepared to cater to demand capacity imbalance towards the end of a day usually reflects wrong
demand as the Flight intentions are not timely updated by Airlines in the SKYFLOW i.e. by originating
appropriate ATS messages through AFTN.
16. CTOT compliant flights are not receiving any preference over non-compliant flights while arriving at
constrained airport, therefore getting substantial ground as well as airborne delay.
17. CDMs prepared to cater to post Weather disruption or post exigency period, even with few hours prior
notice might not capture actual scenario, as for a correct demand prediction updated information on delayed
and diverted flights in the SKYFLOW system is essential. Airport operators are also unable to provide advance
flight information due to uncertainty in such situation.
---------------- X -----------------


