
= -
NASA-CR-198595
OF A
ANNUAL RESEARCH TECHNICAL REPORT
ON STUDY OF DEVELOPMENT AND UTILIZATION
MULTIPURPOSE ATMOSPHERIC CORROSION SENSOR
./x/7E-f//.,"_./
//./- sS'-
o
NASA GRANT #NAG 10-0127
w
I i
= =
COLLEGE OF ENGINEERING
SOUTHERN UNIVERSITY
BATON ROUGE, LOUISIANA 70813
E December, 1994
: i
i
i
. =
y=
RAVINDER M. DIWAN, Ph.D.
PROFESSOR AND PRINCIPAL INVESTIGATOR
A. RAMAN, Ph.D.
ADJUNCT PROFESSOR AND CO-PRINCIPAL INVESTIGATOR
P.K. BHATTACHARYA, Ph.D.ASSOCIATE. PROFESSOR AND CO-PRINCIPAL INVESTIGATOR
t
k_
=
SUBMITTED TO:
NASA KENNEDY SPACE CENTER
FLORIDA 32899
(NASA-CR-198595) STUDY O_
DEVELOPMENT AND UTILIZATION OF A
MULTIPURPOSE ATMGSPHERIC CORROSION
SENSOR Annual Research Technical
_eport (Southern Univ.) 55 p
N95-2736e
G3/35 0049942

J
w
I I
w
w
w
w
w
w
w
w
ANNUAL RESEARCH TECHNICAL REPORT
ON STUDY OF DEVELOPMENT AND UTILIZATION
OF A MULTIPURPOSE ATMOSPHERIC CORROSION SENSOR
NASA GRANT #NAG 10-0127
COLLEGE OF ENGINEERING
SOUTHERN UNIVERSITY
BATON ROUGE, LOUISIANA 70813
December, 1994
RAVINDER M. DIWAN, Ph.D.
PROFESSOR AND PRINCIPAL INVESTIGATOR
A. RAMAN, Ph.D.
ADJUNCT PROFESSOR AND CO-PRINCIPAL INVESTIGATOR
P.K. BHATTACHARYA, Ph.D.
ASSOCIATE PROFESSOR AND CO-PRINCIPAL INVESTIGATOR
SUBMITTED TO:
NASA KENNEDY SPACE CENTER
FLORIDA 32899

r •
ANNUAL RESEARCH TECHNICAL REPORT
OF A
ON STUDY OF DEVELOPMENT AND UTILIZATION
MULTIPURPOSE ATMOSPHERIC CORROSION SENSOR
L .
w w-
NASA GRANT #NAG 10-0127
COLLEGE OF ENGINEERING
SOUTHERN UNIVERSITY
BATON ROUGE, LOUISIANA 70813
w
w
m
m
w
December, 1994
RAVINDER M. DIWAN, Ph.D.
PROFESSOR AND PRINCIPAL INVESTIGATOR
A. RAMAN, Ph.D.ADJUNCT PROFESSOR AND CO-PRINCIPAL INVESTIGATOR
P.K. BHATTACHARYA, Ph.D.
ASSOCIATE PROFESSOR AND CO-PRINCIPAL INVESTIGATOR
SUBMITTED TO:
NASA KENNEDY SPACE CENTER
FLORIDA 32899
i--
w

FOREWORD
The enclosed annual research technical report work has been carried out under
NASA Grant # NAG 10-0127. The authors conducted a thorough review of the state of
the art methods in atmospheric corrosion detection and a study and evaluation of
development of a multipurpose atmospheric corrosion sensor. This research has been
supported by NASA Kennedy Space Center, Florida. Dr. Rupert Lee, DM-MSL-22
served as the Technical Officer and Coordinator of the research project, with Mr. David
Makufka and Ms. Joyce Beeson, OP-MSO-A as the Administrative Coordinators for this
research project.
In addition to this annual research technical report, interim progress reports have
been submitted periodically every three months on this project and a state of the art in
atmospheric corrosion detection review report has been also submitted to Materials
Science Laboratory, Kennedy Space Center.
Annual Research Technical Report Submitted:
L_
December, 1994
Ravinder M. Diwan, Ph.D.
Professor and Principal Investigator
Southern University
Baton Rouge, LA 70813

r_
i==
w
w
ACKNOWLEDGMENT
The authors express their sincere gratitude and appreciation for the financial
assistance provided through the NASA, Kennedy Space Center, Florida under Grant
# NAG 10-0127. Appreciation is expressed to Dr. Rupert Lee of the Materials Science
Laboratory, Kennedy Space Center, who served as the Technical Officer and Coordinator
for this project and provided valuable collaborative technical support. Mr. David Makufka
and Ms. Joyce Beeson of Kennedy Space Center, served as the Administrative
Coordinators for this research project. Special thanks are expressed to them for their
administrative support of this project.
w
w
w
r--
m
L
w

--_-
w
w
w
w
L
TABLE OF CONTENTS
3.0
3.1
3.2
3.3
3.4
4.0
4.1
4.2
Foreword
Acknowledgmet
INTRODUCTION
APPROACH ON MICROSENSOR
DESIGN CHARACTERISTICS
DEVELOPMENTF THIN FILM DEPOSITION TECHNIQUES
Evaporation Techniques
Sputtering Apparatus
Deposition Uniformity Results
Results on Fabrication of Research on Corrosion Sensors
CORROSION TESTING
Corrosion Tests Performed
Time of Wetness and Variation in Wetness
4.3 Fog Tests
4.4 Results and Discussion
Pagei
ii
2
3
9
12
15
16
21
24
27
28
29
7 7 5.0 CONCLUSIONS AND SUMMARY
APPENDIX
42
43
E
iii

z =
L_
m
__I
1.0 INTRODUCTION
There has been a critical need for analyzing the several aspects of atmospheric
corrosion and for development of atmospheric corrosion microsensors. This project has
been carried out in collaboration with the Materials Science Laboratory of NASA
Kennedy Space Center, Florida. The project work has involved the following activities:
a) making of multielectrode corrosion monitors on dielectric substrates,
b) testing them in the laboratory for functional characteristics,
c) preparing a report on the state of the art of atmospheric corrosion sensor
development around word, and
d) corrosion testing of electrochemical changes of sensor specimens and related
fog testing.
The studies included work on the subject of development and utilization of a
multipurpose atmospheric corrosion sensor and this report is the annual report on work
carried out on this referenced research project. This has included studies on the
development of sensors of two designs, stage I and stage II, and with glass and alumina
substrate, experimentation and development and characterization of the coating
uniformity, aspects of corrosion monitoring, literature search on the corrosion sensors and
their development. A state of the art report on atmospheric corrosion sensor development
was prepared and submitted (Reference R1). This project has involved the work and
research efforts of Principal Investigator Dr. R. Diwan, and Co-principal Investigators
Dr. P.K. Bhattacharya, and Dr. A. Raman. The experimental techniques are under
development and being fine tuned and the research team has included the involvement and
training of graduate students in Materials Program Mr. Manoj Chabbra, and Mr. Wensen
Li and undergraduate engineering students Mr. Ali Darwish, Miss Felesha Robertson,
Miss Lorann Jones and Mr. Chin-siung Teo.
R1. R. Diwan, A. Raman and P.K. Bhattacharya; Review Report on " State of the Art in
Atmospheric Corrosion Detection", Submitted to NASA Kennedy Space Center,
September, 1994.

w The microsensor electrode experimental work on fabrication and corrosion testing
is continuing and a proposal is under consideration for a continued further research in this
area for three years as per the needs of NASA Kennedy Space Center.
L_
r •
i i
_J
T==-
u
2.0 APPROACH ON MICROSENSOR DESIGN CHARACTERISTICS
The principle of corrosion sensing calls for electrochemical evaluation of suitable
thin f'dm (TF) electrodes deposited on a dielectric substrate and exposed to the corrosive
environment. The corrosion causing parameters can be evaluated with sensitive elements
such as iron, aluminum, zinc, etc. Thin films of one or two different elements, either alone
or in galvanic coupling can be exposed. Corrosion would occur due to moisture
condensing on the elements along with any contaminants. The metallic film would
corrode at a certain rate, proportional to the corrosion current developed by the metal
being subjected to a specific potential, characteristic of the metal and the variables of the
corroding environment, such as pH, ion concentration in the condensate, temperature, etc.
Thus at a given site, under specific, nearly uniform atmospheric conditions, the corrosion
potential of the metallic film and the corrosion current passing through it subjecting it to
corrode would be of interest. These would vary, especially the current, if corroding
conditions become severe, say due to sudden outbursts of pollutants into the atmosphere.
The corrosion potentials and the corrosion currents are to be determined using
linear polarization and Tafel extrapolation techniques of electrochemistry. These are well
known and described in standard textbooks on electrochemistry.
w
When two corrodible metals located on the same substrate are connected to each
other and exposed to the corrosive atmosphere, one of them would corrode while the
other would resist corrosion. This is from the principles of galvanic corrosion.
In our attempts at developing the atmospheric corrosion sensors (ACS) we have
chosen iron and aluminum as the two corrodible metal electrodes, for the alloys of these

elementsare the most utilized structural materialsin the atmosphere. To be able to
perform the electrochemicaltests,gold or 60% gold-40%palladiumalloy film is usedas
the counterelectrodeanda silver thin film electrodesuitablyprocessedinto a reference
electrodewouldserveasthereferenceto readthepotentialsof thecorrodingmetals.
In the corrosionexperimentsthe open circuit corrosion potential will be first
determinedusingthesilver referenceelectrode. Thecorrodingfilm electrodewill thenbe
connectedto thegoldfilm electrodeandthepotentialvariedin slow enoughstepsfrom 20
to 50 millivolt belowthe corrosionpotentialto about20 millivolt or closeto it abovethe
corrosionpotential. Suchpolarizationof the corroding electrodefilm throughuseof a
suitablefunction generatorand d.c. potential imposition is required. The current is
continuouslymonitoredduring thepolarizationprocess.
i L
= =
= =
F_
rw
From the anodic polarization data, linear polarization resistance, the anodic and
cathodic Tafel slopes are determined. These are then utilized in the Stern-Geary equation
to determine the corrosion current.
The electrochemical testing of corrosion with these film electrodes would thus
allow not only the determination of the corrosion current, but also enable abnormal-
corrosion sensing through indications of sudden variations in corrosion currents. The
periods of wetness when the metals are prone to maximum corrosion would also be
automatically recorded.
3.0 DEVELOPMENT OF FILM DEPOSITION TECHNIQUES
The development of prototype atmospheric corrosion sensors can be generalized as
fabrication of multiple thin f'dm structures over an insulating and chemically inert slab
acting as a substrate for the f'dm components. The substrate is an important part of the
sensor circuit and a base material which should not change during the life of the sensor.
Ideally the base of the sensor should be optically plane, non porous, and dust free surface
w

which can be packaged comfortably. However, actual properties of available substrates
do influence the performance and cost of the resultant sensors. A perfect substrate should
have:
. A perfectly smooth chemically homogenous surface to permit growth of thin,
defect free films.
, A temperature coefficient of expansion that is identical to that of the films
deposited so as to minimize peeling off due to mechanical stress in the films.
1
. High mechanical strength and thermal shock resistance to enable the substrate
to stand practical conditions and rigors of processing. This would make them
stronger and perfect to tolerate thermal warping or expansion.
4. Inertness to chemicals used in circuit processing and corrosion atmosphere.
5. High electrical resistance and low power dissipation factor.
6. Low cost.
7. Uniform physical properties and standard dimensions that suit the size of the
sensor.
Most commonly used substrate materials include various glasses, alumina, beryllia,
sapphire, boron nitride, silicon, and spinels. Silicon must be coated with a dielectric film
which is usually 5000/_ to 10,000/_ of thermally grown SiO2 or spin on glass. Both types
of glasses (alumino or borosilicate glasses) are next in good smoothness.
r
=
One can use dielectric film coatings over normal silicon substrates to achieve
chemical inertness and corrosion protection employing a planar process like diffusion or
4

L_
w
L
= i_
gettering of impurities, but it adds to its cost and inconvenience due to addition of more
number of process steps. For our experiments, with the first set of sensors called stage I
sensors, 1/4" thick glass slabs of l" x 1.5" size were used. Then we switched to the most
commonly used substrate material called sintered alumina because of its high thermal
conductivity, good resistance to chemical attack and good mechanical rigidity. These are
called stage II sensors. Details about these designs would be examined later. Alumina
being a ceramic substrate is usually composed of sintered granules, thus its surface finish
and porosity are not as good as those of glass or the single crystal Si substrates. Just to
enable one to achieve the required characteristics of the substrate we can use the following
methods (a) synthesis, (b) thin film epitaxy of suitable resistivity polysilicon, (c) oxides (d)
nitrides (e) carbides and (f) silicides. Since these are prepared by chemical vapor
deposition methods and involve more advanced process technologies in semiconductor
processing, we have selected pyrosynthesis as a process to get alumina. However, it may
in some cases be a preferentially deposited film over insulating subrstrate like glass or a
polyimide or a film deposited over a preferentially doped substrate, which is not under
direct control of the involved process when using chemical vapor deposition. In the case
of crystalline substrates like (100) silicon we may come across orientation dependence of
defects. Such effects can be used for processing of silicon embedded sensors, but are not
found very attractive from applications point of view. The variations in thermal
conductivity [R2] of various substrates are shown in figure 1.10 i ' '
CO_ER
-
N@,-
WI
"_ /,/- STEATITtr
GLASS /"CEI_I_MIC
GLASS _
0010 I ! ! ! IIO0 ZOO 300 400 500 tOO
TEMPERATURE: ('C)
FIGURE 1: Thermal conductivity of various substrate materials substrates.

w
In our experimentation and coatings of the film structures, it was not found
necessary to improve the surface finish or use costly glazed substrates. Figures 2 (i) and 2
(ii) show an Alpha -Step 200 (Tencor Profiler) stylus tracing of the substrate surface on
smooth and spotchy sides. These roughness were in the order of 5000 A for the smooth
face to about 10,000/_, for the spotchy face. Figure 2(iii) shows meaning of commonly
used definitions for the three component terms called the roughness, waviness and flatness
shown as (b), (c) and (d), and (a) the whole track. In order to compare these with our
samples, typical values of these parameters for standard substrates are shown in table I.
These tables have been obtained from typical values obtained as a result of great deal of
research and in the field of materials engineering.
r =
L
W
r--
--'----'4raa,_
M
E
m
TABLE I
Substrate Roughness and Flatness
Substrate Material Roughness Flatness
Soda-Lime Glass < 250A, 20 lam/cm
Coming Code 7059 Glass < 250 A 40 lam/cm
Polished Sapphire < 250 A < 1 0m/cm
Polished 99.94% Alumina = 250 A < 0.1 pam/cm
(ultrafine grain)
As Fired 99.5% Alumina = 10,000 ,,_ 50 lam/cm
(fine grain)
Glazed Alumina < 250 ,_ 50 lam/cm
We have used physical vapor deposition to achieve vacuum deposition, and
employed evaporation and sputtering processes in particular. Hence the coating materials,
which are metals for our sensors, are passed into a vapor transport phase by physical
mechanisms like Joule evaporation, sputtering and electron or ion bombardment. Since
many of the metals like A1 have a native oxide which frequently etch very slowly and
preferentially and can not be removed unless etched chemically selectively, giving a rough
etching surface, we have ignored AI-Cu or A1-Si alloys which can perhaps solve these
issues. One of the chief causes behind such decisions are to maintain chemical purity of
the corroding electrodes. In this report no attempt is made to give a complete discussion
of all the technologies but certain aspects would be highlighted that are of particular
: =
w

w
W
w
w
importance in sensor fabrication. For plasma deposition, a modified Reinberg [R3] design
of sputtering reactor, with outward radial flow type plasma system(from Ted Pella Inc.)
has been obtained and is in use. For inertness and safety consideration use of inert
perflouropolythelene pump fluids are the best choice and a similar fluid has been selected
for the vacuum system. No special film property measurement techniques were used. For
measuring stoichiometry Rutherford Backscattering, Auger Electron Spectroscopy could
be used to assess surface doping by corrosion. Hydrogen content can be evaluated by
infra-red spectroscopy and nuclear reaction analysis, whereas refractive index changes can
be measured by using ellipsometry and interference effects. These can be added to
estimate etch rate using stylus step height measurement. Interface stress can be measured
by induced curvature of substrate using optical reflection, leverage or X-ray measurement
methods. Adhesion of the electrode films can be measured by ramped pull to failure,
scribing and saw cutting techniques. Conformality can be detected using scanning
electron microscope whereas pinhole density can be made using the latter or by employing
a chemical or electrochemical etch mask followed by optical microscopy. For our
purposes stress is a film property which mainly effects our investigation and is currently
attracting much attention elsewhere.
The effects of stress are known to be dependent on the nature of the substrate, in
terms both of film nucleation effects and of mismatch of thermal expansion coefficients, as
well as deposition conditions. We have thus selected alumina as our high tensile stress
substrate enabling good film/substrate adhesion and needed to prevent film peeling. Glass
did not show such properties for all types of electrode films used.
R2. A.R. Glaser and G.E. Subak-Sharpe, "Integrated circuit Engineering," 2nd Edition,
Addison-Wesley Publishing Co., Reading, (1970), p.350.
R3. G. E. McGuire, "Semiconductor Materials and Process Technology Handbook",
Noyes Publications, New Jersey, (1988), p.364.
_I

o °
m,! i - "+: +.
,o_ ................._-..-_:.................................................++................... iOi,- ...... _.l+..,l:+...i.C+.+..l'...._ ...... , ......... ? ................ : ............. ,,. +i LJ
112, ,l ,+ I I.,I |. i_.:_ +_ ,h _ ,;;,"J;,;|,,_,
I _t • 4, ._: ._., t._.i _.: t, , ,_,,,! L' t+ • ,........
;. : : 'v ",* ':,," .,'
mr.................... .:.......................+.......................i..' ........ -;
Figure 2(i) A1203 substrate Tencor profile showing smooth substrate surface.
+
w
"I" ........... ".................................................. "................................... "]
tio _,+ +.,%. .,.+, . ._i fi'i, r_ :t i .r' '_ ._._,'L+, +
; _ • .++ _ !: L, +._. ,*"+'+++',. ,;,
++:
r
!I+o
h_: ;+" i .ni_!• . ,, .
:. . . . .
+_ 'P+" ; *+%"++ 'm i_+" "
,o, ,, •
+-----'--_
Imae
: +
IF_
W
D
W
Figure 2(ii) AI203 substrate Tencor profile showing spotchy substrate surface.
hl h2 S h3
(a)
hi SI
(b)p-x
(c)
/ (d)
FLATN ( SS
Figure 2(iii) Substrate surface finish. (a) Stylus tracing of surface; (b) roughness; (c) waviness;
(d) flatness.

w 3.1. EVAPORATION TECHNIQUES
Evaporation was conducted in a vacuum environment at a base (initial) pressure in
the range of 10 -6 to 10-5 Torr in an evaporator such as that shown in the figure 3.
w
w
VACUUM_._ \ \ / /_ _NSED DEPOSITvESSEL _'_ "_ _ g/ / ,_ MAY _ AS A GET'rEF
/
\ \ }1 _ THEEVAPOR_T
\r._s DESORBED FROI_I \ _/,/
INTERN AL _IJRFACtm_" \__, !//..'_"RATE INCREASES ASTHE SURFACES AREHE ATED
_ _ _vAPOR SOURCE
"-"-BAFFLE
GAS MAY BACKSTREAM
THE PUMPING SYSTEM
TO PUMPING SYSTEM
w
=
---.
w
:r •
.--o..W
Figure. 3: Schematic of an evaporator.
Large evaporant charges are held in a crucible heated by electron beam or by a
resistant heater in the form of a boat or a basket using Joule heating. Although from the
point of view of fdm purity resistance or Joule heating is not as ideal as electron beam
heating, but for all practical purposes it turns out to be all right. Since the evaporation
process is usually carded out at a sufficiently low pressure (typically in the range of 10 -6 to
10 .5 Torr) so that the evaporated atoms undergo an essentially collisionless "line-of-sight"
transport. They follow all solid angle relationships and are governed by vapor pressure
relationships.
= :
w
i
w
Ew
v
Fv
=
w
E J
w
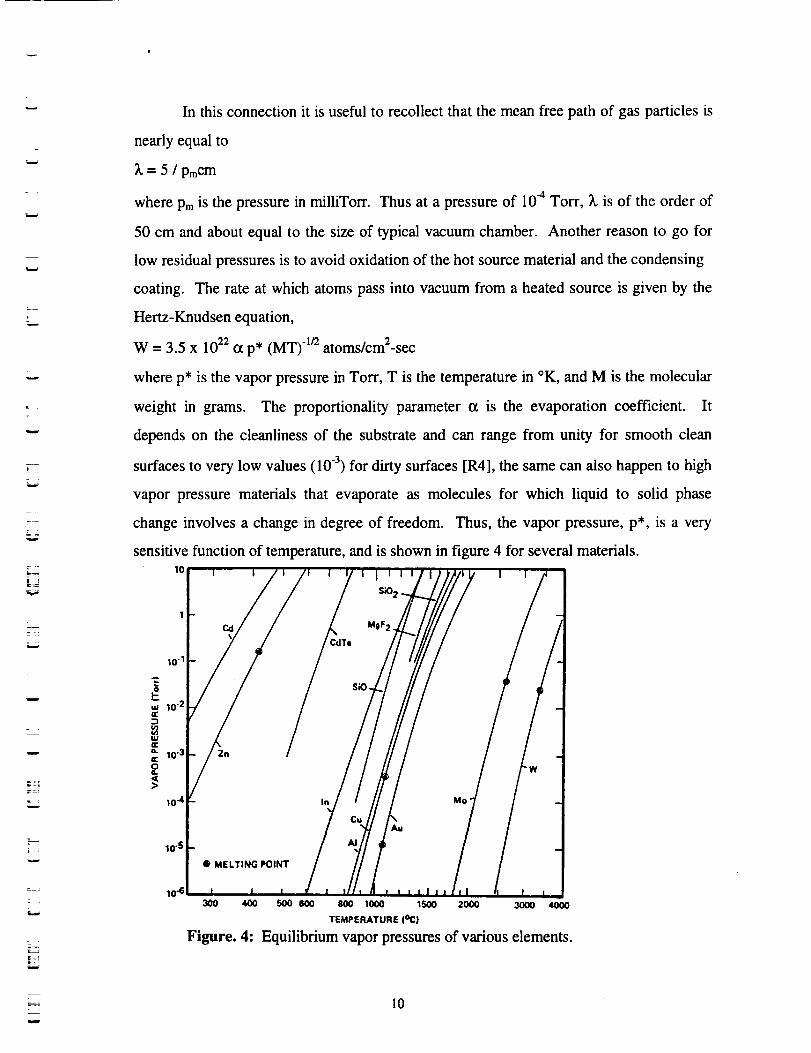
In this connection it is useful to recollect that the mean free path of gas particles is
nearly equal to
= 5 / pmcm
where Pm is the pressure in milliTorr. Thus at a pressure of 10-4 Torr, _, is of the order of
50 cm and about equal to the size of typical vacuum chamber. Another reason to go for
low residual pressures is to avoid oxidation of the hot source material and the condensing
coating. The rate at which atoms pass into vacuum from a heated source is given by the
Hertz-Knudsen equation,
W = 3.5 x 10²² (:t p* (MT) -1r2atoms/cm2-sec
where p* is the vapor pressure in Torr, T is the temperature in °K, and M is the molecular
weight in grams. The proportionality parameter o_ is the evaporation coefficient. It
depends on the cleanliness of the substrate and can range from unity for smooth clean
surfaces to very low values (10 3) for dirty surfaces [R4], the same can also happen to high
vapor pressure materials that evaporate as molecules for which liquid to solid phase
change involves a change in degree of freedom. Thus, the vapor pressure, p*, is a very
sensitive function of temperature, and is shown in figure 4 for several materials.10
w
: r
L.
10-5
10-63OO 4OO
Figure. 4:
5OO 6OO BOO I000 1500 2O00 3OOO 4OO0
TEMPERATURE I°C|
Equilibrium vapor pressures of various elements.
10

w
w
w
w
w
=
L
v
w
The table below shows temperatures for evaporating elements commonly used in
sensor related processing and from it we see that a source temperature of 1220°C is
required for AI to provide p* = 10-2 Torr. We assume that this temperature is used.
TABLE II
Temperatures for commonly used evaporating elements for sensor processing [R3]
Element Predominant Vapor Melting Temp(°C) TM Temp(°C)at 10- 2 Torr T T/TM
Aluminum AI 659 1220 1.61
Antimony Sb4, Sb2 630 530 0.89
Arsenic As4,As2 820 300 0.52
Beryllium Be 1283 1230 0.97
Cadmium Cd 321 265 0.91
Chromium Cr ~ 1990 1400 0.77
Copper Cu 1084 1260 1.13
Gallium Ga 30 1130 4.63
Germanium Ge 940 1400 1.38
Gold Au 1063 1400 1.24
Indium In 156 950 2.85
Lead Pb 328 715 1.64
Molybdenum Mo 2620 2530 0.97
Nickel Ni 1450 1530 1.07
Palladium Pd 1550 1460 0.95
Platinum Pt 1770 2100 1.16
Silicon Si 1410 1350 0.96
Silver Ag 961 1030 1.06
Tantalum Ta 3000 3060 1.02
Tellurim Te 450 375 0.90
Tin Sn 232 1250 3.02
Titanium Ti 1700 1750 1.03
Tungsten W 3380 3230 0.96Zinc Zn 420 345 0.89
Zirconium Zr 1850 2400 1.26
Two different types of evaporators were used, one was an NRC evaporator
model 720, in which the current of nearly 15A was required typically to evaporate Fe, and
10-12A was required to evaporate A1. The second metal evaporator was an e-beam
......................................................................................................
R4 R. Glang, "Handbook of Thin Film Technology", L.I. Maissel and R. Glang ed.,
McGraw-Hill, New York, p. 1-3 to 1-130.
11

= ,
w
w
w
w
L
evaporator called as AIRCO-Temescal Fast Cycle Coater model FC 1800 No. 150, and
was mainly used for evaporating A1. High purity evaporating materials, high deposition
rates and low residual vacuum was used to assure high purity deposits. Wire and metal
foil type sources were provided and a small source emitting from its surface type of
geometry was used in resistive evaporations. For the e-beam metal evaporators, extracting
voltage was about 10 kV and filament current approximately 150 mA, for a uniform
deposition. Sputtering mechanisms were also used for dislodging and ejecting noble metal
ions like Au etc. Sputtering apparatus used in the experimental work is now described
below.
3.2 SPUTTERING APPARATUS
Most often the source of ions for bombarding the target is from a glow discharge.
A simple apparatus using sputtering phenomenon is shown schematically in figure 5. It is
a gas filled diode with plane parallel cathode and anode. The cathode is the target and is
made of the material to be sputtered. The substrate upon which the f'llm is to be deposited
is placed on the anode. This assembly is enclosed in a bell jar that is filled with a rare gas,
usually Ar, at a pressure of 10 milliTorr, and a sufficient potential difference is established
between the cathode and the anode to cause the gas to breakdown, thereby creating a
glow discharge. The sputtering apparatus is usually operated in the so-called abnormal
glow region of the glow discharge, because in that region the entire cathode gets involved
and the number of ions is large and controllable. Diode sputtering system operates with a
dc potential between 1 to 5 KV and a current density of 1 to 10 mA/cm 2 . Electrodes are
spaced typically in the range of 1 to 12 cm and their diameters vary between 5 to 50 cm.
Deposition rate G is proportional to the ion current I and the sputtering yield S, and is
given by the relation,
G=CIS
where C is the constant of proportionality that characterizes the particular sputtering
apparatus. The table below shows sputtering yield for various materials under Ar ion
bombardment.
12

--i
r I
= :
Element
Au 600 2.80
Bi 500 6.64
Cd 500 7.20
Cr 600 1.3
Dy 500 0.88
Er 500 0.77
Eu 500 5.02
Gd 500 0.83
Hf 500 0.70
In 500 3.25
Ir 500 1.01
Fe 600 1.30
Mn 500 1.9
Nd 500 2.65
Os 600 0.95
Pb 500 4.81
Pd 600 2.40
Pr 500 2.40
Pt 600 1.60
Rb 500 9.20
Re 600 0.40
Rh 600 1.50
Sb 500 2.83
Se 500 3.35
Sn 500 1.20
W 600 5.07
Table HI
Sputtering yield of various species under Ar bombardment
Ion Energy (eV) Sputtering Yield
r
13

= =
w
- BELL JAR
I \\ I_......--CATHOOf-
J _ SHIELD
SLIBSTRATES-'_L._I " _ I
LEAD¼11HIGH-vOLTAGE"_ I t ] I I1 tl Ji"_ HEATER
SHIELD IH'III IIIII
HIGH I _ INLETVOLTAGE
TOvACUUM PUMP
_= !w
z z2
F_
[]
B
=
FF_
--4
I
t
Figure 5. Schematic of a diode sputtering apparatus.
In addition to the mass of the bombarding ion and its energy, the sputtering yield is
a function of gas pressure in the sputtering apparatus, because of the fact that many of the
ejected ions diffuse back to the cathode when the gas pressure is high. This is important
because the power available for sputtering is not unlimited and the only way to increase
the ion current without increasing the power is to increase the pressure. The experimental
upper limit is about 100 milli Torr with deposition rates of 100 to 500/?k/min, even with
materials such as tantalum which have low sputtering yield. A sputtering yield curve for
Cu sputtered by Ar is shown in Figure 6. For our usage a Hummer V from Technics
Corp. was used and it had a 3" donut shaped target with magnetic field assistance, giving
between 150 - 200/_/rain deposition rate. We have now obtained a Pelco SC5 unit with
automatic control, a film thickness monitor and high resolution to get an in house model
sputter coater, supplied by the electron microscopy supply center of Ted Pella, Inc. 4595,
Mountain Lakes Boulevard, Redding CA 96003. This is a high power unit and capable of
producing voltages in excess of 3000V DC at 85 mA. Thus, it would take lesser time in
comparison to Hummer V to deposit thick films. In construction, however it is similar to
Hummer V, but has a higher pumping speed and power available to be used during
sputtering. Right now the vacuum port is designed for a 1/2" I.D vacuum connection but
a high speed Edward's pump is attached via a heavy wall vacuum hose and provides
vacuum less than 10 .2 Torr, under usual operating conditions.
14

=
w
r ,
E
g9
?
_6_ 5
4
3
2
I
00
"BACK"OF SPUTTERING CURVE
I ] I I ] I I l5 _0 15 20 25 30 35 40
ION ENERGY (keY)
Figure 6: Sputtering yield for copper bombarded by argon ions.
3.3 DEPOSITION UNIFORMITY RESULTS
Experimentally we found that the uniformity of e-beam evaporated A1 was pretty good
and we could get repeated results as seen in figure 7 (i) below of runs of Al for 4900 -
5000 A, on glass but there was a bit of non uniformity due to pile up at the middle of the
electrodes in some samples as seen in figure 7(ii) below.
e.w,,.,.,_,,,.w,tl. ,,, _ t=1
i6 i __ __
¢ !r. _ !
oF ................ :.................... :..... :
-,L.......................:........................:........................!......................./
_0 _o f_W _dY--'-"_ _
Figure 7(i)
AI ,,.w,.,,,_',i,,,-,,,,,,_ .ix)"l "i l
f. _! .
"t- i!........................i
[ :. ...-- . : ,_I_ ...._...'.2._..........................................................................
,---' : . .. . : ;
0[,_ .......................... ,
J
t :i . ,-.................i
Figure 7(ii)
Sputtered Au-Pd (60/40) film on glass ranged between 450 to 600/_ thick but the
surface uniformity was difficult to determine, due may be to globule formation. Silver also
showed slightly non-uniform surface but about 400-500 A thick film was easily obtained.
Figure 8 shows the non-uniformity in a typical film. The evaporation method was not very
specifically designed for thickness uniformities required and no planetary type rotating
15

r .
L .r ,
=
"-d
= :
=
= :
w
target mounts were available, thus, four samples were placed symmetrically, spaced at
about 10-11 inches from the basket/boat of the physical vapor deposition system. Further
efforts are on the way to get more thickness uniformity from another Joule heated
evaporation system•
KFI0.8 i!
I:
o.,i i!......i";,o,
i:,,- .,, ;.q'd • a"d II
I'1 1
i-;. , i
I:'1 I...,
I" I I
I, '1 ' II • I .i
I." •:
. . i: "l:lI• "l I
!- I|'
..... _i
:1; .!
ih :,0 i. :.:, •:_:'•'q,, ,:;',, . . . d. , , . • ....• ...............
ij ................ :........................ !.:,l'_.',,,..... ,-,,,..,""_..,.,'' ',..........,.. "i
! I.
i i.i "',.,., ....... :,1 ..... ,'.... "ii " "',..i,:i.%..
i ; ":,",.,, .i, ii .,: Sl " I .I I ._
"ii•h" • • "!!
u ....i
• !
• ' [i: : : -,
--j
; : : : .,, "1
,!
: : "- : :1 .u
: . • • ]1.... ".................... :......................."..................i'5"g0 ................."""0"/_............. ::'"d........:.........."....................56"0..................... luu,.J
Figure 8: Silver PVD evaporate on glass substrate- stage I
3.4 RESULTS ON FABRICATION ASPECTS OF RESEARCH ON CORROSION
SENSORS.
We have developed so far two sets of corrosion sensors on two different substrate
materials- regular pyrex glass and sintered alumina. The first stage sensor utilizes only onev"
corroding metal film - aluminum. Gold/palladium ( sputter deposited on glass substrates )
and gold ( on alumina) films as well as silver films are deposited on these using suitably
cut masks for each element. The masks have been cut out of a very thin sheet of stainless
steel. They were suitably fixed on the substrates using adhesive tape. Aluminum fdm was
mainly evaporated in an electron beam vapor deposition system ( AIRCO - Temescal
coater model FC 1800 No. 150 ) , gold and silver was physical vapor deposited in a
Denton vacuum evaporator, and the gold/palladium film was sputter deposited. Their
thickness were measured later using a Tencor thickness gauge. The latter was also used
16

L_
w
le:::m
m
m
W
to check on the uniformity of the thin film deposits along its width. Readings were taken
at random in representative locations only. The uniformity was found within - 6% over
the whole surface.
Stage I Sensor: So far we have prepared two specimens each with the three thin f'dm (TF)
electrodes. These have been processed in different systems (on glass in one, and on
alumina in the other), and tested for uniformity and thickness and continuity, etc. These
electrodes were usually A1, Ag and Au. We are planning to evaluate their electrical
resistivity when a suitable test system becomes available. Electrical wiring has also been
accomplished using fine gauge copper wire and conductive silver paint-type glue.
Sta e II sensor: It has five TF electrodes, has three corrodible working electrodes,
aluminum Copper and iron. These are suitably located, one on either side of a centrally
located gold counter electrode film and adjoined by silver films at the far extremes, one
near each corrodible electrode, such that they can be used as reference for measuring the
potentials. Stage II sensors are also made on glass and alumina substrates, two for each
kind. Iron electrodes showed high resistivities and did not perform well in corrosion tests.
The width of the working electrode in this case(stage II) is reduced to half its value in the
stage I in order to facilitate the placement of all five elements on the same substrate. (see
Figures 9 and 10).
The thickness profiles of the thin film evaporation deposited representative samples of
stage II specimens on alumina substrate are shown in figure 11. These appear to show
fairly uniform thickness values with silver showing 810 ]k, 1250/_, iron showing 7300 A,
gold 10,450/_, and aluminum 11,400/_,. More experimental coating work is continuing
which will involve electroplating after sputter deposition of TF electrodes to achieve
higher aspect ratios and suitable miniaturization. This may also be done by electroless
plating if the substrates of commercially available polyimde films are chosen. Non
uniformity in alumina substrate has not been of much disadvantage as it does help in
increasing the surface area of the film. More work will be done with various NaC1
percentage and evaluate the highest demands on aspect ratio of such electrodes. Included
in the Appendix are photographs of the Stage I and Stage II microsensors, and research
team members and corrosion testing, fog testing and PELCO PC5 sputtering equipment.
17

= :L .
w
r .
J
. •
Mask Gold
=w
u
Mask For Sitver Etectrode
P
Mask Pot working Etectrode (At or Iron)
w
FIGURE 9: Sketch of Microsensor for corrosion monitoring with one working electrode
with individual masks as shown - Stage I.
18

w
|/'_ B -..-,.4
Iron Electrode _Gota Electrode/ rat Electrode
IVl! •
Mask ?or Sllver Electrode Mask ?or Iron Electrode
-7
w
L
Mask f'or At ELec±rode Mask For Gold Electrode
w
w
FIGURE 10: Microsensor with two working electrodes - Sketch of microsensor for
corrosion for corrosion monitoring - Stage II.
19

u
i
i
w
[ tl *'i I s'.,_, .r; _l ,' _; ,'l i ,, ;r_ I,. ;,_,l /!
I_ J L:|. ,I _ : i i t'1_:1 ,_:. Ji . I I :i'. ; 1 ,' _11 I. , I, .I- j" ":ll'l: /Iri| I d
_ _ I 1 I I • I I I II I: I Illl Ik _ i" I"I lal;_ I • i i L I l I • ". i i II I 4
_[ ii .: ! ! i !"; L-":."............ '9"...... :........................ "........................ "'""! ................. ".
Pu " _ ,.u,:,J ' z:_,u " ,,- "I.I,IR.I. • " "
• • :
L • i_ .,, . J
2 _- ................... ?"" _l;a 1 lel"_l" "" _ _.+ t.':" "_f _'1".1"# "' _' "%:JiJ _-_',i "_ %_" "'.' .......... -4
I- ¢.: .... ,..," lUl;_._. ...... t'_..T ...................................... _ ..1__.
:,'-_\_ ";i !; " " " .:• _....... ;.....,;..,....:...: ........................ :........................ _............ :..........
_:" _ : i ! ! "_L ................... _...:........................ :........................ _............ !.......... J
t_ _11 il:d"i ,{ .d'i ill.,; i..i!: fl :i
' I!J :lJ.... ;I" :I"; ;l-_'lJ'!Jl _'_'L! ._
....... _ " o . .
;.......; "; _. i..:'.] .......... : ........................ ; ..................... ;..: ..................... _..._
.L ........... i .... : .......... :.; .................... ._
w
z=
w
-i _-. _-_,,-e_,,,_J _ .%$ (]_) .
. L r_...................... _ .......... • ..--,.....:....._ _.._e.....'L.;._ .................... __
.ll_ ._,,, I't i h il. JU. iJi,,a, tL:l_ =i,_ .:!)*!',, .. _,_!I,'_J.,',,! _:"'il .f i:' ':,_ _,._I_ ), .
'_ 3,I_'" "_ll'I_l '_" II :;,J" ',¢ _ L_t'_._':;I#{, _,
"_; ;; _- • -;; -. :;; ;'- -; _-_o _ ..................... . ....................... ;.,o ......................... . ...............
•"'-*_ _" ._ _ : ;" ":i _
:1
__,LI. |o • m|- • m
=
w
._- ........ , ....................................................... !........ _....................... -_
f _ __.f rli . :.
,L :_ I i rl I",i , .P_ i'_ _ _ -_.t I_, _ ._ ,'lrl.I Iri.lib_ _,', il I _, 11 : . I_ •
o ii : i_l_,-r i •,," "i. ' ..... :] "_.......M ,",,_ (_,.,,.,, ,,_,,. - ., • ,;j:,l- t,r:'l ;rr'J '°11_,_r,... r:;', ,'
, _........,,,.... _ ............................. -. ............... • ......... :............ _._..,._.--
it" : " ! _ ; ; U L_
t _ : : : : ._
I
FIGU1_ 11: Thickness profile Tencor readings of representative sample of stage 1]
microsensor.
r
w
2OORIGINAL PAGE IS
OF POOR QUALITY

4.0 CORROSION TESTING
L
Corrosion testing of sensor assemblies is usually accomplished through
electrochemical test procedures. The corrosion rate is determined using linear
polarization, while total corrosion losses are obtained from increase in resistance of a
resistance probe that is allowed to corrode in the same environment. In our program we
have used linear polarization technique to obtain corrosion rates of the corrodible metal in
the sensor assemblies made.
--=
E
w
w
w
Two types of sensor assemblies have been made and tested. These are the Stage I
three metal thin film assemblies on glass and alumina substrates. Particularly the A1 thin
f'tim (AI-TF) has been tested in the assemblies Ag-AI-Au on both the glass and alumina
substrates. The testing has been both under immersion in various electrolytes as well as in
a fog chamber wherein a fog has been created using tap water. In the latter the testing has
been under wet-dry cyclic conditions. Within the limited time available for testing, exterior
exposures and evaluations of real atmospheric corrosion could not be carried out so far.
Besides the three metal assemblies, the Stage II five f'dm assemblies with two
corrodible working metals have also been tested. Of these, testing has been accomplished
on the Ag-AI-Au-Cu-Ag assembly on A1 and Cu thin films individually in the three
member assembly mode, such as Ag-A1-Au and Au-Cu-Ag, as well as in the A1-Cu
coupled mode, i.e. in the Ag-AI/Cu-Au mode. As on the three electrode assemblies, the
testing has been under immersion in various electrolytes as well as in the fog chamber
under a fog created with tap water. In the latter, the five-electrode assembly has been
tested under wet-dry cyclic conditions.
During the actual exterior exposure, corrosion occurs by the condensation of
moisture from the atmosphere at high humidity levels and this condition is approximated
by the wetting half of the fog test cycle. In the exterior, not only the condensation does
not occur at low enough humidities (say at <50% RH) and elevated temperatures (say
21

i
L ....
w
above 20-25 deg.C), as prevalent during the day time, the already condensed moisture
evaporates, leading to drying. The drying may be complete on bold, sun-hit surfaces if the
temperature is high enough, but the surface may not dry totally in sheltered locations.
Corrosion would be continuous in such places where the electrolyte film or wet condition
is always maintained.
Some places on structures continuously maintain pools of water and in these cases
corrosion would resemble continuous immersion conditions. Exactly how much
evaporation of already condensed moisture fdm occurs at various locations is not well
defined. Such data is needed to gauge the extent of corrosion.
w
w
Corrosion rates under various kinds of exposures are needed in order to judge the
extent of corrosion. Corrosion builds up corrosion product films or layers which would
continuously alter the corrosion rates. The nature of the corrosion product formed, its
porosity and electrolyte or ion permittivity, its stability and transformation characteristics,
etc. all have a bearing on the continuous corrosion process and its rate. Macropassivation
is possible in some instances where the corrosion product layer forms a compact adherent
protective mass on the surface. Such is the case when amorphous corrosion products
form on alloy steel surfaces. On the contrary iron sulfide formed on steels is porous;
likewise the corrosion products formed on copper in chloride environments are porous.
However, the regular passive film on stainless steels is dense and protective of the metal.
In such cases, the degradation of the passive f'dm by depassivation processes would be of
interest. On aluminum, however, the film that forms could assume different
characteristics. The nature of the films formed on aluminum alloys under chloride-
containing marine type atmospheres would be of interest in atmospheric corrosion studies.
r
m
w
The wetting and drying characteristics of various metal surfaces, especially under
prevalent conditions of debris accumulation and/or corrosion product formation, are not
well defined. Some of the corrosion products are hygroscopic and do not dry at all,
especially in sheltered locations. The drying is at best on the surface of the corrosion
w
22

:j
product layer, whereas the interior of the layers at the metal-corrosion product interface
would stay wet. The corrosion would continue.
u
=
The drying time introduces re-formations of some of the crystalline corrosion
products that are porous. For example, on iron and steels ct-FeOOH crystals start forming
through the amorphous rust dissolution and recrystallization from the solution. The
formed crystals are uniquely whiskered or are of the sheet type with lots of pores in
between them. Such structures are not protective of steel.
E
w
E •
L
L
However, the pores formed in the corrosion product layer can be plugged by
precipitates of other kinds, say from selected precipitation-type inhibitors. For example, it
is well known that phosphates and benzoates precipitate and plug the harmful pores. The
chemical conversion-type compounds should all be helpful. So if a chemical conversion
coating is applied, it should provide some benefits.
In prior sensor evaluations, these aspects of the problem have not been considered.
Any corrosion evaluations in the exterior involving corrodible sensor elements should be
able to explain the above raised points. Previous studies with the sensors have been to
determine the corrosivity of the atmospheres qualitatively. Quantitative evaluation of the
corrosivity of the atmosphere would obviously require an understanding and precise
determination of the extent of corrosion under corrosion product films. No attempts have
been made in the past to determine the corrosion rate of the actual metal in the member
experiencing atmospheric corrosion.
E The following points need to be clarified in the corrosion testing with the sensors:
w
-__L
1. How thin the condensate moisture film can be in order to carry current and
cause meaningful corrosion?
2. How is the corrosion rate affected by the thickness of the condensate film on
the sensor complex?
23

w
3. How does condensation and evaporation occur in the exterior and how these
would affect the corrosion rate?
4. What are the effects of corrosion product formation on the water retention and
corrosion rate?
5. What are the effects of phase transformations in the corrosion products?
6. How can the results from different sensors be made to unify and yield the same
corrosion data?
7. How can the results from resistance probes be made truly reflective of the
actual total cumulative corrosion damage of a given metal in a structural
member?
These are some of the questions that are being raised today. In addition the
available sensors do not fulfill all the functions. For example, they do not define the actual
corrosion potential of a metal in exterior exposure, nor its actual corrosion rate.
L-
w
With the above in mind, we have chosen to study the corrosion characteristics of
actual structural metals in sensor assemblies. To be able to measure the true corrosion
potential, one should be able to include a reference electrode in the sensor complex itself.
Though we have not accomplished this feat yet, it is one of our goals to evolve a thin film
reference electrode to read the corrosion potential of the corroding member. Our goal
includes also the determination of the actual corrosion rate as well as the actual cumulative
corrosion loss at any location in an actual structural member experiencing atmospheric
corrosion. Our corrosion testing to date addresses some of the issues raised above.
W
4.1 CORROSION TESTS PERFORMED
L_
In the testing of atmospheric corrosion sensors, actual exterior exposure is very
vital. However, prior to actual exterior utilization, the exterior exposure conditions can be
simulated in the laboratory in accelerated tests and the sensor behavior tested. One such
test is the exposure to cyclic fog in a fog chamber. We have carried out the cyclic fog
E_w
24

LE
W
r
w
L-
testing in one hour full cycles, with 30 minutes for the wetting fog accumulation part and
the other 30 minutes for the drying part, accomplished by blowing warm air with a hot air
blower through a port. The fog is created continuously during the 30 minute wetting part
of the cycle by atomizing the selected solution with compressed air at 15 psig pressure. In
our program to date we have used only tap water as the source for the fog and performed
the tests at room temperature in the fog chamber, that is not utilizing any heating of the
environment in the chamber.
In the limited time available, we could handle only the AI and Cu thin films.
Initially we immersion tested the A1 thin t'tim in the Stage I sensor samples made by using
the three electrode configuration, AI-TF for the working electrode, Au-TF for the counter
electrode, and an external calomel electrode; the Ag-TF was used sparingly, only to get a
bearing on the corrosion potential with it and its shift from the actual value, measured with
the standard calomel electrode.
The testing was started by studying the basic linear polarization of bulk metal
samples under immersion. Four electrolytes were generally used in immersion testing.
These were: distilled water, tap water, 0.1% NaCI solution in distilled water, and 3.5%
NaC1 solution in distilled water. The specimens were kept immersed in the solution for at
least 30 minutes prior to the start of the tests. Linear polarization testing was carried out
thereafter. First the corrosion potential was determined by manually adjusting the
potential setting (E)on the potentiostat such that the current (I) moved to zero. Then the
base potential was fixed at 30 mV below this value and anodic polarization scan was made
with a scan rate of either lmV/sec or 0.5mV/sec. Both gave nearly similar results and
good scans. The scans were made two separate times. The first time the current was
measured and plotted on a linear scale, i.e. it gave rise to the E vs. I plot. The second time
the current measured was plotted on a log scale which resulted in the E vs. log I plot.
From the former, the corrosion potential E¢o, and the polarization resistance Rp (=dE/dI)
could be obtained. The latter is multiplied usually by the area of the electrode involved so
that it will be given in f_cm 2 units. The polarization resistance with this unit is denoted as
25w

_?
w
i
Rp*. The E vs. log I plot gives rise to the two Tafel slopes, I_a and I]c, as well as the
corrosion potential and the Tafel lines-extrapolated corrosion current. Dividing the
current with the area of the electrode, the I _orr in laAcm -2 units is obtained. From the two
Tafel slopes 13a and 13c and the polarization resistance Rp*, the corrosion current density is
again obtained by using the Stern-Geary equation:
I _or_= [ _a. 13c / 2.303( 13a + I_c)]/Rp* = B/Rp*
The Tafel slopes are given in mV per decade change in current on the linear part of the
respective curves. E ¢or_is given in mV(SCE) when standard calomel electrode is used. In
other cases it is given in mV against the standard used. Since we have not made the Ag-
TF into reference electrode yet, when we used it in the tests, it gave a pseudo-potential of
the working electrode, using which its variation as a function of exposure and corrosion
could be defined.
A junction box with five terminal inputs and three terminal outputs was made in
our electronic shop to which the three electrode or the five electrode sensor complex thin
film electrodes could be connected. The outgoing leads from the box were connected to
the three terminals of the potentiostat - that is to the working, counter and reference
electrode terminals. The five inputs to the box were in the sequence Ref.I(Ag-TF)-
Wl(AI-TF)-Counter(Au-TF)-W2(Cu-TF)-Ref.2(Ag-TF). When the three electrode
specimens were under test, only the first three input terminals were used. Suitable switches
enabled operation of either set alone, in which case the corrosion characteristics of the AI-
TF or Cu-TF were individually tested, although they were on the five electrode sensor
complex. The two working electrodes could be shunted together and studied against Au-
TF as counter electrode. This is the way we have carried out the experiments so far.
However, they could be connected to the potentiostat so that one of them is used as the
counter electrode and the other the working electrode, although in our design of the five
electrode sensor complex the Au-TF is in the middle of the two and has to be ignored.
This has not been attempted so far.
26

= :
=
In immersion testing the specimens were rinsed with distilled water after the tests,
dried with a blower with warm air and stored in a desiccator. They were tested a few days
later in similar configuration in similar solution to determine the sensor's aging
characteristics due to corrosion.
w
L
L
z"-"
Testing in the fog chamber was carried out in cyclic mode as already explained. A
small hole was drilled through the chamber wall and the wiring leads could be taken out of
this hole for connection to the junction box. The potentiostat was stationed near the fog
chamber while carrying out these tests. One hour total cycle time was found to be
optimum, of which 30 minute was in the fog wetting part and the remaining 30 minutes in
the drying part. In the future when automatic data accumulation with the computer or
with a data logger would be feasible, the cycle time would be attempted to be reduced to
1/2 hour each, with 15 minute for fogging and 15 minute for drying. Such cycles have
been utilized in all of our previous studies, and the corrosion data obtained on steel
samples have been found to yield approximately similar data as in exterior exposures. This
means that each 1/2 hour cycle data corresponds to 1 day actual exposure to nearly 100%
humidity conditions as prevalent in Louisiana and in coastal areas. The specimens were
cleaned, dried and stored in the desiccator after each test.
4.2 TIME OF WETNESS AND VARIATION IN WETNESS
Wet-dry cyclic fog testing wets the specimen over a given period of time and the
moisture film condenses on the sensor surface and builds up in thickness and form. The
current would increase gradually and the current increase is reflective of the moisture film
formation and growth kinetics. Likewise, during the drying period the film evaporates
steadily and leaves the surface. How much evaporation occurs and the kinetics of
evaporation can be studied by following the current decay. These are accomplished by
using the sensor as a current monitor. Fixing the working electrode at a specific potential,
say at a cathodic potential such that it won't undergo corrosion while the current flows,
the current build-up during the wetting, fogging period and its decay during the drying
27

r_
L==i
W
L :
-: !
part of the cycle can be followed. This has been done in our fog testing program with the
AI-TF electrode in the three electrode sensor, as well as by using a spent (i.e. working
electrode corroded off) -sensor complex, but using only the Ag-Au-Ag in the five
electrode complex for the purpose of tracking the current. A typical current build-up and
decay record is given in Figure 12. As can be seen from the figure, the current rises nearly
exponentially upto a certain intermediate level, then jumps up sharply to the peak value
and stays at this value till the drying part of the cycle starts. At the start of drying the
current drops sharply to the intermediate value and then decays exponentially to the base
value. Oscillations that occur at the end of the drying cycle indicate extreme instability of
the wet film and its step-wise removal from the surface. More work needs to be carried
out further on this aspect of electrolyte film formation and its evaporation.
Only two electrolytes are planned to be used in the fog chamber - the tap water
and the 0.1% NaC1 solution in tap water. Experiments with the former have been
conducted in this fiscal year. Future experiments will utilize also the latter electrolyte.
4.3 FOG TESTS
Fog tests have been conducted on the Ag-AI-Au Stage I sensor complex as well as
on the Stage II Ag-A1-Au-Cu-Ag complex. In the latter the testing has yielded individual
corrosion data for the A1 and Cu TFs as well as the data for the AI/Cu couple against the
Au counter electrode. The individual corrosion potentials as well as the potential of the
couple against Au were determined in selected cycles. The polarization was carried out as
explained before using the Ag-TF as the reference electrode. Thus a pseudo-corrosion-
potential is determined in the fog chamber. After the Ag-TF is converted to a suitable
reference electrode, the actual corrosion potentials against Ag reference electrode would
be determined. In all cases polarization runs were started in the wetting part of the cycle
after considerable initial time having been allowed for stabilization of the electrolyte film.
In the 30 minute fogging period this was after about 15 minutes after the start of fogging.
7
w
28

L
Figure 12 shows the current steadying after about 15 minutes during wetting by fogging.
The tests were conducted and finished prior to the start of the drying half cycle.
w
As stated already, tests were carried out in 1 hour cycles of fogging and drying,
each occupying 30 minute portion of each cycle. A controller was set suitably to
accomplish this. During the fogging part of the cycle the controller automatically opened
a solenoid _,alve and allowed compressed air at 15 psig to flow through the port for
atomizing purposes. During the drying part of the cycle the solenoid valve shut closed and
the drying blower came up. Warm air was blown during the drying half of the cycle. The
wetting and drying repeat themselves for a preset number of cycles. In our current test
program, we have tested only upto 50 cycles over a two day period and polarization data
have been collected manually in approximately five cycle intervals. The variations of the
electrochemical corrosion parameters such as corrosion potential, corrosion current and
the polarization resistance as a function of exposure could be obtained.
4.4 RESULTS AND DISCUSSION
Results of immersion tests with thick specimens of an Al-alloy, and two different
steels ASTM A 36 and A 588, and electronic copper are given in Table IV. The data are
used to orient the tests. In the future, bulk specimens are planned to be tested in the
atmospheric corrosion test program with the sensors and the preliminary results obtained
here would be helpful.
Immersion test results for the AI-TF in the Ag-A1-Au sensor assemblies on glass
and alumina substrates are given in Table V. In 3.5% NaCI solution, the corrosion
potential shifted to a more negative value when tested for the third time after 8 days and
the polarization resistance was also found to be low. The corrosion current had increased
drastically. These results point to the inability of the A1-TF to retain its passive film on the
surface and corrosion in the sea water equivalent 3.5% NaCI solution would be severe.
Huge pits were noticed on the specimen surface and the whole micron-thick film corroded
29

Figure
30

T
w
Table 1V
Electrochemical data from immersion test on thick metals
No. Metal Electrolyte F,corr(mV) Rp* ( f2 .era
(SCE)
) Icorr (rt A/cm _)
Interpold. Calcd.
L
L •
L_
1 M-plate
2 A-36 steel
plate
3 A-588 steel
4 Electronic
copper
3.5% NaCI -731 7020
3.5% NaC1 -652 752
3.5% NaCI -688 1439
0.05% NaCI -650 4073
tap water -657 6464
3.5% NaC1 -222 5250
0.1% NaCI -63 104500
0.44 0.56
2.90 4.27
4.16 5.37
1.15 1.39
0.73 0.96
1.13 1.01
0.271 0.033
v -
W
V_2
L_
_d
31

F.=
,!
z
W
w
off soon. High corrosion rates also are indicated in 0.1% NaC1 solution. The latter
resembles approximately the electrolyte condensates in the coastal areas, that is in marine
atmospheres. On the contrary the corrosion potential is higher in tap water, about 400
mV higher, and the corrosion rate is smaller, nearly by an order of magnitude. The
potential is still higher, about 100 mV more, in distilled water than in tap water and the
corrosion current is smaller by yet another order of magnitude. Figure 13 indicates the
linear and log polarization plots of the AI-TF electrode in distilled water. These results are
all explicable from the conductivity of the electrolytes and the passivation and
depassivation characteristics of AI-TF in the tested electrolytes. Chloride-containing
solutions would lead to depassive attack on the AI f'drn and initiate pitting. These are
verified.
Table VI summarizes the results from the AI-TF in the Ag-A1-Au Stage I sensor on
alumina substrate in the fog test with tap water fog. Typical linear and log polarization
plots from the 15th cycle are given in Figure 14. During these tests the specimen surface
stayed wet considerably longer and drying was much less effective as ambient air was
being used for drying. Data in Table VI shows that the corrosion potential increased
slowly at the beginning, from about -535 mV to about -500 mV, for about 30 cycles, then
suddenly increased in the 31st cycle to about -375 mV and increased once again to -37
mV by the 50th cycle. The polarization resistance seems to rise moderately till about the
31st cycle and increase sharply when the potential increased. The corrosion current seems
to decrease steadily by a factor of four.
The rise in corrosion potential, the increase in the polarization resistance and the
accompanying drop in corrosion current are all indicative of the Al-TF attaining more and
more passivation. The sudden jump of corrosion potential on the 31 st cycle is indicative of
such an onset of passivation. There is a small drop in corrosion current associated with
this phenomenon.
w
32

z _:=
W
=
w
=:
w
0
I=o4-
GJ
C
-I--
o
,L,+(,,j
dl_ 0(,-uc
o,I
+2e-
start:
-180 mV
for linea
-150 mV
for log
!I-
t :
-4- l--
=I-_-
T12
4--t--
e ¢
-4 ;,-4 ;
!!-
ib
44-
c. :
- j,_
!-i
.._:
_q
14T-f,- -i-
iJi
FII
:" Potential, mV(SCE) _nch = 10 mY)
Figure|}: Linear and log polarization diagrams of AI-TFin distilled water.
Linear: starting potl.= -180 mV; scan rate =0.5 mV/s
X-axis: 1 inch = 10 mV; Y-axis: 1 inch = O.I_A.[og.: starting potl. = -150 mV; scan rate = 0.5 mV/s
X-axis: I inch = 10 mV; Y-axis: 0.1WA at 2 inch,also 2 ir I decade I rise.
33

w
w
L
+o.sVa +
I=0
start:-560 mV
for both plo_.+,
-56
Figure 14: Linear and log polarization diagrams for AI-TFin fog test with tap water.cycle # 15, wetting part
• linear: starting potl. : -560 mV (Ag-TF ref.)
X-axis: I inch : i0 mV; Y-axis: i inch : O.5/_A.log.: starting potl. = -560 mV (Ag-TF ref.)X-axis: I inch : I0 mV; Y-axis: O.I/_A at 2 inch
also 2 inch : I decade I rise.
F
m
34

Table _
Electrochemical data from immersion test of A1 thin film in Stage I Ag-AI-Au sensor
w
r
Test period Substrate Electrolyte Ecorr(mV) RO* Icorr ( la A/cm z)
(SCE) (fL cm 2 ) Interpold. Calcd.
w
first glass 3.5% NaCI -626 8580 0.63 0.59
atier 1 day glass 3.5% NaCI -618 4080 0.51 0.52
atter 8 days glass 3.5% NaC1 -742 96 4.14 12
first alumina 3.5% NaCI -633 224 6 19.5
first alumina 0.1% NaCI -611 270 10.4 12.4
first alumina tap water -227 1750 1.28 3.53
after 2 days alumina tap water -427 1540 1.55 2.75
first alumina distilled - 125 216000 0.12 0.02
water
L
w
w
Table'Z:
Electrochemical parameters for AI thin film corrosion in Fog test with tap water fog
L
w
Cycle E _ (mV) P'v* (f_ .cm 2 ) I _ (_tA/cm 2) I _ (gAJcm 2)
Number (against Ag-'IT) (x 104) (interpolated) (calculated)
3 -535 2 ....
4 (wet) -267 0.15 ....
4 (dry) -534 0.14 0.04 3.4615 -501 0.16 0.04 3.49
20 -508 0.36 0.02 1.2
25 -5 I4 0.29 0.03 1.35
31 -502 & -373 0.43 0.01 1.3
41 -375 1.53 0.02 0.98
46 -370 1.48 0.02 0.84
50 -37 1.53 0.016 0.92
35

L
K.d
T "
Table VII gives the results from immersion testing of the Ag-A1-Au-Cu-Ag sensor
assembly. It can be noted that generally the Cu-TF shows more corrosion current than the
A1-TF in the complex under similar test conditions. This is obvious from the results of
these electrodes tested with distilled water and 3.5% NaCI solution. The results can be
interpreted as due to passivation of AI-TF, whereas the Cu-TF does not get passivated.
Data for the A1-TF in the tap water indicates that the corrosion potential increases as the
film corrodes, the polarization resistance should correspondingly increase (results of the
third test after 10 days seem to confirm this), and the corrosion current drops. Ignoring
the results of test after 14 days, the potential of the Cu-TF remains nearly the same, its
polarization resistance seems to double and the calculated corrosion current density seems
to decrease. However the currents can be assumed to remain nearly the same from the
results of the second and third tests on the 7th and the 10th days.
In the 0.1% NaCI solution, corrosion potential of the A1-TF is found to rise, with
an accompanying increase of polarization resistance and reduction in the corrosion current
density. These are indicative of the passivation taking place on the film. Apparently, the
film tested in the latter solution also acquires passivation, so long as it is not kept
immersed in the solution for long periods of time. The data from Cu-TF in tests with this
solution seems to show slight variations indicating probably the lack of passivation in the
Cu-TF in the 0.1% NaCI solution. Uniform corrosion can be inferred for the Cu-TF in this
electrolyte as well as in tap water.
Considering the behavior of the AI/Cu TF couple tested against the Au-TF counter
electrode, it can be observed that the corrosion potential obtained is generally in between
the values of the two individual metal films. Also the value is closer to the higher potential
of the two. Only in two cases are the values of the potential of the couple outside of the
range between the two individual potentials and locate slightly below the lower potential
value. For example, in the case of the test with the 0.1% NaCI solution the third test
conducted on the 16th day showed a potential of -62 mV for A1-TF, -115 mV for the Cu-
TF, but a value of - 125 mV for the mixed electrode AI/Cu. Similar result is also for the
36

=
w
L ,
i
w
[-:Z
ii__o
[ -
r_
0U
1,1_
I
I,
(UQ_
0(__
E
r--
(DE0_-
0G_
I U
E ,--
v
U XaJ
U 0,.--4
r-, X
ILl
_._ Of)
O_U
m,_ v
u
O -I.-_U X
E _
•t_ : • O
e-_ Xv v
UEt._ v
T -dE u
U
0._-_U X
_-_
Euo
, ,--4Xv
v
l,l
O_
ILl
0
0_-- __
cO (',d 0CO ."-- _l) C_ _--
r-.. r'-- _O
O_ O_ O_ u_ {'00 _-_ 0 ,14
O0 _0Od ,_-•-4 ,--_ O,J 0
_l 4 _l_ _
,-,J _,-.: _ _ c_
O0 0,.,I fO f_,l _ ,--_ ,-'_ OdI I I I I I I I I
t_e1) ,--4 (%J L.r)
0 _",J _
0 CO0 r_.,_- ,--14 L/1) l---.
(-,-)
o') ,-q ¢'0 ,'-.-
c_ _cJ
c,u co .(_ ¢o co _oc_J r_
OU_ '_"
I I I I I I I I I
.L'%l _::_ tO {")
,-_ ,--_ C_ 0
c_ c_dc_
_ID _ ,-l_0 00 0 _l_O0
c_ cJ cJc_c_
,lO r_ O_ 0('0 I_. O0 •ll_
CO
_ ,-.._ ,--_ fOI I I I I
,._ _J ,'el ecl ,'0
v-.l e.-ll
3?
O0 0
0 O0 0
d c_d d
CO
I I I I
_-._ m-1 o'--_ rll-
OZ O_Z
a_
or14..JtO
o_
o_
I:Z0
or---
0
r--
Z
(Ur--4_
"_D
4J
_.rl.
e'_ e-_ O
"_ OIll m
4"_
_ |1
"Z,--
,-,_4,0
.I-_
O
12)
ILl

E
r .
F
w
m _
r .r
E.
Wi
m
3.5% NaC1 solution, but here only one data point was recorded. The non-passivating Cu-
TF seems to control the corrosion characteristics of the couple in the tap water and 0.1%
NaC1 solution, for in these all the corrosion parameters are found to remain nearly steady.
It can be noted that the current densities given for the couple have been derived by
dividing the actual corrosion currents by the total area of the two thin films in the couple,
that is by the total area obtained by adding the areas of the AI and Cu TFs in the coupled
mode. If, however, only the area of the Cu-TF is used, since it corrodes with a higher
current density than the A1-TF, the value would be nearly doubled and come closer to the
values of Cu-TF. Thus it appears that in the AI/Cu couple it is the Cu-TF that corrodes.
This needs to be verified by testing the two in galvanic couple mode further, that is by
taking A1-TF as the counter electrode and the Cu-TF as the working electrode.
Figure 15 carries the polarization plots of some of the AI-TF, Cu-TF and the A1/Cu
combined couple against the Au-TF counter electrode in the first test in tap water
conducted. These plots are given for illustration purpose only.
Finally, Table VIII contains the results obtained with the 5-electrode sensor in the
fog test. In these tests, the conditions of wet-dry cycling were slightly altered such that
better drying was obtained this time as compared to the previous test with the A1-TF in the
3-electrode assembly. The corrosion potential of the AI-TF seems to increase only
slightly, from about -143 mV to about -86 mV. (The potential is the pseudo-potential
measured against the Ag-TF on the sensor assembly). The polarization resistance seems to
decrease with a slight increase in corrosion current. Results appear to be varying and the
above conclusions need to be treated as tentative.
On the contrary, the potential of the Cu-TF seems to remain nearly steady. There
seems to be a decrease in the polarization resistance, but the corrosion current seems to
oscillate around a mean value. The calculated value of the corrosion current density is
high as in the case of immersion. Considering the unsteady behavior, it can be inferred
that the Cu-TF is undergoing uniform corrosion without passivation.
38

w
w
i
L
I:
,j.
-190 -180 -170
Potential, mV(SCE)
Figure#_ : Linear and log polarization plots for AI-TF on theStage II five electrode sensor in immersion testingin tap water. First test. External calomel ref. electrodeAu-TF counter electrode
Linear: X-axis: I inch : I0 mV (SCE); Starting potl. =-200 mV
Log.: 2 inch = 1 decade rise in I; 0.1_A at 2 inch location.starting potl. : -200 mV.
Y-axis(linear): 1 inch = 0.1_A.
w
39

L
E .
W
w
_J
i
=
;j
L_
[]
L_
P
£)_
o
!.---
!
t--
&o
t--
-r--
E
e-
U0
E
o,_-._ X
O,J_= .--.
• 0
x"11 v v
_ d
I-
u Ex
_ 0
• Xe-_ v
,m v
%_-._ (._
f,,-IOEE
,_ .l.ax
v_
_J
.,-d_.. x
r_" vv
l.a_I--I
L
o_u E
w v
oz _o
4O
oo_ o
iiiiili1|1
__0__
00000_00_
Ii11;1111_1
___0_00_00_0_0_
__0_00
IIIIIIIlll

=
w
E
F
w
As in immersion the corrosion potential of the couple seems to remain nearly stable
around -100 mV. However, the potential in several instances is higher than the potential of
the metal with the higher potential. In cycle # 21, the potential of the couple is -86 mV,
which is higher than the potential of AI-TF, -99 mV, in cycle # 29, it is -92 mV, higher
than -96 mV of Cu-TF, in the 50th cycle it is -92 mV, higher than the -97 mV value of
Cu-TF, etc. The corrosion potential of the couple is also lower in one instance than the
lowest potential of the two members in the couple. This is in cycle # 10 when the potential
of the couple is -102 mV, below the lower potential of -90 mV of Cu-TF. Overall it is
seen that the corrosion potential of the couple follows that of the higher potential metal
or the one which shows higher corrosion rates, in this case the Cu-TF.
Overall it can be stated that the results obtained to date indicate the following:
1. A1-TF protects itself by passivating in milder electrolytes. It corrodes in
chloride-containing electrolytes and condensates.
2. Compared to AI-TF, the Cu-TF corrodes more uniformly and does not
passivate in electrolytes that would appear in the atmosphere. So copper is a
much better sensor element.
3. Cu-TF corrodes more than the AI-TF in similar environments.
4. When combined together and tested against the Au-TF counter electrode, the
behavior of the couple is dictated by the Cu-TF electrode that corrodes more,
although its potential is higher than that of the AI-TF electrode. The net
corrosion current seems to follow that of the higher corrosion rate of Cu-TF.
The A1-TF would seem to corrode very little in the couple.
5. Wet-dry cyclic conditions vastly determine the formation of the electrolyte film
on the sensor complex as well as its wetting. Complete removal of the
condensed moisture film is not indicated, except in cases of direct sun hit, where
the surface would be heated appreciably.
6. Considerable corrosion is possible during the drying period, though the current
density could be much lower.
41

5.0 CONCLUSIONS AND SUMMARY
g=,=,
wJ,,¢
===
r
W
Work has been carried out on techniques for evaporation and sputtering of
selected materials on selected substrates to obtain thin film coatings to produce specimen
atmospheric corrosion microsensors. Two designs of Stage I and Stage II microsensors
have been devised and characterization and evaluation of these for atmospheric corrosion
conditions in selected environments have been carried out for electrochemical behavior
and selected fog testing. A modem sputtering equipment PELCO SC5 unit has been
procured and is to be further utilized in carrying out the processing of thin films for
different designs of the corrosion sensor thin films. Detailed analyses of electroechemical
corrosion effects have then to be further analyzed.
r_
E
= =t=
L
42

w
L_
t...,
L,
| ] APPENDIX
F q
w
½
w
43

L
STAGE I MICROSENSORS
w
w STAGE II MICROSENSORS
m
Figure AI: Photographs of Stage I and Stage II microsensors as shown under fabrication.
The photograph of Stage I microsensor on glass substrates show some shadow of the
electrode elements at the edges. No shadow is seen in case of alumina substrates for stage II
microsensors.
44

w
w
w
FIGURE A2: Photograph of research team members shown involved in the study
and development of the atmospheric microsensor project.
w
w
=
r-
w
45

PRINCIPAL INVESTIGATOR
DR. RAVINDER M. DIWAN
CO-PRINCIPAL INVESTIGATOR
DR. A. RAMAN
CO-PRINCIPAL INVESTIGATOR
DR. P. K. BHATTACHARYA
Figure A3: Research Project Team Members showing Principal Investigator and
Co-Principal Investigators.
46

v
MR. MANOJ CHHABRA
GRADUATE STUDENT
MS. FELESHA ROBERTSON
SENIOR M. E. STUDENT
w MR. CHIN-SUING TEO
SENIOR CH.E.STUDENT
MS. LORANN JONES
SENIOR E.E. STUDENT
Figure A4: Research Project Student assistants showing graduate student and
Undergraduate students.
47

w
w
W
w
w
r_
w
t
!h
MR. WENSEN LI
GRADUATE STUDENT
i
Figure A5: Research Project Student assistant conducting
corrosion testing.
48

w
w
Figure A6:
!
PELCO PC5 Sputter Coating unit procured for
thin film coating work.
Figure A7: Corrosion Chamber Fog Testing.
w
Z49

W
W
w
L ,.
--4
U
L_

E :
L_
| J
r_
L_
_J
[_U
U
H
w
_ _L5


