Download - Annual Results for FY2019 - Sumitomo Corp

May 11th, 2020
Sumitomo CorporationCautionary Statement Concerning Forward-looking StatementsThis report includes forward-looking statements relating to our future plans, forecasts, objectives, expectations and intentions. The forward-looking statements reflect management's current assumptionsand expectations of future events, and accordingly, they are inherently susceptible to uncertainties and changes in circumstances and are not guarantees of future performance. Actual results may differmaterially, for a wide range of possible reasons, including general industry and market conditions and general international economic conditions. In light of the many risks and uncertainties, you are advisednot to put undue reliance on these statements. The management forecasts included in this report are not projections, and do not represent management'scurrent estimates of future performance. Rather, they represent forecasts that management strives to achieve through the successful implementation of the Company's business strategies. The Company may be unsuccessful in implementing its business strategies, and management may fail to achieve its forecasts. The Company is under no obligation -- and expressly disclaims any such obligation -- to update or alter its forward-looking statements.
© 2020 Sumitomo Corporation
Annual Results for FY2019

FY2018 FY2019(Apr.-Mar.)
Results(Apr.-Mar.)
Results
Exchange rate 〈YEN/US$〉 110.92 108.71 LIBOR 6M (YEN) 0.01% -0.02% LIBOR 6M (US$) 2.65% 2.01%
Copper *1 (US$/MT) 6,526 6,005 Zinc (US$/MT) 2,746 2,406 Nickel (US$/lb) 5.85 6.35 Iron ore *1 (US$/MT) 69 93Hard coking coal *2 (US$/MT) 204 166Thermal coal (US$/MT) 106 71
Brent *1 (US$/bbl) 72 64 WTI (US$/bbl) 63 55
Interestrate
(Reference)Key indicators
CrudeOil
1
1. Operating Results(Profit for the year)
© 2020 Sumitomo Corporation
*1 Mineral resources is a sum of Mineral resources division No.1, Mineral resources division No.2 and Energy division.*2 Non-mineral resources business is calculated by subtracting Mineral resources business from the total (excl.one-off profits/losses)
< Quarterly Trend for excl. one-off profits/losses >
Q1 Q2 Q3 Q4 Q1 Q2 Q3 Q4
FY2018 FY2019
73.0 67.0 61.0 67.0 60.0 52.0 60.0 51.0
16.016.0
14.015.0
6.011.0
6.02.0
89.083.0
75.082.0
66.0 63.0 66.0
53.0
Mineral resources Non-mineral resources
(Unit: Billions of yen)
〈 Summary(Results)〉■ One-off losses Losses from impairment and write-down of
inventory in tubular products business One-off loss in Silver-zinc-lead mining project
in Bolivia
(excl. one-off profits/losses) ■Mineral resources Decrease in earnings of Silver-zinc-lead mining
project in Bolivia Decrease in earnings of coal mining projects in
Australia
■ Non-mineral resources Decrease in earnings of tubular products business
in North America Decrease in earnings of automotive related
business Progress in construction of large-scale projects in
power infrastructure business Stable performance of real estate business
FY2018 FY2019Results Q1 Q2 Q3 Q4 Results
(Apr.-Jun.) (Jul.-Sep.) (Oct.-Dec.) (Jan.-Mar.)
(A) (B) (B)-(A)
320.5 79.7 72.7 58.9 - 40.0 171.4 - 149.2
One-off profits/losses -8.0 +14.0 +9.0 - 7.0 - 93.0 - 77.0 - 69.0
329.0 66.0 63.0 66.0 53.0 248.0 - 81.0 Mineral resources *1 61.0 6.0 11.0 6.0 2.0 25.0 - 36.0
Non-mineral resources *2 268.0 60.0 52.0 60.0 51.0 223.0 - 45.0
Profit for the year
(Unit: Billions of yen)
excl. one-off profits/losses
Increase/Decrease
approx. approx.
approx. approx. approx.
approx. approx.
approx. approx.
approx.
approx.
approx.approx.
approx.
*1 These commodities show the prices in Jan.-Dec. *2 Hard coking coal…Market price

2. Profit for the year by Segment
(Unit: Billions of yen)〈 Summary by segment 〉
(excl. one-off profits/losses (Results) )
■ Metal Products Decrease in earnings of tubular products
business in North America Decrease in earnings of the operation of
overseas steel service centers
■ Transportation & Construction Systems Decrease in earnings of ship business Decrease in earnings of automotive related
business Decrease in earnings of construction
equipment sales & marketing business
■ Infrastructure Progress in construction of large-scale
projects in power infrastructure business Stable performance of IPP/IWPP business
■Media & Digital Stable performance of domestic major
group companies Change of fiscal year of telecommunication
business in Myanmar in FY2018
■ Living Related & Real Estate Stable performance of domestic major
group companies Stable performance of real estate business
■Mineral Resources, Energy, Chemical &Electronics
Decrease in earnings of Silver-zinc-lead mining project in Bolivia
Decrease in earnings of coal mining projects in Australia
2 © 2020 Sumitomo Corporation
40.5
52.0
64.4
47.5 42.1
68.5
5.7
30.0
61.7
38.3
51.3 43.2
-3.0
FY2018 (Results) FY2019 (Results)
MetalProducts
Transportation & Construction
Systems
Infrastructure Media& Digital
Living Related & Real Estate
Mineral Resources, Energy, Chemical
& Electronics Corporate and
Eliminations
One-off profits/losses included in profit for the year by segment (Left : FY 2018, Right : FY 2019)±0.0 -67.0 -2.0+2.0 ±0.0+8.0+3.0 -13.0+1.0-1.0-9.0 ±0.0 +3.0-9.0
-50.0
Shareholders’equity *3
2.5
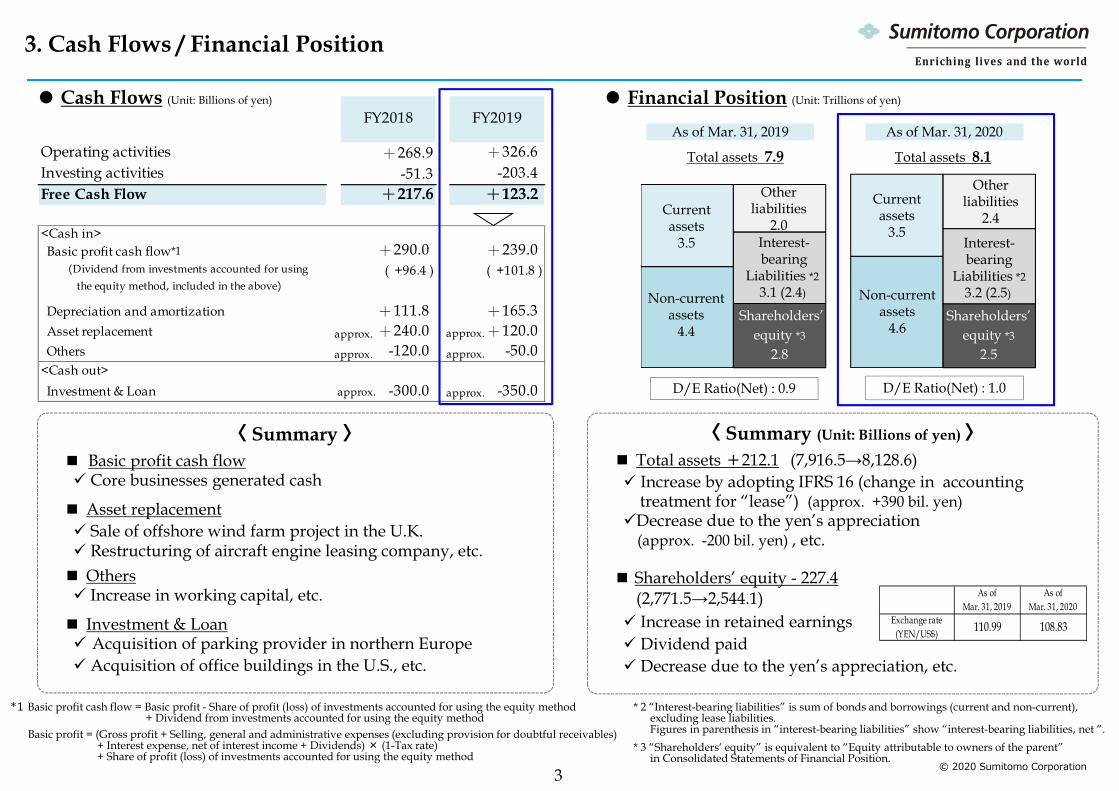
Operating activities +268.9Investing activities -51.3Free Cash Flow
Basic profit cash flow*1 +290.0 +239.0 ( +96.4 ) ( +101.8 )
Depreciation and amortization +111.8 +165.3 Asset replacement +240.0 +120.0 Others -120.0 -50.0
Investment & Loan -300.0 -350.0
FY2018 FY2019
<Cash out>
<Cash in>
+326.6 -203.4
+123.2 +217.6
(Dividend from investments accounted for usingthe equity method, included in the above)
approx.
approx.
approx.
approx.
approx. approx.
3. Cash Flows / Financial Position
As of Mar. 31, 2019
D/E Ratio(Net) : 0.9
As of Mar. 31, 2020
D/E Ratio(Net) : 1.0
● Cash Flows (Unit: Billions of yen) ● Financial Position (Unit: Trillions of yen)
Total assets 7.9 Total assets 8.1
Currentassets
3.5
Non-currentassets
4.4
Otherliabilities
2.0Interest-bearing
Liabilities *23.1 (2.4)
Shareholders’equity *3
2.8
*1 Basic profit cash flow = Basic profit - Share of profit (loss) of investments accounted for using the equity method + Dividend from investments accounted for using the equity method
* 2 “Interest-bearing liabilities” is sum of bonds and borrowings (current and non-current), excluding lease liabilities. Figures in parenthesis in “interest-bearing liabilities” show “interest-bearing liabilities, net “.
110.99 108.83
As ofMar. 31, 2020
As ofMar. 31, 2019
Exchange rate(YEN/US$)
Currentassets
3.5
Non-currentassets
4.6
Otherliabilities
2.4
Interest-bearing
Liabilities *23.2 (2.5)
Basic profit = (Gross profit + Selling, general and administrative expenses (excluding provision for doubtful receivables)+ Interest expense, net of interest income + Dividends) × (1-Tax rate) + Share of profit (loss) of investments accounted for using the equity method
3
* 3 “Shareholders‘ equity” is equivalent to “Equity attributable to owners of the parent”in Consolidated Statements of Financial Position.
〈 Summary 〉■ Basic profit cash flow Core businesses generated cash
■ Asset replacement Sale of offshore wind farm project in the U.K. Restructuring of aircraft engine leasing company, etc.■ Others Increase in working capital, etc.
■ Investment & Loan Acquisition of parking provider in northern Europe Acquisition of office buildings in the U.S., etc.
〈 Summary (Unit: Billions of yen) 〉■ Total assets+212.1 (7,916.5→8,128.6) Increase by adopting IFRS 16 (change in accounting
treatment for “lease”) (approx. +390 bil. yen)Decrease due to the yen’s appreciation
(approx. -200 bil. yen) , etc.
■ Shareholders’ equity - 227.4(2,771.5→2,544.1) Increase in retained earnings Dividend paid Decrease due to the yen’s appreciation, etc.
© 2020 Sumitomo Corporation

Screen investment severely and generate further cash flow to hold back the decrease of free cash flow, and enhance financial soundness by reducing interest-bearing liabilities. As for shareholder return, keep the same level of dividend as for the previous fiscal year following on our basic policy of paying shareholders a stable dividend over the long term.
Examine influence of the COVID-19 and execute drastic structural reform including reviewing our strategies on portfolio management and upgrading our sustainability management to realize the prompt recovery for post COVID-19.
Screen investments
Review plans for new and renewal investments and execute only essential investments to future growth
Global economic slowdown due to outbreak of the COVID-19 and deterioration of business environment caused by the U.S-China trade issues etc. are impacting our activities.
We have secured ample liquidity to keep our operation at this moment. However, since the uncertainties on future outlook is increasing, we have changed our mindset to “emergency mode” and will prepare for prompt recovery for upcoming post-COVID-19 while maintaining the financial soundness.
Promote drastic structural reform
Promote bold structural reform such as business value-up, replacement acceleration, portfolio review, sustainability management enhancement
Generate higher level of cash flow
Pursue lean operation through steady asset replacement, working capital improvement, and cost reduction
<Current situation>
<Initiative in FY2020>
© 2020 Sumitomo Corporation4
4. Initiative in FY2020

© 2020 Sumitomo Corporation
5. Forecast of FY2020 and current situation by segment
5
It is difficult to make reasonable assumption about forecasts for FY2020 at this moment. (there is a possibility to have financial impact for more than 100.0 billion yen subject to assumption.)
We will disclose the annual forecasts promptly after confirming and analyzing the information on resuming economic activities such as plans to lift lockdowns of each countries.
Current situation reflecting COVID-19 influence is as follows.
・Tubular products business in NA ︓Decrease in demand and price ・Overseas steel service centers : Decrease in demand from automotive manufacturers and low operation ratio ・Aluminium smelting business : Low market price ・Leasing business ︓Request for deferred payment from lessee of aircrafts, Increase in credit cost
・Construction equipment business ︓Decrease in demand and lower operation ratio of equipments ・EPC projects ︓Peak out of large-scale project progress and delay in construction of some projects ・IPP/IWPP business : Stable
・Jupiter Telecommunications ︓Restriction on salesforce activities
・T-GAIA ︓Short business hour and store closure ・Supermarket chains in Japan ︓Stable due to increasing demand from home-meal replacement ・Real estate business ︓Decrease in revenue from retail facilities business ・Fresh produce business ︓Decrease in sales due to lower price in the U.S. etc.
・Chemicals & Electronics ︓Decline in prices and turmoil in supply chains
Segment FY2020 Current situation
Mineral Resources,Energy, Chemical &
Electronics
Metal Products
Transportation &Construction
Systems
・Mineral resources & Energy : Suspension of mining operations (nickel project in Madagascar, iron ore mining project in South Africa, silver, zinc and lead mining project in Bolivia) and decline in prices
・Automotive related business
︓Impacts on new order for selling products, Putting attention to the situation on the delay in developing new projects
・SCSKMedia & Digital
Living Related &Real Estate
Infrastructure
︓Decrease in customers to TBC, Temporary closure or lower operating ratio of manufacturing business, Request increase for deferred repayment in financing business in Indonesia
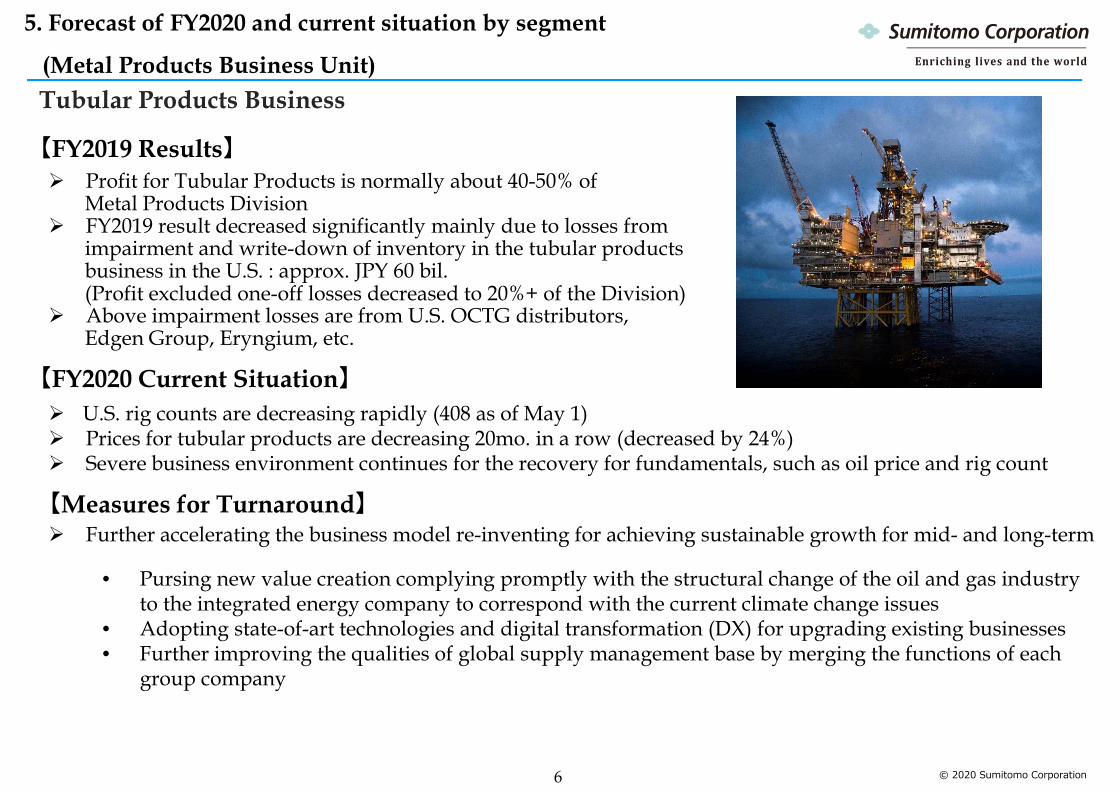
Tubular Products Business
【FY2019 Results】 Profit for Tubular Products is normally about 40-50% of
Metal Products Division FY2019 result decreased significantly mainly due to losses from
impairment and write-down of inventory in the tubular products business in the U.S. : approx. JPY 60 bil.(Profit excluded one-off losses decreased to 20%+ of the Division)
Above impairment losses are from U.S. OCTG distributors, Edgen Group, Eryngium, etc.
【FY2020 Current Situation】 U.S. rig counts are decreasing rapidly (408 as of May 1) Prices for tubular products are decreasing 20mo. in a row (decreased by 24%) Severe business environment continues for the recovery for fundamentals, such as oil price and rig count
【Measures for Turnaround】 Further accelerating the business model re-inventing for achieving sustainable growth for mid- and long-term
• Pursing new value creation complying promptly with the structural change of the oil and gas industry to the integrated energy company to correspond with the current climate change issues
• Adopting state-of-art technologies and digital transformation (DX) for upgrading existing businesses • Further improving the qualities of global supply management base by merging the functions of each
group company
6 © 2020 Sumitomo Corporation
5. Forecast of FY2020 and current situation by segment
(Metal Products Business Unit)

Automotive-related Business
【FY2019 Results】 Profit for the year fell into the red of several billions of yen in FY2019.
Main factors : ・ Downturn of automotive manufacturing businesses
due to decrease in production of automakers・ Impairment losses of TBC and an automotive manufacturing business in Europe etc.
【FY2020 Current Situation】 The outbreak of COVID-19 is impacting the following business fields:
- Manufacturing business : impacts from decrease in production of automakers anddecrease in sales due to temporary closure of factories
- Sales and marketing business : decrease in sales due to suspension of sales activities andlower consumer confidence
- Automotive financing : confusion due to government policy for loan repayment,business in Asia increase in credit cost and
decrease in sales of automobiles and motorcycles 【Measures for Turnaround】 Firstly Minimize adverse effects from COVID-19 outbreak by effective cash management Enhance competitiveness and turnaround low-performing business while anticipating recovery in
automotive manufacturing, sales & marketing business Looking ahead to the post COVID-19 era, maintain, strengthen and structurally transform existing
businesses, as well as create new businesses © 2020 Sumitomo Corporation7
5. Forecast of FY2020 and current situation by segment
(Transportation & Construction Systems Business Unit)

Ambatovy Nickel Project
【FY2019 Results】 FY2019 Result : 20.5 billion yen in deficit
Nickel Price : $6.35/lbNickel Production : 35.9 KMT
(reference) 8.5 KMT/Q1, 9.1 KMT/Q2, 8.5 KMT/Q3, 9.9 KMT/Q4
Stability has increased in operation and production baseline has improved, owing to the plant maintenance with shutdown in Q3 and current initiatives to enhance operation . Nickel production increased to approx. 10KMT in Q4, despite suspension by COVID-19.
【FY2020 Current Situation】 The operation has been suspended since the end of March.
【Measures for Turnaround】 Utilization of external experts and training sessions to employees on
maintenance/operational works will accelerate after restart, to realize high-level/stable operation.
© 2020 Sumitomo Corporation8
5. Forecast of FY2020 and current situation by segment
(Mineral Resources, Energy, Chemical & Electronics Business Unit)

To increase dividends by achieving mid-long term earnings growth while adhering to the Company’s fundamental policy of paying shareholders a stable dividend over the long term
Basic policy
We will decide the dividend amount in view of the situations regarding basic profit and cash flow, with a consolidated payout ratio of 30% as a guideline.
“Medium-Term Management
Plan 2020”Dividend Policy
© 2020 Sumitomo Corporation
Dividend
6. Dividend for FY2019
9
FY 2019Annual dividend: 80 yen/share
(Interim dividend: 45 yen/share, Year-end dividend: 35 yen/share [plan])
171.4 billion yen of profit for the year was lower than expected in February, albeit mainly due to non-cash losses. We plan 80 yen of dividend per share for FY2019 as announced previously based on our basic policy.
FY 2020 Annual dividend: 70 yen/share
(Interim dividend: 35 yen/share, Year-end dividend: 35 yen/share [plan])
We plan 70 yen of dividend per share for FY2020, the same as the amount of ordinary dividend for FY2019 based on our basic policy, though negative impacts on our financial performance is inevitable due to current business environment.
(Unit︓Billions of yen)Revised Forecasts
(as of Feb 2020)
Results(as of May 2020)
300.0 171.4
One-off profits/losses +23.0 -77.0
excl. one-off profits/losses 277.0 248.0
<Dividend>80yen 80yen 70yen
( payout ratio ) (33.3%) (58.3%) (-)
Ordinary dividend 70yen 70yen 70yen( payout ratio ) (29.1%) (51.0%) (-)
Commemorative dividend 10yen 10yen -
Profit for the year
dividend per share
FY2019FY2020(plan)
-approx. approx.
approx. approx.
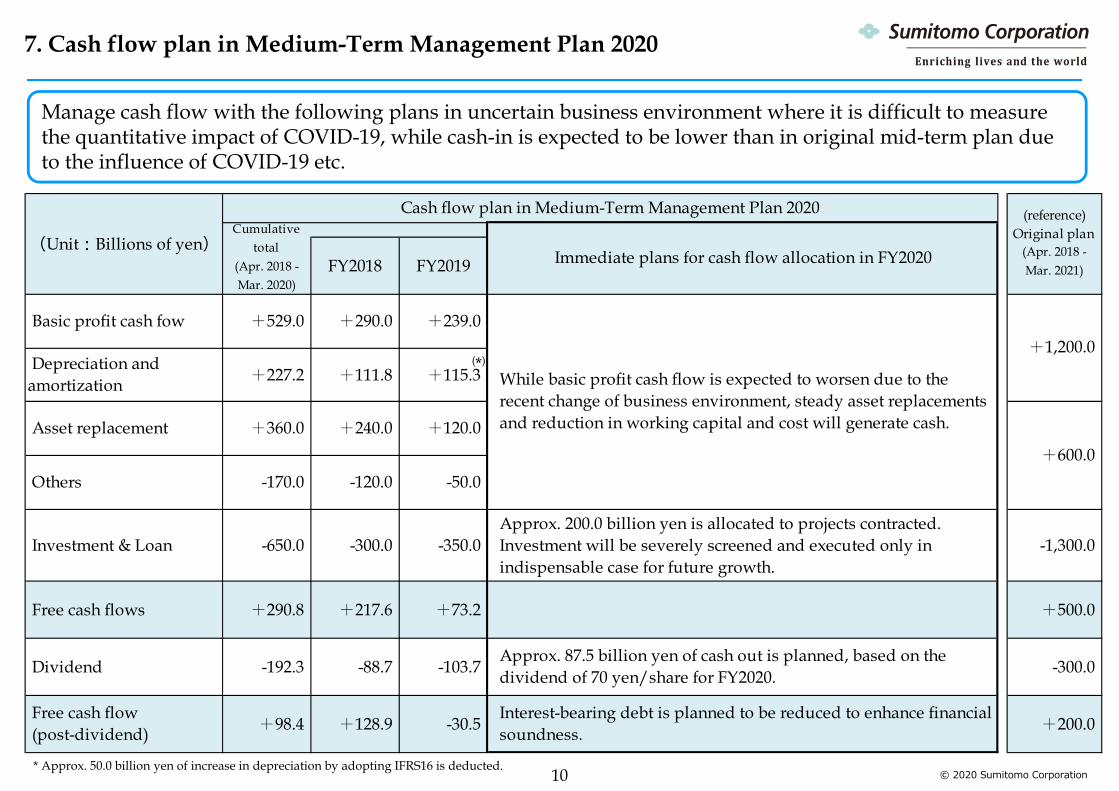
FY2018 FY2019
Basic profit cash fow +529.0 +290.0 +239.0
Depreciation andamortization +227.2 +111.8 +115.3
Asset replacement +360.0 +240.0 +120.0
Others -170.0 -120.0 -50.0
Investment & Loan -650.0 -300.0 -350.0 Approx. 200.0 billion yen is allocated to projects contracted.Investment will be severely screened and executed only inindispensable case for future growth.
-1,300.0
Free cash flows +290.8 +217.6 +73.2 +500.0
Dividend -192.3 -88.7 -103.7 Approx. 87.5 billion yen of cash out is planned, based on thedividend of 70 yen/share for FY2020. -300.0
Free cash flow (post-dividend) +98.4 +128.9 -30.5
Interest-bearing debt is planned to be reduced to enhance financialsoundness. +200.0
Cumulativetotal
(Apr. 2018 -Mar. 2020)
Immediate plans for cash flow allocation in FY2020
+1,200.0
+600.0
Cash flow plan in Medium-Term Management Plan 2020
(Unit︓Billions of yen)(reference)
Original plan(Apr. 2018 -Mar. 2021)
While basic profit cash flow is expected to worsen due to therecent change of business environment, steady asset replacementsand reduction in working capital and cost will generate cash.
© 2020 Sumitomo Corporation10
Manage cash flow with the following plans in uncertain business environment where it is difficult to measure the quantitative impact of COVID-19, while cash-in is expected to be lower than in original mid-term plan due to the influence of COVID-19 etc.
(*)
* Approx. 50.0 billion yen of increase in depreciation by adopting IFRS16 is deducted.
7. Cash flow plan in Medium-Term Management Plan 2020
Appendix
© 2020 Sumitomo Corporation

12
1. Summary of Consolidated Statements of Comprehensive Income (P.13)
2. Summary of Consolidated Statements of Cash Flows (P.14)
3. Summary of Consolidated Statements of Financial Position (P.15)
4. Investment and Loan by Segment (P.16)
5. Performance Overview by Segment (P.17-26)
6. Supplemental Materials by Segment (P.27-28)(Living Related & Real Estate Business Unit, Mineral Resources, Energy, Chemical & Electronics Business Unit)
7. Quarterly Trend for Profit for the year attributable to owners (P.29-30)of the parent and One-off profits/losses by Segment
8. Medium-Term Management Plan 2020, Key Financial Indicators (P.31)
9. Historical Data (P.32-33)
10. Historical Data for Medium-Term Management Plan (P.34)
11. Shareholders’ Composition (P.35)© 2020 Sumitomo Corporation
1. Summary of Consolidated Statements of Comprehensive Income
© 2020 Sumitomo Corporation
amount %
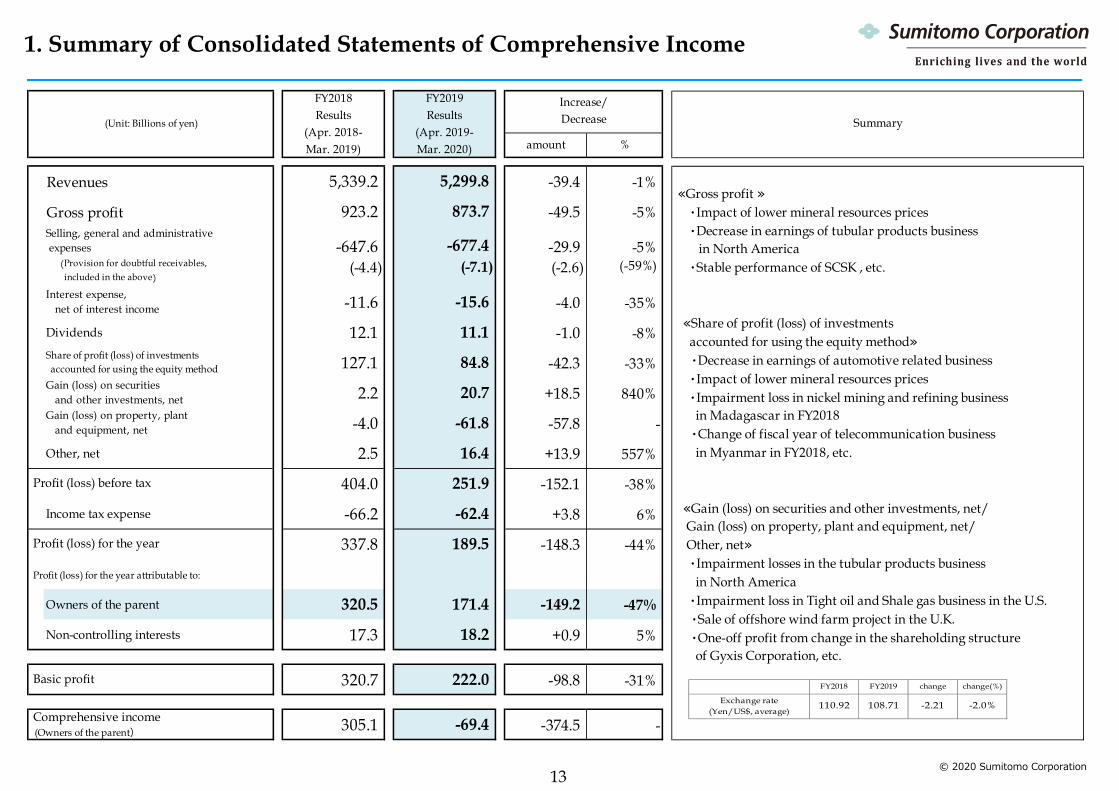
Revenues 5,339.2 5,299.8 -39.4 -1%
Gross profit 923.2 873.7 -49.5 -5% Selling, general and administrative expenses -647.6 -677.4 -29.9 -5% (Provision for doubtful receivables, included in the above)
(-4.4) (-7.1) (-2.6) (-59%)
Interest expense, net of interest income -11.6 -15.6 -4.0 -35%
Dividends 12.1 11.1 -1.0 -8% Share of profit (loss) of investments accounted for using the equity method 127.1 84.8 -42.3 -33% Gain (loss) on securities and other investments, net 2.2 20.7 +18.5 840% Gain (loss) on property, plant and equipment, net -4.0 -61.8 -57.8 -
Other, net 2.5 16.4 +13.9 557%
404.0 251.9 -152.1 -38%
Income tax expense -66.2 -62.4 +3.8 6%
337.8 189.5 -148.3 -44%
Profit (loss) for the year attributable to:
Owners of the parent 320.5 171.4 -149.2 -47%
Non-controlling interests 17.3 18.2 +0.9 5%
320.7 222.0 -98.8 -31%
305.1 -69.4 -374.5 -
Increase/Decrease Summary
≪Gross profit ≫ ・Impact of lower mineral resources prices ・Decrease in earnings of tubular products business in North America ・Stable performance of SCSK , etc.
≪Share of profit (loss) of investments accounted for using the equity method≫ ・Decrease in earnings of automotive related business ・Impact of lower mineral resources prices ・Impairment loss in nickel mining and refining business in Madagascar in FY2018 ・Change of fiscal year of telecommunication business in Myanmar in FY2018, etc.
≪Gain (loss) on securities and other investments, net/ Gain (loss) on property, plant and equipment, net/ Other, net≫ ・Impairment losses in the tubular products business in North America ・Impairment loss in Tight oil and Shale gas business in the U.S. ・Sale of offshore wind farm project in the U.K. ・One-off profit from change in the shareholding structure of Gyxis Corporation, etc.
Profit (loss) before tax
Profit (loss) for the year
Basic profit
Comprehensive income (Owners of the parent)
FY2018Results
(Apr. 2018-Mar. 2019)
FY2019Results
(Apr. 2019-Mar. 2020)
(Unit: Billions of yen)
FY2018 FY2019 change change(%)
Exchange rate(Yen/US$, average)
110.92 108.71 -2.21 -2.0%
13
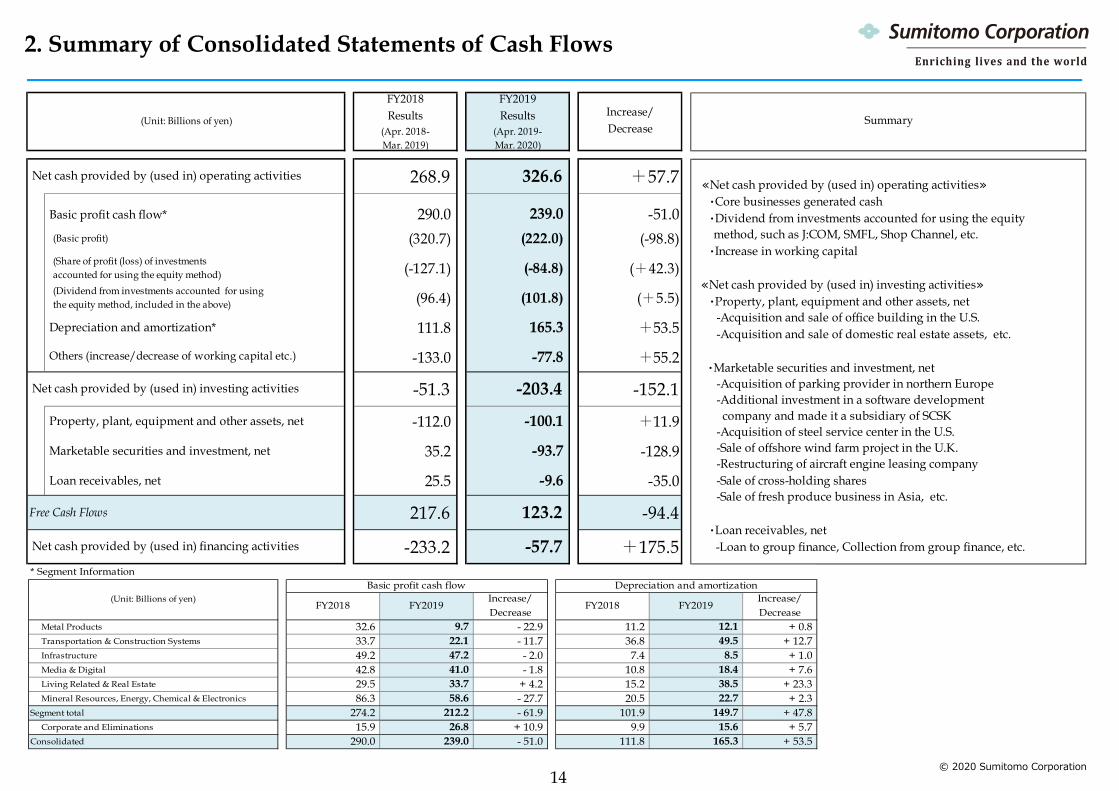
268.9 326.6 +57.7
Basic profit cash flow* 290.0 239.0 -51.0 (Basic profit) (320.7) (222.0) (-98.8) (Share of profit (loss) of investments accounted for using the equity method) (-127.1) (-84.8) (+42.3) (Dividend from investments accounted for using the equity method, included in the above) (96.4) (101.8) (+5.5)
Depreciation and amortization* 111.8 165.3 +53.5
Others (increase/decrease of working capital etc.) -133.0 -77.8 +55.2
-51.3 -203.4 -152.1
Property, plant, equipment and other assets, net -112.0 -100.1 +11.9
Marketable securities and investment, net 35.2 -93.7 -128.9
Loan receivables, net 25.5 -9.6 -35.0
Free Cash Flows 217.6 123.2 -94.4
-233.2 -57.7 +175.5
Net cash provided by (used in) operating activities
Net cash provided by (used in) investing activities
Net cash provided by (used in) financing activities
(Unit: Billions of yen)
≪Net cash provided by (used in) operating activities≫ ・Core businesses generated cash ・Dividend from investments accounted for using the equity method, such as J:COM, SMFL, Shop Channel, etc. ・Increase in working capital
≪Net cash provided by (used in) investing activities≫ ・Property, plant, equipment and other assets, net -Acquisition and sale of office building in the U.S. -Acquisition and sale of domestic real estate assets, etc.
・Marketable securities and investment, net -Acquisition of parking provider in northern Europe -Additional investment in a software development company and made it a subsidiary of SCSK -Acquisition of steel service center in the U.S. -Sale of offshore wind farm project in the U.K. -Restructuring of aircraft engine leasing company -Sale of cross-holding shares -Sale of fresh produce business in Asia, etc.
・Loan receivables, net -Loan to group finance, Collection from group finance, etc.
Increase/Decrease
Summary
FY2018Results
(Apr. 2018-Mar. 2019)
FY2019Results
(Apr. 2019-Mar. 2020)
* Segment Information
FY2018 FY2019Increase/Decrease
FY2018 FY2019Increase/Decrease
Metal Products 32.6 9.7 - 22.9 11.2 12.1 + 0.8 Transportation & Construction Systems 33.7 22.1 - 11.7 36.8 49.5 + 12.7 Infrastructure 49.2 47.2 - 2.0 7.4 8.5 + 1.0 Media & Digital 42.8 41.0 - 1.8 10.8 18.4 + 7.6 Living Related & Real Estate 29.5 33.7 + 4.2 15.2 38.5 + 23.3 Mineral Resources, Energy, Chemical & Electronics 86.3 58.6 - 27.7 20.5 22.7 + 2.3
Segment total 274.2 212.2 - 61.9 101.9 149.7 + 47.8 Corporate and Eliminations 15.9 26.8 + 10.9 9.9 15.6 + 5.7
Consolidated 290.0 239.0 - 51.0 111.8 165.3 + 53.5
(Unit: Billions of yen)Basic profit cash flow Depreciation and amortization
2. Summary of Consolidated Statements of Cash Flows
© 2020 Sumitomo Corporation14

3. Summary of Consolidated Statements of Financial Position
(as of Mar.31,2019) (as of Mar.31,2020)
Assets 7,916.5 8,128.6 +212.1 Current assets 3,547.7 3,536.4 -11.3
Cash and cash equivalents 660.4 710.4 +50.0 Trade and other receivables 1,340.5 1,231.1 -109.4 Inventories 925.2 930.0 +4.8 Assets held for sale 56.0 - -56.0 Other current assets 329.4 408.4 +79.0
Non-current assets 4,368.9 4,592.2 +223.3 Investments accounted for using the equity method 2,130.5 2,025.3 -105.3 Trade and other receivables 371.4 331.9 -39.5 Tangible fixed assets / intangible assets 1,006.4 1,342.9 +336.6
Liabilities (Current / Non-current) 5,010.3 5,436.0 +425.7 Trade and other payables 1,236.3 1,136.3 -100.0 Lease liabilities 68.4 492.0 +423.6
8.8 - -8.8 3,098.0 3,189.4 +91.4
(2,427.1) (2,468.8) (+41.7)
Equity 2,906.2 2,692.6 -213.6 Shareholders' Equity 2,771.5 2,544.1 -227.4
35.0% 31.3% -3.7pt
0.9 1.0 -0.1pt
≪Trade and other receivables(Current/Non-current)≫ ・Decrease︓Impact of changes in accounting standards(IAS28) Decrease in the tubular products business in North America, etc.
≪Tangible fixed assets/intangible assets≫ ・Increase︓Impact of changes in accounting standards(IFRS16) Acquisition of northern Europe parking provider Impairment losses in the tubular products business in North America, etc.
≪Lease liabilities≫ ・Increase︓Impact of changes in accounting standards(IFRS16) , etc.
≪Shareholders' Equity≫ ・Retained earnings +12.6(2,061.3→2,073.9) - Include impact of changes in accounting standards(IAS28/IFRS16) -53.3 ・Exchange difference on translating foreign operation -131.2(99.5→ -31.7) ・Financial assets measured at fair value through other comprehensive income -52.6(159.0→106.4)
Interest bearing liabilities * (gross) (net)
Shareholders' Equity Ratio
D/E ratio(Net)
Liabilities associated with assets classified as held for sale
(Unit: Billions of yen)FY2018Results
FY2019Results
Increase/Decrease
Summary
FY2018 FY2019 change change(%)
Exchange rate(Yen/US$, closing)
110.99 108.83 -2.16 -1.9%
15* Sum of bonds and borrowings (current and non-current) © 2020 Sumitomo Corporation

© 2020 Sumitomo Corporation
Three emerging fields* 90.0 * Technology x Innovation, Healthcare, Social infrastructure
Total
Major investments & loans
161.0
99.0
Media & Digital
Infrastructure
Transportation &Construction Systems
Metal Products
Living Related& Real Estate
Investment& Loan(bil.yen)
・Specialty steel business in India・Oil and gas venture company in Norway
・Acquisition of Quebrada Blanca copper mine interest in Chile・Agricultural input and service business in Ukraine
Minerals Resources,Energy, Chemical &Electronics
650.0
Results(Apr.2018-Mar.2020)
54.0
120.0
143.0
77.0
・Acquisition of domestic and overseas real estates・Acquisition of domestic dispensing pharmacies
・Acquisition of all shares of system companies as wholly owned subsidiaries of SCSK, Capital investment in SCSK・Venture capital investment in technology companies
・Offshore wind farm projects in France and Belgium・Coal-fired power plant in Vietnam
・Assets increase in rental business・Northern Europe parking provider
4. Investment & Loan by Segment
16

FY2018Results
FY2019Results
40.5 -50.0
(0) (approx.-67.0)
Gross profit 145.2 104.8
-99.2 -96.1
10.7 -16.1
Total assets 1,245.2 1,088.6
Basic profit cash flow 32.6 9.7
Depreciation and amortization 11.2 12.1
Profit for the yearattributable to owners of the parent
(Unit: Billions of yen)
(One-off profit/loss)
Share of profit (loss) of investmentsaccounted for using the equity method
Selling, general andadministrative expenses
Sumitomo Corporation Global Metals Group * 7.7 7.0 100.00 %Domestic and International trading of steel products / nonferrousmetal products and related business
3.1 1.6 20.00 % Aluminium smelting business in MalaysiaERYNGIUM Ltd. 0.3 -8.7 100.00 % Processing, distribution and sale of specialty metals for OCTG marketEDGEN GROUP 1.8 -16.0 100.00 % Global distributor of metal and tubular products for energy industry
Aluminium smelting business in Malaysia
(Unit: Billions of yen)
Shares in equity(Mar. 31, 2020)
Main BusinessFY2018Results
FY2019Results
Equity in earnings
【Key Financial Indicators】
【Principal Subsidiaries and Associated Companies】
Investment & Replacement
【Investment (FY2019 Result : ¥22.0 bil.)】・Acquisition of steel service center in the U.S. (Jun. 2019)・Acquisition of oil and gas venture company in Norway (Jul. 2019)
【Replacement】・ Sale of Sumisho Speciality Steel (Aug. 2019)
5. Performance Overview(1) (Metal Products)
<FY2019 Results> (¥90.5 bil. decrease from FY2018)
・Steel sheets Overseas steel service centers : decrease in earnings
・Non-ferrous metalsAluminium smelting business in Malaysia :stagnant market for aluminium
・Tubular productsTubular products business in North America : decrease in earnings
・Losses from impairment and write-down of inventory, etc.in the tubular products business in NA in FY2019 : approx. -¥60.0 bil.
・Other one-off losses, and etc. in FY2019 : approx. -¥7.0 bil.
* We transferred a part of our metal products business to Sumitomo Corporation Global Metals, effective April 1, 2018.As Sumisho Metalex Corporation became a wholly owned subsidiary of Sumitomo Corporation Global Metals in April 2018, financial figures of Sumisho Metalex are included in Sumitomo Corporation Global Metals Group.
© 2020 Sumitomo Corporation17
<FY2020 Current Situation>
・Tubular products business in NA :Decrease in demand and price
・Overseas steel service centers :Decrease in demand from automotive manufacturers and low operation ratio
・Aluminium smelting business in Malaysia :Low market price

Investment & Replacement
【Investment (FY2019 Result : ¥75.0 bil.)】・Assets increase in rental business・Acquisition of northern Europe parking provider “Q-Park *“ (Apr. 2019)
* Q-Park was renamed Aimo-Park. (Sep. 2019)・Acquisition of manufacturer of automotive brake components “Asama Giken” (Sep. 2019)
【Replacement】・Completion of joint stake in aircraft engine leasing company (Apr. 2019)
5. Performance Overview(2) (Transportation & Construction Systems)
【Principal Subsidiaries and Associated Companies】
*1 Equity in earnings for companies marked with an asterisk are amounts for company-total including other segments. The percentage of each company for this segment is as follows:SMFL:45%(out of 50% company-total), Sumisho Corporation Power & Mobility Co., Ltd: 60%(out of 100% company-total)
*2 Our share increased from 40% to 50% due to reorganization from Dec. 2018.*3 Our share decreased from 46% to 34% due to reorganization from Jan. 2019.*4 Sumisho Machinery Tarde Corporation was renamed Sumitomo Corporation Power & Mobility Co., Ltd. in Oct. 2019.
FY2018Results
FY2019Results
52.0 30.0
(approx. -9.0) (approx. -9.0)
Gross profit 158.1 164.9
-127.3 -149.9
49.4 26.1
Total assets 1,752.5 1,693.4
Basic profit cash flow 33.7 22.1
Depreciation and amortization 36.8 49.5
Profit for the yearattributable to owners of the parent
(Unit: Billions of yen)
(One-off profit/loss)
Share of profit (loss) of investmentsaccounted for using the equity method
Selling, general andadministrative expenses
【Key Financial Indicators】<FY2019 Results> (¥22.0 bil. decrease from FY2018)
・Ship : decrease in earnings ・Automotive related business : decrease in earnings ・Construction equipment sales & marketing business
: decrease in earnings
・Impairment losses, and etc. in TBC and Automotive manufacturing business in Europe in FY2019 : approx. -¥9.0 bil.
・One-off loss from sale of Indonesian commercial bank “BTPN” in FY2018 : approx. -¥10.0 bil.
・One-off loss from reorganization of TBC in FY2018 : approx. -¥2.0 bil.
・One-off profit from reorganization of leasing businessin FY2018 : approx. +¥7.0 bil.
© 2020 Sumitomo Corporation
31.8 30.7 50.00 % Finance & Lease
Automotive Financing Business in Indonesia 4.6 5.0 - Car & Motorcycle finance in IndonesiaSumitomo Mitsui Auto Service Company, Limited*3 4.5 2.9 34.00 % Leasing of motor vehiclesSumitomo Corporation Power & Mobility Co., Ltd *1,4 1.2 1.6 100.00 % Trading of automobiles, construction equipment, machinery and equipmentTBC Corporation 0.1 -7.3 50.00 % Retail and wholesale of tires in the U.S.
Sumitomo Mitsui Finance and
Leasing Company, Limited (SMFL)*1,2
(Unit: Billions of yen)
Shares in equity(Mar. 31, 2020) Main BusinessFY2018
ResultsFY2019Results
Equity in earnings
18
<FY2020 Current Situation>・Leasing business :
Request for deferred payment from lessee of aircraftsIncrease in credit cost by economic downturn
・Automotive related business : Decrease in customers visiting to TBCTemporary closure or lower operating ratio ofautomotive manufacturing business Request increase for deferred payment from loanee in automotive financing business in Indonesia
・Construction equipment sales & marketing and rental business : Decrease in demand and lower operation ratio of equipments

Investment & Replacement
【Investment (FY2019 Result : ¥81.0 bil.)】・Construction start of independent combined cycle power plant (Hamriyah) in the Emirate of Sharjah,
UAE (Jun. 2019)・Construction start of coal-fired power plant (Van Phong 1) in Vietnam (Aug. 2019) ・Commence of Smart City development in northern Hanoi (Dec. 2019)
【Replacement】・Sale of offshore wind farm project (Race Bank) in the U.K. to our renewable energy fund (Apr. 2019)・Sale of offshore wind farm project (Galloper) in the U.K. to our renewable energy fund (Mar. 2020)
Overseas IPP/IWPP business*1 37.1 35.0 -*2 Overseas IPP/IWPP business2.6 2.3 100.00 % Global logistics providerSumisho Global Logistics Co., Ltd.
(Unit: Billions of yen)
Shares in equity(Mar. 31, 2020)
Main BusinessFY2018Results
FY2019Results
Equity in earnings
5. Performance Overview(3) (Infrastructure)
【Principal Subsidiaries and Associated Companies】
FY2018Results
FY2019Results
64.4 61.7
(approx.+2.0) (approx.-1.0)
Gross profit 114.3 114.4
-57.3 -60.5
11.0 14.8
Total assets 923.1 894.9
Basic profit cash flow 49.2 47.2
Depreciation and amortization 7.4 8.5
Profit for the yearattributable to owners of the parent
(Unit: Billions of yen)
(One-off profit/loss)
Share of profit (loss) of investmentsaccounted for using the equity method
Selling, general andadministrative expenses
【Key Financial Indicators】<FY2019 Results> (¥2.7 bil. decrease from FY2018)
・ Large-scale EPC* projects : progress in construction ・ IPP/IWPP business : stable
・ One-off profits/losses from power infrastructurebusiness, etc. in FY2019 : approx. -¥1.0 bil.
・ One-off profit from renewable energy powergeneration business in FY2018 : approx. +¥3.0 bil.
・ Other one-off loss, and etc. in FY2018 : approx. -¥1.0 bil.
*EPC: Engineering, Procurement & Construction
© 2020 Sumitomo Corporation19
*1 Equity in earnings for the entire overseas IPP/IWPP business. This also includes Summit Southern Cross Power Holdings Pty Ltd which is previously disclosed.*2 Group of companies with different ratio of shares
<FY2020 Current Situation>
・ EPC projects : Peak out of large-scale project progress anddelay in construction of some projects
・ IPP/IWPP business : stable
Investment & Replacement
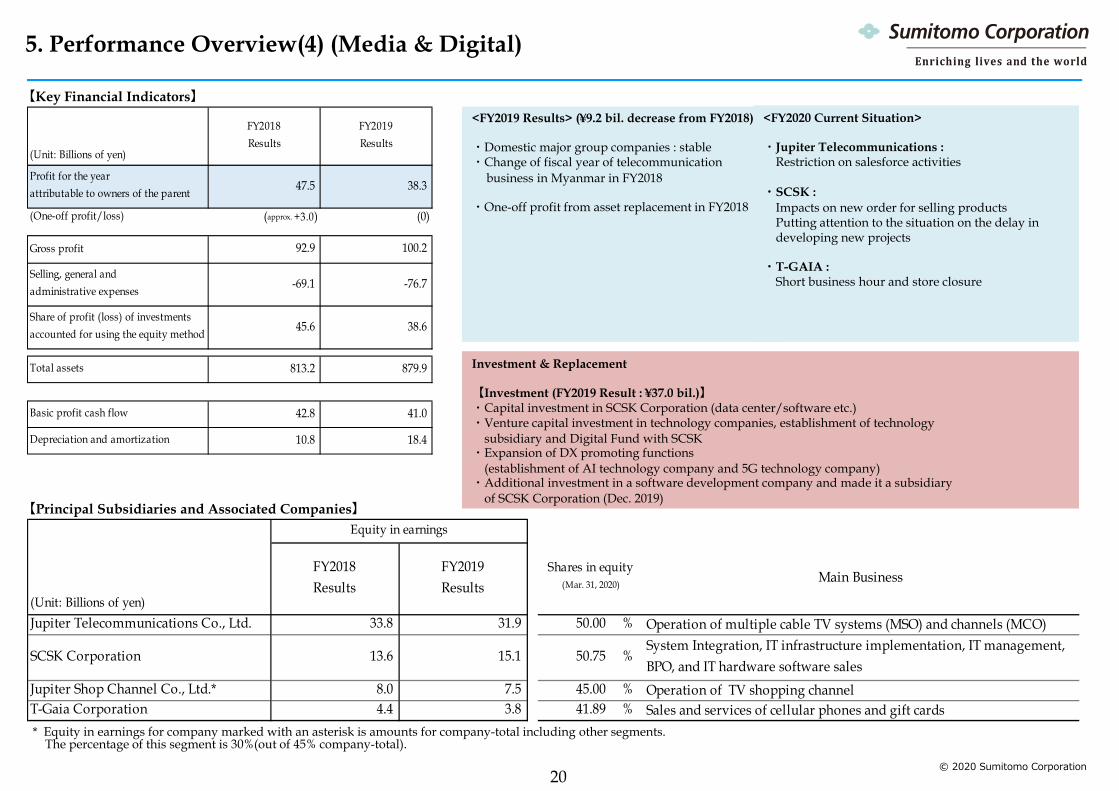
【Investment (FY2019 Result : ¥37.0 bil.)】・Capital investment in SCSK Corporation (data center/software etc.)・Venture capital investment in technology companies, establishment of technology
subsidiary and Digital Fund with SCSK・Expansion of DX promoting functions
(establishment of AI technology company and 5G technology company)・Additional investment in a software development company and made it a subsidiary
of SCSK Corporation (Dec. 2019)
Jupiter Telecommunications Co., Ltd. 33.8 31.9 50.00 % Operation of multiple cable TV systems (MSO) and channels (MCO)
SCSK Corporation 13.6 15.1 50.75 %System Integration, IT infrastructure implementation, IT management,BPO, and IT hardware software sales
Jupiter Shop Channel Co., Ltd.* 8.0 7.5 45.00 % Operation of TV shopping channelT-Gaia Corporation 4.4 3.8 41.89 % Sales and services of cellular phones and gift cards
Shares in equity(Mar. 31, 2020) Main Business
(Unit: Billions of yen)
FY2018Results
FY2019Results
Equity in earnings
5. Performance Overview(4) (Media & Digital)
【Principal Subsidiaries and Associated Companies】
FY2018Results
FY2019Results
47.5 38.3
(approx. +3.0) (0)
Gross profit 92.9 100.2
-69.1 -76.7
45.6 38.6
Total assets 813.2 879.9
Basic profit cash flow 42.8 41.0
Depreciation and amortization 10.8 18.4
Profit for the yearattributable to owners of the parent
(Unit: Billions of yen)
(One-off profit/loss)
Share of profit (loss) of investmentsaccounted for using the equity method
Selling, general andadministrative expenses
【Key Financial Indicators】<FY2019 Results> (¥9.2 bil. decrease from FY2018)
・Domestic major group companies : stable・Change of fiscal year of telecommunication
business in Myanmar in FY2018
・One-off profit from asset replacement in FY2018
<FY2020 Current Situation>
・Jupiter Telecommunications :Restriction on salesforce activities
・SCSK : Impacts on new order for selling productsPutting attention to the situation on the delay in developing new projects
・T-GAIA : Short business hour and store closure
* Equity in earnings for company marked with an asterisk is amounts for company-total including other segments.The percentage of this segment is 30%(out of 45% company-total).
© 2020 Sumitomo Corporation20

Investment & Replacement
【Investment (FY2019 Result : ¥95.0 bil.)】・Acquisition of domestic real estates・Additional investment in condominium development/sales business in India (May 2019)・Refurbishment of Summit store, etc.・Acquisition of domestic dispensing pharmacies・Acquisition of office building in the U.S. (Dec. 2019)・Additional investment in SOSiLA Logistics REIT, Inc. (Dec. 2019)
【Replacement】・Sale of domestic real estates ・Sale of Sumifru Singapore Pte.Ltd. (Jul. 2019)・Sale of office building in the U.S. (Nov. 2019)・Sale of domestic real estates to SOSiLA Logistics REIT, Inc. (Dec. 2019)・Sale of a partial share of GINZA SIX. (Jan. 2020)
Summit, Inc. 4.8 6.1 100.00 % Supermarket chainU.S. Residential Business 0.8 3.0 100.00 % Investment in multi-family apartment projects and land developmentSC Foods Co., Ltd. 2.6 2.3 100.00 % Import, development, and sale of foodstuffsSumisho Realty Management Co., Ltd. 1.0 1.8 100.00 % Asset management business of real estateTOMOD'S Inc. 1.6 1.6 100.00 % Drug store chainFyffes Limited -2.9 1.5 100.00 % Fresh produce production and wholesale business operator in Europe and the AmericasSUMISHO BUILDING MANAGEMENT CO., LTD. 1.6 1.4 100.00 % Operation, management, planning and consulting service for office buildingsSumifru Singapore Pte.Ltd. * 1.3 1.3 NA Production and marketing of fresh fruitS.C.Cement Co., Ltd. 1.2 1.2 100.00 % Sale of cement, ready-mixed concrete, and concrete productsSUMMIT FORESTS NEW ZEALAND LIMITED 1.5 1.1 100.00 % Holding forest assets, finance, harvesting logs, sales, planting, silviculture* We refrain from disclosing shares in equity due to sale of Sumifru Singapore Pte.Ltd. in Jul. 2019.
(Unit: Billions of yen)
Shares in equity(Mar. 31, 2020) Main BusinessFY2018
ResultsFY2019Results
Equity in earnings
5. Performance Overview(5) (Living Related & Real Estate)
【Principal Subsidiaries and Associated Companies】
FY2018Results
FY2019Results
42.1 51.3
(approx. +1.0) (approx. +3.0)
Gross profit 210.7 226.4
-172.0 -178.5
7.6 9.3
Total assets 1,243.3 1,538.4
Basic profit cash flow 29.5 33.7
Depreciation and amortization 15.2 38.5
Profit for the yearattributable to owners of the parent
(Unit: Billions of yen)
(One-off profit/loss)
Share of profit (loss) of investmentsaccounted for using the equity method
Selling, general andadministrative expenses
【Key Financial Indicators】 <FY2019 Results> (¥9.2 bil. increase from FY2018)
・Domestic major group companies andreal estate business : stable
・Other one-off profits in FY2019 : approx. +¥7.0 bil.・Other one-off losses in FY2019 : approx. -¥4.0 bil.・One-off profit from asset replacement in FY2018 :
approx. +¥3.0 bil.・Impairment loss in Fyffes Limited in FY2018 :
approx. -¥2.0 bil.
<FY2020 Current Situation>
・Supermarket chains in Japan : Stable due to increasing demand from home-meal replacement
・Real estate business : Decrease in revenue from retail facilities business
・Fresh produce business in Europe and America : Decrease in sales due to lower price in the U.S. etc.
© 2020 Sumitomo Corporation21
FY2018Results
FY2019Results
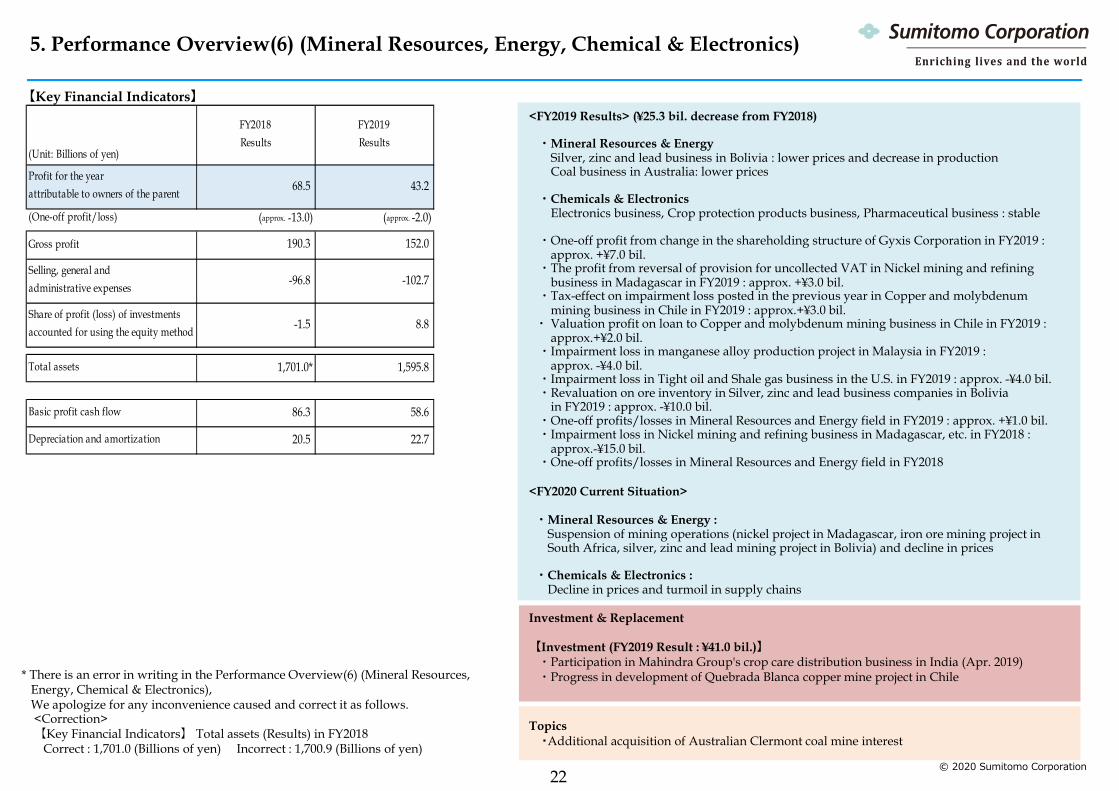
68.5 43.2
(approx. -13.0) (approx. -2.0)
Gross profit 190.3 152.0
-96.8 -102.7
-1.5 8.8
Total assets 1,701.0* 1,595.8
Basic profit cash flow 86.3 58.6
Depreciation and amortization 20.5 22.7
Profit for the yearattributable to owners of the parent
(Unit: Billions of yen)
(One-off profit/loss)
Share of profit (loss) of investmentsaccounted for using the equity method
Selling, general andadministrative expenses
【Key Financial Indicators】
Investment & Replacement
【Investment (FY2019 Result : ¥41.0 bil.)】・Participation in Mahindra Group's crop care distribution business in India (Apr. 2019)・Progress in development of Quebrada Blanca copper mine project in Chile
Topics・Additional acquisition of Australian Clermont coal mine interest
<FY2019 Results> (¥25.3 bil. decrease from FY2018)
・Mineral Resources & EnergySilver, zinc and lead business in Bolivia : lower prices and decrease in productionCoal business in Australia: lower prices
・Chemicals & ElectronicsElectronics business, Crop protection products business, Pharmaceutical business : stable
・One-off profit from change in the shareholding structure of Gyxis Corporation in FY2019 :approx. +¥7.0 bil.
・The profit from reversal of provision for uncollected VAT in Nickel mining and refining business in Madagascar in FY2019 : approx. +¥3.0 bil.
・Tax-effect on impairment loss posted in the previous year in Copper and molybdenum mining business in Chile in FY2019 : approx.+¥3.0 bil.
・ Valuation profit on loan to Copper and molybdenum mining business in Chile in FY2019 :approx.+¥2.0 bil.
・Impairment loss in manganese alloy production project in Malaysia in FY2019 :approx. -¥4.0 bil.
・Impairment loss in Tight oil and Shale gas business in the U.S. in FY2019 : approx. -¥4.0 bil.・Revaluation on ore inventory in Silver, zinc and lead business companies in Bolivia
in FY2019 : approx. -¥10.0 bil.・One-off profits/losses in Mineral Resources and Energy field in FY2019 : approx. +¥1.0 bil.・Impairment loss in Nickel mining and refining business in Madagascar, etc. in FY2018 :
approx.-¥15.0 bil.・One-off profits/losses in Mineral Resources and Energy field in FY2018
<FY2020 Current Situation>
・Mineral Resources & Energy : Suspension of mining operations (nickel project in Madagascar, iron ore mining project in South Africa, silver, zinc and lead mining project in Bolivia) and decline in prices
・Chemicals & Electronics : Decline in prices and turmoil in supply chains
5. Performance Overview(6) (Mineral Resources, Energy, Chemical & Electronics)
© 2020 Sumitomo Corporation22
* There is an error in writing in the Performance Overview(6) (Mineral Resources, Energy, Chemical & Electronics),We apologize for any inconvenience caused and correct it as follows.<Correction>【Key Financial Indicators】 Total assets (Results) in FY2018
Correct : 1,701.0 (Billions of yen) Incorrect : 1,700.9 (Billions of yen)

16.2 13.4 49.00 % Investment in Assmang iron ore and manganese mine in South Africa5.3 11.4 100.00 %
20.5 11.3 -*1 Investment in coal mines in Australia
3.3 4.1 -*1 Electronics manufacturing service and trading of electronics materials
4.0 4.0 50.00 % Trading of LNG, investment and financing related to LNG business
-2.9 3.7 13.50 % Investment in and financing of the Sierra Gorda copper mine in Chile
3.5 3.0 100.00 % Sale and trade of chemicals and plastics
2.0 2.4 100.00 % Investment in agricultural materials business in Europe
5.4 2.2 100.00 %
0.4 1.6 20.00 % Investment in the Cerro Verde copper mine in Peru
2.6 1.6 -*1
0.8 0.9 100.00 % Import of fertilizer materials and sale of chemical fertilizers in Western Australia
1.4 -4.7 100.00 % Exploration, development and production of oil and gas in the U.S.
19.5 -5.5 100.00 %
-40.3 -20.5 47.67 % Investment in and financing of the Ambatovy nickel mining project in Madagascar
2.7 -*2 30.00 % Iron ore mining business in Brazil
Shares in equity (Mar. 31, 2020)
Main Business
Silver, zinc and lead business companiesin Bolivia
SC Minerals America, Inc.
Companies related to coal business in Australia
Investment in the Morenci copper mine and the Candelaria & Ojos del Salado copper mines in Chile
Investment in silver, zinc, and lead mine operating, and ore concentrate sales companies in Bolivia
Equity in earnings
Copper and molybdenum mining businessin Chile
Development, production and sale of crude oil and natural gas in the British and Norwegian zones of the NorthSea
Iron ore mining business in Brazil
PACIFIC SUMMIT ENERGY Trading and marketing of natural gas and electric power, and the exporting business of natural gas in the U.S.
Nickel mining and refining businessin Madagascar
Sumitronics group
Sumitomo Shoji Chemicals Co., Ltd.
Companies with oil field interestsin the North SeaSummit Rural Western Australia Pty. Ltd.Tight oil and Shale gas business in the U.S.
Oresteel Investments (Proprietary) Limited
SMM Cerro Verde Netherlands B.V.
LNG Japan Corporation
FY2018Results
FY2019Results
(Unit: Billions of yen)
Sumi Agro Europe Limited
【Principal Subsidiaries and Associated Companies】
*1 Group of companies with different ratio of shares*2 We refrain from disclosing results of FY2019 due to relation with business partner.
5. Performance Overview(6) (Mineral Resources, Energy, Chemical & Electronics)
© 2020 Sumitomo Corporation23

* The shipping volume of iron ore and manganese ore of Oresteel Investments are recognized semi-annually (in the second and fourth quarter).
FY2018
Annual Q1 Q2 Q3 Q4 Annual
Equity Share ofShipping Volume[mil MT]
1.3 0.4 0.4 0.4 0.3 1.5
Prices[US$/MT] 204 204 164 141 156 166
Equity Share ofShipping Volume[mil MT]
4.7 1.2 1.4 1.7 1.6 5.9
Prices[US$/MT] 106 80 68 67 68 71
Equity Share ofShipping Volume[mil MT]
5.0 0.5 2.3 0.7 2.0 5.6
Prices[US$/MT] 69 83 100 102 89 93
Equity Share ofShipping Volume[mil MT]
0.6 - 0.3 - 0.3 0.6
Prices[US$/MT] 318 286 271 246 180 246
Equity Share ofProduction[KMT]
54 14 14 15 15 58
Prices[US$/MT] 6,526 6,220 6,114 5,798 5,888 6,005
FY2019 Results
Copper
ManganeseOre*
Iron Ore*
Thermal Coal
Coking Coal
Mineral Resources Equity Share of Production and Prices
5. Performance Overview(6) (Mineral Resources, Energy, Chemical & Electronics)
© 2020 Sumitomo Corporation24

FY2018
Annual Q1 Q2 Q3 Q4 Annual
Equity Share ofProduction[mil toz]
10.6 3.5 1.7 2.3 1.8 9.2
Prices[US$/toz] 15.4 14.9 17.0 17.3 16.9 16.5
Equity Share ofProduction[KMT]
207 55 42 57 41 196
Prices[US$/MT] 2,746 2,762 2,345 2,388 2,128 2,406
Equity Share ofProduction[KMT]
68 17 10 11 9 47
Prices[US$/MT] 2,123 1,884 2,029 2,045 1,847 1,951
Equity Share ofProduction[KMT]
16.8 4.1 4.3 4.0 4.7 17.1
Prices[US$/lb] 5.85 5.56 7.08 7.00 5.77 6.35
Equity Share ofProduction[mil boe]
2.4 0.6 0.4 0.4 0.6 2.1
Prices[US$/bbl,Brent] 72 64 68 62 63 64
LNG Equity Share ofProduction[KMT]
340 80 90 90 70 330
FY2019 Results
Crude Oil,Gas(North Sea)
Nickel
Lead
Zinc
Silver
Mineral Resources Equity Share of Production and Prices
5. Performance Overview(6) (Mineral Resources, Energy, Chemical & Electronics)
© 2020 Sumitomo Corporation25

As of Mar.31, 2019 As of Mar.31, 2020
Coking/Thermal Coal 80.0 70.0
Iron Ore 80.0 70.0
Copper 130.0 100.0
Silver, Zinc, Lead 100.0 90.0
Nickel 160.0 150.0
Crude Oil, Gas, LNG 90.0 80.0
Total 640.0 570.0
* The amount of exposure is the total of investment, loan and guarantee.
(Unit: Billions of yen)
Exposure of Upstream Mineral Resources & Energy Business
5. Performance Overview(6) (Mineral Resources, Energy, Chemical & Electronics)
© 2020 Sumitomo Corporation26

6. Supplemental Materials by Segment(Living Related & Real Estate Business Unit)
(Unit: Billions of yen)
Living Related & Real Estate
Gross profit 210.7 226.4 +15.7
Lifestyle & Retail Business Division 118.5 126.6 +8.1
Food & Agriculture Business Division 38.9 40.1 +1.2
Materials, Supplies & Real Estate Division 53.9 60.2 +6.3
Share of profit (loss) of investments accounted for using the equity method 7.6 9.3 +1.7
Lifestyle & Retail Business Division 1.4 1.5 +0.1
Food & Agriculture Business Division 2.5 2.5 -0.0
Materials, Supplies & Real Estate Division 3.7 5.3 +1.6
Profit for the year attributable to owners of the parent 42.1 51.3 +9.2
Lifestyle & Retail Business Division 6.8 7.1 +0.3
Food & Agriculture Business Division -0.8 3.6 +4.4
Materials, Supplies & Real Estate Division 36.0 40.6 +4.5
Total assets 1,243.3 1,538.4 +295.1
Lifestyle & Retail Business Division 211.1 378.8 +167.8
Food & Agriculture Business Division 320.2 331.8 +11.6
Materials, Supplies & Real Estate Division 712.6 828.2 +115.6
FY2019 Results
Increase/Decrease
FY2018 Results
27© 2020 Sumitomo Corporation
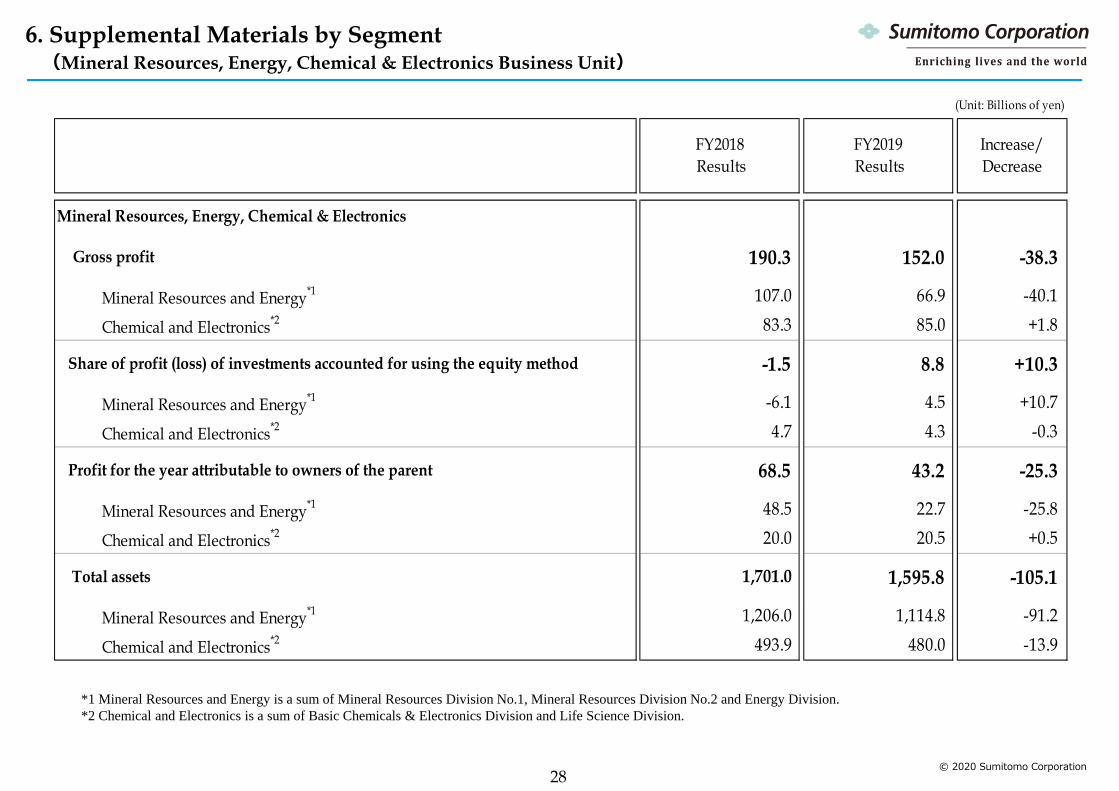
6. Supplemental Materials by Segment(Mineral Resources, Energy, Chemical & Electronics Business Unit)
*1 Mineral Resources and Energy is a sum of Mineral Resources Division No.1, Mineral Resources Division No.2 and Energy Division. *2 Chemical and Electronics is a sum of Basic Chemicals & Electronics Division and Life Science Division.
(Unit: Billions of yen)
Mineral Resources, Energy, Chemical & Electronics
Gross profit 190.3 152.0 -38.3
Mineral Resources and Energy*1 107.0 66.9 -40.1
Chemical and Electronics*2 83.3 85.0 +1.8
Share of profit (loss) of investments accounted for using the equity method -1.5 8.8 +10.3
Mineral Resources and Energy*1 -6.1 4.5 +10.7
Chemical and Electronics*2 4.7 4.3 -0.3
Profit for the year attributable to owners of the parent 68.5 43.2 -25.3
Mineral Resources and Energy*1 48.5 22.7 -25.8
Chemical and Electronics*2 20.0 20.5 +0.5
Total assets 1,701.0 1,595.8 -105.1
Mineral Resources and Energy*1 1,206.0 1,114.8 -91.2
Chemical and Electronics*2 493.9 480.0 -13.9
FY2018 Results
FY2019 Results
Increase/Decrease
28© 2020 Sumitomo Corporation

【Profit for the year attributable to owners of the parent】
Q1 Q2 Q3 Q4 Cumulative
Results
Metal Products 6.4 4.7 4.0 -65.2 -50.0Transportation &Construction Systems 11.7 9.8 13.2 -4.7 30.0
Infrastrucure 20.4 19.5 5.1 16.8 61.7Media & Digital 8.8 10.0 9.7 9.8 38.3Living Related & Real Estate 11.5 14.6 9.7 15.5 51.3Mineral Resources,Energy,Chemical & Electronics 20.9 12.3 13.7 -3.7 43.2
Total 79.6 70.9 55.5 -31.5 174.5Corporate and Eliminations 0.2 1.8 3.4 -8.4 -3.0
Consolidated 79.7 72.7 58.9 -40.0 171.4
【One-off profits/losses】
Q1 Q2 Q3 Q4Cumulative
Results
Metal Products 0.0 0.0 0.0 -67.0 -67.0Transportation &Construction Systems 0.0 0.0 0.0 -9.0 -9.0
Infrastrucure 6.0 2.0 -9.0 -1.0 -1.0Media & Digital 0.0 0.0 0.0 0.0 0.0Living Related & Real Estate -1.0 8.0 0.0 -4.0 3.0Mineral Resources,Energy,Chemical & Electronics 10.0 -2.0 3.0 -13.0 -2.0
Total 14.0 9.0 -7.0 -93.0 -77.0Corporate and Eliminations 0.0 0.0 0.0 0.0 0.0
Consolidated 14.0 9.0 -7.0 -93.0 -77.0One-off profits/losses are rounded to the nearest 1 billion.
(Unit︓billions of yen)
FY2019 Results(Unit︓billions of yen)
FY2019 Results
【Major one-off profits/losses (Annual Results)】*Underlined is related to Q4 results.
Metal Products ・Losses from impairment and write-down of inventory ,etc. in the tubular productsbusiness in North America. (approx.-60.0)・Other one-off losses, and etc.(approx.-7.0)
Transportation & Construction Systems
・Impairment losses, and etc. in TBC and Automotive manufacturing business inEurope, etc. (approx.-9.0)
Infrastructure ・One-off profits/losses from power infrastructure business, etc. (approx.-1.0)
Living Related & Real Estate ・Other one-off profits (approx.+7.0)
・Other one-off losses (approx.-4.0)
Mineral Resources,Energy, Chemical & Electronics
・One-off profit from reorganization of shareholder composition of Gyxis Corporation (approx.+7.0)
・The profit from reversal of provision for uncollected VATin Nickel mining & refining business in Madagascar (approx.+3.0)
・Tax-effect on impairment loss posted in the previous year in Copper andmolybdenum mining business in Chile (approx.+3.0)
・Valuation profit on loan to Copper and molybdenum mining business in Chile (approx.+2.0)
・Impairment loss in manganese alloy production project in Malaysia (approx.-4.0)
・Impairment loss in Tight oil and Shale gas business in the U.S. (approx.-4.0)
・Revaluation on ore inventory in Silver, zinc and lead business in Bolivia (approx.-10.0)
・One-off profits/losses in Mineral Resources and Energy field, etc. (approx.+1.0)
7. Quarterly Trend for Profit for the year attributable to owners of the parent
by Segment and One-off profits/losses (FY2019)
29© 2020 Sumitomo Corporation
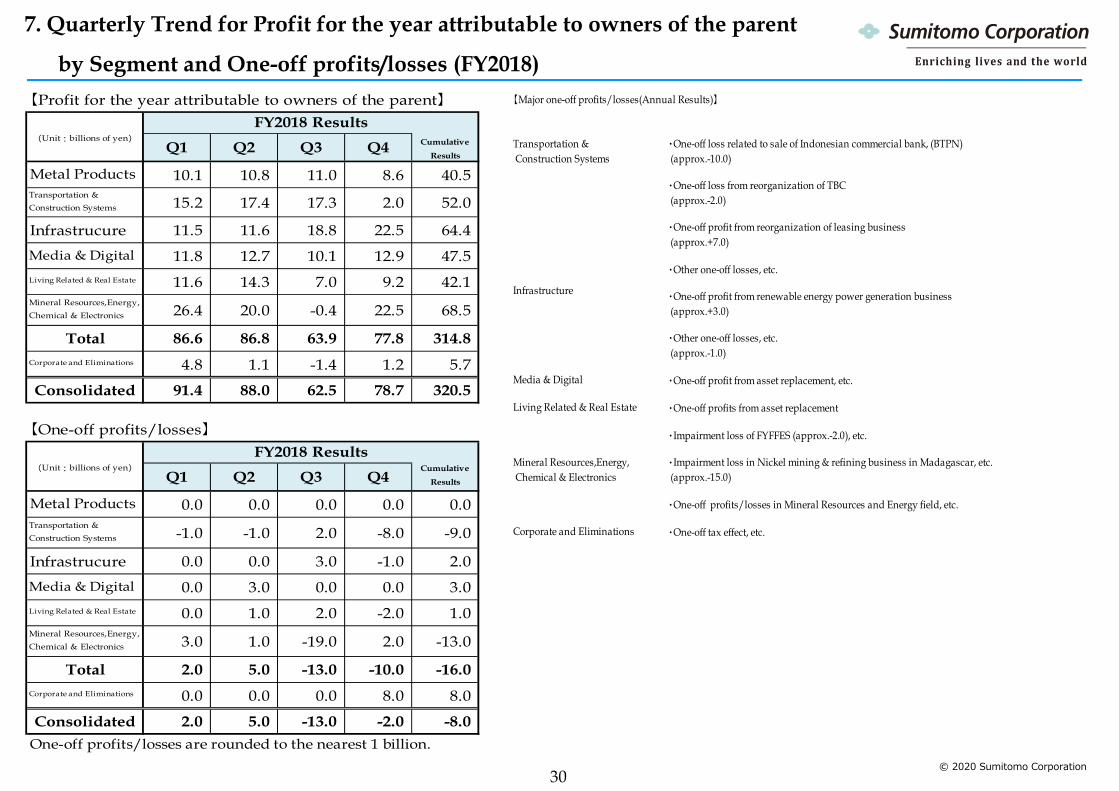
7. Quarterly Trend for Profit for the year attributable to owners of the parent
by Segment and One-off profits/losses (FY2018)【Profit for the year attributable to owners of the parent】
Q1 Q2 Q3 Q4 Cumulative
Results
Metal Products 10.1 10.8 11.0 8.6 40.5Transportation &Construction Systems 15.2 17.4 17.3 2.0 52.0
Infrastrucure 11.5 11.6 18.8 22.5 64.4Media & Digital 11.8 12.7 10.1 12.9 47.5Living Related & Real Estate 11.6 14.3 7.0 9.2 42.1Mineral Resources,Energy,Chemical & Electronics 26.4 20.0 -0.4 22.5 68.5
Total 86.6 86.8 63.9 77.8 314.8Corporate and Eliminations 4.8 1.1 -1.4 1.2 5.7
Consolidated 91.4 88.0 62.5 78.7 320.5
【One-off profits/losses】
Q1 Q2 Q3 Q4Cumulative
Results
Metal Products 0.0 0.0 0.0 0.0 0.0Transportation &Construction Systems -1.0 -1.0 2.0 -8.0 -9.0
Infrastrucure 0.0 0.0 3.0 -1.0 2.0Media & Digital 0.0 3.0 0.0 0.0 3.0Living Related & Real Estate 0.0 1.0 2.0 -2.0 1.0Mineral Resources,Energy,Chemical & Electronics 3.0 1.0 -19.0 2.0 -13.0
Total 2.0 5.0 -13.0 -10.0 -16.0Corporate and Eliminations 0.0 0.0 0.0 8.0 8.0
Consolidated 2.0 5.0 -13.0 -2.0 -8.0One-off profits/losses are rounded to the nearest 1 billion.
(Unit︓billions of yen)
FY2018 Results(Unit︓billions of yen)
FY2018 Results
【Major one-off profits/losses(Annual Results)】
Transportation & Construction Systems
・One-off loss related to sale of Indonesian commercial bank, (BTPN) (approx.-10.0)
・One-off loss from reorganization of TBC (approx.-2.0)
・One-off profit from reorganization of leasing business (approx.+7.0)
・Other one-off losses, etc.
Infrastructure ・One-off profit from renewable energy power generation business (approx.+3.0)
・Other one-off losses, etc. (approx.-1.0)
Media & Digital ・One-off profit from asset replacement, etc.
Living Related & Real Estate ・One-off profits from asset replacement
・Impairment loss of FYFFES (approx.-2.0), etc.
Mineral Resources,Energy, Chemical & Electronics
・Impairment loss in Nickel mining & refining business in Madagascar, etc. (approx.-15.0)
・One-off profits/losses in Mineral Resources and Energy field, etc.
Corporate and Eliminations ・One-off tax effect, etc.
30© 2020 Sumitomo Corporation

© 2020 Sumitomo Corporation
8. Medium-Term Management Plan 2020, Key Financial Indicators
FY2018 FY2019 (reference)Original Plans
Profit for the year(billions of yen) 320.5 171.4
ROA 4.1% 2.1% 4% or more
ROE 12.0% 6.4% 10% or more
Balance of Core Risk Bufferand Risk-weighted Assets Maintained Maintained Maintained
Investment(billions of yen) approx. 300.0 approx. 350.0 1,300.0*
Post-dividends FCF(billions of yen) 128.9 19.5 200.0*
* 3 year total
31

(Unit: Billions of yen)
(MEDIUM-TERM MANAGEMENT PLAN)
(Fiscal Year) 2010 2011 2012 2013 2014 2015 2016 2017 2018 2019Revenues 3,100.2 3,261.0 3,016.2 3,317.4 3,762.2 4,010.8 3,997.0 4,827.3 5,339.2 5,299.8Gross profit 864.0 918.8 827.0 894.4 952.9 894.1 842.7 956.5 923.2 873.7Selling, general and administrative expenses -660.7 -686.4 -657.1 -706.4 -755.2 -762.7 -693.8 -731.6 -647.6 -677.4Interest expense, net -18.1 -15.1 -15.8 -17.4 -13.0 -2.6 -1.7 -5.8 -11.6 -15.6Dividends 10.0 11.2 13.4 14.9 17.2 10.6 9.4 10.7 12.1 11.1Share of profit (loss) of investmentsaccounted for using the equity method
95.6 110.6 107.4 126.2 49.1 -53.8 83.5 149.7 127.1 84.8Gain (loss) on securities and other investments, net 9.5 14.8 51.5 8.8 12.4 72.2 12.9 27.8 2.2 20.7Gain (loss) on property, plant and equipment, net -17.6 -9.0 -5.8 -19.8 -269.2 -33.4 -19.7 -4.4 -4.0 -61.8Other, net -2.2 -3.6 -1.6 3.5 -13.0 15.8 -20.1 9.4 2.5 16.4Profit (loss) before tax 280.5 341.4 319.0 304.2 -18.6 140.1 213.1 412.3 404.0 251.9 Income tax expense -70.7 -77.7 -75.3 -70.4 -52.3 -51.5 -25.9 -78.4 -66.2 -62.4Profit (loss) for the year 209.8 263.7 243.7 233.9 -70.8 88.6 187.2 333.9 337.8 189.5Profit (loss) for the year attributable to:
Owners of the parent 200.2 250.7 232.5 223.1 -73.2 74.5 170.9 308.5 320.5 171.4 Non-controlling interests 9.6 13.0 11.2 10.8 2.4 14.0 16.3 25.4 17.3 18.2
Basic profit 220.5 251.5 216.5 245.0 184.0 46.5 193.1 308.7 320.7 222.0
(Unit: Billions of yen)
(Fiscal Year) 2010 2011 2012 2013 2014 2015 2016 2017 2018 2019Net cash provided by (used in) operating activities 219.5 190.4 280.3 278.2 243.7 599.7 345.8 295.3 268.9 326.6Net cash provided by (used in) investing activities -469.4 -35.7 -186.2 -249.9 -399.6 -85.4 -180.7 -155.8 -51.3 -203.4Free cash flows -249.9 154.7 94.1 28.4 -155.9 514.3 165.1 139.5 217.6 123.2Net cash provided by (used in) financing activities 155.9 -33.3 -24.7 145.9 -74.8 -507.2 -254.4 -229.6 -233.2 -57.7
f(x) BBBO2014 BBBO2017FOCUS'10Medium - Term
Management Plan 2020
9. Historical Data(1) PL, CF
32© 2020 Sumitomo Corporation

9. Historical Data(2) BS, Key Financial Indicators(Unit: Billions of yen)
(MEDIUM-TERMMANAGEMENT PLAN)
(Fiscal Year) 2010 2011 2012 2013 2014 2015 2016 2017 2018 2019Total assets 7,230.5 7,226.8 7,832.8 8,668.7 9,021.4 7,817.8 7,761.8 7,770.6 7,916.5 8,128.6Equity attributable to owners of the parent 1,570.5 1,689.1 2,052.8 2,404.7 2,481.4 2,251.5 2,366.5 2,558.2 2,771.5 2,544.1Interest-bearing liabilities (gross) 3,767.4 3,613.8 3,861.4 4,238.9 4,421.3 3,650.9 3,418.3 3,203.9 3,098.0 3,189.4(*)Interest-bearing liabilities (net) 3,056.3 2,786.7 2,930.3 3,123.5 3,517.5 2,770.3 2,627.9 2,521.5 2,427.1 2,468.8
Risk-weighted Assets [RA] 1,500 1,530 1,810 2,190 2,380 2,200 2,240 2,360 2,290 2,280Core Risk Buffer [RB] 1,660 1,640 1,950 2,270 2,320 2,140 2,220 2,390 2,640 2,520Balance [RB-RA] 160 110 140 80 -60 -60 -20 30 350 240
Equity attributable to owners of the parent ratio (%)
21.7 23.4 26.2 27.7 27.5 28.8 30.5 32.9 35.0 31.3
ROE (%) 12.9 15.4 12.4 10.0 -3.0 3.2 7.4 12.5 12.0 6.4ROA (%) 2.8 3.5 3.1 2.7 -0.8 0.9 2.2 4.0 4.1 2.1Debt-Equity Ratio (net) (times) 1.9 1.6 1.4 1.3 1.4 1.2 1.1 1.0 0.9 1.0
(Unit: Yen)
(Fiscal Year) 2010 2011 2012 2013 2014 2015 2016 2017 2018 2019Stock price of Sumitomo Corp. (closing price) 1,189 1,196 1,178 1,313 1,286.0 1,118.5 1,497.5 1,791.0 1,531.0 1,239.0
(highest) 1,297 1,284 1,276 1,616 1,420.0 1,513.0 1,547.0 2,043.5 1,999.5 1,801.0 (lowest) 874 875 984 1,101 1,054.0 983.5 975.5 1,398.0 1,460.0 1,137.0Nikkei stock average (closing price) 9,755.10 10,083.56 12,397.91 14,827.83 19,206.99 16,758.67 18,909.26 21,454.30 21,205.81 18,917.01Shares of common stock issued (unit: thousand) 1,250,603 1,250,603 1,250,603 1,250,603 1,250,603 1,250,603 1,250,603 1,250,603 1,250,788 1,250,985
Earnings per share attributable to owners of the parent (basic) 160.17 200.52 185.92 178.59 -58.64 59.73 136.91 247.13 256.68 137.18
f(x) BBBO2014 BBBO2017FOCUS'10Medium - Term
Management Plan 2020
33© 2020 Sumitomo Corporation
* Interest-bearing liabilities of financing for motor vehicles and rental for construction equipment related business ;61.1 billion yenInterest-bearing liabilities of project finance (non-recourse) ;135.6 billion yen

-4
-2
0
2
4
6
8
10
12
14
16
-100
-50
0
50
100
150
200
250
300
350
400
FY09 FY10 FY11 FY12 FY13 FY14 FY15 FY16 FY17 FY18 FY19
Net Income (left scale)
Total Assets (right scale)
Risk-adjusted Return ratio(mid-term plan ave., right scale)
FOCUS’10(2 year)
f(x)(2 year)
BBBO2014(2 year)
BBBO2017(3 year)
Medium-TermManagement Plan
2020(3 year)
A growth scenario on a new stage
Growth across regional, generational and
organizational boundaries
Heading for an evenhigher level of profit growth by thorough enhancement of our
earning power
To make group-wide efforts in overcoming issues and to outline a path toward the realization of “What We Aim
to Be”
Unceasing challenge for new
value creation
(billion yen) (trillion yen/%)
10. Historical Data for Medium-Term Management Plan
32
28
24
20
16
12
8
4
0
© 2020 Sumitomo Corporation 34

11.2%
11.7%
13.4%17.1%
36.0%34.1%
12.1%
9.3%
27.5%
27.9%
0%
5%
10%
15%
20%
25%
30%
35%
40%
2010/3 2011/3 2012/3 2013/3 2014/3 2015/3 2016/3 2017/3 2018/3 2019/3 2020/3
Financial Institutions (excl. Trust Banks)Other Corporations
Trust Banks
Overseas
Individual and Others
11. Shareholders’ Composition
© 2020 Sumitomo Corporation 35


