
1 | P a g e
REPORT
ON
APEDA’S PARTICIPATION IN
WORLD FOOD MOSCOW 2017
2 | P a g e
FACT SHEET
Indian Community:
Indian Community in the Russian Federation is estimated at about 30,000. In addition,
about 1,500 Afghan nationals of Indian origin live in Russia. About 500 Indian businessmen
reside in Russia out of which around 200 work in Moscow. An estimated 300 registered Indian
companies operate in Russia. Majority of Indian businessmen/companies in Russia are involved
in trading while some represent Indian banks, pharmaceuticals, hydrocarbon and engineering
companies. Tea, coffee, tobacco, pharmaceuticals, rice, spices, leather footwear, granite, I.T. and
garments are amongst the products being imported by these companies from India. There are
approximately 4,500 Indian students enrolled in medical and technical institutions in the Russian
Federation. About 90% of them pursue medical studies in about 20 universities/institutions
across Russia. Hindustani Samaj is the oldest Indian organization in Russia functioning since
1957. Other Indian organizations in Moscow include, Indian Business Alliance, Overseas Bihar
Association, AMMA (All Moscow Malayalee Association), DISHA (Indian-Russian Friendship
Society), Textile Business Alliance, Bhartiya Sanskritik Samaj, and Ramakrishna Society
Vedanta Centre. Embassy of India School in Moscow is affiliated to Kendriya Vidyalaya
Sangathan in New Delhi with teachers deputed from India. The School has classes from I to XII
and has about 350 students. This provides reason that Indian food products will continue to find
market in Russia, making them popular in the main stream population is important to export
volumes.
Indo-Russia Relations:
Russia has been a longstanding and time-tested partner for India. The development of
India-Russia relations has been a key pillar of India's foreign policy. The signing of the
“Declaration on the India-Russia Strategic Partnership” in October 2000, provided additional
impetus to bilateral ties and contributed towards the enhancement of cooperation in almost all
areas of the bilateral relationship. The strategic partnership between the two countries has
promoted the development of institutionalized dialogue mechanisms at various levels in order to
3 | P a g e
strengthen bilateral interaction and follow up on activities related to cooperation in different
areas. During the visit of the Russian President to India in December 2010, the Strategic
Partnership was elevated to the level of a “Special and Privileged Strategic Partnership.”
Under the Strategic Partnership, annual summits between the Prime Minister of India and
the Russian President take place regularly, with a view to strengthen the India-Russia partnership
further. So far, seventeen annual summits have taken place in India and Russia. The most recent
summit was held in Goa in October, 2016, where Prime Minister Modi and President Putin
adopted a Joint Statement, “Partnership for Global Peace and Stability” which resulted in 19
cooperation agreements in areas including defense, space, trade and investment, hydrocarbons
and railways.
India-Russia Trade in Last Ten Years:
Historically, India and Russia have been strong trading partners. However, over the last
five years, India’s total trade with Russia remained fairly constant at around US$ 6 billion. In
2016-17, total trade went up to US$ 7.5 billion, registering an impressive growth rate of 22 per
cent.
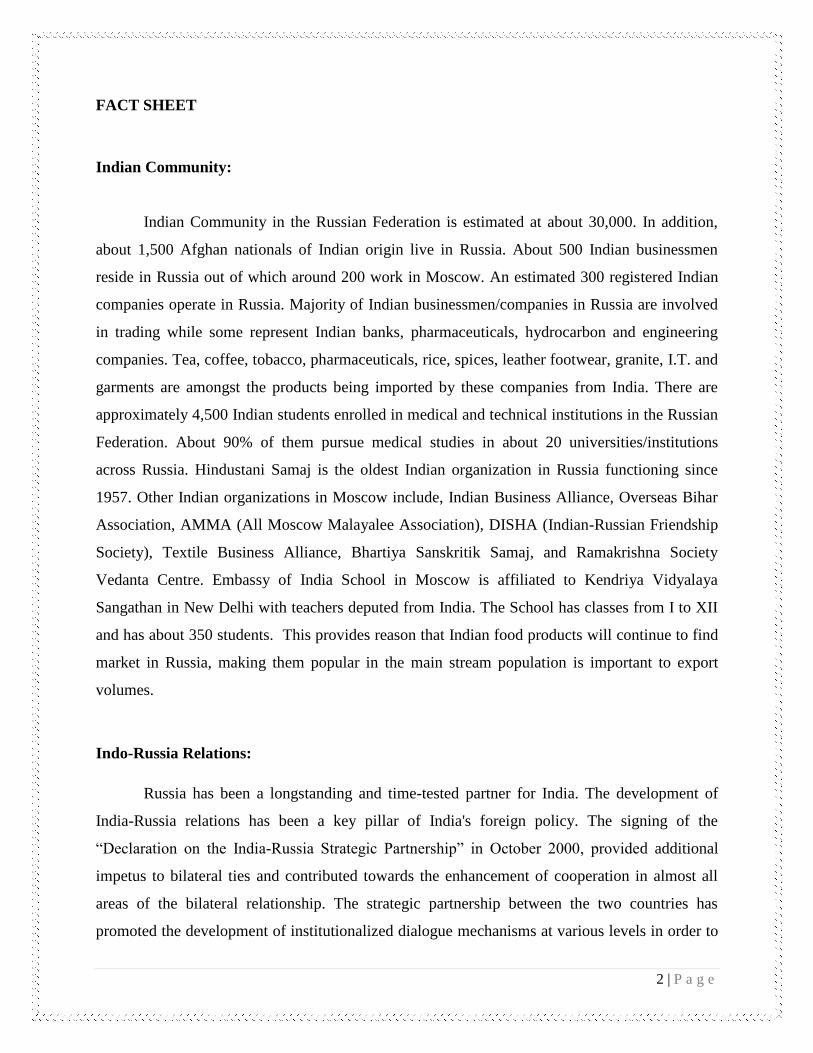
India’s exports to Russia have increased from US$ 0.94 billion in 2007-08 to US$ 1.9
billion in 2016-17 (Figure 1). Indian exports peaked during 2012-13, with total value of exports
at US$ 2.3 billion. On the other hand, Indian imports from Russia increased from US$ 2.5 billion
in 2007-08 to US$ 5.7 billion in 2016-17.
Figure 1: India’s Trade with Russia (in US$ Millions)
4 | P a g e
Major Exports and Imports:
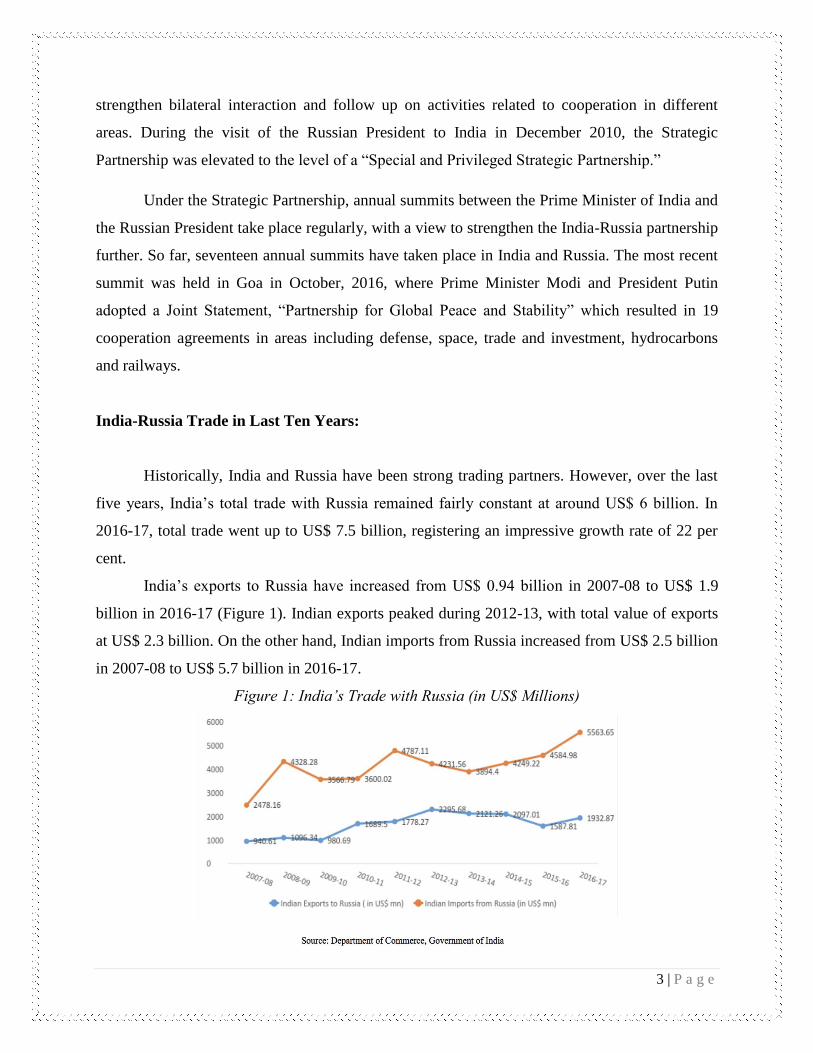
India’s trade basket with Russia is well diversified. In April-Feb 2016-17, among India’s
top imports from Russia, gems and jewellery (HS Code 71) occupied the leading position,
accounting for 45.4 per cent of the total. The other major imports included petroleum products,
fertilisers, iron and steel and paper products. The category wise percentage shares of key imports
are given below (Figure 2).
Figure 2: India’s Major Imports from Russia as % of Total Indian Imports from Russia
In the same year, the top Indian export to Russia was pharmaceutical products (HS Code
30), accounting for 18 per cent of the total Indian exports to Russia. Other key exports included
machinery and parts, beverages and spices, aircrafts and parts and organic chemicals. The
category wise percentage shares of key exports are given below (Figure 3).
Figure 3: India’s Major Exports to Russia as % of Total Indian Exports to Russia

5 | P a g e
Bilateral Investments:
The two countries are involved in numerous projects and bilateral investments. The
historic joint venture between the two countries, resulted in the world-class supersonic cruise
missile, BrahMos, for which each side made equal contributions amounting to a total of US$ 300
million. Another recent collaboration between the two has been India’s newest and largest
aircraft carrier, INS Vikramaditya, which was commissioned into the Indian Navy in November
2013.
Russia’s cumulative investments to India stood at US$ 1.2 billion for the period 2000-
2017. Russia’s state controlled oil giant Rosneft and its partners acquired India’s second largest
oil major Essar Oil for US$ 12.9 billion. Besides being India’s most important defence partner,
Russia also extends support to India for setting up of nuclear reactors.
India’s total investments in Russia, as of December 2016, are estimated to be around US$
13 billion. In recent years, Indian companies have actively invested in Russia’s oil and gas
sectors. This further propelled Indian investments in Russia significantly.

6 | P a g e
Opportunities:
There is potential for the two countries to further enhance economic ties and move
beyond a traditional buyer-seller relationship. It is important for India and Russia to significantly
enhance the private sector engagement of their industry sectors, and also to establish partnerships
for technology transfer and joint ventures in defense and nuclear energy components.
Green Corridor, International North South Transport Corridor and India EAEU FTA
could add to trade and investments.
Bilateral Trade:
Bilateral trade in 2002 stood at $1.5 billion and increased by over 7 times to $11 billion
in 2012 and with both governments setting a bilateral trade target of $30 billion by 2025. Both
Governments have jointly developed an economic strategy that involves using a number of
economic components to increase future bilateral trade. Russian imports from India amounted to
$2.4 billion or 1.3% of its overall imports, and 0.9% of India's overall exports in 2016.
Exports of APEDA scheduled products:
Exports of APEDA scheduled products to Russia have also constantly been increasing
over the past few years. The value of trade between India and Russia in FY 2016-17 reached
USD 0.42 billion from USD 0.36 billion in 2015-16 showing an increase of 14% percent. During
2016-17, India's export to Russia reached USD 0.20 billion from USD 0.15 billion, showing an
increase of 36% percent. While its import reached USD 217 million from USD 218 million in
2016-17 showing a decrease of 0.6 % percent. From Indian point of view Russia is a market
having full of opportunities for trade, development and technology transfer.

7 | P a g e
India’s Export of APEDA
scheduled products to RussiaQty. in MT; Value in US$ Mill
Product
2015-16 2016-17 2017-18 (April-June)
Qty US$ Mill Qty US$ Mill Qty US$ Mill
Guargum 14599.14 26.03 21332.27 28.00 6280.70 9.42
Groundnuts 3853.00 4.41 21017.85 22.53 7129.58 7.63
Buffalo Meat 8654.00 29.30 8948.00 27.22 2358.00 7.09
Fresh Grapes 13804.66 20.47 27354.07 41.56 4690.19 6.51
Non Basmati Rice 66771.00 24.25 77197.00 29.01 11270.18 4.44
Other Processed Fruits & Vegetables 3670.46 4.86 7574.42 9.38 3553.23 4.43
Dried & Preserved Vegetables 3936.15 8.16 4707.61 7.30 1430.55 1.78
Cucumber and Gherkins( Prepd. & Presvd) 30075.81 18.25 22212.15 13.49 2490.89 1.73
Poultry Products 16.25 0.07 1387.60 5.45 360.00 1.48
Other Fresh Vegetables 5809.00 3.12 8439.52 4.29 2028.50 1.01
Fresh Onions 3119.89 1.31 7546.61 2.44 2003.00 0.58
Pulses 488.35 0.53 255.00 0.33 196.00 0.27
Miscellaneous Preparations 108.93 0.33 181.97 0.38 88.82 0.19
Cereal Preparations 558.04 0.53 719.94 0.69 162.77 0.14
Albumin( Eggs & Milk ) 32.00 0.35 42.00 0.25 24.00 0.14
Alcoholic Beverages 130.11 0.26 33.60 0.13 27.40 0.12
Basmati Rice 1661.71 1.49 4136.48 3.35 82.00 0.09
Fresh Mangoes 0.45 0.00 7.19 0.01 15.79 0.05
Jaggery & Confectionery 172.95 0.17 404.43 0.25 14.08 0.05
Other Fresh Fruits 2098.04 1.73 1374.69 1.65 22.31 0.03
Other Products 670.31 1.09 1175.88 1.58 7.78 0.06
Total 160230.25 146.71 216048.28 199.29 44235.77 47.24
Source: DGCIS
Russia’s Export of APEDA
Scheduled products to India
Source: DGCIS
Qty In MT; Value in US$ Mill
Product2015-16 2016-17 2017-18 (April-June)
Qty US$ Mill Qty US$ Mill Qty US$ Mill
Pulses 503490.34 217.57 392273.47 182.04 58546.99 21.30
Miscellaneous Preparations 206.69 0.44 234.13 0.21 21.04 0.10
Alcoholic Beverages 30.47 0.24 44.48 0.78 55.91 0.09
Cereal Preparations 100.00 0.04 0.00 0.00 0.00 0.00
Fruits & Vegetables Seeds 0.00 0.00 0.00 0.00 0.00 0.00
Other Cereals 0.00 0.00 4762.00 0.96 0.00 0.00
Other Processed Fruits & Vegetables 0.00 0.00 0.03 0.00 0.00 0.00
Wheat 1064.53 0.29 153102.00 33.17 0.00 0.00
Total 5,04,892.03 218.58 5,50,416.11 217.16 58623.94 21.49
8 | P a g e
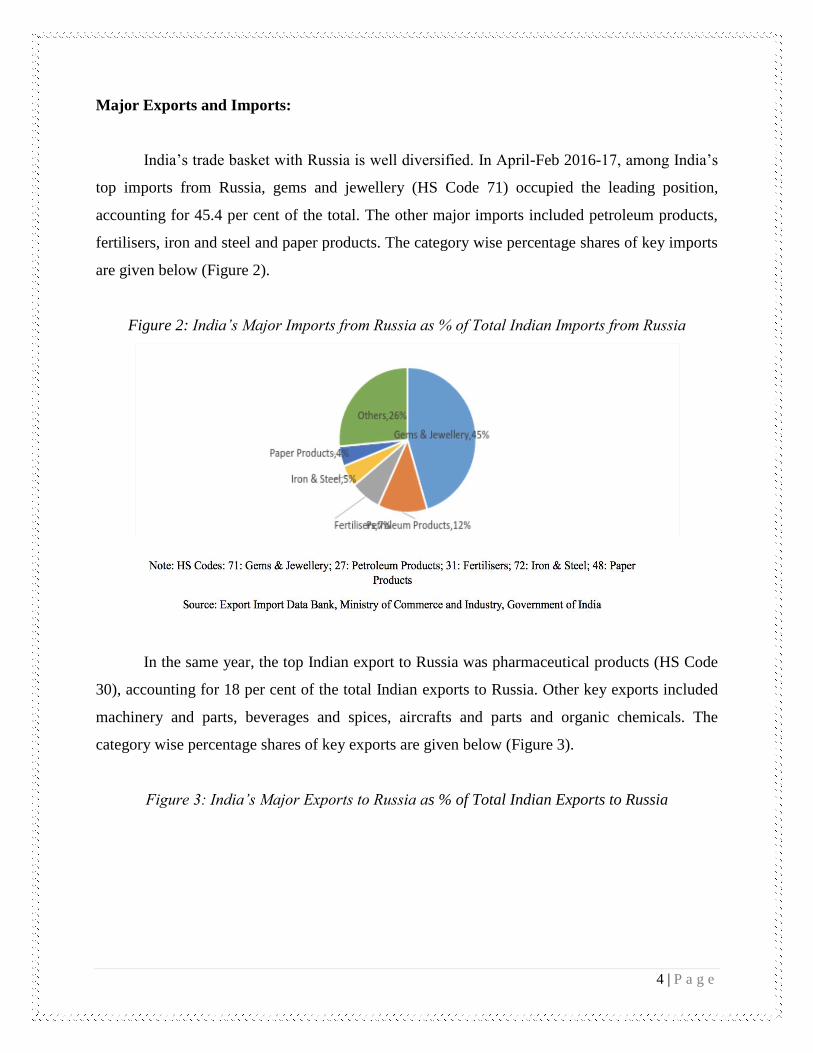
Major Exporting Countries of
Agriculture products to RussiaQty In MT, Value in US$ Mill
2013 2014 2015
S. No. Exporting Country Qty Value Qty Value Qty Value
1. Belarus 1422615.42 2676.37 1936137.27 3263.46 1760798.12 2462.86
2. Brazil 951149.35 2267.33 507471.31 2002.05 1028847.99 1827.27
3. Turkey 1219246.18 1577.27 1415583.58 1486.94 1466940.87 1273.57
4. Ecuador 1315184.14 1209.8 1136112.52 893.45 1294980.7 1111.39
5. China 1228131.66 1150.45 1335267.82 1213.97 1236268.98 1096.48
6. Germany 563878.69 1625.85 401474.1 1143.49 256151.11 617.33
7. The Netherlands 695177.5 1702.52 630504.83 1573.75 221799.28 574.94
8. Italy 517890.81 1232.43 310393.01 696.49 255792.11 553.92
9. Argentina 409715.26 677.03 328082.56 623.31 333397.58 512.71
10. France 449514.7 1341.74 537020 955.62 188413.52 511.21
11. Paraguay 154286.04 659.7 143664.77 587.26 115671.15 395.57
12. Egypt 434649.06 355.03 614443.72 437.96 694859.18 364.41
13. Morocco 332433.85 345.68 304971.76 301.89 463352.7 341.34
14. Poland 1428702.37 1513.14 713459.31 779.03 195566.82 322.62
15. Spain 662342.68 1135.91 390172.99 561.22 251083.39 312.89
16. Serbia 158668.56 201.13 252541.18 356.63 320918.94 312.26
17. Israel 349151.59 422.2 308880.23 317.89 358099.46 311.51
18. Ukraine 1129808.37 1815.64 584685.52 875.9 257798.9 283.19
19. Chile 210562.54 337.21 142825.56 205.14 162773.6 266.66
20. Azerbaijan 288564.68 275.77 290843.33 294.19 287780.29 264.55
21. United Kingdom 112506.54 522.06 618191.11 1046.04 83382.62 257.76
22. South Africa 302896.95 318.71 238266.15 233.36 343670.55 256.92
23. U.S.A. 411485.95 906.36 356205.99 849.03 49968.91 224.54
24. Cote D Ivoire 0 0 0 0 51081.18 190.96
25. Iran 213777.23 248.26 187719.93 196.86 191114.89 179.37
26. Kazakhstan 1058606.48 335.45 638599.59 249.04 478070.66 173.09
27. Georgia 141310.67 167.84 227073.65 282.09 164068.22 167.3
28. India 117048.68 122.44 231238.81 176.93 169427.91 158.54
Source: DGCIS
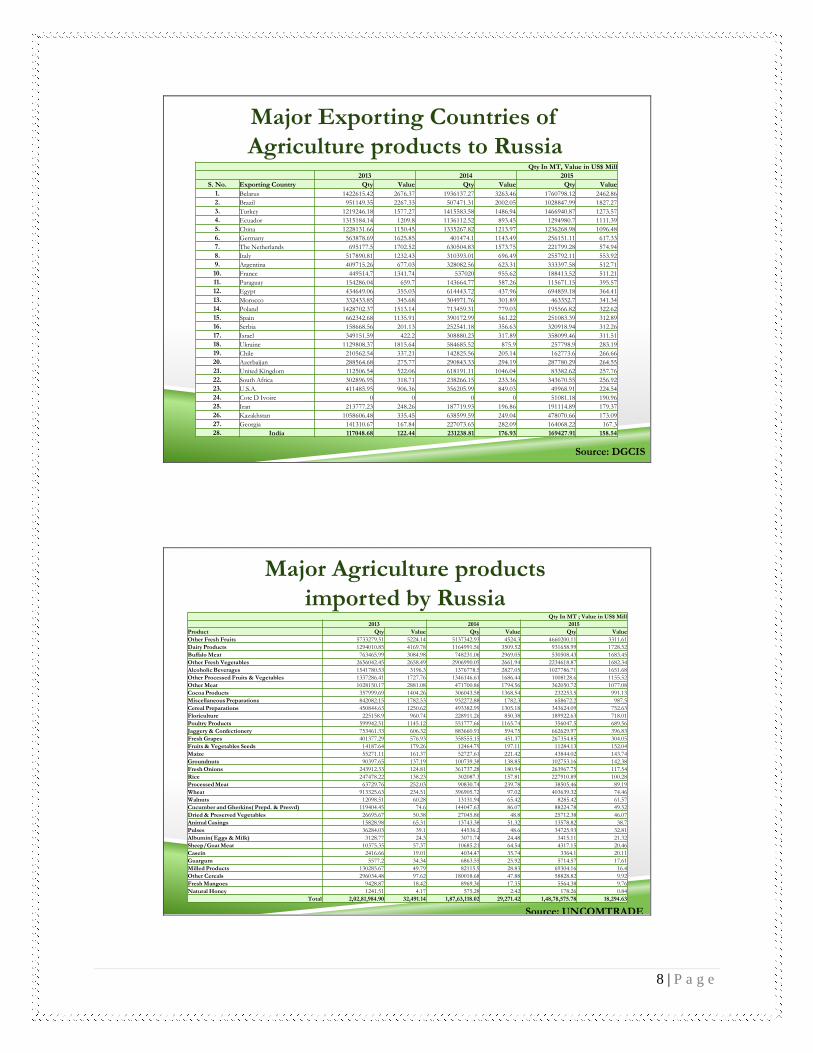
Major Agriculture products
imported by Russia
Source: UNCOMTRADE
Qty In MT ; Value in US$ Mill
2013 2014 2015
Product Qty Value Qty Value Qty Value
Other Fresh Fruits 5733279.51 5224.14 5137342.93 4524.3 4660200.11 3311.61
Dairy Products 1294010.85 4169.78 1164991.56 3509.52 931658.99 1728.52
Buffalo Meat 763465.99 3084.98 748231.06 2969.05 530508.43 1683.45
Other Fresh Vegetables 2656042.45 2658.49 2906990.05 2661.94 2234618.87 1682.34
Alcoholic Beverages 1541780.53 3196.3 1376778.5 2827.05 1027786.71 1651.68
Other Processed Fruits & Vegetables 1337286.41 1727.76 1346146.61 1686.44 1008128.6 1155.52
Other Meat 1028150.17 2881.08 471700.86 1794.56 362050.72 1077.08
Cocoa Products 357999.69 1404.26 306043.58 1368.54 232253.5 991.13
Miscellaneous Preparations 842082.15 1782.53 932272.88 1782.3 658672.2 987.5
Cereal Preparations 450844.63 1250.62 493382.99 1305.18 343624.09 752.63
Floriculture 225158.9 960.74 228911.26 850.38 189922.63 718.01
Poultry Products 599942.51 1145.12 551777.66 1165.74 356047.5 689.56
Jaggery & Confectionery 753461.33 606.32 883660.91 594.75 662629.97 396.83
Fresh Grapes 401377.29 576.93 358555.15 451.37 267354.85 304.05
Fruits & Vegetables Seeds 14187.64 179.26 12464.79 197.11 11284.13 152.04
Maize 55271.11 161.37 52727.61 221.42 43844.02 143.74
Groundnuts 90397.65 137.19 100739.38 138.85 102753.16 142.38
Fresh Onions 243912.33 124.81 361737.28 180.94 263967.75 117.54
Rice 247478.22 138.23 302087.3 157.81 227910.89 100.28
Processed Meat 63729.76 252.03 90830.74 239.78 38505.46 89.19
Wheat 913325.63 234.51 396905.72 97.02 403639.32 74.46
Walnuts 12098.51 60.28 13131.94 65.42 8285.42 61.57
Cucumber and Gherkins( Prepd. & Presvd) 119404.45 74.6 144047.63 86.07 88224.78 49.52
Dried & Preserved Vegetables 26695.67 50.38 27045.86 48.8 25712.38 46.07
Animal Casings 15828.98 65.31 13743.38 51.32 13578.82 38.7
Pulses 36284.03 39.1 44536.2 48.6 34725.93 32.81
Albumin( Eggs & Milk) 3128.77 24.3 3071.74 24.48 3415.11 21.32
Sheep/Goat Meat 10375.35 57.37 10685.21 64.54 4317.15 20.46
Casein 2416.66 19.01 4034.47 35.74 3364.1 20.11
Guargum 5577.2 34.34 6863.55 25.92 5714.57 17.61
Milled Products 130285.67 49.79 82115.9 28.83 69304.16 16.4
Other Cereals 296034.48 97.62 180018.68 47.88 58828.82 9.92
Fresh Mangoes 9428.87 18.42 8969.36 17.35 5564.38 9.76
Natural Honey 1241.51 4.17 575.28 2.42 178.26 0.84
Total 2,02,81,984.90 32,491.14 1,87,63,118.02 29,271.42 1,48,78,575.78 18,294.63
9 | P a g e
Both governments have long viewed their bilateral trade well below its optimal potential,
with the only long term way of rectifying this through having a Free trade agreement (FTA). It
is predicted once an FTA is in place bilateral trade will increase manifold, thereby significantly
increasing the importance of economics in bilateral ties.
Russia a 43-billion market:
Russia imported $43 billion worth food items in 2013-14, a large number of which have
been covered by the ban. India accounts for less than 1 per cent of Russia’s total imports and has
been eyeing its agriculture market for long.
Quality certification issues are the major hindrance Indian food exporters have been
facing in the Russian market. But, with the Russian Government eager to explore alternative
markets, it might not remain a stumbling block.
Talks are going on with Russia’s Federal Service for Veterinary and Phytosanitary
Surveillance for quick inspection of facilities in order to increase exporting meat and egg
products and start milk products.
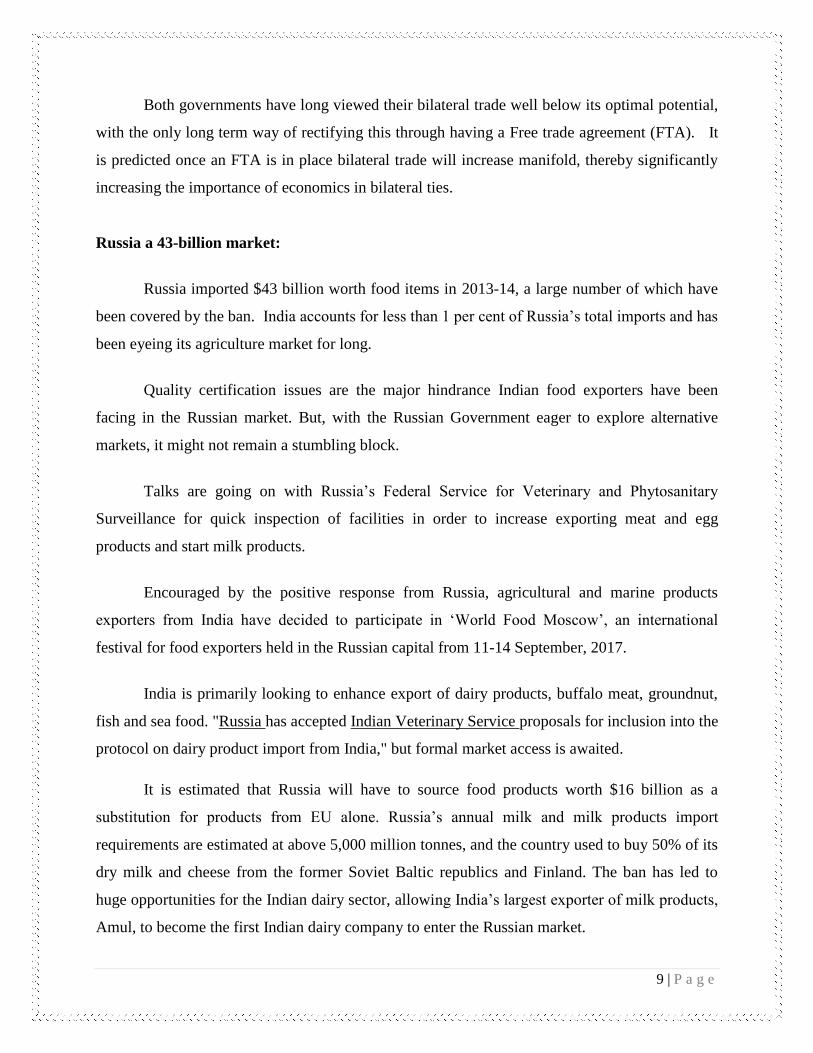
Encouraged by the positive response from Russia, agricultural and marine products
exporters from India have decided to participate in ‘World Food Moscow’, an international
festival for food exporters held in the Russian capital from 11-14 September, 2017.
India is primarily looking to enhance export of dairy products, buffalo meat, groundnut,
fish and sea food. "Russia has accepted Indian Veterinary Service proposals for inclusion into the
protocol on dairy product import from India," but formal market access is awaited.
It is estimated that Russia will have to source food products worth $16 billion as a
substitution for products from EU alone. Russia’s annual milk and milk products import
requirements are estimated at above 5,000 million tonnes, and the country used to buy 50% of its
dry milk and cheese from the former Soviet Baltic republics and Finland. The ban has led to
huge opportunities for the Indian dairy sector, allowing India’s largest exporter of milk products,
Amul, to become the first Indian dairy company to enter the Russian market.
10 | P a g e
About the Exhibition:
APEDA participated in 26th
Edition of World Food Moscow 2017, an international event
for the food and drinks industry. It was a 4 day event being held from 11th
September to 14th
September 2017 at the Expocentre in Moscow, Russia. The exhibition is a prominent meeting
place and a vibrant source of products for the Russian market that attracted a huge audience of
wholesalers, distributors, retailers and restaurateurs.
This event showcased products that covered all the sectors of the food industry. For the
convenience of the exhibitors and visitors, the exhibition was divided into eleven specialised
sectors: Meat and Poultry, Fish and Seafood; Fruit and Vegetables; Confectionery and Bakery;
Groceries; Oils, Fats and Sauces; Frozen Production; Preservation; Dairy; Tea and Coffee; and
Drinks etc. in the Food & Beverage industry.
This year there was foreign participation in the show where more than 1500 companies
from various countries participated in the exhibition. The four day show recorded more than
30,000 visitors. More than 65 Indian companies participated in the exhibition this year.

11 | P a g e
This year APEDA facilitated participation of IOPEPC and participated under one India
pavilion and where APEDA had taken an area of 120 sqm. and IOPEPC an area of 90 sqm. An
aesthetically designed and attractive India Pavilion was set up at common space for the different
food items from India, which was greatly appreciated by the exporters and the visitors and was
attraction for everyone. The India Pavilion, was premiere with colourful and vibrant ambience
accompanied by pleasant exotic aromas of Indian Food.

12 | P a g e
Participants:
Around 33 Indian companies participated in the exhibition under APEDA and IOPEPC
banner and showcased a wide range of agro and food products, Dehydrated Vegetables, Peanuts,
Rice, Organic, Processed Foods etc. and highlighted India’s export potential in these sectors.
The exhibition provided an ideal opportunity to exporters from India to partner with Russian
companies to work together.
S. No. Exporters participated under APEDA banner:
1. M/s. Kosher Food Industries
2. M/s. Maahir Industries
3. M/s. Bhalala Foods Pvt. Ltd.
4. M/s. Shreeji Dehydrate Export
5. M/s Sky Agri Export
6. M/s. G. S. Exports
7. M/s. Shree Shantmohanam Peanuts
8. M/s. Organic Products India
9. M/s. Agricom Impex
10. M/s. Fuletra Agro Food
11. M/s. Sheetal Universal Limited
S. No. Exporters participated under IOPEPC banner:
1. M/s. Agro Impex
2. M/s. Deepkamal Exports Pvt Ltd
3. M/s. Jayant kumar & CO.
4. M/s. H. Bheda & CO.
5. M/s. Olam Agro India Pvt. Ltd
6. M/s.Ghanshyam Traders
7. M/s. HNS (V.P & Sons)
8. M/s. Dhirajlal Premchand & Bros
9. M/s. Gujarat Peanut Products Pvt Ltd
10. M/s. Sterling Exports Inc.
11. M/s. S M International
12. M/s. Agro Impex

13 | P a g e
Inauguration of India pavilion:
India pavilion was inaugurated by Head Economics and Commerce, Embassy of India,
Mr. Inbasekar and spent a time in APEDA pavilion. The efforts put in by APEDA and
Exhibitors were appreciated by him.
Biryani tasting campaign:
APEDA also carried Biryani tasting campaign of Indian Basmati Rice, aroma of which
attracted great number of footfall of visitors to APEDA pavilion.

14 | P a g e
Importer Exporter Interaction:
An Importer Exporter Interaction was also organised by HE Ambassador of India, Mr.
Pankaj Saran where exporters participated under the aegis of APEDA and IOPEPC along with
Tea exporters and others participated which according to them was great experience, especially,
for those exporters visiting there for the first time.
A visit to Food City in the Moscow was also arranged for the exporters.
India Tea Evening was organised at Four Seasons Hotel, Moscow on 12th September 2017
– Presentation of 5 teas from India was made:
Darjeeling Tea: Picked from North Indian high mountains. Light delicious flowery taste
Nilgiri Tea: Picked from South India. Bright strong classic taste
Assam Tea: Picked from Indian state of Assam , from valley of Brahmaputra river. Malty honey
taste. Good for Russian taste.

15 | P a g e
Kangra Tea: Picked from picturesque valley of Kangra in Himachal Pradesh. First place in
India where tea was cultivated Very rare taste with historical importance.
Sikkim Tea: Picked from hill state of Sikkim. Very romantic. Light and beautiful on tongue.

16 | P a g e
Trade Enquiries
S No.
Importer Name Address World food Moscow Products
1 Mr. Maril Krutova
Head of external relations and logistic
M/s. Russian Trade nad Industry Corporation
Off. 447, Myasnitskaya str.
47 Moscow,101000, Russia ‘Tel.(495)6073873
Mob. +7(909)6314503
E-mail: [email protected]
Milk & milk
Products
milk Powder,
Cheese
2 Mr. Tamara Maric Tecnologist
M/s. Elmar Essential oils
UL. Sjeverni logor bb. 89 101
Trebinje Bosnia & Herzegovina
Tel/Fax +38759225218
Mob:+38765467954
E-mail: [email protected]
Herbals Organic
3 Mr. Burhan Makhmadiev
Head of Import/Export Department
M/s. Food Art Nut & Dried Fruits
Food art llc.129343,Moscow
14 Serebryakova passage,
block -15 office-2
Business Center silver stone
Tel: +7(499)7077176,(495)7787176
E-mail: [email protected]
Peanuts sesame
Spice
4 Mr. Halilovic Mejra GM
M/s. Liliya Essential Oil
Obala 27, llijas,
Bosnia
Tel: +38733403244
Mob: + 38761901830
E-mail: [email protected]

17 | P a g e
5 Mr. S.M. Abbas
Director
M/s. ACS Logistics
Ozernaya h.42,
119361, Russia
Tel :+7495792-1885
Mob:+7903792-1885
E-mail: [email protected]; [email protected]
6 Mr. Hamed Fadhil
Regional Sales Manager
M/s Golden Seed
A:cite 1200 logs,
Residence el bahdja btb n06 bab ezouar 126024 Algiers.
Tel:+21323924554
Fax: +21323924559
Mob: +213778116659
Whatsapp +971558423008
E-mail: [email protected]
Seed
7 Mr. Mohamed Maatalla
M/s Expert foncier Interprete de Russe
Mob:+213(0)0793.969.168 ; 213(0)698.699.122
Email: [email protected]; [email protected]
8 Mr. Jude Rubera Dip. M.Micm(UK)
GM Export
M/s Ceylon Biscuits Limited
P.O. Box 03, Pannipitya,
Sri Lanka
Tel +94 11 5000000 Ext:1051 +94 11 2855056/5000051
Fax +94 11 2857202
Mob: +94 777 289933
E-mail: [email protected]
Confectionery
9 Mr. Renat Bederdinov
Development Department Manager
M/s. Food City
142770, building 10,
-km kaluzhskoe highway,
Russia
Tel:+7(495)9844000.ext.7364
Mob:+7(968)3956376
E-mail: [email protected]

18 | P a g e
10 Mr. Natalia Bammatova
M/s. Euro Fresh Distribution
51 rue Albert camus-BP
20131-Agen-France
Tel: + 33553 778 370
Fax: + 33 553 778 371
Pierre Escodo: port.+34661 324 134
E-mail: [email protected];
Fresh Foods
11 M/s. Nut Vinograd
10958 r.
Moscow, Russia
Tel: +8 (926) 344-89-40
E-mail: [email protected]
Grapes
12 Mr. Vitaly Krutov
Vice President
M/s. Russian Trade and Industry Corporation
Appt.340, Myasnitskaya str. 47
Moscow, 101000, Russia
E-mail: [email protected]
Tel: +(495)6073873
Fax: +(495)6077402
Mob: +7(968)7280433
Milk & milk
Products
milk Powder,
Cheese
13 Mr. Jitender Tiwari
M/s. Hi Vegie
450071, P6
Tel :+7347 248 -49-25 ,79276350-008
E-mail: [email protected]
Vegetable Frozen,
fresh been , other
Products
14 Mr. Sunil
M/s Shennun
Tel:+7(499)641-04-15
Mob: +8968-665-33-90
E-mail: [email protected]; www.shennun-tea.ru
Tea spice
15 Mr. Maria Krotova
Head of External Relations & Logistic
M/s Russian Trade and Industry Corporation
Off. 447, Myasnitskaya str. 47
Moscow,101000, Russia
Tel: +(495)6073873
Mob: +7(909)6314503
E-mail: [email protected]
Milk & milk
Products
milk Powder,
Cheese
19 | P a g e
16 M/s. Attayebat Company for food Industries LLc.
M/s. Al Mwaqer Development Zone
630759 Amman
11163 Jordan
Tel: +962 6 4610 418
Fax: +962 6 4610 420
E-mail: [email protected]
Potato Powder
17 Mr. Asgar
Pakistan
Whatsapp: +89180409490
Mob: +89856667889
Onion/ Potato

20 | P a g e
Annexure
RUSSIA FACT SHEET
Basic Data
OFFICIAL NAME Russian Federation (Rossiyskaya Federatsiya)
AREA 17,075,400 KM2. (Russia is the largest country of
the world in terms of territory)
[India: 3,287,263 KM2]
POPULATION 143.7 million (2014)
(India: 1.26 billion)
SEX RATIO (Number of females per 1000 males)
Russia India 1163 940
LIFE EXPECTANCY
(Years)
69 65
GDP Absolute
(US$ trillion)
Per Capita
(US $)
Per Capita
(PPP)
(US $)
Russia 1.861 12, 735 25,636
India 2.067 1,630 5,833 (World Bank -2014)
ETHNIC COMPOSITION Russians (82.6%), Tatars (3.6%), Ukrainians
(2.7%), Chuvash (1.2%), Dagestanis (1%),
Bashkirs (0.9%) and others (8%)
LANGUAGE Russian and local languages
CURRENCY Ruble; 1 Ruble = 100 Kopeks
Approximate Exchange Rate: USD1 ≈ 60 Russian
Rubles
(1 Russian Ruble is approximately 1.1 Indian
Rupees)
TIME IST -2.5 hrs in Moscow and St. Petersburg; Russia
has 11 time zones from IST- 3.5.5 hrs to IST+6.5
hrs
Political System
FORM OF STATE Federal state, with Presidential form of
government. A new constitution was adopted after
a national vote on December 12th
1993.

21 | P a g e
NATIONAL LEGISLATURE Two-chamber legislature: the Lower House, the State
Duma, has 450 elected deputies and has a term of five
years; and the Upper House, the Federation Council,
has 170 appointed deputies, two from each of the 85
republics and regions. The present Chairman of the
State Duma is Mr. Sergey Naryshkin. The present
Chairman of the Federation Council is Ms. Valentina
Matviyenko.
HEAD OF STATE President is the Head of State. Under the amended
Constitution, the President is elected for a six-year
term. Present President is Mr. Vladimir Putin, who was
sworn in office for his third (not consecutive) term on
May 7, 2012.
NATIONAL GOVERNMENT Prime Minister is appointed by the President, and other
members of the Government are appointed by President
on the advice of Prime Minister. Present Prime Minister
is Mr. Dmitry Medvedev.
ELECTORAL SYSTEM Universal direct suffrage over the age of 18. In the
election in 2011, all 450 seats in the Duma were elected
from party lists in a single nationwide constituency on a
proportional basis. The minimum threshold for a party
to get parliamentary representation is 5% of the votes
polled nationally.
NATIONAL ELECTIONS Recent: December 4, 2011 (Parliamentary); March 4,
2012 (Presidential); September 14, 2014 (Regional
elections); September 13, 2015 (Regional elections)
MAIN POLITICAL PARTIES The main parties are: United Russia Party (URP), the
largest party with 238/450 seats in the State Duma; the
Communist Party of the Russian Federation (CPRF);
Just Russia Party; and the Liberal Democratic Party of
Russia (LDPR)
Indo-Russia Trade Figures
KEY STATISTICS
Financial Year Imports from Russia Exports to Russia Total Trade
2000 1.08 0.55 1.63
2005 2.31 0.78 3.09
2010 6.39 2.14 8.53
2011 6.09 2.79 8.89
2012 7.91 3.04 10.95
2013 7.01 3.10 10.11
2014 6.34 3.17 9.51


