
APL APOLLOQ3 FY20 Results
1
Safe Harbour
Except for the historical information contained herein, statements in this presentation and the subsequent
discussions, which include words or phrases such as "will", "aim", "will likely result", "would", "believe", "may", "expect", "will
continue", "anticipate", "estimate", "intend", "plan", "contemplate", seek to", "future", "objective", "goal", "likely", "project",
"should", "potential", "will pursue", and similar expressions of such expressions may constitute "forward-looking
statements“. These forward looking statements involve a number of risks, uncertainties and other factors that could
cause actual results to differ materially from those suggested by the forward-looking statements. These risks and
uncertainties include, but are not limited to our ability to successfully implement our strategy, our growth and
expansion plans, obtain regulatory approvals, our provisioning policies, technological changes, investment and
business income, cash flow projections, our exposure to market risks as well as other risks. The Company does not
undertake any obligation to update forward-looking statements to reflect events or circumstances after the date
thereof.
2
Year till date 9MFY’20
APL Apollo Overview
Financial Performance
Core Competence
Key Takeaways
Annexure
Contents
3

YEAR TILL DATE9M FY’20

Q3 FY’20 at a Glance
4.8 lac ton
Volume
52% yoy increase
40%
Market share in structural steel
tube sector as at 30 Sept’ 19
FY19 was 36%
25.5 lac ton
Capacity as at 31 Dec’ 19
20.7%
ROCE as at 31 Dec’ 19
Acquisitions and new
capacity yet to yield results
28 days
Net Working Capital as at 31
Dec’ 19
FY19 was 34 days
Operating cash flows
FY19 operating cash flows
were ₹ 3,576 Mn
BrandingMass branding kick
started
790+ Distributors
Distribution expansion
remains key focus area
1,100+
Products
Continuous focus on
new product addition
₹ 1,652 Mn
EBITDA
164% yoy increase
₹ 742 Mn*
Net profit
475% yoy increase
₹ 3,440
EBITDA/ ton
73% yoy increase
₹ 2,590 Mn
5
* Excluding non-controlling interest of Rs 89.9m

Slight
improvement in
demand
Evident from our sales
volume growth
Company focused on
market share gains and
launch of value added
products
Macro environment
remains tough
Q3 FY’20 Highlights
Margin recovery
Better capacity utilization
levels led to operating
leverage gains
Focus on increased sale of
value added products
Benefits from branding
exercise started to be
visible
Strong balance
sheet
Debt of APL Apollo
(excluding Apollo Tricoat)
declined by Rs1.1bn to Rs7bn
in 9MFY20
Consolidated debt also
declined by Rs480m QoQ to
Rs8.1bn
D/E ratio improved to 0.6x
from 0.9x in 9MFY20
6
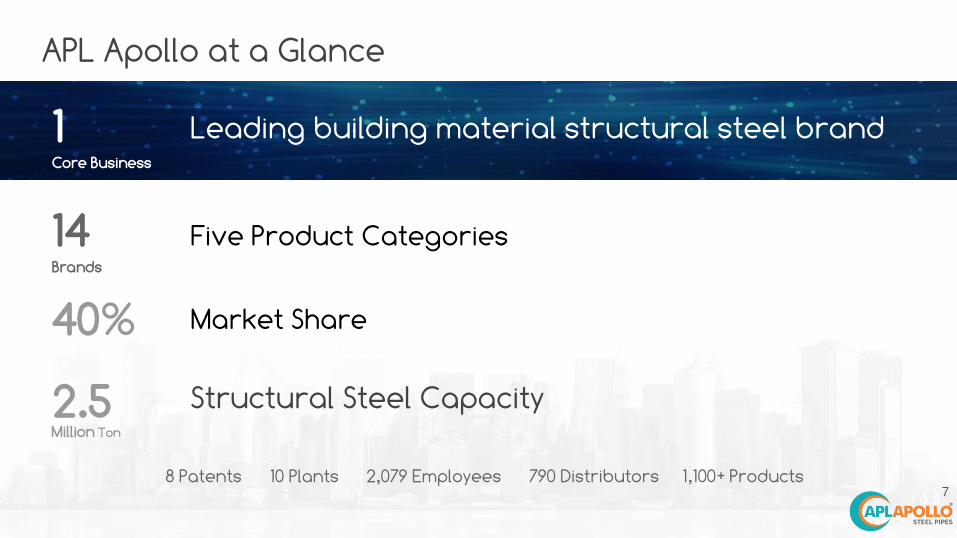
APL Apollo at a Glance
1Core Business
14 Brands
40%
2.5 Structural Steel Capacity
8 Patents 10 Plants 2,079 Employees 790 Distributors 1,100+ Products
Million Ton
Leading building material structural steel brand
Five Product Categories
Market Share
7

68% Building Material 32% Infrastructure & Others
Our Brands
Fabritech, Build, DFT
CoastGuard
Green, Bheem, StrenX
FireReady, Agri
Tricoat, Plank, Signature, Elegant, Chaukhat
8
Apollo StructuralStructural steel construction material:
Residential, Commercial, Infrastructure
Apollo ZGalvanized structural steel construction material:
Residential, Commercial, Infrastructure
Apollo BuildGalvanized structural steel construction material:
Residential, Commercial, Infrastructure
Apollo Standard
Construction material, Industrial
Apollo Tricoat
Home improvement applications
Pro
du
ct
Ca
teg
ory
*
*Apollo Structural -Hollow Section, Apollo Z- Pre Galvanized (GP), Apollo Build – Galvanized (GI), Apollo Standard – Black Pipes

Brand Equity
9

Brand Equity
10

790+ Distributors – Solid Relationships, Incentive plans
B2C Channel
50,000+ Retailers – Retailer bonding program
100,000+ Fabricators – Apollo Connect Bonding Programs, Fabricator meets to promote APL Apollo Brand
End Customer Connect– Indian Premier League, Football, Kabaddi League. Amitabh Bachchan Campaign, TV Commercials, Radio, Social Media
Distributors
Retailers
Fabricators
End Consumer
11

FINANCIAL PERFORMANCE

Growing Strength to StrengthPAT (Rsm)Volume (000’s Ton)
EBITDA (Rsm) EBITDA/Ton (Rs)
13
315
418389
364
480
Q3 FY19 Q4 FY19 Q1 FY20 Q2 FY20 Q3 FY20
625
1,416 1,295
766
1,652
Q3 FY19 Q4 FY19 Q1 FY20 Q2 FY20 Q3 FY20
1,985
3,384 3,335
2,104
3,440
Q3 FY19 Q4 FY19 Q1 FY20 Q2 FY20 Q3 FY20
129
617
518 551
742
Q3 FY19 Q4 FY19 Q1 FY20 Q2 FY20 Q3 FY20

Growing Strength to StrengthDebt to EBITDA (x)Operating Cash flow (Rsm)
Debt to Equity (x) Net debt (Rsm)
14
2.6
2.2
1.8 2.0 2.1
1.7
FY 15 FY 16 FY 17 FY 18 FY 19 9MFY20
1.0
1.2
0.8 0.9 0.9
0.6
FY 15 FY 16 FY 17 FY 18 FY 19 9MFY20
4,630
6,492 5,957
7,683 8,103 8,081
FY 15 FY 16 FY 17 FY 18 FY 19 9MFY20
2,067
-543
2,370
34
3,576
2,590
FY 15 FY 16 FY 17 FY 18 FY 19 9MFY20
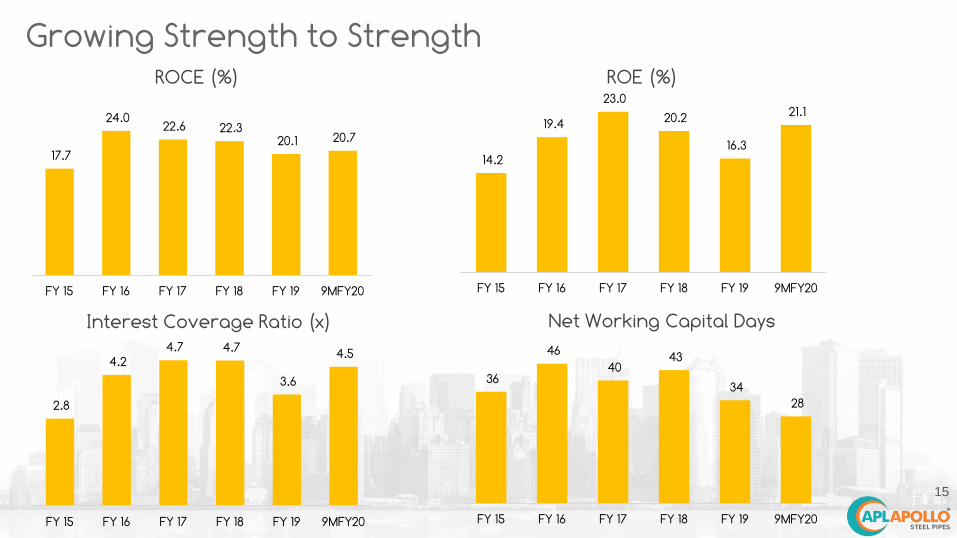
Growing Strength to StrengthROE (%)ROCE (%)
Net Working Capital DaysInterest Coverage Ratio (x)
15
17.7
24.0 22.6 22.3
20.1 20.7
FY 15 FY 16 FY 17 FY 18 FY 19 9MFY20
2.8
4.2 4.7 4.7
3.6
4.5
FY 15 FY 16 FY 17 FY 18 FY 19 9MFY20
36
46
40 43
34
28
FY 15 FY 16 FY 17 FY 18 FY 19 9MFY20
14.2
19.4
23.0
20.2
16.3
21.1
FY 15 FY 16 FY 17 FY 18 FY 19 9MFY20

Growing Strength to StrengthParticulars FY15 FY16 FY17 FY18 FY19 9MFY20
Apollo Structural
Volume (000’s tons) 249 426 475 614 766 682
Revenue (Rsm) 10,541 14,744 17,971 26,380 37,469 28,592
EBITDA (Rsm) 525 1,008 1,223 1,616 1,798 1,475
Apollo Standard
Volume (000’s tons) 170 194 151 164 198 163
Revenue (Rsm) 7,115 6,554 5,590 6,925 9.473 6.716
EBITDA (Rsm) 236 322 268 261 271 213
Apollo Z
Volume (000’s tons) 148 159 189 241 283 240
Revenue (Rsm) 7,555 6,701 8,727 12,431 16,213 12,006
EBITDA (Rsm) 695 842 1,075 1,372 1,572 1,263
Apollo Build
Volume (000’s tons) 91 115 117 111 92 74
Revenue (Rsm) 4,674 4,838 5,393 5,766 5,273 3,767
EBITDA (Rsm) 357 526 578 543 402 308
Apollo Tricoat
Volume (000’s tons) - - - - - 75
Revenue (Rsm) - - - - - 3,827
EBITDA (Rsm) - - - - - 442
Total Revenue* (Rsm) 31,274 34,138 38,680 53,213 71,533 54,908
Total EBITDA* (Rsm) 1,862 2,919 3,328 3,790 4,045 3,701
PAT (Rsm) 638 1,006 1,461 1,581 1,483 1,811**16
Particulars FY18 FY19 9MFY20
Apollo Structural DFT (Part of Apollo Structural)
Volume (000’s tons) 153 321 267
Revenue (Rsm) 6,644 15,772 11,340
EBITDA (Rsm) 466 958 712
*Some contribution from sale of scrap and trading sales
** Excludes non-controlling interest of Rs140mcom

Consolidated Financial Performance
P&L (Rsm) Q3FY20 Q3FY19 9MFY20 9MFY19 FY19
Sales Volume (000s Ton) 480 314 1,233 921 1,339
Revenue 21,205 16,944 58,486 50,671 71,640
EBITDA 1,652 624 3,713 2,630 4,045
EBITDA/Ton 3,440 1,981 3,012 2,851 3,020
Depreciation 262 157 704 470 643
Interest 281 271 832 844 1,134
Tax 277 68 225 450 787
Net Profit 832 129 1,952 865 1,482
Minority Interest 90 0 141 0 -
Actual Net Profit 742* 129 1,811 865 1,482
ROCE (%) 20.7 20.1
ROE (%) 21.1 16.317
* Excluding non-controlling interest of Rs 89.9m

Financial Performance (Excluding Apollo Tricoat)
P&L (Rsm) Q3FY20 Q3FY19 9MFY20 9MFY19 FY19
Sales Volume (000s Ton) 433 314 1,158 921 1,339
Revenue 18,915 16,944 54,538 50,671 71,640
EBITDA 1,367 624 3,259 2,630 4,045
EBITDA/Ton 3,157 1,981 2,814 2,851 3,020
Depreciation 235 157 653 470 642
Interest 258 271 804 844 1,134
Tax 22 68 13 450 787
Net Profit 652 129 1,671 865 1,482
ROCE (%) 18.5 17.6
ROE (%) 19.5 16.5
18

EBITDA Growth QoQ (Excluding Apollo Tricoat)
19
₹ 609m
₹ 1,367m
EBI
TD
A
Q2FY20 Q3FY20
Incremental sales volume of 96,612 ton
Operating leverage gains
Better product mix with increased sale of Apollo Z and Apollo Build products
Better demand scenario after dull Q2FY20
₹ 1,808/ton
₹ 3,157/ton
CORECOMPETENCE

Most products with 1,100 SKUs
Lowest cost producer (largest buyer of HR coil)
Premium pricing to peers
(brand strength)
Technology edge & Innovation
Our Business Moat...
HighestProfitability
Highest scale with 11 plants
(2.5Mn ton capacity)
Largest sales network
(790 distributors)
21

Dominant Leadership
Peer Market Share FY19 APL’s Market Share (%)
Capacity (Mn Tons)Number of Plants
Source: Company data and Industry research
* 1 Plant has been consolidated and converted into a warehouse
29 2832
3640
FY 16 FY 17 FY 18 FY 19 1H FY20
40%
12%9%
7%
32%APL Apollo
Player 2
Player 3
Player 4
Others
22
67 7
1110
FY 16 FY 17 FY 18 FY 19 9MFY20
1.3 1.3
1.82.1
2.5
FY 16 FY 17 FY 18 FY 19 9MFY20

Unique Capabilities
Developed structural
steel
market in India
Technology Distribution
network
Innovative
products
First Mover advantage
No.1 Leader; Focused on
steel strength and
building material
applications
Direct Forming Technology
for big structural products
In-line Galvanizing to
replace traditional
products
B2C channel for last
mile penetration
Roofing solutions,
Door & window frame
Ground breaking
solutions
Roofing solutions for
coastal market, door
frame
23

KEY TAKEAWAYS

Financial Priorities under Strong Governance
Growth
•Profitable Organic Growth
•EPS accretive strategic acquisitions
•Commitment to R&D and Talent
Earnings
•Drive sustainable EPS growth
•Attain earnings objectives across
economic cycles
•ROCE ≥ 25%
Capital Allocation
•Focus on Free Cash Flow Generation
•Sound Leverage and Working Capital Ratio
•Consistent dividend payouts to shareholders 25

Solid Future OutlookSufficient capacity for 20% annual
sales volume growth
Three focus areas: Cash flows and profitability
• Improving EBITDA/ton
• Improving free cash flows
• ROCE enhancement
Launch high-margin new products
Add more distributors and penetrate into new markets
Solidifying APL Apollo brand
Growth in exports and OEM led by DFT technology based products
26

ESG Initiatives
Social
Committed to impart skill
development and employment
Recruitment of rural youth for local
sales operations
Funds for education, healthcare and
community infrastructure
development projects for
marginalized communities
Made contribution to: Prime
Minister’s National Relief Fund for
Education of Poor Children, World
Hope Foundation, U.P. Science Centre
and Bharat Lok Shiksha Parishad
Association in compliance to the
provisions of Companies Act, 2013
relating to Corporate Social
Responsibility
Governance
No pledge of promoter shares
Deloitte for statutory audit and Ernst
& Young for internal audit
5 non-executive board members out
of 8
Environment Mapping energy consumption trends to
achieve energy optimisation
benchmark
Target to equip all the units and
buildings with rooftop solar panels
Achieved 20% reduction in wastages
through operational efficiency
Water recycling already in practice
Increasing the greenery cover around
all plants
Coil stacking system to enhance safety
guidelines and flexibility of operations
Installed effluent treatment plants for
the prevention of water pollution
27

Solid Management
Neeru Abrol26 Yr experience in SAIL | Director at TCNS Clothing Co
Limited & others|Awarded best achiever by ICAI
Abhilash Lal3 decades of professional experience in senior roles
across financial services including banking, PE & others
Anil Kumar BansalDirector of NABARD, Rockland Finesto Ltd & others
4 decades of experience in banking industry
Directors (Non Executive)
Virendra Singh JainBoard member of Dalmia Bharat Ltd|
Ex-Chairman of SAIL|Ex-Executive Director at IOC
Sanjay GuptaChairman & Managing Director
Romi SehgalDirector
Executive Team
P.K. SinghExecutive Director
Deepak GoyalChief Finance Officer
Anubhav GuptaChief Strategy Officer
Vinay GuptaDirector
Ashok Kumar GuptaSteel industry veteran with 4 decades of experience
Worked as MD in APL Apollo in the past
28
Arun AgrawalChief Operating Officer

ANNEXURE

Detailed P&L Statement (without Apollo Tricoat)
Particulars (Rsm) Q3 FY20 Q3 FY19Y-o-Y
Chg (%)9MFY20 9MFY19
Y-o-Y Chg (%)
Net Sales 18,869 16,912 11 54,404 50,582 7
Total Income From Operations (Net) 18,869 16,912 54,404 50,582
Other Income 46 32 43 135 89 51
Total Income 18,915 16,944 11 54,538 50,671 7
Total Expenditure 17,547 16,320 7 51,279 48,041 6
Raw Material expenses 15,829 15,257 3 46,719 44,894 4
Employee benefits expense 336 259 29 969 793 22
Other expenses 1,382 804 71 3,591 2,354 52
EBITDA 1,367 624 119 3,259 2,630 23
EBITDA margin (%) 7.2 3.7 6.0 5.2
Finance Costs 258 271 -4 804 844 -4
Depreciation and Amortization 235 157 49 653 470 38
PBT 874 196 346 1,803 1,315 37
Tax expense 222 68 226 132 450 -70
PAT 652 129 405 1,671 865 93
PAT Margins (%) 3.4 0.8 3.1 1.730

Thank You
For further information, please contact:
Anoop Poojari
CDR India
Tel: +91 9833090434
Email: [email protected]
Deepak Goyal/Anubhav Gupta
APL Apollo Tubes Ltd
Tel: +91 120 404 1400/ 1452
Email: [email protected]


