Tarancon et al. Application of a free parameter model to plastic scintillation samples.
APPLICATION OF A FREE PARAMETER MODEL TO PLASTIC SCINTILLATION SAMPLES
Alex Tarancón Sanz1, Hector Bagan1, Karsten Kossert2, Ole Nähle2
1 Departmento de Química Analitica de la Universidad de Barcelona. Spain2 Physikalisch-Technische Bundesanstalt (PTB). Braunschweig. Germany
LSC conference. Paris. France. 6-10 September 2010

Tarancon et al. Application of a free parameter model to plastic scintillation samples.
Plastic Scintillation microspheresSolid solution of a fluorescence solute in a polymeric solvent.
Applications. Continuous detector. Scintillation support for selective extractative compounds. Scintillation reagent for measure of salty samples. . In general alternative to LSC as does not produces mixed wastes.
Behavior. Similar to LSC for high energetic beta emitters. Different to LSC for low energetic beta emitters and alpha emitters.

Tarancon et al. Application of a free parameter model to plastic scintillation samples.
Main differences between PS and LS are based on the different path of the particle in the aqueous media before it reaches the scintillator
Plastic scintillation Liquid scintillation
Objective: Application of a free parameter model to PS samples
• Determine a theoretical model valid to PS samples• Evaluate the effect of micelles in Liquid Scintillation
Tarancon et al. Application of a free parameter model to plastic scintillation samples.
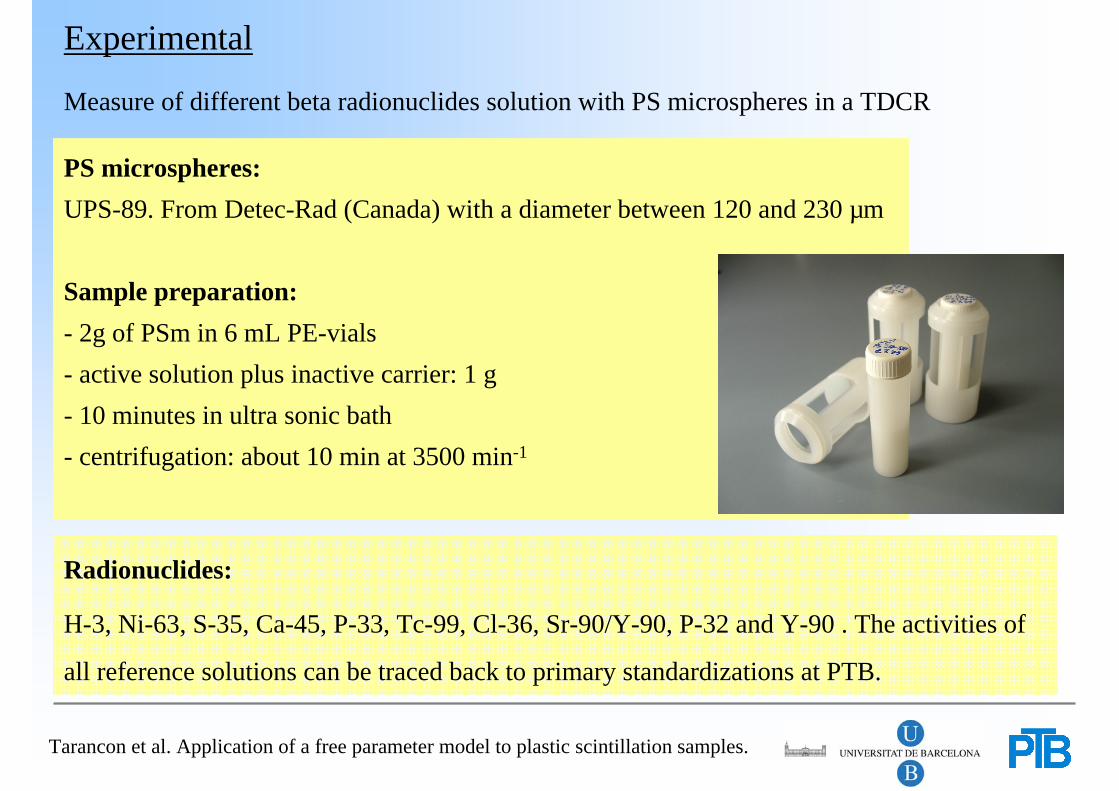
PS microspheres: UPS-89. From Detec-Rad (Canada) with a diameter between 120 and 230 µm
Sample preparation:- 2g of PSm in 6 mL PE-vials- active solution plus inactive carrier: 1 g- 10 minutes in ultra sonic bath- centrifugation: about 10 min at 3500 min-1
Experimental
Measure of different beta radionuclides solution with PS microspheres in a TDCR
Radionuclides:
H-3, Ni-63, S-35, Ca-45, P-33, Tc-99, Cl-36, Sr-90/Y-90, P-32 and Y-90 . The activities of
all reference solutions can be traced back to primary standardizations at PTB.
Tarancon et al. Application of a free parameter model to plastic scintillation samples.
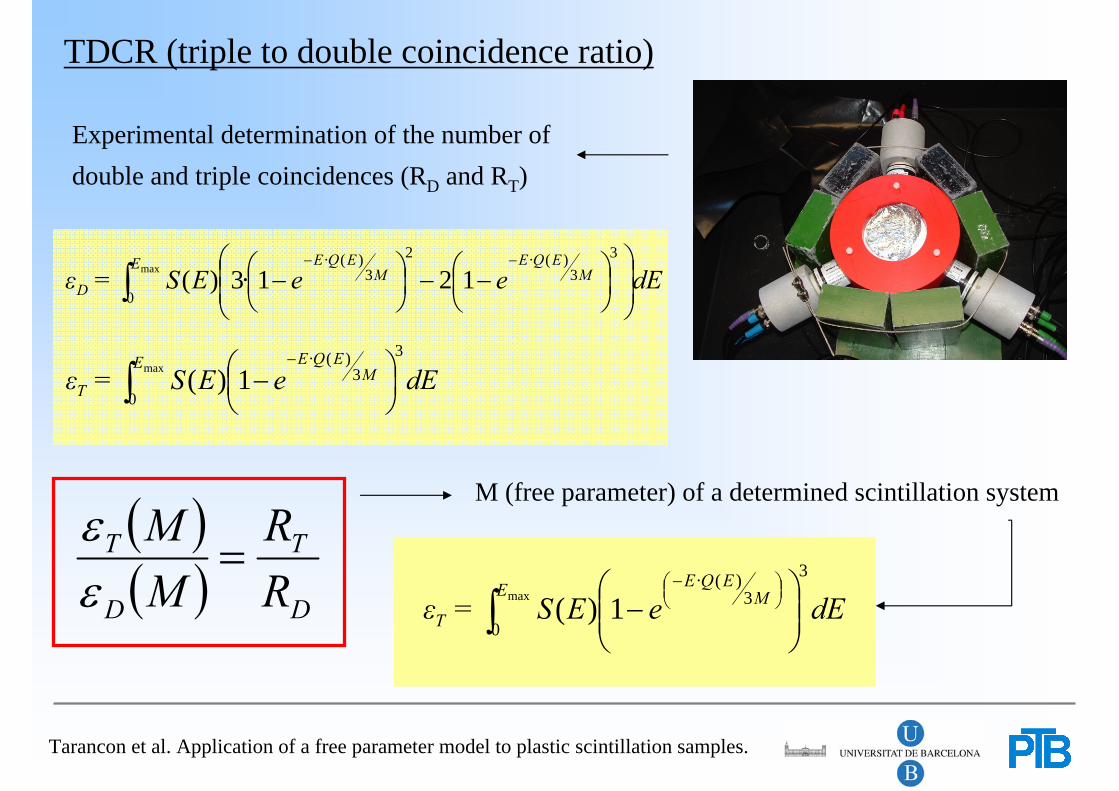
TDCR (triple to double coincidence ratio)
Experimental determination of the number of double and triple coincidences (RD and RT)
dEeES=εE
MEQE
T ∫ ⎟⎠⎞
⎜⎝⎛ −
−max
0
33
)(·1)(
dEeeES=εE
MEQE
MEQE
D ∫ ⎟⎟⎠
⎞⎜⎜⎝
⎛⎟⎠⎞
⎜⎝⎛ −−⎟
⎠⎞
⎜⎝⎛ −
−−max
0
33
)(·23
)(·121·3)(
( )( ) D
T
D
T
RR
MM
=εε
M (free parameter) of a determined scintillation system
dEeES=εE M
EQE
T
3
0
3)(·
max 1)(∫ ⎟⎟⎠
⎞⎜⎜⎝
⎛−
⎟⎠⎞⎜
⎝⎛ −
Tarancon et al. Application of a free parameter model to plastic scintillation samples.
RadionuclideMaximum
Energy (keV)
TDCRReference Activity(kBq/g)
Calculated activity(kBq/g)
Deviation (%)
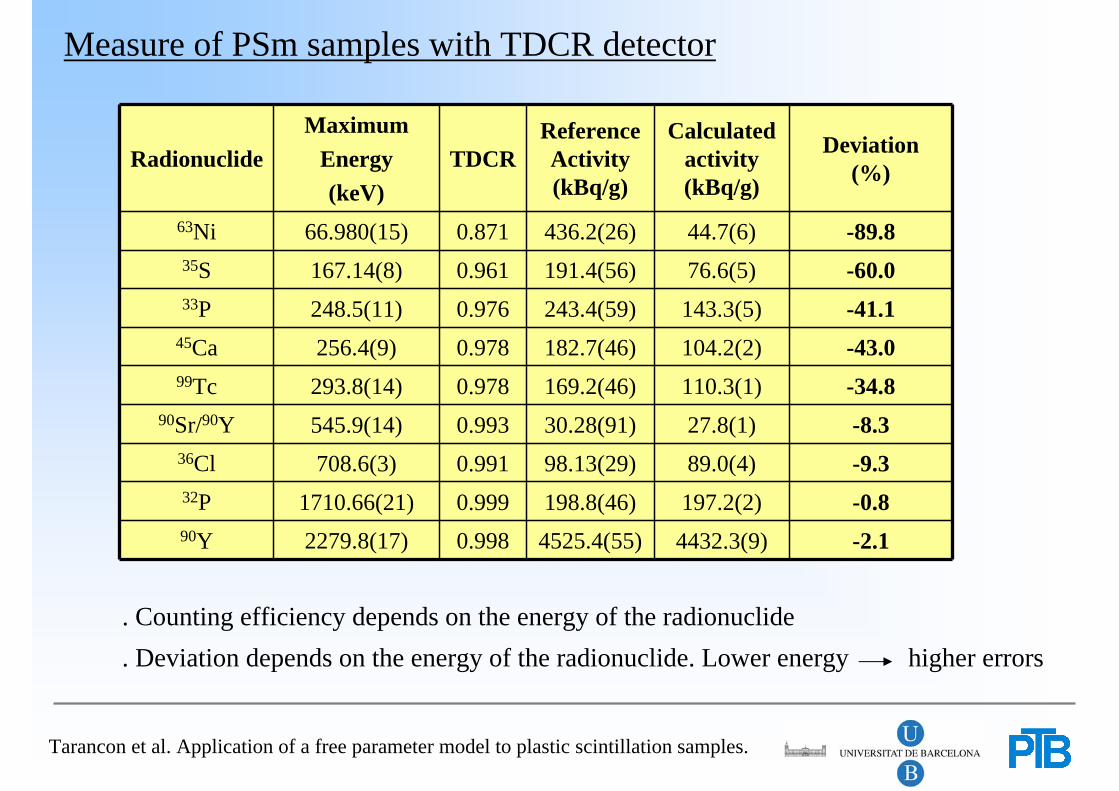
63Ni 66.980(15) 0.871 436.2(26) 44.7(6) -89.835S 167.14(8) 0.961 191.4(56) 76.6(5) -60.033P 248.5(11) 0.976 243.4(59) 143.3(5) -41.1
45Ca 256.4(9) 0.978 182.7(46) 104.2(2) -43.099Tc 293.8(14) 0.978 169.2(46) 110.3(1) -34.8
90Sr/90Y 545.9(14) 0.993 30.28(91) 27.8(1) -8.336Cl 708.6(3) 0.991 98.13(29) 89.0(4) -9.332P 1710.66(21) 0.999 198.8(46) 197.2(2) -0.890Y 2279.8(17) 0.998 4525.4(55) 4432.3(9) -2.1
. Counting efficiency depends on the energy of the radionuclide
. Deviation depends on the energy of the radionuclide. Lower energy higher errors
Measure of PSm samples with TDCR detector

Tarancon et al. Application of a free parameter model to plastic scintillation samples.
)()( ' ESES ≈
1),,,( =zyxEP i
The energy (E’) of the particle when
reaching the scintillator is similar to
that of the initial particle (E)
All the particles reach the scintillator
dEM
EQEES=εE
T
3
0
max
3)(·exp1)(∫ ⎥⎦
⎤⎢⎣
⎡
⎭⎬⎫
⎩⎨⎧−−
Mechanism overview in LS
Tarancon et al. Application of a free parameter model to plastic scintillation samples.
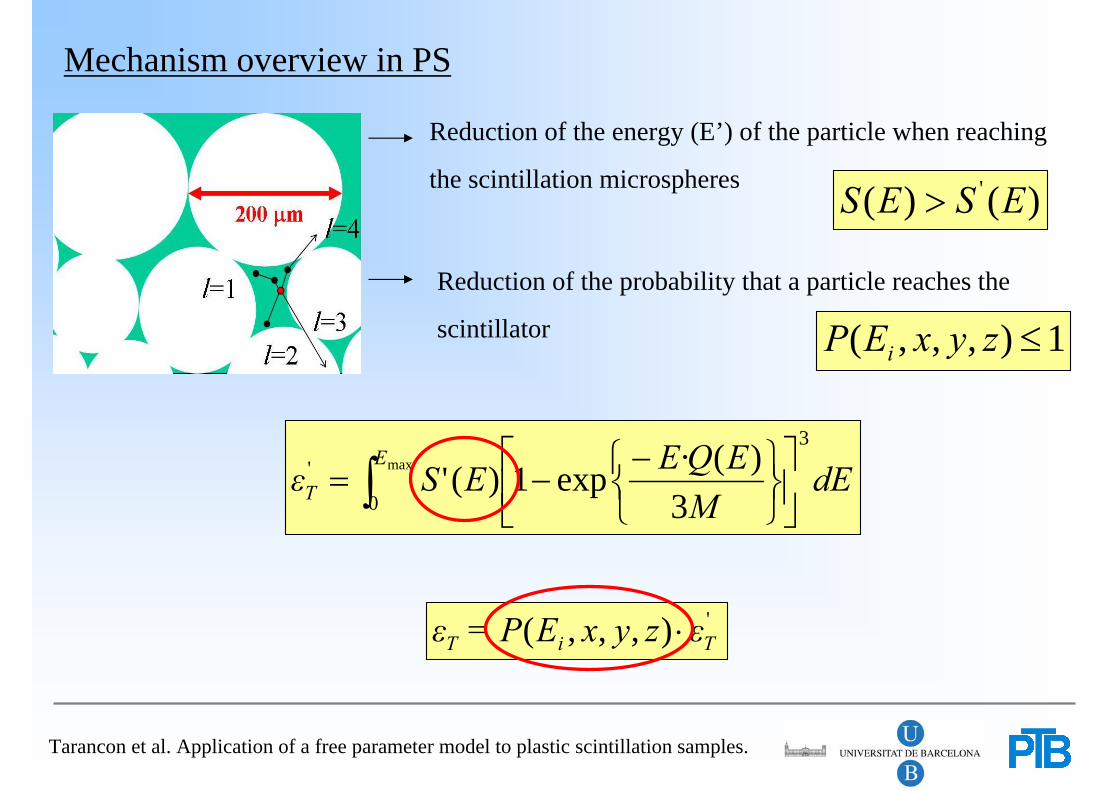
'),,,( TiT εzyxEP=ε ⋅
)()( ' ESES >
1),,,( ≤zyxEP i
Reduction of the energy (E’) of the particle when reaching
the scintillation microspheres
Reduction of the probability that a particle reaches the
scintillator
Mechanism overview in PS
dEM
EQEESεE
T
3
0
' max
3)(·exp1)('∫ ⎥⎦
⎤⎢⎣
⎡
⎭⎬⎫
⎩⎨⎧−−=

Tarancon et al. Application of a free parameter model to plastic scintillation samples.
)(ES
Geometry
of the detection system(unit cell of 1mm3 filled with
polyethylene spheres with
radius of 87.8 µm and water)
Penelope Monte Carlo
simulation software
Simulation conditions
Absorption energies (50 eV), Elastic scattering parameters (0.05), Collisional and radiative energy cutoffs (50 eV), Number of simulations (2·10-5). Particle random location in water material. Particle is relocated into the cell when escapes. Particle is only detected once.
)(' ES
1),,,( ≤= zyxEPP ireach
Monte Carlo simulation of the electron track in the aqueous phase (Penelope package)

Tarancon et al. Application of a free parameter model to plastic scintillation samples.
SP (52.36%) BCCP (68.02%) CP (74.05%)HCP (74.05%)
Geometry description
Ideal Geometries (cell of 1mm3 filled with polystyrene spheres with radius of 87.8 µm and water)
0
2
4
6
8
10
12
14
16
18
80 100
120
140
160
180
200
220
240
260
280
300
320
340
360
Diameter in µm
Prob
abili
ty in
%
. Mean radius: 87.8 ± 28.0 µm
. Degree of space filled: 60-66%

Tarancon et al. Application of a free parameter model to plastic scintillation samples.
• Sphere radius was selected following the probability size distribution
• The spheres are located in a random free position into the cell
• The spheres are move in the Z, X and Y axis.
Random geometries (cell of 1mm3 filled with polyethylene spheres and water)
• AL1(59.4 ± 0.9 %)
• AL2(62.3 ± 0.9 %)
• Sphere radius was selected following the probability size distribution
• The spheres are located in the position with lowest Z axis value
• The spheres are move in the Z, X and Y axis.
• AL3(60.8 ± 0.5 %)
• Sphere radius was 87.8 µm
• The spheres are located in the position with lowest Z axis value
• The spheres are move in the Z, X and Y axis.
0
2
4
6
8
10
12
14
16
18
80 100
120
140
160
180
200
220
240
260
280
300
320
340
360
Diameter in µm
Prob
abili
ty in
%

Tarancon et al. Application of a free parameter model to plastic scintillation samples.
Preach
AL1(n=3)
AL2(n=3)
AL3(n=3)
PS(n=1)
BCCP(n=1)
HCP(n=1)
CCP(n=1)
63Ni 8.0 ± 0.1 8.7± 0.6 9.2± 0.8 7.0 12.3 15.6 15.535S 33.8 ± 0.3 35.6 ± 1.7 36.9± 0.1 30.7 45.2 49.9 50.133P 51.4± 0.4 53.6± 1.8 54.6± 0.1 48.3 62.2 66.6 66.6
45Ca 51.3± 0.5 53.3 ± 1.8 54.5± 0.2 48.5 62.1 66.2 66.199Tc 59.0 ± 0.5 60.7± 1.6 62.5± 0.1 56.5 68.7 71.9 72.036Cl 89.6 ± 0.1 90.1 ± 0.1 90.5 ± 0.1 88.9 92.3 93.0 93.032P 97.4 ± 0.1 97.5 ± 0.2 97.7 ± 0.1 97.2 98.3 98.5 98.590Y 97.5 ± 0.1 97.6 ± 0.1 97.7 ± 0.1 97.2 98.3 98.5 98.4
ExperimentalPS
efficiency63Ni 835S 3733P 55
45Ca 5299Tc 6136Cl 8832P 97.390Y 97.6
Probability values for AL2 geometry are similar to experimental efficiency values
Simulation with Penelope (Preach)

Tarancon et al. Application of a free parameter model to plastic scintillation samples.
• In reduce spectra the mean energy is moved to higher energies
• Weak particles are stopped in the aqueous phase and those that arrive are more energetic
• Normalized spectra, REDUCED SPECTRA, must be used on TDCR calculations
0 1 2 3 4 5 6 7
x 104
-1
0
1
2
3
4
5
6
7x 10⁻⁴ Ni-63 normalized probability
Energy (eV)
Pro
babi
lity
Nor
mal
ized
(1/p
artic
le)
AL2HCPSPNI63 SPECTRA
Simulation with Penelope (Spectra)
0 0.5 1 1.5 2 2.5 3
x 105
0
1
2
3
x 10-4 Tc-99 normalized probability
Energy (eV)Pro
babi
lity
norm
aliz
ed to
1 (1
/par
ticle
)
AL2HCPSPTC99 SPECTRA
0 0.5 1 1.5 2 2.5
x 106
0
0.5
1
1.5
2
2.5
3
3.5x 10⁻⁴ Y-90 normalized probability
Energy (eV)
Pro
babi
lity
Nor
mal
ized
(1/p
artic
le)
AL2HCPSPY90 SPECTRA
Tarancon et al. Application of a free parameter model to plastic scintillation samples.
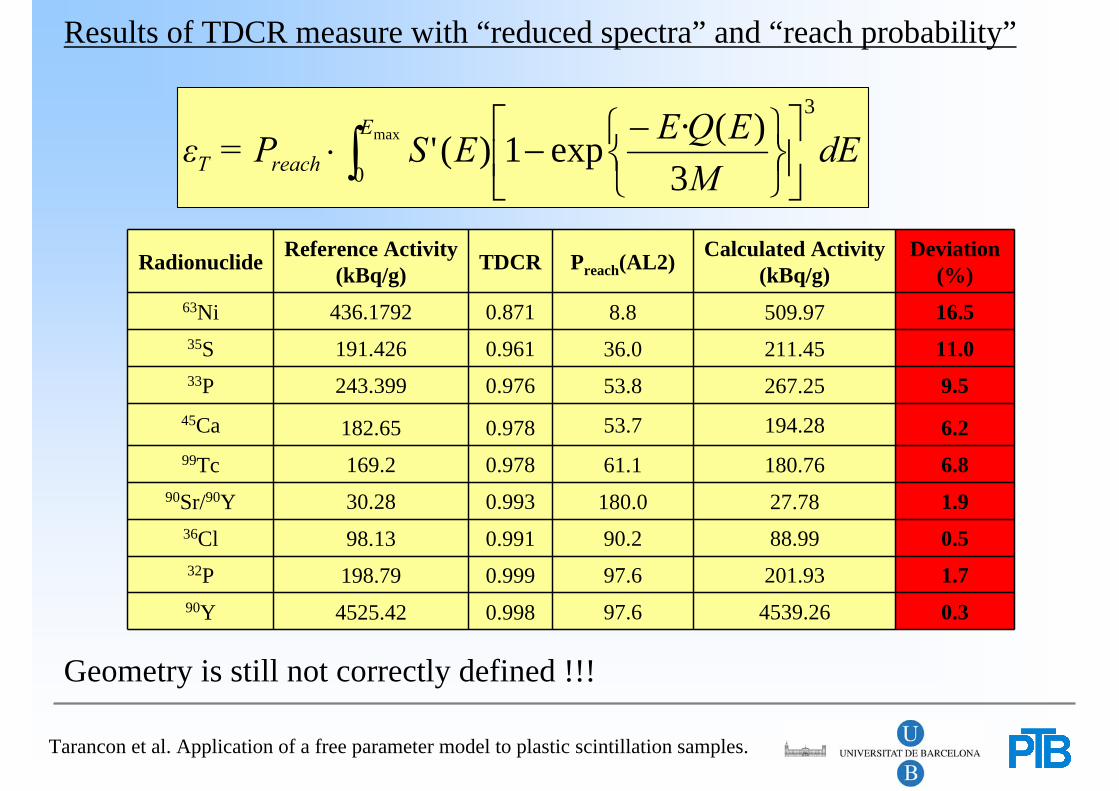
Radionuclide Reference Activity(kBq/g) TDCR Preach(AL2) Calculated Activity
(kBq/g)Deviation
(%)63Ni 436.1792 0.871 8.8 509.97 16.535S 191.426 0.961 36.0 211.45 11.033P 243.399 0.976 53.8 267.25 9.5
45Ca 182.65 0.978 53.7 194.28 6.299Tc 169.2 0.978 61.1 180.76 6.8
90Sr/90Y 30.28 0.993 180.0 27.78 1.936Cl 98.13 0.991 90.2 88.99 0.532P 198.79 0.999 97.6 201.93 1.790Y 4525.42 0.998 97.6 4539.26 0.3
dEM
EQEESP=εE
reachT
3
0
max
3)(·exp1)('∫ ⎥⎦
⎤⎢⎣
⎡
⎭⎬⎫
⎩⎨⎧−−⋅
Geometry is still not correctly defined !!!
Results of TDCR measure with “reduced spectra” and “reach probability”
Tarancon et al. Application of a free parameter model to plastic scintillation samples.
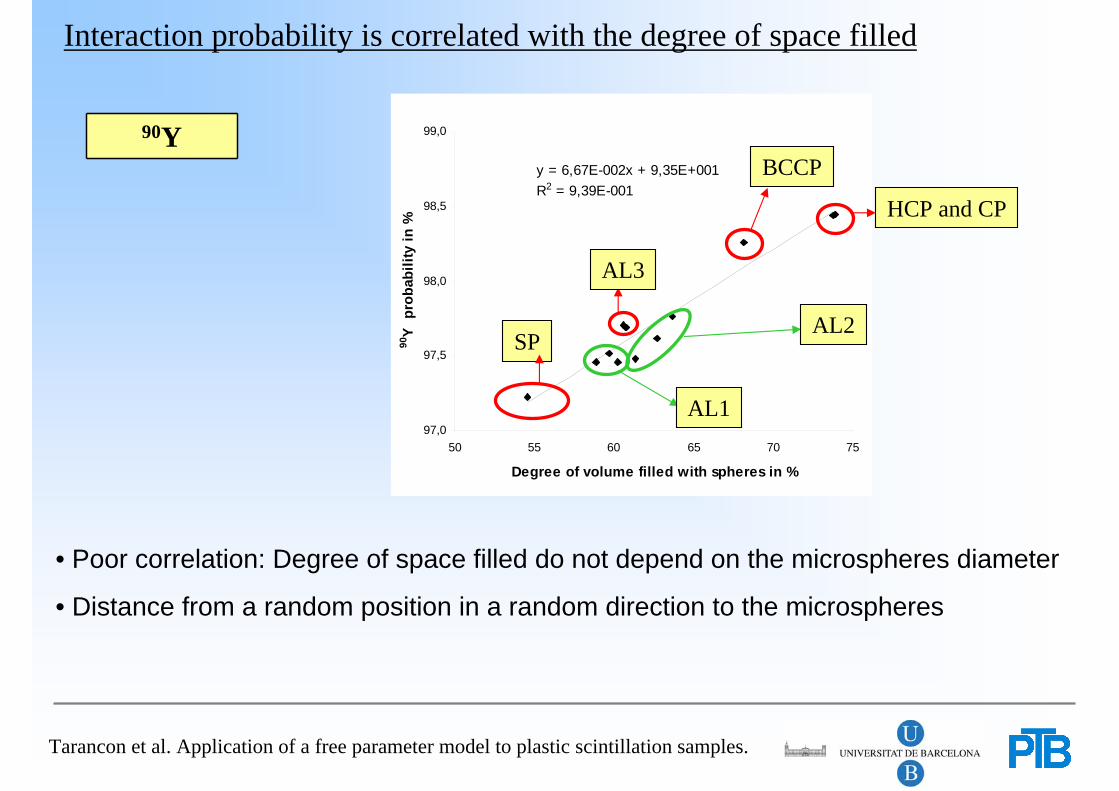
90Yy = 6,67E-002x + 9,35E+001R2 = 9,39E-001
97,0
97,5
98,0
98,5
99,0
50 55 60 65 70 75
Degree of volume filled with spheres in %
90Y
pro
babi
lity
in %
HCP and CP
BCCP
AL3
SP
AL1
AL2
• Poor correlation: Degree of space filled do not depend on the microspheres diameter
• Distance from a random position in a random direction to the microspheres
Interaction probability is correlated with the degree of space filled
Tarancon et al. Application of a free parameter model to plastic scintillation samples.
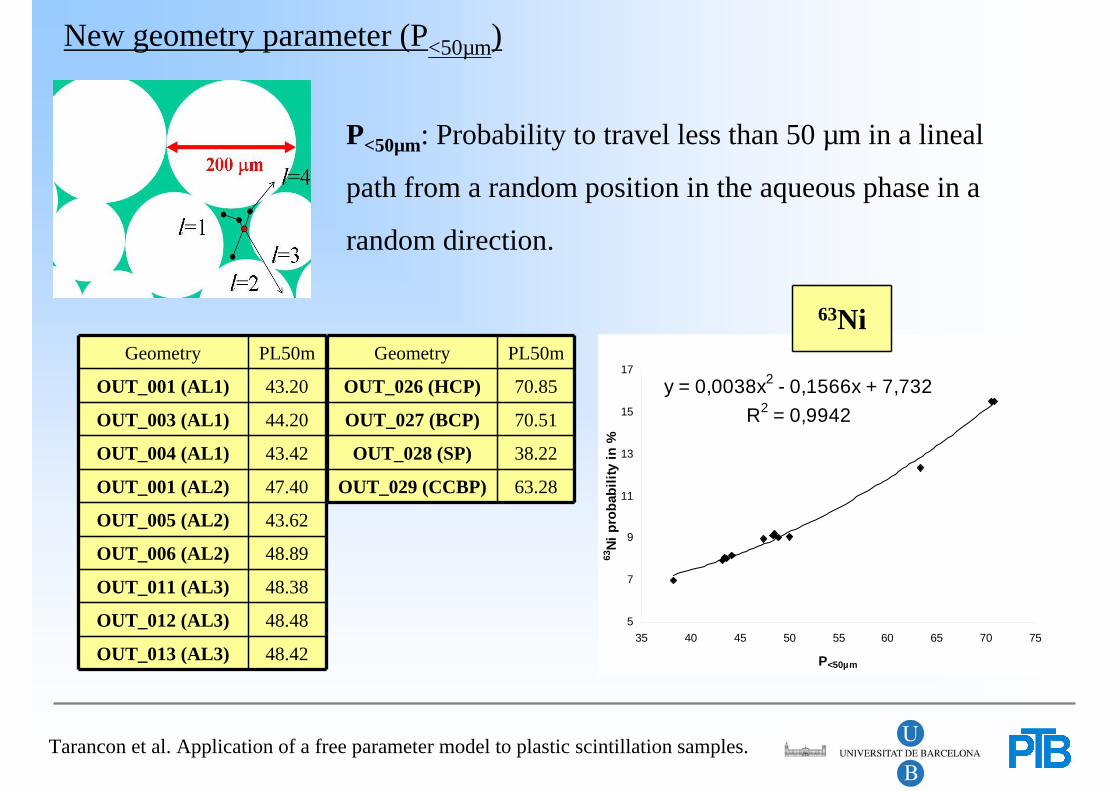
P<50µm: Probability to travel less than 50 µm in a lineal
path from a random position in the aqueous phase in a
random direction.
Geometry PL50m
OUT_001 (AL1) 43.20
OUT_003 (AL1) 44.20
OUT_004 (AL1) 43.42
OUT_001 (AL2) 47.40
OUT_005 (AL2) 43.62
OUT_006 (AL2) 48.89
OUT_011 (AL3) 48.38
OUT_012 (AL3) 48.48
OUT_013 (AL3) 48.42
y = 0,0038x2 - 0,1566x + 7,732R2 = 0,9942
5
7
9
11
13
15
17
35 40 45 50 55 60 65 70 75
P<50µm
63Ni
pro
babi
lity
in %
Geometry PL50m
OUT_026 (HCP) 70.85
OUT_027 (BCP) 70.51
OUT_028 (SP) 38.22
OUT_029 (CCBP) 63.28
63Ni
New geometry parameter (P<50µm)

Tarancon et al. Application of a free parameter model to plastic scintillation samples.
y = 0,0038x2 - 0,1566x + 7,732R2 = 0,9942
5
7
9
11
13
15
17
35 40 45 50 55 60 65 70 75
P<50µm
63Ni
pro
babi
lity
in %
• 63Ni solution measure with PSm in a TDCR detector• TDCR computation of the activity using the 63Ni reduced spectra (AL2)• Calculation of the 63Ni Preach value needed to match the measured activity with the reference activity• Calculation of the P<50µm value.
Reference Activity
(kBq/g)
Measured Activity
(kBq/g)
Preach
(%)
436.18 44.71 10.2
P<50µm = 54.3 %
PSm-TDCR-Penelope tracing method
Property of our geometry

Tarancon et al. Application of a free parameter model to plastic scintillation samples.
Radionuclide TDCRReference Activity(kBq/g)
Calculatedactivity(kBq/g)
Preach (%)( at P<50µm=54.3)
Correctedactivity(kBq/g)
Deviation(%)
35S 0.961 191.426 76.6151 39.9 191.9 0.233P 0.976 243.399 143.3476 57.4 249.6 2.5
45Ca 0.978 182.65 104.1724 57.4 181.5 -0.699Tc 0.978 169.2 110.3408 64.6 170.9 1.036Cl 0.991 98.132 88.99979 91.2 97.6 -0.5
90Sr/90Y 0.993 30.282 27.7805 182.0 30.5 0.832P 0.999 198.79 197.209 97.9 201 1.390Y 0.998 4525.42 4432.28 97.9 4529 0.1
PSm-TDCR-Penelope tracing method
• Radionuclide solution measure with PSm in a TDCR detector• Calculation of the Preach at 53.4 % P<50µm value• TDCR activity computation using the reduced spectra (AL2)• Calculation of the corrected activity.
y = 0,0012x2 + 0,4564x + 11,61R2 = 0,9983
25
30
35
40
45
50
55
35 40 45 50 55 60 65 70 75
P<50µm
35S
prob
abili
ty in
%
Tarancon et al. Application of a free parameter model to plastic scintillation samples.
Conclusions
• We have established a method based on TDCR-PSm-PENELOPE using 63Ni as tracing radionuclide for the measure of beta radionuclides with quantification deviation lower that 3 %.
• We have established a theoretical model based on Monte Carlo simulation that allows to predict with high accuracy the lost of energy in the aqueous phase in microscopic geometries.
• We have evidenced the relevance to take into account the aqueous phase in the simulation of microscopic system (PS) but also in case of nanoscopic systems (LSC or Gel scintillation) in case of low energy beta emitters (3H) or electron capture emitters (125I).

Tarancon et al. Application of a free parameter model to plastic scintillation samples.
• DAAD (Deutsche Akademische Austauschdienst) for financial support
• All the people from the Unit of activity of the Radioactivity department
of the PTB for their help and warm reception during my stage in
Braunschweig on the 2009 summer.
Acknowledgments

Tarancon et al. Application of a free parameter model to plastic scintillation samples.
THANK YOU FOR
YOUR
ATTENTION


