INVESTOR NEWSLETTER April 2015
Highlights of First Quarter 2015 Results
LDR improved to 92.7%vs 94.1% last year, well below BUKU 3 banks.
CoF improved from last quarter to 6.8 % (maintained from last year). While non mass market yield rose 90bps year on year. NIM stood at 8.3% from last quarter’s 8.5% due to shift in asset mix.
CASA grew 15% to Rp 54 trillion. CASA ratio rose to 46% as compared with 42% in 1Q14.
NPL at 2.5%, marginal increase of 20bps from last quarter, was in line with industry. CoC though higher at 3.3% in 1Q15, is expected to maintain over the next few months, barring seasonal peaks.
Negative q-q operating expense (opex) growth since 1Q14–dropped 4% from last quarter and improved 7% from last year. Productivity and efficiency initiatives through branch and headcount realignment continues, resulted in improvement of CIR to 53.3% (vs. 55.2% in 1Q14).
Profit after tax was Rp 687 billion in the first quarter of the year (vs. Rp 875 billion in 1Q14)
Macro Economic Situation
The macroeconomic indicators remain neutral at best; expect
a slight pick-up in the economic activities.
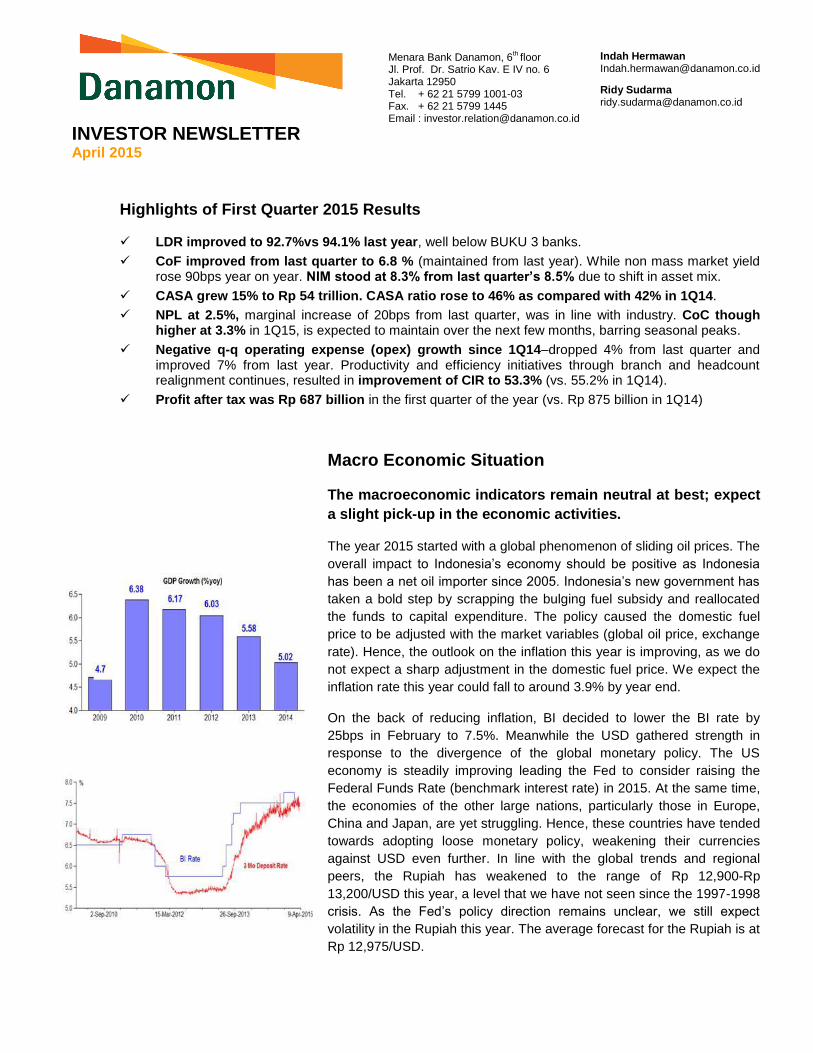
The year 2015 started with a global phenomenon of sliding oil prices. The
overall impact to Indonesia’s economy should be positive as Indonesia
has been a net oil importer since 2005. Indonesia’s new government has
taken a bold step by scrapping the bulging fuel subsidy and reallocated
the funds to capital expenditure. The policy caused the domestic fuel
price to be adjusted with the market variables (global oil price, exchange
rate). Hence, the outlook on the inflation this year is improving, as we do
not expect a sharp adjustment in the domestic fuel price. We expect the
inflation rate this year could fall to around 3.9% by year end.
On the back of reducing inflation, BI decided to lower the BI rate by
25bps in February to 7.5%. Meanwhile the USD gathered strength in
response to the divergence of the global monetary policy. The US
economy is steadily improving leading the Fed to consider raising the
Federal Funds Rate (benchmark interest rate) in 2015. At the same time,
the economies of the other large nations, particularly those in Europe,
China and Japan, are yet struggling. Hence, these countries have tended
towards adopting loose monetary policy, weakening their currencies
against USD even further. In line with the global trends and regional
peers, the Rupiah has weakened to the range of Rp 12,900-Rp
13,200/USD this year, a level that we have not seen since the 1997-1998
crisis. As the Fed’s policy direction remains unclear, we still expect
volatility in the Rupiah this year. The average forecast for the Rupiah is at
Rp 12,975/USD.
Indah Hermawan [email protected]
Ridy Sudarma [email protected]
Menara Bank Danamon, 6th
floor Jl. Prof. Dr. Satrio Kav. E IV no. 6 Jakarta 12950 Tel. + 62 21 5799 1001-03 Fax. + 62 21 5799 1445 Email : [email protected]
PT Bank Danamon Indonesia, Tbk. Investor Newsletter – First Quarter 2015 Results April 2015
Page 2 of 27
Acknowledging the pressure on the Rupiah, BI has reiterated its tight
bias policy stance. The BI rate is kept at 7.5%. BI may have limited room
to lower rate further. We are still expecting another cut by 25bps later this
year but on the assumption that the Rupiah stabilizes. The expectation is
also based on the ambitious growth target that is set by the government
at 5.7% this year, which we think will be difficult to achieve if the interest
rates remain at current level.
This quarter, consumption and government spending may still be able to
drive the economic growth to improve to around 5.19%y-y. For the year
in overall, there are potential obstacles for the economy. The ambitious
tax revenue target, if not achieved will lead to government revenue
shortfall, impacting fiscal deficit. Furthermore, the weakening currency
may also impact consumer purchasing power, hence, could be negative
for the consumption. Therefore, we expect the economic growth will only
modestly improve to around 5.3% y-y supported more by government
spending and investment.
Challenges in the banking industry
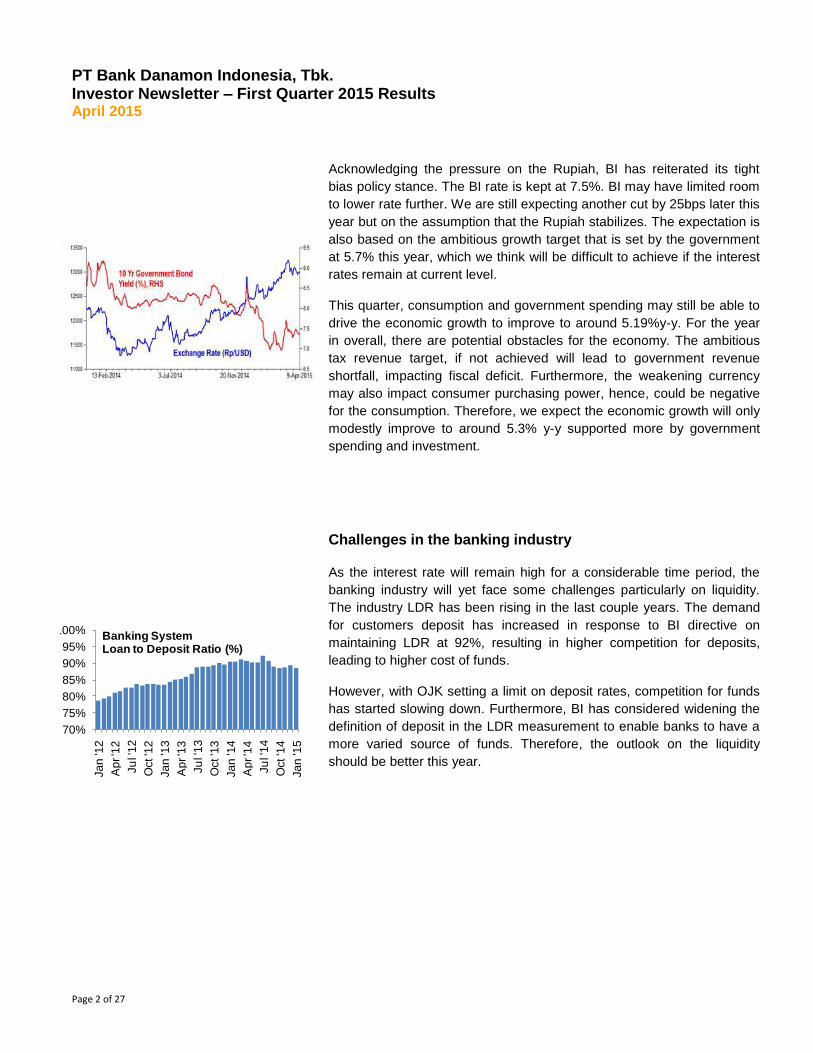
As the interest rate will remain high for a considerable time period, the
banking industry will yet face some challenges particularly on liquidity.
The industry LDR has been rising in the last couple years. The demand
for customers deposit has increased in response to BI directive on
maintaining LDR at 92%, resulting in higher competition for deposits,
leading to higher cost of funds.
However, with OJK setting a limit on deposit rates, competition for funds
has started slowing down. Furthermore, BI has considered widening the
definition of deposit in the LDR measurement to enable banks to have a
more varied source of funds. Therefore, the outlook on the liquidity
should be better this year.
70%
75%
80%
85%
90%
95%
100%
Ja
n '1
2
Ap
r '1
2
Ju
l '1
2
Oct '1
2
Ja
n '1
3
Ap
r '1
3
Ju
l '1
3
Oct '1
3
Ja
n '1
4
Ap
r '1
4
Ju
l '1
4
Oct '1
4
Ja
n '1
5
Banking System Loan to Deposit Ratio (%)
PT Bank Danamon Indonesia, Tbk. Investor Newsletter – First Quarter 2015 Results April 2015
Page 3 of 27
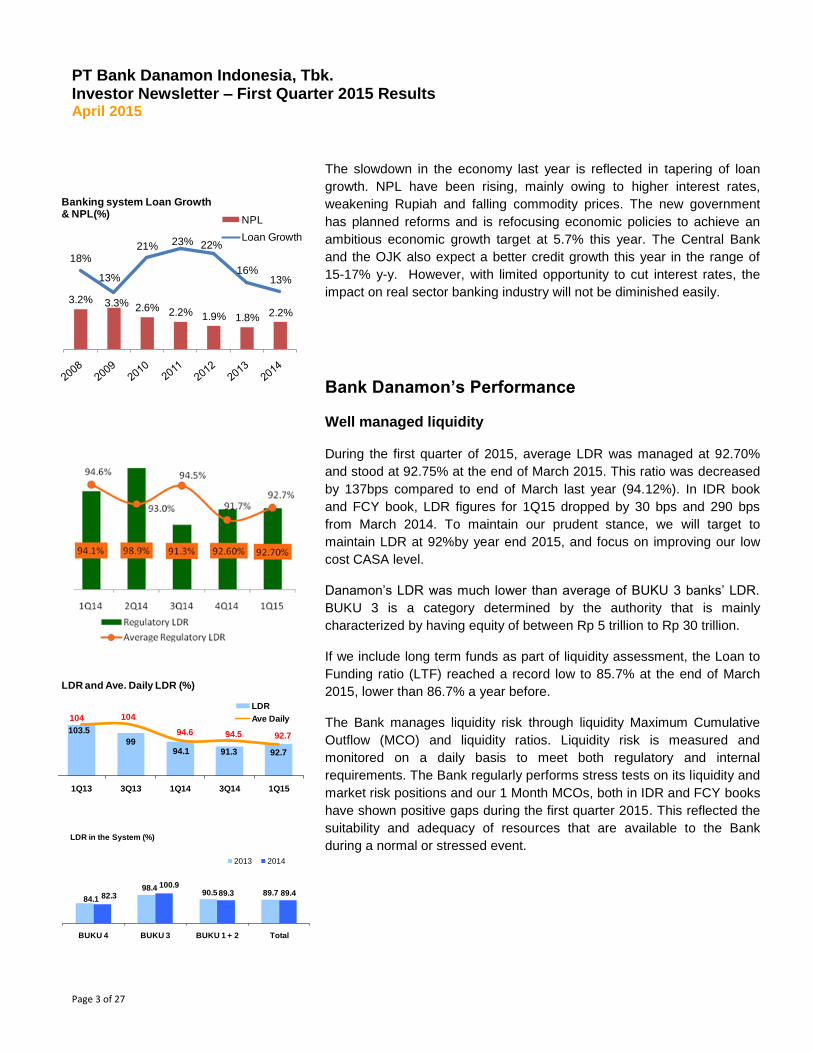
The slowdown in the economy last year is reflected in tapering of loan
growth. NPL have been rising, mainly owing to higher interest rates,
weakening Rupiah and falling commodity prices. The new government
has planned reforms and is refocusing economic policies to achieve an
ambitious economic growth target at 5.7% this year. The Central Bank
and the OJK also expect a better credit growth this year in the range of
15-17% y-y. However, with limited opportunity to cut interest rates, the
impact on real sector banking industry will not be diminished easily.
Bank Danamon’s Performance
Well managed liquidity
During the first quarter of 2015, average LDR was managed at 92.70%
and stood at 92.75% at the end of March 2015. This ratio was decreased
by 137bps compared to end of March last year (94.12%). In IDR book
and FCY book, LDR figures for 1Q15 dropped by 30 bps and 290 bps
from March 2014. To maintain our prudent stance, we will target to
maintain LDR at 92%by year end 2015, and focus on improving our low
cost CASA level.
Danamon’s LDR was much lower than average of BUKU 3 banks’ LDR.
BUKU 3 is a category determined by the authority that is mainly
characterized by having equity of between Rp 5 trillion to Rp 30 trillion.
If we include long term funds as part of liquidity assessment, the Loan to
Funding ratio (LTF) reached a record low to 85.7% at the end of March
2015, lower than 86.7% a year before.
The Bank manages liquidity risk through liquidity Maximum Cumulative
Outflow (MCO) and liquidity ratios. Liquidity risk is measured and
monitored on a daily basis to meet both regulatory and internal
requirements. The Bank regularly performs stress tests on its liquidity and
market risk positions and our 1 Month MCOs, both in IDR and FCY books
have shown positive gaps during the first quarter 2015. This reflected the
suitability and adequacy of resources that are available to the Bank
during a normal or stressed event.
3.2% 3.3% 2.6% 2.2% 1.9% 1.8% 2.2%
18%
13%
21% 23% 22%
16%13%
Banking system Loan Growth & NPL(%)
NPL
Loan Growth
103.5
9994.1 91.3 92.7
104 104
94.6 94.5 92.7
1Q13 3Q13 1Q14 3Q14 1Q15
LDR
Ave Daily
LDR and Ave. Daily LDR (%)
84.1
98.490.5 89.782.3
100.989.3 89.4
BUKU 4 BUKU 3 BUKU 1 + 2 Total
2013 2014
LDR in the System (%)

PT Bank Danamon Indonesia, Tbk. Investor Newsletter – First Quarter 2015 Results April 2015
Page 4 of 27
Dominated by the Saving Accounts, CASA ratio stood at 46%,
higher than the average of BUKU 3 Banks’ CASA ratio
Danamon has continuously built funding franchise with the main focus in
current accounts and saving accounts (CASA). CASA had grown 15%
compared to that at the end of 1Q14. While both of current account and
saving account exhibited healthy growth, saving accounts yet dominated
the total CASA balance. As at the end of March 2015, saving accounts
balances formed 58% of the total CASA.
The growth in CASA outpaced growth in TDs which increased at 2%
CAGR from 2008. The Bank’s 46% CASA ratio was higher than the
average CASA ratio of banks in BUKU 3 of 40% as at 31 December 2014.
Slowing down in the economy last year reflected in tapering of
loan growth
Our loan levels had been impacted by many factors such as slowing down
of the economy, interest rates remaining high, and concern on Rupiah
depreciation. As at the end of March 2015, total outstanding loan was Rp
135.7 trillion. The growth was largely contributed by Small & Medium
Enterprise and Commercial which expanded 12% to Rp 38.24 trillion.
SME grew by 9% y-y to Rp 20.8 trillion at the end of March 2015. This
was higher than industry and the Bank gained market share. At the same
time NPL stood at 2.5% (1.7% at the end of March 2014) better than
industry of 4.1% (Jan 15). The increase in NPL was primarily caused by
smaller ticket Emerging SME (ticket size below Rp 3 billion)
Commercial was another loan growth engine for the Bank. Year on year
grew by 5%to Rp 15.0 trillion by end of March 2015 (excluding asset-
based financing channelled to these customers), while NPL remained low
at 0.9% for the same period.
Similarly, Sharia booked a very healthy growth. Going from a low base,
over the year, Sharia recorded 46% to Rp 2.5 trillion at the end of March
2015. NPL stood at 1.9% (1.1% at the end of March 2015).
Wholesale outstanding loan was decreased by 8% y-y to 16.4 trillion. This
was a conscious decision given the interest rate scenario. NPL stayed
about the same at 1.0% compared to the 1.1% a year earlier.
50%50%51%51%52%
6%6%6%6%6%
28%27%26%26%25%
16%17%17%18%
18%
1Q14 2Q14 3Q14 4Q14 1Q15
136141 139 139
136
Loan Composition & Size (Rp trillion)

PT Bank Danamon Indonesia, Tbk. Investor Newsletter – First Quarter 2015 Results April 2015
Page 5 of 27
Trade finance growth remained robust. Though outstanding Cash Loan
of Rp 10.3 trillion was relatively similar to the situation a year earlier, the
Non-Cash Loan had grown very well at 47% to Rp 13.7 trillion at the end
of March 2015. Meanwhile the asset quality remained sound. NPL stood
at 0.8% or Rp 77 billion.
The automotive industry continued to be under pressure in the first three
months of 2015, maintaining the softening trend from 2014. The
industry’s new motorcycle sales for 1Q15 was down by nearly 20% to
only 1.6 million units from 2.0 million units in 1Q14. Meanwhile, the
industry’s new car sales for 1Q15 recorded a drop of 14% to 283
thousand units from 329 thousand units in the same period of 2014.
The main reasons for the decline in the automotive sector, amongst
others, were the slowing down economic growth worsened by the
pressure in Rupiah exchange rate. Nevertheless, as macroeconomic
conditions improve, the automotive industry players are confident that the
industry sales will bounce back again, bearing in mind that vehicles are
largely considered as a productive need for Indonesians.
In line with industry’s trend, Adira Finance recorded new disbursement of
394 thousand units of vehicles, lower than the same period in 2014 of
440 thousand units of vehicles. Despite slowing down in the auto
industry, Adira Finance managed its growth prudently by balancing
between protecting margins, while at the same time, implementing
prudent risk management in its credit underwriting. Adira Finance used
vehicle new disbursement rose 8% from Rp 2.5 trillion in 1Q14 to Rp 2.7
trillion in 1Q15. The composition of new disbursement between new and
used vehicles shifted, from 69%:31% in 1Q14 to 61%:39% in 1Q15.
A similar situation was faced by micro loan. Despite the remarkable
137% growth of upper-tier micro, overall micro loan contracted by 9% y-y
to Rp 18.2 trillion. Management has identified various strategic actions to
improve the performance of micro loan, including enhancing automation
through CPA (Credit Processing Application) and centralizing the credit
processing in Java.
NIM stood at 8.3% from last quarter’s 8.5% due to shift in
asset mix
COF improved from last quarter to 6.8% (maintained from last year), on
the other hand, non mass-market yield has rose 90 bps y-y. Net interest
margin (NIM) stood at 8.3% due to shift in asset mix.
4.4
6.9
9.811
10 10.3
2011 2012 2013 2014 1Q14 1Q15
Cash Loans (Rp tn)
CAGR 36%YoY 2%
4.95.6
9.9
13.8
9.3
13.7
2011 2012 2013 2014 1Q14 1Q15
Non-Cash Loans (Rp tn)
CAGR 41%
YoY 47%
1,990 2,226
1,863 1,829 1,605
11.5 11.9
14.2
13.0
11.1
1Q14 2Q14 3Q14 4Q14 1Q15
2W Industry Sales and ADMF Mkt Share
ADMF Mkt
Shr (%)
Ind. unit sold
(thousand)
4W Industry Sales and ADMF Mkt Share
Ind. unit sold
(thousand)
329 314 291 275 282
4.9 4.8
5.4 6.0
4.3
1Q14 2Q14 3Q14 4Q14 1Q15
ADMF Mkt
Shr (%)
6.1 5.2 5.4 5.6 5.0
2.5 3.0 3.0 2.9 3.3
8.6 8.2 8.4 8.5 8.3
17.2 16.9 17.1 17.4 17.3
6.8 7.2 7.3 7.0 6.8
1Q14 2Q14 3Q14 4Q14 1Q15
IDR
Loan Yield
IDR CoF
NIM
CoC
Risk adj
NIM
IDR Loan Yield (Rp tn), IDR CoF (Rp tn),
and NIM (%)
PT Bank Danamon Indonesia, Tbk. Investor Newsletter – First Quarter 2015 Results April 2015
Page 6 of 27
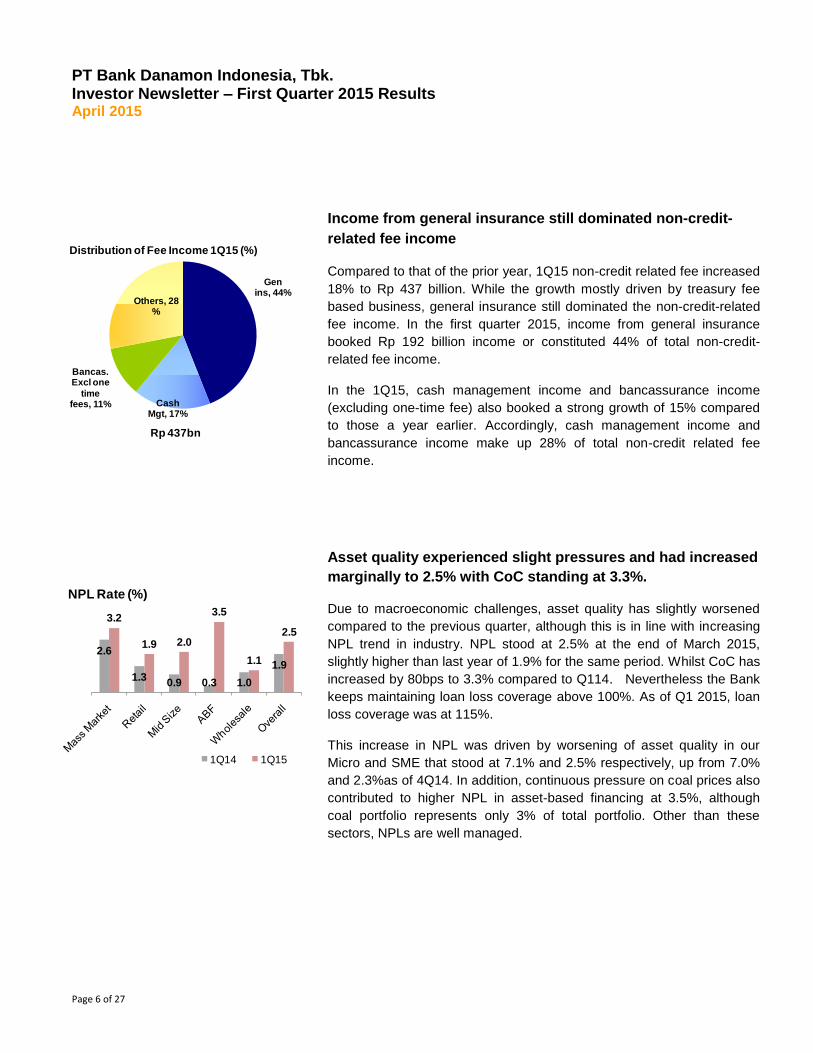
Income from general insurance still dominated non-credit-
related fee income
Compared to that of the prior year, 1Q15 non-credit related fee increased
18% to Rp 437 billion. While the growth mostly driven by treasury fee
based business, general insurance still dominated the non-credit-related
fee income. In the first quarter 2015, income from general insurance
booked Rp 192 billion income or constituted 44% of total non-credit-
related fee income.
In the 1Q15, cash management income and bancassurance income
(excluding one-time fee) also booked a strong growth of 15% compared
to those a year earlier. Accordingly, cash management income and
bancassurance income make up 28% of total non-credit related fee
income.
Asset quality experienced slight pressures and had increased
marginally to 2.5% with CoC standing at 3.3%.
Due to macroeconomic challenges, asset quality has slightly worsened
compared to the previous quarter, although this is in line with increasing
NPL trend in industry. NPL stood at 2.5% at the end of March 2015,
slightly higher than last year of 1.9% for the same period. Whilst CoC has
increased by 80bps to 3.3% compared to Q114. Nevertheless the Bank
keeps maintaining loan loss coverage above 100%. As of Q1 2015, loan
loss coverage was at 115%.
This increase in NPL was driven by worsening of asset quality in our
Micro and SME that stood at 7.1% and 2.5% respectively, up from 7.0%
and 2.3%as of 4Q14. In addition, continuous pressure on coal prices also
contributed to higher NPL in asset-based financing at 3.5%, although
coal portfolio represents only 3% of total portfolio. Other than these
sectors, NPLs are well managed.
Gen ins, 44%
Cash Mgt, 17%
Bancas. Excl one
time fees, 11%
Others, 28%
Distribution of Fee Income 1Q15 (%)
Rp 437bn
2.6
1.30.9 0.3 1.0
1.9
3.2
1.9 2.0
3.5
1.1
2.5
NPL Rate (%)
1Q14 1Q15

PT Bank Danamon Indonesia, Tbk. Investor Newsletter – First Quarter 2015 Results April 2015
Page 7 of 27
We expect further albeit modest, deterioration in asset quality for next one
or two quarters. However, aggressive collections and recoveries
processes are underway to counter the downside.
Negative opex growth since 1Q14 resulted in improvement of
CIR in 1Q15 to 53.3% (versus 55.2% in 1Q14)
Serving mass market with service spanning across Indonesia, Danamon
is one of the largest employers in the financial sector. At the same time,
manpower cost and facilities cost represented about two third of total
operating expenses.
Disciplined operating expense management, coupled with strategic
initiatives to increase efficiency including creation of shared services,
helped the Bank in re-aligning its branches and people, with
redundancies taking place in many support and back office areas.
In the 1Q15, the Rp 2.3 trillion operating expense was 7% lower
compared to that in earlier year. Quarter to quarter, operating expense
had decreased since the first quarter of 2014 with 4% decreased to the
1Q15.
Regulatory updates: OJK has introduced consultative papers
on Liquidity Coverage Ratio and Leverage Ratio
The Basel Committee on Banking Supervision (BCBS) document related
to Basel III Liquidity Coverage Ratio (LCR) was released in January 2013.
The ratio measures bank short term resilience of the liquidity risk profile
based on its High Quality Liquid Assets within crisis scenario in 30
calendar days. Related to that, OJK issued a Consultative Paper in
September 2014. Implementation timeline for this could be summarized
as follows:
NPL Rate(%) 1Q14 4Q14 1Q15 Y-y Q-q
Mass Market 2.6 3.1 3.2 0.6 0.1
Retail 1.3 1.6 1.9 0.6 0.3
Mid Size 0.9 1.7 2.0 1.1 0.3
ABF 0.3 2.0 3.5 3.2 1.5
Wholesale 1.0 1.0 1.1 0.1 0.1
Total 1.9 2.3 2.5 0.6 0.2
2,489 2,472
2,449 2,411
2,304
0.0 -0.7 -0.9 -1.6
-4.4
1Q14 2Q14 3Q14 4Q14 1Q15
Operating Expenses
Opex (Rp bn)
Y-y -7%
Q-q Growth (%)
PT Bank Danamon Indonesia, Tbk. Investor Newsletter – First Quarter 2015 Results April 2015
Page 8 of 27
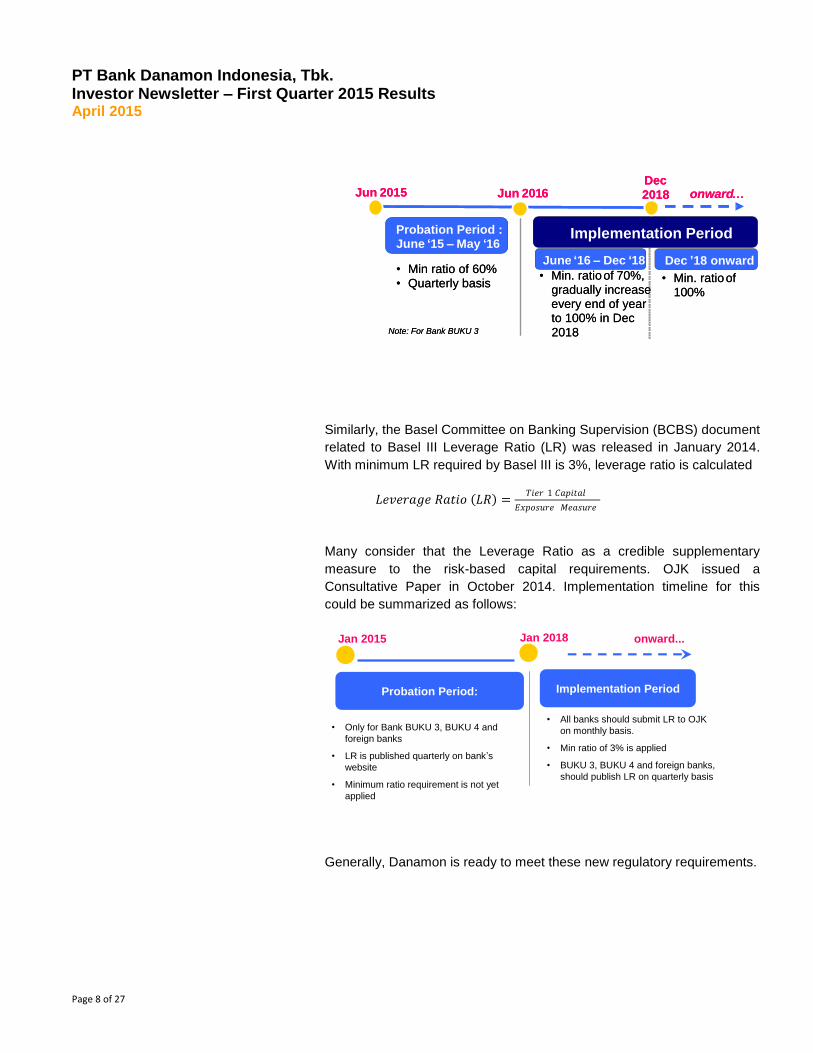
Similarly, the Basel Committee on Banking Supervision (BCBS) document
related to Basel III Leverage Ratio (LR) was released in January 2014.
With minimum LR required by Basel III is 3%, leverage ratio is calculated
𝐿𝑒𝑣𝑒𝑟𝑎𝑔𝑒 𝑅𝑎𝑡𝑖𝑜 𝐿𝑅 =𝑇𝑖𝑒𝑟 1 𝐶𝑎𝑝𝑖𝑡𝑎𝑙
𝐸𝑥𝑝𝑜𝑠𝑢𝑟𝑒 𝑀𝑒𝑎𝑠𝑢𝑟𝑒
Many consider that the Leverage Ratio as a credible supplementary
measure to the risk-based capital requirements. OJK issued a
Consultative Paper in October 2014. Implementation timeline for this
could be summarized as follows:
Generally, Danamon is ready to meet these new regulatory requirements.
Jun 2015
Note: For Bank BUKU 3
onward…Jun 2016Dec 2018
• Min ratio of 60%• Quarterly basis
• Min. ratio of 70%, gradually increase every end of year to 100% in Dec 2018
Probation Period :June ‘15 –May ‘16
Implementation Period
June ‘16 – Dec ‘18 Dec ’18 onward
• Min. ratio of 100%
Jun 2015
Note: For Bank BUKU 3
onward…Jun 2016Dec 2018
• Min ratio of 60%• Quarterly basis
• Min. ratio of 70%, gradually increase every end of year to 100% in Dec 2018
Probation Period :June ‘15 –May ‘16
Implementation Period
June ‘16 – Dec ‘18 Dec ’18 onward
• Min. ratio of 100%
Probation Period: Implementation Period
• Only for Bank BUKU 3, BUKU 4 and
foreign banks
• LR is published quarterly on bank’s
website
• Minimum ratio requirement is not yet
applied
Jan 2015
• All banks should submit LR to OJK
on monthly basis.
• Min ratio of 3% is applied
• BUKU 3, BUKU 4 and foreign banks,
should publish LR on quarterly basis
Jan 2018 onward...
PT Bank Danamon Indonesia, Tbk. Investor Newsletter – First Quarter 2015 Results April 2015
Page 9 of 27
Corporate Update
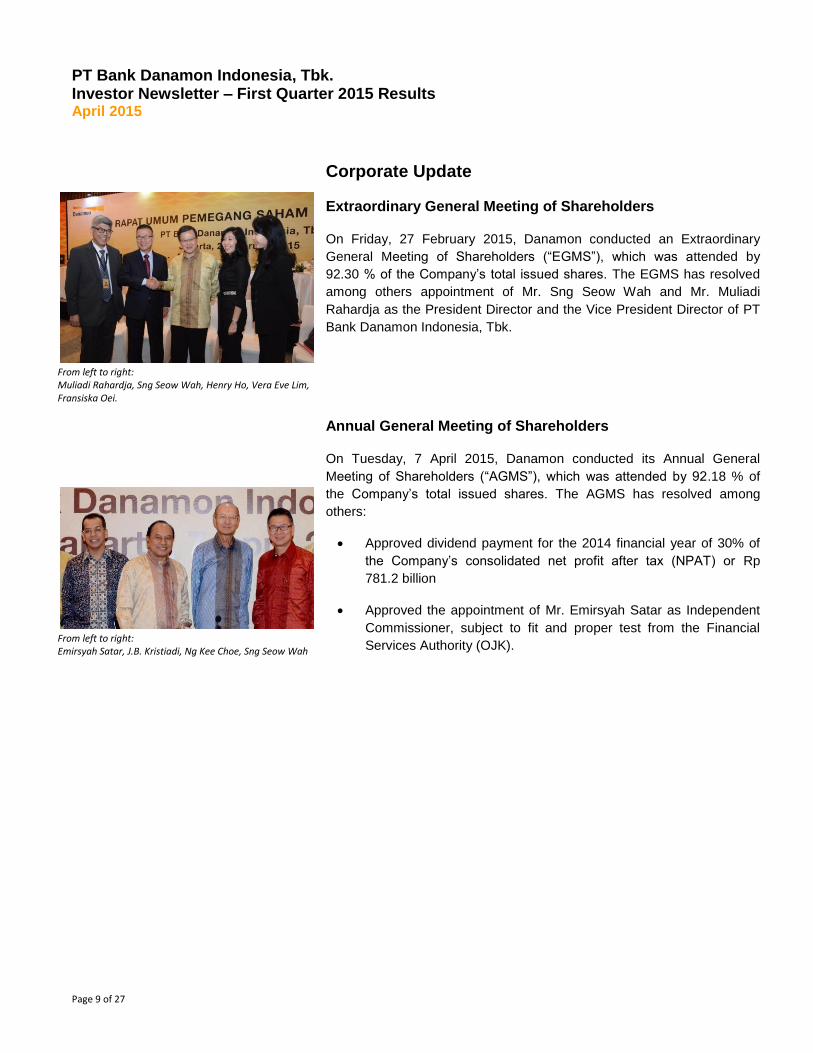
Extraordinary General Meeting of Shareholders
On Friday, 27 February 2015, Danamon conducted an Extraordinary
General Meeting of Shareholders (“EGMS”), which was attended by
92.30 % of the Company’s total issued shares. The EGMS has resolved
among others appointment of Mr. Sng Seow Wah and Mr. Muliadi
Rahardja as the President Director and the Vice President Director of PT
Bank Danamon Indonesia, Tbk.
Annual General Meeting of Shareholders
On Tuesday, 7 April 2015, Danamon conducted its Annual General
Meeting of Shareholders (“AGMS”), which was attended by 92.18 % of
the Company’s total issued shares. The AGMS has resolved among
others:
Approved dividend payment for the 2014 financial year of 30% of
the Company’s consolidated net profit after tax (NPAT) or Rp
781.2 billion
Approved the appointment of Mr. Emirsyah Satar as Independent
Commissioner, subject to fit and proper test from the Financial
Services Authority (OJK).
From left to right: Muliadi Rahardja, Sng Seow Wah, Henry Ho, Vera Eve Lim, Fransiska Oei.
From left to right: Emirsyah Satar, J.B. Kristiadi, Ng Kee Choe, Sng Seow Wah
PT Bank Danamon Indonesia, Tbk. Investor Newsletter – First Quarter 2015 Results April 2015
Page 10 of 27
Recent awards
Recently Danamon received various awards, including:
1st Winner of Annual Report Awards 2014 for Private Listed
Financial Institutions Category by Financial Services Authorities
(OJK), Bank Indonesia, Indonesia Stock Exchange, State-Owned
Enterprise Ministry, Directorate General of Taxation, National
Committee on Governance (NCG/ KNKG), and Indonesian Institute
of Accountant (IAI).
Website Multinational Corporation Awards 2015 for Reader’s
Favourite Website in Banking Category by beritasatu.com.
Digital Brand of The Year Awards 2015 for 1st Rank in Sharia
Business Unit Category and 2nd Rank in Savings Product,
Sharia Business Unit Category by Infobank Magazine and
Isentia.
WOW Service Excellence Awards 2015 for The Champion of
Manado - Conventional Bank in BUKU 3 Category by MarkPlus,
Inc.
Center for Entrepreneurship, Change and Third Sector (CECT)
- CSR Awards for Silver Winner in Banking Sector Overall
Performance by Trisakti University.
PT Bank Danamon Indonesia, Tbk. Investor Newsletter – First Quarter 2015 Results April 2015
Page 11 of 27
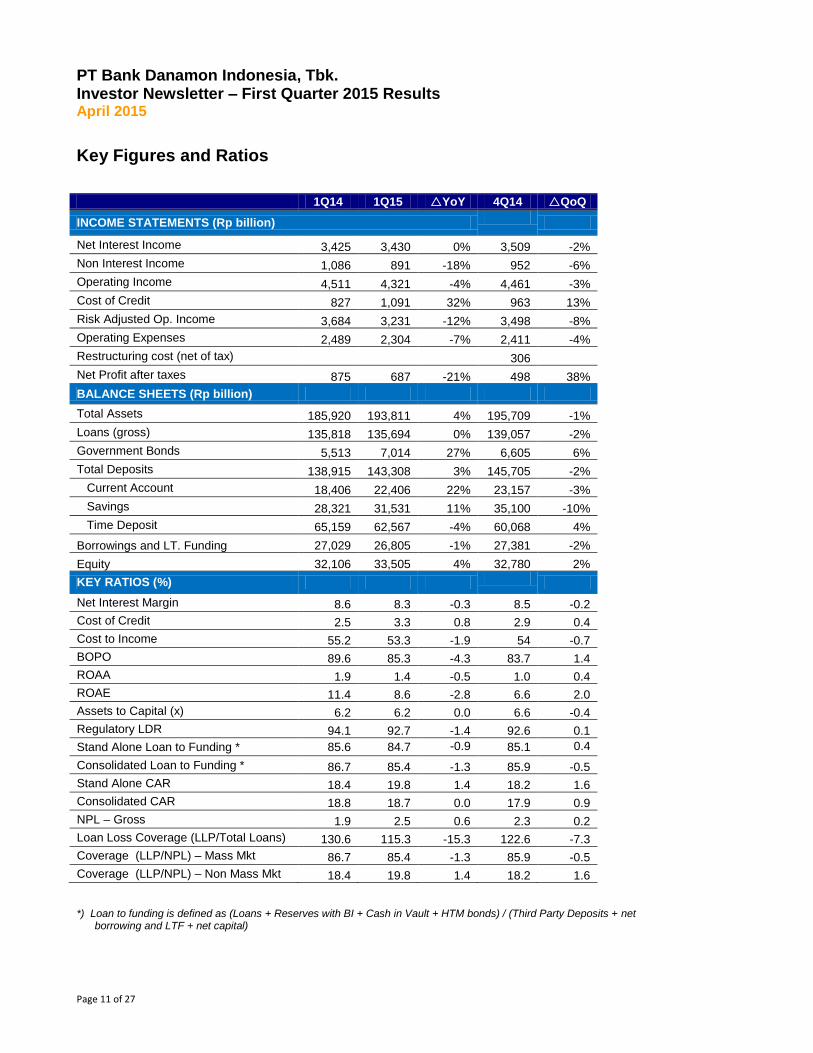
Key Figures and Ratios
1Q14 1Q15 YoY 4Q14 QoQ
INCOME STATEMENTS (Rp billion)
Net Interest Income 3,425 3,430 0% 3,509 -2%
Non Interest Income 1,086 891 -18% 952 -6%
Operating Income 4,511 4,321 -4% 4,461 -3%
Cost of Credit 827 1,091 32% 963 13%
Risk Adjusted Op. Income 3,684 3,231 -12% 3,498 -8%
Operating Expenses 2,489 2,304 -7% 2,411 -4%
Restructuring cost (net of tax) 306
Net Profit after taxes 875 687 -21% 498 38%
BALANCE SHEETS (Rp billion)
Total Assets 185,920 193,811 4% 195,709 -1%
Loans (gross) 135,818 135,694 0% 139,057 -2%
Government Bonds 5,513 7,014 27% 6,605 6%
Total Deposits 138,915 143,308 3% 145,705 -2%
Current Account 18,406 22,406 22% 23,157 -3%
Savings 28,321 31,531 11% 35,100 -10%
Time Deposit 65,159 62,567 -4% 60,068 4%
Borrowings and LT. Funding 27,029 26,805 -1% 27,381 -2%
Equity 32,106 33,505 4% 32,780 2%
KEY RATIOS (%)
Net Interest Margin 8.6 8.3 -0.3 8.5 -0.2
Cost of Credit 2.5 3.3 0.8 2.9 0.4
Cost to Income 55.2 53.3 -1.9 54 -0.7
BOPO 89.6 85.3 -4.3 83.7 1.4
ROAA 1.9 1.4 -0.5 1.0 0.4
ROAE 11.4 8.6 -2.8 6.6 2.0
Assets to Capital (x) 6.2 6.2 0.0 6.6 -0.4
Regulatory LDR 94.1 92.7 -1.4 92.6 0.1
Stand Alone Loan to Funding * 85.6 84.7 -0.9 85.1 0.4
Consolidated Loan to Funding * 86.7 85.4 -1.3 85.9 -0.5
Stand Alone CAR 18.4 19.8 1.4 18.2 1.6
Consolidated CAR 18.8 18.7 0.0 17.9 0.9
NPL – Gross 1.9 2.5 0.6 2.3 0.2
Loan Loss Coverage (LLP/Total Loans) 130.6 115.3 -15.3 122.6 -7.3
Coverage (LLP/NPL) – Mass Mkt 86.7 85.4 -1.3 85.9 -0.5
Coverage (LLP/NPL) – Non Mass Mkt 18.4 19.8 1.4 18.2 1.6 *) Loan to funding is defined as (Loans + Reserves with BI + Cash in Vault + HTM bonds) / (Third Party Deposits + net
borrowing and LTF + net capital)
PT Bank Danamon Indonesia, Tbk. Investor Newsletter – First Quarter 2015 Results April 2015
Page 12 of 27
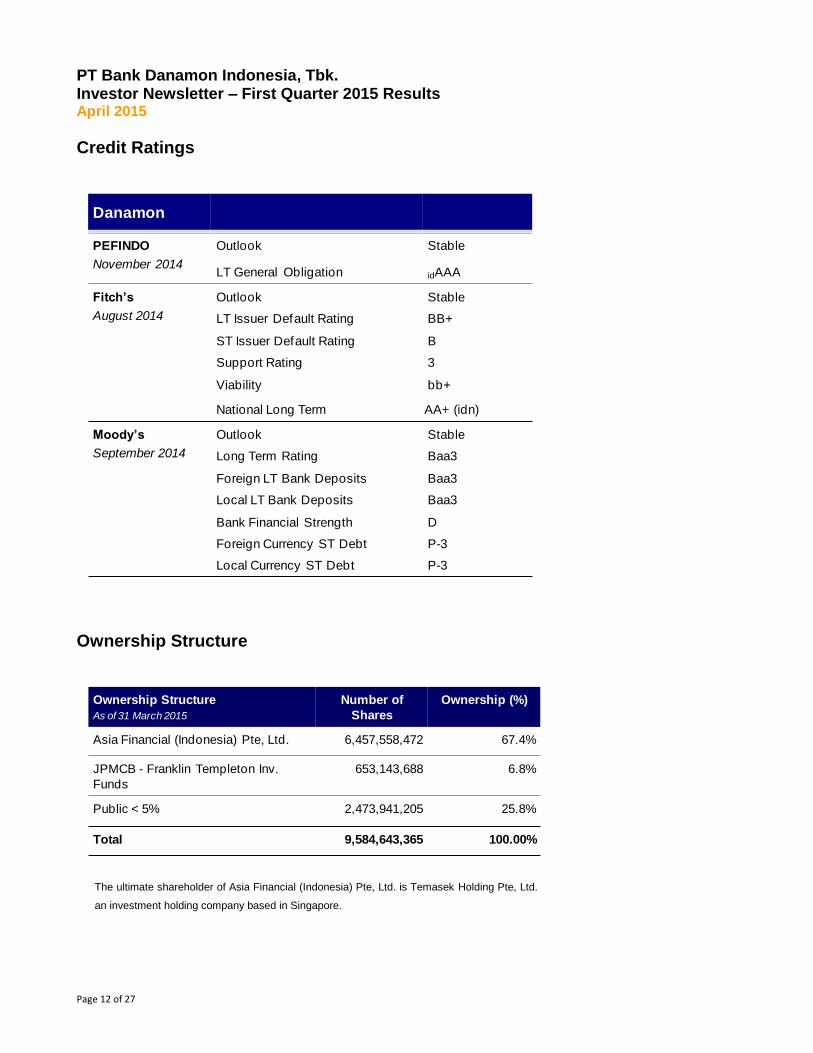
Credit Ratings
Ownership Structure
The ultimate shareholder of Asia Financial (Indonesia) Pte, Ltd. is Temasek Holding Pte, Ltd.
an investment holding company based in Singapore.
Danamon
PEFINDO
November 2014
Outlook Stable
LT General Obligation idAAA
Fitch’s
August 2014
Outlook
LT Issuer Default Rating
ST Issuer Default Rating
Support Rating
Viability
Stable
BB+
B
3
bb+
National Long Term AA+ (idn)
Moody’s
September 2014
Outlook
Long Term Rating
Foreign LT Bank Deposits
Local LT Bank Deposits
Bank Financial Strength
Foreign Currency ST Debt
Local Currency ST Debt
Stable
Baa3
Baa3
Baa3
D
P-3
P-3
Ownership Structure
As of 31 March 2015
Number of
Shares
Ownership (%)
Asia Financial (Indonesia) Pte, Ltd. 6,457,558,472 67.4%
JPMCB - Franklin Templeton Inv.
Funds
653,143,688 6.8%
Public < 5% 2,473,941,205 25.8%
Total 9,584,643,365 100.00%
PT Bank Danamon Indonesia, Tbk. Investor Newsletter – First Quarter 2015 Results April 2015
Page 13 of 27
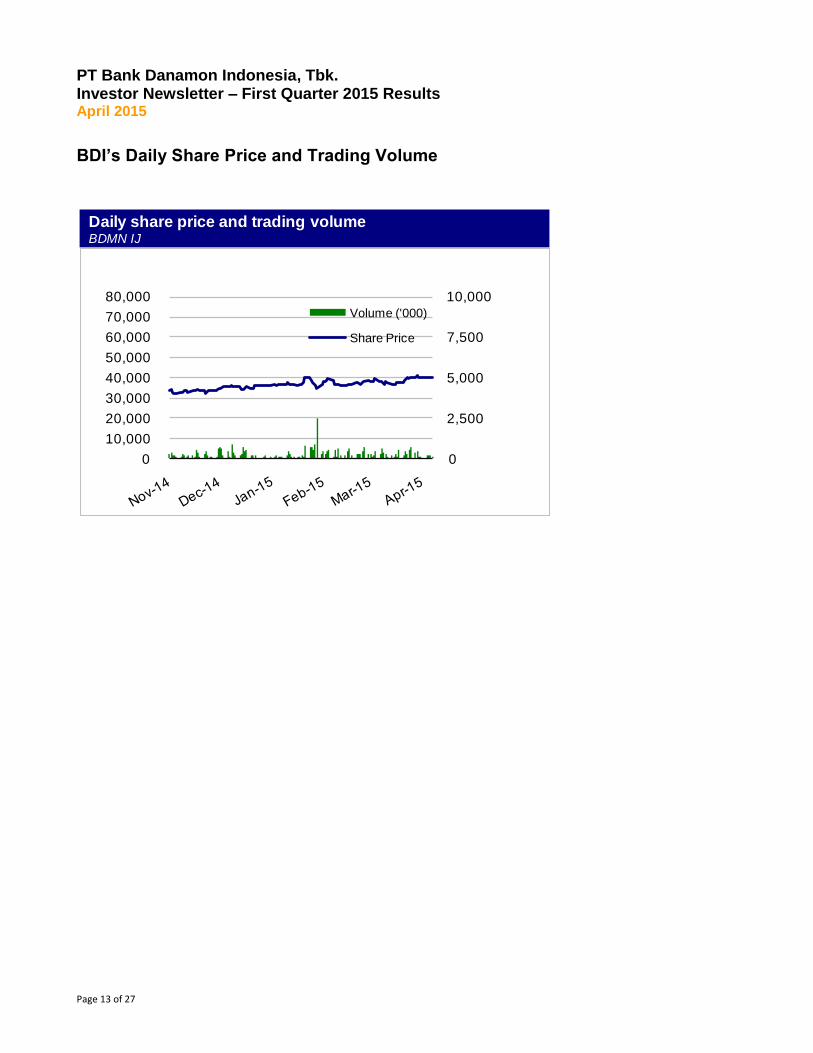
BDI’s Daily Share Price and Trading Volume
Daily share price and trading volumeBDMN IJ
0
2,500
5,000
7,500
10,000
0
10,000
20,000
30,000
40,000
50,000
60,000
70,000
80,000 Volume ('000)
Share Price
PT Bank Danamon Indonesia, Tbk. Investor Newsletter – First Quarter 2015 Results April 2015
Page 14 of 27
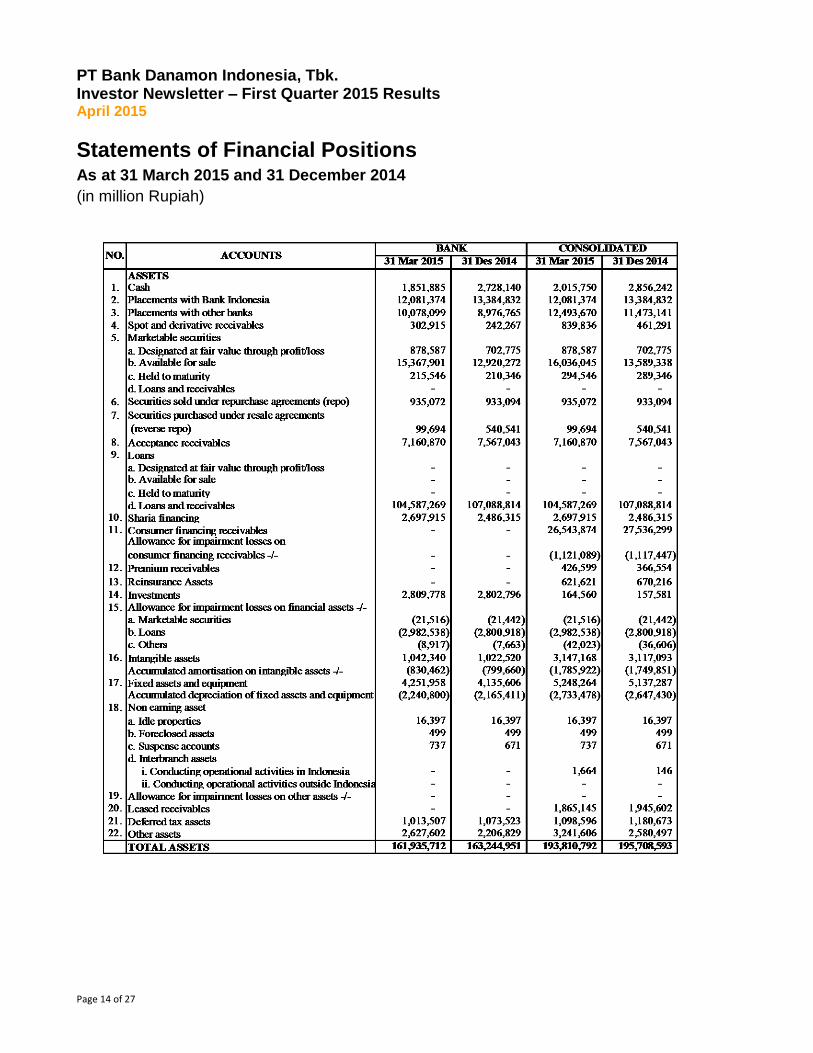
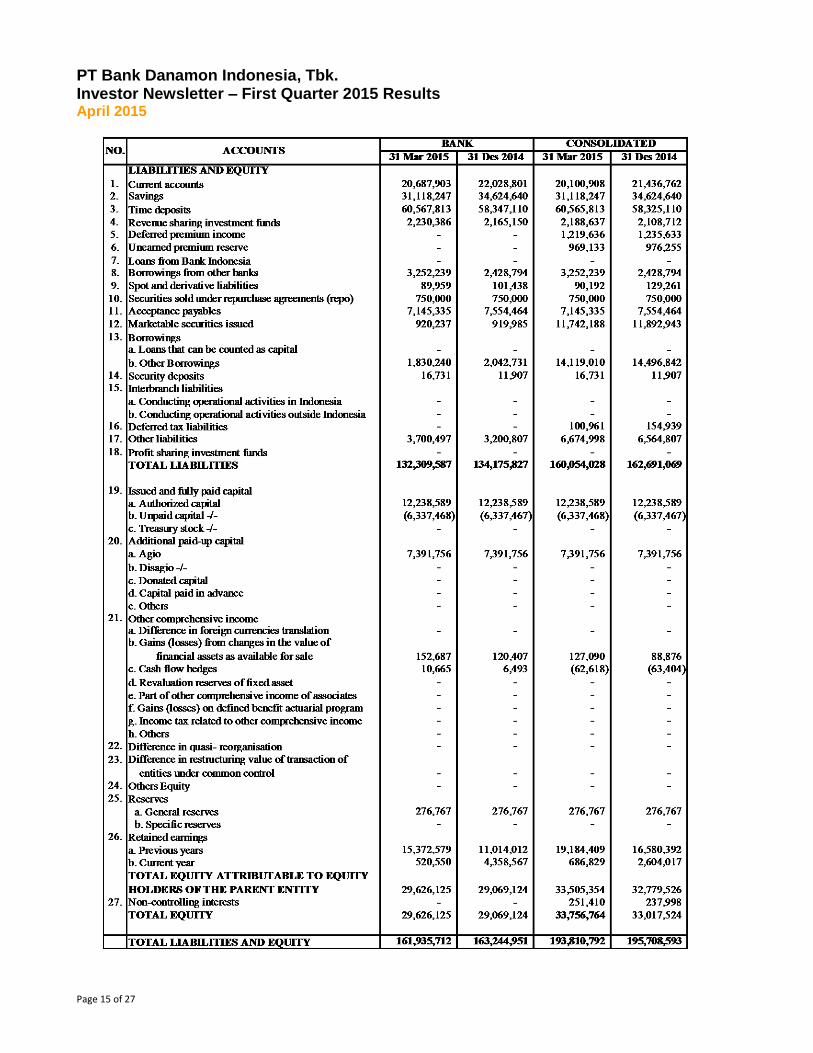
Statements of Financial Positions As at 31 March 2015 and 31 December 2014
(in million Rupiah)
PT Bank Danamon Indonesia, Tbk. Investor Newsletter – First Quarter 2015 Results April 2015
Page 15 of 27
PT Bank Danamon Indonesia, Tbk. Investor Newsletter – First Quarter 2015 Results April 2015
Page 16 of 27
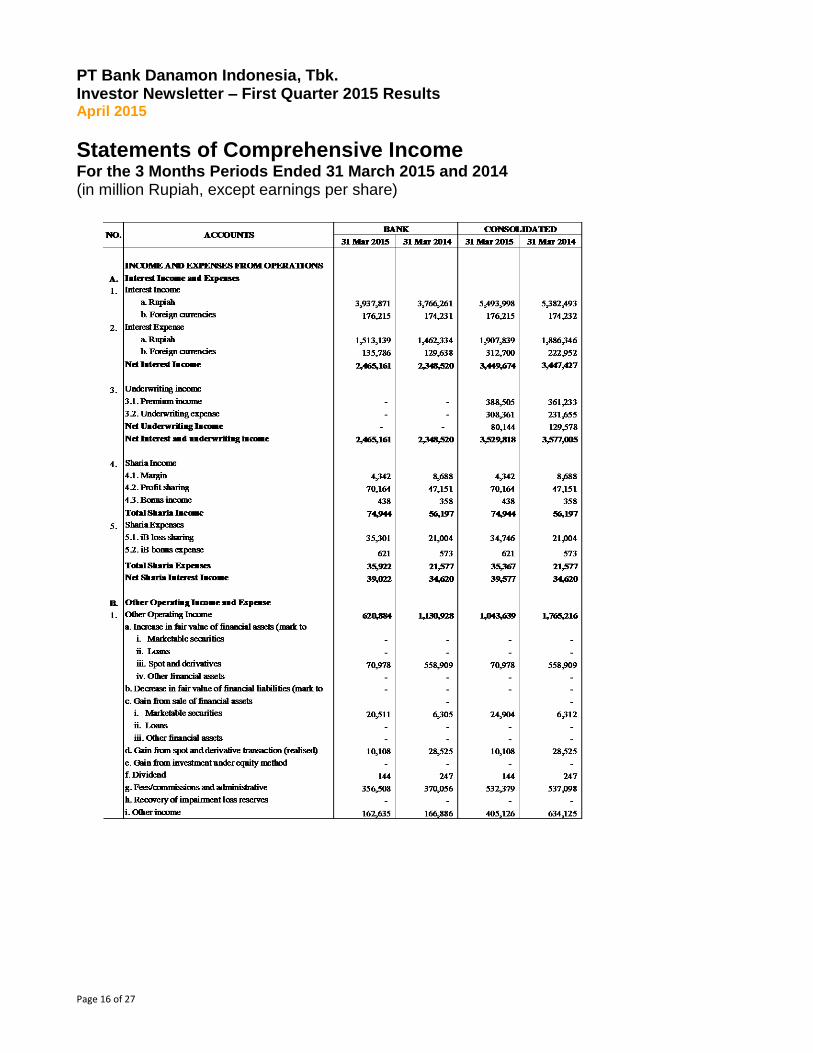
Statements of Comprehensive Income For the 3 Months Periods Ended 31 March 2015 and 2014 (in million Rupiah, except earnings per share)
PT Bank Danamon Indonesia, Tbk. Investor Newsletter – First Quarter 2015 Results April 2015
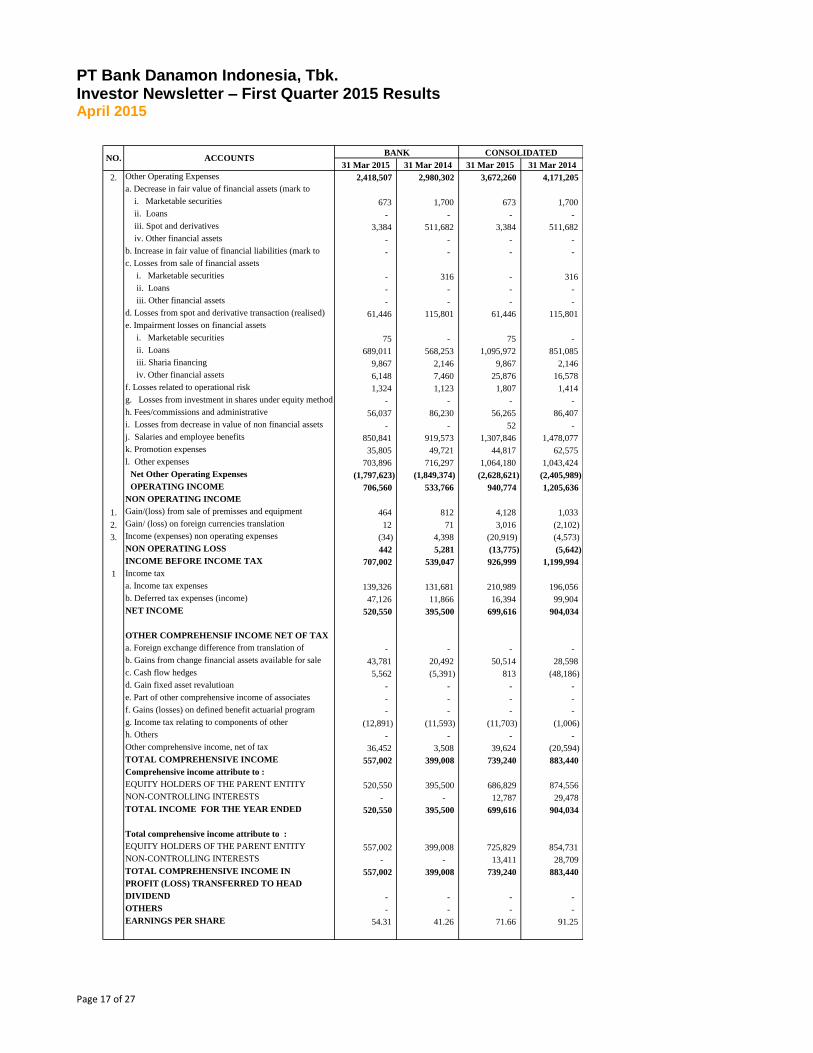
Page 17 of 27
31 Mar 2015 31 Mar 2014 31 Mar 2015 31 Mar 2014
2. Other Operating Expenses 2,418,507 2,980,302 3,672,260 4,171,205
a. Decrease in fair value of financial assets (mark to
market) i. Marketable securities 673 1,700 673 1,700
ii. Loans - - - -
iii. Spot and derivatives 3,384 511,682 3,384 511,682
iv. Other financial assets - - - -
b. Increase in fair value of financial liabilities (mark to
market) - - - -
c. Losses from sale of financial assets
i. Marketable securities - 316 - 316
ii. Loans - - - -
iii. Other financial assets - - - -
d. Losses from spot and derivative transaction (realised) 61,446 115,801 61,446 115,801
e. Impairment losses on financial assets
i. Marketable securities 75 - 75 -
ii. Loans 689,011 568,253 1,095,972 851,085
iii. Sharia financing 9,867 2,146 9,867 2,146
iv. Other financial assets 6,148 7,460 25,876 16,578
f. Losses related to operational risk 1,324 1,123 1,807 1,414
g. Losses from investment in shares under equity method - - - -
h. Fees/commissions and administrative 56,037 86,230 56,265 86,407
i. Losses from decrease in value of non financial assets - - 52 -
j. Salaries and employee benefits 850,841 919,573 1,307,846 1,478,077
k. Promotion expenses 35,805 49,721 44,817 62,575
l. Other expenses 703,896 716,297 1,064,180 1,043,424
Net Other Operating Expenses (1,797,623) (1,849,374) (2,628,621) (2,405,989)
OPERATING INCOME 706,560 533,766 940,774 1,205,636
NON OPERATING INCOME
1. Gain/(loss) from sale of premisses and equipment 464 812 4,128 1,033
2. Gain/ (loss) on foreign currencies translation 12 71 3,016 (2,102)
3. Income (expenses) non operating expenses (34) 4,398 (20,919) (4,573)
NON OPERATING LOSS 442 5,281 (13,775) (5,642)
INCOME BEFORE INCOME TAX 707,002 539,047 926,999 1,199,994
1 Income tax
a. Income tax expenses 139,326 131,681 210,989 196,056
b. Deferred tax expenses (income) 47,126 11,866 16,394 99,904
NET INCOME 520,550 395,500 699,616 904,034
OTHER COMPREHENSIF INCOME NET OF TAX
a. Foreign exchange difference from translation of
financial statements in foreign currency - - - -
b. Gains from change financial assets available for sale 43,781 20,492 50,514 28,598
c. Cash flow hedges 5,562 (5,391) 813 (48,186)
d. Gain fixed asset revalutioan - - - -
e. Part of other comprehensive income of associates - - - -
f. Gains (losses) on defined benefit actuarial program - - - -
g. Income tax relating to components of other
comprehensive income (12,891) (11,593) (11,703) (1,006)
h. Others - - - -
Other comprehensive income, net of tax 36,452 3,508 39,624 (20,594)
TOTAL COMPREHENSIVE INCOME 557,002 399,008 739,240 883,440
Comprehensive income attribute to :
EQUITY HOLDERS OF THE PARENT ENTITY 520,550 395,500 686,829 874,556
NON-CONTROLLING INTERESTS - - 12,787 29,478
TOTAL INCOME FOR THE YEAR ENDED 520,550 395,500 699,616 904,034
Total comprehensive income attribute to :
EQUITY HOLDERS OF THE PARENT ENTITY 557,002 399,008 725,829 854,731
NON-CONTROLLING INTERESTS - - 13,411 28,709
TOTAL COMPREHENSIVE INCOME IN
CURRENT YEARS
557,002 399,008 739,240 883,440
PROFIT (LOSS) TRANSFERRED TO HEAD
OFFICEDIVIDEND - - - -
OTHERS - - - -
EARNINGS PER SHARE 54.31 41.26 71.66 91.25
CONSOLIDATEDNO. ACCOUNTS
BANK
PT Bank Danamon Indonesia, Tbk. Investor Newsletter – First Quarter 2015 Results April 2015
Page 18 of 27
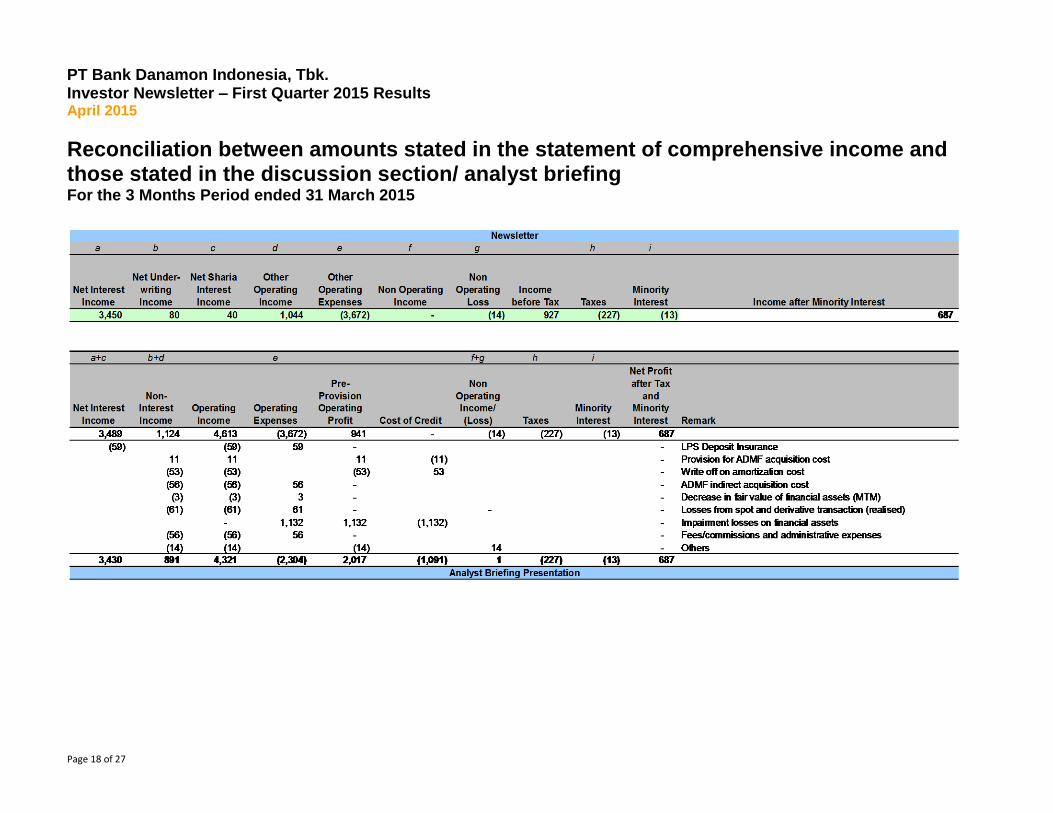
Reconciliation between amounts stated in the statement of comprehensive income and those stated in the discussion section/ analyst briefing For the 3 Months Period ended 31 March 2015
PT Bank Danamon Indonesia, Tbk. Investor Newsletter – First Quarter 2015 Results April 2015
Page 19 of 27
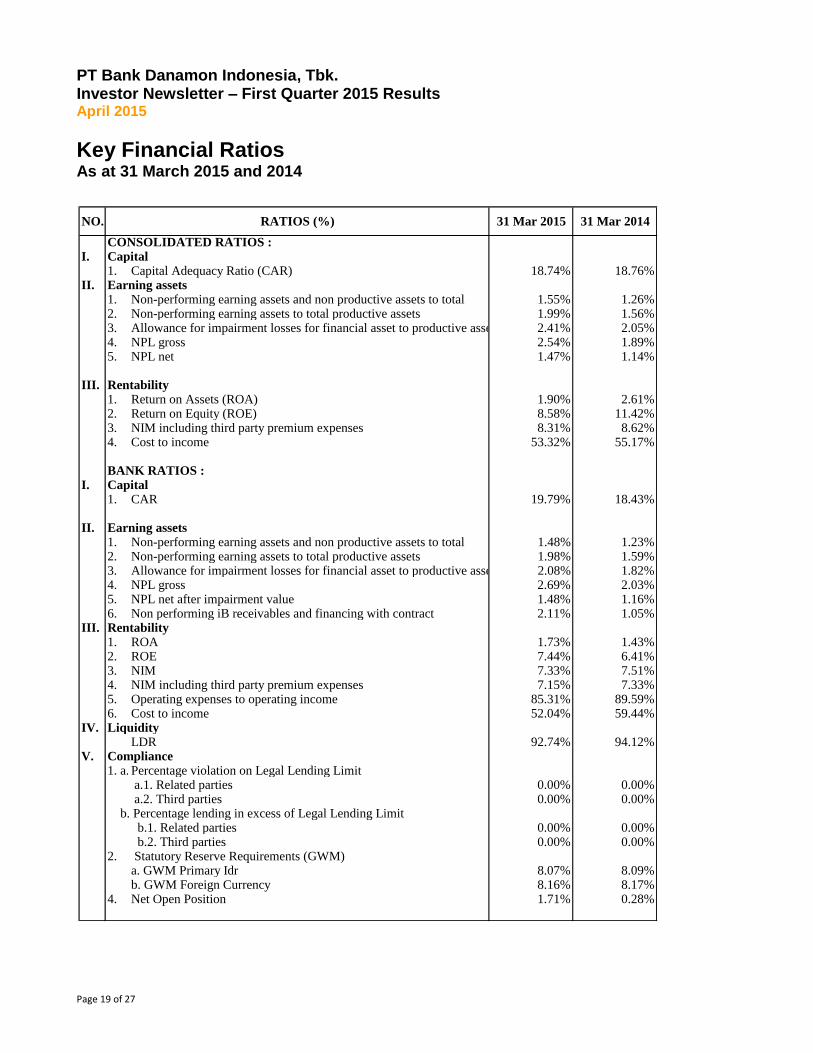
Key Financial Ratios As at 31 March 2015 and 2014
CONSOLIDATED RATIOS :I. Capital
1. Capital Adequacy Ratio (CAR) 18.74% 18.76%II. Earning assets
1. Non-performing earning assets and non productive assets to total 1.55% 1.26%2. Non-performing earning assets to total productive assets 1.99% 1.56%3. Allowance for impairment losses for financial asset to productive asset 2.41% 2.05%4. NPL gross 2.54% 1.89%5. NPL net 1.47% 1.14%
III. Rentability1. Return on Assets (ROA) 1.90% 2.61%2. Return on Equity (ROE) 8.58% 11.42%3. NIM including third party premium expenses 8.31% 8.62%4. Cost to income 53.32% 55.17%
BANK RATIOS :I. Capital
1. CAR 19.79% 18.43%
II. Earning assets1. Non-performing earning assets and non productive assets to total 1.48% 1.23%2. Non-performing earning assets to total productive assets 1.98% 1.59%3. Allowance for impairment losses for financial asset to productive asset 2.08% 1.82%4. NPL gross 2.69% 2.03%5. NPL net after impairment value 1.48% 1.16%6. Non performing iB receivables and financing with contract 2.11% 1.05%
III. Rentability1. ROA 1.73% 1.43%2. ROE 7.44% 6.41%3. NIM 7.33% 7.51%4. NIM including third party premium expenses 7.15% 7.33%5. Operating expenses to operating income 85.31% 89.59%6. Cost to income 52.04% 59.44%
IV. LiquidityLDR 92.74% 94.12%
V. Compliance1. a. Percentage violation on Legal Lending Limit
a.1. Related parties 0.00% 0.00% a.2. Third parties 0.00% 0.00%
b. Percentage lending in excess of Legal Lending Limit b.1. Related parties 0.00% 0.00% b.2. Third parties 0.00% 0.00%
2. Statutory Reserve Requirements (GWM)a. GWM Primary Idr 8.07% 8.09%b. GWM Foreign Currency 8.16% 8.17%
4. Net Open Position 1.71% 0.28%
31 Mar 2014NO. RATIOS (%) 31 Mar 2015
PT Bank Danamon Indonesia, Tbk. Investor Newsletter – First Quarter 2015 Results April 2015
Page 20 of 27
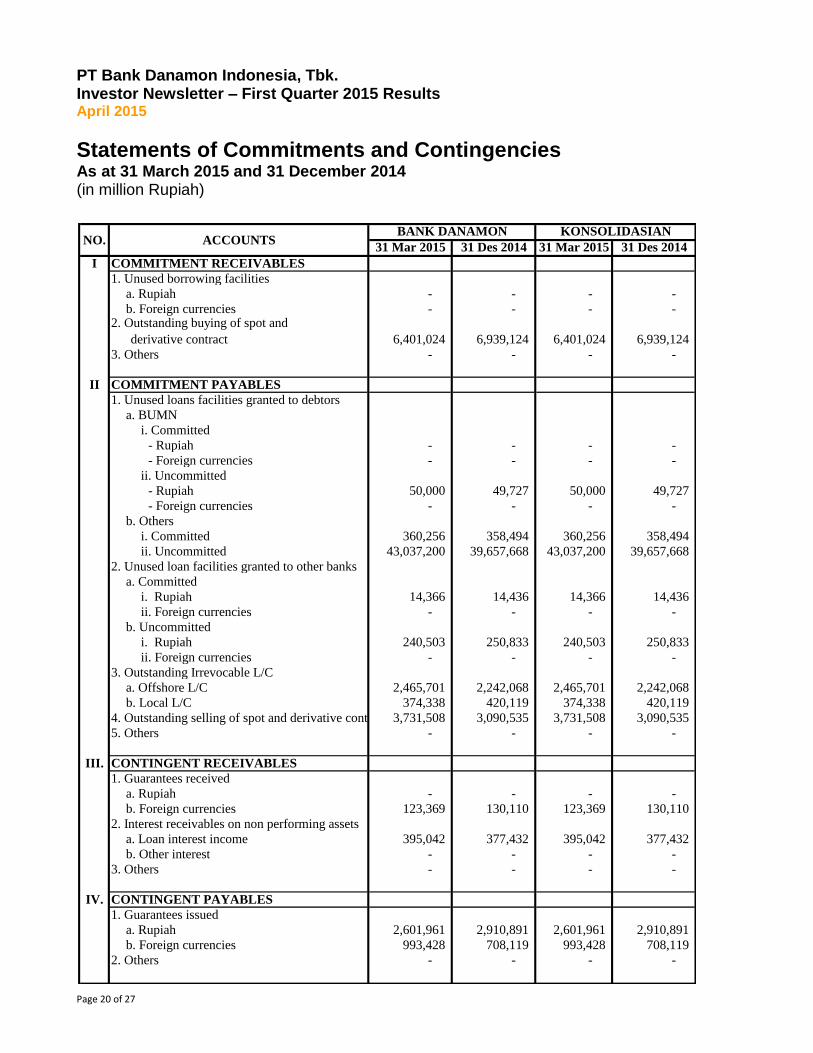
Statements of Commitments and Contingencies As at 31 March 2015 and 31 December 2014 (in million Rupiah)
31 Mar 2015 31 Des 2014 31 Mar 2015 31 Des 2014
I COMMITMENT RECEIVABLES
1. Unused borrowing facilities
a. Rupiah - - - -
b. Foreign currencies - - - - 2. Outstanding buying of spot and
derivative contract 6,401,024 6,939,124 6,401,024 6,939,124
3. Others - - - -
II COMMITMENT PAYABLES
1. Unused loans facilities granted to debtors
a. BUMN
i. Committed
- Rupiah - - - -
- Foreign currencies - - - -
ii. Uncommitted
- Rupiah 50,000 49,727 50,000 49,727
- Foreign currencies - - - -
b. Others
i. Committed 360,256 358,494 360,256 358,494
ii. Uncommitted 43,037,200 39,657,668 43,037,200 39,657,668
2. Unused loan facilities granted to other banks
a. Committed
i. Rupiah 14,366 14,436 14,366 14,436
ii. Foreign currencies - - - -
b. Uncommitted
i. Rupiah 240,503 250,833 240,503 250,833
ii. Foreign currencies - - - -
3. Outstanding Irrevocable L/C
a. Offshore L/C 2,465,701 2,242,068 2,465,701 2,242,068
b. Local L/C 374,338 420,119 374,338 420,119
4. Outstanding selling of spot and derivative contract 3,731,508 3,090,535 3,731,508 3,090,535
5. Others - - - -
III. CONTINGENT RECEIVABLES
1. Guarantees received
a. Rupiah - - - -
b. Foreign currencies 123,369 130,110 123,369 130,110
2. Interest receivables on non performing assets
a. Loan interest income 395,042 377,432 395,042 377,432
b. Other interest - - - -
3. Others - - - -
IV. CONTINGENT PAYABLES
1. Guarantees issued
a. Rupiah 2,601,961 2,910,891 2,601,961 2,910,891
b. Foreign currencies 993,428 708,119 993,428 708,119
2. Others - - - -
BANK DANAMON KONSOLIDASIANNO. ACCOUNTS

PT Bank Danamon Indonesia, Tbk. Investor Newsletter – First Quarter 2015 Results April 2015
Page 21 of 27
Asset Quality and Other Information As at 31 March 2015 and 2014 (in million Rupiah)
CurrentSpecial
MentionSubstandard Doubtful Loss Total Current
Special
MentionSubstandard Doubtful Loss Total
I. RELATED PARTIES
1. Placements with other banks
a. Rupiah 125,444 - - - - 125,444 116,328 - - - - 116,328
b. Foreign currencies 235,242 - - - - 235,242 632,852 - - - - 632,852
2. Spot and derivative receivables
a. Rupiah - - - - - - - - - - - -
b. Foreign currencies 4 - - - - 4 20 - - - - 20
3. Marketable securities
a. Rupiah 71,780 - - - - 71,780 39,246 - - - - 39,246
b. Foreign currencies 3,744 - - - - 3,744 6,524 - - - - 6,524
4. Securities sold under repurchase agreements (repo)
a. Rupiah - - - - - - - - - - - -
b. Foreign currencies - - - - - - - - - - - -
5. Securities purchased under resale agreements (reverse repo)
a. Rupiah - - - - - - - - - - - -
b. Foreign currencies - - - - - - - - - - - -
6. Acceptance receivables - - - - - - 1,120 - - - - 1,120
7. Loans
a. Debtor micro, small and medium
i. Rupiah 8 - - - - 8 1,926 13 - - - 1,939
ii. Foreign currencies - - - - - - - - - - - -
b. Non debtor micro, small and medium
i. Rupiah 20,815 - - - - 20,815 22,465 332 - - - 22,797
ii. Foreign currencies - - - - - - - - - - - -
c. Restructured
i. Rupiah - - - - - - - - - - - -
i. Foreign currencies - - - - - - - - - - - -
d. Properties loan 18,259 - - - - 18,259 20,554 330 - - - 20,884
8. Investments 2,645,312 - - - - 2,645,312 2,645,312 - - - - 2,645,312
9. Temporary equity investment - - - - - - - - - - - -
10. Others receivables - - - - - - - - - - - -
11. Commitments and contingencies to third parties
a. Rupiah 1,221,090 - - - - 1,221,090 1,220,966 - - - - 1,220,966
b. Foreign currencies - - - - - - - - - - - -
12. Idle properties - - - - - - - - - - - -
13. Foreclosed assets - - - - - - - - - - - -
14. Suspense accounts - - - - - - - - - - - -
II. NON RELATED PARTIES
1. Placements with other banks
a. Rupiah 1,606,053 - - - - 1,606,053 522,426 - - - - 522,426
b. Foreign currencies 8,111,360 - - - - 8,111,360 7,978,782 - - - - 7,978,782
2. Spot and derivative receivables
a. Rupiah 258,241 - - - - 258,241 166,814 - - - - 166,814
b. Foreign currencies 44,670 - - - - 44,670 29,891 - - - - 29,891
3. Marketable securities
a. Rupiah 13,860,742 - - - 20,000 13,880,742 11,231,158 - - - 20,000 11,251,158
b. Foreign currencies 2,505,768 - - - - 2,505,768 929,496 - - - - 929,496
4. Securities sold under repurchase agreements (repo)
a. Rupiah 935,072 - - - - 935,072 928,772 - - - - 928,772
b. Foreign currencies - - - - - - - - - - - -
5. Securities purchased under resale agreements (reverse repo)
a. Rupiah 99,694 - - - - 99,694 - - - - - -
b. Foreign currencies - - - - - - - - - - - -
6. Acceptance receivables 7,160,870 - - - - 7,160,870 4,361,410 - - - - 4,361,410
7. Loans
a. Debtor micro, small and medium
i. Rupiah 28,152,604 2,311,985 271,446 457,145 985,787 32,178,967 30,177,994 2,011,439 271,816 415,937 671,218 33,548,404
ii. Foreign currencies 241,008 - - - 3,050 244,058 264,454 2,932 - - 540 267,926
b. Non debtor micro, small and medium
i. Rupiah 57,966,869 5,070,280 280,925 272,727 285,573 63,876,374 55,505,443 4,445,887 146,533 208,595 267,038 60,573,496
ii. Foreign currencies 9,657,852 1,009,169 14,304 21,813 261,824 10,964,962 10,354,955 459,418 - - 140,242 10,954,615 c. Restructured
i. Rupiah 909,581 704,218 74,395 74,038 167,511 1,929,743 687,693 388,858 48,417 57,207 150,235 1,332,410
ii. Foreign currencies 142,356 860,861 - - 257,435 1,260,652 233,826 391,938 - - 37,205 662,969
d. Properties loan 4,553,034 179,049 25,656 16,918 44,258 4,818,915 4,310,530 156,398 7,610 6,919 22,763 4,504,220
8. Investments 164,441 25 - - - 164,466 12,055 25 - - - 12,080
9. Temporary equity investment - - - - - - - - - - - -
10. Others receivables 3,890 718 - - - 4,608 96,319 227 - - - 96,546
11. Commitments and contingencies to third parties
a. Rupiah 33,098,164 196,112 4,950 - - 33,299,226 27,417,588 168,267 - - - 27,585,855
b. Foreign currencies 15,443,740 173,698 - - - 15,617,438 11,279,726 133,254 - - - 11,412,980
12. Idle properties - - - - 16,397 16,397 - - - 1,908 14,381 16,289
13. Foreclosed assets - - - 80 419 499 - - - 540 434 974
14. Suspense accounts 737 - - - - 737 1,086 - - - - 1,086
III. OTHERS INFORMATION
1. Collateralised assets
a. To Bank Indonesia - -
b. To other parties - -
2. Total Allowance for impairment losses on financial assets -/- 3,012,971 2,453,752
3. Minimum required allowance for possible losses on assets 3,208,581 2,670,508
4. Percentage of micro, small and medium enterprises credit to total
loans 30.22% 32.10%
5. Percentage of micro and small enterprises credit to total loans 11.78% 13.62%
6. Percentage of micro, small and medium enterprises debtors to total
debtors 9.48% 9.93%
7. Percentage of micro and small enterprises debtor to total debtors 7.83% 8.47%
8. Others - -
a. Chanelling loans 350,623 350,639
b. Chanelling loans Mudharabah Muqayadah - -
c. Written-off earning assets 681,791 606,885
d. Recovery on written-off earning assets 173,085 180,292
e. Charged-off earning assets 1,312,426 661,107
NO. ACCOUNTS
31 Maret 2015 31 Maret 2014
PT Bank Danamon Indonesia, Tbk. Investor Newsletter – First Quarter 2015 Results April 2015
Page 22 of 27
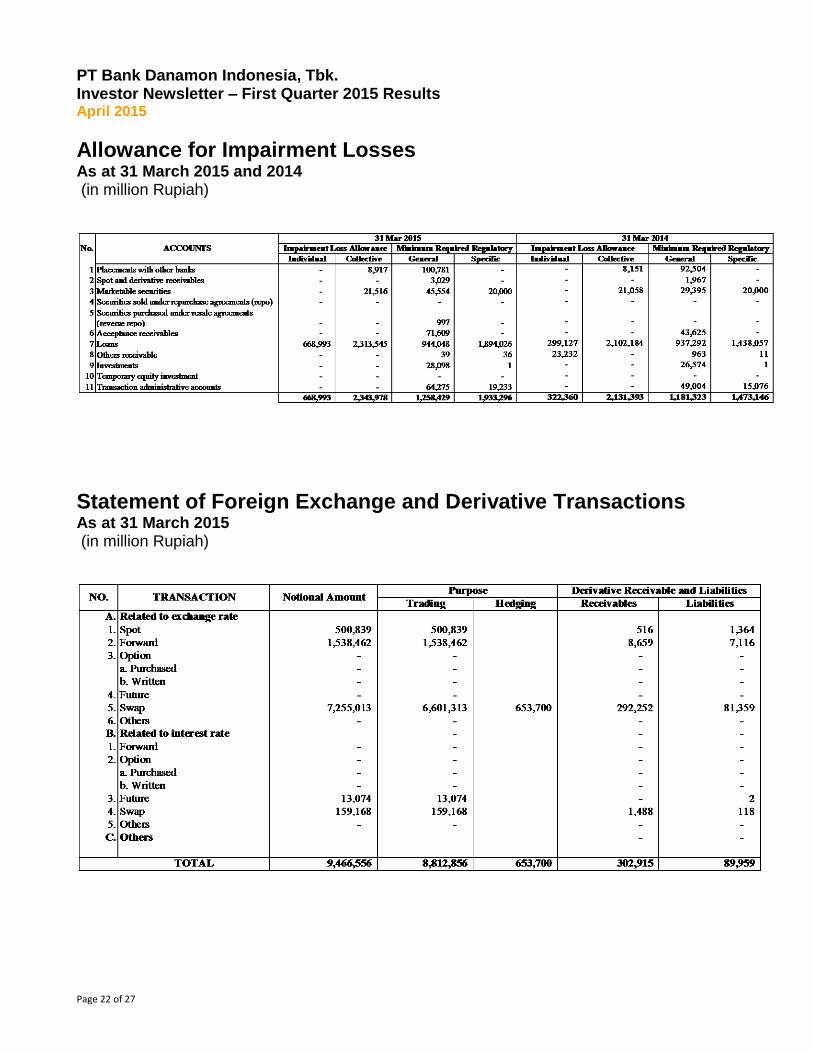
Allowance for Impairment Losses As at 31 March 2015 and 2014 (in million Rupiah)
Statement of Foreign Exchange and Derivative Transactions As at 31 March 2015 (in million Rupiah)
PT Bank Danamon Indonesia, Tbk. Investor Newsletter – First Quarter 2015 Results April 2015
Page 23 of 27
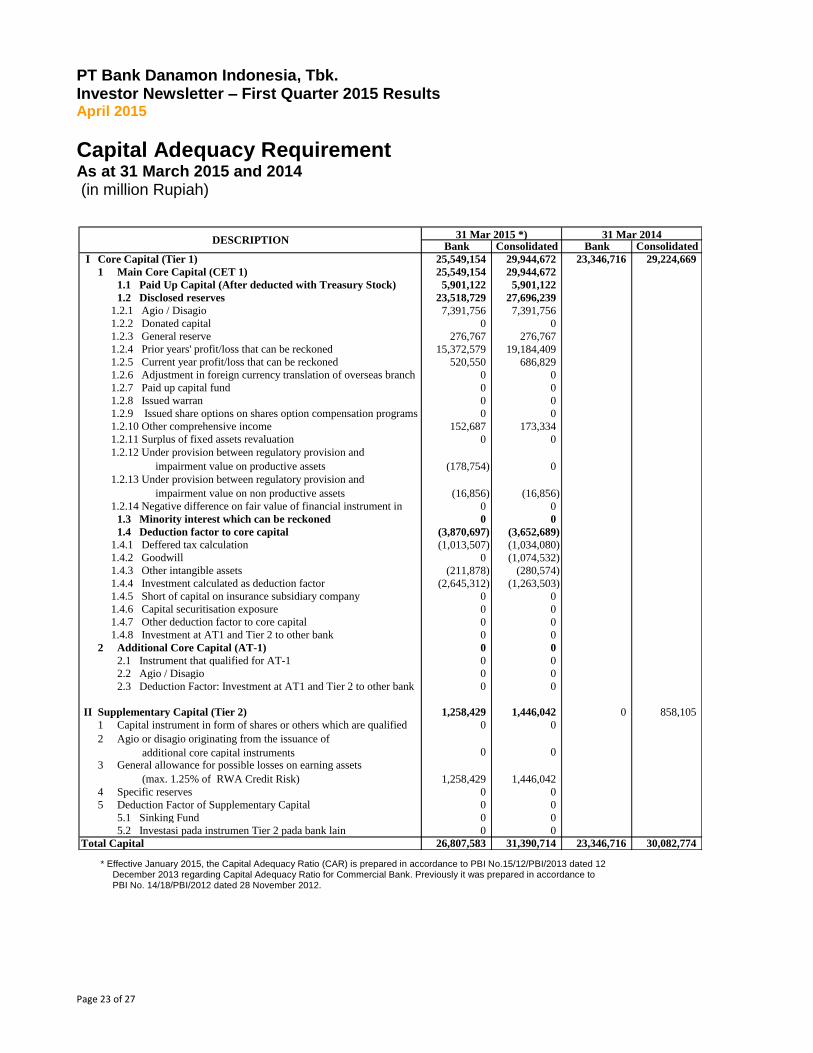
Capital Adequacy Requirement As at 31 March 2015 and 2014 (in million Rupiah)
* Effective January 2015, the Capital Adequacy Ratio (CAR) is prepared in accordance to PBI No.15/12/PBI/2013 dated 12 December 2013 regarding Capital Adequacy Ratio for Commercial Bank. Previously it was prepared in accordance to PBI No. 14/18/PBI/2012 dated 28 November 2012.
Bank Consolidated Bank Consolidated
I Core Capital (Tier 1) 25,549,154 29,944,672 23,346,716 29,224,669
1 Main Core Capital (CET 1) 25,549,154 29,944,672
1.1 Paid Up Capital (After deducted with Treasury Stock) 5,901,122 5,901,122
1.2 Disclosed reserves 23,518,729 27,696,239
7,391,756 7,391,756
0 0
276,767 276,767
15,372,579 19,184,409
520,550 686,829
0 0
0 0
0 0
0 0
152,687 173,334
0 0
(178,754) 0
(16,856) (16,856)
0 0
1.3 Minority interest which can be reckoned 0 0
1.4 Deduction factor to core capital (3,870,697) (3,652,689)
(1,013,507) (1,034,080)
0 (1,074,532)
(211,878) (280,574)
(2,645,312) (1,263,503)
0 0
0 0
0 0
0 0
2 Additional Core Capital (AT-1) 0 0
2.1 Instrument that qualified for AT-1 0 0
2.2 Agio / Disagio 0 0
2.3 Deduction Factor: Investment at AT1 and Tier 2 to other bank 0 0
II Supplementary Capital (Tier 2) 1,258,429 1,446,042 0 858,105
1 Capital instrument in form of shares or others which are qualified 0 0
0 0
1,258,429 1,446,042
4 Specific reserves 0 0
5 Deduction Factor of Supplementary Capital 0 0
5.1 Sinking Fund 0 0
5.2 Investasi pada instrumen Tier 2 pada bank lain 0 0
26,807,583 31,390,714 23,346,716 30,082,774
2 Agio or disagio originating from the issuance of
additional core capital instruments3 General allowance for possible losses on earning assets
(max. 1.25% of RWA Credit Risk)
1.2.5 Current year profit/loss that can be reckoned
1.2.6 Adjustment in foreign currency translation of overseas branch
DESCRIPTION
1.2.3 General reserve
1.2.4 Prior years' profit/loss that can be reckoned
1.2.7 Paid up capital fund
1.2.8 Issued warran
1.2.9 Issued share options on shares option compensation programs
1.2.10 Other comprehensive income
31 Mar 2015 *) 31 Mar 2014
1.2.1 Agio / Disagio
1.2.2 Donated capital
1.2.11 Surplus of fixed assets revaluation
1.2.12 Under provision between regulatory provision and
impairment value on productive assets
1.2.13 Under provision between regulatory provision and
impairment value on non productive assets
1.2.14 Negative difference on fair value of financial instrument in
1.4.1 Deffered tax calculation
1.4.2 Goodwill
1.4.8 Investment at AT1 and Tier 2 to other bank
1.4.3 Other intangible assets
1.4.4 Investment calculated as deduction factor
1.4.5 Short of capital on insurance subsidiary company
Total Capital
1.4.6 Capital securitisation exposure
1.4.7 Other deduction factor to core capital

PT Bank Danamon Indonesia, Tbk. Investor Newsletter – First Quarter 2015 Results April 2015
Page 24 of 27
* Effective January 2015, the Capital Adequacy Ratio (CAR) is prepared in accordance to PBI No.15/12/PBI/2013 dated 12 December 2013 regarding Capital Adequacy Ratio for Commercial Bank. Previously it was prepared in accordance to PBI No. 14/18/PBI/2012 dated 28 November 2012.
Bank Consolidated Bank Consolidated
CAR RATIO
Main Core Capital (CET 1) Ratio 18.86% 17.88%
Main Capital (Tier 1) Ratio 18.86% 17.88% 18.43% 18.22%
Supplementary Capital (Tier 2) Ratio 0.93% 0.86% 0.00% 0.54%
Total Ratio 19.79% 18.74% 18.43% 18.76%
31 Mar 201431 Mar 2015 *)DESCRIPTION

PT Bank Danamon Indonesia, Tbk. Investor Newsletter – First Quarter 2015 Results April 2015
Page 25 of 27
Sharia Unit
BALANCE SHEETS
AS AT 31 MARCH 2015 AND 2014
(In million Rupiah)
NO. ACCOUNTS 31 Mar 2015 31 Mar 2014
A. ASSETS
1. Cash 13,051 37,964
2. Current accounts with Bank Indonesia 128,443 102,063
3. Certificates of Bank Indonesia Sharia 82,000 635,000
4. Placement with other sharia banks - -
Allowance for possible losses on placement with other sharia banks -/- - -
5. Marketable securities - sharia bonds 95,000 95,000
Allowance for possible losses on marketable securities - sharia bonds -/- (20,750) (20,750)
6. iB receivables *) 165,772 236,355
Allowance for possible losses on iB receivables -/- (14,251) (16,022)
7. Others iB receivables 31,221 120,215
Allowance for possible losses on others iB receivables -/- (126) (137)
8. iB financing 2,500,922 1,531,630
Allowance for possible losses on iB financing -/- (37,532) (17,209)
9. Fixed assets 26,656 27,413
Accumulated depreciation of fixed assets -/- (18,605) (10,934)
10. Accrued income 19,407 14,558
11. Prepaid expenses 5,332 36,603
12. Other assets 3,684 2,621
TOTAL ASSETS 2,980,224 2,774,370
B. LIABILITIES
1. iB funds
a. iB deposit current accounts 248,174 244,279
b. iB deposit savings 4,769 4,135
2. Others iB current liabilities 3,925 3,332
3. Liabilities to Bank Indonesia (FPJPS) - -
4. Deposits from other banks 497,954 34,488
5. iB marketable securities issued - 50,000
6. Others liabilities 239,185 538,566
7. Investment funds
a. iB savings 478,617 488,925
b. iB deposits 1,498,826 1,404,183
8. Accumulated gain/(loss) 8,774 6,462
TOTAL LIABILITIES 2,980,224 2,774,370
0 -
STATEMENTS OF INCOME
FOR THE YEAR ENDED 31 MARCH 2015 AND 2014
(In million Rupiah)
NO. ACCOUNTS 31 Mar 2015 31 Mar 2014
A. OPERATING INCOME
1. Margin 4,342 8,688
2. Profit sharing 70,164 47,151
3. iB Bonus 438 358
4. Other operating income 12,296 15,680
B. TOTAL OPERATING INCOME 87,240 71,877
C. Margin distribution for non - discretionary investment funds
a. Bank 5,514 180
b. Non Bank 29,787 20,824
c. Bank Indonesia (FPJPS) - -
D. TOTAL PROFIT SHARING 35,301 21,004
E. Income from operation after deducting margin
distribution for non-discretionary investment funds 51,939 50,873
F. OPERATING EXPENSES
1, iB bonus 621 573
2. Allowance for possible losses on assets 9,899 2,427
3. General and administrative 1,958 5,732
4. Salaries and employee benefits 21,764 26,514
5. Others 5,225 6,805
G. TOTAL OPERATING EXPENSE 39,467 42,051
H. NET OPERATING INCOME 12,472 8,822
I. Other non-operating income 34 175
J. Other non-operating expenses 3,732 2,535
K. NON-OPERATING LOSS (3,698) (2,360)
L. NET INCOME/(LOSS) PERIOD ENDED 8,774 6,462
STATEMENTS OF COMMITMENTS AND CONTINGENCIES
AS AT 31 MARCH 2015 AND 2014
(In million Rupiah)
NO. ACCOUNTS 31 Mar 2015 31 Mar 20141. Unused iB financing facilites **) - -
2. Outstanding iB irrevocable letters of credit - -
3. iB guarantees issued - -
4. Others 3,661 2,404
Notes:
*) iB receivables exclude margin to be received of Rp 30,266 million and Rp 49,066
million as at 31 March 2015 and 2014, respectively.**) This unused iB financing facilites is only for committed facilities.
PT Bank Danamon Indonesia, Tbk. Investor Newsletter – First Quarter 2015 Results April 2015
Page 26 of 27
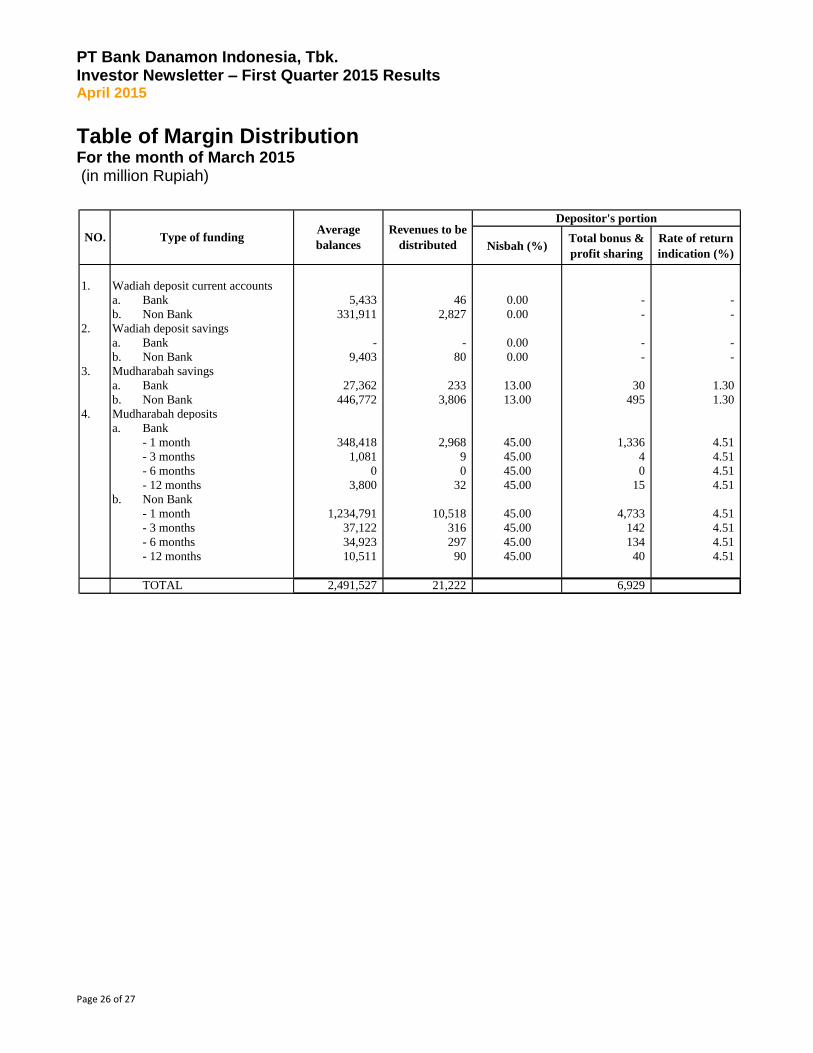
Table of Margin Distribution For the month of March 2015 (in million Rupiah)
Nisbah (%)Total bonus &
profit sharing
Rate of return
indication (%)
1. Wadiah deposit current accounts
a. Bank 5,433 46 0.00 - -
b. Non Bank 331,911 2,827 0.00 - -
2. Wadiah deposit savings
a. Bank - - 0.00 - -
b. Non Bank 9,403 80 0.00 - -
3. Mudharabah savings
a. Bank 27,362 233 13.00 30 1.30
b. Non Bank 446,772 3,806 13.00 495 1.30
4. Mudharabah deposits
a. Bank
- 1 month 348,418 2,968 45.00 1,336 4.51
- 3 months 1,081 9 45.00 4 4.51
- 6 months 0 0 45.00 0 4.51
- 12 months 3,800 32 45.00 15 4.51
b. Non Bank
- 1 month 1,234,791 10,518 45.00 4,733 4.51
- 3 months 37,122 316 45.00 142 4.51
- 6 months 34,923 297 45.00 134 4.51
- 12 months 10,511 90 45.00 40 4.51
TOTAL 2,491,527 21,222 6,929
NO.
Depositor's portion
Type of fundingAverage
balances
Revenues to be
distributed
PT Bank Danamon Indonesia, Tbk. Investor Newsletter – Full Year 2014 Results April 2015
Page 27 of 27
Notes to the Financial Statements
1. The above financial information is extracted from the consolidated financial statements of PT Bank
Danamon Indonesia Tbk. (the "Bank") and its subsidiaries as of March 31, 2015 and for the three-
month periods then ended, prepared by the Bank's management in accordance with Indonesian
Financial Accounting Standards. The above financial information does not contain notes to the
consolidated financial statements.
The above published report are presented in order to comply with the Circular Letter of Bank
Indonesia (SE BI) No. 13/30/DPnP dated 16 December 2011 regarding “Third Amendment on
Bank Indonesia Circular Letter No. 3/30/DPnP dated 14 December 2001 regarding Quarterly and
Monthly Published Financial Statements of Commercial Bank and Certain Reports Submitted to
Bank Indonesia” and in accordance with Regulation of Capital Market and Financial Institution
Supervisory Agency (“Bapepam-LK” which function has been transferred to Financial Service
Authority (”OJK”) starting 1 January 2013) No. VIII.G.7. Attachment to Decision of Chairman of
Bapepam and LK No. Kep-347/BL/2012 regarding “Financial Statements Presentation and
Disclosure of Issuer or Public Companies” jo. Decision of Chairman of Bapepam and LK. No. KEP-
554/BL/2010 dated 30 December 2010 regarding “Amendment on Decision of Chairman of Capital
Market Supervisory Agency No. KEP-06/PM/2000 dated 13 March 2000 regarding Guidelines for
the Preparation of Financial Statements” jo. Circular Letter of Chairman of Bapepam No. SE-
02/PM/2002 regarding “Guidelines for Presentation and Disclosure of Financial Statements of
Issuer or Public Companies”, and Regulation No. X.K.2 Attachment to Decision of Chairman of
Bapepam-LK No. Kep-346/BL/2011 dated 5 July 2011 regarding “Submission Obligation of
Periodic Financial Statements”.
2. The consolidated financial statements as at 31 March 2015 and for the three-month periods then
ended included financial statements of subsidiaries, i.e. PT Adira Dinamika Multi Finance, Tbk., PT
Asuransi Adira Dinamika, and PT Adira Quantum Multifinance.
3. The ultimate shareholder of Asia Financial (Indonesia) Pte. Ltd. (AFI) is Temasek Holding Pte.
Ltd., an investment holding company based in Singapore which is wholly owned by the Ministry of
Finance of Singapore.
4. Exchange rate as at 31 March 2015: USD 1 = Rp13,074; Exchange rate as at 31 Desember 2014:
USD 1 = Rp12,385; Exchange rate as at 31 March 2014: USD 1 = Rp11,360.


