
Int. Journal of Economics and Management 5(1): 179 – 215 (2011) ISSN 1823 - 836X
Are There Prospects for Future Economic Integration Among Muslim Countries? Evidence from Selected OIC Countries
RuzIta Mohd. aMINa*, zaRINah haMIdb aNd NoRMa Md. Saadc
a,b,cInternational Islamic University Malaysia, Malaysia
AbSTrACTSince mid-1980s, trade has been one of the main agenda among the organization of Islamic Conference (oIC) member countries as a means towards achieving higher economic development. January 1st, 2009 has been declared as the target date for the establishment of the trade Preferential System among the oIC countries, by which date intra-trade should be increased to 20%. Malaysia, which is considered to be one of the more successful economies among the oIC countries, is expected to play a pivotal role in enhancing intra-trade and ensuring that the targets are achieved. this paper investigates the degree of intra-trade activities among six oIC members, namely Egypt, Jordan, Malaysia, Saudi arabia, Syria and oman. It analyzes the trade structure of these oIC members utilizing “revealed comparative advantage” indices, “trade concentration”, and “trade competition” profiles. The findings show only small potentials for higher intra-OIC trade, generally in chemicals and materials, food and live animals, manufactured goods, and machinery and transport equipment. this indicates that much greater efforts need to be undertaken by oIC countries to prepare themselves for the establishment of an Islamic Common Market.
Keywords: economic integration, oIC countries, trade concentration, trade divergence, revealed comparative advantage
InTrOduCTIOnthe last decade has seen an increasing emphasis on economic integration among various groups of countries in the world. Integration has the potential to create a
* Corresponding author: E-mail: [email protected] remaining errors or omissions rest solely with the author(s) of this paper.

180
International Journal of Economics and Management
more competitive trade environment from the removal of trade barriers and is also an important impetus for stimulating investment in the member countries from both internal and foreign sources. the larger market as a result of trade integration reduces risk and uncertainty for producers while foreign investors become more inclined to invest in productive capacity in a member country as a way to avoid being excluded by trade restrictions and a high common external tariff (appleyard, 1995). the increased trade and investment through economic integration can, hence, spur economic development among participating countries.
the organization of Islamic Conferences (oIC), as with other groupings, would not be left behind in trying to benefit from economic integration. The OIC is an inter-governmental grouping of fifty-seven countries. Established in Rabat, Kingdom of Morocco, on 25 September 1969, it has the objective of strengthening the solidarity and cooperation among Muslim countries in the political, economic, cultural, scientific and social fields.
Various measures have been undertaken to enhance economic cooperation and, later, integration among members. In May 1976, the idea to establish the Islamic Chamber of Commerce and Industry (ICCI) was proposed in the Seventh Islamic Conference of foreign ministers held in Istanbul, turkey. the idea was subsequently accepted and the constitution of the ICCI adopted by the First and Second Conference of the Chambers of Commerce and Industry in october 1977 and in december 1978, respectively. the ICCI serves as an allied organ of the oIC and represents the private sector of member countries.1 It aims at intensifying greater collaboration in the field of trade, commerce, information technology, insurance/reinsurance, shipping, banking, promotion of investment opportunities and joint ventures in the member countries.
In the late 1990s, the oIC member countries signed an agreement on a trade Preferential System (tPS) and declared the target date for its establishment to be 1 January 2009. the tPS aims at further promoting trade among oIC member states through the exchange of trade preferences to ensure equal and non-discriminatory treatment among participating countries. In the tPS agreement, the exchange preferences are not only limited to tariffs, but will be progressively extended to para-tariff and non-tariff concessions. the tPS agreement also extends trade preferences to all commodities including agricultural and animal products, manufactured or semi-manufactured products.
to date, eleven Islamic Summit conferences and thirty-seven Islamic Conferences of Foreign Ministers (ICFM) have been held. the 10th Islamic Summit Conference held in Putrajaya, Malaysia on 11-18 october 2003, elected Malaysia as the Chairman of the organization until 2008. The Summit reaffirms the desire to intensify trade and economic cooperation and to increase the share of global
1 Its membership consists of the national chambers, unions, federations of chambers of commerce and industry of the member countries.
181
are there Prospects for Future Economic Integration among Muslim Countries?
trade between member countries as well as with other nations. on 17 october 2003, the oIC countries adopted a resolution on the establishment of an Islamic common market.
the declaration of the establishment of the tPS represents a very important step towards increasing the intra-oIC trade to 20% by the target date. In addition, the resolution to establish an Islamic Common market presents a clear indication of the intention to move towards a higher degree of economic integration among member countries. Malaysia, being once the chairman of the oIC and being one of the member countries which is very open to international trade with more than 200% trade to GdP ratio, is expected to play a pivotal role in enhancing trade activities among the oIC countries and ensuring that the targets are achieved.
In view of the above development it is, hence, very pertinent to investigate if the oIC possesses the necessary prerequisites to enable a successful economic integration among its member countries that have different economic and trade characteristics. one of the important questions is whether the oIC countries’ export structures are diverse enough to support higher intra-oIC trade activities. the ability to increase regional exports has been said to depend upon the degree to which countries’ dynamic exports are incorporated in the regional export mix. this means that the extent to which the relative share of intra-oIC trade can be increased depends on the extent to which countries’ dynamic exports are represented in intra-oIC trade. apart from that, the likely success or failure of any regional economic integration is highly dependent on the range of products that members have the capacity to export or import. Members exporting a wide range of diversified goods are considered a positive factor, while concentration of exports is considered a limiting factor to the prospects of increasing regional trade (Pitigala, 2005). Such an argument is based on the product substitution theory where substitutability of products of member countries for those of non-member countries has the effect of increasing the chance of trade creation, representing a positive welfare effect of economic integration (Park, Park & Estrada, 2008).2 Exports of member countries that are highly diversified increase the chances of substitutability of products, hence improving the prospects of a successful regional integration.
this paper investigates the degree of intra-trade activities among six oIC members, namely Egypt, Jordan, Malaysia, Saudi arabia, Syria and oman. Specifically, it examines the extent to which countries’ dynamic exports are represented in intra-OIC trade as well as the extent of trade concentration/ trade diversification by analyzing the “trade divergence”, and “trade concentration” profiles between the years 1990 and 2005. In addition, it checks for trade complementarities and the prospects for higher intra-trade among the selected
2 trade creation arises when higher cost domestic products are replaced with lower cost imports from member countries. The change from an expensive to a cheaper source of supply is beneficial because it is a move toward freer trade.
182
International Journal of Economics and Management
countries and identifies the range of products that members have the capacity to export or import by using the “revealed comparative advantage” indices for the same years. The findings provide an indication as to whether the existing trade structure and trade potentials would facilitate intra-trade among oIC members in their effort towards economic integration. Such information will be useful for member countries to formulate strategies that would foster closer trade relations among themselves.
this paper is organized as follows. the next section provides a survey of literature on regional integration and the use of statistical indices in analyzing intra-trade activities, trade concentration and trade divergence. Section 3 describes the methodology and data used in this study. Section 4 presents the analysis and discussion of the findings while the last section concludes.
LITErATurE rEvIEwthe “natural trading partners” hypothesis introduced by Lipsey (1960) presents one of the early works that deal with the idea of regional integration. the hypothesis suggests that the higher the proportion of intra-trade within the region, the more likely a regional agreement would result in an increase in welfare effects. the natural trading partner hypothesis was later modified by other studies, such as those by Wonnacott and Lutz (1989) and deardoff and Stern (1994) who added location and transportation costs into the analysis in an effort to identify other factors determining regional trade. the “natural trading partners” hypothesis was later popularized as “natural trading blocs” by Krugman (1991) who put emphasis on geographical proximity. these studies found that geographical proximity between countries provides a positive contributing factor to intra-trade activities.
other studies such as Michaely (1996) and Pitigala (2005) have proposed that natural trading partners be defined based on trade complementarity, where the natural trading partner hypothesis is likely to hold if a country imports what its trading partner exports. Michaely (1996), for instance, used the complementarity index and argued that the higher the observed values of the index between partners, the more likely it is that a regional trade agreement will succeed. along similar argument, Pitigala (2005) utilized revealed comparative indices to assess the complementarity of intra-regional trade as a pre-requisite for the potential success of the regional arrangement among the South asian association for Regional Cooperation (SaaRC) countries. he argues that the likely success or failure of any regional economic integration is highly dependent on the range of products that members have the capacity to export or import. Members exporting a wide range of diversified goods are considered a positive factor, while concentration of exports is considered a limiting factor to the prospects of increasing regional trade (Pitigala, 2005).

183
are there Prospects for Future Economic Integration among Muslim Countries?
Trade concentration and diversification of exports have been shown to have impacts on regional trade arrangements. Massell (1964), who performed a cross section analysis of 36 countries and Soutar (1977) who adopted a cross section analysis of 48 less developed countries between 1957 and 1969, found a clear relationship between instability of export earnings and concentration of exports. Massel (1964) further elaborated that trade diversification would be more likely to provide the economy with greater flexibility and stability in export earnings. In a related work, Yeats (1998) reported that studies have shown that countries with highly concentrated exports may experience a relatively high degree of export earning instability that could reduce a country’s ability to maintain the financial commitment required by regional arrangements.
there are many studies that analyzed the relationship between regional trade arrangements and intra-trade, to name a few (Grubel and Llyod: 1975, Greenaway: 1986, 1989, Globerman: 1992, Kim and Lee: 2003 and Chen et al.: 2007). these studies found some evidence that regional trade arrangements stimulate intra-trade among its member countries and vice-versa. Grubel and Llyod (1975) and Greenaway (1986, 1989) for instance, suggest that regional trade arrangements among developed countries stimulate trade by creating a more competitive trade environment as a result of the removal of trade barriers and the possibility of realizing economies of scale. Kim and Lee (2003) highlighted that regional trade arrangements among developing countries such as Mercosur have effects on trade because member countries have significant industrial base in sectors characterized by economies of scale and the existence of preferential treatment in the form of lower tariffs.
The Gini coefficient and the modified version called the Gini-Hirschman coefficient of concentration are commonly used methods for measuring commodity concentration. however, Low, olarreaga and Suarez (1998) used three different concentration indices namely Herfindal-Hirschman concentration index, Theil-entropy coefficient and Mean Logarithm deviation to investigate if globalization has affected the concentration indices. Kali, Mendez and Reyes (2007) highlighted the fact that empirical measures of trade characteristics or trade structures are limited. they used trade dispersion among trading partners as one of the measures of trade structure. as in Low, olarreaga and Suarez (1998), Kali, Mendez and Reyes (2007) constructed a Herfindahl-Hirschman concentration index of trade for all countries to measure trade dispersion among all trading partners. a low value of the index indicates low concentration or high dispersion, and vice versa. the study found trade concentration to be positively correlated with growth for all countries, but the effect is found to be more pronounced for poor countries.
this paper attempts to look at the potential success of economic integration among selected oIC countries by analyzing trade concentration, trade divergence and revealed comparative advantage indices as in Pitigala (2005). In line with

184
International Journal of Economics and Management
Low, olarreaga and Suarez (1998), Pitigala (2005), and Kali, Mendez and Reyes (2007), this study will focus on the export component of trade, except in the case of revealed comparative advantage where both exports and imports are utilized. the advantage of using these measurements is that they allow for a more in-depth analysis at the product level as well as country-level examination which could be used to gauge the prospects for the success of economic integration. Since there has been no such effort to investigate the success of regional trade among the oIC member countries at the disaggregated level, the findings of this paper would serve to provide useful information for the formulation of strategies that would enhance regional economic integration among the members of the grouping. the details of the measurements are described in the next section.
dATA dESCrIPTIOn And METhOdOLOgyThe statistical analysis uses trade data of Malaysia and five other members of the oIC namely Egypt, Jordan, oman, Saudi arabia and Syria for the years 1990 and 2005. the two years are chosen to examine whether the oIC grouping possesses the characteristics that are conducive for the establishment of an Islamic Common Market. Values of the countries’ intra-oIC trade and their trade to the rest of the world (RoW) based on the SItC Revision 2 at 4-digit level were extracted from the uNCoMtRadE data source provided by the World Integrated trade Solution (WItS) database. the SItC 4-digit level is selected since it is the highest level of disaggregation for which comparisons can be carried out. this is due to the fact that consistent reporting of data is unattainable at further disaggregated levels, such as the SItC 6- to 8-digit levels (Pitigala, 2005).
The study confines itself to Malaysia, who is expected to play a pivotal role in enhancing trade activities among the oIC countries being one of the member countries with the most open economy as mentioned earlier, and five other selected OIC countries as listed earlier. The five countries are chosen for the reason that they are mainly located in the Middle-eastern and african region (where most members of the oIC are located geographically) and their economic, trade and preference structures are quite different from those of Malaysia’s. hence, any sign of potentially higher intra-trade activities, particularly among these diverse countries, would provide an indication of the prospects of economic integration among oIC countries as a whole.
In order to compute the share of intra-oIC exports and share of total exports, the disaggregated individual product at 4-digit level is divided by intra-oIC total exports of the individual countries and total exports of individual countries to the rest of the world, respectively. these values are used to calculate the share in the growth of total exports to the oIC and to the rest of the world, between 1990 and

185
are there Prospects for Future Economic Integration among Muslim Countries?
2005. the share in the growth of total exports of each commodity i for country j (Si,j) between 1990 and 2005 can be computed as:
S
X
X X
XX X
,
,
, ,
,
, ,
i j
i j
i
n
i j i j
i
n
i
n
i j
i
n
i j i j
1990
1
2005 1990
11
1990
1
2005 1990
=
-
-
=
=-
-
J
L
KKKK
fN
P
OOOO
p
/
//
/ (1)
which can be simplified to:
SX X
X X,
, ,
, ,
i j
i j i j
i
n
i
n
i j i j
2005 1990
11
2005 1990
=-
-
==
c
^m
h//
(2)
where X ,i j1990 and X ,i j
2005 are export of commodity i of country j for 1990 and 2005,
respectively; X ,i j
i
n1990
1=
/ and X ,i j
i
n2005
1=
/ are total exports of country j for 1990 and 2005,
respectively. the share in equation (1) is derived based on the commutative property of
subtraction where,
X
X X
X
X X
,
, ,
,
, ,
i j
i
n
i j
i
n
i j
i
n
i j
i
n
i j i j
i
n
1990
1
2005
1
1990
1
1990
1
2005 1990
1
-
=
-
=
= =
=
=
c ^m h
/
/ /
/
/
X
X X
X
X X
X
X X
,
, ,
,
, ,
,
, ,
i j
i
n
i j i j
i j
i
n
j j
i j
i
n
n j n j
1990
1
2005 1990
1990
1
22005
21990
1990
1
2005 1990
f f
=-
+-
+ +-
= =
=
^ ^
^
h h
h
/ /
/
(3)

186
International Journal of Economics and Management
dividing equation (3) by the growth of total exports, X
X X
,
, ,
i j
i
n
i j
i
n
i j
i
n
1990
1
2005
1
1990
1
-
=
= =
c m
/
/ / the
equation becomes,
1
X
X X
XX X
X
X X
XX X
X
X X
XX X
,
, ,
,
, ,
,
, ,
,
, ,
,
, ,
,
, ,
i j
i
n
i j
i
n
i j
i
n
i j
i
n
i j i j
i j
i
n
i j
i
n
i j
i
n
i j
i
n
j j
i j
i
n
i j
i
n
i j
i
n
i j
i
n
n j n j
1990
1
2005
1
1990
1
1990
1
2005 1990
1990
1
2005
1
1990
1
1990
1
22005
21990
1990
1
2005
1
1990
1
1990
1
2005 1990
f
=
-
-
+
-
-
+ +
-
-
=
= =
=
=
= =
=
=
= =
=
J
L
KKKK
J
L
KKKK
J
L
KKKK
f f
f
N
P
OOOO
N
P
OOOO
N
P
OOOO
p p
p
/
/ /
/
/
/ /
/
/
/ /
/
(4)
thus,
S S S1 , , ,i j j n j2 f= + + + , or S1 ,i j
i
n
1
==
/ (5)
Collectively, the shares of growth computed are used to identify the dynamic exports of the individual countries, where dynamic exports are defined as products which accounted for a significant amount of total export growth to the region and to the rest of the world between 1990 and 2005. Pitigala (2005) classifies products that account for 75% of total export growth (which exclude marginal products that might not be reported on regular basis) as dynamic exports. For comparison purposes, apart from using the 75% cut-off point as in Pitigala (2005), this study also employs a cut-off point of 95% to identify dynamic exports.
The divergence and concentration of exports are based on the profile of dynamic exports at both the 75% and 95% cut-off points. divergence of exports can be interpreted as the extent to which a country’s dynamic exports to the rest of the world are represented in its regional dynamic exports. Conversely, the divergence of exports can also be defined as the extent of the departure (i.e., differences) of dynamic exports to the region from dynamic exports to the rest of the world. hence, smaller differences (larger similarities) in the dynamic export composition provide an indication for the possibility of higher intra-trade among the selected oIC member countries.

187
are there Prospects for Future Economic Integration among Muslim Countries?
Based on Pitigala (2005), the divergence of exports of country j (Dj) is calculated as:
DC
C
,
,
j
i ROWj
i
k
i OICj
i
k
1
1=
=
=
/
/,
where i = 1, ..., k; k is the number of common dynamic exports to the oIC and RoW, while C ,i OIC
j and C ,i ROWj are common dynamic exports to the oIC and RoW,
respectively. a high value of D j indicates a more similar (or less different) dynamic export composition of a country to the region and to the rest of the world, hence the better the prospects of increasing regional trade. Meanwhile, the concentration of exports at the 75% (or 95%) cut-off point is measured by the number of products accounting for 75% (or 95%) of export growth to the rest of the world between the years 1990 and 2005.
Revealed comparative advantage measures a country’s trade specialization in a commodity group and is defined as a country’s sectoral share divided by the world sectoral share. hence, the IRCAij measures the index of revealed comparative advantage of country i in commodity j as follows:
IRCA X XX X
ijwj w
ij i=
where Xij represents country i’s export of commodity j, Xwj represents world exports of commodity j, Xi represents the total exports of country i, and Xw represents total world exports. the index value ranges between zero and infinity with values greater than unity indicating specialization in that commodity group, while a value between zero and unity indicates no specialization in that commodity group. the top 50 imports of each country are listed and compared to the IRCa of the respective trading partners in order to check for trade complementarities and the prospects for higher intra-trade among the selected countries.
AnALySIS And dISCuSSIOn OF FIndIngS
Overall Trade Patterns of Selected OIC CountriesIn order to evaluate whether the oIC members possess certain fundamental conditions to become a successful grouping, this section first provides a general description of the trade structure of the oIC countries. an analysis of product-level trade data in table 1 suggests that food & live animals, chemicals & materials, and manufactured goods have dominated intra-regional trade in oIC for the past decade. For example, in 2005, the percentage of regional exports that originated in food & live animals was close to 55% for Syria, 36% for oman, 26% for Egypt, and 20%

188
International Journal of Economics and Management
Tabl
e 1
Prod
uct c
ompo
sitio
n of
sele
cted
oIC
cou
ntrie
s’ in
tra-r
egio
nal a
nd e
xtra
-reg
iona
l exp
orts
Food
& li
ve
anim
als
bev
erag
es
& to
bacc
oC
rude
m
ater
ials
Min
eral
s &
fuel
s
Ani
mal
&
vege
tabl
e fa
t
Che
mic
als
& m
ater
ials
Man
ufac
ture
d go
ods
Mac
hine
ry
& tr
ansp
ort
equi
pmen
t
Mis
cella
neou
s m
anuf
actu
res
Oth
er
com
mod
ities
OIC
rO
wO
ICr
Ow
OIC
rO
wO
ICr
Ow
OIC
rO
wO
ICr
Ow
OIC
rO
wO
ICr
Ow
OIC
rO
wO
ICr
Ow
Egyp
t19
9046
.51
7.48
0.14
0.14
2.71
10.3
71.
3230
.35
0.01
0.03
9.95
4.54
22.5
437
.01
2.82
0.58
13.1
99.
500.
820.
0020
0525
.85
12.4
50.
020.
083.
447.
4313
.68
39.3
70.
210.
367.
668.
4542
.78
24.6
23.
321.
782.
735.
150.
310.
29
Jord
an19
9025
.81
7.49
0.57
0.75
10.5
042
.33
0.00
0.00
0.17
0.10
42.3
929
.24
12.6
012
.99
2.05
2.37
5.91
4.74
0.00
0.00
2005
20.2
59.
320.
202.
136.
8614
.81
0.04
0.01
0.61
3.16
37.0
520
.08
15.9
05.
4314
.79
3.48
4.31
41.5
60.
000.
02
Mal
aysi
a19
9015
.53
4.24
0.35
0.12
7.62
14.6
60.
0017
.44
35.1
06.
840.
871.
677.
658.
2529
.66
36.4
63.
0210
.28
0.19
0.04
2005
5.55
2.07
0.05
0.34
2.24
2.82
0.02
11.0
432
.71
4.55
3.03
5.61
28.8
27.
4720
.81
57.0
26.
778.
780.
000.
31
om
an19
9023
.32
1.23
2.28
0.08
0.70
0.20
0.00
92.4
80.
430.
048.
250.
2458
.61
1.05
1.68
3.57
4.72
0.83
0.00
0.27
2005
36.0
01.
411.
560.
090.
970.
280.
0093
.59
11.3
20.
2813
.52
1.35
24.4
41.
822.
180.
618.
260.
511.
750.
07
Saud
i a
rabi
a19
903.
840.
590.
170.
091.
621.
0538
.42
90.7
30.
740.
0130
.72
4.50
13.0
30.
759.
141.
211.
580.
720.
740.
3520
052.
850.
230.
640.
050.
760.
4467
.37
88.8
00.
160.
0117
.87
8.85
7.54
0.81
1.65
0.61
1.16
0.19
0.01
0.00
Syria
1990
67.2
28.
250.
750.
523.
895.
688.
4548
.45
0.00
0.00
0.90
13.8
87.
5914
.52
0.50
0.13
10.6
58.
560.
050.
0020
0554
.58
6.09
1.95
1.02
2.92
5.26
0.00
73.8
60.
741.
965.
533.
0720
.35
4.76
2.87
1.06
11.0
62.
910.
010.
01
Not
e: F
igur
es re
pres
ent t
he p
erce
ntag
e ex
port
shar
e of
eac
h pr
oduc
t cat
egor
y ou
t of i
ntra
-reg
iona
l tra
de (w
ith se
lect
ed o
IC c
ount
ries)
and
ext
ra-r
egio
nal t
rade
(with
Ro
W),
resp
ectiv
ely.

189
are there Prospects for Future Economic Integration among Muslim Countries?
for Jordan. Except for oman, the percentage has, however, shown a declining trend in the intra-regional trade share of this category for all these countries from 1990.
of all the six countries, Egypt and oman are major exporters of manufactured goods within the oIC grouping with a share of 22.54% and 58.61%, respectively, in 1990. however, this sector showed a substantial decline to only 24.44% share in regional exports in 2005 for oman, but Egypt managed to increase its share substantially to about 43% in the same year. Malaysia emerged as one of the important supplier of manufactured goods within the grouping with a considerable export share of 28.82% in 2005 from only 7.65% in 1990. Malaysia also is found to be a major supplier of animal & vegetable fat and machinery & transport equipment to the oIC countries, with the share of 32.71% and 20.81%, respectively, in 2005.
Chemicals & minerals are found to be important for Jordan and Saudi arabia, accounting for 42.39% and 30.72% of intra-regional trade in 1990, and 37.05% and 17.87% in 2005, respectively. For Saudi arabia, the importance of chemicals & materials is closely associated with the production and exports of minerals & fuels, which are found to have dominated intra-regional trade of the country with an export share of 67.37% in 2005.
Minerals & fuels have also been found to be the dominating sector in oIC exports share to the rest of the world for three countries with oman, Saudi and Syria showing significant shares. Oman’s share of exports of minerals & fuels to the rest of the world accounted for 92.48% and 93.59% in 1990 and 2005, respectively; Saudi arabia’s share accounted for 90.73% and 88.80%, while Syria’s share are 48.45% and 73.86% in the same years, respectively.
other sectors that, to a certain extent, are also important exports to the rest of the world include minerals & fuels and manufactured goods for Egypt, crude materials and chemicals & materials for Jordan, and machinery & transport equipment for Malaysia. In summary, the region has established a mutual dependency in basic foods & agricultural products. In general, there appears to be a significant divergence3 between products that are exported to the region and to the rest of the world. Primary products seem to dominate intra-regional trade while minerals & fuels dominate exports to the rest of the world.
Trade divergence and Trade Concentrationthe likely success or failure of any proposed regional trade arrangement depends on the range of products that members have the capacity to export or import. Members exporting a wide range of diversified goods present a positive signal to a successful regional trade arrangement. however, concentration of exports will limit the prospects of increasing regional trade (Pitigala, 2005).
3 As mentioned in the earlier section, divergence is defined as the departure of intra-regional exports from exports to the rest of the world in major product categories (Pitigala, 2005).

190
International Journal of Economics and Management
table 2 presents a summary of the divergence and concentration estimates to examine the two propositions above.4 Based on the 75% cut-off point, the figures suggest that only Jordan shows the likelihood for greater intra-trade with 26.91% of its dynamic exports being represented in intra-oIC exports. the disparity is extreme for the other countries, particularly oman, Saudi arabia and Syria, where none of their products that accounted for 75% of the countries’ growth in exports to the rest of the world is represented in the growth of its regional exports. Since the extent to which the relative share of intra-oIC trade can be increased depends on the extent to which countries’ dynamic exports to the rest of the world are represented in the oIC trade, the prospects for all the countries except for Jordan do not appear to be encouraging. a highly concentrated export for these countries, especially Saudi Arabia, also confirms their narrow export base. Saudi Arabia’s dynamic exports are found to be concentrated in only 2 items, namely petrol, oil & crude oils (SItC 3330) and polyethelene (SItC 5831).
Table 2 divergence and concentration summary
Egypt Jordan Malaysia Oman Saudi Arabia Syria
95% cut-off pointdivergence of exports (%) 12.69
(9)26.05(50)
6.13(13)
0 (0)
2.25(2)
0(0)
Concentration of exports 42 50 23 22 35 42
75% cut-off pointdivergence of exports (%) 12.25
(4)26.91(17)
2.60(7)
0(0)
0(0)
0(0)
Concentration of exports 13 17 8 11 2 19
Notes: Figures in parentheses represent the number of product categories in intra-oIC exports that match exports to the RoW that were among its dynamic exports (account for 75% or 95% of total export growth between 1990 and 2005).divergence of exports = intra-oIC exports that match exports to the RoW as a share of the latter.Concentration of exports = Number of products accounting for either 75% or 95% of export growth to the RoW between 1990 and 2005.
Based on the 95% cut-off point for dynamic exports, the number of items of regional exports that match exports to the rest of the world is higher for Jordan, Malaysia and Egypt (50, 13, and 9, respectively). the measurements for export divergence are also higher for Jordan, Egypt and Malaysia. For Jordan and Egypt, the percentage share is not much different from the figures at the 75% cut-off point. In the case of Oman and Syria, the divergence of export figures remain at 0% at the 75% cut-off point which means that there is no match at all between dynamic exports to the region and to the rest of the world. at the 95% cut-off point, table 2 shows a relatively lower degree of trade concentration for all the selected oIC countries compared to the 75% cut-off point.
4 The tables from which the figures are derived are available from the authors upon request.
191
are there Prospects for Future Economic Integration among Muslim Countries?
revealed Comparative Advantage and Trade Complementarities
Egypttable 3 shows that Egypt’s top 50 imports comprise mainly of food & live animals (SItC 0) accounting for about 13% share of total imports, machinery & transport equipment (SItC 7) accounting for about 10% share of imports, and minerals & fuels (SItC 3) accounting for 8.8% share of imports. others include chemicals & materials (SItC 5) with 6.3% import share, and manufactured goods (SItC 6) with 7.2% import share.
out of Egypt’s top 50 imports, only 19 items show some potential for higher intra-oIC trade based on the IRCa values of its trading partners in the grouping. In terms of the number of items, among the major product categories include 5 items from chemical & materials (SItC 5), four items from food & live animals (SItC 0), and 4 items from machinery & transport equipment (SItC 7). Malaysia seems to demonstrate the highest number of products (11 products) in which it has trade complementarities with Egypt. this is followed by oman with 7 products, Saudi arabia with 5 products, and Syria and Jordan, each with 3 products. all the oIC trading partners except for Syria have IRCa>1 in minerals or chemical fertilizers (SItC 5621), but the share of imports of this product from oIC trading partners in 2005 is very small, i.e., only 0.77%. Petroleum gases (SItC 3413) and petrol, oils & crude oils (SItC 3330) each show 3 countries having comparative advantage in exporting these products to Egypt. Similarly, the shares of imports of these goods from the selected oIC trading partners are, again, very small with 3.64% and almost 0%, respectively. this shows potentials for Egypt to increase its imports of these products from oIC trading partners.
Palm oil (SItC 4242) shows the highest import share from oIC countries of 14.86% with oman and Malaysia, in particular, having a high comparative advantage in exporting this product to Egypt. this does not come as a surprise since Malaysia is a major world exporter of palm oil, hence having a natural niche on the export of this product. Polyethelene (SItC 5831) represents the second highest import share of Egypt from oIC countries with 4.99%, followed by petroleum gases (SItC 3413) and yarn (SItC 6514) representing 3.64% and 2.41% of intra-oIC imports, respectively.
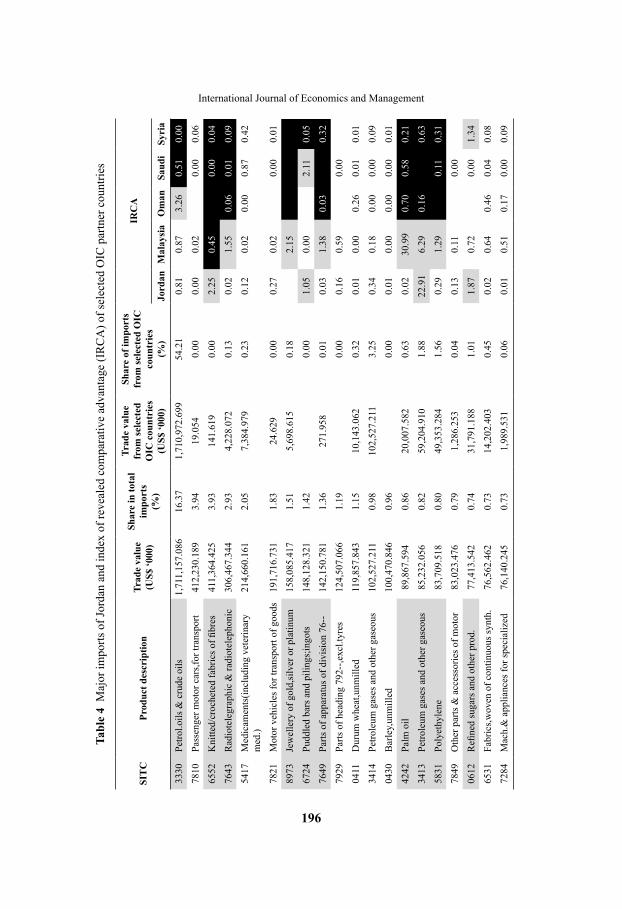
JordanJordan’s top 50 imports are mainly dominated by minerals & fuels (SItC 3), machinery & transport equipment (SItC 7), and manufactured goods (SItC 6) accounting for 18.79%, 14.82% and 9.18%, respectively (see table 4). Petrol, oils & crude oils (SItC 3330) represents the highest import share for Jordan at 16.37%. as with Egypt, the majority of products (38 out of the 50 products) in the list individually represent a very small share of Jordan’s total imports (less than

192
International Journal of Economics and ManagementTa
ble
3 M
ajor
impo
rts o
f Egy
pt a
nd in
dex
of re
veal
ed c
ompa
rativ
e ad
vant
age
(IR
Ca
) of s
elec
ted
oIC
par
tner
cou
ntrie
s
SIT
CPr
oduc
t des
crip
tion
Trad
e va
lue
(uS$
‘000
)
Shar
e in
to
tal i
mpo
rts
(%)
Trad
e va
lue
fr
om se
lect
ed
OIC
cou
ntri
es
(uS$
‘000
)
Shar
e of
impo
rts
from
sele
cted
OIC
co
untr
ies
(%)
IrC
A
Jord
anM
alay
sia
Om
anSa
udi
Syri
a
0411
dur
um w
heat
,unm
illed
9158
39.2
714.
6230
508.
112.
000.
000.
260.
0035
.50
3413
Petro
leum
gas
es a
nd o
ther
gas
eous
80
6903
.271
4.07
5554
5.95
73.
646.
4330
.55
4.78
0.09
3330
Petro
l.oils
& c
rude
oils
79
7563
.925
4.03
0.00
0.93
11.5
512
.73
9.89
6725
Blo
oms,b
illet
s,sla
bs &
shee
t bar
s 77
4417
.048
3.91
145.
128
0.01
0.46
0.01
0440
Mai
ze (c
orn)
,unm
illed
6964
63.7
733.
510.
000.
010.
000.
000.
00
2482
Woo
d of
con
ifero
us sp
ecie
s,saw
n43
5866
.775
2.20
0.20
50.
000.
010.
030.
000.
000.
02
7810
Pass
enge
r mot
or c
ars,f
or tr
ansp
ort
3040
60.1
541.
5355
05.7
770.
360.
000.
020.
000.
00
7849
oth
er p
arts
& a
cces
sorie
s of m
otor
29
3261
.494
1.48
1526
.969
0.10
0.02
0.11
0.00
0.03
0111
Mea
t of b
ovin
e an
imal
s, fr
esh,
chi
lled
2770
85.8
751.
400.
000.
250.
010.
010.
01
5417
Med
icam
ents
(inc
ludi
ng v
eter
inar
y m
ed.)
2688
58.1
981.
3651
34.0
010.
343.
460.
020.
000.
030.
20
4242
Palm
oil
2674
30.0
021.
3522
6918
.763
14.8
60.
1531
.05
1.18
0.00
7649
Parts
of a
ppar
atus
of d
ivis
ion
76--
2336
81.7
61.
1871
5.06
60.
050.
001.
380.
000.
000.
00
7643
Rad
iote
legr
aphi
c &
radi
otel
epho
nic
2300
56.4
061.
1657
.283
0.00
0.00
1.55
0.00
0.00
0.00
2222
Soya
bea
ns19
3980
.953
0.98
0.00
0.02
0.00
0.06
5621
Min
eral
or c
hem
ical
ferti
lizer
s19
2696
.383
0.97
1173
2.02
10.
7741
.00
1.36
7.59
3.28
0.04
2820
Was
te a
nd sc
rap
met
al o
f iro
n
or st
eel
1876
66.7
930.
9530
9.61
30.
020.
810.
030.
040.
000.
04
7284
Mac
h.&
app
lianc
es fo
r spe
cial
ized
18
6422
.487
0.94
927.
902
0.06
0.06
0.51
0.00
0.00
0.01
2873
alu
min
ium
ore
s and
con
cent
rate
s 18
5890
.823
0.94
3391
.855
0.22
0.01
0.00
0.00

193
are there Prospects for Future Economic Integration among Muslim Countries?
6514
Yarn
con
tain
.85%
by
wgt
.of s
ynth
.fib
re17
8751
.022
0.90
3684
8.68
32.
410.
682.
260.
010.
040.
38
5831
Poly
ethy
lene
1737
41.7
390.
8876
196.
145
4.99
0.21
1.31
0.16
4.31
0.29
0542
Bea
ns,p
eas,l
entil
s & o
ther
legu
min
o16
6041
.413
0.84
1221
4.80
50.
800.
000.
070.
000.
0122
.68
1211
toba
cco,
not s
tripp
ed15
4848
.672
0.78
30.9
620.
000.
110.
010.
180.
000.
02
7599
Parts
of a
nd a
cces
sorie
s 15
1115
.281
0.76
1258
.312
0.08
0.00
3.64
0.00
0.00
0813
oil-
cake
& o
ther
resi
dues
15
0333
.949
0.76
0.00
0.03
0.45
0.00
0.89
7499
oth
er n
on-e
lect
ric p
arts
& a
cces
sorie
s14
7648
.762
0.75
148.
543
0.01
0.10
0.49
0.00
0.01
0.07
6821
Cop
per a
nd c
oppe
r allo
ys,re
fined
13
6174
.307
0.69
4192
.441
0.27
0.00
0.01
0.49
0.01
3222
Oth
er c
oal,w
heth
er/n
ot p
ulve
rized
1327
44.0
080.
670.
000.
000.
010.
000.
15
7721
Elec
t.app
.such
as s
witc
hes,r
elay
s13
0192
.018
0.66
945.
214
0.06
0.07
2.98
0.02
0.01
0.00
7281
Mac
h.to
ols f
or sp
ecia
lized
par
ticul
1240
43.0
130.
6311
.097
0.00
0.11
0.36
0.00
0.00
0.30
5989
Che
mic
al p
rodu
cts a
nd p
repa
ratio
ns12
2346
.626
0.62
5088
.771
0.33
0.23
0.78
0.00
0.07
0.14
5111
acy
clic
hyd
roca
rbon
s10
6006
.10.
5361
91.7
080.
410.
000.
781.
70
2483
Woo
d of
non
-con
ifero
us sp
ecie
s,saw
n10
5749
.306
0.53
1789
.557
0.12
0.02
7.27
0.00
0.02
8720
Med
ical
inst
rum
ents
and
app
lianc
es10
1082
.991
0.51
2739
.939
0.18
0.01
0.49
0.00
0.00
0.00
6418
Pape
r & p
aper
boar
d,im
preg
nat.c
oat.
9801
2.15
10.
4995
85.0
380.
630.
130.
200.
010.
07
7492
taps
,coc
ks,v
alve
s etc
.for p
ipes
,tan
9754
0.29
20.
4929
1.03
80.
020.
000.
210.
000.
000.
00
6997
arti
cles
of i
ron
or st
eel,
n.e.
s.91
868.
674
0.46
488.
743
0.03
0.28
0.52
0.00
0.09
0.66
5839
oth
er p
olym
eriz
atio
n an
d co
polim
eri
8760
8.29
70.
4476
04.2
040.
500.
240.
400.
170.
750.
07
4236
Sunfl
ower
seed
oil
8403
4.06
40.
4232
.534
0.00
0.39
0.62
6.32
0.19
0.16
0342
Fish
,froz
en (e
xclu
ding
fille
ts)
8067
2.74
0.41
82.9
480.
010.
000.
181.
390.
010.
00
5156
het
eroc
yclic
com
poun
ds;n
ucle
ic a
cid
7907
5.05
0.40
442.
661
0.03
0.00
0.01
0.00
0.00
5832
Poly
prop
ylen
e77
244.
594
0.39
2342
8.50
71.
530.
900.
730.
070.
600.
11
tabl
e 3
(Con
t’d)

194
International Journal of Economics and Management
6749
oth
er sh
eets
and
pla
tes,o
f iro
n 77
006.
135
0.39
8179
.244
0.54
0.02
0.32
0.01
0.06
0.00
5833
Poly
styr
ene
and
its c
opol
ymer
s76
989.
008
0.39
6074
.534
0.40
0.48
1.64
0.06
0.33
0.02
0611
Suga
rs,b
eet a
nd c
ane,
raw,
solid
7375
9.66
80.
370.
000.
000.
010.
09
7821
Mot
or v
ehic
les f
or tr
ansp
ort o
f goo
ds73
527.
096
0.37
776.
299
0.05
0.00
0.02
0.01
0.01
0224
Milk
& c
ream
,pre
serv
ed,c
once
ntra
ted
7246
4.82
60.
3710
3.36
80.
017.
120.
564.
510.
430.
30
0612
Refi
ned
suga
rs a
nd o
ther
pro
d.
7133
5.48
90.
3614
9.39
80.
010.
000.
750.
000.
370.
16
6415
Pape
r and
pap
erbo
ard,
in ro
lls o
r sh
eets
7108
6.89
70.
3631
42.9
40.
210.
200.
240.
060.
030.
04
5823
alk
yds a
nd o
ther
pol
yest
ers
6900
6.25
30.
3512
234.
899
0.80
0.55
0.82
0.02
0.10
0.18
0230
But
ter
6867
0.14
10.
350.
000.
000.
020.
310.
390.
17n
o of
pro
duct
s with
IrC
A>1
311
75
3N
ote:
the
shad
ed c
ells
repr
esen
t pro
duct
s with
pot
entia
lly h
ighe
r int
ra-tr
ade
with
thei
r res
pect
ive
IRC
as t
hat h
ave
valu
es o
f gre
ater
than
1.
tabl
e 3
(Con
t’d)

195
are there Prospects for Future Economic Integration among Muslim Countries?
1% each), while the remaining 11 products (i.e., excluding petrol, oils & crude oils) constitute import share of no greater than 4%.
Based on the IRCa of trading partners, it was found that 27 products show potential improvement in intra-oIC trade. these include 6 items each from food & live animals (SITC 0) and manufactured goods (SITC 6), five items from machinery & transport equipment (SItC 7), three items from chemicals & materials (SItC 5), two items each from minerals & fuels (SItC 3) and miscellaneous manufactures (SItC 8), as well as 1 item each from beverages & tobacco (SItC 1), crude materials (SItC 2), and animal & vegetable fat (SItC 4).
as was the case with Egypt, Malaysia seems to demonstrate the highest number of products (13 products) in which it has trade complementarities with Jordan. this is followed by Egypt, Syria, oman and Saudi arabia with 9, 6, 4 and 2 products, respectively. out of the 27 products that show prospects for higher intra-oIC trade, 7 products are found to have more than 1 trading partner possessing comparative advantage. Petrol, oils & crude oils (SItC 3330) again dominates intra-oIC imports with a share of 54.21%.
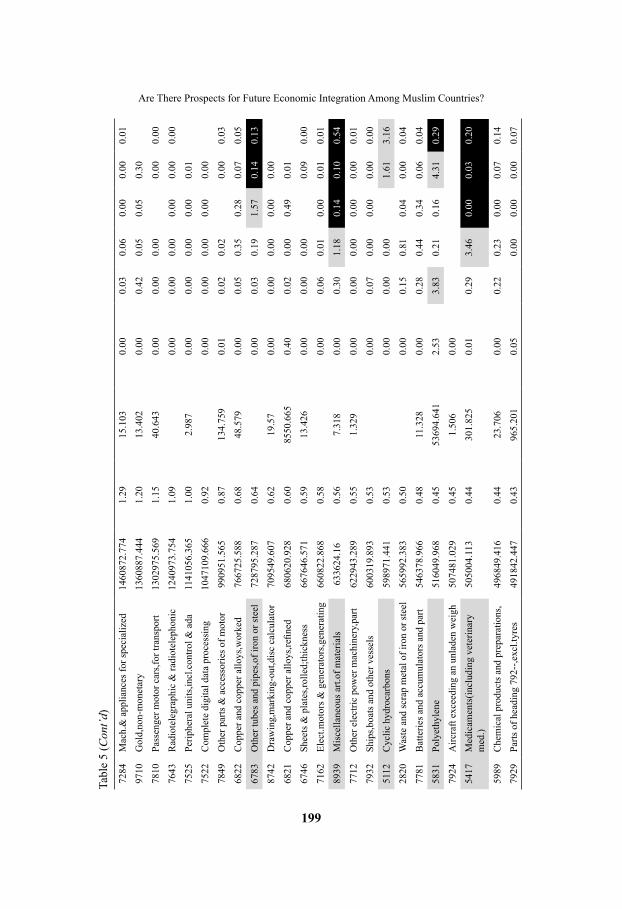
Malaysiatable 5 provides Malaysia’s import structure and her corresponding IRCas of selected oIC partners. Based on the top 50 products imported by Malaysia, electronic microcircuits (SItC 7764) make up the largest share of 12.42% with uS$14.11 billion of total import value. at 1-digit aggregate level the statistics reveals that Malaysia’s import in 2005 are dominated by machinery & transport equipment (SItC 7) which accounts for 48.07% of the total followed by manufactured goods (SItC 6), minerals & fuels (SItC 3) and chemical & materials (SItC 5) with the shares of 4.08%, 3.39% and 2.91% of the total, respectively.
a review of complementarity of Malaysia’s imports and its trading partner’s comparative advantage does not seem to show much prospect for future economic integration among these countries. only 11 of the 50 major products imported by Malaysia are found to have potential for intra-trade with Egypt registering the highest number of items (5 products) followed by Jordan and Saudi arabia (both 3 products) and oman and Syria (both 2 products).
these 11 products have a regional import share of only 7.48% and the extent of the disparity between imports and products with IRCa<1 among these six selected oIC countries is the highest for Malaysia. out of the top 50 major imports which represent 62.44% of Malaysia’s imports, 78% of these products show an IRCa of less than 1, suggesting the extent to which the region is lacking in “efficiency” to meet Malaysia’s import needs.
196
International Journal of Economics and ManagementTa
ble
4 M
ajor
impo
rts o
f Jor
dan
and
inde
x of
reve
aled
com
para
tive
adva
ntag
e (I
RC
a) o
f sel
ecte
d o
IC p
artn
er c
ount
ries
SIT
CPr
oduc
t des
crip
tion
Trad
e va
lue
(uS$
‘000
)
Shar
e in
tota
l im
port
s (%
)
Trad
e va
lue
from
sele
cted
O
IC c
ount
ries
(u
S$ ‘0
00)
Shar
e of
impo
rts
from
sele
cted
OIC
co
untr
ies
(%)
IrC
A
Jord
anM
alay
sia
Om
anSa
udi
Syri
a
3330
Petro
l.oils
& c
rude
oils
1,
711,
157.
086
16.3
71,
710,
972.
699
54.2
10.
810.
873.
260.
510.
00
7810
Pass
enge
r mot
or c
ars,f
or tr
ansp
ort
412,
230.
189
3.94
19.0
540.
000.
000.
020.
000.
06
6552
Kni
tted/
croc
hete
d fa
bric
s of fi
bres
411,
364.
425
3.93
141.
619
0.00
2.25
0.45
0.00
0.04
7643
Rad
iote
legr
aphi
c &
radi
otel
epho
nic
306,
467.
344
2.93
4,22
8.07
20.
130.
021.
550.
060.
010.
09
5417
Med
icam
ents
(incl
udin
g ve
terin
ary
med
.)21
4,66
0.16
12.
057,
384.
979
0.23
0.12
0.02
0.00
0.87
0.42
7821
Mot
or v
ehic
les f
or tr
ansp
ort o
f goo
ds19
1,71
6.73
11.
8324
.629
0.00
0.27
0.02
0.00
0.01
8973
Jew
elle
ry o
f gol
d,si
lver
or p
latin
um15
8,08
5.41
71.
515,
698.
615
0.18
2.15
6724
Pudd
led
bars
and
pili
ngs;
ingo
ts14
8,12
8.32
11.
420.
001.
050.
002.
110.
05
7649
Parts
of a
ppar
atus
of d
ivis
ion
76--
142,
150.
781
1.36
271.
958
0.01
0.03
1.38
0.03
0.32
7929
Parts
of h
eadi
ng 7
92--
,exc
l.tyr
es12
4,50
7.06
61.
190.
000.
160.
590.
00
0411
dur
um w
heat
,unm
illed
119,
857.
843
1.15
10,1
43.0
620.
320.
010.
000.
260.
010.
01
3414
Petro
leum
gas
es a
nd o
ther
gas
eous
10
2,52
7.21
10.
9810
2,52
7.21
13.
250.
340.
180.
000.
000.
09
0430
Bar
ley,
unm
illed
100,
470.
846
0.96
0.00
0.01
0.00
0.00
0.00
0.01
4242
Palm
oil
89,8
67.5
940.
8620
,007
.582
0.63
0.02
30.9
90.
700.
580.
21
3413
Petro
leum
gas
es a
nd o
ther
gas
eous
85
,232
.056
0.82
59,2
04.9
101.
8822
.91
6.29
0.16
0.63
5831
Poly
ethy
lene
83,7
09.5
180.
8049
,353
.284
1.56
0.29
1.29
0.11
0.31
7849
oth
er p
arts
& a
cces
sorie
s of m
otor
83,0
23.4
760.
791,
286.
253
0.04
0.13
0.11
0.00
0612
Refi
ned
suga
rs a
nd o
ther
pro
d.
77,4
13.5
420.
7431
,791
.188
1.01
1.87
0.72
0.00
1.34
6531
Fabr
ics,w
oven
of c
ontin
uous
synt
h.76
,562
.462
0.73
14,2
02.4
030.
450.
020.
640.
460.
040.
08
7284
Mac
h.&
app
lianc
es fo
r spe
cial
ized
76
,140
.245
0.73
1,98
9.53
10.
060.
010.
510.
170.
000.
09

197
are there Prospects for Future Economic Integration among Muslim Countries?
7832
Roa
d tra
ctor
s and
sem
i-tra
ilers
70,8
74.1
700.
680.
000.
210.
020.
00
0980
Edib
le p
rodu
cts a
nd p
repa
ratio
ns
69,8
34.9
580.
6721
,563
.792
0.68
0.32
0.52
0.32
0.18
3.12
9710
Gol
d,no
n-m
onet
ary
68,6
00.0
410.
660.
000.
86
6783
oth
er tu
bes a
nd p
ipes
,of i
ron
or st
eel
67,7
46.7
970.
651,
790.
801
0.06
0.07
1.71
0.01
0.00
0440
Mai
ze (c
orn)
,unm
illed
66,1
85.1
300.
6312
2.88
20.
000.
100.
010.
270.
12
3510
Elec
tric
curr
ent
65,9
11.8
230.
6365
,911
.823
2.09
0.13
0.21
0.10
0.02
0.51
0224
Milk
& c
ream
,pre
serv
ed,c
once
ntra
ted
64,7
23.5
200.
623,
985.
685
0.13
0.09
0.55
4.51
0.43
4.40
0422
Ric
e se
mi-m
illed
or w
holly
mill
ed59
,129
.711
0.57
16,5
50.3
390.
5233
.99
0.01
0.03
1223
toba
cco,
man
ufac
ture
d (in
c.sm
okin
g)58
,003
.112
0.55
693.
994
0.02
0.11
1.57
0.07
0.00
6842
alu
min
ium
and
alu
min
ium
al
loys
,wor
k57
,645
.789
0.55
8,97
3.40
90.
280.
000.
500.
010.
02
6822
Cop
per a
nd c
oppe
r allo
ys,w
orke
d56
,431
.625
0.54
35,6
62.1
761.
132.
201.
360.
180.
00
0813
oil-
cake
& o
ther
resi
dues
55,2
60.6
270.
531,
131.
421
0.04
0.43
0.45
0.69
0.14
1.53
6749
oth
er sh
eets
and
pla
tes,o
f iro
n or
stee
l54
,364
.197
0.52
11,6
65.8
070.
370.
020.
320.
060.
02
8939
Mis
cella
neou
s art.
of m
ater
ials
52
,623
.243
0.50
7,55
4.51
20.
240.
240.
510.
17
1110
Non
alc
ohol
ic b
ever
ages
,n.e
.s.51
,089
.784
0.49
35,5
30.9
471.
130.
400.
500.
000.
00
2483
Woo
d of
non
-con
ifero
us sp
ecie
s,saw
n50
,907
.177
0.49
277.
757
0.01
0.02
7.27
0.00
0.60
7161
Mot
ors &
gen
erat
ors,d
irect
cur
rent
50,8
23.7
780.
4940
.721
0.00
0.28
0.18
1.17
0.00
0.08
5989
Che
mic
al p
rodu
cts a
nd p
repa
ratio
ns50
,435
.189
0.48
7,29
4.56
00.
230.
010.
780.
590.
000.
05
0111
Mea
t of b
ovin
e an
imal
s, fr
esh,
chi
lled
46,1
09.3
710.
4412
9.23
30.
000.
030.
010.
010.
010.
17
7599
Parts
of a
nd a
cces
sorie
s 45
,936
.901
0.44
1,26
3.46
70.
040.
003.
640.
000.
000.
02
7721
Elec
t.app
.such
as s
witc
hes,r
elay
s45
,913
.919
0.44
4,85
7.95
20.
150.
022.
980.
020.
010.
00
6624
Non
-ref
ract
.cer
amic
bric
ks,ti
les
45,8
04.4
580.
4414
,396
.907
0.46
0.22
0.49
1.66
0.17
0.94
5530
Perf
umer
y,co
smet
ics a
nd to
ilet p
rep
45,4
46.3
920.
4313
,661
.024
0.43
4.00
0.21
0.39
0.27
0.39
8720
Med
ical
inst
rum
ents
and
app
lianc
es44
,832
.464
0.43
193.
876
0.01
0.02
0.49
0.04
tabl
e 4
(Con
t’d)

198
International Journal of Economics and Managementta
ble
4 (C
ont’d
)82
19o
ther
furn
iture
and
par
ts43
,388
.261
0.42
7,42
4.22
80.
240.
021.
940.
00
5832
Poly
prop
ylen
e42
,954
.710
0.41
26,7
47.6
800.
850.
720.
730.
020.
050.
01
5169
org
anic
che
mic
als,n
.e.s
42,3
03.8
080.
403,
136.
244
0.10
10.1
20.
020.
220.
841.
49
8459
oth
er o
uter
gar
men
ts &
cl
othi
ng,k
nitw
ear
42,0
56.1
010.
401,
491.
048
0.05
0.55
0.60
0.19
6841
alu
min
ium
and
alu
min
ium
allo
ys41
,222
.156
0.39
0.00
1.55
0.25
0.07
0.01
0.00
0012
Shee
p an
d go
ats,
live
39,8
61.4
250.
380.
000.
270.
000.
551.
0529
7.73
no
of p
rodu
cts w
ith Ir
CA
>19
134
26
Not
e: t
he sh
aded
cel
ls re
pres
ent p
rodu
cts w
ith p
oten
tially
hig
her i
ntra
-trad
e w
ith th
eir r
espe
ctiv
e IR
Ca
s tha
t hav
e va
lues
of g
reat
er th
an 1
.
Tabl
e 5
Maj
or im
ports
of M
alay
sia
and
inde
x of
reve
aled
com
para
tive
adva
ntag
e (I
RC
a) o
f sel
ecte
d o
IC p
artn
er c
ount
ries
SIT
CPr
oduc
t des
crip
tion
Trad
e va
lue
(uS$
‘000
)
Shar
e in
tota
l im
port
s (%
)
Trad
e va
lue
from
sele
cted
O
IC c
ount
ries
(u
S$ ‘0
00)
Shar
e of
impo
rts
from
sele
cted
O
IC c
ount
ries
(%
)
IrC
A
Egy
ptJo
rdan
Om
anSa
udi
Syri
a
7764
Elec
troni
c m
icro
circ
uits
1410
8322
.61
12.4
23.
679
0.00
0.00
0.01
0.00
7768
Piez
o-el
ectri
c cr
ysta
ls,m
ount
ed11
0868
39.7
39.
7623
8.8
0.01
0.03
0.00
0.00
0.00
7599
Parts
of a
nd a
cces
sorie
s sui
tabl
e 64
8293
3.24
85.
7141
.357
0.00
0.00
0.00
0.00
0.00
3330
Petro
l.oils
& c
rude
oils
34
0556
0.53
53.
0015
0913
8.15
971
.11
0.86
11.5
512
.73
9.89
7788
oth
er e
lect
.mac
hine
ry a
nd e
quip
men
t23
3551
9.88
82.
0697
.948
0.00
0.01
0.01
0.00
0.00
0.00
7721
Elec
t.app
.such
as s
witc
hes,r
elay
s,19
7687
8.04
11.
7423
07.7
020.
110.
030.
070.
020.
010.
00
7649
Parts
of a
ppar
atus
of d
ivis
ion
76--
1900
048.
452
1.67
124.
741
0.01
0.03
0.00
0.00
0.00
0.00
7722
Prin
ted
circ
uits
and
par
ts th
ereo
f18
8059
3.84
51.
661.
907
0.00
0.00
0.00
0.00
7763
dio
des,t
rans
isto
rs a
nd si
m.se
mi-
cond
ucto
rs16
4392
8.36
51.
450.
000.
000.
000.
000.
00
199
are there Prospects for Future Economic Integration among Muslim Countries?
7284
Mac
h.&
app
lianc
es fo
r spe
cial
ized
14
6087
2.77
41.
2915
.103
0.00
0.03
0.06
0.00
0.00
0.01
9710
Gol
d,no
n-m
onet
ary
1360
887.
444
1.20
13.4
020.
000.
420.
050.
050.
30
7810
Pass
enge
r mot
or c
ars,f
or tr
ansp
ort
1302
975.
569
1.15
40.6
430.
000.
000.
000.
000.
00
7643
Rad
iote
legr
aphi
c &
radi
otel
epho
nic
1240
973.
754
1.09
0.00
0.00
0.00
0.00
0.00
0.00
7525
Perip
hera
l uni
ts,in
cl.c
ontro
l & a
da11
4105
6.36
51.
002.
987
0.00
0.00
0.00
0.00
0.01
7522
Com
plet
e di
gita
l dat
a pr
oces
sing
10
4710
9.66
60.
920.
000.
000.
000.
000.
00
7849
oth
er p
arts
& a
cces
sorie
s of m
otor
9909
51.5
650.
8713
4.75
90.
010.
020.
020.
000.
03
6822
Cop
per a
nd c
oppe
r allo
ys,w
orke
d76
6725
.588
0.68
48.5
790.
000.
050.
350.
280.
070.
05
6783
oth
er tu
bes a
nd p
ipes
,of i
ron
or st
eel
7287
95.2
870.
640.
000.
030.
191.
570.
140.
13
8742
dra
win
g,m
arki
ng-o
ut,d
isc
calc
ulat
or70
9549
.607
0.62
19.5
70.
000.
000.
000.
000.
00
6821
Cop
per a
nd c
oppe
r allo
ys,re
fined
68
0620
.928
0.60
8550
.665
0.40
0.02
0.00
0.49
0.01
6746
Shee
ts &
pla
tes,r
olle
d;th
ickn
ess
6676
46.5
710.
5913
.426
0.00
0.00
0.00
0.09
0.00
7162
Elec
t.mot
ors &
gen
erat
ors,g
ener
atin
g66
0822
.868
0.58
0.00
0.06
0.01
0.00
0.01
0.01
8939
Mis
cella
neou
s art.
of m
ater
ials
63
3624
.16
0.56
7.31
80.
000.
301.
180.
140.
100.
54
7712
oth
er e
lect
ric p
ower
mac
hine
ry,p
art
6229
43.2
890.
551.
329
0.00
0.00
0.00
0.00
0.00
0.01
7932
Ship
s,boa
ts a
nd o
ther
ves
sels
6003
19.8
930.
530.
000.
070.
000.
000.
000.
00
5112
Cyc
lic h
ydro
carb
ons
5989
71.4
410.
530.
000.
000.
001.
613.
16
2820
Was
te a
nd sc
rap
met
al o
f iro
n or
stee
l56
5992
.383
0.50
0.00
0.15
0.81
0.04
0.00
0.04
7781
Bat
terie
s and
acc
umul
ator
s and
par
t54
6378
.966
0.48
11.3
280.
000.
280.
440.
340.
060.
04
5831
Poly
ethy
lene
5160
49.9
680.
4553
694.
641
2.53
3.83
0.21
0.16
4.31
0.29
7924
airc
raft
exce
edin
g an
unl
aden
wei
gh50
7481
.029
0.45
1.50
60.
00
5417
Med
icam
ents
(incl
udin
g ve
terin
ary
med
.)50
5004
.113
0.44
301.
825
0.01
0.29
3.46
0.00
0.03
0.20
5989
Che
mic
al p
rodu
cts a
nd p
repa
ratio
ns,
4968
49.4
160.
4423
.706
0.00
0.22
0.23
0.00
0.07
0.14
7929
Parts
of h
eadi
ng 7
92--
,exc
l.tyr
es49
1842
.447
0.43
965.
201
0.05
0.00
0.00
0.00
0.07
tabl
e 5
(Con
t’d)

200
International Journal of Economics and Management
7761
tele
visi
on p
ictu
re tu
bes,c
atho
de
4880
78.9
150.
430.
000.
000.
000.
00
6749
oth
er sh
eets
and
pla
tes,o
f iro
n or
stee
l47
8433
.695
0.42
21.1
360.
000.
050.
020.
010.
060.
00
6842
alu
min
ium
and
alu
min
ium
al
loys
,wor
k45
1024
.101
0.40
0.00
1.26
0.81
0.52
0.14
0.30
3222
Oth
er c
oal,w
heth
er/n
ot p
ulve
rized
4496
00.9
290.
400.
000.
000.
000.
000.
15
7149
Parts
of t
he e
ngin
es &
mot
ors o
f 71
4490
53.9
790.
400.
000.
000.
000.
000.
01
6841
alu
min
ium
and
alu
min
ium
allo
ys44
0380
.323
0.39
9812
.073
0.46
2.07
0.52
0.00
0.00
0.02
8749
Parts
,n.e
.s.ac
cess
orie
s for
873
--,8
4293
92.8
160.
383.
510.
000.
000.
000.
000.
000.
00
6727
Iron
or s
teel
coi
ls fo
r re-
rolli
ng42
6271
.649
0.38
0.00
7.06
0.00
0.03
0.01
2320
Nat
ural
rubb
er la
tex;
nat
.rubb
er
4227
13.4
990.
370.
000.
170.
000.
010.
02
5823
alk
yds a
nd o
ther
pol
yest
ers
4214
10.6
950.
3728
.983
0.00
0.00
0.55
0.02
0.10
0.18
7528
off-
line
data
pro
cess
ing
equi
pmen
t.41
9976
.035
0.37
5.91
10.
000.
000.
000.
03
7499
oth
er n
on-e
lect
ric p
arts
& a
cces
sorie
s41
2379
.413
0.36
24.1
610.
000.
160.
100.
000.
010.
07
7821
Mot
or v
ehic
les f
or tr
ansp
ort o
f goo
ds39
9093
.679
0.35
0.00
0.00
0.00
0.01
0.01
7731
Insu
late
d,el
ect.w
ire,c
able
,bar
s39
8556
.071
0.35
0.00
0.04
1.78
0.89
0.30
0.27
5839
oth
er p
olym
eriz
atio
n an
d co
polim
eri
3953
28.4
780.
3518
70.4
420.
091.
020.
240.
170.
750.
07
0721
Coc
oa b
eans
,who
le o
r bro
ken,
raw
39
2638
.423
0.35
0.00
5833
Poly
styr
ene
and
its c
opol
ymer
s37
4362
.256
0.33
135.
339
0.01
0.01
0.48
0.06
0.33
0.02
no
of p
rodu
cts w
ith Ir
CA
>15
32
32
Not
e: t
he sh
aded
cel
ls re
pres
ent p
rodu
cts w
ith p
oten
tially
hig
her i
ntra
-trad
e w
ith th
eir r
espe
ctiv
e IR
Ca
s tha
t hav
e va
lues
of g
reat
er th
an 1
.
tabl
e 5
(Con
t’d)

201
are there Prospects for Future Economic Integration among Muslim Countries?
Omanoman provides a different scenario from Malaysia as seen in table 6. Based on the top 50 products imported by oman, passenger motorcars (SItC 7810) makes up the largest share of 15.45% with uS$1.36 billion of total import value. at 1-digit aggregate level the statistics reveals that oman’s import in 2005 are dominated by machinery & transport equipment (SItC 7) which accounts for 41.07% of the total followed by manufactured goods (SItC 6), food & live animals (SItC 0) and chemical & materials (SItC 5) with the shares of 7.37%, 4.26% and 4.09% of the total, respectively.
Based on the complementarity of its imports and IRCa of selected oIC partners, with 29 products accounting for 21.82% of oman’s imports, the region appears to be an efficient supplier of machinery & transport equipment (9.09%), chemicals & materials (6.32%), manufactured goods (4.68%), and food & live animals (2.94%). All five trading partners of selected OIC countries are found to have trade complementarities with oman in which Jordan recorded the highest number of products with 14 out of 50 oman’s major products originated from Jordan. In addition, both Malaysia and Egypt have comparative advantage in their products with 11 and 10 having IRCa>1, respectively. Meanwhile, Saudi arabia and Syria both have comparative advantage in 2 out of 50 major products imported by oman.
Saudi Arabiatable 7 shows 50 major products imported by Saudi arabia. Passenger motor cars (SItC 7810) make up the largest share of Saudi arabia’s import with a total value of uS$6.63 billion which represents 11.14% of total imports of Saudi arabia. other major imports are medicaments (SItC 5417), radiotelegraphic & radiotelephonic (SItC 7643), motor vehicles (SItC 7821) and parts of heading (SItC 7929) with the total amounts of uS$1.57 billion (2.64%), uS$1.52 billion (2.55%), uS$1.37 billion (2.31%), and uS$1.36 billion (2.28%), respectively.
among the 50 major products imported by Saudi arabia, machinery & transport equipment (SItC 7) occupies the largest share (32.94%), followed by food & live animals (SItC 0), manufactured goods (SItC 6), chemicals & materials (SItC 5), and miscellaneous manufactures (SItC 8) with the shares of 7.01%, 6.71%, 4.49%, and 2.31%, respectively. out of these top 50 imports, 27 products (where the IRCa>1) are found to have potential for intra-trade between Saudi arabia and selected oIC countries. Products with potential intra-trade are food & live animals (SItC 0), beverages & tobacco (SItC 1), chemicals & materials (SItC 5), manufactured goods (SItC 6), machinery & transport equipment (SItC 7), and miscellaneous manufactures (SItC 8).
Jordan and Malaysia, and to a certain extent, Egypt and Syria are found to have trade complementarities with Saudi arabia based on the IRCa values. Both Jordan and Malaysia have comparative advantage in 11 out of the 50 major

202
International Journal of Economics and ManagementTa
ble
6 M
ajor
impo
rts o
f om
an a
nd in
dex
of re
veal
ed c
ompa
rativ
e ad
vant
age
(IR
Ca
) of s
elec
ted
oIC
par
tner
cou
ntrie
s
SIT
CPr
oduc
t des
crip
tion
Trad
e va
lue
(uS$
‘000
)
Shar
e in
tota
l im
port
s (%
)
Trad
e va
lue
from
sele
cted
O
IC c
ount
ries
(u
S$ ‘0
00)
Shar
e of
impo
rts
from
sele
cted
OIC
co
untr
ies (
%)
IrC
A
Egy
ptJo
rdan
Mal
aysi
aSa
udi
Syri
a
7810
Pass
enge
r mot
or c
ars,f
or tr
ansp
ort
1363
553.
1415
.45
179.
923
0.05
0.00
0.00
0.02
0.00
0.00
7239
Parts
of t
he m
achi
nery
of 7
23.4
1 38
3796
.594
4.35
1357
7.92
93.
500.
010.
010.
150.
020.
03
7849
oth
er p
arts
& a
cces
sorie
s of m
otor
3057
77.6
453.
4647
0.23
30.
120.
020.
020.
110.
000.
03
7821
Mot
or v
ehic
les f
or tr
ansp
ort o
f goo
ds26
0665
.518
2.95
210.
814
0.05
0.00
0.00
0.02
0.01
0.01
7649
Parts
of a
ppar
atus
of d
ivis
ion
76--
1532
19.8
011.
740.
000.
030.
001.
380.
000.
00
0224
Milk
& c
ream
,pre
serv
ed,c
once
ntra
ted
1329
67.1
031.
5181
71.1
692.
110.
097.
120.
560.
430.
30
7721
Elec
t.app
.such
as s
witc
hes,r
elay
s12
3957
.584
1.40
3881
.123
1.00
0.03
0.07
2.98
0.01
0.00
7149
Parts
of t
he e
ngin
es &
mot
ors o
f 71
1162
44.4
291.
320.
401
0.00
0.00
0.19
0.00
0.01
6822
Cop
per a
nd c
oppe
r allo
ys,w
orke
d10
7543
.138
1.22
263.
048
0.07
0.05
0.35
1.36
0.07
0.05
5417
Med
icam
ents
(incl
udin
g ve
terin
ary
med
.)90
797.
527
1.03
8363
.101
2.16
0.29
3.46
0.02
0.03
0.20
7234
Con
stru
ctio
n an
d m
inin
g m
achi
nery
8787
1.93
71.
0081
.16
0.02
0.13
0.00
0.13
0.00
0.10
7831
Publ
ic-s
ervi
ce ty
pe p
asse
nger
mot
or82
461.
574
0.93
6.50
20.
000.
786.
460.
110.
010.
07
7929
Parts
of h
eadi
ng 7
92--
,exc
l.tyr
es80
659.
729
0.91
45.0
770.
010.
000.
590.
000.
07
7599
Parts
of a
nd a
cces
sorie
s 80
266.
508
0.91
238.
239
0.06
0.00
0.00
3.64
0.00
7119
Parts
of b
oile
rs &
aux
.pla
nt o
f 711
7924
8.22
90.
902.
182
0.00
0.00
0.22
0.00
6782
seam
less
tube
s and
pip
es;b
lank
s 77
612.
444
0.88
1074
.944
0.28
0.18
1.88
0.23
0.09
0.54
5831
Poly
ethy
lene
7658
2.38
0.87
1614
5.88
24.
163.
830.
211.
314.
310.
29
5530
Perf
umer
y,co
smet
ics a
nd to
ilet p
rep
7646
0.64
40.
870.
000.
570.
420.
210.
120.
24
5416
Gly
cosi
des;
glan
ds o
r oth
er o
rgan
s 70
169.
754
0.79
895.
534
0.23
0.07
0.47
0.01
0.00
0.00
6911
Stru
ctur
es &
par
ts o
f stru
c.;ir
on/s
6967
1.78
70.
7972
81.0
051.
881.
130.
670.
640.
540.
05
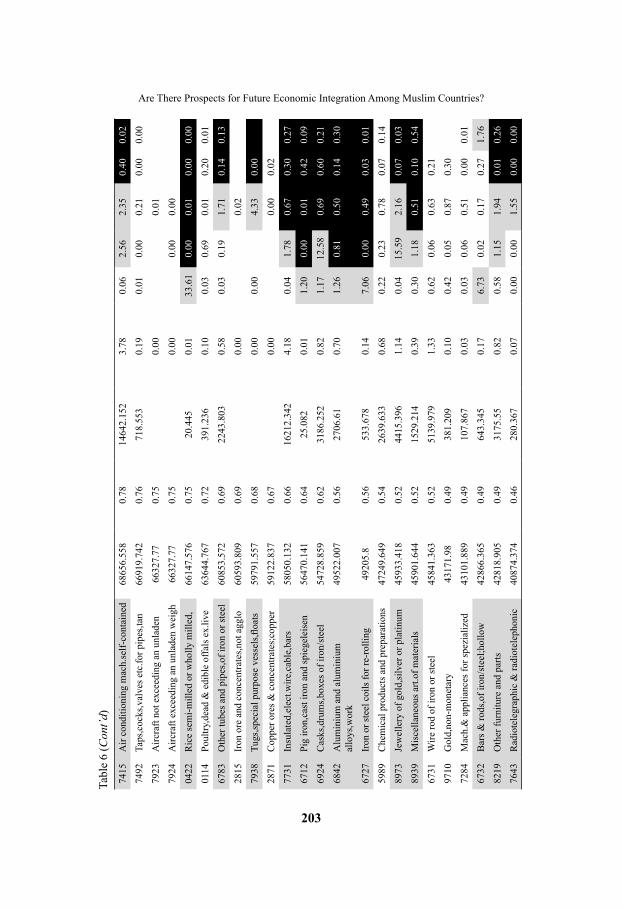
203
are there Prospects for Future Economic Integration among Muslim Countries?
7415
air
cond
ition
ing
mac
h.se
lf-co
ntai
ned
6865
6.55
80.
7814
642.
152
3.78
0.06
2.56
2.35
0.40
0.02
7492
taps
,coc
ks,v
alve
s etc
.for p
ipes
,tan
6691
9.74
20.
7671
8.55
30.
190.
010.
000.
210.
000.
00
7923
airc
raft
not e
xcee
ding
an
unla
den
6632
7.77
0.75
0.00
0.01
7924
airc
raft
exce
edin
g an
unl
aden
wei
gh66
327.
770.
750.
000.
000.
00
0422
Ric
e se
mi-m
illed
or w
holly
mill
ed,
6614
7.57
60.
7520
.445
0.01
33.6
10.
000.
010.
000.
00
0114
Poul
try,d
ead
& e
dibl
e of
fals
ex.
live
6364
4.76
70.
7239
1.23
60.
100.
030.
690.
010.
200.
01
6783
oth
er tu
bes a
nd p
ipes
,of i
ron
or st
eel
6085
3.57
20.
6922
43.8
030.
580.
030.
191.
710.
140.
13
2815
Iron
ore
and
con
cent
rate
s,not
agg
lo60
593.
809
0.69
0.00
0.02
7938
Tugs
,spec
ial p
urpo
se v
esse
ls,fl
oats
5979
1.55
70.
680.
000.
004.
330.
00
2871
Cop
per o
res &
con
cent
rate
s;co
pper
59
122.
837
0.67
0.00
0.00
0.02
7731
Insu
late
d,el
ect.w
ire,c
able
,bar
s58
050.
132
0.66
1621
2.34
24.
180.
041.
780.
670.
300.
27
6712
Pig
iron,
cast
iron
and
spie
gele
isen
5647
0.14
10.
6425
.082
0.01
1.20
0.00
0.01
0.42
0.09
6924
Cas
ks,d
rum
s,box
es o
f iro
n/st
eel
5472
8.85
90.
6231
86.2
520.
821.
1712
.58
0.69
0.60
0.21
6842
alu
min
ium
and
alu
min
ium
al
loys
,wor
k49
522.
007
0.56
2706
.61
0.70
1.26
0.81
0.50
0.14
0.30
6727
Iron
or s
teel
coi
ls fo
r re-
rolli
ng49
205.
80.
5653
3.67
80.
147.
060.
000.
490.
030.
01
5989
Che
mic
al p
rodu
cts a
nd p
repa
ratio
ns47
249.
649
0.54
2639
.633
0.68
0.22
0.23
0.78
0.07
0.14
8973
Jew
elle
ry o
f gol
d,si
lver
or p
latin
um45
933.
418
0.52
4415
.396
1.14
0.04
15.5
92.
160.
070.
03
8939
Mis
cella
neou
s art.
of m
ater
ials
45
901.
644
0.52
1529
.214
0.39
0.30
1.18
0.51
0.10
0.54
6731
Wire
rod
of ir
on o
r ste
el45
841.
363
0.52
5139
.979
1.33
0.62
0.06
0.63
0.21
9710
Gol
d,no
n-m
onet
ary
4317
1.98
0.49
381.
209
0.10
0.42
0.05
0.87
0.30
7284
Mac
h.&
app
lianc
es fo
r spe
zial
ized
43
101.
889
0.49
107.
867
0.03
0.03
0.06
0.51
0.00
0.01
6732
Bar
s & ro
ds,o
f iro
n/st
eel;h
ollo
w
4286
6.36
50.
4964
3.34
50.
176.
730.
020.
170.
271.
76
8219
oth
er fu
rnitu
re a
nd p
arts
4281
8.90
50.
4931
75.5
50.
820.
581.
151.
940.
010.
26
7643
Rad
iote
legr
aphi
c &
radi
otel
epho
nic
4087
4.37
40.
4628
0.36
70.
070.
000.
001.
550.
000.
00
tabl
e 6
(Con
t’d)

204
International Journal of Economics and Management
1222
Cig
aret
tes
3960
60.
450.
000.
006.
820.
820.
000.
20
0585
Juic
es;fr
uit &
veg
et.(i
ncl.g
rape
)38
474.
326
0.44
0.00
2.20
0.31
0.15
0.76
0.62
0012
Shee
p an
d go
ats,
live
3815
2.08
10.
430.
762
0.00
0.27
34.4
30.
001.
0529
8.42
7442
Lifti
ng,h
andl
ing,
load
ing
mac
h.co
nve
3798
4.60
20.
439.
758
0.00
0.36
0.24
0.36
0.00
0.02
0980
Edib
le p
rodu
cts a
nd p
repa
ratio
ns n
.36
817.
186
0.42
3215
.733
0.83
0.32
1.08
0.53
0.06
0.65
6612
Portl
and
cem
ent,c
imen
t fon
du,sl
ag c
3676
1.43
80.
4220
9.29
0.05
43.8
35.
970.
760.
690.
01
no
of p
rodu
cts w
ith Ir
CA
>110
1411
22
Not
e: t
he sh
aded
cel
ls re
pres
ent p
rodu
cts w
ith p
oten
tially
hig
her i
ntra
-trad
e w
ith th
eir r
espe
ctiv
e IR
Ca
s tha
t hav
e va
lues
of g
reat
er th
an 1
.
tabl
e 6
(Con
t’d)
Tabl
e 7
Maj
or im
ports
of S
audi
ara
bia
and
inde
x of
reve
aled
com
para
tive
adva
ntag
e (I
RC
a) o
f sel
ecte
d o
IC p
artn
er c
ount
ries
SIT
CPr
oduc
t des
crip
tion
Trad
e va
lue
(uS$
‘000
)
Shar
e in
tota
l im
port
s (%
)
Trad
e va
lue
from
sele
cted
O
IC c
ount
ries
(u
S$ ‘0
00)
Shar
e of
impo
rts
from
sele
cted
OIC
co
untr
ies
(%)
IrC
A
Jord
anM
alay
sia
Om
anE
gypt
Syri
a
7810
Pass
enge
r mot
or c
ars,f
or tr
ansp
ort
6630
803.
222
11.1
410
55.5
840.
040.
000.
020.
000.
00
5417
Med
icam
ents
(incl
udin
g ve
terin
ary
med
.)15
7099
4.71
42.
6410
8445
.502
4.57
3.46
0.02
0.00
0.29
0.20
7643
Rad
iote
legr
aphi
c &
radi
otel
epho
nic
1518
870.
617
2.55
4732
.982
0.20
0.00
1.55
0.00
0.00
0.00
7821
Mot
or v
ehic
les f
or tr
ansp
ort o
f goo
ds13
7231
5.50
12.
3158
0.55
70.
020.
000.
020.
000.
01
7929
Parts
of h
eadi
ng 7
92--
,exc
l.tyr
es13
5899
0.24
32.
2876
.853
0.00
0.00
0.59
0.00
0.07
0430
Bar
ley,
unm
illed
1048
283.
163
1.76
0.41
30.
000.
000.
000.
010.
09
7849
oth
er p
arts
& a
cces
sorie
s of m
otor
9254
36.8
561.
5610
543.
582
0.44
0.02
0.11
0.02
0.03
7938
Tugs
,spec
ial p
urpo
se v
esse
ls,fl
oatin
g90
3611
.359
1.52
0.00
4.33
0.00
0.00
9710
Gol
d,no
n-m
onet
ary
8005
23.0
121.
350.
000.
050.
870.
050.
42

205
are there Prospects for Future Economic Integration among Muslim Countries?ta
ble
7 (C
ont’d
)68
42a
lum
iniu
m a
nd a
lum
iniu
m
allo
ys,w
ork
7423
03.0
161.
2517
684.
918
0.74
0.81
0.50
0.52
1.26
0.30
7239
Parts
of t
he m
achi
nery
of 7
23.4
1 to
7364
78.4
231.
2484
8.65
70.
040.
010.
150.
000.
010.
03
7721
Elec
t.app
.such
as s
witc
hes,r
elay
s68
9996
.812
1.16
1334
7.39
80.
560.
072.
980.
020.
030.
00
0012
Shee
p an
d go
ats,
live
6476
18.7
991.
0939
9163
.212
16.8
134
.43
0.00
0.56
0.27
298.
42
0114
Poul
try,d
ead
& e
dibl
e of
fals
ex.
live
6266
61.0
191.
0532
0.10
10.
010.
690.
010.
280.
030.
01
7149
Parts
of t
he e
ngin
es &
mot
ors o
f 71
6145
86.2
261.
030.
720.
000.
000.
190.
000.
01
7131
Inte
rnal
com
bust
ion
pist
on e
ngin
es58
7213
.722
0.99
0.00
0.00
6.88
0.06
5530
Perf
umer
y,co
smet
ics a
nd to
ilet p
rep
5682
37.6
10.
9588
72.2
580.
370.
420.
210.
050.
570.
24
5989
Che
mic
al p
rodu
cts a
nd p
repa
ratio
ns53
6370
.795
0.90
9935
.217
0.42
0.23
0.78
0.00
0.22
0.14
6727
Iron
or s
teel
coi
ls fo
r re-
rolli
ng53
3531
.326
0.90
7436
9.07
73.
130.
000.
497.
060.
01
6749
oth
er sh
eets
and
pla
tes,o
f iro
n 53
1587
.13
0.89
4393
1.41
21.
850.
020.
320.
010.
050.
00
0422
Ric
e se
mi-m
illed
or w
holly
mill
ed52
7435
.632
0.89
8308
.666
0.35
0.00
0.01
0.00
33.6
10.
00
0224
Milk
& c
ream
,pre
serv
ed,c
once
ntra
ted
5109
18.1
870.
8641
697.
888
1.76
7.12
0.56
4.51
0.09
0.30
7492
taps
,coc
ks,v
alve
s etc
.for p
ipes
,tan
5090
76.7
230.
8628
1.07
70.
010.
000.
210.
000.
010.
00
2815
Iron
ore
and
con
cent
rate
s,not
agg
lo49
9628
.12
0.84
0.00
0.02
0.04
0980
Edib
le p
rodu
cts a
nd p
repa
ratio
ns
4990
38.3
440.
8446
986.
381
1.98
1.08
0.53
0.30
0.32
0.65
7234
Con
stru
ctio
n an
d m
inin
g m
achi
nery
4755
73.6
880.
8043
9.05
40.
020.
000.
130.
130.
10
7649
Parts
of a
ppar
atus
of d
ivis
ion
76--
4686
50.7
230.
7929
56.6
060.
120.
001.
380.
000.
030.
00
6822
Cop
per a
nd c
oppe
r allo
ys,w
orke
d45
2198
.927
0.76
1346
1.61
10.
570.
351.
360.
280.
050.
05
1222
Cig
aret
tes
4342
76.6
50.
7331
81.6
730.
136.
820.
820.
000.
000.
20
6252
tyre
s,pne
umat
.,new
,of a
kin
d us
ed
4220
87.9
90.
7151
16.1
310.
220.
000.
130.
002.
26
7599
Parts
of a
nd a
cces
sorie
s 39
3764
.808
0.66
1639
4.33
70.
690.
003.
640.
000.
00
8219
oth
er fu
rnitu
re a
nd p
arts
3714
49.0
840.
6248
377.
895
2.04
1.15
1.94
0.19
0.58
0.26
7415
air
cond
ition
ing
mac
h.se
lf-co
ntai
ned
3688
07.4
970.
6277
40.6
420.
332.
562.
350.
000.
060.
02
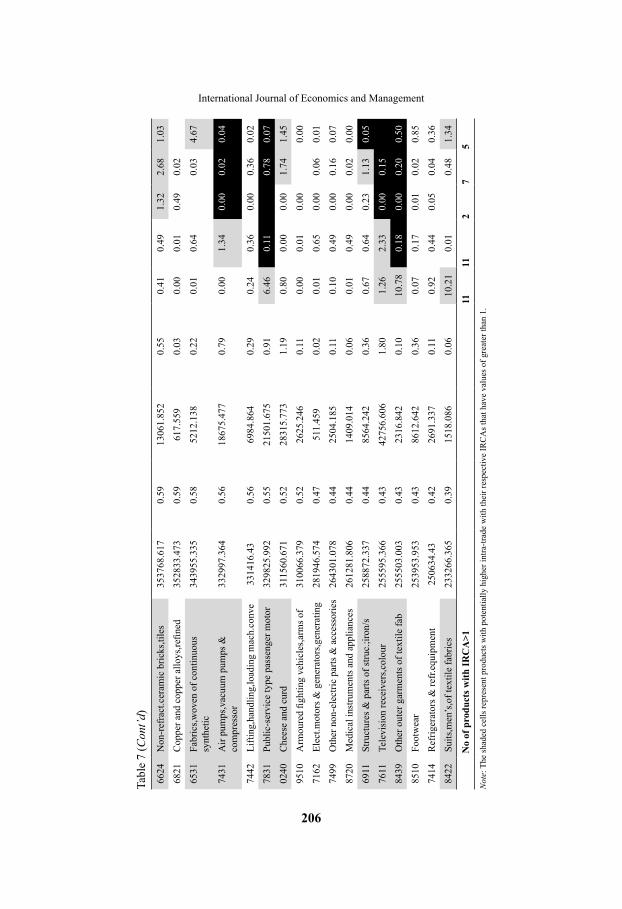
206
International Journal of Economics and Management
6624
Non
-ref
ract
.cer
amic
bric
ks,ti
les
3537
68.6
170.
5913
061.
852
0.55
0.41
0.49
1.32
2.68
1.03
6821
Cop
per a
nd c
oppe
r allo
ys,re
fined
35
2833
.473
0.59
617.
559
0.03
0.00
0.01
0.49
0.02
6531
Fabr
ics,w
oven
of c
ontin
uous
sy
nthe
tic34
3955
.335
0.58
5212
.138
0.22
0.01
0.64
0.03
4.67
7431
air
pum
ps,v
acuu
m p
umps
&
com
pres
sor
3329
97.3
640.
5618
675.
477
0.79
0.00
1.34
0.00
0.02
0.04
7442
Lifti
ng,h
andl
ing,
load
ing
mac
h.co
nve
3314
16.4
30.
5669
84.8
640.
290.
240.
360.
000.
360.
02
7831
Publ
ic-s
ervi
ce ty
pe p
asse
nger
mot
or32
9825
.992
0.55
2150
1.67
50.
916.
460.
110.
780.
07
0240
Che
ese
and
curd
3115
60.6
710.
5228
315.
773
1.19
0.80
0.00
0.00
1.74
1.45
9510
Arm
oure
d fig
htin
g ve
hicl
es,a
rms o
f31
0066
.379
0.52
2625
.246
0.11
0.00
0.01
0.00
0.00
7162
Elec
t.mot
ors &
gen
erat
ors,g
ener
atin
g28
1946
.574
0.47
511.
459
0.02
0.01
0.65
0.00
0.06
0.01
7499
oth
er n
on-e
lect
ric p
arts
& a
cces
sorie
s26
4301
.078
0.44
2504
.185
0.11
0.10
0.49
0.00
0.16
0.07
8720
Med
ical
inst
rum
ents
and
app
lianc
es26
1281
.806
0.44
1409
.014
0.06
0.01
0.49
0.00
0.02
0.00
6911
Stru
ctur
es &
par
ts o
f stru
c.;ir
on/s
2588
72.3
370.
4485
64.2
420.
360.
670.
640.
231.
130.
05
7611
tele
visi
on re
ceiv
ers,c
olou
r25
5595
.366
0.43
4275
6.60
61.
801.
262.
330.
000.
15
8439
oth
er o
uter
gar
men
ts o
f tex
tile
fab
2555
03.0
030.
4323
16.8
420.
1010
.78
0.18
0.00
0.20
0.50
8510
Foot
wea
r25
3953
.953
0.43
8612
.642
0.36
0.07
0.17
0.01
0.02
0.85
7414
Ref
riger
ator
s & re
fr.eq
uipm
ent
2506
34.4
30.
4226
91.3
370.
110.
920.
440.
050.
040.
36
8422
Suits
,men
’s,o
f tex
tile
fabr
ics
2332
66.3
650.
3915
18.0
860.
0610
.21
0.01
0.48
1.34
no
of p
rodu
cts w
ith Ir
CA
>111
112
75
Not
e: t
he sh
aded
cel
ls re
pres
ent p
rodu
cts w
ith p
oten
tially
hig
her i
ntra
-trad
e w
ith th
eir r
espe
ctiv
e IR
Ca
s tha
t hav
e va
lues
of g
reat
er th
an 1
.
tabl
e 7
(Con
t’d)

207
are there Prospects for Future Economic Integration among Muslim Countries?
products imported by Saudi arabia. Products that both Jordan and Malaysia possess comparative advantage are food & live animals (SItC 0), beverages & tobacco (SItC 1), chemicals & materials (SItC 5), manufactured goods (SItC 6), machinery & transport equipment (SItC 7), and miscellaneous manufactures (SItC 8). Egypt and Syria, on the other hand, are found to have comparative advantage in food & live animals (SItC 0), manufactured goods (SItC 6), and miscellaneous manufactures (SItC 8).
Column 6 shows the share of the 50 major products imported by Saudi arabia from oIC countries. Sheep & goats (SItC 0012) make up the largest share of Saudi’s imports from oIC members with the total amount of uS$399.2 million (16.81%). this is followed by medicaments (SItC 5417), iron or steel coils (SItC 6727), and other furniture & parts (SItC 8219) with trade values of uS$108.4 million (4.57%), uS$74.4 million (3.13%), and uS$48.4 million, respectively. the oIC countries are found to have comparative advantage in these products.
Food & live animals (SItC 0) dominates the 10 major import products of Saudi arabia from the oIC countries with the share of 21.74%, followed by manufactured goods (SItC 6), chemicals & materials (SItC 5), machinery & transport equipment (SItC 7), and miscellaneous manufactures (SItC 8) with the respective shares of 4.98%, 4.57%, 2.71%, and 2.04%.
Syriatable 8 shows the 50 major products imported by Syria in 2005. Similar to Saudi arabia, passenger motorcars (SItC 7810) makes up the largest share (5.34%) in Syria’s total imports amounting to uS$421.7 million. other major import products, each respectively make up more than 2% of the share in Syria’s total imports are polyethylene (SItC 5831), motor vehicles (SItC 7821), maize (SItC 0440), yarn (SITC 6514), refined sugars (SITC 0612), blooms, billets, slabs & sheet bars (SITC 6725), and bars & rods of iron/steel (SITC 6732).
Manufactured goods (SItC 6) represent the largest share of major products imported by Syria with the share in total imports of 19.01%. the next major import categories are machinery & transport equipment (SItC 7), food & live animals (SItC 0), chemicals & materials (SItC 5), and crude materials (SItC 2), each consisting of 14.49%, 10.09%, 7.03%, and 3.49% of the share of Syria’s imports.
out of the 50 major imports of Syria, 27 products (where the IRCa>1) are found to have potential for intra-trade between Syria and oIC countries. Products with potential intra-trade are food & live animals (SItC 0), beverages & tobacco (SItC 1), crude materials (SItC 2), chemicals & materials (SItC 5), manufactured goods (SItC 6), machinery & transport equipment (SItC 7), and miscellaneous manufactures (SItC 8).
Based on the IRCa values, Egypt and Malaysia are found to have potential trade complementarities with Syria. Egypt and Malaysia have comparative advantage in
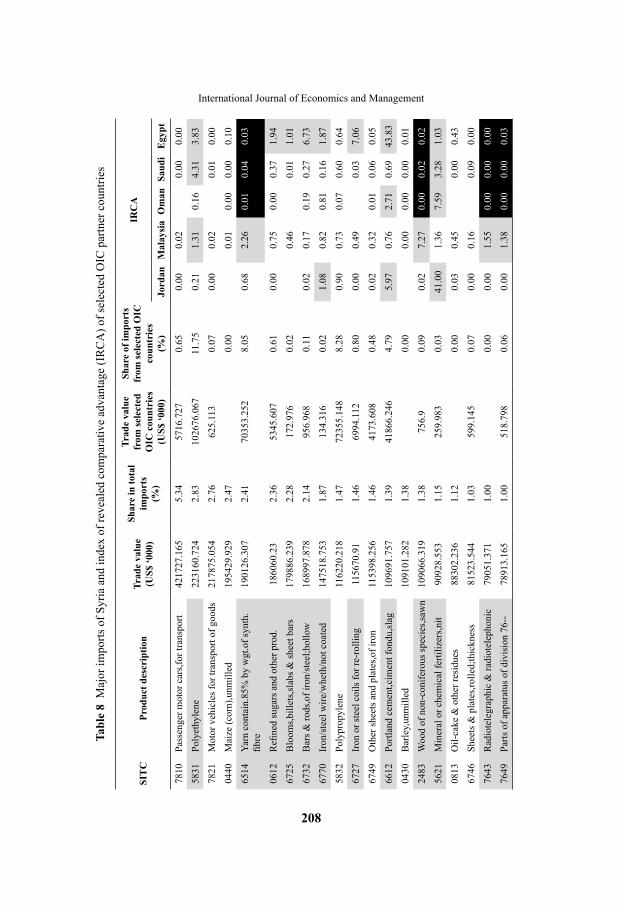
208
International Journal of Economics and ManagementTa
ble
8 M
ajor
impo
rts o
f Syr
ia a
nd in
dex
of re
veal
ed c
ompa
rativ
e ad
vant
age
(IR
Ca
) of s
elec
ted
oIC
par
tner
cou
ntrie
s
SIT
CPr
oduc
t des
crip
tion
Trad
e va
lue
(uS$
‘000
)
Shar
e in
tota
l im
port
s (%
)
Trad
e va
lue
from
sele
cted
O
IC c
ount
ries
(u
S$ ‘0
00)
Shar
e of
impo
rts
from
sele
cted
OIC
co
untr
ies
(%)
IrC
A
Jord
anM
alay
sia
Om
anSa
udi
Egy
pt
7810
Pass
enge
r mot
or c
ars,f
or tr
ansp
ort
4217
27.1
655.
3457
16.7
270.
650.
000.
020.
000.
00
5831
Poly
ethy
lene
2231
60.7
242.
8310
2676
.067
11.7
50.
211.
310.
164.
313.
83
7821
Mot
or v
ehic
les f
or tr
ansp
ort o
f goo
ds21
7875
.054
2.76
625.
113
0.07
0.00
0.02
0.01
0.00
0440
Mai
ze (c
orn)
,unm
illed
1954
29.9
292.
470.
000.
010.
000.
000.
10
6514
Yarn
con
tain
.85%
by
wgt
.of s
ynth
.fib
re19
0126
.307
2.41
7035
3.25
28.
050.
682.
260.
010.
040.
03
0612
Refi
ned
suga
rs a
nd o
ther
pro
d.
1860
60.2
32.
3653
45.6
070.
610.
000.
750.
000.
371.
94
6725
Blo
oms,b
illet
s,sla
bs &
shee
t bar
s 17
9886
.239
2.28
172.
976
0.02
0.46
0.01
1.01
6732
Bar
s & ro
ds,o
f iro
n/st
eel;h
ollo
w
1689
97.8
782.
1495
6.96
80.
110.
020.
170.
190.
276.
73
6770
Iron
/ste
el w
ire/w
heth
/not
coa
ted
1475
18.7
531.
8713
4.31
60.
021.
080.
820.
810.
161.
87
5832
Poly
prop
ylen
e11
6220
.218
1.47
7235
5.14
88.
280.
900.
730.
070.
600.
64
6727
Iron
or s
teel
coi
ls fo
r re-
rolli
ng11
5670
.91
1.46
6994
.112
0.80
0.00
0.49
0.03
7.06
6749
oth
er sh
eets
and
pla
tes,o
f iro
n 11
5398
.256
1.46
4173
.608
0.48
0.02
0.32
0.01
0.06
0.05
6612
Portl
and
cem
ent,c
imen
t fon
du,sl
ag
1096
91.7
571.
3941
866.
246
4.79
5.97
0.76
2.71
0.69
43.8
3
0430
Bar
ley,
unm
illed
1091
01.2
821.
380.
000.
000.
000.
000.
01
2483
Woo
d of
non
-con
ifero
us sp
ecie
s,saw
n10
9066
.319
1.38
756.
90.
090.
027.
270.
000.
020.
02
5621
Min
eral
or c
hem
ical
ferti
lizer
s,nit
9092
8.55
31.
1525
9.98
30.
0341
.00
1.36
7.59
3.28
1.03
0813
oil-
cake
& o
ther
resi
dues
88
302.
236
1.12
0.00
0.03
0.45
0.00
0.43
6746
Shee
ts &
pla
tes,r
olle
d;th
ickn
ess
8152
3.54
41.
0359
9.14
50.
070.
000.
160.
090.
00
7643
Rad
iote
legr
aphi
c &
radi
otel
epho
nic
7905
1.37
11.
000.
000.
001.
550.
000.
000.
00
7649
Parts
of a
ppar
atus
of d
ivis
ion
76--
7891
3.16
51.
0051
8.79
80.
060.
001.
380.
000.
000.
03
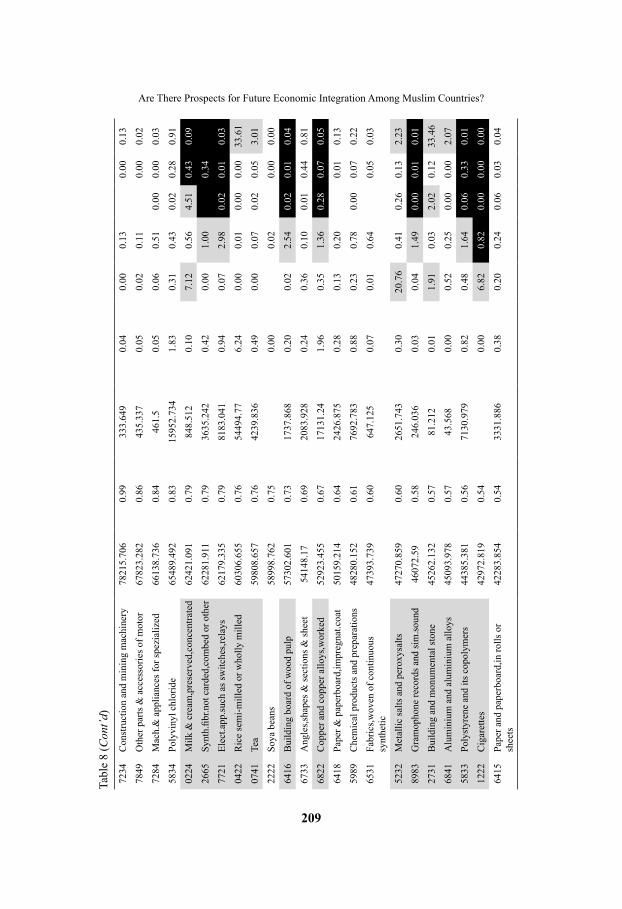
209
are there Prospects for Future Economic Integration among Muslim Countries?
7234
Con
stru
ctio
n an
d m
inin
g m
achi
nery
7821
5.70
60.
9933
3.64
90.
040.
000.
130.
000.
13
7849
oth
er p
arts
& a
cces
sorie
s of m
otor
6782
3.28
20.
8643
5.33
70.
050.
020.
110.
000.
02
7284
Mac
h.&
app
lianc
es fo
r spe
zial
ized
66
138.
736
0.84
461.
50.
050.
060.
510.
000.
000.
03
5834
Poly
viny
l chl
orid
e65
489.
492
0.83
1595
2.73
41.
830.
310.
430.
020.
280.
91
0224
Milk
& c
ream
,pre
serv
ed,c
once
ntra
ted
6242
1.09
10.
7984
8.51
20.
107.
120.
564.
510.
430.
09
2665
Synt
h.fib
r.not
car
ded,
com
bed
or o
ther
6228
1.91
10.
7936
35.2
420.
420.
001.
000.
34
7721
Elec
t.app
.such
as s
witc
hes,r
elay
s62
179.
335
0.79
8183
.041
0.94
0.07
2.98
0.02
0.01
0.03
0422
Ric
e se
mi-m
illed
or w
holly
mill
ed60
306.
655
0.76
5449
4.77
6.24
0.00
0.01
0.00
0.00
33.6
1
0741
tea
5980
8.65
70.
7642
39.8
360.
490.
000.
070.
020.
053.
01
2222
Soya
bea
ns58
998.
762
0.75
0.00
0.02
0.00
0.00
6416
Bui
ldin
g bo
ard
of w
ood
pulp
57
302.
601
0.73
1737
.868
0.20
0.02
2.54
0.02
0.01
0.04
6733
ang
les,s
hape
s & se
ctio
ns &
shee
t 54
148.
170.
6920
83.9
280.
240.
360.
100.
010.
440.
81
6822
Cop
per a
nd c
oppe
r allo
ys,w
orke
d52
923.
455
0.67
1713
1.24
1.96
0.35
1.36
0.28
0.07
0.05
6418
Pape
r & p
aper
boar
d,im
preg
nat.c
oat
5015
9.21
40.
6424
26.8
750.
280.
130.
200.
010.
13
5989
Che
mic
al p
rodu
cts a
nd p
repa
ratio
ns48
280.
152
0.61
7692
.783
0.88
0.23
0.78
0.00
0.07
0.22
6531
Fabr
ics,w
oven
of c
ontin
uous
sy
nthe
tic47
393.
739
0.60
647.
125
0.07
0.01
0.64
0.05
0.03
5232
Met
allic
salts
and
per
oxys
alts
47
270.
859
0.60
2651
.743
0.30
20.7
60.
410.
260.
132.
23
8983
Gra
mop
hone
reco
rds a
nd si
m.so
und
4607
2.59
0.58
246.
036
0.03
0.04
1.49
0.00
0.01
0.01
2731
Bui
ldin
g an
d m
onum
enta
l sto
ne
4526
2.13
20.
5781
.212
0.01
1.91
0.03
2.02
0.12
33.4
6
6841
alu
min
ium
and
alu
min
ium
allo
ys45
093.
978
0.57
43.5
680.
000.
520.
250.
000.
002.
07
5833
Poly
styr
ene
and
its c
opol
ymer
s44
385.
381
0.56
7130
.979
0.82
0.48
1.64
0.06
0.33
0.01
1222
Cig
aret
tes
4297
2.81
90.
540.
006.
820.
820.
000.
000.
00
6415
Pape
r and
pap
erbo
ard,
in ro
lls o
r sh
eets
4228
3.85
40.
5433
31.8
860.
380.
200.
240.
060.
030.
04
tabl
e 8
(Con
t’d)

210
International Journal of Economics and Management
7224
Whe
eled
trac
tors
,not
incl
. in
744.
142
051.
178
0.53
423.
272
0.05
0.00
0.01
0.00
0.01
6731
Wire
rod
of ir
on o
r ste
el41
926.
722
0.53
0.00
0.06
0.63
1.24
0.21
0.62
7245
Wea
ving
,kni
tting
mac
h. fo
r pre
parin
g36
828.
320.
470.
000.
000.
100.
000.
000.
01
5823
alk
yds a
nd o
ther
pol
yest
ers
3583
3.51
50.
4533
62.1
340.
380.
550.
820.
020.
100.
00
0421
Ric
e in
the
husk
or h
uske
d35
542.
934
0.45
1889
0.23
32.
160.
000.
014.
26
8720
Med
ical
inst
rum
ents
and
app
lianc
es35
411.
194
0.45
1855
.47
0.21
0.01
0.49
0.00
0.00
0.02
7452
oth
er n
on-e
lect
rical
mac
h.am
p pa
rts35
029.
156
0.44
439.
424
0.05
0.10
0.12
0.00
0.02
0.01
no
of p
rodu
cts w
ith Ir
CA
>17
125
214
Not
e: t
he sh
aded
cel
ls re
pres
ent p
rodu
cts w
ith p
oten
tially
hig
her i
ntra
-trad
e w
ith th
eir r
espe
ctiv
e IR
Ca
s tha
t hav
e va
lues
of g
reat
er th
an 1
.
tabl
e 8
(Con
t’d)

211
are there Prospects for Future Economic Integration among Muslim Countries?
14 and 12, respectively, out of 50 major products imported by Syria. these products are food & live animals (SItC 0), crude materials (SItC 2), chemicals & materials (SItC 5), manufactured goods (SItC 6), machinery & transport equipment (SItC 7), and miscellaneous manufactures (SItC 8).
Jordan, on the other hand, possesses comparative advantage in 7 products. the products that Jordan are found to have comparative advantage are food & live animals (SItC 0), beverages & tobacco (SItC 1), crude materials (SItC 2), chemicals & materials (SItC 5), manufactured goods (SItC 6). oman and Saudi arabia have comparative advantage in 5 and 2 products, respectively. these products are food & live animals (SItC 0), chemicals & materials (SItC 5), manufactured goods (SItC 6).
Column 6 shows shares of the 50 major products imported by Syria from oIC countries. Polyethylene (SItC 5831) constitutes the largest share (11.75%) of Syria’s imports from the oIC members with the trade value of uS$102.7 million. the second and third major imports from oIC countries are polypropylene (SItC 5832) and yarn (SItC 6514), each constituting about 8% of the share of Syria’s imports from oIC, with the amount of uS$72.4 million and uS$70.4 million, respectively.
Syria’s major import products from the oIC countries include chemicals & materials (SItC 5), manufactured goods (SItC 6), food & live animals (SItC 0) and machinery & transport equipment (SItC 7) with the share of 23.56%, 14.80%, 8.40%, and 0.94%, respectively. the oIC countries are found to possess comparative advantage 6 of the 10 major products that Syria imports from the oIC members. the six products fall into the following categories: food & live animals (SItC 0), chemicals & materials (SItC 5), manufactured goods (SItC 6), and machinery & transport equipment (SItC 7).
the overall results for all the six countries are summarized in table 9. In general, all the oIC countries under study have potentials to enhance intra-trade among themselves in chemicals & materials (SITC 5), while at least five of the countries have trade potentials in food & live animals (SItC 0), manufactured goods (SItC 6), and machinery & transport equipment (SItC 7). to a lesser degree, there are also intra-trade potentials in miscellaneous manufactures (SItC 8), food & beverages (SItC 1), and crude materials (SItC 2). Based on the results above, trade complementarity analyses by using the index of revealed comparative advantage indices do not seem to indicate a very bright prospect for higher intra-oIC trade.
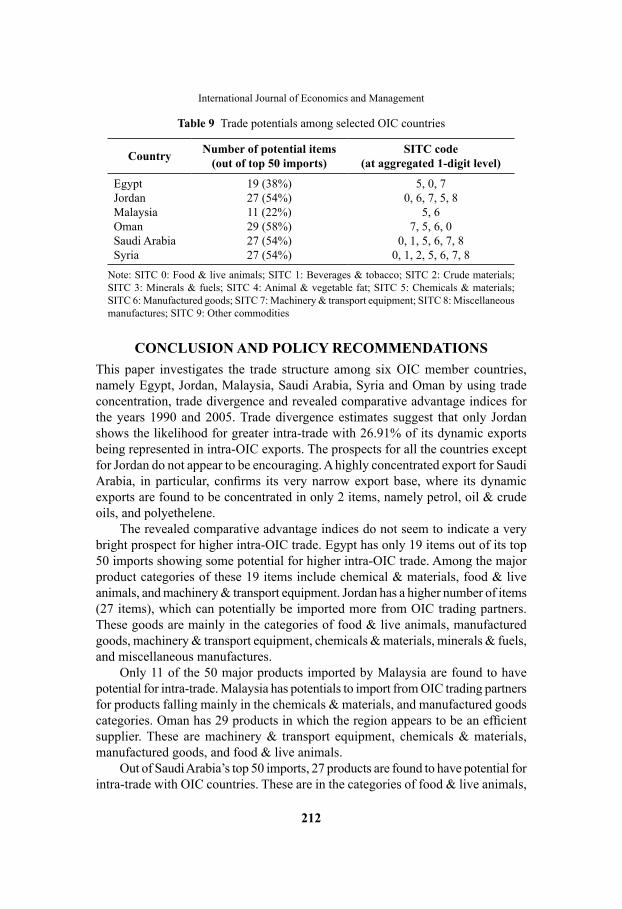
212
International Journal of Economics and Management
Table 9 trade potentials among selected oIC countries
Country number of potential items (out of top 50 imports)
SITC code (at aggregated 1-digit level)
Egypt 19 (38%) 5, 0, 7Jordan 27 (54%) 0, 6, 7, 5, 8Malaysia 11 (22%) 5, 6oman 29 (58%) 7, 5, 6, 0Saudi arabia 27 (54%) 0, 1, 5, 6, 7, 8Syria 27 (54%) 0, 1, 2, 5, 6, 7, 8
Note: SItC 0: Food & live animals; SItC 1: Beverages & tobacco; SItC 2: Crude materials; SItC 3: Minerals & fuels; SItC 4: animal & vegetable fat; SItC 5: Chemicals & materials; SItC 6: Manufactured goods; SItC 7: Machinery & transport equipment; SItC 8: Miscellaneous manufactures; SItC 9: other commodities
COnCLuSIOn And POLICy rECOMMEndATIOnSthis paper investigates the trade structure among six oIC member countries, namely Egypt, Jordan, Malaysia, Saudi arabia, Syria and oman by using trade concentration, trade divergence and revealed comparative advantage indices for the years 1990 and 2005. trade divergence estimates suggest that only Jordan shows the likelihood for greater intra-trade with 26.91% of its dynamic exports being represented in intra-oIC exports. the prospects for all the countries except for Jordan do not appear to be encouraging. a highly concentrated export for Saudi Arabia, in particular, confirms its very narrow export base, where its dynamic exports are found to be concentrated in only 2 items, namely petrol, oil & crude oils, and polyethelene.
the revealed comparative advantage indices do not seem to indicate a very bright prospect for higher intra-oIC trade. Egypt has only 19 items out of its top 50 imports showing some potential for higher intra-oIC trade. among the major product categories of these 19 items include chemical & materials, food & live animals, and machinery & transport equipment. Jordan has a higher number of items (27 items), which can potentially be imported more from oIC trading partners. these goods are mainly in the categories of food & live animals, manufactured goods, machinery & transport equipment, chemicals & materials, minerals & fuels, and miscellaneous manufactures.
only 11 of the 50 major products imported by Malaysia are found to have potential for intra-trade. Malaysia has potentials to import from oIC trading partners for products falling mainly in the chemicals & materials, and manufactured goods categories. Oman has 29 products in which the region appears to be an efficient supplier. these are machinery & transport equipment, chemicals & materials, manufactured goods, and food & live animals.
out of Saudi arabia’s top 50 imports, 27 products are found to have potential for intra-trade with oIC countries. these are in the categories of food & live animals,
213
are there Prospects for Future Economic Integration among Muslim Countries?
beverages & tobacco, chemicals & materials, manufactured goods, machinery & transport equipment, and miscellaneous manufactures. as for Syria, 27 products have potentials for higher intra-oIC trade, namely food & live animals, beverages & tobacco, crude materials, chemicals & materials, manufactured goods, machinery & transport equipment, and miscellaneous manufactures.
the findings indicate that the oIC countries will have to undertake a monumental and serious effort to prepare themselves for the establishment of an Islamic Common Market. Members will need to develop comparative advantage in many non-traditional sectors in order to enable higher trade creation among oIC countries. this will involve strategic industrial policies to identify and develop sectors to meet the import needs of oIC trading partners. however, such measures represent long-term policies which involves a substantial period of time for the effects to be visible. as immediate measures, higher trade integration can be enhanced through the establishment of the trade Preferential System focusing on sectors where oIC countries currently exhibit comparative advantage. From the above analysis, these sectors are chemicals & materials, manufactured goods, machinery & transport equipment, and food & live animals. Bilateral trade agreements among oIC countries can also be established to enhance trade in the targeted sectors. Such bilateral agreements can accelerate intra-oIC trade as it is easier to customize tariff reduction schemes in the potential areas identified between pairs of countries rather than formulating a more generalized tariff reduction scheme across a bigger number of countries.
this study examines the trade potentials of a subset of oIC countries. For a more comprehensive analysis, the study can be extended to include other member countries so as to obtain further insight into the trade potentials among oIC countries as a whole.
ACKnOwLEdgEMEnTthe authors would like to thank the Ministry of higher Education, Malaysia, for providing the research grant under the Fundamental Research Grant Scheme for the conduct of this research project.
rEFErEnCESappleyard, d.R. (1995) International Economics. 2nd ed. Irwin: Chicago.Chen, C.h., Mai, C.C. and Shih, C.t. (2007), China and East asia: an appraisal of Regional
Economic Integration, Eurasian Geography and Economics, 48, no. 3, 320-340. deardoff, a. and Stern, R.M. (1994) Multilateral trade Negotiations and Preferential trade
arrangements, in Analytical and Negotiating Issues in the Global Trading System (Ed.) a. deardorff and R. M. Stern, university of Michigan Press, ann arbor.

214
International Journal of Economics and Management
Greenaway, d. (1986), The Economics of Intra-industry Trade, Cambridge: Basil Blackwell._______________. (1989), “Chapter 2. Regional trading arrangements andIntra-Industry trade: evidence and Policy Issues”, (in) Greenaway,david, hyclak, thomas and thornton and Robert t., Economic Aspects of Regional Trading
Arrangements, New York: New York University Press/ Washington Square.Grubel, h. G. and Llyod (1975), Intra-industry Trade: The Theory and Measurement of
International Trade in Differentiated Products, New York: Wiley.Ishido, h. (2004) East asia’s Economic development cum trade divergence. Institute of
developing Economies discussion Paper, No. 11.https://ir.ide.go.jp/dspace/bitstream/2344/329/1/ARRIDE_Discussion_No.11_ishido.pdf
(accessed october 1, 2007).Kali, R., F. Mendez and Reyes, J. (2007) trade Structure and Economic Growth, Journal
of International Trade and Economic Development, 16, no. 2, 245–269.Kim, C.S and Lee, K.E. (2003) Regional trade arrangements and Intra-industry trade: the
Case of Mercusor, Asian Journal of Latin American Studies, 16, no. 1, 95-113.Krugman, Paul. (1991) the Move toward Free trade zones. In Policy Implications of
Trade and Currency Zones. Kansas City: Federal Reserve Bank of Kansas City, 7-41.Lipsey, R. (1960) the theory of Customs unions: a General Survey, Economic Journal,
70, 498–513. Low, P., olarreaga, M. and Suarez, J. (1998). does Globalization Cause a higher
Concentration of International trade and Investment Flows? Economic Research and analysis division, World trade organization, Staff Working Paper ERAD-98-08. http://www.netamericas.net/Researchpapers/Documents/Low/Low1.doc (accessed October 1, 2007).
Massell, B.F. (1964) Export Concentration and Fluctuation in Export Earnings: a Cross Section analysis, American Economic Review, 54, no. 1, 47–63.
Michaely, M. (1996) trade Preferential agreements in Latin america: an Ex ante assessment. World Bank Policy Research Working Paper, No. 1583.
Park, d., Park, I. and Estrada, G.E. Is the aSEaN-Korea Free trade area (aKFta) an optimal Free trade area? Working Paper Series on Regional Economic Integration No. 21, November 2008.
Pitigala, N. (2005) What does Regional trade in South asia Reveal about Future trade Integration? Some Empirical Evidence. World Bank Policy Research Working Paper, No. 3497.
Soutar, G.N. (1977) Export Instability and Concentration in the Less developed Countries, Journal of Development Economics, 4, 279–297.
Winters, L.a. (1996) Regionalism versus Multilateralism. World Bank Mimeo.Wonnacott, P. and Lutz, M. (1989) Is there a Case for Free trade areas? in Free Trade Areas
and US Trade Policy (Ed.) J.J. Schott, Institute of International Economics, Washington, d.C., pp. 59–84.
215
are there Prospects for Future Economic Integration among Muslim Countries?
Yeats, a. (1998) What Can Be Expected from african Regional trade arrangements? Some Empirical Evidence. World Bank Policy Research Working Paper, No. 2004.
Viner, J. (1950) The Customs Union Issue. Carnegie Endowment for International Peace: New York.


