
1
2
3
4
5
6789
10
111213141516171819
40
41
42
43
44
45
46
47
48
49
50
51
52
53
54
NeuroImage xxx (2009) xxx–xxx
YNIMG-06234; No. of pages: 13; 4C:
Contents lists available at ScienceDirect
NeuroImage
j ourna l homepage: www.e lsev ie r.com/ locate /yn img
ARTICLE IN PRESS
OF
Mapping the regional influence of genetics on brain structurevariability —
^A Tensor-
^Based Morphometry study
Caroline Brun a,⁎, Natasha Leporé a, Xavier Pennec b, Agatha D. Lee a, Marina Barysheva a, Sarah K. Madsen a,Christina Avedissian a, Yi-
^Yu Chou a, Greig I. de Zubicaray c, Katie McMahon c, Margaret Wright d,
Arthur W. Toga a, Paul M. Thompson a
a Laboratory of Neuro Imaging, Department of Neurology, UCLA School of Medicine, 635 Charles Young Drive South Suite 225, Los Angeles, CA 90095-^7334, USA
b Asclepios Research Project, INRIA, 2004 route des Lucioles -^BP 93, 06902 Sophia-
^Antipolis Cedex, France
c Centre for Magnetic Resonance, University of Queensland, Brisbane, Queensland, 4072, Australiad Genetic Epidemiology Lab, Queensland Institute of Medical Research, PO Royal Brisbane Hospital, Queensland 4029, Australia
⁎ Corresponding author.E-mail address: [email protected] (C. Brun).
1053-8119/$ – see front matter © 2009 Published by Edoi:10.1016/j.neuroimage.2009.05.022
Please cite this article as: Brun, C., et al.,Morphometry Study, NeuroImage (2009), d
O
a b s t r a c t
a r t i c l e i n f o20
21
22
23
24
25
26
Article history:Received 6 December 2008Revised 4 May 2009Accepted 5 May 2009Available online xxxx
27
28
29
30
31
32
33
34
35
36
37
CTED
PRGenetic and environmental factors influence brain structure and function profoundly. The search forheritable anatomical features and their influencing genes would be accelerated with detailed 3D mapsshowing the degree to which brain morphometry is genetically determined. As part of an MRI study that willscan 1150 twins, we applied Tensor-
^Based Morphometry to compute morphometric differences in 23 pairs of
identical twins and 23 pairs of same-^sex fraternal twins (mean age: 23.8±1.8 SD years). All 92 twins'
^3D
brain MRI scans were nonlinearly registered to a common space using a Riemannian fluid-^based warping
approach to compute volumetric differences across subjects. A multi-^template method was used to improve
volume quantification. Vector fields driving each subject'^s anatomy onto the common template were
analyzed to create maps of local volumetric excesses and deficits relative to the standard template. Using anew structural equation modeling method, we computed the voxelwise proportion of variance in volumesattributable to additive (A) or dominant (D) genetic factors versus shared environmental (C) or uniqueenvironmental factors (E). The method was also applied to various anatomical regions of interest (ROIs). Ashypothesized, the overall volumes of the brain, basal ganglia, thalamus, and each lobe were under stronggenetic control; local white matter volumes were mostly controlled by common environment. After adjustingfor individual differences in overall brain scale, genetic influences were still relatively high in the corpuscallosum and in early-
^maturing brain regions such as the occipital lobes, while environmental influences
were greater in frontal brain regions which have a more protracted maturational time-^course.
38
E © 2009 Published by Elsevier Inc.39
55
56
57
58
59
60
61
62
63
64
65
66
67
68
UNCO
RRIntroduction
3D maps showing the relative contribution of genetic, shared andunique environmental factors to brain structure can facilitate theunderstanding of the influence of genetics on anatomical variability.Twins have been studied with quantitative genetic models toestimate these different factors. This approach has detected highlyheritable (i.e., genetically influenced) brain features, such as thewhole brain volume and total gray and white matter volumes(Posthuma et al., 2002).
Identifying genetically^influenced features is important, as genes
at least partially mediate many psychiatric disorders (Van'^t Ent et
al., 2007). In addition, many cognitive or behavioral measures innormal individuals, such as full-
^scale IQ, are highly genetically
69
70
71
72
lsevier Inc.
Mapping the Regional Influoi:10.1016/j.neuroimage.200
influenced (Gray and Thompson, 2004) and are correlated withmeasures of brain structure (Reiss et al., 1996; Thompson et al.,2001; Haier et al., 2004). These image-
^derived measures (such as
gray matter volume) are often called intermediate phenotypes ifthey are associated with an illness and are more amenable toquantitative genetic analysis (see Glahn et al. (2007a) for a reviewof the endophenotype concept). Using this approach, researchershave identified and confirmed specific genes that are associatedwith structural brain deficits in schizophrenia patients (Cannonet al., 2002, 2005; Pietiläinen et al., 2008; Narr et al., 2008).Association studies (Sullivan, 2007; Hattersley and McCarthy, 2005)and twin studies using a cross-
^twin cross-
^trait design (bivariate
genetic models) (Posthuma et al., 2002) have also found specificgenes or common sets of genes influencing brain morphology andcognitive performance.
Environmental factors (e.g., cardiovascular health, nutrition,exercise, and education) may also exert protective or harmful effectson the structural integrity of the brain (Raji et al., 2009). In
ence of Genetics on Brain Structure Variability — A Tensor-Based9.05.022
C
73
74
75
76
77
78
79
80
81
82
83
84
85
86
87
88
89
90
91
92
93
94
95
96
97
98
99
100
101
102
103
104
105
106
107
108
109
110
111
112
113
114
115
116
117
118
119
120
121
122
123
124
125
126
127
128
129
130
131
132
133
134
135
136
137
138
39
40
41
42
43
44
45
46
47
48
49
50
51
52
53
54
55
56
57
58
59
60
61
62
63
64
65
66
67
68
69
70
71
72
73
74
75
76
77
78
79
80
81
82
83
84
85
86
87
88
89
90
91
92
93
94
95
96
97
98
99
00
2 C. Brun et al. / NeuroImage xxx (2009) xxx–xxx
ARTICLE IN PRESS
UNCO
RRE
epidemiological studies and drug trials, it may be important toaccount for genetic and environmental influences on diseaseprogression (e.g., the ApoE4 risk allele in Alzheimer'
^s disease; Hua
et al. (2008b)), to adjust for confounds in the analysis of treatmenteffects (Jack et al., 2008). Twin studies can reveal whether specificneuroanatomical measures are predominantly influenced by geneticsor shared or individual environments (see Peper et al. (2007) for areview), by comparing twin pairs with different degrees of geneticaffinity. Identical (or monozygotic, MZ) twins share the same geneticmaterial, whereas fraternal (or dizygotic, DZ) twins share, onaverage, only half of their genetic polymorphisms (random DNAsequence variations that occur among normal individuals). DZ twinsare commonly studied in lieu of other siblings because they are thesame age, preventing any age-
^related confounds. Identical and
fraternal twin pairs are compared to ensure, to the greatest possibleextent, comparable upbringings and family environments despitevarying degrees of genetic resemblance.
The earliest neuroanatomical genetic studies used traditionalvolumetric measures and region of interest analyses to quantifysimilarity between MZ and DZ twins. Whole brain and hemisphericvolumes were found to be highly heritable (N80% for the whole brainin Pfefferbaum et al. (2000); Sullivan et al. (2001) and N94% for thehemispheric volume in Bartley et al. (1997)). Gray matter and whitematter volumes were shown to be 82% and 88% genetically deter-mined (Baaré et al., 2001), respectively. Oppeheim et al. (1989),
^Pfefferbaum et al. (2000)^, Scamvougeras et al. (2003), and
^Hulshoff
Pol et al. (2006a) showed that the corpus callosum is mostlycontrolled by genes, which was verified at different stages in life.Findings were less consistent for ventricular volume and shape.Reveley et al. (1982),
^Pfefferbaum et al. (2000) and Styner et al.
(2005) showed these structures to be highly heritable, whereasother studies (Baaré et al., 2001; Wright et al., 2002) determinedthat ventricular volumes are equally influenced by genetics (58%)and environment (42%). Gyral and sulcal patterns were shown to bewidely variable in MZ twins (Weinberger et al., 1992; Bartley et al.,1997), suggesting strong environmental influences independent ofgenetics (Steinmetz et al., 1994).
Computational mapping methods allow the mapping of geneticinfluences on structure volumes throughout the brain, withoutrequiring a priori specification of regions of interest. Among them,voxel-
^based methods, such as voxel-
^based morphometry (VBM)
(Ashburner and Friston, 2000), have revealed genetically^mediated
deficits in attention deficit hyperactivity disorder (Van'^t Ent et al.,
2007), anxiety disorders (De Geus et al., 2006) and schizophrenia(Hulshoff Pol et al., 2006b). Tensor-
^Based Morphometry (TBM) is
another voxel-^based method that has been used successfully to
detect morphometric differences associated with aging and
^Alzheimer's disease (Hua et al., 2008a, 2008b), HIV/AIDS (Brunet al., 2007; Chiang et al., 2006; Leporé et al., 2008a), Williamssyndrome (Chiang et al., 2007), Fragile X syndrome (Lee et al.,2007), schizophrenia (Gogtay et al., 2008), and normal braindevelopment (Hua et al., 2007).
As TBM has been extensively used in past studies, we chose thismethod to analyze our data set of 23 pairs of MZ and 23 pairs ofsame-
^sex DZ twins. TBM combines a warping step and a statistical
step to determine local volume changes. Here, we detected localsimilarities between MZ twins, and DZ twins, and compared thesetwo groups, to determine the genetic and environmental effects onbrain structures. We first hypothesized that brain structurevolumes would be more genetically influenced when the data isnot adjusted for the overall brain size. We also predicted that thevolumes of brain regions that mature the earliest in infancy (e.g.,occipital lobes) would be the most highly heritable, whileenvironmental effects would be more readily detected in structuresthat have a more protracted maturational
^time-course, such as the
frontal lobes.
Please cite this article as: Brun, C., et al., Mapping the Regional InfluMorphometry Study, NeuroImage (2009), doi:10.1016/j.neuroimage.200
TEDPR
OOF
1Methods
1Overview
1In TBM, a population of images is linearly aligned to a common1space, then nonrigidly registered (i.e., warped) to a common target1brain, chosen either as one of the subjects in the study or as a specially1constructed template with the mean geometry for the group of1subjects being studied. The local expansion or compression factor1applied during the warping process (also called the Jacobian1determinant) is a useful index of volumetric differences between1each subject and the template. Morphometric differences are assessed1by performing a statistical analysis of the volumetric differences at1each location in the brain. Here, we performed the registration using a1fluid registration algorithm first proposed in Brun et al. (2007) and1further developed in Brun et al. (2008). Formore precise quantification1of volumes,weused amulti-
^template schemedescribed in Leporé et al.
1(2008c) rather than using one single target brain image.We previously1studied whether TBM results depend on the choice of template for1normalization (Leporé et al., 2007, 2008c, 2008d). In general, we found1that the findings regarding genetic influences are highly consistent,1regardless of which template is used for spatial normalization. This is1encouraging, because the power to resolve morphometric variation in1TBM depends on the ability to align each image accurately to the1chosen template. In addition, we also found that it makes very little1difference to the results, if the warping is performed on images that1have already been segmented into gray andwhitematter before spatial1normalization (Chou et al., 2008). In
^Leporé et al.
^(2007), we built a
1mean brain template based on averaging a set of deformation fields,1such that the mean deformation tensor of the mappings from each1individual to the template was minimized in a log-
^Euclidean metric
1that measured deviations from the identity tensor. This involved1iterative perturbation of the template until the criterion for the mean1deformation was optimized. Even though the results with this tem-1plate were very similar to those achieved with an individual brain as1the target, it can be used to rule out a possible source of bias that may1arise due to template selection. In complementary work, we also1investigated whether multi-
^template normalization can provide
1greater power for TBM studies (Leporé et al., 2008d). In that approach,1instead of aligning images to a single brain, we aligned all images to a1set of different templates, and the results were averaged (Chou et al.,12008, 2009a, 2009b); this approach was originally termed targetless1spatial normalization (Kochunov et al., 2002) and is related to multi-1
^atlas segmentation methods (Heckemann et al., 2006). This multi-
1^template method can increase the statistical power to detect disease
1effects and also leads tomore accurate segmentations, as it reduces the1overall impact of errors in individual registrations by fusing informa-1tion from a large number of registrations among different pairs of1brains in the study. We assessed anatomical resemblance within twin1pairs by computing intraclass correlation coefficient (ICC) maps for1the MZ and DZ twins. Falconer'
^s heritability statistics (Falconer, 1989),
1which estimate the proportion of variance due to genetic differences,1were computed at each voxel and displayed as a map (as in Thompson1et al. (2001)). Using a more advanced modeling approach developed1in Chiang et al. (2008
^), Lee et al. (2009), and based on Neale et al.
1(1999), we fitted a structural equation model (SEM) to estimate the1proportion of local volumetric variability attributable to genetics,1shared and unique environmental factors across the whole brain both1before and after adjusting the data for individual differences in overall1brain scale. The same technique was applied for various lobar and1subcortical regions of interest (ROIs) traced on the brain template.
1Participants
1We scanned 23 pairs of monozygotic (MZ) (11 male and 12 female2pairs) and 23 pairs of same-
^sex dizygotic (DZ) twins (10 male and 13
ence of Genetics on Brain Structure Variability — A Tensor-Based9.05.022

201
202
203
204
205
206
207
208
209
210
211
212
213
214
215
216
217
218
219
220
221
222
223
224
225
226
227
228
229
230
231
232
233
234
235
236
237
238
239
240
241
242
243
244
245
246
247
248
249
250
251
252
253
254
255
256
257
258
259
260
261
262
263
264
265
266
267
268
269
270
271
272
273
274
275
276
277
278
279
280
281
282
283
284
285
286
287
288
289
290
291
292
293
294
295
296
297
298
299
300
301
302
303
304
305
306
307
308
309
310
311
312
313
314
315
316
317
318
319
320
321
322
323
324
325
326
3C. Brun et al. / NeuroImage xxx (2009) xxx–xxx
ARTICLE IN PRESS
UNCO
RREC
female pairs), recruited as part of a 5-^year research project that will
eventually evaluate 1150 twins. As explained below, to eliminate biasand improve registration accuracy, we used a multi-
^template
approach in which we aligned all the scans to a set of 5 target brainsrandomly selected from our database (Leporé et al.,
^2008d
^). These
scans were performed with the same protocol on 5 healthy subjectsnot part of the genetic analysis (one of themwas a monozygotic twin,2 of them were members of two different dizygotic twin pairs, and 2did not have twin siblings). These scanswere used as templates for thefluid registration step (see Image acquisition and preprocessing
^), and
all the other images were fluidly registered to each of them. The agerange for the subjects was 22–
^25^years old for all the subjects,
including the templates (mean age: 23.8±1.8 SD years). Each subjectwas informed of the goals of the study and signed a formal consent.The study was approved by the appropriate Institutional Review andResearch Ethics Boards.
Zygosity was established objectively by typing nine independentDNA microsatellite polymorphisms (Polymorphism InformationContentN0.7), using standard polymerase chain reaction (PCR)methods and genotyping. These results were cross-
^checked with
blood group (ABO, MNS and Rh), and phenotypic data (hair, skin andeye color), giving an overall probability of correct zygosity assign-ment of greater than 99.99%. All subjects underwent physical andpsychological screening to exclude cases of pathology known toaffect brain structure. None of the twin subjects reported a history ofsignificant head injury, a neurological or psychiatric illness, sub-stance abuse or dependence, or had a first-
^degree relative with a
psychiatric disorder.
Image acquisition and preprocessing
All MR images were collected using a^4 T
^Bruker Medspec whole
body scanner (Bruker Medical, Ettingen, Germany) at the Center forMagnetic Resonance (University of Queensland, Australia). Three-
^dimensional T1-
^weighted images were acquiredwith a magnetization
prepared rapid gradient echo (MP-^RAGE) sequence to resolve anatomy
at high resolution. Acquisition parameters were: inversion time (TI)/repetition time (TR)/echo time (TE)=
^1500/2500/3.83 ms
^; flip
angle=^15°; slice thickness=
^0.9 mm with a 256×256×256 acquisi-
tion matrix.Extracerebral (non-
^brain) tissues were manually deleted from the
MRI images using the 3D interactive program, Display (MontrealNeurological Institute, McGill University, Canada). All scans were thenaligned to the ICBM53 template using 9-
^parameter registration (i.e.,
translational and rotational alignment, allowing scaling in 3 indepen-dent directions) found in the FMRIB'
^s Linear Image Registration
Toolbox, FLIRT (Jenkinson et al., 2002). The ICBM53 template is one ofthe several standardized adult brain templates, and was generated bynonlinearly registering and averaging 53 high-
^resolution brain MRI
scans in the ICBM standard space to improve the signal-^to-
^noise ratio
(Collins et al. (1995); Montreal Neurological Institute, McGillUniversity, Canada).
Fluid registration
Non-^rigid warping is usually performed by registering each
subject'^s image S to a common target image, T. Most commonly,
this target is an image selected from the data set or a speciallyconstructed Mean Deformation Template (MDT), which has theaverage geometry (shape) and intensity for the group of subjectsstudied (Kochunov et al., 2001). Sometimes, a single image is usedrather than group average, because it has sharper features andgreater anatomical detail. The choice of an MDT can affect theprecision of the registration (Kochunov et al., 2001; Leporé et al.,2008b). To avoid any bias in the registration, we did not use onesingle target image. Instead we used the multi-
^template method
Please cite this article as: Brun, C., et al., Mapping the Regional InfluMorphometry Study, NeuroImage (2009), doi:10.1016/j.neuroimage.200
TEDPR
OOF
described in Leporé et al. (2008d), which is a variant of previouslyproposed multi-
^template registration approaches; we registered all
the subjects to four different templates. The use of 4 templates offersa reasonable trade-
^off between using more templates, which can
reduce registration errors but is very time^consuming, and preser-
ving computational efficiency, which requires keeping the number oftemplates reasonably low (see Chou et al. (2008), for an optimiza-tion study).
These 4 templates were fluidly registered to a common 5thtemplate (see Image acquisition and preprocessing
^for a description of
these subjects). These registration vector fields were concatenatedwith the previous registrations, so that all the obtained vector fields (4per subject), sit in a common space.
For each subject, Jacobian matrices J were derived from these 4vector fields (see Measuring volumetric differences
^). As all the
defined mathematical entities (4 vector fields and their 4 correspond-ing Jacobianmatrices per subject) were computed in a common space,we computed Javerage from the 4 Jacobian matrices existing at eachvoxel. We used the mean defined in Arsigny et al. (2006) (this mean isdefined in a Riemannian space).
The first deformable registration methods were inspired bycontinuum mechanics. In these elastic or fluid registrationapproaches, the image is considered to be embedded in a 3Delastic or fluid medium and its deformation at each voxel isgoverned by mechanical equilibrium equations. A similaritymeasure is defined between the deforming image and the targetimage (simple squared-
^intensity difference, cross-
^correlation or
information-^theoretic measures, such as normalized mutual infor-
mation or Jensen–^Rényi divergence (Chiang et al., 2006)) and this
similarity term is included as a force term in a partial differentialequation (PDE), that regularizes the deformation to avoid anyfolds or tears in the image (see Christensen et al. (1996); Bro-
^Nielsen and Gramkow (1996); Gramkow (1996); Leporé et al.(2008b)).
Fluid registration methods have been advocated as theyguarantee diffeomorphisms (i.e., smooth invertible, one-
^to-
^one
mappings) even when the magnitude of the deformations is large(Christensen et al., 1996), whereas elastic registration methods aretypically simpler to implement but only generate diffeomorphicmappings when the deformations are small in magnitude. Ourstudy used a fluid registration algorithm built upon an elasticregistration method that was developed in a Riemannian frame-work by Pennec et al. (2005). This method ensures diffeomorphicmaps when matching anatomy across subjects (for details, see Brunet al. (2007, 2008)).
It is worth noting that the twins'^images are not registered by
aligning one twin'^s image directly to the other twin'
^s image. Instead
they are each individually aligned to a common target image from arandomly selected control subject who is not a member or the twinpair. As such, because the MZ twins vary as much, as a group, as theDZ group (and the general population) what matters most for theregistration is how much they deviate from the target image. As thetarget image was not the other member of a twin pair used in theanalysis, and was an unrelated individual, a
^zygosity×
^registration
error interaction is unlikely. Consequently, statistical measuresassessing resemblance between members of twin pairs can becomputed from registration-
^derived measures without any bias
introduced by the registration.
Statistical analysis
Measuring volumetric differencesFor each registration, there is a corresponding displacement vector
field. At each voxel, each of the registrations (4 per subject) gives a 3-
^component vector (noted ux, uy, uz), that describes the displacementof a particle from the template to the initial image (defined in the
ence of Genetics on Brain Structure Variability — A Tensor-Based9.05.022

C
327
328
329330331
332
333
334335336
337
338
339
340
341
342343344
345
346
347
348
349350351
352
353
354
355
356
357
358
359
360
361
362
363
364
365
366
367
368
369
370
371
372
373
374
375
376
377
378
79
80
81
82
83
84
85
86
87
88
89
90
91
92
93
94
95
96
97
98
99
00
01
02
03
04 Q105
06
070809
10
11
12
13 Q214
15
161718192021222324252627
28
29
30
31
32
33
34
35
36
4 C. Brun et al. / NeuroImage xxx (2009) xxx–xxx
ARTICLE IN PRESS
UNCO
RRE
template coordinate system). From those vectors, a Jacobian matrix iscomputed, defined as
J =
A x − uxð ÞAx
A y − uxð ÞAy
A z − uxð ÞAz
A x − uy
� �Ax
A y − uy
� �Ay
A z − uy
� �Az
A x − uzð ÞAx
A y − uzð ÞAy
A z − uzð ÞAz
0BBBBBBBBB@
1CCCCCCCCCA
Scalar values such as the trace, geodesic anisotropy or the determinantof the matrices may be analyzed (Leporé et al., 2008a). Here, we choseto focus on the analysis of det( J), the expansion factor that detectslocal volume changes; this is the most common form of TBM analysis.det J u→
� �N 1 indicates a local volumetric expansion of the image being
studied in comparison to the template and det J u→� �
b1 indicates a localvolume shrinkage.
Measuring the genetic influence on brain structures
Intraclass correlation and Falconer'^s heritability statistic. To measure
the resemblance between twin pairs, we first computed the intraclasscorrelation coefficient (ICC) for both the MZ and the DZ groups,according to the formula
ICC = σ2b = σ2
b + σ2w
� �: ð1Þ
Here, σb2 is the pooled variance between pairs and σw
2 is the variancewithin pairs (Scout and Fleiss, 1979).
Heritability is the proportion of the variation in a measurementthat is attributable to genetic factors. We first computed Falconer'
^s
heritability statistic, h2, defined as twice the difference in correlationbetween MZ and DZ pairs
h2 = 24 r MZð Þ− r DZð Þð Þ
where r(MZ) and r(DZ) are the ICC measures for the MZ and DZgroups, respectively. This statistic has been debated in the twinliterature as it is based on the equal environments assumption (thatMZ and DZ twins have comparable rearing environments; seeThompson et al. (2002) for a discussion). Even so, it is perhaps themost widely-
^reported index of genetic effects on a trait (e.g., in the
twin studies reviewed by Peper et al., 2007), sowe report it first beforegoing on to a more sophisticated analysis of genetic effects, based onstructural equation models.
We did not want to assume that the data on volumetric differences(here det( J)) were normally distributed, so we computed
^̂p-values at
each voxel with a voxelwise permutation test, to establish a nulldistribution for the ICC statistics at each voxel (Nichols and Holmes,2002). The null hypothesis for the intraclass correlation was ICC=
^0
(no correlation). At each permutation, a given subject'^s scalar map det
(J) was randomly assigned to another subject, and a null distributionwas computed at each voxel; the r-
^values computed from this
randomly-^generated distribution were compared to the r-
^values for
the true assignment to give statistical maps of the significance of theICCs. All voxels from the same subject were permuted in the sameway at each randomization, as is required to maintain spatialcontinuity of the null distribution. The resulting permutation-
^based
(non-^parametric)p-
^value is defined as the quantile of the empirical null
distribution where the real data falls. To control the standard error ofp, we performed 5000 permutations at each voxel (Edgington, 1995).
To control for multiple spatial comparisons implicit in computingmaps of statistics, we computed the omnibus probability, which wecall pcorrected, using the suprathreshold volume, for maps thresholdedat p=
^0.05. This value assesses the overall significance of the
Please cite this article as: Brun, C., et al., Mapping the Regional InfluMorphometry Study, NeuroImage (2009), doi:10.1016/j.neuroimage.200
TEDPR
OOF
3observed pattern of effects in the statistical maps (Nichols and3Holmes, 2002). These values were computed for both MZ and DZ3probability maps.
3Structural equation modeling. Eight regions of interest (ROIs) were3manually traced on the 5th (common) template, using BrainSuite3(Shattuck and Leahy, 2002). These ROIs consisted of the five lobes,3the thalamus, the lateral ventricles and the basal ganglia. For each3individual, the volume of each ROI was computed using the3determinant of the Jacobian matrix, by integrating its value over3the appropriate region in the template (see Measuring volumetric3differences
^). This allows the volume of the ROI in each subject to
3be estimated.3A variance component analysis was performed at each voxel in3addition to the analysis of the lobar ROI volumes by fitting structural3equation models (SEMs) at each voxel in the images. This method3was first implemented and promoted by Neale et al. (1999) with the3genetic modeling program, Mx. Here, we used a more computation-3ally efficient version that we recently implemented (Chiang et al.,32008; Lee et al., 2009), and this permitted a voxelwise analysis. To3analyze genetic and environmental correlations in twins, structural3equation models can compute the relative contributions of additive4genetic (A), shared environmental (C) and random environmental4(E) components to the variance in the observed local and ROI volume,4y. For each twin subject, we can model the value of y as the4combination of 3 latent factors, y=
^aA+cC+eE; by standard analysis
4(Neale et al., 1999), the covariance matrix ∑ for the vector (y1, y2)T,4where 1 or 2 stands for the first or second twin in the same pair, can4be modeled by:
Σ = cov y1; y1ð Þ cov y1; y2ð Þcov y1; y2ð Þ cov y2; y2ð Þ
� �= a2 + c2 + e2 γa2 + c2
γa2 + c2 a2 + c2 + e2
!
ð2Þ
44where cov(u, v) means covariance between u and v. γ=^1 for MZ
4twins, and γ=1/2 for DZ twins, as MZ twins share all and DZ twins4share on average half of their genetic polymorphisms. Since A, C, and4E are unobservable variables, the path coefficients Θ=
^(a, c, e) are
4estimated by comparing the covariance matrix implied by the model,4∑(Θ), with the sample covariance matrix (S) of the observed4variables (y1 and y2), using maximum-
^likelihood fitting (Fornell and
4Larcker, 1981).
FLM;β = log jΣ Θð Þ j + trace Σ−1 Θð ÞS� �
− log jS j − p ð3Þ
44where p=^2 is the number of observed variables. Under the null
4hypothesis that S=^∑(Θ
^), minus twice the logarithm of the like-
4lihood ratio was simplified to TLM,Θ=^(^̂nMZ −̂̂1)FML,Θ,MZ+(
^̂nDZ −̂̂1)
4FML,Θ,DZ, which follows a χ2 distribution with p(p+1)t degrees of4freedom, where t=
^3 is the number of free model parameters, and
4nMZ and nDZ are the number of MZ and DZ twin pairs. Acceptance4of the null hypothesis (pN0.05) indicates a good fit for the model.4The
^maximum-likelihood computation was performed to find the
4model parameters and expected covariance for both MZ and DZ4pairs.4If the variance in the data at each voxel is assumed to be normal,4χ2 values could be used to measure the agreement between the4observed and expected covariance matrices, as χ
^2 is essentially a
4goodness-^of-
^fit index. To free our fitted SEMs from any assumption
4that the data were normally distributed, we used a permutation-4
^based method to determine the
^goodness-
^of-fit (Lee et al., 2009;
4Chiang et al., 2008; Bollen and Stein, 1992). FML,Θ,DZ was minimized4using an optimization method in the original and in the 50004permuted samples in which the twin pair'
^s MZ and DZ labels were
4randomly shuffled. At each permutation, three hypotheses with
ence of Genetics on Brain Structure Variability — A Tensor-Based9.05.022
437
438
439
440
441
442
443
444
445
446
5C. Brun et al. / NeuroImage xxx (2009) xxx–xxx
ARTICLE IN PRESS
different Θ were evaluated, in order to fit the ACE, AE or CE modelsand the p-values pace, pce, and pae were determined separately bycomparing the value of TLM,Θ for the real distribution to the one of thepermuted distribution. For each null hypothesis, the sample data wasrescaled since the permutation distribution of χ
^2 statistics, TLM,Θ can
UNCO
RREC
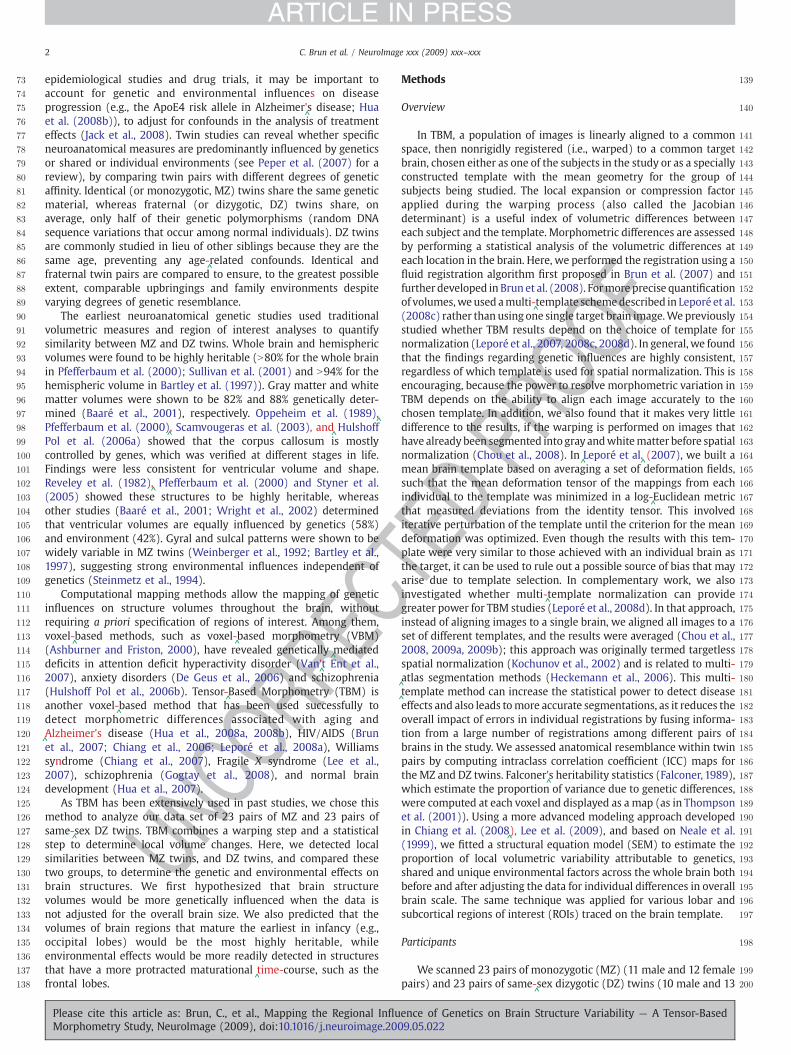
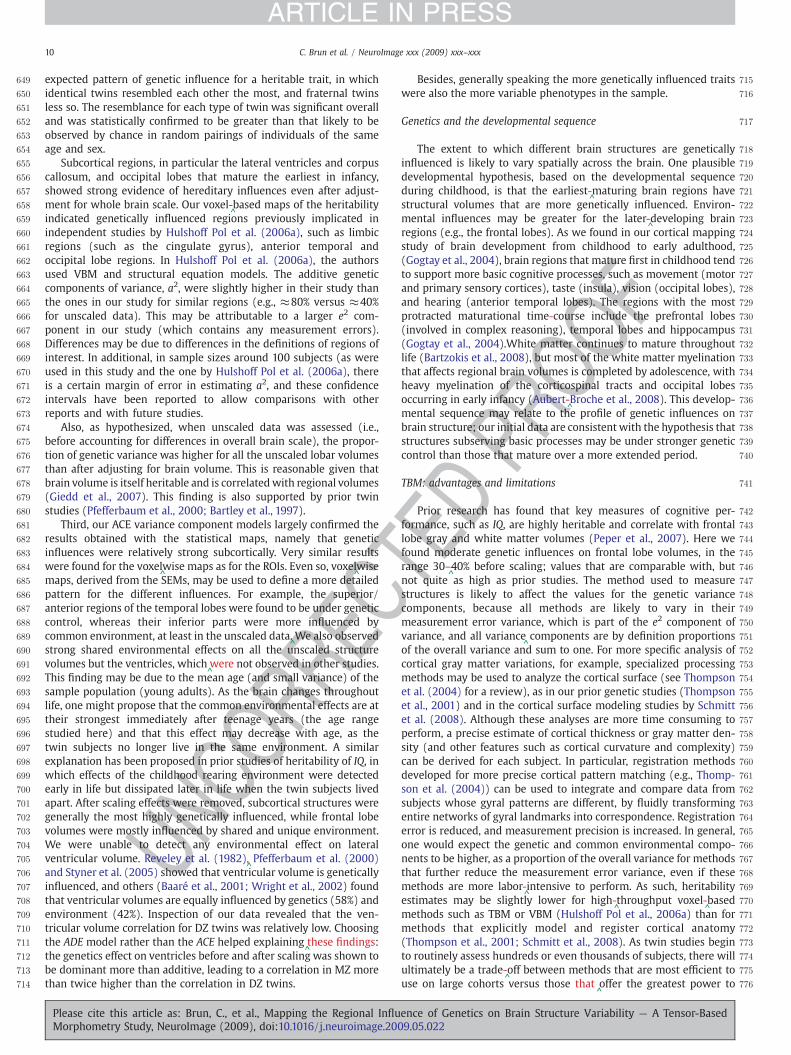
Fig. 1.^̂Top row: Intraclass correlation maps are shown for the monozygotic twins (rMZ; left
(left) shows the sections for which statistics are displayed; maps of Falconer'^s heritability est
^values (significance) of the intraclass correlation in monozygotic twins (
^ICCMZ) and dizygot
Please cite this article as: Brun, C., et al., Mapping the Regional InfluMorphometry Study, NeuroImage (2009), doi:10.1016/j.neuroimage.200
differ from its original distribution. At each voxel and for each region,the three probabilities p-
^values pace, pce and pae were compared and
the A, C and E values resulting from the best model were retained.The best model was defined by the p-
^value that was greater than the
two others and also greater than 0.05 (a p-^valueb0.05 indicates a
TEDPR
OOF
panel) and for the dizygotic twins (rDZ; right panel).^̂Middle row: An anatomical image
imate (h2) show high heritability in subcortical regions.^̂Bottom row: Maps show the p-
ic twins (^ICCDZ).^
ence of Genetics on Brain Structure Variability — A Tensor-Based9.05.022
447
448
449
450
451
452
453
454
455
456
457
458
459
460
461
462
463
464
465
466
467
68
69
70
71
72
73
74
75
76
77
78
79
80
81
82
83
84
85
6 C. Brun et al. / NeuroImage xxx (2009) xxx–xxx
ARTICLE IN PRESS
lack of fit to the data and rejection of the model —^note that this is
analogous to the convention in standard multivariate regression,where a p-
^valueb0.05 denotes rejection of the null hypothesis, but in
our case the genetic model, consisting of the ACE factors, is rejectedwhen pb0.05. The model is therefore considered to fit when p-
^valueN0.05. Even so, the significance of a specific term in a model(such as the A term) can be assessed by comparing the χ
^2 goodness-
^of-
^fit values of the two competing models also has a χ
^2 distribution,
and its significance can be reported in the conventional way, withpb0.05 denoting that the added term provides a better overall fitto the data).
A similar path analysis and structural equation model can be usedto estimate the A, D and E parameters (relative contributions ofadditive genetic factors, genetic dominance effects and randomenvironmental components, respectively on the observed volumes).The ADE model differentiates two genetic effects: the sum of all theeffects of individual genetic loci (A) and the result of any interactionsbetween alleles at the same genetic locus (D) (Maes, 2005). Whenthe genetic dominance term fits, the DZ correlation tends to be lessthan half of the MZ correlation (here we take γ=1/4 to fit D andγ=1/2 to fit A).
UNCO
RREC
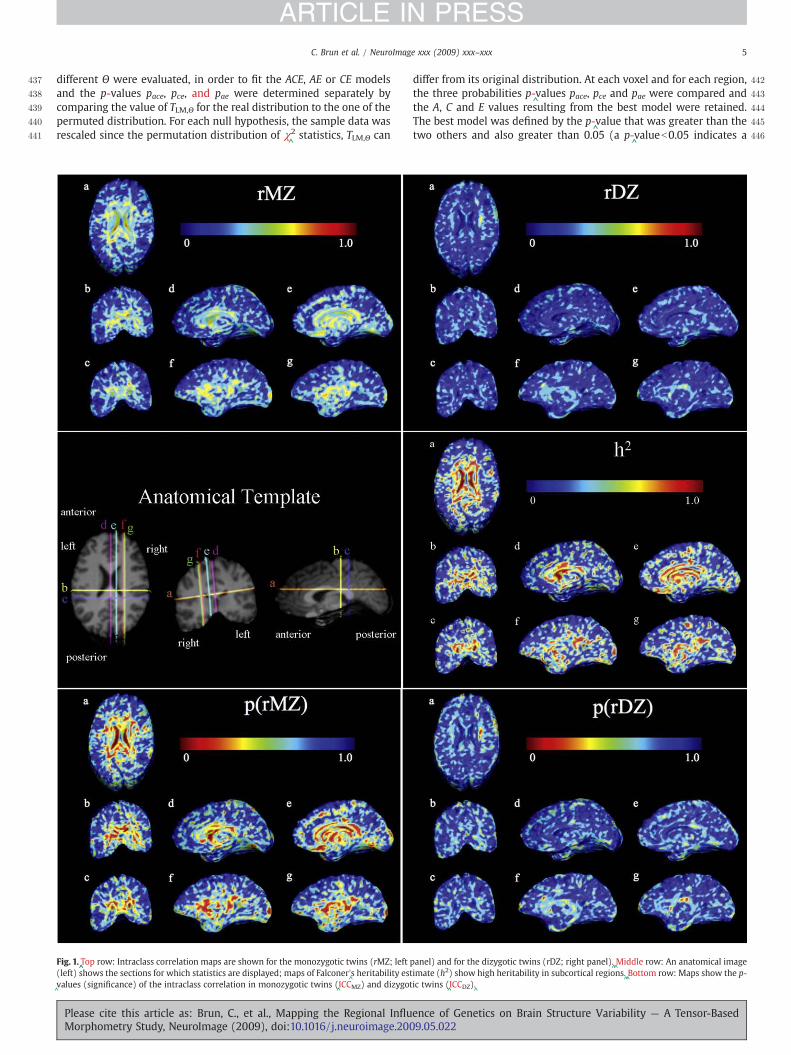
Fig. 2.^Variance component maps for additive genetic (a2 —
^top left), common (c2 —
^top rig
right: Color-^coded maps representing the model choice at each voxel—
^l^ight blue (yellow an
respectively). The corresponding anatomical sections (a–^g) are shown in Fig. 5—
^middle left.
to the web version of this article.)^
Please cite this article as: Brun, C., et al., Mapping the Regional InfluMorphometry Study, NeuroImage (2009), doi:10.1016/j.neuroimage.200
OF
4Estimating phenotypic variance in the population4To examine the variability of the measured phenotypes (Jacobian4determinants, det(J), at each voxel, and ROIs volumes), we4computed the mean and variance of each volumetric across the4sample. To avoid any bias in estimating variance, we chose a group4composed of one subject per pair in the MZ and the DZ groups,4taken randomly.
4Results
4Intraclass correlations and Falconer'^s heritability estimates
4Fig. 1 shows the intraclass correlation computed for local4volumes in both identical and fraternal twins (top left: rMZ and4top right: rDZ). Red colors indicate a high correlation (r close to 1),4whereas blue colors indicate no detectable correlation (r=
^0). The
4significance of the intraclass correlations was assessed by computing4p-
^values corrected for multiple comparisons (bottom left: pICC(MZ),
4pcorrected=^0.034; bottom right: pICC(DZ), pcorrected=^
0.025). A com-4parison of these two intraclass correlations is given by the maps of4Falconer'
^s heritability statistics (h2, middle right panel). Red colors
TEDPR
O
ht), and unique environmental (e2 —^bottom left) factors for the unscaled data. Bottom
d red, respectively) indicates that the best fitting model is obtained with ACE (AE and CE,Q3(For interpretation of the references to colour in this figure legend, the reader is referred
ence of Genetics on Brain Structure Variability — A Tensor-Based9.05.022
486
487
488
489
490
491
492
493
494
495
496
497
498
499
500
501
502
503
504
505
506
507
508
509
510
511
512
513
514
515
516
517
518
519
520
521
7C. Brun et al. / NeuroImage xxx (2009) xxx–xxx
ARTICLE IN PRESS
indicate greater heritability. The left panel in the middle row showsthe common anatomical template and the colored lines indicate thedifferent sections exhibited in the color maps. Three features areevident: first, for most subcortical regions, MZ twin volumes arecorrelated between members of the pair at around r=
^0.5, with
values much closer to zero for DZ twins. Second, a correction formultiple comparisons reveals that the overall pattern of correlationsin the DZ twins is significantly greater than zero; strictly speaking, ahigher proportion of the brain has correlations exceeding thep=
^0.05 threshold than would be expected by chance if the null
hypothesis of no correlation were true. Third, the high values ofheritability (right panel in the middle row), with values over 0.5 forthe majority of the subcortical regions, are based on twice thedifference in the intraclass correlations for the MZ and DZ twins.These give an estimate of the proportion of the variance in thoseregions that is genetically mediated. As is also implied by thestructural equation models below, the heritability maps suggest thatthe anatomy of the MZ twins resembles each other to a greaterdegree than the anatomy of the DZ twins in ventricular, callosal,
UNCO
RREC
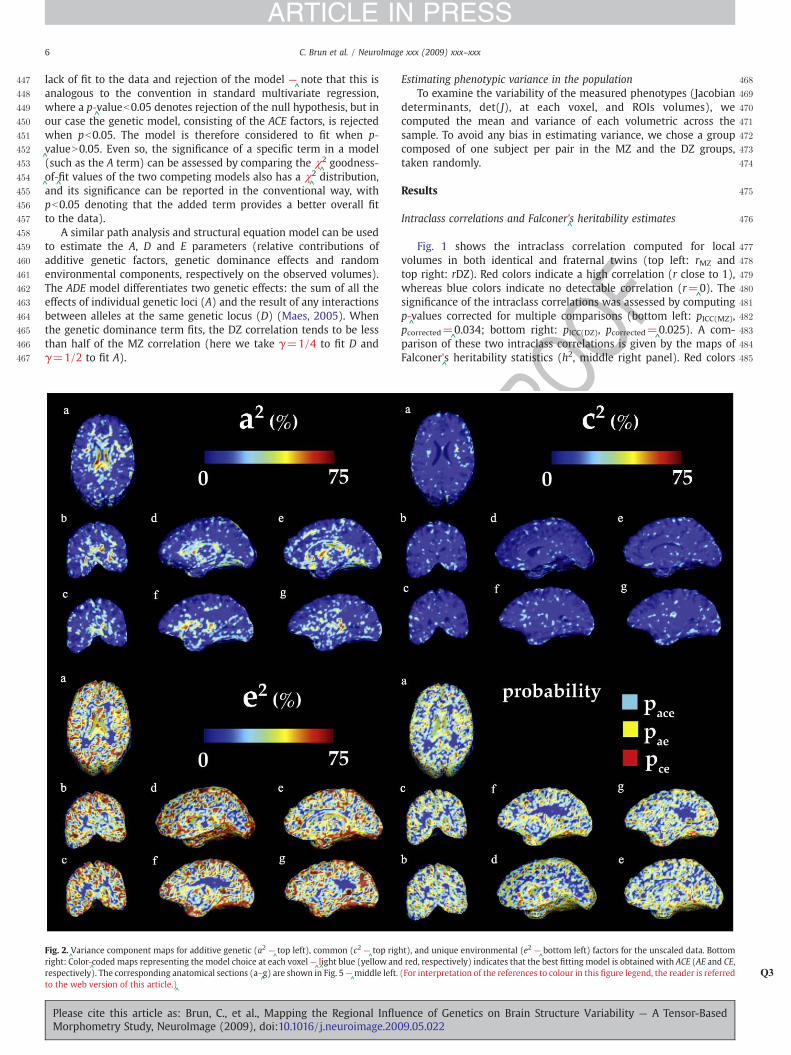
Fig. 3.^Variance component maps for additive genetic (a2 —
^top left), common (c2 —
^top right
Color-^coded maps representing the model choice at each voxel —
^l^ight blue (yellow and red
respectively). The corresponding anatomical sections (a–^g) are shown in Fig. 5—
^middle left.
to the web version of this article.)^
Please cite this article as: Brun, C., et al., Mapping the Regional InfluMorphometry Study, NeuroImage (2009), doi:10.1016/j.neuroimage.200
F
limbic (cingulate gyrus), occipital and anterior temporal regions,while DZ twins resemble each other to a greater degree thanrandomly chosen individuals of the same age and sex.
Genetic and environmental influences on brain structure variability
The influence of additive genetic (A), as well as shared (C) andunique (E) environmental factors on brain structure volumes aremapped in Figs. 2 and 3 for the unscaled and scaled data, res-pectively. The corresponding values are also reported for eight ROIsin Table 1 (unscaled data) and Table 2 (scaled data).
Figs. 2 and 3 display voxelwise maps of the ACE variancecomponents. In each map, the proportion of the overall variance isexpressed on a scale of 0 (dark blue) to 75% (red). The variancecomponents, a2, c2, e2 are proportions, and vary from 0 to 1, but theircontribution to the overall variance is often stated as a percentage). Inthe bottom left panel, color-
^coded maps
^presented
^show the model
that provided the best fit. Light blue corresponds to the ACE model,yellow to the AE model and red to the CE model.
TEDPR
OO
), and unique environmental (e2 —^bottom left) factors for the scaled data. Bottom right:
, respectively) indicates that the best fitting model fit is obtained with ACE (AE and CE,Q4(For interpretation of the references to colour in this figure legend, the reader is referred
ence of Genetics on Brain Structure Variability — A Tensor-Based9.05.022

C522
523
524
525
526
527
528
529
530
531
532
533
534
535
536
537
538
539
540
541
542
543
544
545
546
547
548
549
550
551
52
53
54
55
56
57
58
59
60
61
62
63
64
65
66
67
68
69
70
71
72
73
74
75
76
77
78
79
80
81
t2:1
t2:2t2:3
t2:4
t2:5
t2:6
t2:7
t2:8
t2:9
t2:10
t2:11
t2:12
t2:13
t2:14
t2:15
Table 1t1:1
^Measures of the intraclass correlation coefficients (ICC) for the MZ and DZ groups, Falconer'
^s heritability estimate (h2), the additive genetic (a2), dominant genetic (d2), shared (c2)
and unique environmental (e2) variance components, their confidence interval, the probability p (computed from the structural equation models; these exceed 0.05 when the modelfits) and the model that provided the best fit when explaining variance in the volumes of these brain regions across subjects for the unscaled data.
t1:2t1:3 Regions WB Fr Par Temp Occ Lmbc Vent BG Th
t1:4 ICCMZ 0.87 0.86 0.87 0.88 0.87 0.85 0.71 0.86 0.84t1:5 ICCDZ 0.74 0.74 0.74 0.74 0.75 0.77 0 0.71 0.76t1:6 h2 0.26 0.25 0.27 0.29 0.24 0.17 1.42 0.30 0.17t1:7 a2 (%) 34.82
(0.47^̂̂–65.66)
35.28(0.32–
^̂̂54.18)
33.18(3.07–
^̂̂55.81)
36.58(31.89–
^̂̂96.97)
33.26(30.69–
^̂̂91.19)
27.81(1.85–
^̂̂36.86)
0 (0–^̂̂49.64) 39.58
(0.22–^̂̂42.57)
24.08(0.05–
^̂̂68.59)
t1:8 c2/d2 (%) 55.03(1.52–
^̂̂56.59)
54.44(28.16–
^̂̂73.67)
56.57(0–
^̂̂57.26)
54.98(0.15–
^̂̂55.90)
56.71(4.9–
^̂̂56.93)
62.03(30.17–
^̂̂78.73)
63.51(0.79–
^̂̂63.91)
49.43(17.02–
^̂̂95.13)
63.67(9.43–
^̂̂98.97)
t1:9 e2 (%) 10.14(7.87–
^̂̂53.03)
10.28(7.51–
^̂̂41.24)
10.25(5.65–
^̂̂85.93)
8.44(1.90–
^̂̂38.22)
10.03(3.23–
^̂̂40.38)
10.15(10.13–
^̂̂51.53)
36.49(0.80–
^̂̂63.91)
10.99(0.35–
^̂̂70.10)
12.26(0.26–
^̂̂41.98)
t1:10^Probability 0.74 0.74 0.77 0.58 0.56 0.41 0.09 0.91 0.74
t1:11 Best fitting model ACE ACE ACE ACE ACE ACE ADE ACE ACE
ROIs: WB —^̂Whole brain
^; Fr—
^Frontal lobes
^; Par—
^Parietal lobes
^; Temp —
^Temporal lobes
^; Occ —
^Occipital lobes
^; Lmbc —
^Limbic lobes;
^Vent—
^Ventricles;
^BG —
^Basal Ganglia;
^Th —
^Thalamus.t1:12
8 C. Brun et al. / NeuroImage xxx (2009) xxx–xxx
ARTICLE IN PRESS
RRE
If we assume that all the regions of the brain have a partly sharedgenetic influence related to overall scale of the brain, then afteradjusting for individual differences in brain scale across subjects, alesser residual effect of genetic factors should remain (this is based onthe fact that overall brain volume is heritable). Therefore, wehypothesized that all brain regions would show a higher heritabilityprior to the adjustment and we also expected the proportion ofvariance due to environmental factors to be greater afterwards.
Fig. 3 shows that the influence of genetic factors is detectablethroughout the brain in the unscaled data (top left): from 20% in thewhite matter to 75% in subcortical structures such as the corpuscallosum and the ventricles, 20–
^40% in the basal ganglia and the
thalamus and 50% in the occipital lobes (d). The effects of the sharedenvironment, as shown by the c2 values (Fig. 2, top right panel), aremore prominent than their genetic counterparts in the white matter,such as the internal capsule, the uncinate fasciculus and the superiorlongitudinal fasciculus and mostly located in the frontal lobes. Theunique environment variance (e2) maps demonstrate high variance inthe gray matter. As this term not only accounts for the individualenvironment influence but also measurement errors from all sources,it is not possible to distinguish unique environmental effects fromsources of measurement errors that are uncorrelated between thetwins. These maps should therefore be interpreted cautiously.
As hypothesized, the scaled maps showed less genetic effectsthroughout the brain (see Fig. 3 —
^top right).While scaling the data
depleted the effects of the common environment on brain structure(only the white matter partly exhibits c2 values equal to 20–
^30%),
the genetics influence is still very strong in the limbic lobe, and thesubcorticular structures, in particular in the ventricles (60%). Effectsare also noticeable in the occipital lobes (20–
^30% –
^top left –
^d). The
UNCOTable 2
^Measures of the intraclass correlation coefficients (ICC) for the MZ and DZ groups, Falconer'
^s
and unique environmental (e2) variance components, their confidence interval, the probabilifits) and the model that provided the best fit when explaining variance in the volumes of t
Regions WB Fr Par Temp
ICCMZ 0.21 0.38 0.09 0.12ICCDZ 0.33 0.46 0.26 0.21h2 0 0 0 0a2 (%) 0 0 –
^14.91
(0–^̂̂25.23) (0–
^̂̂34.76) –
^(0–
^̂̂38.41)
c2/d2 (%) 27.13 42.29 –^
0(3.27–
^̂̂61.47) (0–
^̂̂45.53) –
^0
e2 (%) 73.87 57.05 –^
85.08(24.43–
^̂̂89.48) (19.70–
^̂̂83.03) –
^(61.58–
^̂̂100)
^Probability 0.26 0.54 –
^0.55
Best fitting model ACE ACE^No fit AE
ROIs: WB—^̂Whole brain;
^Fr—
^Frontal lobes;
^Par—
^Parietal lobes;
^Temp —
^Temporal lobes;
^O
Thalamus.
Please cite this article as: Brun, C., et al., Mapping the Regional InfluMorphometry Study, NeuroImage (2009), doi:10.1016/j.neuroimage.200
TEDPR
OOF 5comparison of the top right panels in Figs. 2 and 3 shows that
5overall, genetic influences (a2) are relatively high in the subcortical5areas, as well as in the occipital areas, which are the earliest to5mature in infancy.5To summarize the effect of the three factors on global structure5volumes, ICC, h2 and proportion of variance factors were computed for5the five lobes, the ventricles, the thalamus, basal ganglia and the5whole brain (Tables 1 and 2). In the unscaled data, the proportion of5genetic, shared and unique environmental variance was approxi-5mately the same for all the lobes (see Table 1), with around 30–
^40% of
5the variance being attributable to genetic differences in the cohort.5The shared environment also accounted for around half of the5variance in these volumes, with the rest of the differences being5attributable either to unique environment or measurement errors.5Volumes for the basal ganglia and the thalamus were shown to be5influenced by genetic factors (A), as well as shared (C) and unique (E)5environmental factors (a2=
^40%, and c2=
^50%, for the basal ganglia—
^5a2=
^25% and c2=
^63% for the thalamus). Between 60% and 70% of the
5variance in ventricular volumes was attributable to dominant genetic5factors (the ADE model resulted in a better fit than the ACE model,5whichmay be related to the undetectable DZ correlation (ICC=
^0) and
5to the increased difference between MZ and DZ correlations (N1/2).5This value was still high (50% to 70%) in the scaled data (Table 2),5where the ADE model was also proved to be the best fit. The strong5influence of genetics was also seen in the thalamus and basal ganglia5(where a2=
^58% and d2=
^57%, respectively). Even so, the genetics
5influence on the whole brain volume was considerably smaller after5scaling, whereas the effect of the common environment decreased5from 10%. This trend was found for all lobar structures except for the5occipital lobes (ascaled2 =
^47%) and the temporal lobes (ascaled2 =
^15%).
heritability estimate (h2), the additive genetic (a2), dominant genetic (d2), shared (c2)ty p (computed from the structural equation models; these exceed 0.05 when the modelhese brain regions across subjects for the scaled data.
Occ Lmbc Vent BG Th
0.55 0.57 0.59 0.49 0.610.26 0.12 0 0.35 00.58 0.91 1.17 0.27 1.2146.84 17.27 0 56.97 0(1.46–
^̂̂65.11) (0.02–
^̂̂79.76) (0–
^̂̂34.92) (0–
^̂̂99.93) (0–
^̂̂68.10)
7.01 34.54 53.12 0 58.32(5.72–
^̂̂54.36) (0.01–
^̂̂41.67) (9.40–
^̂̂53.62) 0 (1.66–
^̂̂58.67)
46.13 48.18 46.88 43.03 41.68(28.53–
^̂̂72.13) (28.75–
^̂̂73.95) (26.14–
^̂̂73.95) (0–
^̂̂99.99) (0–
^̂̂79.60)
0.38 0.06 0.23 0.61 0.25ADE ADE ADE AE ADE
cc —^Occipital lobes;
^Lmbc —
^Limbic lobes;
^Vent—
^Ventricles;
^BG —
^Basal Ganglia;
^Th —
^
ence of Genetics on Brain Structure Variability — A Tensor-Based9.05.022

OOF
582
583
584
585
586
587
588
589
590
591
592
593
594
595
596
597
598
599
600
601
602
603
604Q5605
606
607
608
609
610
611
612
613
614
615
616
617
618
619
620
621
622
623
624
625
626
627
628
629
630
631
632
633
634
635
636
637
638
639
640
641
642
643
644
645
646
647
648
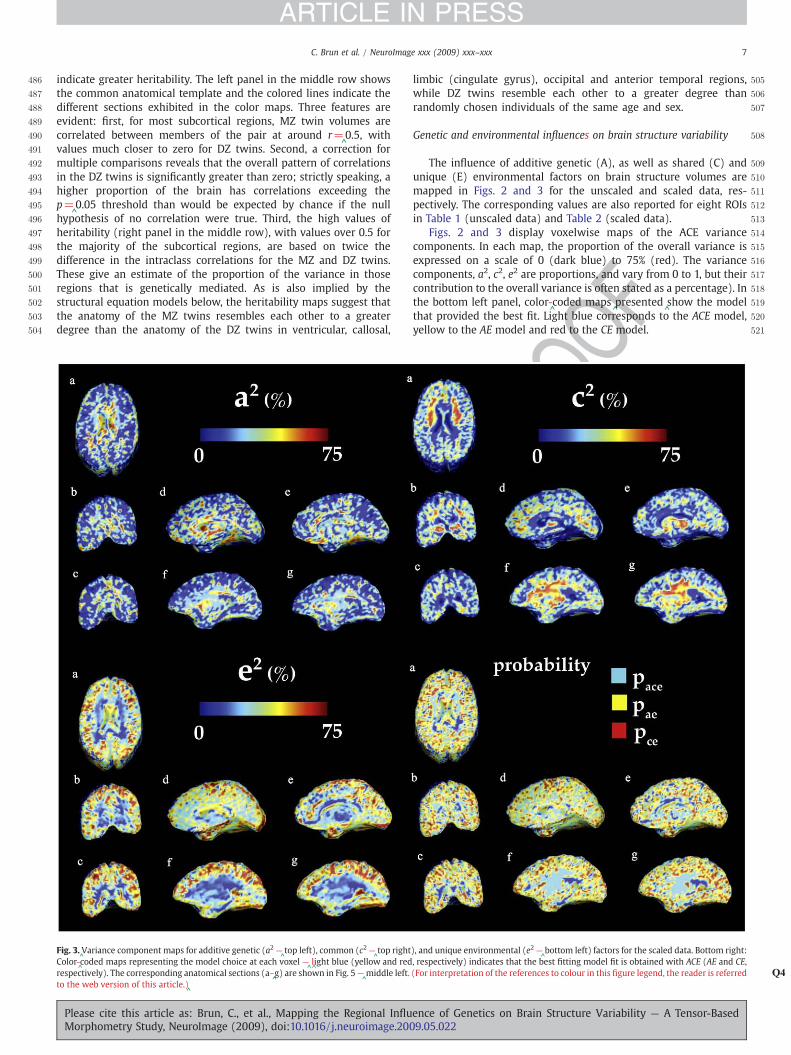
Fig. 4.^Variance of the Jacobian across the population for the unscaled (left) and the scaled data (right) displayed as the percentage of the mean at each voxel. Here, blue indicates a
small variance in the trait (0%), whereas red indicates a higher variance (5%). It is worth noting that values in the unscaled white matter are higher than values in the scaled whitematter except for the subcortical regions (1% versus 0.3%). (For interpretation of the references to colour in this figure legend, the reader is referred to the web version of this article.)
^
Table 3 t3:1
^Standard deviation of the ROI volumes across the population reported as a percentage ofthe mean of the whole region.
t3:2t3:3Regions WB Fr Par Temp Occ Lmbc Vent BG Th
t3:4^Unscaled 8.99 8.94 8.93 8.71 8.81 8.69 17.31 8.93 8.91
t3:5^Scaled 0.41 0.40 0.67 0.71 10.37 17.11 11.84 0.77 11.41
ROIs: WB —^̂Whole brain;
^Fr —
^Frontal lobes;
^Par —
^Parietal lobes; Temp —
^Temporal
lobes;^Occ —
^Occipital lobes;
^Lmbc —
^Limbic lobes;
^Vent —
^Ventricles; BG —
^Basal
Ganglia;^Th —
^Thalamus. t3:6
9C. Brun et al. / NeuroImage xxx (2009) xxx–xxx
ARTICLE IN PRESS
UNCO
RREC
In the scaled and unscaled data, the A, C, E or A, D, E terms fitted inall cases except for the parietal lobes (where the best p-
^value=
^0.01
was found for the ACEmodel in the scaled data, and indicates a lack offit). The full ACEmodel gave the best fit for all the structures except forthe lateral ventricles (where pace=^
0.048 and pade=^0.091) in the
unscaled data. In comparison, the best fit with ACE was found in thescaled whole brain and frontal lobes only (p=
^0.26 and p=
^0.54,
respectively). The ADE model was the best fit for the most geneticallyinfluenced structures, such as the occipital lobes, the ventricles, andthe thalamus, whereas the AE model performed better in the basalganglia (pace=^
0.44, pade=^0.40 and pae=^
0.61) and in the temporallobes (pace=^
0.41, pade=^0.36 and pae=^
0.55).Overall, when the scaling effect was removed, the explanatory
value of the genetic term (A) decreased in all lobar regions. This isin line with expectation, because the variance in substructurevolumes obeys an approximate power law relative to the overallsize of the brain (Thompson et al., 2003); in other words, thelogarithms of the substructure volumes and overall brain volumesare tightly correlated in normal populations. Because of thisdependency, some of the variance in substructure volumes iscorrelated with variations in overall brain volume, which is alsohighly heritable (see Table 1 and Introduction). If some of the samegenes influence substructure volumes as they influence the overallbrain volume (which is likely), then adjusting for overall brainvolume is likely to decrease the remaining genetic proportion ofvariation in substructure volumes; however, if different genesmediate overall brain volume and substructure volumes, adjustingfor overall brain volume may (at least in theory) increase theproportion of the remaining variation in substructure volumes that
^are genetically mediated. In our data, even after adjusting for brainvolume (see Fig. 2), the adjusted occipital, limbic lobar volumeswere still genetically influenced. Temporal lobes volumes were alsocontrolled by genetics before and after adjustment, but to a lesserextent
^, which may be explained by a high c2 value in the inferior
temporal lobes, and a high a2 value in the anterior temporal area,that persisted after scaling (see Fig. 2 –
^top right and left –
^f and g
and Fig. 3 –^t^op left –
^f and g). The environmental (C) component
remained high in frontal regions. This effect was not seen forsubcortical structures, where the genetic term was still dominant inthe lateral ventricles, basal ganglia and thalamus after adjusting forbrain scale.
Please cite this article as: Brun, C., et al., Mapping the Regional InfluMorphometry Study, NeuroImage (2009), doi:10.1016/j.neuroimage.200
TEDPRPhenotypic variability in the population
Fig. 4 shows the voxelwise variance of the phenotype in oursample. Whether the brains are scaled or unscaled, variance remainsrelatively high in the subcorticular regions (around 5%), where thegenetic influence is the highest (see the two previous paragraphs).Second, although not so clearly evident, values measured in the lobarwhite matter (Figs. 4 f and g) show a difference in variance betweenthe unscaled and the scaled data (1% and 0.3%, respectively). Thiseffect is also shown in Table 3, where a similar measurement ispresented for the ROIs. While the variance is higher in the unscaleddata (8% versus 0.6% for the scaled data) for the whole brain volume,frontal, parietal, temporal lobar and basal ganglia volumes, the scalinghas little influence on the other structures that are the most gene-tically determined.
Discussion
Findings
In this study, we combined Tensor-^Based Morphometry, a method
that analyzes morphological brain differences, with models tradi-tionally used in genetic studies, including structural equationmodels, which were computed using a new and efficient method(Chiang et al., 2008; Lee et al., 2009). The study had three mainfindings. First, we computed correlation maps to visualize the level ofanatomical similarity for identical and fraternal twin groups, fromwhich we derived a commonly used measure of heritability. Thisvoxel
^wise method indicated a genetically mediated component of
variance in subcortical regions (≈50%). The maps revealed the
ence of Genetics on Brain Structure Variability — A Tensor-Based9.05.022
C
649
650
651
652
653
654
655
656
657
658
659
660
661
662
663
664
665
666
667
668
669
670
671
672
673
674
675
676
677
678
679
680
681
682
683
684
685
686
687
688
689
690
691
692
693
694
695
696
697
698
699
700
701
702
703
704
705
706
707
708
709
710
711
712
713
714
15
16
17
18
19
20
21
22
23
24
25
26
27
28
29
30
31
32
33
34
35
36
37
38
39
40
41
42
43
44
45
46
47
48
49
50
51
52
53
54
55
56
57
58
59
60
61
62
63
64
65
66
67
68
69
70
71
72
73
74
75
76
10 C. Brun et al. / NeuroImage xxx (2009) xxx–xxx
ARTICLE IN PRESS
UNCO
RRE
expected pattern of genetic influence for a heritable trait, in whichidentical twins resembled each other the most, and fraternal twinsless so. The resemblance for each type of twin was significant overalland was statistically confirmed to be greater than that likely to beobserved by chance in random pairings of individuals of the sameage and sex.
Subcortical regions, in particular the lateral ventricles and corpuscallosum, and occipital lobes that mature the earliest in infancy,showed strong evidence of hereditary influences even after adjust-ment for whole brain scale. Our voxel-
^based maps of the heritability
indicated genetically influenced regions previously implicated inindependent studies by Hulshoff Pol et al. (2006a), such as limbicregions (such as the cingulate gyrus), anterior temporal andoccipital lobe regions. In Hulshoff Pol et al. (2006a), the authorsused VBM and structural equation models. The additive geneticcomponents of variance, a2, were slightly higher in their study thanthe ones in our study for similar regions (e.g., ≈80% versus ≈40%for unscaled data). This may be attributable to a larger e2 com-ponent in our study (which contains any measurement errors).Differences may be due to differences in the definitions of regions ofinterest. In additional, in sample sizes around 100 subjects (as wereused in this study and the one by Hulshoff Pol et al. (2006a), thereis a certain margin of error in estimating a2, and these confidenceintervals have been reported to allow comparisons with otherreports and with future studies.
Also, as hypothesized, when unscaled data was assessed (i.e.,before accounting for differences in overall brain scale), the propor-tion of genetic variance was higher for all the unscaled lobar volumesthan after adjusting for brain volume. This is reasonable given thatbrain volume is itself heritable and is correlatedwith regional volumes(Giedd et al., 2007). This finding is also supported by prior twinstudies (Pfefferbaum et al., 2000; Bartley et al., 1997).
Third, our ACE variance component models largely confirmed theresults obtained with the statistical maps, namely that geneticinfluences were relatively strong subcortically. Very similar resultswere found for the voxel
^wise maps as for the ROIs. Even so, voxel
^wise
maps, derived from the SEMs, may be used to define a more detailedpattern for the different influences. For example, the superior/anterior regions of the temporal lobes were found to be under geneticcontrol, whereas their inferior parts were more influenced bycommon environment, at least in the unscaled data.
^We also observed
strong shared environmental effects on all the unscaled structurevolumes but the ventricles, which
^were not observed in other studies.
This finding may be due to the mean age (and small variance) of thesample population (young adults). As the brain changes throughoutlife, one might propose that the common environmental effects are attheir strongest immediately after teenage years (the age rangestudied here) and that this effect may decrease with age, as thetwin subjects no longer live in the same environment. A similarexplanation has been proposed in prior studies of heritability of IQ, inwhich effects of the childhood rearing environment were detectedearly in life but dissipated later in life when the twin subjects livedapart. After scaling effects were removed, subcortical structures weregenerally the most highly genetically influenced, while frontal lobevolumes were mostly influenced by shared and unique environment.We were unable to detect any environmental effect on lateralventricular volume. Reveley et al. (1982),
^Pfefferbaum et al. (2000)
and Styner et al. (2005) showed that ventricular volume is geneticallyinfluenced, and others (Baaré et al., 2001; Wright et al., 2002) foundthat ventricular volumes are equally influenced by genetics (58%) andenvironment (42%). Inspection of our data revealed that the ven-tricular volume correlation for DZ twins was relatively low. Choosingthe ADE model rather than the ACE helped explaining
^these findings:
the genetics effect on ventricles before and after scaling was shown tobe dominant more than additive, leading to a correlation in MZ morethan twice higher than the correlation in DZ twins.
Please cite this article as: Brun, C., et al., Mapping the Regional InfluMorphometry Study, NeuroImage (2009), doi:10.1016/j.neuroimage.200
TEDPR
OOF
7Besides, generally speaking the more genetically influenced traits7were also the more variable phenotypes in the sample.
7Genetics and the developmental sequence
7The extent to which different brain structures are genetically7influenced is likely to vary spatially across the brain. One plausible7developmental hypothesis, based on the developmental sequence7during childhood, is that the earliest-
^maturing brain regions have
7structural volumes that are more genetically influenced. Environ-7mental influences may be greater for the later-
^developing brain
7regions (e.g., the frontal lobes). As we found in our cortical mapping7study of brain development from childhood to early adulthood,7(Gogtay et al., 2004), brain regions that mature first in childhood tend7to support more basic cognitive processes, such as movement (motor7and primary sensory cortices), taste (insula), vision (occipital lobes),7and hearing (anterior temporal lobes). The regions with the most7protracted maturational time-course include the prefrontal lobes7(involved in complex reasoning), temporal lobes and hippocampus7(Gogtay et al., 2004).White matter continues to mature throughout7life (Bartzokis et al., 2008), but most of the white matter myelination7that affects regional brain volumes is completed by adolescence, with7heavy myelination of the corticospinal tracts and occipital lobes7occurring in early infancy (Aubert-
^Broche et al., 2008). This develop-
7mental sequence may relate to the profile of genetic influences on7brain structure; our initial data are consistent with the hypothesis that7structures subserving basic processes may be under stronger genetic7control than those that mature over a more extended period.
7TBM: advantages and limitations
7Prior research has found that key measures of cognitive per-7formance, such as IQ, are highly heritable and correlate with frontal7lobe gray and white matter volumes (Peper et al., 2007). Here we7found moderate genetic influences on frontal lobe volumes, in the7range 30–
^40% before scaling; values that are comparable with, but
7not quite as high as prior studies. The method used to measure7structures is likely to affect the values for the genetic variance7components, because all methods are likely to vary in their7measurement error variance, which is part of the e2 component of7variance, and all variance
^components are by definition proportions
7of the overall variance and sum to one. For more specific analysis of7cortical gray matter variations, for example, specialized processing7methods may be used to analyze the cortical surface (see Thompson7et al. (2004) for a review), as in our prior genetic studies (Thompson7et al., 2001) and in the cortical surface modeling studies by Schmitt7et al. (2008). Although these analyses are more time consuming to7perform, a precise estimate of cortical thickness or gray matter den-7sity (and other features such as cortical curvature and complexity)7can be derived for each subject. In particular, registration methods7developed for more precise cortical pattern matching (e.g., Thomp-7son et al. (2004)) can be used to integrate and compare data from7subjects whose gyral patterns are different, by fluidly transforming7entire networks of gyral landmarks into correspondence. Registration7error is reduced, and measurement precision is increased. In general,7one would expect the genetic and common environmental compo-7nents to be higher, as a proportion of the overall variance for methods7that further reduce the measurement error variance, even if these7methods are more labor-
^intensive to perform. As such, heritability
7estimates may be slightly lower for high-^throughput voxel-
^based
7methods such as TBM or VBM (Hulshoff Pol et al., 2006a) than for7methods that explicitly model and register cortical anatomy7(Thompson et al., 2001; Schmitt et al., 2008). As twin studies begin7to routinely assess hundreds or even thousands of subjects, there will7ultimately be a trade-
^off between methods that are most efficient to
7use on large cohorts versus those that^offer the greatest power to
ence of Genetics on Brain Structure Variability — A Tensor-Based9.05.022

777
778
779
780
781
782
783
784
785
786
787
788
789
790
791
792
793
794
795
796
797
798
799
800
801
802
803
804
805
806
807
808
809
810
811
812
813
814Q6815
816
817
818
819
820
821
822
823
824
825
826
827
828
829
830
831
832
833
834
835
836
837
838
839
840
841
842
843
844
845
846
847
848849850851852853854855856857858859860861862863864 Q7865866867868869870871872873874875876877878879880881882883884885886887888889890891892893894895896897898899900901902903904905906907908909910911912913914915916917918919 Q8920921922923
11C. Brun et al. / NeuroImage xxx (2009) xxx–xxx
ARTICLE IN PRESS
UNCO
RREC
detect gene effects per subject analyzed, given the resources avail-able. A related problem pertains to the subcortical structures asregistration accuracy could potentially be influenced by the degree ofspatial regularization involved in the warping approach. A highlyregularized method, in which the deformation fields are extremelysmooth, may increase the genetic proportion of variance (a2) locallyif a2 was high for global measures. This issue can be further inves-tigated in future by studying how the genetic effects on brainstructures depend on the smoothness and accuracy of the registra-tion vector fields. In the future, we plan to further examine geneticinfluences on cortical gray matter differences using surface-
^based
cortical thickness maps (Thompson et al.,^2004), which will take
advantage of the cortical features and explicit surface models to allowhigher order spatial normalization and matching of cortical anatomy.
A second more conceptual issue relates to the disentanglement ofgenetic effects on overall brain volume from regional heritabilityestimates. In imaging studies designed to identify genes that regulateoverall brain volume, there may be no need to adjust the heritabilitymaps for global volume effects, as potentially important geneticeffects would be discounted. In the future, however, there will be agrowing interest in genes that regulate specific functional systems andnot others, or distributed cortical networks that operate as afunctional unit. A first step towards understanding regionally-
^specific
genetic influences has been pioneered by Wright et al. (2002) andSchmitt et al. (2007), who proposed a multivariate spatial decom-position of the genetic variance in a dataset. These methods holdpromise for identifying genetic effects that affect the development ofan entire system, or overlapping sets of genes involved in thematuration of different brain regions. These methods often requirevery large cohorts to rigorously establish these subtle, second-
^order
effects on heritability. These include the examination of differentialheritability between different measures or different regions and thedetection of common versus specific genetic influences on differentmeasures, which will be a key target of future studies.
Third, there may be age effects on heritability, which means thatany study of a specific cohort must be interpreted as applying to theage range specifically examined (here, early adulthood). In Lenroot etal. (2007
^), who studied children, the authors argued that there is an
age-^related difference in the heritability of cortical thickness. The
primary sensory and motor^cortices were found to be predominantly
determined by genes in childhood, while^later-developing regions,
such as the dorsolateral prefrontal cortex and the temporal lobes mayexperience greater genetic influence later in life.
Lenroot et al. (2007) suggested that brain regions related to highcognitive functions may have morphometric variance that is moreheritable in adolescence than childhood, as that is when they aremostrapidly developing. Gene–
^environment interaction effects may also
complicate and further enhance this increase in heritability during themost rapid period of development. As such, longitudinal studies willbe needed on large datasets (Wright et al., 2001) to account for ageeffects, or even temporary effects on heritability that may occurduring an active growth spurt and may not persist later when growthrates are lower and population variance is lower (Giedd et al., 2007).
An additional fruitful direction involves the genetics of diffusiontensor imaging (DTI). Hulshoff Pol et al. (2006a) showed that thecross-
^sectional area and fiber integrity (fractional anisotropy) of the
corpus callosum was mostly determined by genes, a finding that hasbeen verified at different ages across the human lifespan. More recentbivariate genetic modeling studies using high-
^angular resolution
diffusion imaging (HARDI) in twins suggest that DTI-^derived mea-
sures of fiber architecture and IQ may be both highly heritable andinfluenced by overlapping sets of genes (Chiang et al., 2008; Lee et al.,2009). Future studies combining DTI, functional, and cognitivemeasurements with neuroanatomy (Glahn et al., 2007b) are neededto better establish links between genetics, functional MRI signals andcognition (see Blokland et al. (2008) and De Zubicaray et al. (2008)).
Please cite this article as: Brun, C., et al., Mapping the Regional InfluMorphometry Study, NeuroImage (2009), doi:10.1016/j.neuroimage.200
TEDPR
OOF
Acknowledgments
This work was generously supported by NIH grant R01HD050735 and the National Health and Medical Research Council,Australia grant 496682.
References
Arsigny, V., Fillard, P., Pennec, X., Ayache, N., 2006. Log-^Euclidean metrics for fast and
simple calculus on diffusion tensors. Mag. Res. Med. 56 (2), 411–421.Ashburner, J., Friston, K.J., 2000. Voxel-
^based m
^orphometry: the methods. NeuroImage
11 (6), 805–821.Aubert-
^Broche, B., Fonov, V., Leppert, I., Pike, G.B., Collins, L.D., 2008. Human brain
myelination from birth to 4.5 years. International conference on Medical ImageComputing and Computer Assisted Intervention (MICCAI), New-
^York, USA,
September 7–^9.
Baaré, W.F., Hulshoff Pol, H.E., Boomsma, D.I., Posthuma, D., de Geus, E.J., Schnack, H.G.,van Haren, N.E., van Oel, C.J., Kahn, R.S., 2001. Quantitative genetic modeling ofvariation in human brain morphology. Cereb. Cortex 11 (9), 816–824.
Bartley, A.J., Jones, D.W., Weinberger, D.R., 1997. Genetic variability of human brain sizeand cortical gyral patterns. Brain 120 (2), 257–269.
Bartzokis, G., Lu, P.H., Tingus, K., Mendez, M.F., Huang, D., Thompson, P.M., Mintz,J., 2008. Lifespan trajectories of myelin integrity and tapping speed in healthymales: implications for aging and degenerative brain diseases. Neurobiol.Aging.
Blokland, G.A., McMahon, K.L., Hoffman, J., Zhu, G., Meredith, M., Martin, N.G.,Thompson, P.M., de Zubicaray, G.I., Wright, M.J., 2008. Quantifying the heritabilityof task-
^related brain activation and performance during the N-
^back working
memory task: a twin fMRI study. Biol. Psychol. 79 (1), 70–79.Bollen, K.A., Stein, R.A., 1992. Bootstrapping goodness-
^of-
^fit measures in structural
equation models. Sociol. Methods Res. 21 (2), 205–229.Bro-
^Nielsen, M., Gramkow, C., 1996. Fast fluid registration of medical images.Proceedings of the 4th International
^Conference on Visualization in Biomedical
Computing, Hamburg, Germany, September 22–^25, pp. 272–276.
Brun, C., Leporé, N., Pennec, X., Chou, Y.-^Y., Lopez, O.L., Aizenstein, O.J., Becker, J.T., Toga,
A.W., Thompson, P.M., 2007. Comparison of^standard and Riemannian fluid
registration for tensor-^based morphometry in HIV/AIDS. Workshop on Statistical
Registration: Pair-^wise and Group-
^wise Alignment and Atlas Formation, 10th
International conference on Medical Image Computing and Computer AssistedIntervention (MICCAI), Brisbane, Australia, October 29–
^November 2.
Brun, C., Leporé, N., Pennec, X., Chou, Y.-^Y, Lee, A.D., de Zubicaray, G., McMahon, K.,
Wright, M., Barysheva, M., Toga, A.W., Thompson, P.M., 2008. A new registrationmethod based on log-
^euclidean tensor metrics and its application to genetic
studies. Proceedings of the 5th IEE International Symposium on BiomedicalImaging (ISBI), Paris, France, May 14–
^17.
Cannon, T.D., Thompson, P.M., Van Erp, T.G., Toga, A.W., Poutanen, V.P., Huttunen, M.,Lonnqvist, J., Standerskjold-
^Nordenstam, C.G., Narr, K.L., Khaledy, M., Zoumalan,
C.I., Dail, R., Kaprio, J., 2002. Cortex mapping reveals regionally specific patternsof genetic and disease-
^specific gray-
^matter deficits in twins discordant for
schizophrenia. Proc. Natl. Acad. Sci. 99 (5), 3228–3233.Cannon, T.D., Hennah, W., van Erp, T.G., Thompson, P.M., Lönnqvist, J., Huttunen, M.,
Gasperoni, T., Tuulio-^Henriksson, A., Pirkola, T., Toga, A.W., Kaprio, J., Mazziotta, J.,
Peltonen, L., 2005. Association of DISC1/TRAX haplotypes with schizophrenia,reduced prefrontal gray matter, and impaired short-
^and longterm memory. Arch.
Gen. Psychiatry, 62 (11), 1205–1213.Chiang, M.-
^C., Dutton, R.A., Hayashi, K.M., Toga, A.W., Lopez, O.L., Aizenstein, H.J.,
Becker, J.T., Thompson, P.M., 2006. Fluid registration of medical images usingJensen–
^Rényi divergence reveals 3D-
^profile of brain atrophy in HIV/AIDS.
Proceedings of the 3rd IEEE International Symposium on Biomedical Imaging,Arlington, Virginia, USA, 6–
^9 April.
Chiang, M.-^C., Dutton, R.A., Hayashi, K.M., Toga, A.W., Lopez, O.L., Aizenstein, H.J., Becker,
J.T., Thompson, P.M., 2007. 3D pattern of brain abnormalities in Williams syndromevisualized using tensor-
^based morphometry. Neuroimage 36 (4), 1096–1109.
Chiang, M.-^C., Barysheva, M., Lee, A.D., Madsen, S.K., Klunder, A.D., Toga, A.W.,
McMahon, K.L., de Zubicaray, G.I., Meredith, M., Wright, M.J., Srivastava, A., Balov,N., Thompson, P.M., 2008. Brain fiber architecture, genetics, and intelligence: a HighAngular Resolution Diffusion Imaging (HARDI) s
^tudy. Workshop on Computational
^Diffusion MRI, International
^Conference on Medical Image Computing and
Computer Assisted Intervention (MICCAI), New-^York, USA, September 6.
Chou, Y.-^Y., Leporé, N., de Zubicaray, G.I., Carmichael, O.T., Becker, J.T., Toga, A.W.,
Thompson, P.M., 2008. Automated ventricular mapping with multi-^atlas fluid
image alignment reveals genetic effects in Alzheimer's Disease. Neuroimage 40 (2),615–630.
Chou, Y.-^Y., Leporé, N., Chiang, M.-
^C., Avedissian, C., Barysheva, M., McMahon, K.L.,
de Zubicaray, G.I., Meredith, M., Wright, M.J., Toga, A.W., Thompson, P.M., 2009a.Mapping genetic influences on ventricular structure in twins. NeuroImage 44(4), 1312–1323.
Chou, Y.-^Y., Leporé, N., Brun, C.C., Barysheva, M., McMahon, K., de Zubicaray, G.I., Wright,
M.J., Toga, A.W., Thompson, P.M., 2009b.^Can t
^issue s
^egmentation i
^mprove
r^egistration? A study of 92 t
^wins. Organization for Human Brain Mapping.
Christensen, E.G., Rabbitt, R.D., Miller, M.I., 1996. Deformable templates using largedeformation kinematics. IEEE Trans. Image Process. 5 (10), 1435–1447.
Collins, L., Holmes, C.J., Peters, T.M., Evans, A.C., 1995. Automatic 3D model-^based
neuroanatomical segmentation. Hum. Brain Mapp. 3 (3), 190–208.
ence of Genetics on Brain Structure Variability — A Tensor-Based9.05.022

C
924925926927928929930931932933934935936937938939940941942943944945946947948949Q9950951952953954955956957958959960961962963Q1096496596696796896997097197297397497597697797897998098198298398498598698798898999099199299399499599699799899910001001100210031004100510061007Q1110081009
010011012013014015016017018019020021022023024025026027028029030031032033034035036037038039040041042043044045046047048049050051052053054055056057058059 Q12060061062063064065066 Q13067068069070071072073074 Q14075076077078079080081082083084085086087088089090091092093094095
12 C. Brun et al. / NeuroImage xxx (2009) xxx–xxx
ARTICLE IN PRESS
UNCO
RRE
De Geus, E.J.C., Van't Ent, D., Wolfensberger, S.P.A., Heutink, P., Hoogendijk, W.J.G.,Boomsma, D.I., Veltman, D.J., 2006. Intrapair differences in hippocampal volume inmonozygotic twins discordant for the risk for anxiety and depression. Biol.Psychiatry 61 (9), 1062–1071.
De Zubicaray, G.I., Chiang, M.-^C., McMahon, K.L., Shattuck, D.W., Toga, A.W., Martin, N.G.,
Wright, M.J., Thompson, P.M., 2008. Meeting the challenges of neuroimaginggenetics. Brain Imaging Behav. 2 (4), 258–263.
Edgington, E.S., 1995. Randomization Tests3rd Edition. Marcel Dekker.Falconer, D.S., 1989. Introduction to Quantitative Genetics3rd Ed. Longman, Essex, UK.Fornell, C., Larcker, D.F., 1981. Evaluating structural equation models with unobservable
variables and measurement error. J. Marketing Res. 18 (3), 375–381.Giedd, J.N., Schmitt, J.E., Neale, M.C., 2007. Structural brain magnetic resonance imaging
of pediatric twins. Hum. Brain Mapp. 28 (6), 474–481.Glahn, D.C., Thompson, P.M., Blangero, J., 2007a. Neuroimaging endophenotypes:
strategies for finding genes influencing brain structure and function. Hum. BrainMapp. 28 (6), 488–501.
Glahn, D.C., Paus, T., Thompson, P.M., 2007b. Imaging genomics: m^apping the influence
of genetics on brain structure and function. Hum. Brain Mapp. 28 (6), 461–463.Gogtay, N., Giedd, J.N., Lusk, L., Hayashi, K.M., Greenstein, D., Vaituzis, A.C., Nugent 3rd,
T.F., Herman, D.H., Clasen, L.S., Toga, A.W., Rapoport, J.L., Thompson, P.M., 2004.Dynamic mapping of human cortical development during childhood through earlyadulthood. Proc. Natl. Acad. Sci. 101 (21), 8174–8179.
Gogtay, N.⁎, Lu, A.⁎, Leow, A.D., Klunder, A.D., Lee, A.D., Chavez, A., Greenstein, D., Giedd,J.N., Toga, A.W., Rapoport, J.L., Thompson, P.M., 2008. 3D growth patternabnormalities visualized in childhood-
^onset schizophrenia using tensor-
^based
morphometry. Proc. Natl. Acad. Sci. [⁎ equal contribution].Gramkow, C., Registration of 2D and 3D medical images, Master's thesis, Danish
Technical University, Copenhagen, Denmark (1996)Gray, J.R., Thompson, P.M., 2004. Neurobiology of intelligence: science and ethics. Nat.
Rev. Neurosci. 4 (6), 471–482.Haier, R.J., Jung, R.E., Yeo, R.A., Head, K., Alkire, M.T., 2004. Structural brain variation and
general intelligence. Lancet 23 (1), 425–433.Hattersley, A.T., McCarthy, M.I., 2005. What makes a good genetic association study?
Lancet 366 (9493), 1315–1323.Heckemann, R.A., Hajnal, J.V., Aljabar, P., Rueckert, D., Hammers, A., 2006. Automatic
anatomical brain MRI segmentation combining label propagation and decisionfusion. NeuroImage 33 (1), 115–126.
Hua, X., Leow, A.D., Levitt, J.G., Caplan, R., Thompson, P.M., Toga, A.W., 2007. Detectingbrain growth patterns in normal children using tensor-
^based morphometry. Hum.
Brain Mapp.Hua, X., Leow, A.D., Lee, S., Klunder, A.D., Toga, A.W., Leporé, N., Chou, Y.-
^Y., Chiang,
M.-^C., Barysheva, M., Jack Jr, C.R., Bernstein, M.A., Britson, P.J., Gunter, J.L., Ward,
C.P., Whitwell, J.L., Borowski, B., Fleisher, A.S., Fox, N.C., Boyes, R., Barnes, J.,Harvey, D., Kornak, J., Schuff, N., Boreta, L., Studholme, C., Alexander, G.E.,Weiner, M.W., Thompson, P.M., 2008a. 3D characterization of brain atrophy inAlzheimer's disease and mild cognitive impairment using tensor-
^based
morphometry. NeuroImage 41 (1), 19–34.Hua, X., Leow, A.D., Parikshak, N., Lee, S., Chiang, M.C., Toga, A.W., Jack Jr., C.R., Weiner,
M.W., Thompson, P.M., Alzheimer's Disease Neuroimaging Initiative, 2008b. Tensor-
^based morphometry as a neuroimaging biomarker for Alzheimer's disease: an MRIstudy of 676 AD, MCI, and normal subjects. NeuroImage 43 (3), 458–469.
Hulshoff Pol, H.E., Schnack, H.G., Posthuma, D., Mandl, R.C.W., Baaré, W.F., Van Oel, C.J.,Van Haren, N.E., Collins, D.L., Evans, A.C., Amunts, K., Bürgel, U., Zilles, K., de Geus, E.,Boomsma, D.I., Kahn, R.S., 2006a. Genetic contributions to human brainmorphology and intelligence. J. Neurosci. 26 (40), 10235–10242.
Hulshoff Pol, H.E., Schnack, H.G., Mandl, R.C.W., Brans, R.G., Van Haren, N.E., Baaré, W.F.,Van Oel, C.J., Collins, D.L., Evans, A.C., Kahns, R.S., 2006b. Gray and white matterdensity changes in monozygotic and same-
^sex dizygotic twins discordant for
schizophrenia using voxel-^based morphometry. Neuroimage 31 (2), 482–488.
Jack Jr., C.R., Petersen, R.C., Grundman, M., Jin, S., Gamst, A., Ward, C.P., Sencakova, D.,Doody, R.S., Thal, L.J., Members of the Alzheimer's Disease Cooperative Study(ADCS), 2008. Longitudinal MRI findings from the vitamin E and donepeziltreatment study for MCI. Neurobiol. Aging 29 (9), 1285–1295.
Jenkinson, M., Bannister, P.R., Brady, J.M., Smith, S.M., 2002. Improvised optimization forthe robust and accurate linear registration and motion correction of brain images.Neuroimage 17 (2), 825–841.
Kochunov, P., Lancaster, J.L., Thompson, P.M., Woods, R., Mazziotta, J., Hardies, J., Fox, P.,2001. Regional spatial normalization: toward an optimal target. J. Comput. Assist.Tomogr. 25 (5), 805–816.
Kochunov, P., Lancaster, J.L., Thompson, P.M., Toga, A.W., Brewer, P., Hardies, J., Fox, P.,2002. An optimized individual target brain in the Talairach coordinate system.NeuroImage 17 (2), 922–927.
Lee, A.D., Leow, A.D., Lu, A., Reiss, A.L., Hall, S., Chiang, M.-^C., Toga, A.W., Thompson, P.M.,
2007. 3D pattern of brian abnormalities in fragile X Syndrome visualized usingtensor-
^based morphometry. Neuroimage 34 (3), 924–938.
Lee, A.D., Leporé, N., Brun, C., Barysheva, M., Chou, Y.-^Y., Chiang, M.-
^C., Madsen, S.K.,
McMahon, K.L., de Zubicaray, G.I., Wright, M., Toga, A.W., Thompson, P.M., 2009. Them^ultivariate A/C/E model and the genetics of fiber architecture. Proceedings of the
6th IEEE International Symposium on Biomedical Imaging (ISBI), Boston, MA, USA,June 28–
^July 1rst.
Lenroot, R.K., Schmitt, J.E., Ordaz, S.J., Wallace, G.L., Neale, M.C., Lerch, J.P., Kendler, K.S.,Evans, A.C., Giedd, J.N., Differences in genetic and environmental influences on thehuman cerebral cortex associated with development during childhood andadolescence, Hum Brain Mapp, (2007) (in press).
Leporé, N., Brun, C.C., Pennec, X., Chou, Y.Y., Lopez, O.L., Aizenstein, H.J., Becker, J.T., Toga,A.W., Thompson, P.M., 2007. Mean template for tensor-
^based morphometry using
Please cite this article as: Brun, C., et al., Mapping the Regional InfluMorphometry Study, NeuroImage (2009), doi:10.1016/j.neuroimage.200
TEDPR
OOF
1deformation tensors. Proceedings, 10th International conference on Medical Image1Computing and Computer Assisted Intervention (MICCAI), Brisbane, Australia,1October 29–
^̂November 2 10 (2), 826–833.
1Leporé, N., Brun, C., Chou, Y.-^Y, Chiang, M.-
^C., Dutton, R.A., Hayashi, K.M., Lueders, E.,
1Lopez, O.L., Aizenstein, H.K., Toga, A.W., Becker, J.T., Thompson, P.M., 2008a.1Generalized tensor-
^based morphometry of HIV/AIDS using multivariate statistics
1on deformation tensors. IEEE Trans. Med. Imaging 27 (1), 129–141.1Leporé, N., Chou, Y.-
^Y., Lopez, O.L., Aizenstein, H.J., Becker, J.T., Toga, A.W., Thompson,
1P.M., 2008b. Fast 3D fluid registration of brain magnetic resonance images. SPIE1Medical Imaging conference, San Diego, CA, February 17–
^21.
1Leporé, N., Brun, C., Chou, Y.-^Y., Lee, A.D., Barysheva, M., Pennec, X., McMahon, K.L.,
1Meredith, M., de Zubicaray, G.I., Wright, M., Toga, A.W., Thompson, P.M., 2008c. Best1individual template selection from deformation tensor minimization. Proceedings1of the 5th IEEE International Symposium on Biomedical Imaging (ISBI), Paris,1France, May 14–
^17.
1Leporé, N., Brun, C., Chou, Y.-^Y., Lee, A.D., Barysheva, M., Pennec, X., McMahon, K.L.,
1Meredith, M., de Zubicaray, G.I., Wright, M., Toga, A.W., Thompson, P.M., 2008d.1Multi-a
^̂tlas tensor-
^based morphometry and its application to a genetic study of 92
1twins. Workshop on Mathematical Foundations of Computational Anatomy,1International conference on Medical Image Computing and Computer Assisted1Intervention (MICCAI), New-
^York, USA, September 6.
1Maes, H.H., 2005. ACE Model, Encyclopedia of Statistics in Behavioral Science. John1Wiley & Sons, LTD, Chichester.1Narr, K.L., Szeszko, P.R., Lencz, T., Woods, R.P., Hamilton, L.S., Phillips, O., Robinson,1D., Burdick, K.E., DeRosse, P., Kucherlapati, R., Thompson, P.M., Toga, A.W.,1Malhotra, A.K., Bilder, R.M., DTNBP1 is associated with imaging phenotypes in1schizophrenia, Hum Brain Mapp, under revision (2008)1Neale, M.C., Boker, S.M., Xie, G., Maes, H.H., 1999. Mx: Statistical
^Modeling, 5th Edition.
1Richmond.1Nichols, T.E., Holmes, A.P., 2002. Non parametric permutation tests for functional1neuroimaging: a primer with examples. Hum. Brain Mapp. 15 (1), 1–25.1Oppeheim, J.S., Skerry, J.E., Tramo, M.J., Gazzaniga, M.S., 1989. Magnetic resonance1imaging morphology of the corpus callosum in monozygotic twins. Ann. Neurol. 261(1), 100–104.1Pennec, X., Stefanescu, R., Arsigny, V., Fillard, P., Ayache, N., 2005. Riemannian elasticity:1a
^statistical regularization framework for non-
^linear registration. Medical Image
1Computing and Computer-^Assisted Intervention (MICCAI), Palm Springs, CA, USA,
1pp. 943–950.1Peper, J.S., Brouwer, R.M., Boomsma, D.I., Kahn, R.S., Hulshoff Pol, H.E., 2007. Genetic1influences on human brain structure: a review of brain imaging studies in twins.1Hum Brain Mapp, 28 (6), 464–473.1Pfefferbaum, A., Sullivan, E.V., Swan, G.E., 2000. Brain structure in men remains1highly heritable in the seventh and eighth decades of life. Neurobiol. Aging 211(1), 63–74.1Pietiläinen, O.P.H., Paunio, T., Loukola, A., Tuulio-
^Henriksson, A., Kieseppä, T.,
1Thompson, P.M., Toga, A.W., van Erp, T.G.M., Soronen, P., Hennah, W., Turunen,1J.A., Peltonen, J.O., Palo, O.M., Silander, K., Lönnqvist, J., Kaprio, J., Cannon, T.D.,1Peltonen, L., Association of AKT1 with verbal learning, verbal memory and1regional cortical grey matter density in twins, Am J Med Genet B Neuropsychiatr1Genet, (in press), December (2008).1Posthuma, D., De Geus, E.J., Baaré, W.F., Hulshoff Pol, H.E., Kahn, R.S., Boomsma, D.I.,12002. The association between brain volume and intelligence is of genetic origin.1Nat. Neurosci. 5 (2), 83–84.1Raji, C.A.⁎, Ho, A.J.⁎, Parikshak, N., Becker, J.T., Lopez, O.L., Kuller, L.H., Hua, X., Leow, A.D.,1Toga, A.W., Thompson, P.M., 2009. Tensor based morphometry of body mass index,1insulin, and type II diabetes effects on brain structure in the cardiovascular health1study cognition study. Hum. Brain Mapp. [⁎ equal contribution].1Reiss, A.L., Abrams, M.T., Singer, H.S., Ross, J.L., Denckla, M.B., 1996. Brain development,1gender and IQ in children. A volumetric imaging study. Brain 119 (5), 1763–1774.1Reveley, A.M., Reveley, M.A., Clifford, C.A., Murray, R.M., 1982. Cerebral ventricular size1in twins discordant for schizophrenia. Lancet, 1 (8271), 540–541.1Scamvougeras, A., Kigar, D.L., Jones, D., Weinberger, D.R., Witelson, S.F., 2003. Size of the1human corpus callosum is genetically determined: an MRI study in mono and1dizygotic twins. Neurosci. Lett. 338 (2), 91–94.1Shattuck, D.W., and Leahy, R.M., BrainSuite: an automated cortical surface identification1tool, 6 (2), (2002) 129–
^142
1Schmitt, J.E., Wallace, G.L., Rosenthal, M.A., Molloy, E.A., Ordaz, S., Lenroot, R.K., Clasen,1L.S., Blumenthal, J.D., Kendler, K.S., Neale, M.C., Giedd, J.N., 2007. A multivariate1analysis of neuroanatomic relationships in a genetically informative pediatric1sample. Neuroimage 35 (1), 70–82.1Schmitt, J.E., Lenroot, R.K., Wallace, G.L., Ordaz, S., Taylor, K.N., Kabani, N., Greenstein, D.,1Lerch, J.P., Neale, M.C., Giedd, J.N., 2008. Identification of genetically mediated1cortical networks: a multivariate study of pediatric twins and siblings. Cereb.1Cortex 18 (8), 1737–1747.1Scout, P.E., Fleiss, J.L., 1979. Intraclass correlations: u
^ses in assessing rater reliability.
1Psychol. Bull. 86 (2), 420–428.1Steinmetz, H., Herzog, A., Huang, Y., Hacklander, T., 1994. Discordant brain-
^surface
1anatomy in monozygotic twin. N. Engl. J. Med. 331 (14), 952–953.1Styner, M., Lieberman, J.A., McClure, R.K., Weinberger, D.R., Jones, D.W., Gerig, G., 2005.1Morphometric analysis of lateral ventricles in schizophrenia and healthy controls1regarding genetic and disease-
^specific factors. Proc. Natl. Acad. Sci. USA 102 (13),
14872–4877.1Sullivan, E.V., Pfefferbaum, A., Swan, G.E., Carmelli, D., 2001. Heritability of hippocampal1size in elderly twin men:
^equivalent influence from genes and environment.
1Hippocampus 11 (6), 754–762.1Sullivan, P.F., 2007. Spurious genetic associations. Biol. Psychiatry 61 (10), 1121–1126.
ence of Genetics on Brain Structure Variability — A Tensor-Based9.05.022

1096109710981099110011011102110311041105Q151106110711081109
11101111111211131114111511161117111811191120112111221123
1124
13C. Brun et al. / NeuroImage xxx (2009) xxx–xxx
ARTICLE IN PRESS
Thompson, P.M., Cannon, T.D., Narr, K.L., Van Erp, T., Poutanen, V.P., Huttunen, M.,Lönnqvist, J., Standertskjöld-
^Nordenstam, C.G., Kaprio, J., Khaledy, M., Dail, R.,
Zoumalan, C.I., Toga, A.W., 2001. Genetic influences on brain structure. Nat.Neuroscience 4 (12), 1253–1258.
Thompson, P.M., Cannon, T.D., Toga, A.W., 2002. Mapping genetic influences on humanbrain structure. Ann. Med. 34 (7–
^8), 523–536.
Thompson, P.M., Narr, K.L., Toga, A.W., 2003. Mapping structural alterations ofthe corpus callosum during brain development and degeneration, chapter.In: Zaidel, E., Iacoboni, M. (Eds.), The Parallel Brain:
^The Cognitive
Neuroscience of the Corpus Callosum. MIT press.Thompson, P.M., Hayashi, K.M., Sowell, E.R., Gogtay, N., Giedd, J.N., Rapoport, J.L., de
Zubicaray, G.I., Janke, A.L., Rose, S.E., Semple, J., Doddrell, D.M., Wang, Y., vanErp, T.G., Cannon, T.D., Toga, A.W., 2004. Mapping cortical change in Alzheimer'sdisease, brain development, and schizophrenia. Neuroimage 23 (1), 2–18.
UNCO
RREC
Please cite this article as: Brun, C., et al., Mapping the Regional InfluMorphometry Study, NeuroImage (2009), doi:10.1016/j.neuroimage.200
Van't Ent, D., Lehn, H., Derks, E.M., Hudziak, J.J., Van Strien, N.M., Veltman, D.J.,de Geus, E.J.C., Todd, R.D., Boomsma, D.I., 2007. A structural MRI study inmonozygotic twins concordant or discordant for attention/hyperactivityproblems: evidence for genetic and environmental heterogeneity in thedeveloping brain. Neuroimage 35 (3), 1004–1020.
Weinberger, D.R., Bartley, A.J., Jones, D.W., Zigun, J.R., 1992. Regional variations inhuman monozygotic twins. Soc. Neurosci. Abstr. 18, 595.
Wright, M., de Geus, E., Ando, J., Luciano, M., Posthuma, D., Onon, Y., Hansell, N., VanBaal, C., Hiraishi, K., Hasegawa, T., Smith, G., Geffen, G., Geffen, L., Kanba, S.,Miyake, A., Martin, N., Boomsma, D., 2001. Genetic of cognition: outline of acollaborative twin study. Twin Res. 4 (1), 48–56.
Wright, I.C., Sham, P., Murray, R.M., Weinberger, D.R., Bullmore, E.T., 2002. Geneticcontributions to regional variability in human brain structure: methods andpreliminary results. Neuroimage 17 (1), 256–271.
TEDPR
OOF
ence of Genetics on Brain Structure Variability — A Tensor-Based9.05.022


