Assessing the impacts of climate change on Atbara flows using bias-corrected
GCM scenarios
Assessing the impacts of climate change on Atbara flows using bias-corrected
GCM scenarios
SIGMED and MEDFRIEND International Scientific Workshop
Relations man / environment and sediment transport: a spatial
approach
Algeria 7&8 June 2011Mohamed Elshamy
OutlineOutline
1. Uncertainty Cascade1. Uncertainty Cascade
2. The Nile Basin & Previous CC studies2. The Nile Basin & Previous CC studies
3. Study Area & Methodology3. Study Area & Methodology
4. Results 4. Results
5. Conclusions 5. Conclusions
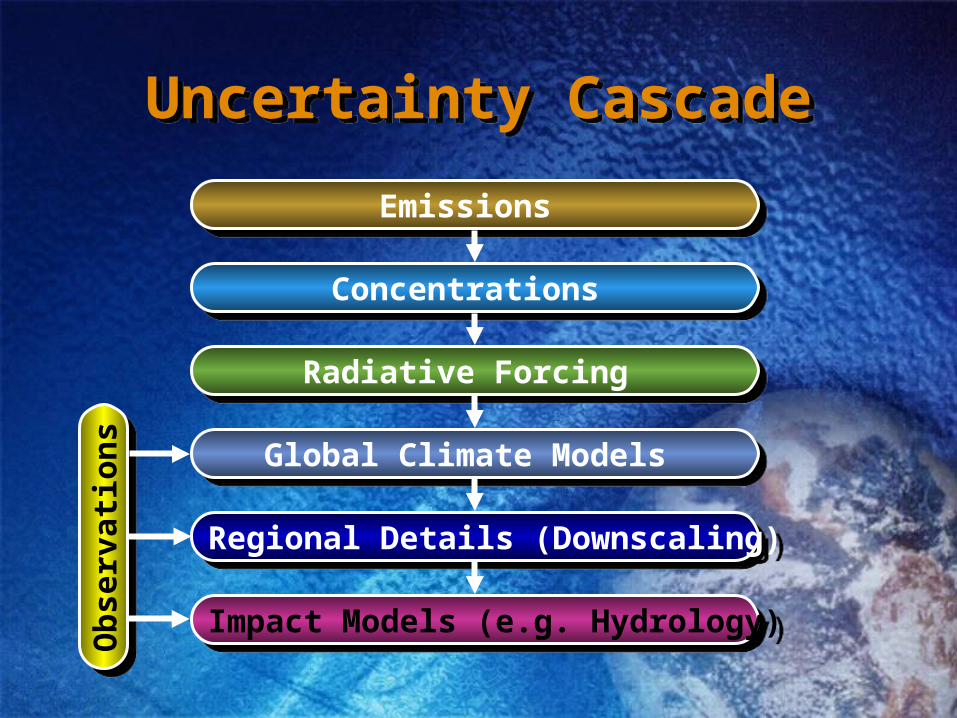
Uncertainty CascadeUncertainty Cascade
Emissions Emissions
Concentrations Concentrations
Radiative Forcing Radiative Forcing
Global Climate Models Global Climate Models
Regional Details (Downscaling) Regional Details (Downscaling)
Impact Models (e.g. Hydrology) Impact Models (e.g. Hydrology)
Ob
serv
atio
ns
Ob
serv
atio
ns

The Nile BasinThe Nile Basin
Large area (2.9 x 10⁶ km2) Low specific discharge Spans several climate
regions Variable topography High runoff variability High Sensitivity to Climate
Mongalla
Jinja
Pakwach
Diem
Roseires
Sennar
Khartoum
Malakal
Atbara
KhashmEl-Girba
Aswan
Dongola
Mogren
Hillet Doleib
Masindi
Cairo
LakeNo
TANZAN IA
BU RU NDI
Gabal Awlia
Paara
-5
0
5
10
15
20
25
30
35
20 25 30 35 40
EGY PT
ETH IOPIA
D.R. CONGO
RWANDA
L IBY A
CENTRAL
AF RICAN
REP.
U GANDA
SU DAN
ERITRIACHAD
K ENY A

Lake Nasser Flood & Drought Control Project (2008)
Previous Studies (1)Previous Studies (1)
– 6 Transient scenarios (3 GCMs x 2 Emission Scenarios)
– Statistically downscaled using a spatio-temporal weather generator
– Changes at Dongola from 2010-2100
0
20
40
60
80
100
120
Base 2010s 2020s 2030s 2040s 2050s 2060s 2070s 2080s 2090s
To
tal A
nn
ua
l Flo
w (
BC
M)
HadCM3 A2 HadCM3 B2
CGCM2 A2 CGCM2 B2ECHAM4 A2 ECHAM4 B2
OBS Base
Elshamy, M.E., Sayed, M.A.-A. and Badwy, B., 2009. Impacts of climate change on Nile flows at Dongola using statistically downscaled GCM scenarios. Nile Water Science & Engineering Magazine 2: 1-14

Previous Studies (2)Previous Studies (2)
Elshamy et al. (2009)– 17 GCMs x A1B
scenario– Statistically
downscaled using Bias Correction Method
– Blue Nile Flow Changes: -60% to +45%
0
2
4
6
8
10
12
14
16
18
20
22
Jan Feb Mar Apr May Jun Jul Aug Sep Oct Nov Dec
Flo
w (
BC
M)
Ensemble Mean 2081-98
Observed 1961-90
Elshamy, M.E., Seierstad, I.A. and Sorteberg, A., 2009. Impacts of climate change on Blue Nile flows using bias-corrected GCM scenarios. Hydrol. Earth Syst. Sci., 13(5): 551-565.

The Atbara BasinThe Atbara Basin
Climate: Semi-Arid/Arid
Area:200 000 km2
Mean Rainfall: 500 mm/yr
Mean PET: 1730 mm/yr
Mean Flow: 8.5 BCM/yr
(1961-1990)
Very Sensitive to Climate

The Atbara BasinThe Atbara Basin
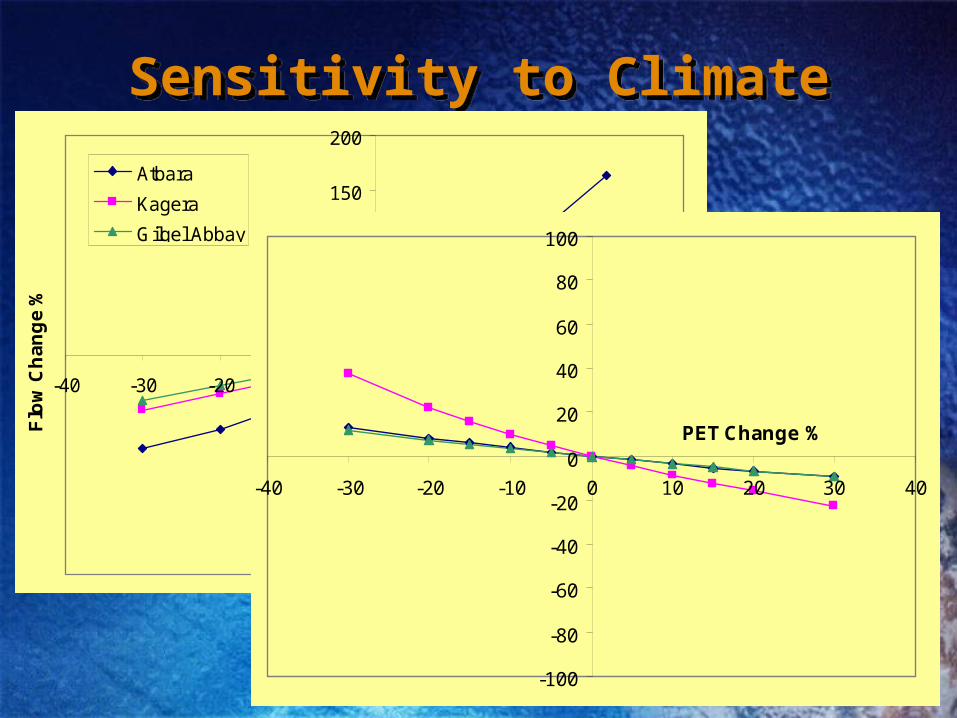
Sensitivity to ClimateSensitivity to Climate
-200
-150
-100
-50
0
50
100
150
200
-40 -30 -20 -10 0 10 20 30 40
Preciptation Change %Flo
w C
ha
ng
e %
Atbara
Kagera
Gilgel Abbay
-100
-80
-60
-40
-20
0
20
40
60
80
100
-40 -30 -20 -10 0 10 20 30 40
PET Change %
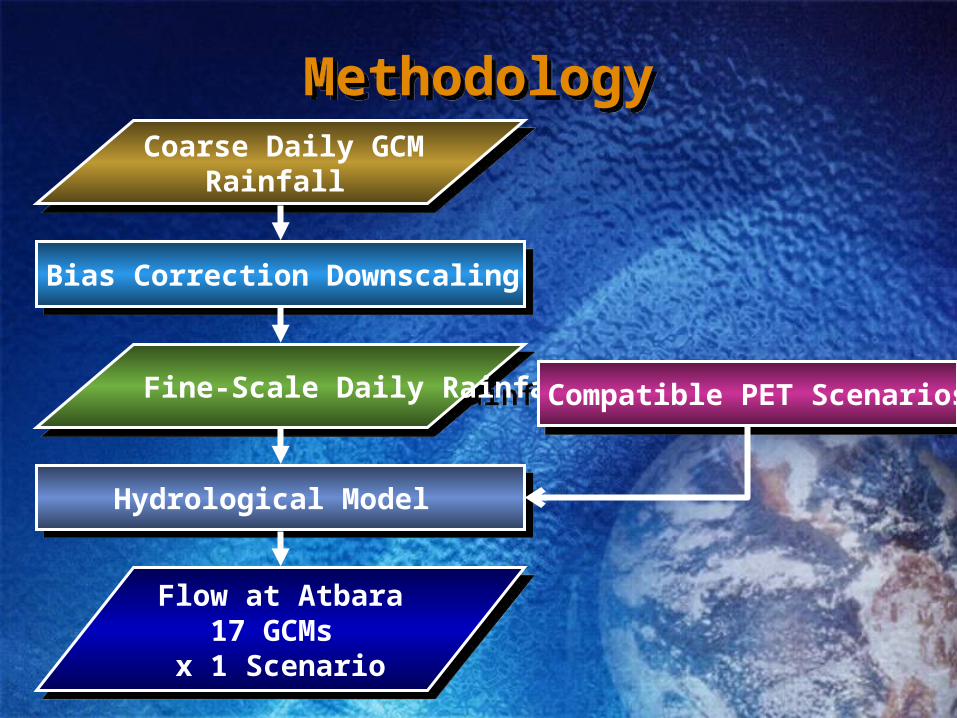
MethodologyMethodologyCoarse Daily GCM
Rainfall
Coarse Daily GCMRainfall
Bias Correction DownscalingBias Correction Downscaling
Fine-Scale Daily Rainfall Fine-Scale Daily Rainfall
Hydrological Model Hydrological Model
Flow at Atbara17 GCMs
x 1 Scenario
Flow at Atbara17 GCMs
x 1 Scenario
Compatible PET ScenariosCompatible PET Scenarios
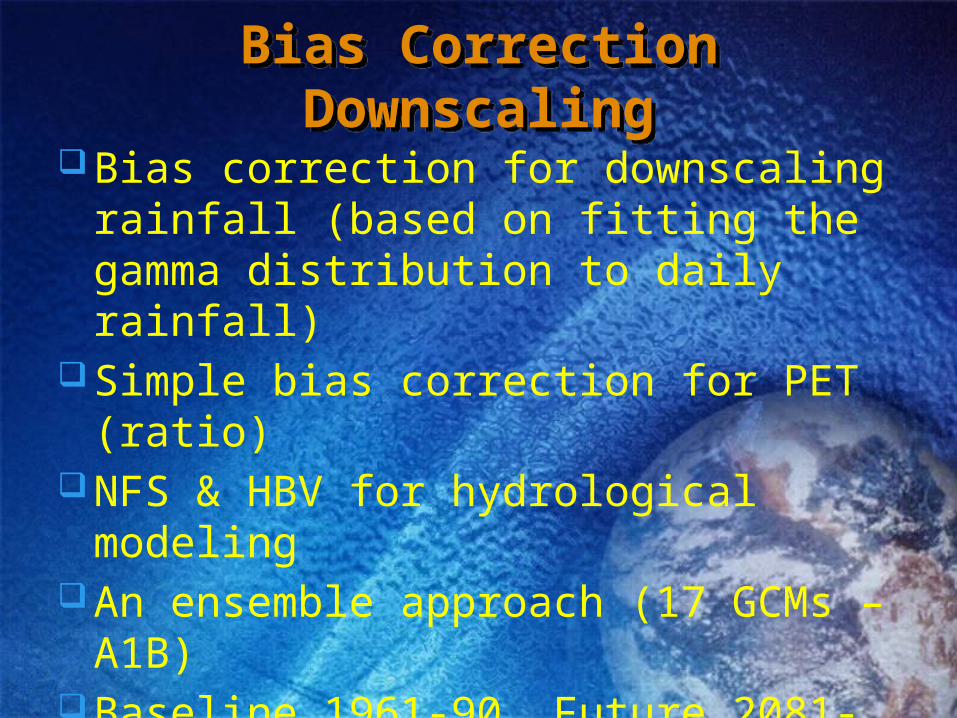
Bias Correction DownscalingBias Correction Downscaling
Bias correction for downscaling rainfall (based on fitting the gamma distribution to daily rainfall)
Simple bias correction for PET (ratio)NFS & HBV for hydrological modelingAn ensemble approach (17 GCMs – A1B)Baseline 1961-90, Future 2081-2098,
Daily rainfall data & Monthly PET data
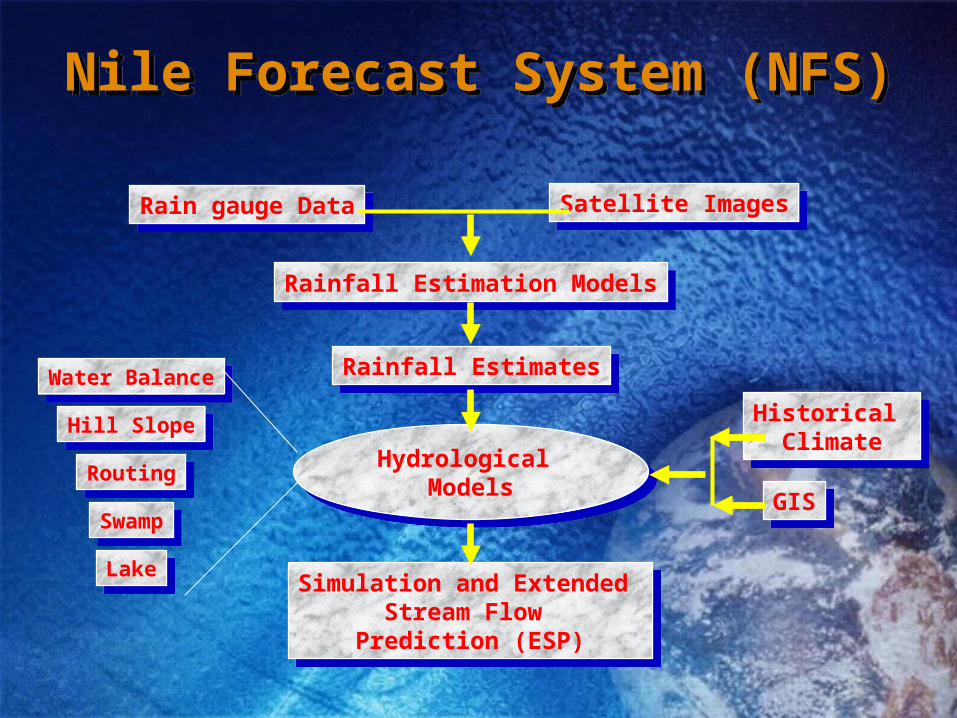
Rain gauge DataRain gauge Data Satellite ImagesSatellite Images
Rainfall Estimation ModelsRainfall Estimation Models
Rainfall EstimatesRainfall Estimates
Hydrological Models
Hydrological Models
Simulation and Extended Stream Flow
Prediction (ESP)
Simulation and Extended Stream Flow
Prediction (ESP)
Water BalanceWater Balance
Hill SlopeHill Slope
RoutingRouting
SwampSwamp
LakeLake
Historical Climate
Historical Climate
GISGIS
Nile Forecast System (NFS)Nile Forecast System (NFS)
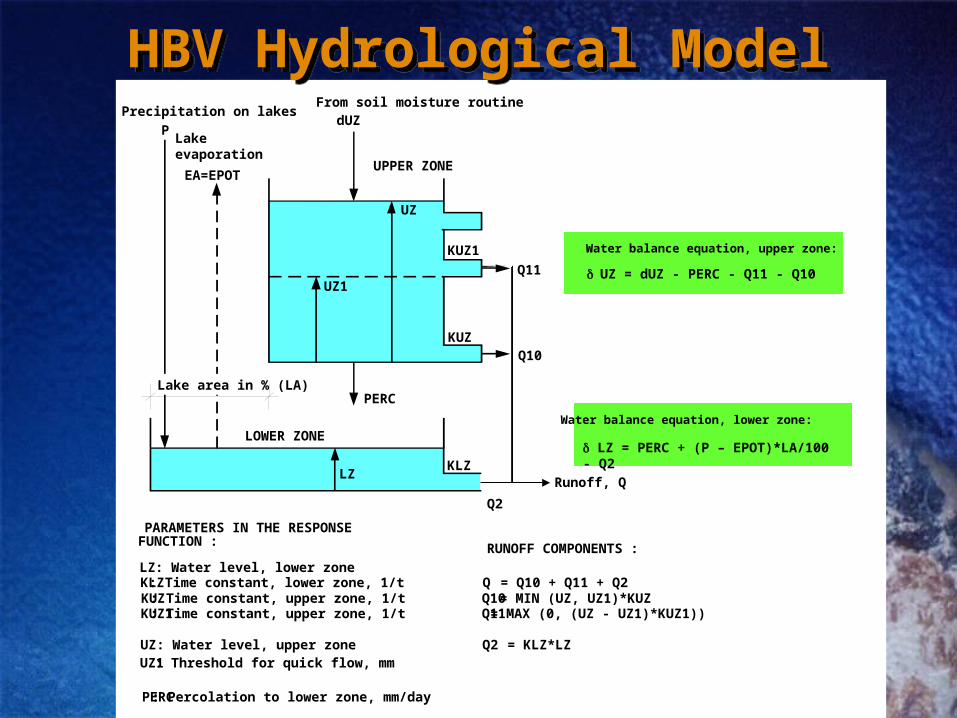
HBV Hydrological ModelHBV Hydrological ModelPrecipitation on lakes
Lakeevaporation
EA=EPOT
P
From soil moisture routinedUZ
UPPER ZONE
LOWER ZONE
KUZ1
KUZ
UZ1
UZ
Q11
Q10
Q2
LZKLZ
PERCLake area in % (LA)
Runoff, Q
KLZKUZKUZ1
UZ
PERC
: Time constant, lower zone, 1/t: Time constant, upper zone, 1/t: Time constant, upper zone, 1/t
: Water level, upper zone
: Percolation to lower zone, mm/day
QQ10Q11
Q2
= Q10 + Q11 + Q2= MIN (UZ, UZ1)*KUZ= MAX (0, (UZ - UZ1)*KUZ1))
= KLZ*LZ
PARAMETERS IN THE RESPONSEFUNCTION : RUNOFF COMPONENTS :
d UZ = dUZ - PERC - Q11 - Q10
Water balance equation, upper zone:
d LZ = PERC + (P – EPOT)*LA/100 - Q2
Water balance equation, lower zone:
LZ : Water level, lower zone
UZ1 : Threshold for quick flow, mm
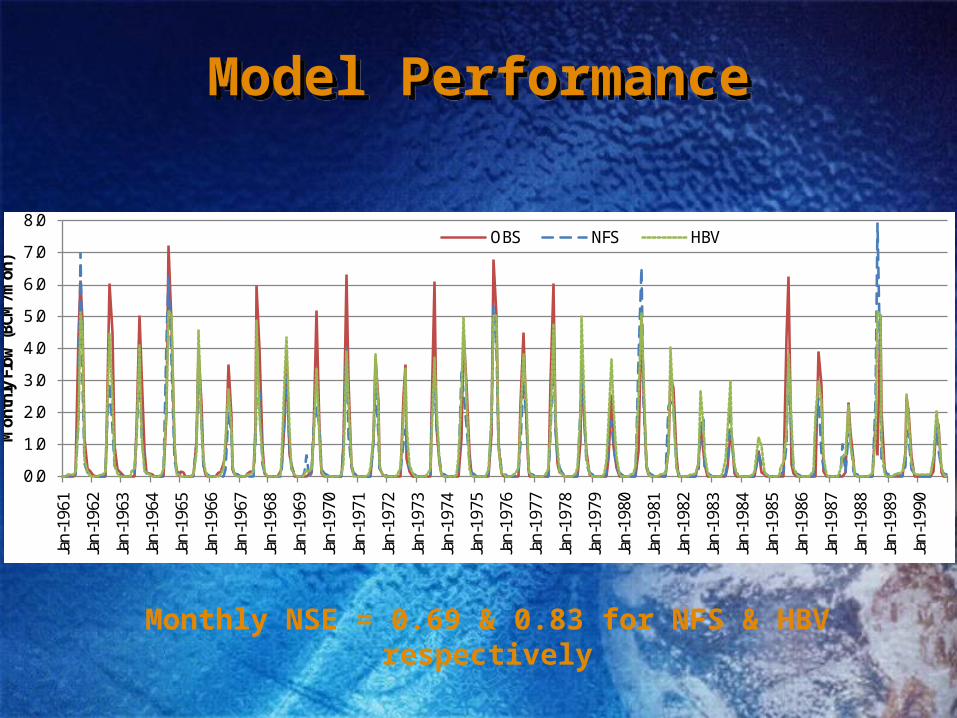
Model PerformanceModel Performance
0.0
1.0
2.0
3.0
4.0
5.0
6.0
7.0
8.0
Jan-19
61
Jan-19
62
Jan-19
63
Jan-19
64
Jan-19
65
Jan-19
66
Jan-19
67
Jan-19
68
Jan-19
69
Jan-19
70
Jan-19
71
Jan-19
72
Jan-19
73
Jan-19
74
Jan-19
75
Jan-19
76
Jan-19
77
Jan-19
78
Jan-19
79
Jan-19
80
Jan-19
81
Jan-19
82
Jan-19
83
Jan-19
84
Jan-19
85
Jan-19
86
Jan-19
87
Jan-19
88
Jan-19
89
Jan-19
90
Mon
thly
Flo
w (B
CM/m
on)
OBS NFS HBV
Monthly NSE = 0.69 & 0.83 for NFS & HBV respectively

The GLUE FrameworkThe GLUE Framework
• GLUE: Generalized Likelihood Uncertainty Estimation
• GLUE rejects the concept of a single optimal model and parameter set
• Assumes all model structures and parameter sets have a likelihood of being accepted
• Likelyhood depends performance as measured by a selected criteria
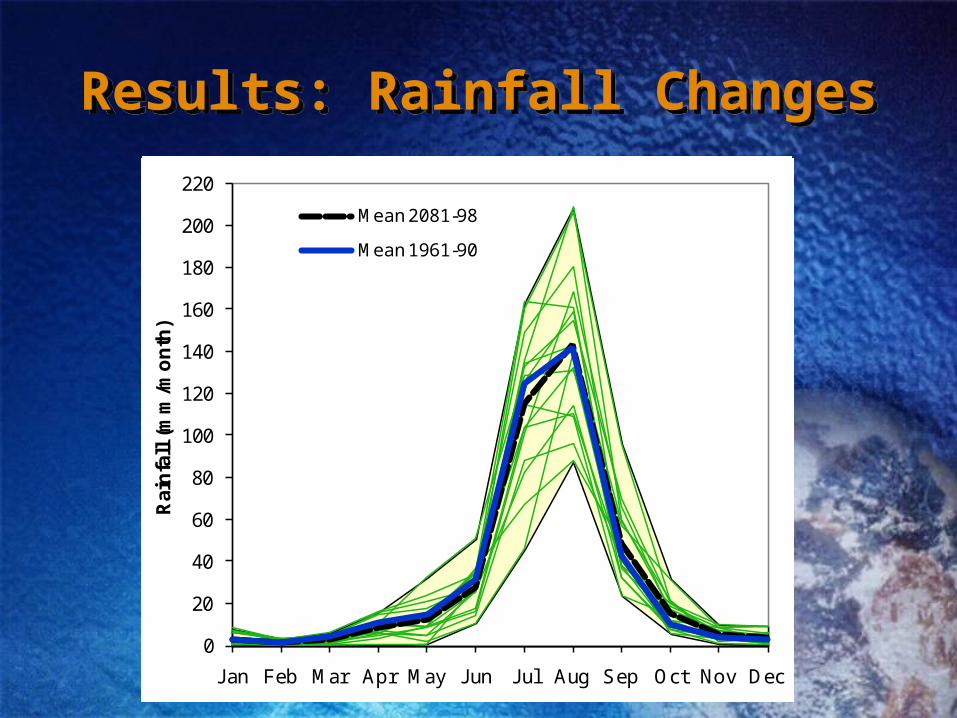
Results: Rainfall ChangesResults: Rainfall Changes
0
20
40
60
80
100
120
140
160
180
200
220
Jan Feb Mar Apr May Jun Jul Aug Sep Oct Nov Dec
Rai
nfa
ll (
mm
/mo
nth
)
Mean 1961-1990
OBS
0
20
40
60
80
100
120
140
160
180
200
220
Jan Feb Mar Apr May Jun Jul Aug Sep Oct Nov Dec
Rai
nfa
ll (
mm
/mo
nth
)
Mean 2081-98
Mean 1961-90
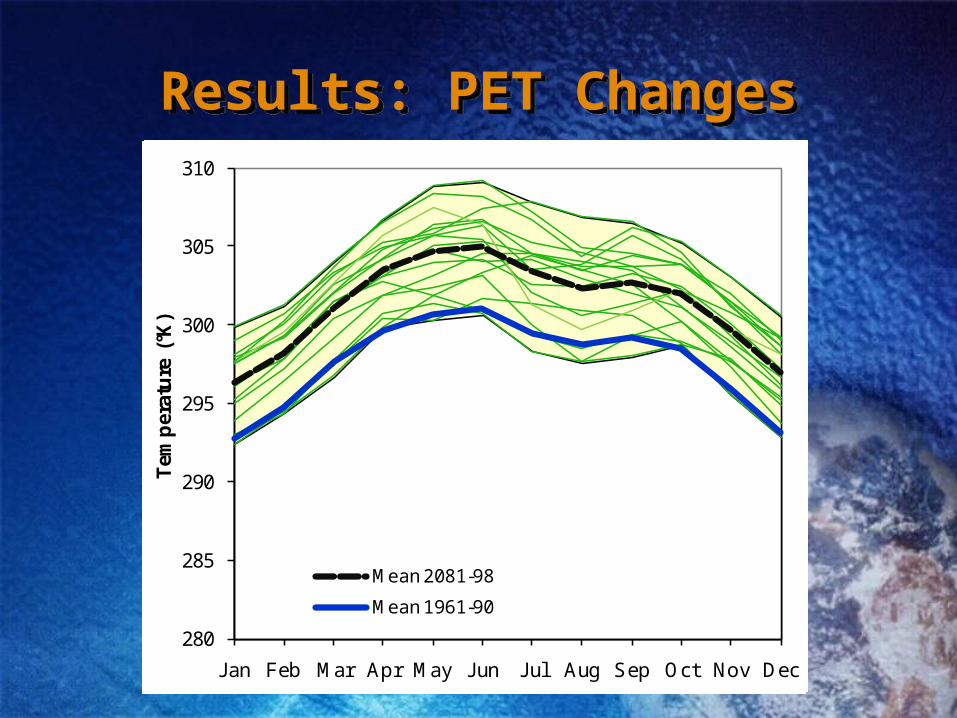
Results: PET ChangesResults: PET Changes
280
285
290
295
300
305
310
Jan Feb Mar Apr May Jun Jul Aug Sep Oct Nov Dec
Tem
per
atu
re (
°K)
Mean 1961-1990
OBS
280
285
290
295
300
305
310
Jan Feb Mar Apr May Jun Jul Aug Sep Oct Nov Dec
Tem
per
atu
re (
°K)
Mean 2081-98
Mean 1961-90
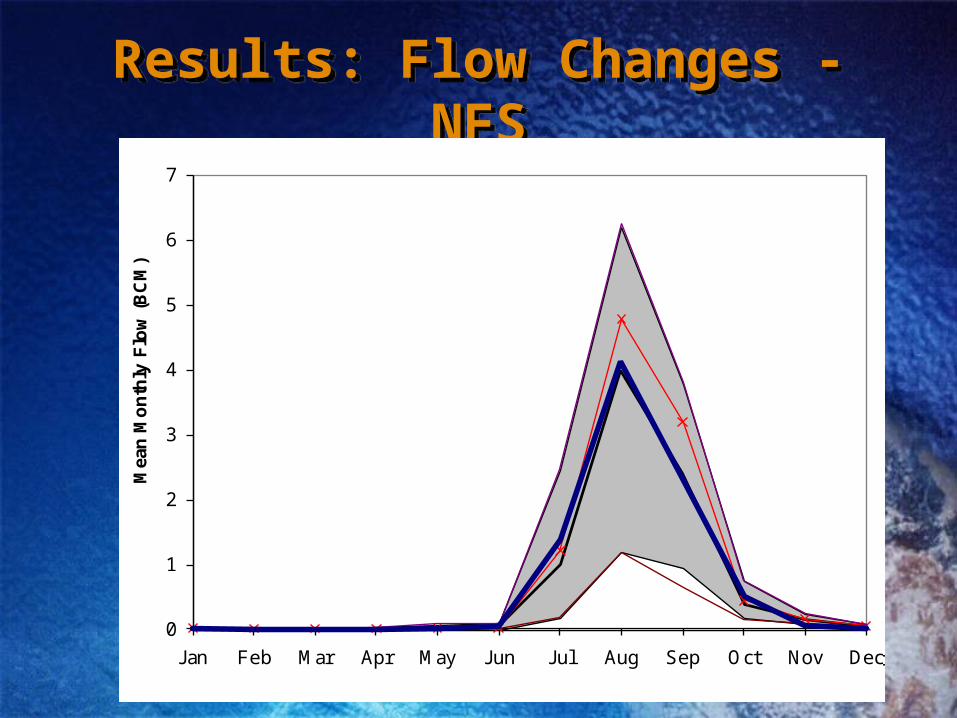
Results: Flow Changes - NFSResults: Flow Changes - NFS
0
1
2
3
4
5
6
7
Jan Feb Mar Apr May Jun Jul Aug Sep Oct Nov Dec
Mea
n M
on
thly
Flo
w (
BC
M)
Mean
Median
Max
Min
OBS
0
1
2
3
4
5
6
7
Jan Feb Mar Apr May Jun Jul Aug Sep Oct Nov Dec
Mea
n M
on
thly
Flo
w (
BC
M)
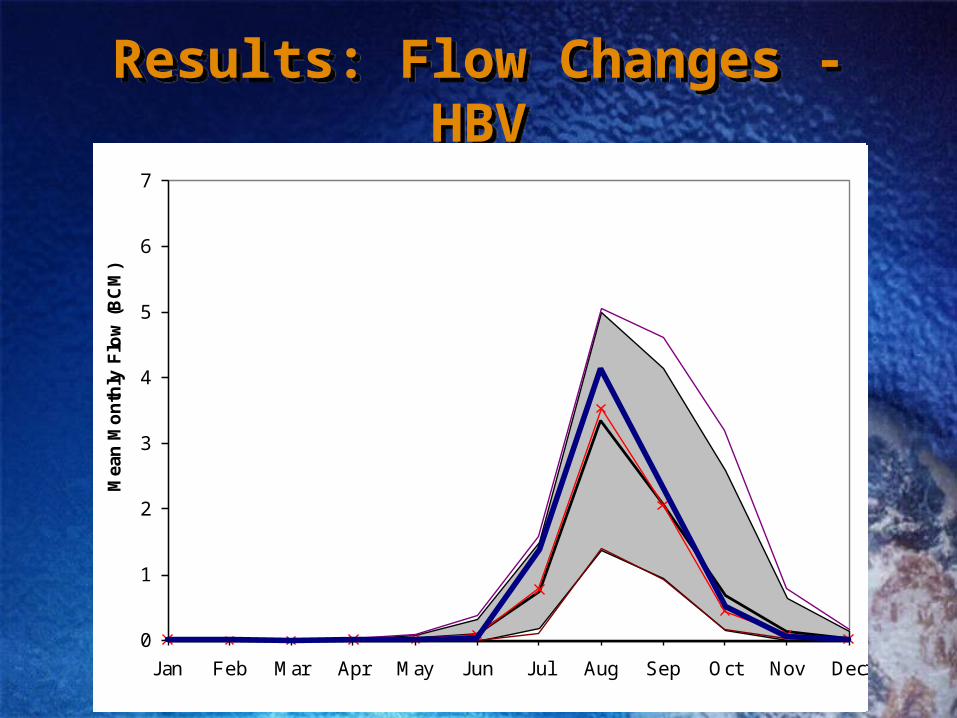
Results: Flow Changes - HBVResults: Flow Changes - HBV
0
1
2
3
4
5
6
7
Jan Feb Mar Apr May Jun Jul Aug Sep Oct Nov Dec
Mea
n M
on
thly
Flo
w (
BC
M)
0
1
2
3
4
5
6
7
Jan Feb Mar Apr May Jun Jul Aug Sep Oct Nov Dec
Mea
n M
on
thly
Flo
w (
BC
M)
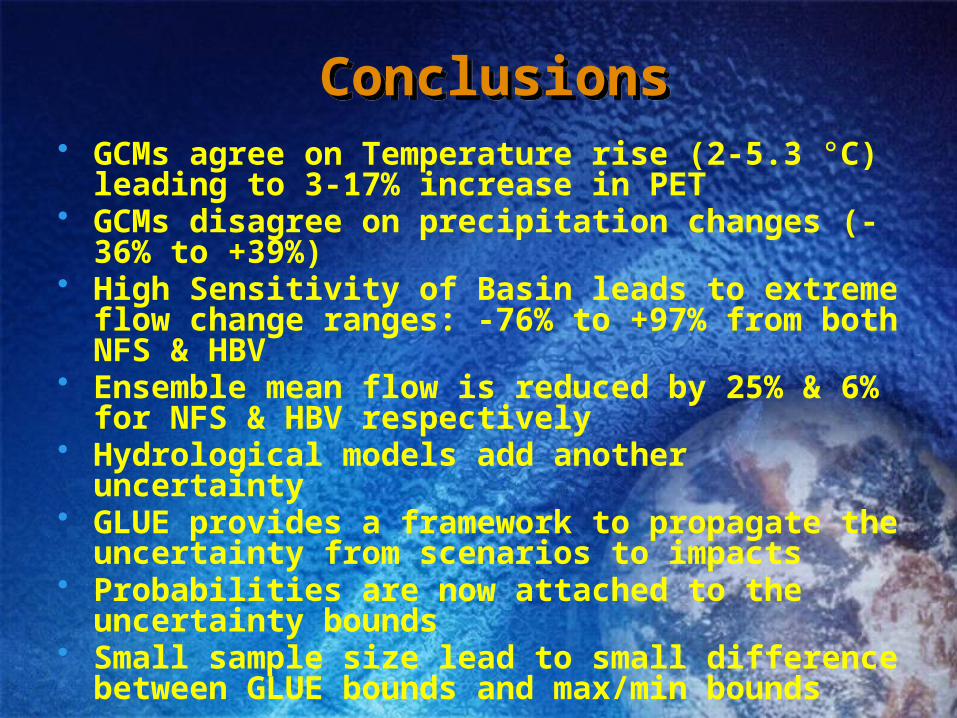
Conclusions Conclusions• GCMs agree on Temperature rise (2-5.3 °C) leading
to 3-17% increase in PET• GCMs disagree on precipitation changes (-36% to
+39%)• High Sensitivity of Basin leads to extreme flow
change ranges: -76% to +97% from both NFS & HBV• Ensemble mean flow is reduced by 25% & 6% for
NFS & HBV respectively• Hydrological models add another uncertainty• GLUE provides a framework to propagate the
uncertainty from scenarios to impacts• Probabilities are now attached to the uncertainty
bounds• Small sample size lead to small difference between
GLUE bounds and max/min bounds