THESIS FOR DEGREE OF DOCTOR IN PHILOSOPHY
Assessment of novel applications fornano-porous thermal insulation in district
heating pipes and building walls
Axel Berge
Division of Building TechnologyDepartment of Civil and Environmental EngineeringCHALMERS UNIVERSITY OF TECHNOLOGY
Goteborg, Sweden, 2016
i

Assessment of novel applications for nano-porous thermal insulation in district heating pipesand building walls
Axel BergeISBN 978-91-7597-343-2
c©Axel Berge, 2016.
Doktorsavhandling vid Chalmers Tekniska HogskolaNy serie nr: 4024ISSN: 0346-718X
Department of Civil and Environmental EngineeringDivision of Building TechnologyChalmers University of TechnologySE-412 96 GoteborgSwedenTelephone +46 (0)31-772 1000www.chalmers.se
Cover: Bendable vacuum insulation panel for pipes (Chapter 3). (Photo: Nina Zanders)
Printed by Chalmers ReproserviceGoteborg, Sweden 2016
ii

Assessment of novel applications for nano-porous thermal insulation in district heating pipes
and building walls
Axel Berge
Division of Building Technology
Department of Civil and Environmental Engineering
Chalmers University of Technology
Abstract
In nano-porous thermal insulation there is a strong relation between the pressure and thethermal conductivity, even at pressures close to atmospheric pressure. This thesis presentsresearch on applications of nano-porous insulation in hybrid insulation district heating pipesand in building walls.
A concept of hybrid insulation district heating pipes has been investigated where the inner-most layers of insulation consists of nano-porous insulation and the outer layers consists ofpolyurethane foam insulation. The concept has been investigated through a mix of laboratorymeasurements, field measurements and simulations. The presented research indicates that vac-uum insulation panels (VIPs) can be used in district heating pipes to reduce the heat losses.For the evaluated configurations the heat losses were reduced by a magnitude of 30%. The heatlosses from the supply pipe in a twin pipe were reduced by 50%. The two main considerationswith using vacuum panels in district heating pipes are the thermal bridges and the long termperformance. It is shown that the position of the thermal bridges in the panels has a large effecton the thermal performance of the twin pipes and the results indicate a preferred configurationto minimize heat loss. The thesis presents a model to evaluate the long term performance ofthe VIPs through temperature measurements. After three years of field measurements on pipesconnected to a district heating network with temperatures up to 90◦C, there is no sign of anyuncontrolled deterioration of the VIPs.
Results from the investigation show that the use of aerogel can reduce the thickness of a loadbearing stud wall with 40% compared to the use of conventional insulation. If done wrong,this can lead to some new consideration regarding mold growth risk. The fact that the thermalconductivity of nano-porous insulation is strongly influenced by the pressure in the pore gascan be used to create variable insulation, where the thermal properties of the insulation ischanged to match the current circumstances. By putting the insulation in a diffusion tight bag,connected to a vacuum pump, the pressure in the material can be changed and thereby thethermal conductivity. The pressure was varied in a fumed silica and an aerogel blanket samplebetween 1 kPa and atmospheric pressure, which gave a variation in the thermal conductivity of1.5 for the aerogel blanket and 3 for the fumed silica. Transient measurements during evacuationand refilling show that the thermal performance will be influenced by some transient effects,such as influence from the temperature of the inserted air, but the time scale is too small tohave any large effect on the energy performance. When the variation is used in simulations ofthe energy use for an office building, an interesting result is that a variable construction gavea higher optimum U-value, corresponding to thinner walls.
iii

iv
List of publications
The thesis is based on the following publications, referred to in the text by Roman numeralsI-VII. The publications are divided into two themes.
Theme 1: Hybrid insulation district heating pipes.
I Explorative study of the thermal performance of superinsulation in district heating pipes(2016) Submitted to Energy and Buildings.
Co-authors: Bijan Adl-Zarrabi.
II Assessing the thermal performance of district heating twin pipes with vacuum insulationpanels (2015) Energy Procedia, Vol. 78 pp. 382-387.
Co-authors: Bijan Adl-Zarrabi, Carl-Eric Hagentoft.
III Field measurements on a district heating pipe with vacuum insulation panels (2016) Re-newable Energy, Vol. 87(3) pp. 1130-1138.
Co-authors: Carl-Eric Hagentoft, Bijan Adl-Zarrabi.
IV Finite element simulations of the thermal performance for district heating pipes with vac-uum insulation panels (2016) Submitted to Energy and Buildings.
Co-authors: Bijan Adl-Zarrabi, Carl-Eric Hagentoft, Paula Wahlgren.
Theme 2: Nano-porous insulation in building walls.
V Wooden stud walls with aerogel thermal insulation (2013) Buildings XII Conference, Clear-water, USA.
Co-authors: Carl-Eric Hagentoft, Paula Wahlgren.
VI Changing internal pressure to achieve variable thermal conductivity in thermal insulation(2015) Advanced Building Skins Conference, Graz, Austria.
Co-authors: Carl-Eric Hagentoft, Paula Wahlgren, Bijan Adl-Zarrabi.
VII Effect from a variable U-value in adaptive building components with controlled internalair pressure (2015) Energy Procedia, Vol. 78 pp. 376-381.
Co-authors: Carl-Eric Hagentoft, Paula Wahlgren, Bijan Adl-Zarrabi.
Other publications
• Johansson, P., Adl-Zarrabi B. & Berge, A. (2015) Long-term performance of vacuuminsulations panels in buildings and building systems. IVIS2015 12th International vacuuminsulation symposium, China.
• Johansson, P., Adl-Zarrabi B. & Berge, A. (2015) Evaluation of long-term performanceof VIPs. Energy Procedia, Vol. 78 pp. 388-393.
v

• Berge, A. & Adl-Zarrabi, B.(2014) Evaluation of vacuum insulation panels used in hybridinsulation district heating pipes. DHC14, the 14th International Symposium on DistrictHeating and Cooling, Stockholm, Sweden.
• Berge, A., Adl-Zarrabi, B. & Hagentoft, C. (2013) Determination of specific heat capacityby transient plane source. Frontiers of Architectural research, 2(4) 476-482.
• Berge A. (2013) Novel thermal insulation in future building and district heating applica-tions - hygrothermal measurements and analysis. Licentiat thesis, Lic 2013:6, ChalmersUniversity of Technology, Goteborg, Sweden.
• Adl-Zarrabi, B. & Berge, A. (2013) Hybridisolerade Fjarrvarmeror [Hybrid insulationdistrict heating pipes], Report 2013:23, Fjarrsyn. (In Swedish)
• Berge, A. & Adl-Zarrabi, B.(2012) Using high performance insulation in district heat-ing pipes. DHC13, the 13th International Symposium on District Heating and Cooling,Copenhagen, Denmark.
• Berge, A. & Johansson, P. (2012) Literature review of high performance thermal insula-tion., Report 2012:2, Chalmers University of Technology, Goteborg, Sweden.
• Adl-Zarrabi, B. & Berge, A. (2012) Hogpresterande Fjarrvarmeror [High perforance dis-rict heating pipes], Report 2012:16, Fjarrsyn. (In Swedish)
• Berge A. (2011) Analysis of Methods to Calculate Air Infiltration for Use in EnergyCalculations. Master’s Thesis 2011:16, Chalmers University of Technology, Goteborg,Sweden.
vi
Preface
This thesis summarize my research at the Division of Building Technology, Department of Civiland Environmental Engineering, at Chalmers University of Technology. The research have beenfunded by the project homes 4 tomorrow through FORMAS, by the EU project FC-District andthe three projects Hogpresterande fjarrvarmeror, Hybridisolerade fjarrvarmeror and Livslangdoch statusbedomning av fjarrvarmenat all funded by Svensk fjarrvarme through the researchprogram Fjarrsyn.
The field measurements have been made in Varberg, connected to the district heating network ofVarberg Energi. All prototypes of hybrid insulation district heating pipes have been prodeucedin collaboration with Powerpipe systems AB. Aspen Aerogel have provided aerogel blankets forthe measurements.
I am very grateful to my three supervisors Carl-Eric Hagentoft, Bijan Adl-Zarrabi and PaulaWahlgren. Carl-Eric Hagentoft have been fundamental for the development of my theoreticalknowledge through countless discussions. The experimental experience of Bijan Adl-Zarrabihave been invaluable for planning my experiments. Paula Wahlgren and I have had a greatpedagogical exchange through our joint teaching. The division of Building Technology havebeen a great workplace with a good research environment, mainly because of all good colleagues.A special thank to Marek for the company during all hours spent on the road between Goterborgand Varberg.
I also want to thank my family. I thank my parents Karin and Dag for all support and forgiving me the foundation on which to build my higher education. Thanks to my brothers Aron,Isak and Leo for all intellectual stimulation which have sharpened my analytical ability.
Most of all I want to thank my wife Bonnie for standing by my side through this whole process.
Axel BergeGoteborg, 2016
vii

viii
Contents
Abstract iii
List of publications v
Preface vii
1 Introduction 1
1.1 Aim . . . . . . . . . . . . . . . . . . . . . . . . . . . . . . . . . . . . . . . . . . 2
1.2 Limitations . . . . . . . . . . . . . . . . . . . . . . . . . . . . . . . . . . . . . . 3
1.3 Methods . . . . . . . . . . . . . . . . . . . . . . . . . . . . . . . . . . . . . . . . 4
1.4 Thesis structure . . . . . . . . . . . . . . . . . . . . . . . . . . . . . . . . . . . . 5
2 Nanoporous thermal insulation 6
2.1 Aerogel . . . . . . . . . . . . . . . . . . . . . . . . . . . . . . . . . . . . . . . . 8
2.2 Vacuum insulation panels . . . . . . . . . . . . . . . . . . . . . . . . . . . . . . 10
3 Hybrid insulation district heating pipes 13
3.1 Finite element model for simulations on hybrid insulation district heating twinpipes . . . . . . . . . . . . . . . . . . . . . . . . . . . . . . . . . . . . . . . . . . 15
3.2 Thermal performance . . . . . . . . . . . . . . . . . . . . . . . . . . . . . . . . . 17
3.3 Optimization of panel configuration . . . . . . . . . . . . . . . . . . . . . . . . . 19
3.4 Field measurements . . . . . . . . . . . . . . . . . . . . . . . . . . . . . . . . . . 20
4 Nano-porous insulation in building walls 26
4.1 Wooden stud walls with aerogel blankets . . . . . . . . . . . . . . . . . . . . . . 27
ix
4.2 Effects from pressure changes in nano-porous insulation . . . . . . . . . . . . . . 29
4.3 Building simulations on building with switchable insulation . . . . . . . . . . . . 32
5 Conclusion 35
6 Future work 37
Bibliography 38
x

Chapter 1
Introduction
The main factors influencing heat transfer through a material between two temperatures is the
thickness of the material and its thermal properties: thermal conductivity and specific heat
capacity. In nano-porous materials there is a strong relation between the gas pressure and the
thermal conductivity.
In a gas, the thermal energy is transferred through collisions between gas molecules. The
heat transfer between molecules in a gas is more efficient than the heat transfer from when
gas molecules collide with solids. The average distance a gas molecule travels before hitting
another gas molecule is called the mean free path. In nano-porous materials, the pore size
is of the same magnitude as the mean free path of air, which means a decreasing number of
collisions between the molecules in the gas. Therefore the thermal conductivity of the gas is
reduced compared to the thermal conductivity of a free moving gas.
The thermal conductivity of a gas in a nano-porous material will also be influenced by the
pressure of the gas. A lower pressure means that there are fewer or slower gas molecules which
leads to a longer average length between collisions. In other words, a longer mean free path. A
consequence of this is that the thermal conductivity of nano-porous materials are sensitive to
changes in the pore gas pressure.
The above hypothesis was presented already by Kistler & Caldwell (1934), after Kistler had
experienced the low thermal conductivity of his newly invented aerogel (Kistler 1931). The
same relation between pressure and thermal conductivity has been found for various aerogels
(Fricke et al. 1992, Hummer et al. 1993) as well as for fumed silica and perlite (Caps & Fricke
2000). Simmler et al. (2005b) show comparative measurements to some materials without nano-
pores, where it is clear that a much lower pressure is needed to reduce the thermal conductivity
of the gas inside the porous material. The mean free path would reach the same magnitude as
the pore size, first at a lower pressure. This relation between pressure and thermal conductivity
1
2 Chapter 1. Introduction
has been fundamental for the introduction of vacuum insulation panels (VIP) for the building
sector. However, the vacuum in the panels is hard to maintain for long time periods. For
nano-porous materials, the vacuum does not need to be of as high quality to achieve a low
thermal conductivity, meaning that a larger intrusion of air can be allowed.
For domestic buildings in cold climates, a lower U-value is almost always preferable to save
energy. But a lower U-value commonly comes with the cost of an increased wall thickness.
Nano-porous insulation could potentially be used to reduce the heat losses without an increase
in thickness.
There has been a large number of research projects dealing with VIPs in building components.
Some examples of studied applications are flat roof construction with vacuum panels investi-
gated by Brunner & Simmler (2008), wooden stud walls with VIPs between the studs by Haavi
et al. (2012) and VIP as a retrofit measure of old buildings with heritage protected facades, as
by Johansson et al. (2014). A new area for the VIP research is in applications with a higher
temperature around the panels. With a higher temperature, the diffusion of air increases, as
shown by Simmler & Brunner (2005a).
A change in pressure could also be utilized to control the thermal conductivity for cases where
the optimal properties varies. This is typically true for buildings in cold climates with occa-
sionally large heat loads. Then a low thermal conductivity would be beneficial when heating
is needed and a low conductivity would be beneficial when cooling is needed, assuming that
the outdoor temperature is below the indoor temperature. A fundamental concept for using
vacuum to control the heat losses has been patented by Xenophou (1976) where walls made
up of cells can be evacuated by a vacuum pump. Meister et al. (1997) present another concept
where the hydrogen pressure can be shifted by electro-chemical reaction with metal hydrides.
This has led to an interest in the research of two applications for nano-porous insulation: Hybrid
insulation district heating pipes and as super insulation for buildings which potentially could
have switchable properties, controlled by a variation in the internal pressure of the building
insulation.
1.1 Aim
The aim of this thesis is to evaluate the feasibility of new applications for nano-porous ther-
mal insulation. Two insulation types have been investigated: aerogel blankets and fumed silica
vacuum insulation panels. The thesis is parted into two themes correlated to two different appli-
cations: hybrid insulation district heating pipes and building insulation, nano-porous insulation
in building walls. The thesis tries to answer the following research questions.

1.2. Limitations 3
On hybrid insulation district heating pipes:
• What effect can nano-porous insulation have on the thermal performance of district heat-
ing pipes?
• How can the application nano-porous insulation in district heating pipes be optimized
from a heat transfer perspective?
• How will the thermal performance of the hybrid insulation pipes withstand long term
usage?
On nano-porous building insulation:
• How will aerogel blankets influence the heat and moisture performance of a wooden stud
wall?
• How will a cycling pressure influence the thermal performance of fumed silica and aerogel
blankets?
• How can switchable insulation affect the energy performance of a building?
1.2 Limitations
All the district heating pipes in this study have been of dimensions between DN 25 and DN
150. Rigid straight pipes have been used and in the twin pipes, the VIPs have been positioned
enveloping the supply pipe. For the laboratory measurements, the polyurethane foam (PUR)
in the pipes were mixed by hand. This gives a somewhat higher thermal conductivity compared
to production line polyurethane foam.
The long term study of the field measurements has been done on pipes connected to a low
temperature system. The maximum temperature in the supply pipe was around 90◦C. Field
measurements at higher system temperatures have been initiated but not analyzed. So far,
three years of measurements have been collected.
The properties of aerogel blankets and fumed silica have been tested at various pressures below
atmospheric pressure. The measurements have only been performed on material level and not
on system level. The measurement results for fumed silica were used for the energy balance
simulations of an office. The energy balance have only been made for one office configuration
with specific geometry and heat load data.
4 Chapter 1. Introduction
1.3 Methods
The two applications have been investigated from some different angles with a variety of meth-
ods. The methods can be divided into three different paths: laboratory measurements, numer-
ical simulations and field measurements.
In the laboratory, a guarded hot pipe apparatus has been used to evaluate the thermal per-
formance of hybrid insulation district heating pipes presented in Paper I and Paper II. The
measurements were based on the standard SS-EN 253 (2009). In this way the results can be
compared to commercial pipes, even though the standard measurement is made for homoge-
neously insulated pipes. In Paper II, two apparatuses were used to measure the heat flows in
twin pipes. The heat flow was measured for a set temperature difference between the supply
and return pipes. A guarded heat flow meter apparatus has been used to measure the thermal
conductivity of aerogel blankets in Paper V and for both aerogel blankets and fumed silica in
Paper VI. In Paper V the thermal conductivity is measured at various temperatures and at
different rates of mechanical compression. In Paper VI the samples were enclosed in a plas-
tic bag connected to a vacuum pump, so that the thermal conductivity could be measured at
varying pressure. The vapor diffusion coefficient of aerogel blankets was measured by the wet
cup method in Paper V. The measurements were made for different sample sizes, to find the
influence from the edges where the aerogel can crack.
Numerical simulations have been performed using various softwares. The finite element software
Comsol multiphysics (2015) was used in Paper IV for theoretical estimates of the thermal
performance of hybrid insulation district heating pipes. The simulations are used to investigate
the potential thermal benefit when introducing VIPs in twin pipe geometries and compares
it to the same effect by an increased thickness of polyurethane foam. The thermal bridges in
the envelope around the VIP have been modeled in detail to test the influence of variations
in configuration. The results from the simulations are also separated between losses from the
supply pipe and losses from the return pipe, which is compared to the total losses from the
system with and without VIPs. In Paper V, Comsol multiphysics (2015) was used to simulate
thermal performance at steady-state conditions for different wall assemblies while the finite
difference software Wufi2d (2015) was used for transient coupled heat and moisture simulations.
The results where analyzed using the model for mold growth potential by Hukka & Viitanen
(1999). In Paper VI, finite difference method was used in Matlab (2015) to simulate the
transient effects on the thermal performance from a pressure change in nano-porous insulation.
Finally, Excel was used to calculate the energy performance of a building with switchable
insulation in Paper VII.
The long term performance of the pipes has been analyzed through field measurements, pre-
sented in III. Thermocouples have been placed different positions throughout a pipe cross

1.4. Thesis structure 5
section, both around the VIP and in corresponding positions in a reference part with only
polyurethane foam. The temperatures have been logged over more than three years for the
oldest pipe. The resulting temperatures have been analyzed with a superposition model based
on Wallenten (1991). The results from the field measurements have been compared to finite
element simulations made in Comsol multiphysics (2015). A variation of cases have been sim-
ulated, based on either an instant collapse of the VIPs or a slow deterioration from diffusion of
gas into the panels.
1.4 Thesis structure
In Chapter 2 the theory of nano-porous thermal insulation is presented. The mechanisms for
heat transfer in porous and nano-porous materials are described, followed by a description of
aerogel and vacuum insulation panels. Next, Chapter 3 will present the first theme of the
thesis: hybrid insulation district heating pipes and will be followed by the research results
from Paper I-IV. Chapter 4 will present the second theme: nano-porous building insulation
from Paper V-VII. The thesis will finish with a summary of the conclusions in Chapter 5 and
suggestions for future work in Chapter 6.

Chapter 2
Nanoporous thermal insulation
In thermal insulation, porous materials are commonly used. The porous structure utilize the
low thermal conductivity of the gas in the pores. At the same time, heat radiation and gas
convection is hindered by the solid structure. The effective thermal conductivity of porous
material can in a simplified way be described as in Equation (2.1), assuming that the heat
transfer through convection can be neglected:
λinsulation = λsolid + λgas + λradiation [W/(m ·K)] (2.1)
where λinsulation is the apparent thermal conductivity of the insulation material , λsolid is the
thermal conduction through the solid structure of the pore walls, λgas is the conduction through
the pore gas and λradiation is the heat radiation between the cell walls. The thermal conductivity
will also be affected by some coupling effects as shown by Ebert (2011).
The benefit of nano-porous materials is that the small pores hinder the heat transfer through
the gas in the pores, reducing the term λgas in Equation (2.1). The reason for the decrease is
that collisions between the gas molecules and the solid pore walls transfer less heat than the
collisions between gas molecules. With smaller pores the probability of colliding gas molecules
is reduced in favor of collisions against walls (Baetens et al. 2010a). The average distance a gas
molecule travels before colliding with another gas is called the mean free path, lavg, and can be
calculated by Equation (2.2):
lavg =kBT√2πd2Pg
[m] (2.2)
where kB is the Boltzmann constant [Pa·m3/K], T is the temperature [K], d is the molecule
diameter [m] and Pg is the gas pressure [Pa]. The mean free path of air is around 100 nm at
6
7
normal pressure and temperature. This means that for air filled porous materials with a pore
size some magnitudes above 100 nm, most gas molecules will collide with other gas molecules
and the solid structures influence on the thermal conductivity can be neglected. For pore sizes
in the range of the mean free path and below, the solid walls would interrupt the heat transfer.
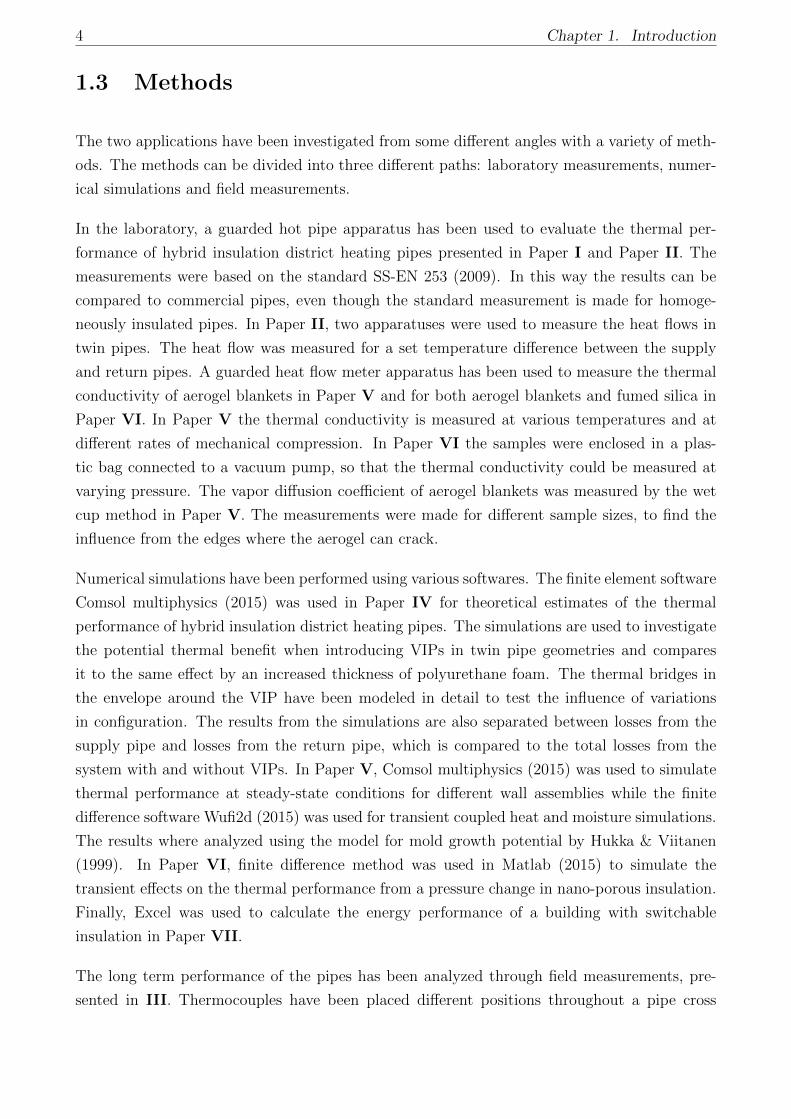
The conductivity of the gas can then be calculated according to Equation (2.3) (Ebert 2011),
λg =Π · λg.0
1 + 2β(lavg/δ)[W/(m ·K)] (2.3)
where λg is the gas conductivity in limited spaces [W/(m·K)], Π is the porosity of the material
[-], λg.0 is the gas conductivity for a free gas [W/(m·K)], β is a constant correlated to the
magnitude of the energy exchange between the gas and the solid walls [-] which has a value
between 1.5 and 2 (Baetens et al. 2010a) and δ is the characteristic system size [m]. The relation
between the mean free path and the characteristic system size, lavg/δ, is commonly referred to
as the Knudsen number, Kn [-]. With the mean free path of air and a porosity close to 1,
Equation (2.3) gives the relation λg/λg.0 as in Figure 2.1.
0
0.1
0.2
0.3
0.4
0.5
0.6
0.7
0.8
0.9
1
0.000001 0.0001 0.01 1 100
λg/λ
g.0
Pressure, Pg [kPa]
Characteristic size, δ100mm 10mm 1mm100µm 10µm 1µm100nm 10nm
Smaller pores
0
0.1
0.2
0.3
0.4
0.5
0.6
0.7
0.8
0.9
1
0 20 40 60 80 100
λg/λ
g.0
Pressure, Pg [kPa]
Characteristic size, δ100mm 10mm 1mm
100µm 10µm 1µm
100nm 10nm
Figure 2.1: Principal figure of thermal conductivity through the air ina porous insulation for different pressures below atmospheric pressure(just above 100 kPa). To the left, the pressure axis is logarithmic andto the right the pressure axis is linear. The porosity of the material isassumed to be 1.
As seen in Equation (2.2), the mean free path is inversely proportional to the gas pressure. In
Equation (2.3) the denominator includes one plus the quotient between mean free path and
pore size. This means that when the mean free path is small compared to the pore size, the
denominator will be one. At lower pressures the mean free path will increase and thereby, the
thermal conductivity will decrease. As seen in Figure 2.1, a large pressure change is needed

8 Chapter 2. Nanoporous thermal insulation
if the pores are large, but, if the pores are small the relation between pressure and thermal
conductivity becomes almost linear.
2.1 Aerogel
Aerogels are former gels which have been dried under such circumstances that the solid structure
of the gel is preserved. Kistler (1931) had the hypothesis that the main reason for the shrinkage
when a gel is dried to a xerogel were the forces from the pore liquid pulling the pore walls
together. He tested the hypothesis by drying gels in a condition of temperature and pressure
above the critical point. At that state, the fluid in the pores could be exchanged with a gas
without any forces on the structure. With the right gel, this led to a material with very high
porosity and a pore size in the nano range.
Already Kistler & Caldwell (1934) realized the superb thermal performance of the aerogels. And
he assumed that the reason for the low thermal conductivity was the small pores in accordance
with Equation (2.3). The properties have later been investigated by several methods and
researchers (Baetens et al. 2010a). A monolithic piece of silica aerogel is shown in Figure 2.2.
Figure 2.2: Monolithic silica aerogel. (Photo: Nina Zanders)
Since aerogels can be transparent they are interesting for light inlet into building. Scheuerpflug
et al. (1985) investigated the thermal performance of transparent aerogels. They present how
the radiative properties influence the total heat loss through the aerogel. The performance of
the aerogel could be improved further by hindering the radiation through the material, at the
cost of losing the transparency. Nilsson et al. (1986) used the hot strip method to measure
the thermal conductivity of a transparent aerogel and found it to be 17 mW/m·K. Reim et al.
(2004) measures the thermal conductivity and the optical properties of two types of aerogel
granulates. They tested the influence of mechanical loading of the aerogels. The loading
improves the thermal performance, and some of the improvement sustains after the load was
removed. The load compact the granulates and since the thermal conductivity of the aerogel
is lower than the thermal conductivity of the air the apparent thermal conductivity decreases.
2.1. Aerogel 9
Fricke et al. (1992) investigated the addition of opacifiers, soot or titanium oxide, to optimize
the thermal conductivity of monolithic aerogels. They find a minimum thermal conductivity of
13 mW/m·K at a density of 12 kg/m3. Hummer et al. (1993) measured the thermal conductivity
of aerogel granulates and powders with a guarded hot plate apparatus. The granulates and
powders are shown to have a thermal conductivity 17-22 mW/m·K. Compared to the monolithic
aerogel measured by Fricke et al. (1992), a lower pressure is neededd to decrease the thermal
conductivity. However, the minimum thermal conductivity at very low pressures are shown
to be lower for some of the powder samples. Spagnol et al. (2009) measured monolithic and
granular aerogels with the guarded thin film method with similar results. The change in thermal
conductivity was also shown to decrease in a stepwise manner rather than as one large step as
for the ideal case in Figure 2.1. This is probably a consequence of two superpositioned pore
systems, one within the granulates and one between the granulates for which the effect of the
pressure decrease follows different curves. Pietruszka et al. (2012) made measurements on an
aerogel blanket composite with a thermal conductivity of 15-16 mW/m·K. With reinforcement
fibers the strength of the aerogel is considerably improved.
The reason for the low thermal conductivity of aerogels are their small pores. Tamon et al.
(1997) measured the pore size distribution of a 200 kg/m3 aerogel with a N2 adsorption method.
The pores where shown to be in the range of 1-100 nm with the main volume around 10 nm.
The optimal density for thermal conductivity was found around 100 kg/m3 by Fricke et al.
(1992), but the density could be much lower. Tillotson & Hrubesh (1992) produce an aerogel
with a density of 3 kg.
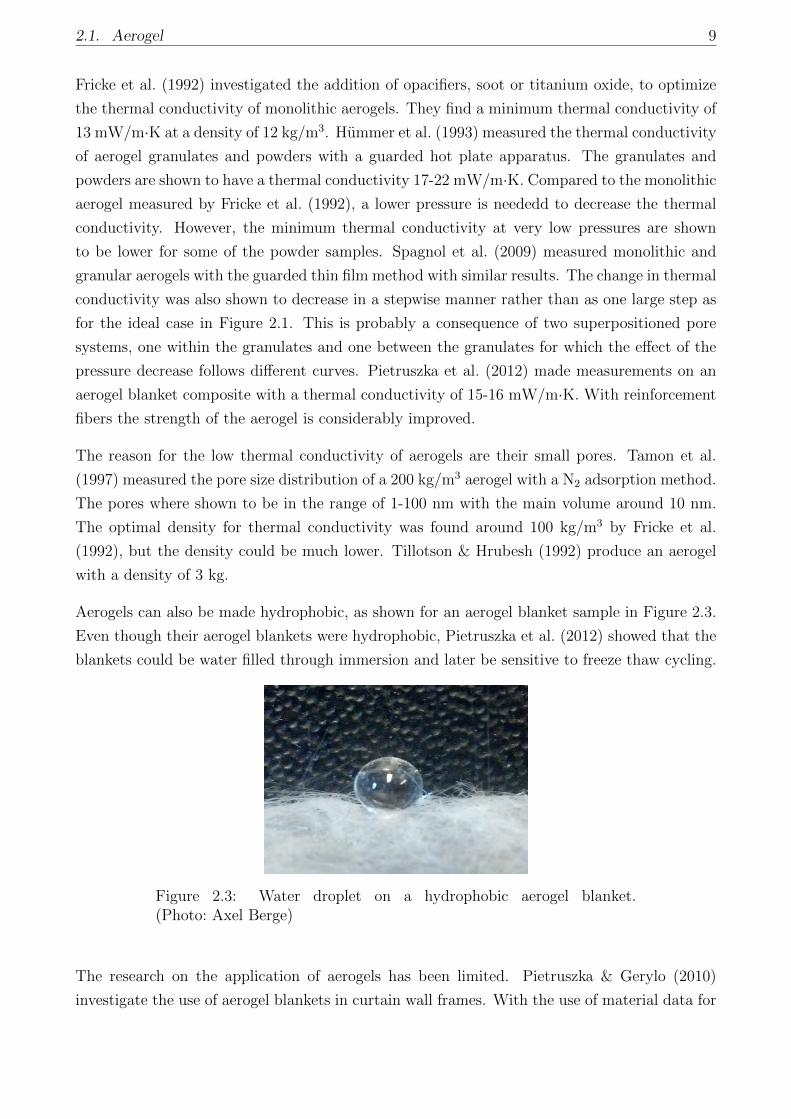
Aerogels can also be made hydrophobic, as shown for an aerogel blanket sample in Figure 2.3.
Even though their aerogel blankets were hydrophobic, Pietruszka et al. (2012) showed that the
blankets could be water filled through immersion and later be sensitive to freeze thaw cycling.
Figure 2.3: Water droplet on a hydrophobic aerogel blanket.(Photo: Axel Berge)
The research on the application of aerogels has been limited. Pietruszka & Gerylo (2010)
investigate the use of aerogel blankets in curtain wall frames. With the use of material data for

10 Chapter 2. Nanoporous thermal insulation
aerogel blankets, the U-value of the frame was found to be 0.83 W/m2K. A value comparable
to passive house standard windows.
Some research has been made on using the transparent properties of aerogel to collect solar
energy. Schreiber et al. (1986) investigate the use of transparent aerogel to let sun through to
a stone wall and then keeping the heat from the solar radiation in the wall. Svendsen (1992)
use transparent aerogel to insulate solar collectors.
Rubin & Lampert (1983) investigate the solar transmittance on an aerogel with a thermal
conductivity of 19 mW/m·K. The total transmittance of a 8 mm aerogel between two normal
window glasses was found to be 0.6 which is similar to the transmittance of a 3 pane window.
Reim et al. (2005) investigate the use of noble gas filled aerogel granulates in translucent
daylight inlets. With a light transmittance of 0.24-0.54 the U-value is 0.44-0.56 W/m2K.
2.2 Vacuum insulation panels
Vacuum insulation panels (VIP) consist of a porous core material that has been evacuated and
put in a highly diffusion tight envelope. An opened VIP with a fumed silica core is shown in
Figure 2.4. To minimize the permeation of gas into the vacuum panel the envelope commonly
contain some layers of aluminum, which have a high thermal conductivity, many orders of
magnitude higher than the evacuated core of the VIP. This creates an optimization problem
where an increased aluminum thickness decrease the permeation and prolongs the life span
of the panel, but at the same time, it creates thermal bridges along the edges of the panel.
Three main characteristics are thereby of importance for the thermal performance of a VIP:
the thermal performance of the core material, the thermal bridge effect through the envelope
and the permeation of gas into the panel.
Figure 2.4: The layers of a vacuum panel with a fumed silica core.(Photo: Nina Zanders)
2.2. Vacuum insulation panels 11
The core material in a VIP has to meet two criteria: the pore system must be open so that the air
can be evacuated and it must be strong enough to withstand the pressure of the atmosphere.
For building application the expected life span of the VIP is long. Therefore a nanoporous
material is preferable since it will retain its good thermal performance even at higher pressures.
This can be seen in Simmler et al. (2005b) where glass fiber insulation is shown to give lower
thermal conductivity at the minimum pressure but the fumed and precipitated silica materials
decrease in thermal conductivity at not o low pressures. Glass fiber has therefore been used for
applications with shorter expected life time. Caps & Fricke (2000) test different nanoporous
filler materials for use in vacuum insulation panels: fumed silica, percipitated silica, aerogel
powder and perlite. Precipitated silica is most promising with a thermal conductivity below
5 mW/m·K at pressures up to 1-2 kPa.
There are two types of envelopes commonly used in VIPs for the building sector. Aluminum
foils and metalized films. In aluminum foil envelopes, the foil is glued in between two polymer
films. The foil commonly has an aluminum thickness around 10 µm. In a metalized film,
the aluminum is instead deposited directly onto the surface of a polymer film. This enables a
much thinner aluminum layer down to thicknesses of 20 nm. Although, the thinner layers are
more sensitive to pointwise defects. In most VIP envelopes multiple layers are compiled in a
laminate.
The thermal conductivity of aluminum is about 200 W/m·K, 5 orders of magnitude larger than
the thermal conductivity of an evacuated VIP core. Ghazi Wakili et al. (2004) have made
measurements with guarded hot plate on three types of VIP, with and without an envelope
edge in the measurement area. Two samples had metalized films and showed a 10-20% increase
in effective thermal conductivity due to thermal bridges in a 1 m2 panel. The last VIP had
a foil envelope and the effective thermal conductivity almost doubled compared to the center
of panel thermal conductivity. Ghazi Wakili et al. (2011) continue the guarded hot plate
measurements on multilayer VIP structures. With multiple layers the influence of the thermal
bridges can be reduced. The measurements are compared to simulations with good correlation.
In the simulations, the envelope was treated as a single representative layer. Sprengard & Holm
(2014) simulates the difference between single layer edges of the panels and double, layered edges
where the double layers represent the seams of the envelope. The distance between panels and
fasteners are also investigated. The double layer edges is shown to almost double the heat loss.
Tenpierik & Cauberg (2007) developed an analytical model to evaluate the thermal bridges at
the VIP edges. The model shows less than 5% error when compared to numerical simulations.
One of the main simplifications of the model was that the thermal conductivity of the core was
assumed to be 0 mW/m·K. This meant that for panels with a high thermal conductivity the
deviation between simulations and measurements increase.
The thermal bridge effect of the vacuum insulation is in a direct relation to the long term
12 Chapter 2. Nanoporous thermal insulation
performance. With a thinner envelope the longt erm performance is reduced. Simmler &
Brunner (2005a) evaluated the long term performance of VIPs for building applications. For
a VIP with a production thermal conductivity in the center of the panel of 4 mW/m·K they
suggest a 25 year design value of 6 mW/m·K if an aluminum foil is used or 8 mW/m·K if a
metalized film laminate is used. Schwab et al. (2005) measured the permeation through different
VIP envelopes. The internal pressure was measured through the foil Lift-off Procedure where
the sample is put in a vacuum chamber and the pressure was changed until the envelop lifts from
the surface of the core material. They indicate that the area of the panel is more important
for water vapor permeation, but for air transmission the sealing has a larger effect. For the
two better performing films, the air transmission at 80◦C was around 5 times the rate at 25◦C.
Araki et al. (2009) tested different polymers for the vacuum panel envelope and show that there
are plastics that can withstand a higher temperature than the polyethylene used in most films
today. Although, with a higher melting temperature, a higher temperature is needed to seal
the VIP envelopes.

Chapter 3
Hybrid insulation district heating pipes
Statistics Sweden (2013) collects yearly statistics on Swedish energy usage. They show that
approximately 10% of the energy produced for district heating is lost from the distribution
system. According to Reidhav & Werner (2008) this number could be even higher for areas with
a sparse energy outtake. For the 72 sparse areas under investigation the worst had distribution
losses above 40%.
International Energy Agencys District Heating and Cooling Annex VIII (IEA DHC Annex VIII)
(Zinko et al. 2008) presents some suggestions to reduce the heat losses from district heating
pipes:
• To use twin pipes instead of two single pipes, where the supply pipe and the return pipe
are placed within the same insulation pipe.
• To shift the symmetry of the twin pipe so that the warmer supply pipe gets more insulated:
– by different sizes on the supply and return pipe.
– by shifting the position of the supply and return pipes so that the supply pipe is
closer to the center.
– by using an egg shaped casing with thicker insulation around the supply pipe.
• To put more than two pipes within the same insulation where some can be turned of
when the energy outtake is low.
• To add some superior type of insulation close to the supply pipe.
The use of twin pipes is already common practice in Sweden, when applicable. The shift of the
supply pipe towards the center of the surrounding pipe has been investigated by Dalla Rosa
et al. (2011) who show a reduction by up to 3.2%. Bøhm & Kristjansson (2005) investigate egg
13

14 Chapter 3. Hybrid insulation district heating pipes
shaped casing pipes and show a reduction of 7% compared to twin pipes. Bøhm & Kristjansson
(2005) also investigate the use of two supply pipes with one pipe turned of when the outtake
is low. This led to a decrease in the energy loss of around 25% compared to twin pipes. The
last suggestion from IEA-DHC (Zinko et al. 2008), to add a superior type of insulation around
the supply pipe, has been tested in this study.
In a cylindrical geometry, the insulation close to the center has a larger influence on the total
heat loss. This can be explained by the equation for thermal conductance, K, through a
cylindrical layer in Equation (3.1) (Hagentoft 2005):
K =2πLλ
ln(∆r/r1 + 1)[W/K] (3.1)
where L is the pipe length [m], λ is the thermal conductivity of the layer [W/(m·K)], ∆r is
the layer thickness [m] and r1 is the inner radius of the cylindrical layer [m]. If the inner
radius, r1, increases, then the denominator decreases and the total conductance increases. The
insulation closer to the center is thereby more material efficient. This indicates that it might be
preferable to add a more expensive high performance insulation close to the center of the pipe,
rather than add insulation thickness to the outside of the pipe. This has led to the development
of a concept for hybrid insulation district heating pipes, presented in Figure 3.1. The innermost
part of the polyurethane foam (PUR) in a conventional district heating pipe is exchanged with
a high performance insulation. For a twin pipe, the high performing insulation surrounds the
supply pipe.
Casing pipe(Polyethylene)
Highperformance
insulation
Supply pipe(steel/plastic)
Service pipe(steel/plastic)
Polyurethane foam
Return pipe(steel/plastic)
Single pipe Twin pipe
Figure 3.1: Concept for hybrid insulation district heating pipes.
Early in the research, VIPs were chosen as insulation, motivated in Section 3.2 and in Paper I.
One important aspect for the thermal performance of VIPs is the thermal bridges created in the
highly diffusion tight envelope. The envelop must surround the whole panel to hinder gas from
entering and destroying the vacuum. The thermal bridges in a pipe are described in Figure 3.2.
There is a thermal bridge along the panel where it overlaps itself (TBA), a thermal bridge at
the edges of the panel (TBE) and in twin pipes there is a reallocation of heat from the warm
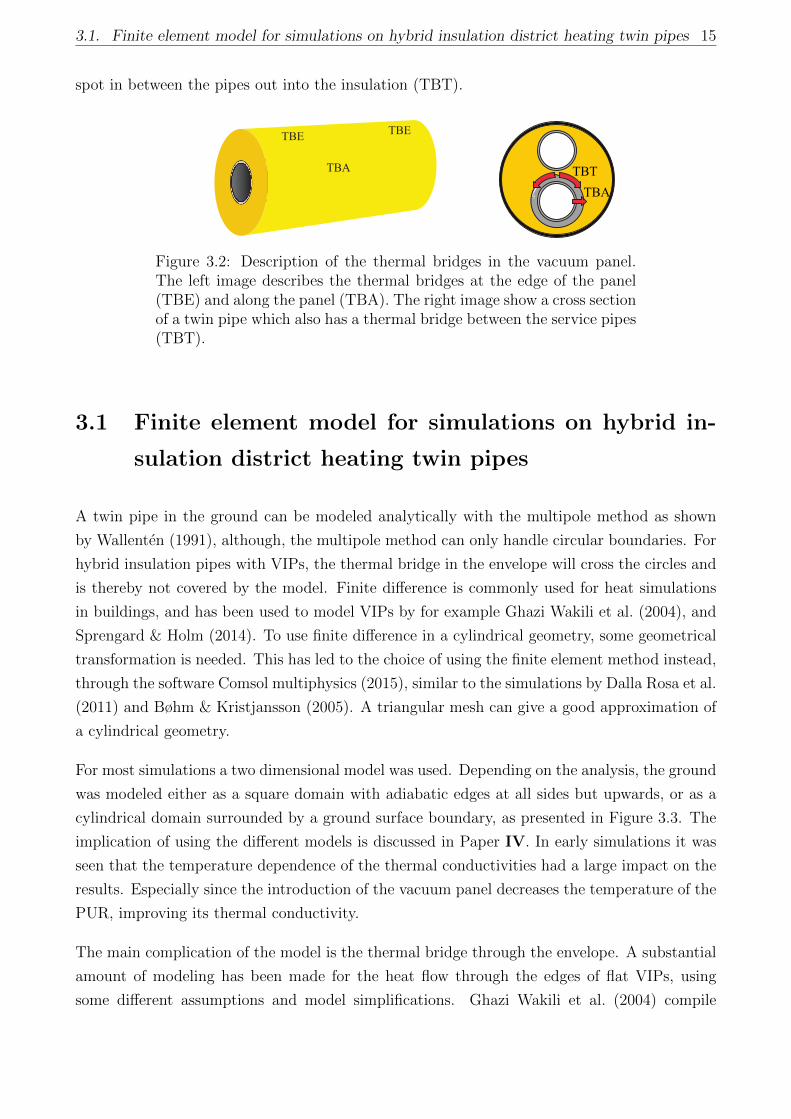
3.1. Finite element model for simulations on hybrid insulation district heating twin pipes 15
spot in between the pipes out into the insulation (TBT).
TBA
TBE TBE
TBT
TBA
Figure 3.2: Description of the thermal bridges in the vacuum panel.The left image describes the thermal bridges at the edge of the panel(TBE) and along the panel (TBA). The right image show a cross sectionof a twin pipe which also has a thermal bridge between the service pipes(TBT).
3.1 Finite element model for simulations on hybrid in-
sulation district heating twin pipes
A twin pipe in the ground can be modeled analytically with the multipole method as shown
by Wallenten (1991), although, the multipole method can only handle circular boundaries. For
hybrid insulation pipes with VIPs, the thermal bridge in the envelope will cross the circles and
is thereby not covered by the model. Finite difference is commonly used for heat simulations
in buildings, and has been used to model VIPs by for example Ghazi Wakili et al. (2004), and
Sprengard & Holm (2014). To use finite difference in a cylindrical geometry, some geometrical
transformation is needed. This has led to the choice of using the finite element method instead,
through the software Comsol multiphysics (2015), similar to the simulations by Dalla Rosa et al.
(2011) and Bøhm & Kristjansson (2005). A triangular mesh can give a good approximation of
a cylindrical geometry.
For most simulations a two dimensional model was used. Depending on the analysis, the ground
was modeled either as a square domain with adiabatic edges at all sides but upwards, or as a
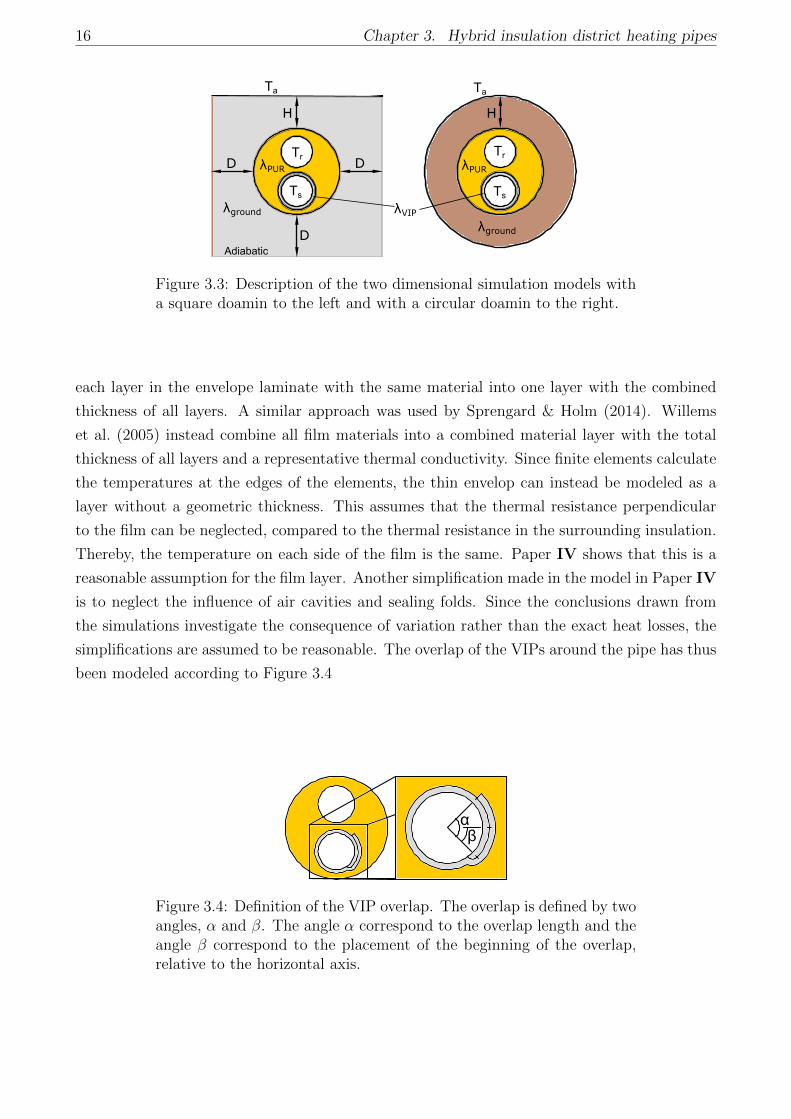
cylindrical domain surrounded by a ground surface boundary, as presented in Figure 3.3. The
implication of using the different models is discussed in Paper IV. In early simulations it was
seen that the temperature dependence of the thermal conductivities had a large impact on the
results. Especially since the introduction of the vacuum panel decreases the temperature of the
PUR, improving its thermal conductivity.
The main complication of the model is the thermal bridge through the envelope. A substantial
amount of modeling has been made for the heat flow through the edges of flat VIPs, using
some different assumptions and model simplifications. Ghazi Wakili et al. (2004) compile
16 Chapter 3. Hybrid insulation district heating pipes
Ta Ta
Ts
Tr
Ts
Tr
λground λVIP
λPUR λPUR
λground
H H
D
D
D
Adiabatic
Figure 3.3: Description of the two dimensional simulation models witha square doamin to the left and with a circular doamin to the right.
each layer in the envelope laminate with the same material into one layer with the combined
thickness of all layers. A similar approach was used by Sprengard & Holm (2014). Willems
et al. (2005) instead combine all film materials into a combined material layer with the total
thickness of all layers and a representative thermal conductivity. Since finite elements calculate
the temperatures at the edges of the elements, the thin envelop can instead be modeled as a
layer without a geometric thickness. This assumes that the thermal resistance perpendicular
to the film can be neglected, compared to the thermal resistance in the surrounding insulation.
Thereby, the temperature on each side of the film is the same. Paper IV shows that this is a
reasonable assumption for the film layer. Another simplification made in the model in Paper IV
is to neglect the influence of air cavities and sealing folds. Since the conclusions drawn from
the simulations investigate the consequence of variation rather than the exact heat losses, the
simplifications are assumed to be reasonable. The overlap of the VIPs around the pipe has thus
been modeled according to Figure 3.4
α
β
Figure 3.4: Definition of the VIP overlap. The overlap is defined by twoangles, α and β. The angle α correspond to the overlap length and theangle β correspond to the placement of the beginning of the overlap,relative to the horizontal axis.
3.2. Thermal performance 17
3.2 Thermal performance
Heat loss measurements are presented in Paper I for single pipes and in Paper II for twin
pipes. The heat losses have been measured with a guarded hot pipe apparatus based on the
standard measurement from SS-EN 253 (2009). The outcome of the standard measurement is
the thermal conductivity of the insulation material. In a hybrid insulation pipe, two materials
are used. So, the measured thermal conductivity is a representative value for the total thermal
resistance of the hybrid insulation. Thereby, the results are only representing the geometry of
the measured sample.
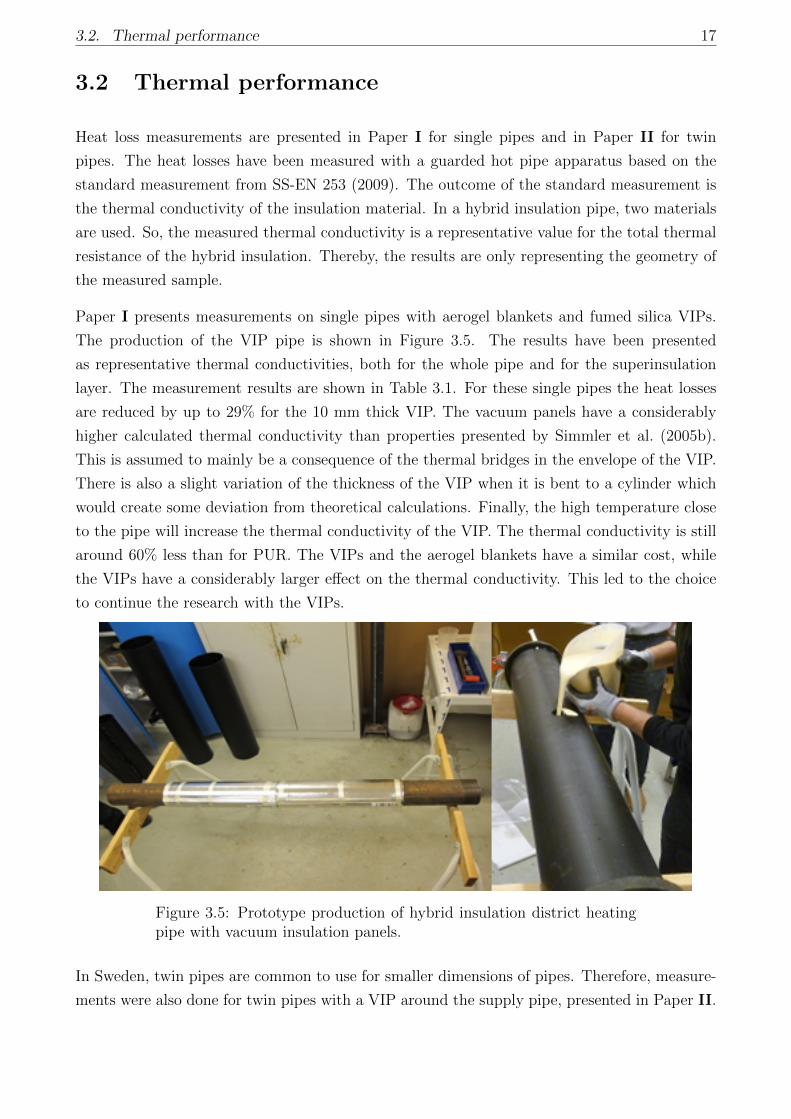
Paper I presents measurements on single pipes with aerogel blankets and fumed silica VIPs.
The production of the VIP pipe is shown in Figure 3.5. The results have been presented
as representative thermal conductivities, both for the whole pipe and for the superinsulation
layer. The measurement results are shown in Table 3.1. For these single pipes the heat losses
are reduced by up to 29% for the 10 mm thick VIP. The vacuum panels have a considerably
higher calculated thermal conductivity than properties presented by Simmler et al. (2005b).
This is assumed to mainly be a consequence of the thermal bridges in the envelope of the VIP.
There is also a slight variation of the thickness of the VIP when it is bent to a cylinder which
would create some deviation from theoretical calculations. Finally, the high temperature close
to the pipe will increase the thermal conductivity of the VIP. The thermal conductivity is still
around 60% less than for PUR. The VIPs and the aerogel blankets have a similar cost, while
the VIPs have a considerably larger effect on the thermal conductivity. This led to the choice
to continue the research with the VIPs.
Figure 3.5: Prototype production of hybrid insulation district heatingpipe with vacuum insulation panels.
In Sweden, twin pipes are common to use for smaller dimensions of pipes. Therefore, measure-
ments were also done for twin pipes with a VIP around the supply pipe, presented in Paper II.

18 Chapter 3. Hybrid insulation district heating pipes
Table 3.1: Apparent thermal conductivity of the prototype single pipes.The reduction is in comparison to the reference pipes.
Thermal conductivity ReductionSize [mW/(m·K)] [%]
Polyurehthane foam referencesReference DN 80/180 27.8 -Reference DN 100/225 27.8 -Production quality PUR - 26 -Whole pipes (compared to reference pipes)Vacuum insulation panel, 5mm DN 100/225 23.5 15Vacuum insulation panel, 10 mm DN 100/225 19.6 29Aerogel blanket, 10 mm DN 80/180 24.0 14Superinsulation layer (compared to production quality PUR)Vacuum insulation panel, 5 mm - 11.2 57Vacuum insulation panel, 10 mm - 10.3 61Aerogel blanket - 17.9 31
The twin pipes had the dimensions DN 2*80/315 with various thickness and overlap length of
the VIPs. The heat flows from the pipes were measured at temperature levels proportional to
those used in the simulations in Paper IV, which is based on typical grid temperatures. This
way, the relative performance can be compared. The results are shown in Table 3.2. The total
energy losses from the twin pipes are reduced by around 15% when hybrid pipes are compared
to conventional pipes with the same dimensions. But, the losses from the supply pipe was
reduced by up to 39%. This can be compared to the results from the simulations in Paper IV,
presented in Table 3.3. In the simulations, the VIP thickness is only 8 mm and 2 different
thermal conductivities have been used for the VIP envelope: λ05 and λ20 at 0.5 W/m·K and
20 W/m·K respectively . The overlap in the simulations were 45◦ of the circumference, close
to 35 mm.
Table 3.2: Heat losses from twin pipes measured with two heating rods,one in each service pipe. The temperatures were 80◦C in the supplypipe, 58◦C in the return pipe and 22.5◦C in the laboratory.
Heat flow [W] Reduction [%]Supply Return Total Supply Return Total
Reference 9.6 2.2 11.8 0 0 010 mm VIP, 0 mm overlap 6.8 3.5 10.4 29 -61 1210 mm VIP, 60 mm overlap 6.1 3.8 10.0 36 -74 1610 mm VIP, 100 mm overlap 6.0 3.8 9.7 38 -70 1815 mm VIP, 60 mm overlap 5.8 3.9 9.7 39 -78 17
3.3. Optimization of panel configuration 19
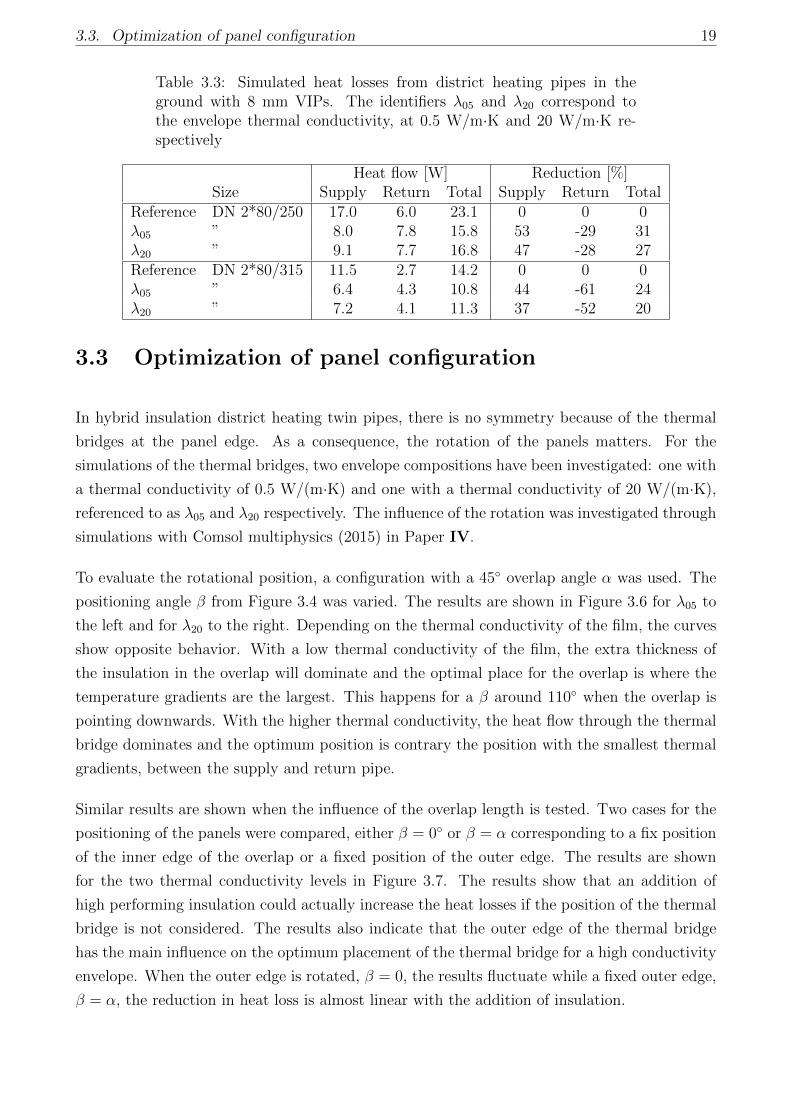
Table 3.3: Simulated heat losses from district heating pipes in theground with 8 mm VIPs. The identifiers λ05 and λ20 correspond tothe envelope thermal conductivity, at 0.5 W/m·K and 20 W/m·K re-spectively
Heat flow [W] Reduction [%]Size Supply Return Total Supply Return Total
Reference DN 2*80/250 17.0 6.0 23.1 0 0 0λ05 ” 8.0 7.8 15.8 53 -29 31λ20 ” 9.1 7.7 16.8 47 -28 27Reference DN 2*80/315 11.5 2.7 14.2 0 0 0λ05 ” 6.4 4.3 10.8 44 -61 24λ20 ” 7.2 4.1 11.3 37 -52 20
3.3 Optimization of panel configuration
In hybrid insulation district heating twin pipes, there is no symmetry because of the thermal
bridges at the panel edge. As a consequence, the rotation of the panels matters. For the
simulations of the thermal bridges, two envelope compositions have been investigated: one with
a thermal conductivity of 0.5 W/(m·K) and one with a thermal conductivity of 20 W/(m·K),
referenced to as λ05 and λ20 respectively. The influence of the rotation was investigated through
simulations with Comsol multiphysics (2015) in Paper IV.
To evaluate the rotational position, a configuration with a 45◦ overlap angle α was used. The
positioning angle β from Figure 3.4 was varied. The results are shown in Figure 3.6 for λ05 to
the left and for λ20 to the right. Depending on the thermal conductivity of the film, the curves
show opposite behavior. With a low thermal conductivity of the film, the extra thickness of
the insulation in the overlap will dominate and the optimal place for the overlap is where the
temperature gradients are the largest. This happens for a β around 110◦ when the overlap is
pointing downwards. With the higher thermal conductivity, the heat flow through the thermal
bridge dominates and the optimum position is contrary the position with the smallest thermal
gradients, between the supply and return pipe.
Similar results are shown when the influence of the overlap length is tested. Two cases for the
positioning of the panels were compared, either β = 0◦ or β = α corresponding to a fix position
of the inner edge of the overlap or a fixed position of the outer edge. The results are shown
for the two thermal conductivity levels in Figure 3.7. The results show that an addition of
high performing insulation could actually increase the heat losses if the position of the thermal
bridge is not considered. The results also indicate that the outer edge of the thermal bridge
has the main influence on the optimum placement of the thermal bridge for a high conductivity
envelope. When the outer edge is rotated, β = 0, the results fluctuate while a fixed outer edge,
β = α, the reduction in heat loss is almost linear with the addition of insulation.

20 Chapter 3. Hybrid insulation district heating pipes
-2%
-1%
0%
1%
2%
0 90 180 270 360
Heat lo
ss r
ela
tive t
o a
vera
ge
Rotation angle, β [°]
DN 2*25/140DN 2*80/250
DN 2*150/450
(λ05) (λ20)
-10%
-5%
0%
5%
10%
0 90 180 270 360
Heat lo
ss r
ela
tive t
o a
vera
ge
Rotation angle, β [°]
DN 2*25/140DN 2*80/250DN 2*150/450
Figure 3.6: The heat loss relative to the average for a variation in therotational position, β of the VIPs.
-35%
-30%
-25%
-20%
-15%
-10%
0 90 180 270 360
Rela
tive h
eat
loss, p
qto
t
Rotation, α [°]
DN 25 DN 25DN 80 DN 80DN 150 DN 150
-45%
-40%
-35%
-30%
-25%
-20%
-15%
0 90 180 270 360
Rela
tive h
eat
loss, p
qto
t
Rotation, α [°]
DN 25 DN 25DN 80 DN 80DN 150 DN 150
β = 0° β = α β = 0° β = α(λ05) (λ20)
Figure 3.7: The heat loss relative to a reference PUR pipe dependingon the length of the overlap.
3.4 Field measurements
Bøhm (2001) compares different methods to evaluate the heat losses from district heating pipes
in field. The ground surface temperature methods would be problematic for the hybrid pipe
measurements since we only have short distances of pipes. The rest of the pipe with conventional
insulation would influence the results. A heat flow meter could give good results of the total
losses but Bøhm (2001) points out some problems with calibration. Another problem with heat
flow measurements on the casing is that you cannot separate the losses from the supply pipes
and the return pipes. Therefore, thermocouples were used to measure the temperatures at
different positions through the pipe section. These measurements can later be fit to simulation
results in order to obtain the heat flows. The thermocouple measurements could also give point-
wise information on thermal performance which could be used to investigate the influence of
thermal bridges in the vacuum panel.
Two 6 m long sample pipes, of which half was insulated with VIPs and the other half was used as
reference, have been connected to the district heating network in Varberg on the Swedish west
coast. The network is a low temperature network with the maximum registered temperatures

3.4. Field measurements 21
below 90◦C. The position for the temperature measurements are shown in Figure 3.8, where S
and R represent the supply and return pipes, u, s and d represent the up, side and down position
around the pipe and VIP and PUR represent the hybrid insulation part (with VIPs) and the
reference part (with only PUR). In addition, the temperature in the measurement station has
been measured and is referred to as Ta. The temperatures have been measured on the outside
of the vacuum panel and at the same position in the middle of PUR for reference. From the
measured points and outwards, the pipes are identical. With a lower measured temperature,
there is a lower temperature gradient between the measurement point and the ground, and
thereby a lower heat loss.
s-VIP s-PUR
d-VIPS S
u-VIPR
u-PURR
u-VIPR
d-VIPS
s-VIP
DN 2*80/250 DN 2*25/140
Figure 3.8: Position of thermocouples in the field measurement pipes.Each point is measured in at least two positions along the pipe.
The thermal performance is indicated by the temperature difference between the temperature
on the VIP and the corresponding reference temperature. The resulting temperature measure-
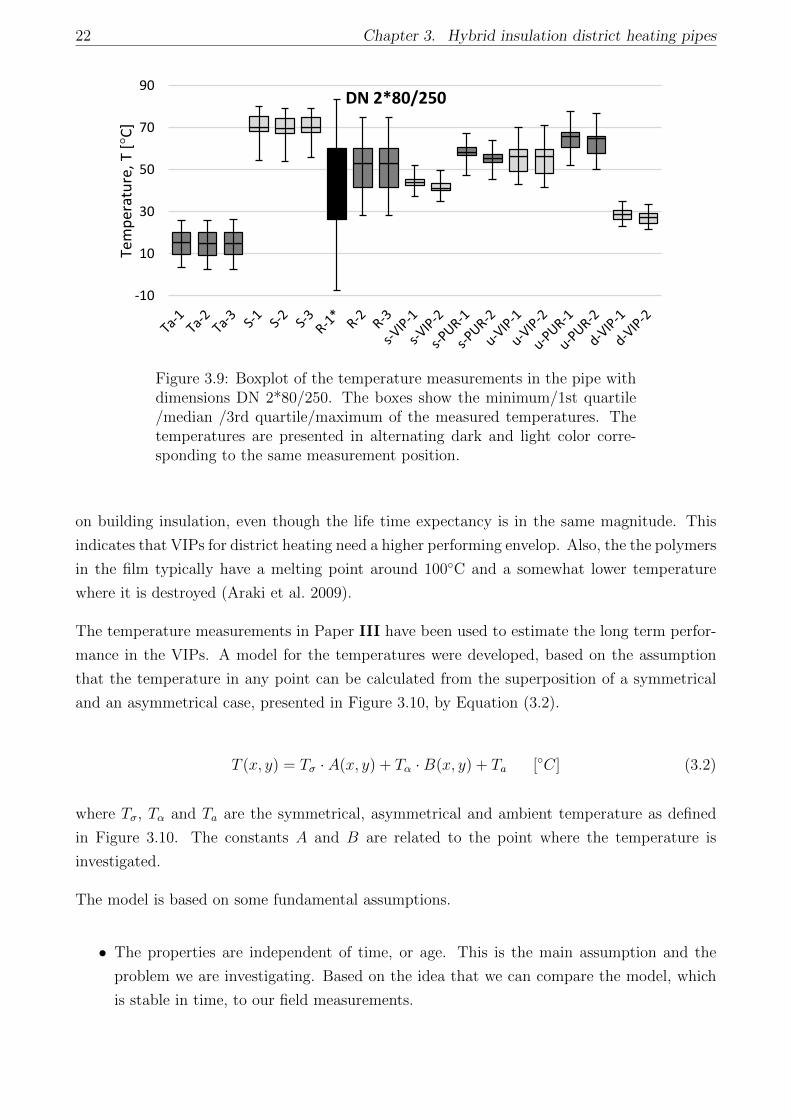
ments for one of the pipes are shown in Figure 3.9. The results are presented as a boxplot
showing the minimum/1st quartile/median/3rd quartile/maximum of the measured tempera-
ture. The thermocouple for position R-1 was damaged and thereby the box is filled. Otherwise,
the results show a considerably lower temperature on the backside of the VIPs compared to
the same position in the PUR. This means that the heat losses are less than for a conventional
PUR pipe. However, the magnitude of the difference in heat flow is complex to evaluate.
The temperatures in Figure 3.9 show good consistency between measurements at the same
position along the pipe. The measurements in PUR have larger variations, probably due to the
challenge of positioning the thermocouples at an exact position.
The thermal performance of VIPs depends on the ability of the VIP to separate the vacuum
from the surrounding. Simmler & Brunner (2005a) have tested the long term performance of
VIPs. They show that the pressure increasing rate increase considerably with temperature.
This correlates well with the effect predicted by the Arrhenius equation where the diffusion is
exponentially dependent on the temperature. The VIP can be parted into two diffusion paths:
through the surface of the envelope and through the seals of the envelope.
In a district heating pipe, the temperature will be high compared to the temperature load
22 Chapter 3. Hybrid insulation district heating pipes
-10
10
30
50
70
90
Tem
per
atu
re,
T [°
C]
DN 2*80/250
Figure 3.9: Boxplot of the temperature measurements in the pipe withdimensions DN 2*80/250. The boxes show the minimum/1st quartile/median /3rd quartile/maximum of the measured temperatures. Thetemperatures are presented in alternating dark and light color corre-sponding to the same measurement position.
on building insulation, even though the life time expectancy is in the same magnitude. This
indicates that VIPs for district heating need a higher performing envelop. Also, the the polymers
in the film typically have a melting point around 100◦C and a somewhat lower temperature
where it is destroyed (Araki et al. 2009).
The temperature measurements in Paper III have been used to estimate the long term perfor-
mance in the VIPs. A model for the temperatures were developed, based on the assumption
that the temperature in any point can be calculated from the superposition of a symmetrical
and an asymmetrical case, presented in Figure 3.10, by Equation (3.2).
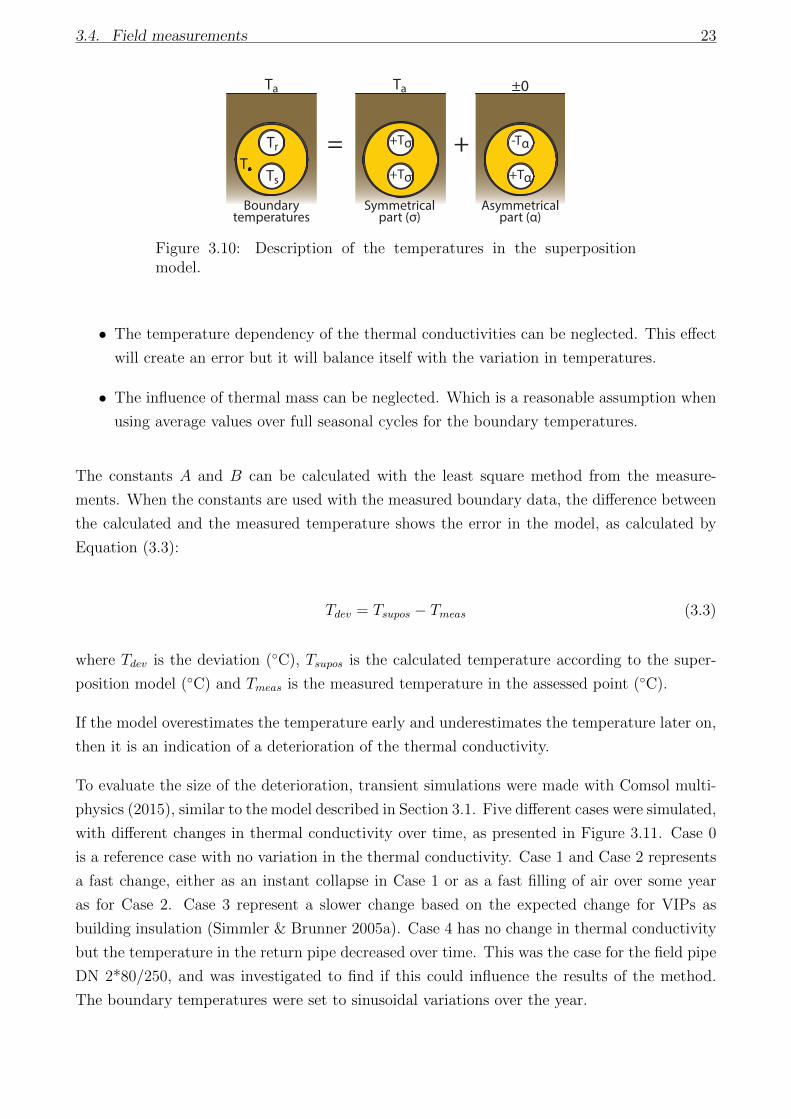
T (x, y) = Tσ · A(x, y) + Tα ·B(x, y) + Ta [◦C] (3.2)
where Tσ, Tα and Ta are the symmetrical, asymmetrical and ambient temperature as defined
in Figure 3.10. The constants A and B are related to the point where the temperature is
investigated.
The model is based on some fundamental assumptions.
• The properties are independent of time, or age. This is the main assumption and the
problem we are investigating. Based on the idea that we can compare the model, which
is stable in time, to our field measurements.
3.4. Field measurements 23
Tr
Ts
Ta
-Tα
±0
T
Boundary temperatures
Symmetrical part (σ)
Asymmetricalpart (α)
+Tα
Ta
+Tσ
+Tσ
= +
Figure 3.10: Description of the temperatures in the superpositionmodel.
• The temperature dependency of the thermal conductivities can be neglected. This effect
will create an error but it will balance itself with the variation in temperatures.
• The influence of thermal mass can be neglected. Which is a reasonable assumption when
using average values over full seasonal cycles for the boundary temperatures.
The constants A and B can be calculated with the least square method from the measure-
ments. When the constants are used with the measured boundary data, the difference between
the calculated and the measured temperature shows the error in the model, as calculated by
Equation (3.3):
Tdev = Tsupos − Tmeas (3.3)
where Tdev is the deviation (◦C), Tsupos is the calculated temperature according to the super-
position model (◦C) and Tmeas is the measured temperature in the assessed point (◦C).
If the model overestimates the temperature early and underestimates the temperature later on,
then it is an indication of a deterioration of the thermal conductivity.
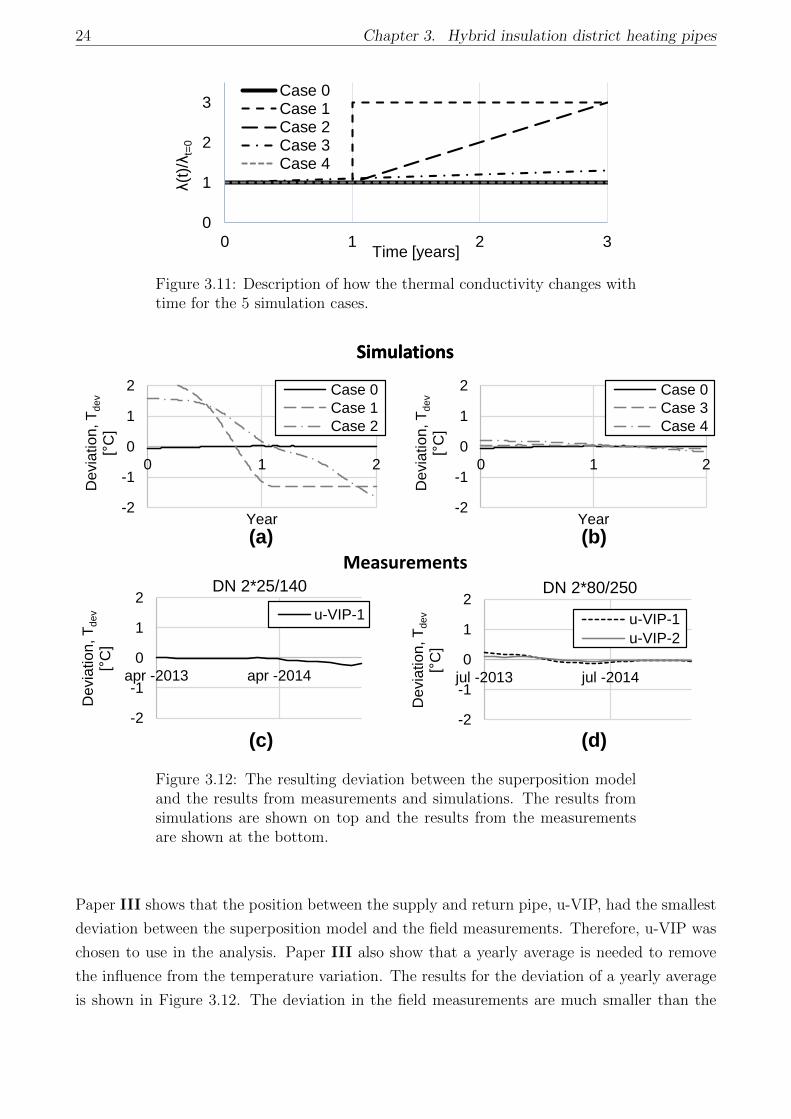
To evaluate the size of the deterioration, transient simulations were made with Comsol multi-
physics (2015), similar to the model described in Section 3.1. Five different cases were simulated,
with different changes in thermal conductivity over time, as presented in Figure 3.11. Case 0
is a reference case with no variation in the thermal conductivity. Case 1 and Case 2 represents
a fast change, either as an instant collapse in Case 1 or as a fast filling of air over some year
as for Case 2. Case 3 represent a slower change based on the expected change for VIPs as
building insulation (Simmler & Brunner 2005a). Case 4 has no change in thermal conductivity
but the temperature in the return pipe decreased over time. This was the case for the field pipe
DN 2*80/250, and was investigated to find if this could influence the results of the method.
The boundary temperatures were set to sinusoidal variations over the year.
24 Chapter 3. Hybrid insulation district heating pipes
0
1
2
3
0 1 2 3
λ(t
)/λ
t=0
Time [years]
Case 0Case 1Case 2Case 3Case 4
Figure 3.11: Description of how the thermal conductivity changes withtime for the 5 simulation cases.
Simulations
(a) (b)
(c) (d)
Measurements
Simulations
-2
-1
0
1
2
apr -2013 apr -2014
De
via
tio
n, T
de
v
[°C
]
DN 2*25/140
u-VIP-1
-2
-1
0
1
2
jul -2013 jul -2014
De
via
tio
n, T
de
v
[°C
]
DN 2*80/250
u-VIP-1
u-VIP-2
-2
-1
0
1
2
0 1 2
De
via
tio
n, T
de
v
[°C
]
Year
Case 0
Case 1
Case 2
-2
-1
0
1
2
0 1 2
De
via
tio
n, T
de
v
[°C
]
Year
Case 0
Case 3
Case 4
Figure 3.12: The resulting deviation between the superposition modeland the results from measurements and simulations. The results fromsimulations are shown on top and the results from the measurementsare shown at the bottom.
Paper III shows that the position between the supply and return pipe, u-VIP, had the smallest
deviation between the superposition model and the field measurements. Therefore, u-VIP was
chosen to use in the analysis. Paper III also show that a yearly average is needed to remove
the influence from the temperature variation. The results for the deviation of a yearly average
is shown in Figure 3.12. The deviation in the field measurements are much smaller than the
3.4. Field measurements 25
deviation in Case 1 and Case 2 which shows that no total collapse of the VIPs have occurred,
they are still in good condition. From Case 3 and Case 4 it is shown that a sinking temperature
in the return water would influence the model with a similar magnitude to a slower decrease
in the thermal conductivity. This means that a slower deterioration of the panels cannot be
detected by the model as it is.
Chapter 4
Nano-porous insulation in building
walls
Nano-porous thermal insulation can be used to lower the heat loss from buildings, when used
in place of conventional insulation types. Alternatively, the insulation can be used to decrease
the thickness of the building walls. This creates challenges where a decreased thickness gives
less space for structural elements in the building, also leading to a potentially larger thermal
bridge effect.
For a building with a temporary high heat load, the optimum insulation performance varies.
When heating is needed a low U-values is preferable and when cooling is needed a high U-value
is preferable as long as the outdoor air is colder than the indoor air. This has been investigated
theoretically by Hagentoft (2012) who shows that when the wall can change properties there
is almost no need for temperature control by the HVAC system. Many concepts have been
developed for adaptable facades, as presented by Loonen (2010), but few have been investigated
in research projects. One way to adjust the U-value would be to change the pressure in the
walls. Xenophou (1976) have patented a wall made up of cells which can be evacuated by a
vacuum pump. The problem with such solution is that a high quality vacuum is needed and
it is thus very sensitive to damages. Another concept is to have a metal hydride which can
absorb and release hydrogen (Meister et al. 1997, Benson et al. 1994). Since hydrogen has very
light molecules the thermal conductivity is high but when the hydrogen is adsorbed the thermal
conductivity is considerably reduced. However, that kind of system would have to deal with
the same challenge as for VIPs where the function would be ruined if air is permeated into the
insulation.
Another method to create a variable U-value would be to use nano-porous insulation within a
bag that can be evacuated and refilled. For nano-porous insulation a lower quality of vacuum
is needed to change the thermal conductivity, compared to insulation with larger pores, as
26
4.1. Wooden stud walls with aerogel blankets 27
presented in Chapter 2.
4.1 Wooden stud walls with aerogel blankets
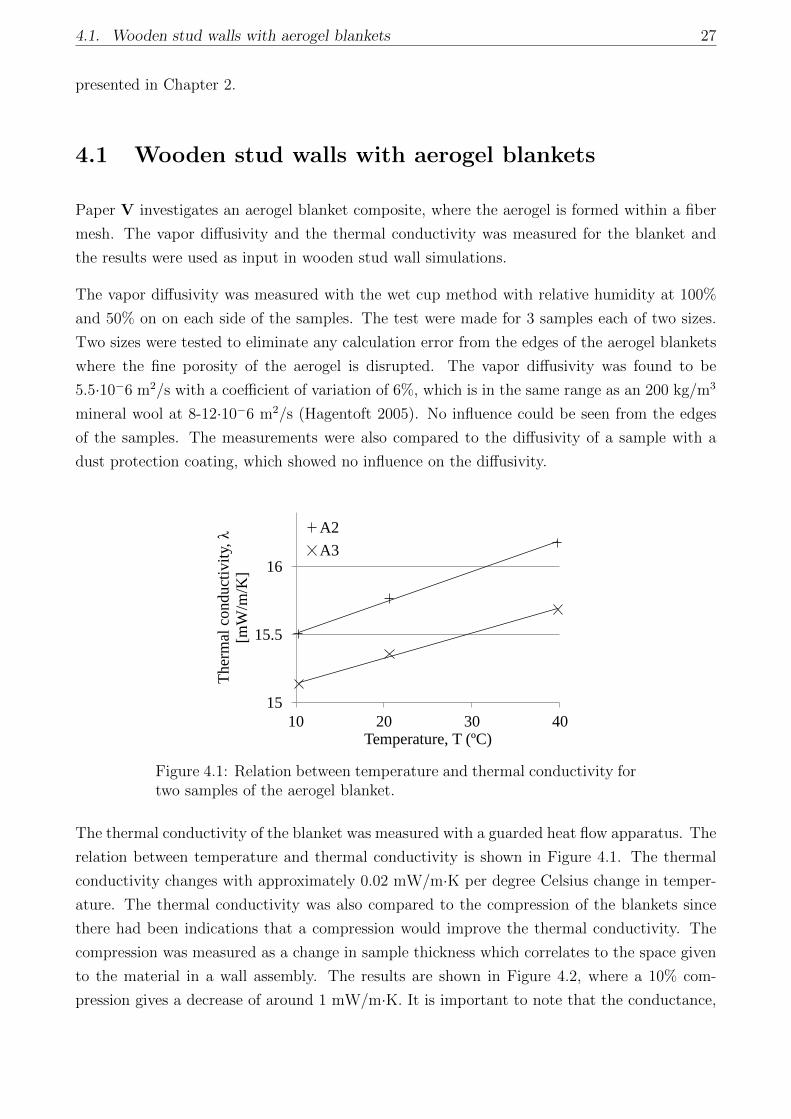
Paper V investigates an aerogel blanket composite, where the aerogel is formed within a fiber
mesh. The vapor diffusivity and the thermal conductivity was measured for the blanket and
the results were used as input in wooden stud wall simulations.
The vapor diffusivity was measured with the wet cup method with relative humidity at 100%
and 50% on on each side of the samples. The test were made for 3 samples each of two sizes.
Two sizes were tested to eliminate any calculation error from the edges of the aerogel blankets
where the fine porosity of the aerogel is disrupted. The vapor diffusivity was found to be
5.5·10−6 m2/s with a coefficient of variation of 6%, which is in the same range as an 200 kg/m3
mineral wool at 8-12·10−6 m2/s (Hagentoft 2005). No influence could be seen from the edges
of the samples. The measurements were also compared to the diffusivity of a sample with a
dust protection coating, which showed no influence on the diffusivity.
15
15.5
16
10 20 30 40
Ther
mal
conduct
ivit
y, λ
[mW
/m/K
]
Temperature, T (ºC)
A2
A3
Figure 4.1: Relation between temperature and thermal conductivity fortwo samples of the aerogel blanket.
The thermal conductivity of the blanket was measured with a guarded heat flow apparatus. The
relation between temperature and thermal conductivity is shown in Figure 4.1. The thermal
conductivity changes with approximately 0.02 mW/m·K per degree Celsius change in temper-
ature. The thermal conductivity was also compared to the compression of the blankets since
there had been indications that a compression would improve the thermal conductivity. The
compression was measured as a change in sample thickness which correlates to the space given
to the material in a wall assembly. The results are shown in Figure 4.2, where a 10% com-
pression gives a decrease of around 1 mW/m·K. It is important to note that the conductance,

28 Chapter 4. Nano-porous insulation in building walls
0.47
0.49
0.51
0.53
14.5
15
15.5
16
29 30 31 32 33
Ther
mal
co
ndu
ctan
ce, K
[W/m
2/K
]
Th
erm
al c
ond
uct
ivit
y, λ
[mW
/m/K
]
Measurement thickness, d [mm]
A1 λ10
A2 λ10
A3 λ10
A1 K10
A2 K10
A3 K10
Figure 4.2: Relation between mechanical compression (measured as athickness variation) and thermal conductivity for an aerogel blanket
related to the total heat flow through the material, increased. Compression will therefore lead
to worse performance per cost for the material.
432 256 263
13915
432
1398
Mineral wool
Aerogel blanket
Wall 1a Wall 1b Wall 2a Wall 2b255 265
Wall 3a Wall 3b
7 174545
Common dimensions for all walls [mm]
13
H1 H2
12045 25
45
Figure 4.3: Description of the different walls used in the simulations.All walls have a simulated U-value of 0.10 W/m2K.
The results from the measurements were used in numerical heat and moisture simulations.
Four aerogel blanket walls and two reference mineral wool walls were investigated, presented in
Figure 4.3. The thermal performance was investigated using steady-state simulations in Comsol
multiphysics (2015) and the thickness of the walls, the layers H1 and H2 in Figure 4.3, were
adjusted until all walls had a U-value of 0.10 W/m2K. The aerogel walls, with less than half the
thermal conductivity in the insulation, waere around 40% thinner than the conventional walls.

4.2. Effects from pressure changes in nano-porous insulation 29
The transient heat and moisture performance of the walls were simulated in Wufi2d (2015).
The results were analyzed with the mold growth potential model by Hukka & Viitanen (1999).
The results showed no greater risk of mold growth for an aerogel blanket compared to mineral
wool. The only places where the model reached critical condition was in the air cavity of wall
2a and 2b, where it is close to outdoor conditions and no outer homogeneous insulation layer.
Otherwise, the point where the outer wooden stud reach the service layer in the walls 2a and
3a has the highest mold growth potentials.
4.2 Effects from pressure changes in nano-porous insu-
lation
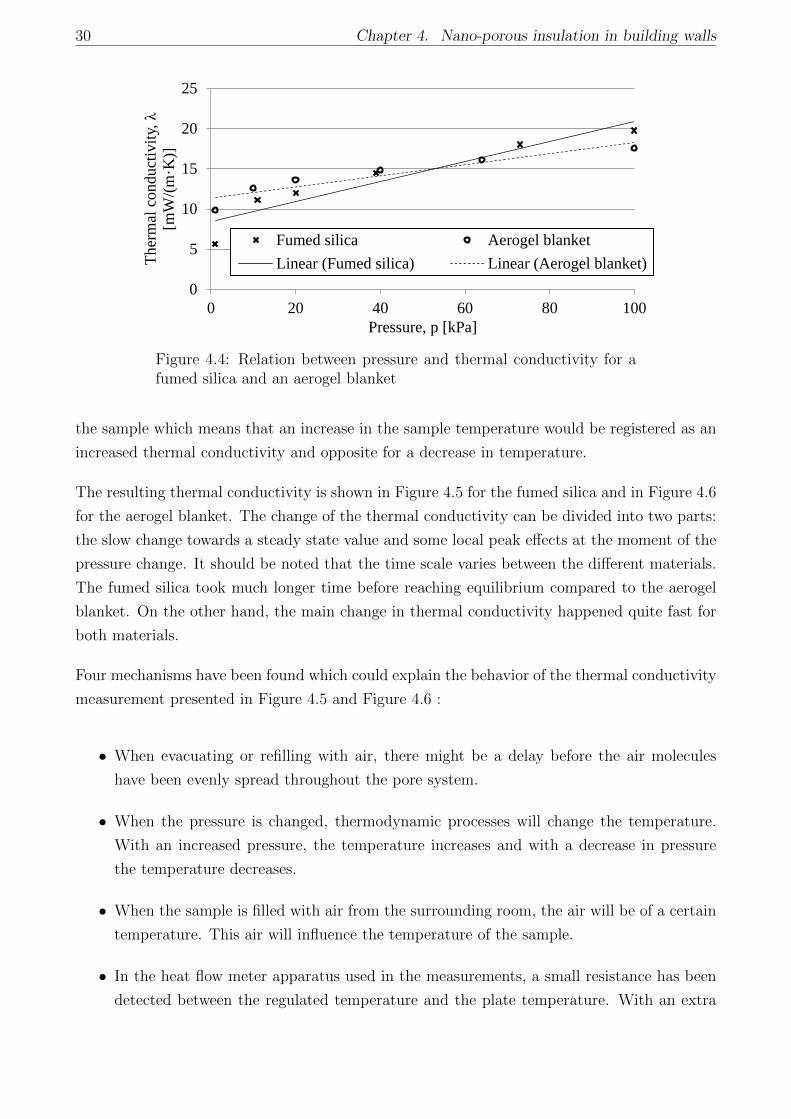
In Paper VI the relation between the pressure and the thermal conductivity for an aerogel
blanket and a fumed silica from a VIP has been investigated. The objective was to evaluate
the potential to use a pressure change to vary the thermal conductivity in the insulation. The
materials samples were put in a sealed plastic bag connected to a vacuum pump. The results
from steady state measurements are shown in Figure 4.4. The performance as switchable
insulation has been evaluated as a variation factor, ξ [-], defined as in Equation (4.1).
ξ =λp.maxλp.min
[−] (4.1)
where λp.max [W/m·K] and λp.min [W/m·K] are the thermal conductivity at atmospheric pres-
sure and at the minimal system pressure respectively. The variation factor was found to be
around 1.5 for the aerogel blanket and 2.6 for the fumed silica. This means that the fumed
silica can create a larger variation in the U-value of a wall. One reason for the results is that
the aerogel has a very low thermal conductivity already at atmospheric pressure. It should be
noted that neither of the materials were optimized for this kind of application.
The transient effects of a pressure change was also investigated. The thermal conductivity of
the samples of fumed silica and aerogel blankets was measured while the pressure was changed.
For an ideal situation, where the thermal conductivity of a material is changed instantly, the
heat flow measured through the material would change instantly as well. But, when air is
evacuated, the change is not instant but rather a diffusion process. At the same time, various
other effects might influence the measurement.
The presented varied thermal conductivity is a representative measurement calculated from
the heat flow. When the transient effects are taken into consideration it is important to know
how the heat flow meter is positioned. In these measurements it is placed on the cold side of
30 Chapter 4. Nano-porous insulation in building walls
0
5
10
15
20
25
0 20 40 60 80 100
Ther
mal
conduct
ivit
y, λ
[mW
/(m
·K)]
Pressure, p [kPa]
Fumed silica Aerogel blanket
Linear (Fumed silica) Linear (Aerogel blanket)
Figure 4.4: Relation between pressure and thermal conductivity for afumed silica and an aerogel blanket
the sample which means that an increase in the sample temperature would be registered as an
increased thermal conductivity and opposite for a decrease in temperature.
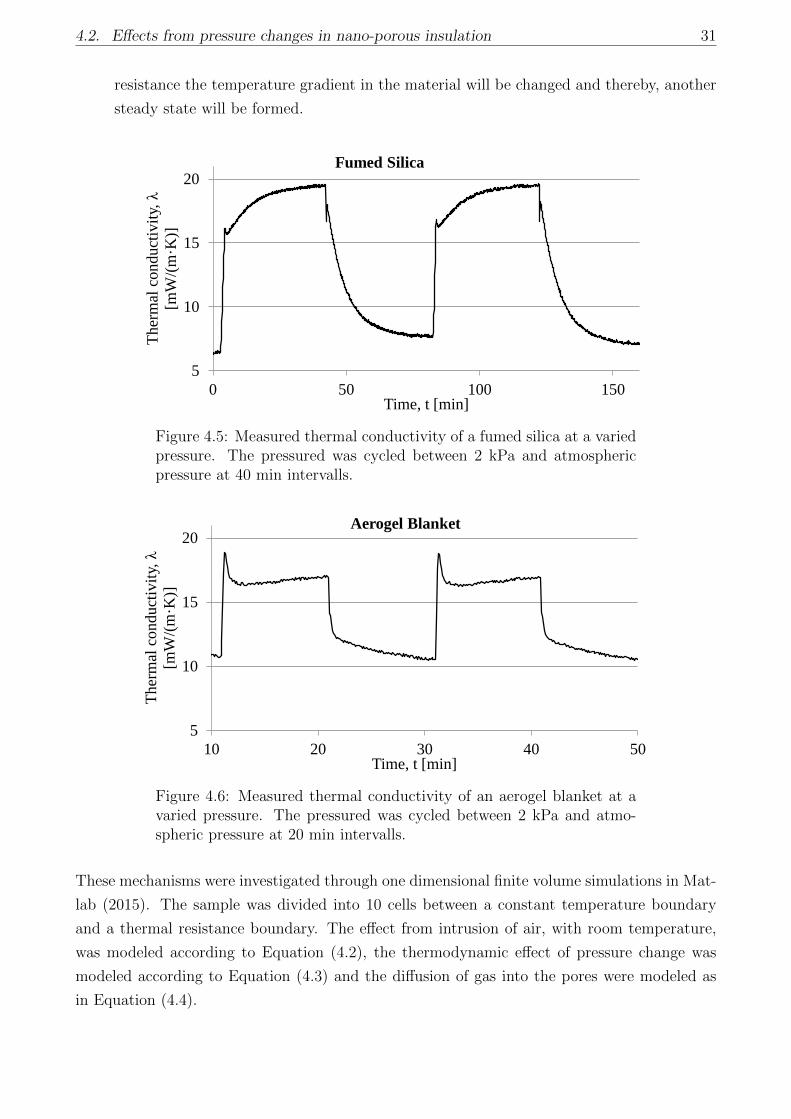
The resulting thermal conductivity is shown in Figure 4.5 for the fumed silica and in Figure 4.6
for the aerogel blanket. The change of the thermal conductivity can be divided into two parts:
the slow change towards a steady state value and some local peak effects at the moment of the
pressure change. It should be noted that the time scale varies between the different materials.
The fumed silica took much longer time before reaching equilibrium compared to the aerogel
blanket. On the other hand, the main change in thermal conductivity happened quite fast for
both materials.
Four mechanisms have been found which could explain the behavior of the thermal conductivity
measurement presented in Figure 4.5 and Figure 4.6 :
• When evacuating or refilling with air, there might be a delay before the air molecules
have been evenly spread throughout the pore system.
• When the pressure is changed, thermodynamic processes will change the temperature.
With an increased pressure, the temperature increases and with a decrease in pressure
the temperature decreases.
• When the sample is filled with air from the surrounding room, the air will be of a certain
temperature. This air will influence the temperature of the sample.
• In the heat flow meter apparatus used in the measurements, a small resistance has been
detected between the regulated temperature and the plate temperature. With an extra
4.2. Effects from pressure changes in nano-porous insulation 31
resistance the temperature gradient in the material will be changed and thereby, another
steady state will be formed.
5
10
15
20
0 50 100 150
Ther
mal
co
nduct
ivit
y, λ
[mW
/(m
·K)]
Time, t [min]
Fumed Silica
Figure 4.5: Measured thermal conductivity of a fumed silica at a variedpressure. The pressured was cycled between 2 kPa and atmosphericpressure at 40 min intervalls.
5
10
15
20
10 20 30 40 50
Ther
mal
conduct
ivit
y, λ
[mW
/(m
·K)]
Time, t [min]
Aerogel Blanket
Figure 4.6: Measured thermal conductivity of an aerogel blanket at avaried pressure. The pressured was cycled between 2 kPa and atmo-spheric pressure at 20 min intervalls.
These mechanisms were investigated through one dimensional finite volume simulations in Mat-
lab (2015). The sample was divided into 10 cells between a constant temperature boundary
and a thermal resistance boundary. The effect from intrusion of air, with room temperature,
was modeled according to Equation (4.2), the thermodynamic effect of pressure change was
modeled according to Equation (4.3) and the diffusion of gas into the pores were modeled as
in Equation (4.4).
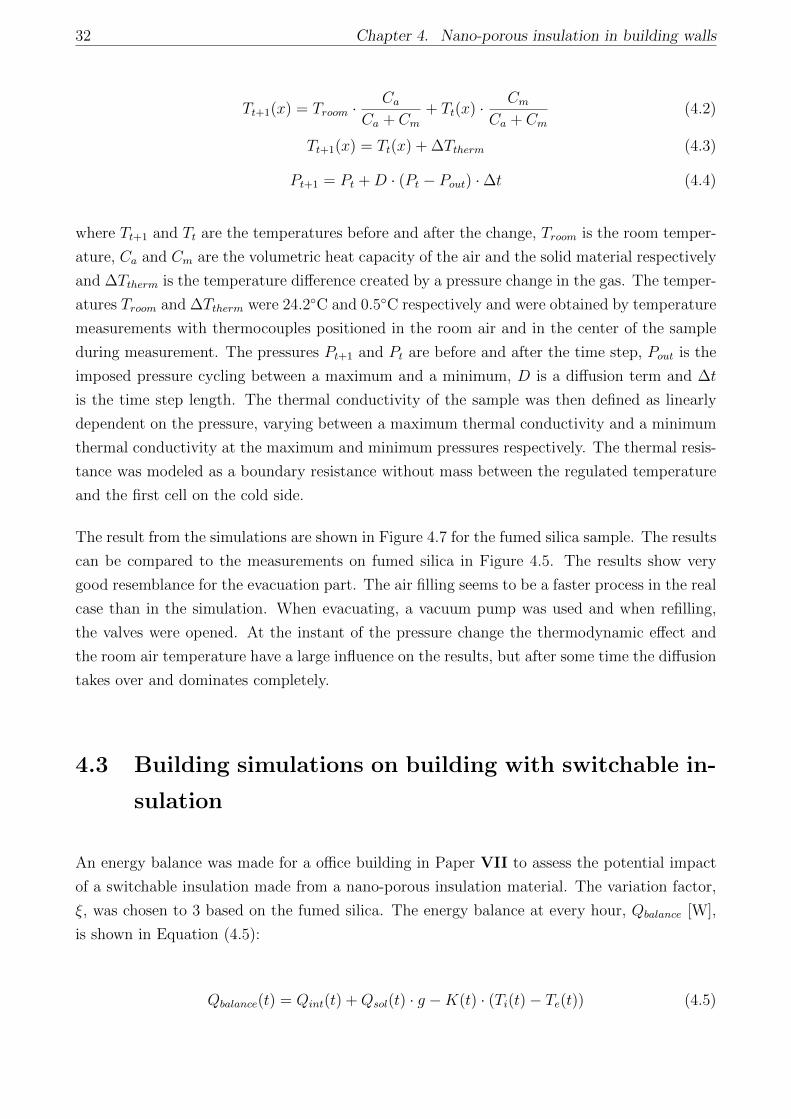
32 Chapter 4. Nano-porous insulation in building walls
Tt+1(x) = Troom ·Ca
Ca + Cm+ Tt(x) · Cm
Ca + Cm(4.2)
Tt+1(x) = Tt(x) + ∆Ttherm (4.3)
Pt+1 = Pt +D · (Pt − Pout) ·∆t (4.4)
where Tt+1 and Tt are the temperatures before and after the change, Troom is the room temper-
ature, Ca and Cm are the volumetric heat capacity of the air and the solid material respectively
and ∆Ttherm is the temperature difference created by a pressure change in the gas. The temper-
atures Troom and ∆Ttherm were 24.2◦C and 0.5◦C respectively and were obtained by temperature
measurements with thermocouples positioned in the room air and in the center of the sample
during measurement. The pressures Pt+1 and Pt are before and after the time step, Pout is the
imposed pressure cycling between a maximum and a minimum, D is a diffusion term and ∆t
is the time step length. The thermal conductivity of the sample was then defined as linearly
dependent on the pressure, varying between a maximum thermal conductivity and a minimum
thermal conductivity at the maximum and minimum pressures respectively. The thermal resis-
tance was modeled as a boundary resistance without mass between the regulated temperature
and the first cell on the cold side.
The result from the simulations are shown in Figure 4.7 for the fumed silica sample. The results
can be compared to the measurements on fumed silica in Figure 4.5. The results show very
good resemblance for the evacuation part. The air filling seems to be a faster process in the real
case than in the simulation. When evacuating, a vacuum pump was used and when refilling,
the valves were opened. At the instant of the pressure change the thermodynamic effect and
the room air temperature have a large influence on the results, but after some time the diffusion
takes over and dominates completely.
4.3 Building simulations on building with switchable in-
sulation
An energy balance was made for a office building in Paper VII to assess the potential impact
of a switchable insulation made from a nano-porous insulation material. The variation factor,
ξ, was chosen to 3 based on the fumed silica. The energy balance at every hour, Qbalance [W],
is shown in Equation (4.5):
Qbalance(t) = Qint(t) +Qsol(t) · g −K(t) · (Ti(t)− Te(t)) (4.5)
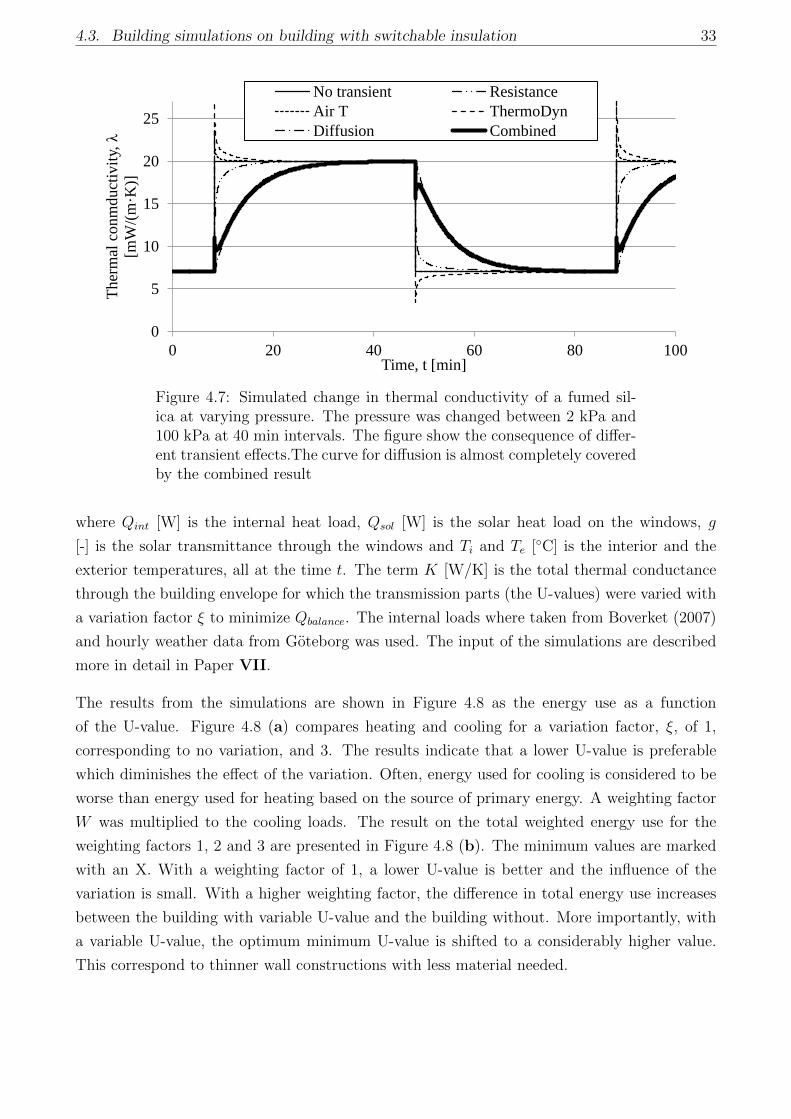
4.3. Building simulations on building with switchable insulation 33
0
5
10
15
20
25
0 20 40 60 80 100
Ther
mal
conm
duct
ivit
y, λ
[mW
/(m
·K)]
Time, t [min]
No transient Resistance
Air T ThermoDyn
Diffusion Combined
Figure 4.7: Simulated change in thermal conductivity of a fumed sil-ica at varying pressure. The pressure was changed between 2 kPa and100 kPa at 40 min intervals. The figure show the consequence of differ-ent transient effects.The curve for diffusion is almost completely coveredby the combined result
where Qint [W] is the internal heat load, Qsol [W] is the solar heat load on the windows, g
[-] is the solar transmittance through the windows and Ti and Te [◦C] is the interior and the
exterior temperatures, all at the time t. The term K [W/K] is the total thermal conductance
through the building envelope for which the transmission parts (the U-values) were varied with
a variation factor ξ to minimize Qbalance. The internal loads where taken from Boverket (2007)
and hourly weather data from Goteborg was used. The input of the simulations are described
more in detail in Paper VII.
The results from the simulations are shown in Figure 4.8 as the energy use as a function
of the U-value. Figure 4.8 (a) compares heating and cooling for a variation factor, ξ, of 1,
corresponding to no variation, and 3. The results indicate that a lower U-value is preferable
which diminishes the effect of the variation. Often, energy used for cooling is considered to be
worse than energy used for heating based on the source of primary energy. A weighting factor
W was multiplied to the cooling loads. The result on the total weighted energy use for the
weighting factors 1, 2 and 3 are presented in Figure 4.8 (b). The minimum values are marked
with an X. With a weighting factor of 1, a lower U-value is better and the influence of the
variation is small. With a higher weighting factor, the difference in total energy use increases
between the building with variable U-value and the building without. More importantly, with
a variable U-value, the optimum minimum U-value is shifted to a considerably higher value.
This correspond to thinner wall constructions with less material needed.

34 Chapter 4. Nano-porous insulation in building walls
0
50
100
150
200
0 0.1 0.2 0.3 0.4 0.5 0.6
Wei
ghte
d e
ner
gy u
se (
kW
h/m
2)
Minimum Uwall (W/m2·K)
b
ξ=1 W =3 ξ=3 W=3
ξ=1 W =2 ξ=3 W =2
ξ=1 W =1 ξ=3 W =1
0
50
100
0 0.1 0.2 0.3 0.4 0.5 0.6
En
ergy u
se(k
Wh/m
2)
Minimum Uwall (W/(m2·K))
aHeating ξ=1 & ξ=3Cooling ξ=1 (constant)Cooling ξ=3
Figure 4.8: Effect of a variable U-value in an office building. In (a)the heating is compared to the cooling and in (since the minimum U-value have been used as baseline for the variation, the heating nergyuse ios independent of the variation) (b) different weighting factors forthe weighted relation between cooling energy and heating energy ispresented.

Chapter 5
Conclusion
This thesis has been divided into two main themes: hybrid insulation district heating pipes and
nano-porous insulation in building walls. It is shown that the use of VIPs in district heating
pipes is a plausible method to reduce the heat losses from the pipes without increasing their
thickness. The results for the investigated wall solutions are further from implementation but
the studies indicate some possible positive effects. The main conclusions of the thesis are:
• When VIPs are used in hybrid insulation district heating pipes, a reduction of the heat
losses in the range of 30% can be expected when compared to conventional pipes of the
same dimension. For the supply pipe heat losses of twin pipes, the improvement is even
higher, up to around 50%, at a cost of an increase in the return pipe losses.
• How the thermal bridges of the VIP are positioned in a twin pipe has a large influence
on the thermal performance. With a high thermal conductivity in the vacuum envelop,
the variation is 20% between the best and the worst position. The position of the outer
edge of the overlap was shown to be crucial for the thermal performance.
• After three years of field measurements on pipes connected to a district heating network
with temperatures up to 90◦C, there is yet no sign of a collapse of the VIPs. A su-
perposition model has been developed to evaluate the deterioration of the VIPs. The
model showed that a slow deterioration cannot be ruled out, but the model could not
differentiate it from other variations in the system.
• When aerogel blankets were investigated for use in load bearing wooden stud walls with a
U-value of 0.1 W/m2K, the thickness could be reduced by 40%. Furthermore, the effect of
the thermal bridge through the studs increase with thinner walls. Numerical simulations
also showed that the thermal bridge of the studs, in the thinner aerogel walls, could create
a higher risk of mold growth inside the wall.
35

36 Chapter 5. Conclusion
• Measurements of the thermal conductivity was made on a fumed silica sample and an
aerogel blanket sample at different pressures. The variation between the thermal conduc-
tivity at atmospheric pressure and the minimum pressure (around 1 kPa), were in the
size range of 1.5 for the aerogel blanket and 3 for the fumed silica.
• When the pressure was varied in a fumed silica sample and an aerogel blanket sample, five
effects were investigated to see how they influenced the measurements. In a short time
perspective, the change in temperature from pumping in air and changing the pressure
seemed to dominate the change in heat flow. In a longer time perspective some kind of
diffusion process seemed to dominate.
• The simulations of energy use in an office building indicated that, in a cold climate, a
lower U-value is more important than a variable U-value for the tested magnitude of
variation factors. When cooling was weighted as more energy demanding than heating
the benefit of variability increased. Moreover, for this case, the optimal U-value of the
walls increased, meaning thinner walls were more beneficial.
Chapter 6
Future work
The concepts for using nano-porous thermal insulation, presented in this thesis, demand more
research before they can be implemented. Some suggestions for the next step of the research is
presented here.
Hybrid insulation district heating pipes:
• The durability of the VIPs at district heating temperature have to be more thoroughly
investigated to be able to guarantee their service life. Long time/high temperature tests
of hybrid insulation pipes have already been initiated. The pipes have been mounted in a
rig where hot oil is circulated through the service pipe and the temperature on the back
of the panels have been measured continuously. The measurements have been running
for approximately 3 years and the results need an in depth analysis.
• The high temperature measurements can be complemented by the ongoing field measure-
ments. So far they have been registering the temperatures for more than 3 years. As long
as the measurements are active they will give continuous information of the panels long
term performance.
• At the, moment every new measurement on district heating pipes with VIPs have been
using the latest development of the panels, few measurements have used the same panels.
To get knowledge of the average thermal performance and the variation, more samples
need to be measured for a statistical analysis.
• The results from the simulations can be used to show th e prospect of the technology. To
use it for more exact design it would have to be validated against measurements. The
effect of the thermal bridges through the envelope of the VIPs could be measured from
carefully planned laboratory measurements on pipes with a well known layout.
37
38 Chapter 6. Future work
• It would be useful to be able to assess the performance of the VIPs with one single
measurement, instead of using long time continuous measurements. Therefore, there is a
need to investigate new potential technology for performance measurements.
Nano-porous insulation in building walls:
• For variable insulation, the magnitude of the variation factor is the central property. This
thesis presents measurements on two materials which are already in production. It would
be interesting to try to make a theoretical investigation of the largest possible variation
factor that could be obtained for pressure regulated nano-porous insulation. This could
give information on what kind of material to try to produce and show the potential limits
of the concept.
• The presented measurements have all been on material level. A natural next step would
be to try and develop a solution on component level. A component would add some extra
layers of complexity which could influence the performance, such as thermal bridges.
• One crucial point of the variable insulation system is the energy needed to pump out
air, both to evacuate the panels and also to keep them evacuated. The optimal rela-
tion between the system diffusion tightness and needed pump energy would have to be
investigated.
• If further research on variable insulation show promise, it would be necessary to investigate
it in a building system. A variety of different properties would have to be tested, such
as: acoustics and durability of the diffusion barrier.
Bibliography
Araki, K., Kamoto, D. & Matsuoka, S. (2009), ‘Optimization about multilayer laminated filmand getter device materials of vacuum insulation panel for using at high temperature’, Journalof Materials Processing Technology 209(1), 271 – 282.
Baetens, R., Jelle, B. & Gustavsen, A. (2010a), ‘Aerogel insulation for building applications:A state-of-the-art review’, Energy and Buildings 43, 761–769.
Benson, D. K., Potter, T. F. & Tracy, C. E. (1994), Design of a variable-conductance vacuuminsulation, Technical report, SAE Technical Paper.
Bøhm, B. (2001), ‘Experimental Determination of Heat Losses from Buried District HeatingPipes in Normal Operation’, Heat Transfer Engineering 22(3), 41–51.
Bøhm, B. & Kristjansson, H. (2005), ‘Single, twin and triple buried heating pipes: on potentialsavings in heat losses and costs’, International Journal of Energy Research 29(14), 1301–1312.
Boverket (2007), Indata for energiberakningar i kontor och smahus, en sammanstallning avbrukarrelaterad indata for elanvandning, personvarme och tappvarmvatten., Boverket, Karl-skrona.
Brunner, S. & Simmler, H. (2008), ‘In situ performance assessment of vacuum insulation panelsin a flat roof construction’, Vacuum 82(7), 700–707.
Caps, R. & Fricke, J. (2000), ‘Thermal conductivity of opacified powder filler materials forvacuum Insulations’, International Journal of Thermophysics 21(2), 445–452.
Comsol multiphysics (2015), ‘COMSOL Multiphysics Modeling Software’.URL: www.comsol.com
Dalla Rosa, A., Li, H. & Svendsen, S. (2011), ‘Method for optimal design of pipes for low-energydistrict heating, with focus on heat losses’, Energy 36(5), 2407–2418.
Ebert, H.-P. (2011), Thermal properties of aerogel, in ‘Aerogels Handbook’, Springer New York,New York, NY, pp. 537 – 563.
Fricke, J., Lu, X., Wang, P., Buttner, D. & Heinemann, U. (1992), ‘Optimization of monolithicsilica aerogel insulants’, International journal of heat and mass transfer 35(9), 2305–2309.
Ghazi Wakili, K., Bundi, R. & Binder, B. (2004), ‘Effective thermal conductivity of vacuuminsulation panels’, Building Research & Information 32(4), 293–299.
Ghazi Wakili, K., Stahl, T. & Brunner, S. (2011), ‘Effective thermal conductivity of a staggereddouble layer of vacuum insulation panels’, Energy and Buildings 43(6), 1241–1246.
39
40 BIBLIOGRAPHY
Haavi, T., Jelle, B. P. & Gustavsen, A. (2012), ‘Vacuum insulation panels in wood frame wallconstructions with different stud profiles’, Journal of Building Physics 36(2), 212–226.
Hagentoft, C.-E. (2005), Introduction to building physics, Studentlitteratur, Lund, Sweden.
Hagentoft, C.-E. (2012), Potential impact on innovative and active building envelope compo-nents and materials, in ‘Proceedings of the 5th IBPC’, Kyoto, Japan, pp. 309–315.
Hukka, E. & Viitanen, H. (1999), ‘A mathematical model of mould growth on wooden material’,Wood Science and Technology 33.
Hummer, E., Rettelbach, T., Lu, X. & Fricke, J. (1993), ‘Opacified silica aerogel’, Thermochim-ica Acta 218, 269–276.
Johansson, P., Hagentoft, C.-E. & Sasic Kalagasidis, A. (2014), ‘Retrofitting of a listed brick andwood building using vacuum insulation panels on the exterior of the facade: Measurementsand simulations’, Energy and Buildings 73, 92–104.
Kistler, S. S. (1931), ‘Coherent expanded aerogels and jellies’, Nature 127, 741.
Kistler, S. S. & Caldwell, A. G. (1934), ‘Thermal conductivity of aerogels’, Journal of Industrialand Engineering Chemistry 26(6), 658–662.
Loonen, R. (2010), Climate Adaptive Building Shells, Master of science thesis, TU Eindhoven,Eindhoven, Netherlands.
Matlab (2015), ‘Matlab’.URL: http://se.mathworks.com/products/matlab/
Meister, M., Horn, R., Hetfleisch, J., Caps, R. & Fricke, J. (1997), Switchable thermal insulationfor solar heating, in ‘Thermal conductivity 24/Thermal Expansion 12’, Technomic PublishingCompany Inc., Lancaster, USA, pp. 417–427.
Nilsson, O., Fransson, A. & Sandberg, O. (1986), Thermal properties of silica aerogel, in‘Aerogels’, number 6 in ‘Springer Proceedings in Physics’, Springer-Verlag, Berlin, pp. 121–132.
Pietruszka, B., Babinska, J. & Gerylo, R. (2012), Aerogel-based thermal insulation materials -structure and properties, in ‘Proceedings of the 5th IBPC’, Kyoto, pp. 117–123.
Pietruszka, B. & Gerylo, R. (2010), Implementation of nanoporous thermal insulations toimprove the energy efficiency of curtain walling structures, in ‘Proceedings of the 10th in-ternational conference on modern building materials, structures and techniques’, VilniusGediminas Technical University, Lithuania, pp. 255–258.
Reidhav, C. & Werner, S. (2008), ‘Profitability of sparse district heating’, Applied Energy85(9), 867–877.
Reim, M., Korner, W., Manara, J., Korder, S., Arduini-Schuster, M., Ebert, H.-P. & Fricke,J. (2005), ‘Silica aerogel granulate material for thermal insulation and daylighting’, SolarEnergy 79(2), 131 – 139. {CISBAT} 03: Innovation in Building Envelopes and EnvironmentalSystems.
BIBLIOGRAPHY 41
Reim, M., Reichenauer, G., Korner, W., Manara, J., Arduini-Schuster, M., Korder, S., Beck,A. & Fricke, J. (2004), ‘Silica-aerogel granulate: Structural, optical and thermal properties’,Journal of non-crystalline solids 350, 358–363.
Rubin, M. & Lampert, C. (1983), ‘Transparent silica aerogels for window insulation’, SolarEnergy Materials 7(4), 393–400.
Scheuerpflug, P., Caps, R., Buttner, D. & Fricke, J. (1985), ‘Apparent thermal conductivity ofevacuated SiO2-aerogel tiles under variation of radiative boundary conditions’, Internationaljournal of heat and mass transfer 28(12), 2299–2306.
Schreiber, E., Boy, E. & Bertsch, K. (1986), Aerogel as a transparent thermal insulation materialfor buildings, in ‘Aerogels’, number 6 in ‘Springer Proceedings in Physics’, Springer-Verlag,Berlin, pp. 133–139.
Schwab, H., Heinemann, U., Beck, A., Ebert, H.-P. & Fricke, J. (2005), ‘Permeation of DifferentGases Through Foils used as Envelopes for Vacuum Insulation Panels’, Journal of BuildingPhysics 28(4), 293–317.
Simmler, H. & Brunner, S. (2005a), ‘Vacuum insulation panels for building application’, Energyand Buildings 37(11), 1122–1131.
Simmler, H., Brunner, S., Heinemann, U., Schwab, H., Kumaran, K., Qunard, D., Sallee,H., Noller, K., Kucukpinar-Niarchos, E., Stramm, C., Tenpierik, M., Cauberg, H. & Erb, M.(2005b), Study on VIP-components and Panels for Service Life Prediction of VIP in BuildingApplications (Subtask A), Technical report, IEA/ECBCS Annex 39.
Spagnol, S., Lartigue, B., Trombe, A. & Despetis, F. (2009), ‘Experimental Investigationson the Thermal Conductivity of Silica Aerogels by a Guarded Thin-Film-Heater Method’,Journal of Heat Transfer 131(7), 074501.
Sprengard, C. & Holm, A. H. (2014), ‘Numerical examination of thermal bridging effects atthe edges of vacuum-insulation-panels (VIP) in various constructions’, Energy and Buildings85, 638–643.
SS-EN 253 (2009), District heating pipes - Preinsulated bonded pipe systems for directly buriedhot water networks - Pipe assembly of steel service pipe, polyurethane thermal insulationand outer casing of polyethylene, Standard 253:2009, Swedish standards institute.
Statistics Sweden (2013), El-, gas- och fjarrvarmeforsorjningen 2013. Slutlig statistik, TechnicalReport SM1401.
Svendsen, S. (1992), ‘Solar collector with monolithic silica aerogel’, Journal of non-crystallinesolids 145, 240–243.
Tamon, H., Sone, T. & Okazaki, M. (1997), ‘Control of Mesoporous Structure of Silica AerogelPrepared from TMOS’, Journal of Colloid and Interface Science 188(1), 162–167.
Tenpierik, M. & Cauberg, H. (2007), ‘Analytical Models for Calculating Thermal Bridge Ef-fects Caused by Thin High Barrier Envelopes around Vacuum Insulation Panels’, Journal ofBuilding Physics 30(3), 185–215.
42 BIBLIOGRAPHY
Tillotson, T. M. & Hrubesh, L. W. (1992), ‘Transparent Ultralow-density silica aerogels pre-pared by a two-step sol-gel process’, Journal of non-crystalline solids 145, 44–50.
Wallenten, P. (1991), Steady-State heat loss from insulated pipes, Technical Report TVBH-3017, Lund Institute of Technology, Lund, Sweden.
Willems, W., Schild, K. & Hellinger, G. (2005), Numerical investigation on thermal bridgeeffects in vacuum insulating elements, in ‘7th international vacuum insulation symposium’,Zurich, Switzerland.
Wufi2d (2015), ‘Wufi 2d’.URL: https://wufi.de/en
Xenophou, T. (1976), ‘System of using vacuum for controlling heat transfer in building struc-tures, motor vehicles and the like’.
Zinko, H., Bøhm, B., Ottosson, U., Rama, M. & Sipila, K. (2008), District heating in areaswith low heat demand density, Technical Report 8DHC-08-03, IEA-DHC.


