S1
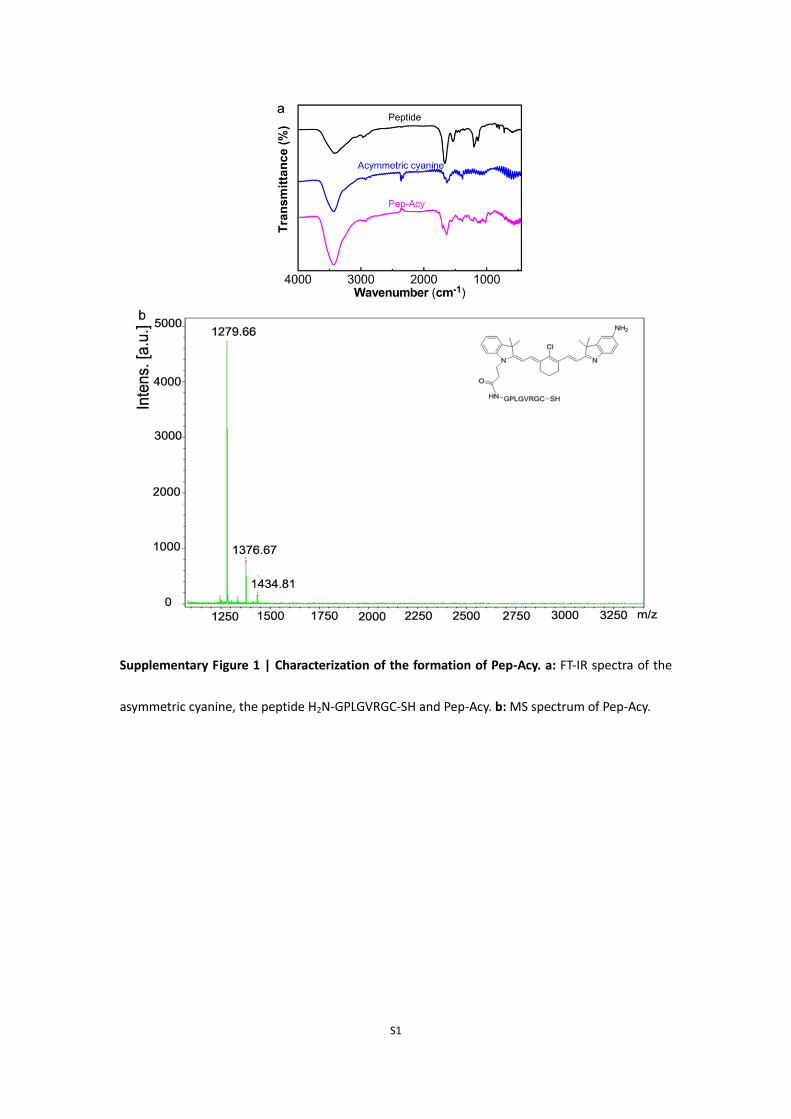
Supplementary Figure 1 | Characterization of the formation of Pep-Acy. a: FT-IR spectra of the
asymmetric cyanine, the peptide H2N-GPLGVRGC-SH and Pep-Acy. b: MS spectrum of Pep-Acy.

S2
Supplementary Figure 2 | Characterization of the formation of Glu-SH. a: FT-IR spectra of
glucosamine hydrodhloride, 11-mecaptoundecanoic acid and Glu-SH. b: 1H NMR spectrum of
Glu-SH. c: HRMS spectrum of Glu-SH.

S3
Supplementary Figure 3 | Characterization of AuNRs before and after functionalization. a and b:
TEM images of CTAB@AuNRs (Scale bar, 100 nm. Inset is enlarged image and the scale bar is 20
nm) and Pep-Acy@AuNRs (Scale bar, 20 nm), respectively. c and d: The particle size distribution
of CTAB@AuNRs calculated from 100 randomly selected nanorods in TEM images. e: UV-vis-NIR
absorption spectra of CTAB@AuNRs and Pep-Acy@AuNRs at pH 7.4.
S4
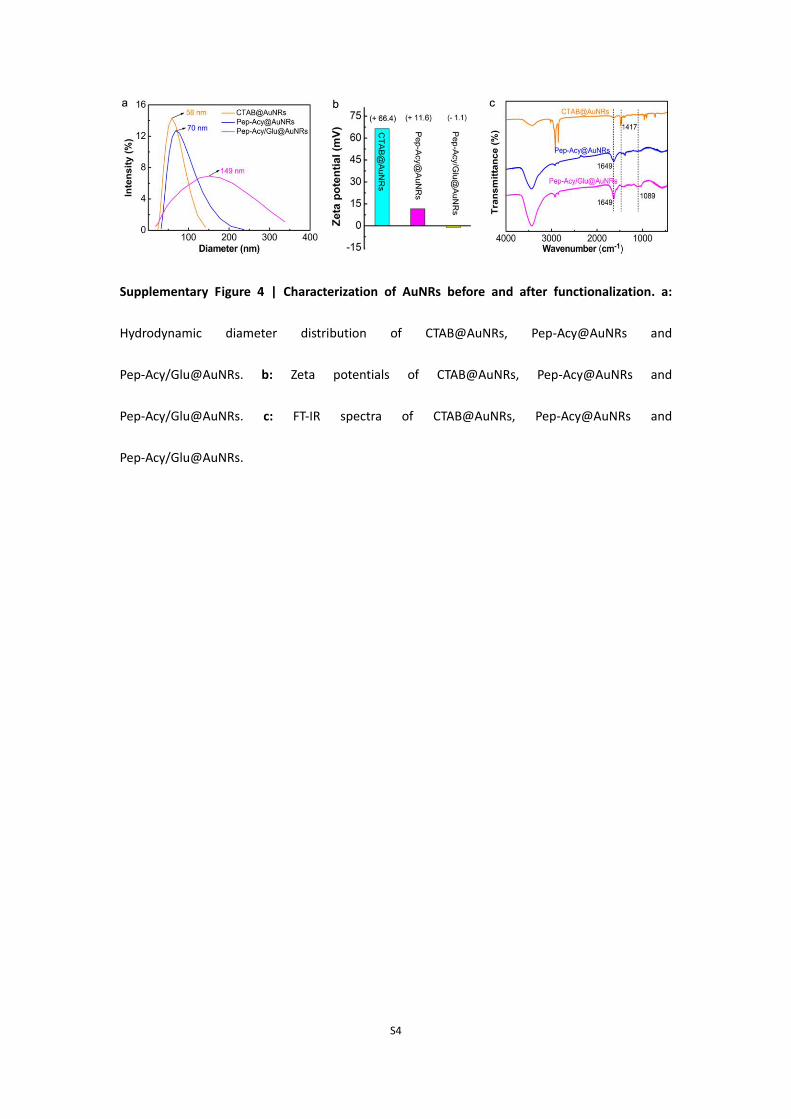
Supplementary Figure 4 | Characterization of AuNRs before and after functionalization. a:
Hydrodynamic diameter distribution of CTAB@AuNRs, Pep-Acy@AuNRs and
Pep-Acy/Glu@AuNRs. b: Zeta potentials of CTAB@AuNRs, Pep-Acy@AuNRs and
Pep-Acy/Glu@AuNRs. c: FT-IR spectra of CTAB@AuNRs, Pep-Acy@AuNRs and
Pep-Acy/Glu@AuNRs.

S5
Supplementary Figure 5 | UV-vis-NIR absorption spectra of Pep-Acy at pH 6.0 and 7.4. The
prepared Pep-Acy showed a characteristic absorption peak at ca. 525 nm at pH 7.4 (in its base
form), and gave a reduced absorption peak at 525 nm and a new absorption peak at ca. 790 nm
with a shoulder peak at ca. 700 nm at pH 6.0 due to the transition of the Pep-Acy from its base to
acid form.

S6
Supplementary Figure 6 | Stability of Pep-Acy/Glu@AuNRs. a: UV-vis-NIR absorption spectra of
Pep-Acy/Glu@AuNRs before and after incubation with a complex physiological medium
(Dulbecco’s modified Eagle’s medium (DMEM) with 10% fetal bovine serum (FBS)). b: TEM image
of Pep-Acy/Glu@AuNRs after incubation with DMEM with 10% FBS (Scale bar, 20 nm).

S7
Supplementary Figure 7 | Quantification of Acy on the surface of AuNRs. a: UV-vis absorption
spectra of Acy at different concentrations at pH 7.4. b: Calibration curve (Absorbance at 525 nm
against the concentration of Acy) for quantification of Acy at pH 7.4.

S8
Supplementary Figure 8 | Effect of DTT on the fluorescence of Pep-Acy/Glu@AuNRs. a:
Fluorescence spectra of Pep-Acy/Glu@AuNRs before and after adding DTT at pH 6.0 or pH 7.4. b:
NIR fluorescence imaging of Pep-Acy/Glu@AuNRs before and after adding DTT at different pH
values.

S9
Supplementary Figure 9 | Fluorescence analysis of MMPs activation of Pep-Acy/Glu@AuNRs. a:
Responses of the fluorescence spectra of Pep-Acy/Glu@AuNRs (60 μg mL-1, as Au) to multiple
types of MMPs (100 nM) and pH (pH 6.0 or 7.4). b: Response of the fluorescence spectra of
Pep-Acy/Glu@AuNRs (60 μg mL-1, as Au) to various concentrations of MMP-13 at weak acid
medium (pH 6.0). Inset: Fluorescence intensity at 805 nm against the concentrations of MMP-13
at pH 6.0.
S10
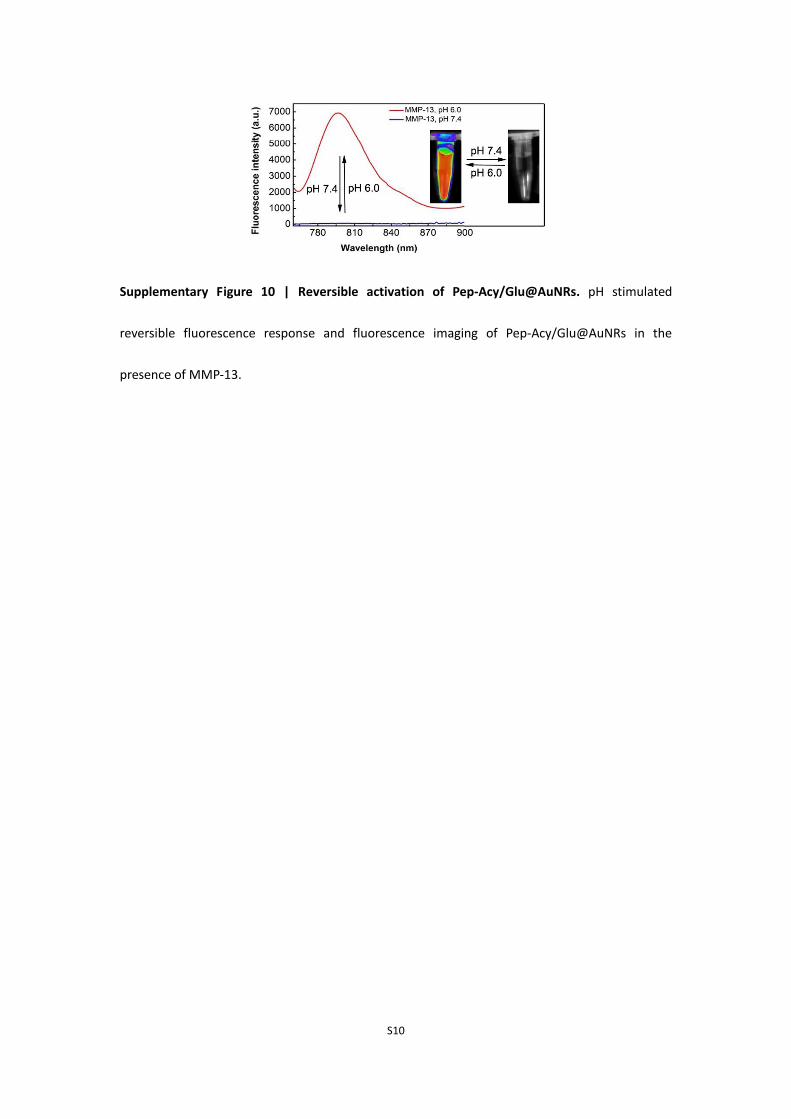
Supplementary Figure 10 | Reversible activation of Pep-Acy/Glu@AuNRs. pH stimulated
reversible fluorescence response and fluorescence imaging of Pep-Acy/Glu@AuNRs in the
presence of MMP-13.
S11
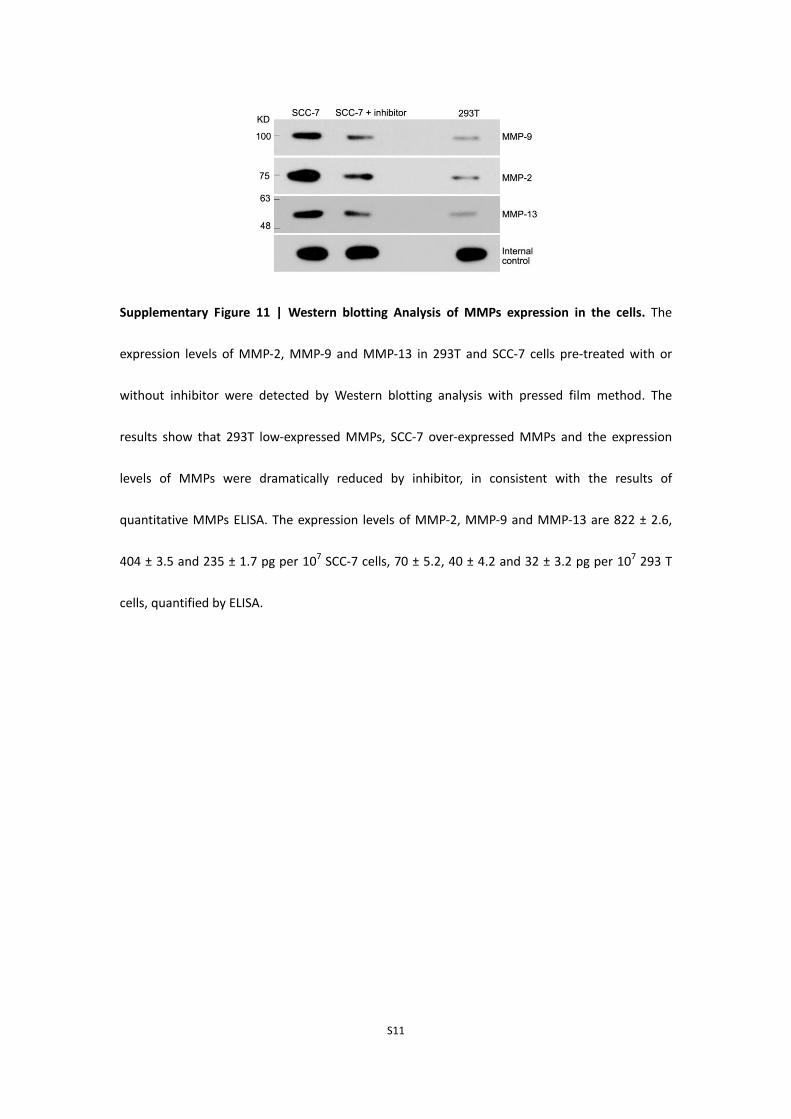
Supplementary Figure 11 | Western blotting Analysis of MMPs expression in the cells. The
expression levels of MMP-2, MMP-9 and MMP-13 in 293T and SCC-7 cells pre-treated with or
without inhibitor were detected by Western blotting analysis with pressed film method. The
results show that 293T low-expressed MMPs, SCC-7 over-expressed MMPs and the expression
levels of MMPs were dramatically reduced by inhibitor, in consistent with the results of
quantitative MMPs ELISA. The expression levels of MMP-2, MMP-9 and MMP-13 are 822 ± 2.6,
404 ± 3.5 and 235 ± 1.7 pg per 107 SCC-7 cells, 70 ± 5.2, 40 ± 4.2 and 32 ± 3.2 pg per 107 293 T
cells, quantified by ELISA.
S12
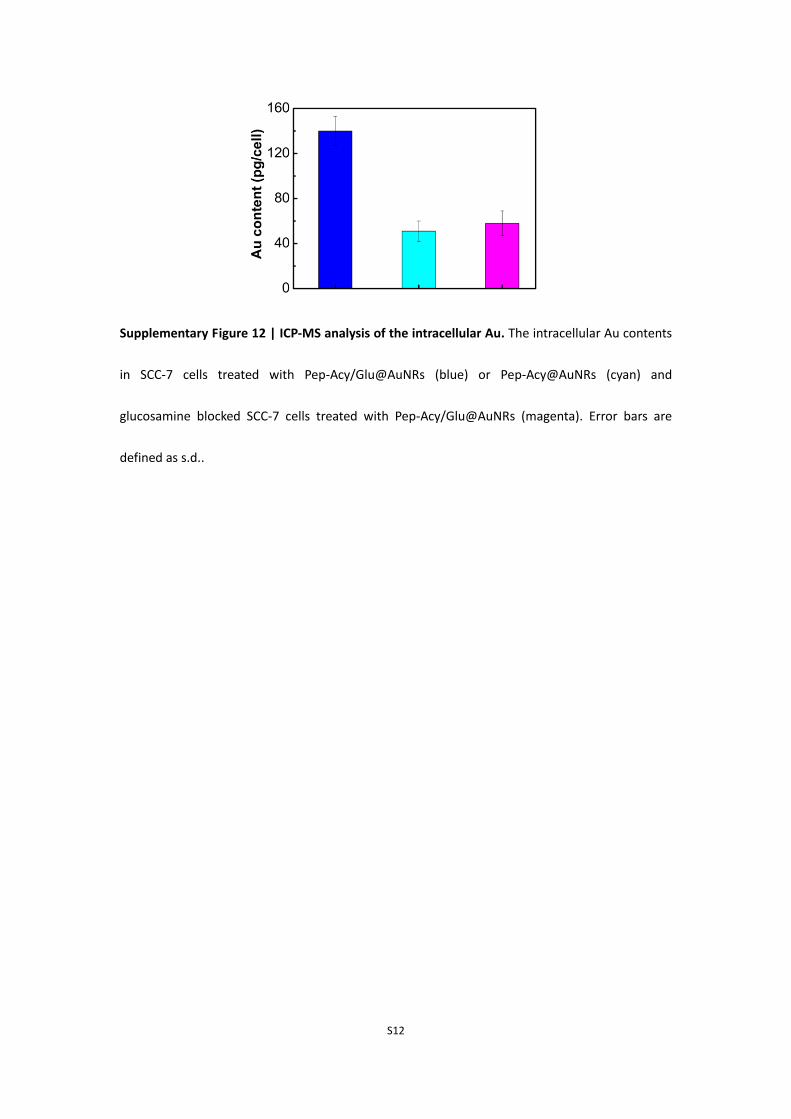
Supplementary Figure 12 | ICP-MS analysis of the intracellular Au. The intracellular Au contents
in SCC-7 cells treated with Pep-Acy/Glu@AuNRs (blue) or Pep-Acy@AuNRs (cyan) and
glucosamine blocked SCC-7 cells treated with Pep-Acy/Glu@AuNRs (magenta). Error bars are
defined as s.d..

S13
Supplementary Figure 13 | Flow cytometry analysis of SCC-7 cells. a: Flow cytometry profile for
the SCC-7 cell incubated with Pep-Acy/Glu@AuNRs under different conditions. Blue and orange:
In the absence (blue) or presence (orange) of MMPs inhibitor (low MMPs expressed) at weak acid
medium (pH 6.0). Magenta: In the absence of MMPs inhibitor at weak base medium (pH 7.4).
Black: without treatment. b: Corresponding mean fluorescence intensity (MFI) of SCC-7 cells. The
MFI of SCC-7 cells treated with Pep-Acy/Glu@AuNRs at pH 6.0 was much higher than others,
indicating that the fluorescence activation of Pep-Acy/Glu@AuNRs was pH and MMPs dependent.
Error bars are defined as s.d..

S14
Supplementary Figure 14 | Flow cytometry analysis of MMPs negative 293T cells. a: Flow
cytometry profile for the 293T cells incubated with Pep-Acy/Glu@AuNRs. b: Corresponding MFI
of 293T cells. Blue: weak acid medium (pH 6.0, blue); Magenta: weak base medium (pH 7.4,);
Black: without treatment. 293T cells exhibited almost no fluorescence at pH 6.0 although the
same amount of Pep-Acy/Glu@AuNRs was applied (compared with Supplementary Figure 17),
showing a strong MMPs dependent fluorescence activation. Error bars are defined as s.d..
S15
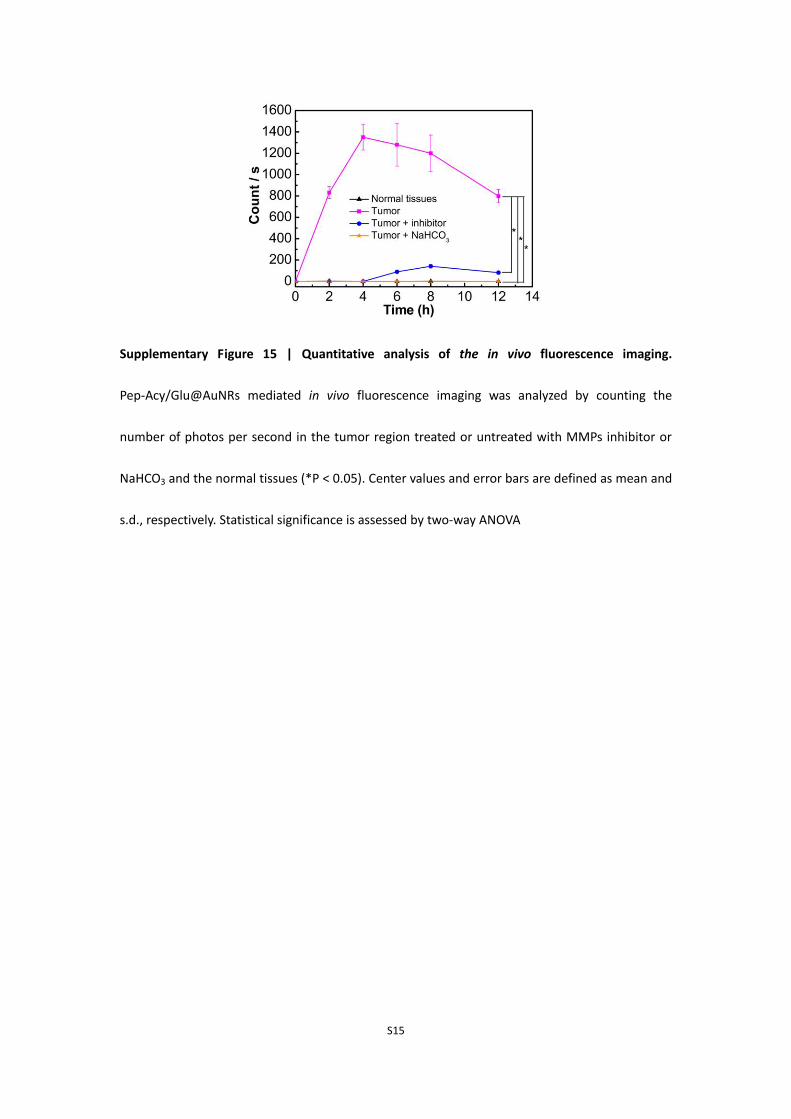
Supplementary Figure 15 | Quantitative analysis of the in vivo fluorescence imaging.
Pep-Acy/Glu@AuNRs mediated in vivo fluorescence imaging was analyzed by counting the
number of photos per second in the tumor region treated or untreated with MMPs inhibitor or
NaHCO3 and the normal tissues (*P < 0.05). Center values and error bars are defined as mean and
s.d., respectively. Statistical significance is assessed by two-way ANOVA
S16
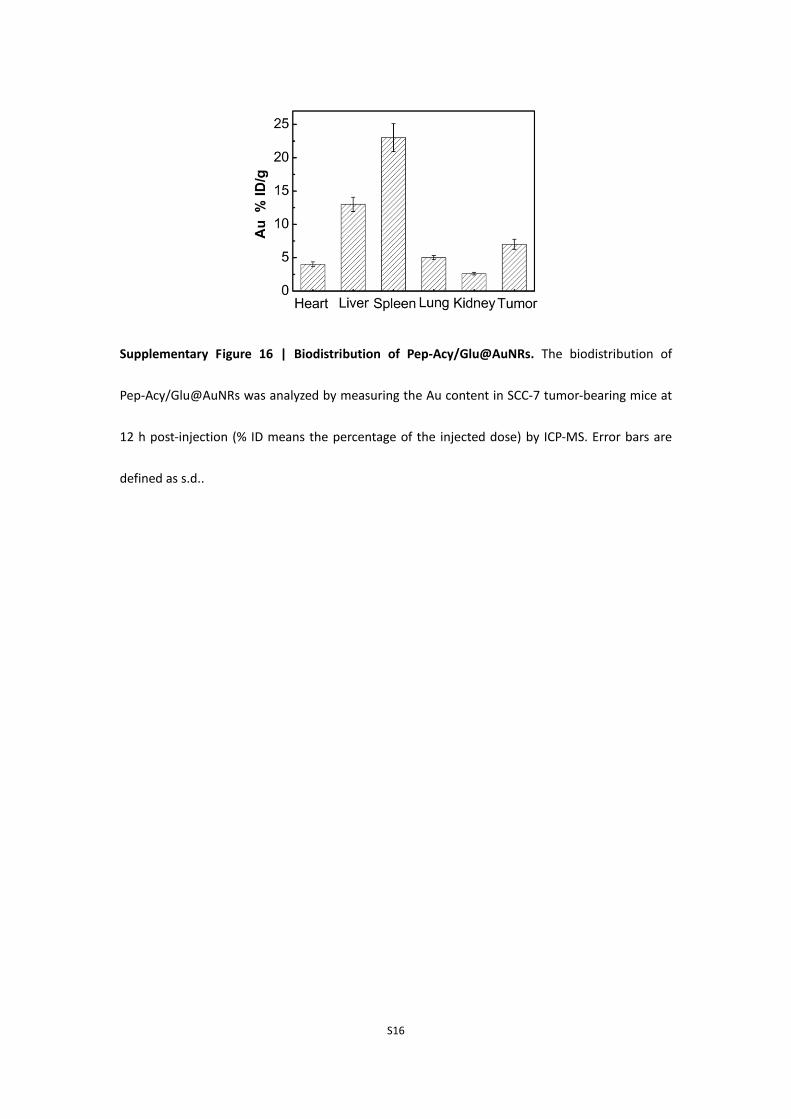
Supplementary Figure 16 | Biodistribution of Pep-Acy/Glu@AuNRs. The biodistribution of
Pep-Acy/Glu@AuNRs was analyzed by measuring the Au content in SCC-7 tumor-bearing mice at
12 h post-injection (% ID means the percentage of the injected dose) by ICP-MS. Error bars are
defined as s.d..

S17
Supplementary Figure 17 | In vitro photothermal effect. a: Representative thermal images of
Pep-Acy and PBS with 808 nm laser irradiation. b: Representative thermal images of
Pep-Acy/Glu@AuNRs and CTAB@AuNRs under 808 nm laser irradiation. c: Temperature change
curves of Pep-Acy/Glu@AuNRs and CTAB@AuNRs with 808 nm laser irradiation.

S18
Supplementary Figure 18 | In vivo photothermal effect. Temperature change of mice (tumor
sites) subjected to 808 nm laser irradiation for 4 h after intravenous injection of
Pep-Acy/Glu@AuNRs and PBS.

S19
Supplementary Figure 19 | Characterization of the formation of Pep2-Acy. a: FT-IR spectra of
asymmetric cyanine, peptide 2 (H2N-GGRRGGC-SH) and Pep2-Acy. b: MS spectrum of Pep2-Acy.
S20
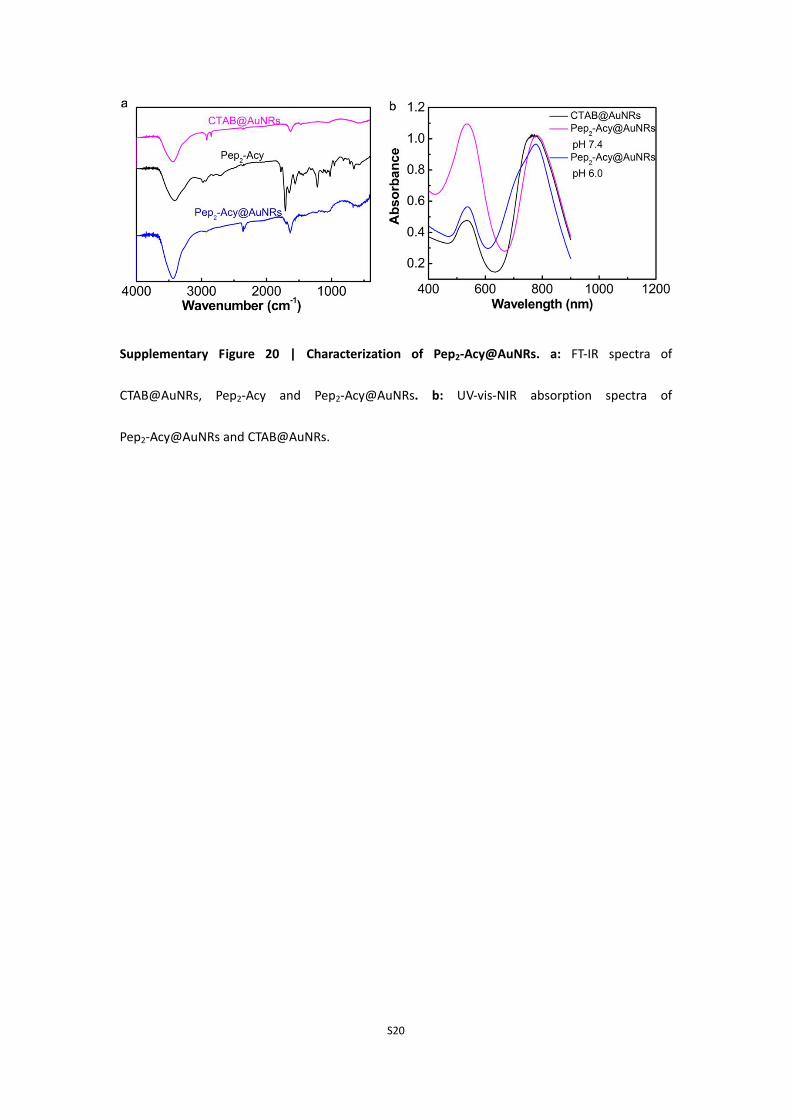
Supplementary Figure 20 | Characterization of Pep2-Acy@AuNRs. a: FT-IR spectra of
CTAB@AuNRs, Pep2-Acy and Pep2-Acy@AuNRs. b: UV-vis-NIR absorption spectra of
Pep2-Acy@AuNRs and CTAB@AuNRs.

S21
Supplementary Figure 21 | Cathepsin B and pH dependent fluorescence of Pep2-Acy@AuNRs.
Fluorescence response of Pep2-Acy@AuNRs (60 μg mL-1, as Au) to cathepsin B and pH with or
without inhibitor. Incubating of Pep2-Acy@AuNRs and cathepsin B with simultaneous adjusting
pH to 6.0 (simulated tumor acidic microenvironment) induced significant NIR fluorescence signal,
while the fluorescence signals was dramaticlly inhibited with cathepsin B inhibitor. Besides, no
fluorescence of Pep2-Acy/Glu@AuNRs was lightened with cathepsin B in weak basic medium (pH
7.4, normal biological fluid pH). The above results indicate that the activation of
Pep2-Acy@AuNRs should be carried out with synergetic stimulation of acidic microenvironment
and cathepsin B.

S22
Supplementary Figure 22 | Cell imaging of Pep2-Acy@AuNRs. Scale bar, 25 μm. SCC-7 cells
(cathepsin B positive) incubated with Pep2-Acy@AuNRs at pH 6.0 gave remarkable fluorescence.
In comparison, the SCC-7 cells pretreated with MMPs inhibitor (low cathepsin B expressed)
showed little fluorescence while NIH 3T3 cells (cathepsin B negative) exhibited almost no
fluorescence at pH 6.0 although the same amount of Pep2-Acy@AuNRs was applied. On the other
hand, neither SCC-7 nor NIH 3T3 cells lighted up the fluorescence of Pep2-Acy@AuNRs at pH 7.4.
The above results clearly indicate that the fluorescence of Pep2-Acy@AuNRs could be switched
on if and only if acidic microenvironment and overexpressed cathepsin B co-exist, making it
qualified for intelligent tumor-specific imaging.

S23
Supplementary Figure 23 | Flow cytometry of SCC-7 cells incubated with Pep2-Acy@AuNRs. a:
Flow cytometry profile of SCC-7 cells incubated with Pep2-Acy@AuNRs with or without cathepsin
B inhibitor. Blue and Orange: In the presence (blue) or absence (orange) of cathepsin B inhibitor
at weak acid medium (pH 6.0). Black: In the absence of cathepsin B inhibitor at weak base
medium (pH 7.4). Magenta: Without treatment. b: Corresponding MFI of SCC-7 cells. The MFI of
SCC-7 cells treated with Pep2-Acy@AuNRs at pH 6.0 was much higher than others, also indicating
that the fluorescence of Pep2-Acy@AuNRs was pH and cathepsin B dependent. Error bars are
defined as s.d..

S24
Supplementary methods
Chemicals and materials
Cetyltrimethylammonium bromide (CTAB) was purchased from Sinopharm Chemical Reagent Co.
Ltd. (Shanghai, China). HAuCl4∙4H2O, AgNO3, NaBH4 and ascorbic acid (AA) were obtained from
Guangfu Fine Chemical Research Institute (Tianjin, China). D-glucosamine hydrochloride,
1-ethyl-3-(3-dimethylaminopropyl) carbodiimide hydrochloride (EDC∙HCl), N-hydroxysuccinimide
(NHS) and N,N-diisopropylethylamine (DIPEA) were bought from Aladdin Reagent Co. Ltd.
(Shanghai, China). 3-(4,5-Dimethyl-thiazol-2-yl)-2,5-diphenyltetrazolium bromide (MTT),
11-Mercaptoundecanoic acid and p-aminophenol mercuric acid (APMA) were provided by
Sigma-Aldrich (Tianjin, China). DL-Dithiothreitol (DTT) was obtained from J&K Scientific Ltd.
(Beijing, China). Matrix metalloproteinases (MMPs) substrate (H2N-GPLGVRGC-SH) and cathepsin
B substrate (H2N-GGRRGGC-SH) were supplied by China Peptides Co. Ltd. (Shanghai, China).
Recombinant human MMPs (including MMP-2, MMP-3, MMP-7, MMP-9 and MMP-13) proteins,
MMP-13 inhibitor (WAY 170523), broad-spectrum MMP inhibitor (ONO 4817) and Recombinant
human cathepsin B protein were purchased from R&D Systems (Minneapolis, MN, USA).
Cathepsin B inhibitor (VBY-825) was obtained from MedChem express Co., Ltd (Shanghai, China).
Quantitative MMPs ELISA kits were purchased from Cloud-Clone Corp. (Wuhan, China). MMP-2
(D8N9Y) Rabbit mAb and MMP-9 (D603H) XP® Rabbit mAb were obtained from Cell Singnaling
Technology, Inc. (Shanghai, china). Anti-MMP13 antibody (EP 1263Y) was provided by Abcam
Trading (Shanghai) Company Ltd. (Shanghai, china). All the other reagents and solvents were
analytical grade and used without further purification unless otherwise noted. Dimethyl sulfoxide
(DMSO) was purified by refluxing with calcium hydride for 4 h and then distilled. High-purity
S25
water (Hangzhou Wahaha Group Co. Ltd., Hangzhou, China) was used throughout this work.
Instrumentation and characterization
1H NMR analysis was carried out on a Bruker Avance 400 spectrometer with tetramethyl silane
(TMS) as an internal standard (Bruker, Switzerland). High-resolution mass spectra were recorded
on a VG ZAB-HS mass spectrometer (VG Instruments, UK). Mass spectra were measured on an
Autoflex III LRF 200-CID (Bruker Daltonics, Germany). Fourier transform infrared spectroscopy
(FT-IR) spectra were carried out on a Nicolet 6700 spectrometer (Thermo Fisher Scientific, USA)
using a KBr pellet. The absorption spectra were performed on a UV 3600 UV-vis-NIR
spectrophotometer (Shimadzu Co., Japan). The fluorescence spectra were acquired on an F-4500
spectrofluorometer (Hitachi, Japan). The transmission electron microscopy (TEM) images were
performed on a Tecnai G2 F20 field emission transmission electron microscope (FEI, US) with an
accelerating voltage of 200 KV. Dynamic light scattering (DLS) and zeta potential analysis were
performed on a Nano-ZS Zetasizer (Malvern, UK). The content of Au in the solution of AuNRs was
determined on a 180-80 polarized Zeeman atomic absorption spectrophotometer (AAS) (HITACHI,
Japan). The content of gold in cells, major organs and tumor tissue was measured on an X series
inductively coupled plasma mass spectrometer (ICP-MS) (Thermo Elemental, UK). MTT assay was
performed on a microplate reader (Synergy HT, BioTek). The cell imaging was carried on a TCS SP8
laser confocal scanning microscope (Leica, Germany). Flow cytometry analysis was carried out on
FACScan cytometer (BD Biosciences, USA). In vivo fluorescence imaging was performed on an IVIS
Lumina II imaging system (Xenogen, USA).
Preparation of CTAB@AuNRs
CTAB@AuNRs was prepared according to Wang et al. with a slight modification1. Briefly, the seed

S26
solution was prepared by adding freshly prepared and ice-cold NaBH4 (0.6 mL, 10.0 mM) to a
mixture, made of CTAB (5.0 mL, 0.2 M) and HAuCl4 (5.0 mL, 0.5 mM). After vigorous stirring for 5
min, the resulting solution was kept at 28 oC for 4 h before use. Meanwhile, the growth solution
was obtained by sequential addition of HAuCl4 (1.8 mL, 5.0 mM), AgNO3 (23 μL, 0.1 M), HCl (20
μL, 1.2 M) and AA (1050 μL, 10.0 mM) into the solution of CTAB (9 mL, 0.2 M) under gentle
stirring. Then, 12 μL of seed solution was injected into the mixture rapidly. The resulting solution
was stirred for 1 min and then left at 28 oC overnight for growing the CTAB@AuNRs.
Synthesis of H2N-GPLGVRGC-SH peptide modified asymmetric cyanine (Pep-Acy)
To a DMSO solution of the asymmetric cyanine (Acy) prepared according to our previous work2
(54.20 mg, 0.10 mmol), EDC∙HCl (28.09 mg, 0.11 mmol) and NHS (12.66 mg, 0.11 mmol) were
added and then the resulting mixture was stirred for 12 h at room temperature under N2
atmosphere. After that, DIPEA (55 μL, 0.33 mmol) and H2N-GPLGVRGC-SH (84.74 mg, 0.11 mmol)
were added and stirred for an additional 8 h at room temperature in the dark. The mixture was
poured into diethyl ether (150 mL). The precipitation was collected by filtration and washed three
times with diethyl ether and acetone to obtain Pep-Acy as a black powder in 69.1 % yield. FT-IR
(powder): 3441, 2926, 2855, 1701, 1657, 1648, 1550, 1532, 1444, 1373, 1195, 1124 (cm-1)
(Supplementary Fig. 1a). MS: calc. for: C64H89ClN14O10S, [M-H]- 1279.62, found 1279.66
(Supplementary Fig. 1b).
Pep2-Acy was obtained by the similar method. FT-IR (powder): 3419, 2964, 2934, 1773, 1714,
1654, 1552, 1432, 1215, 1192, 1137 (cm-1) (Supplementary Fig. 19a). MS: calc. for: C56H77ClN16O9S,
[M-H]- 1183.54, found 1183.57 (Supplementary Fig. 19b).
Synthesis of thiol-terminated glucosamine derivative (Glu-SH)

S27
The mixture of NHS (1.27 g, 11.03 mmol) and EDC∙HCl (2.10 g, 10.95 mmol) was added to the
DMSO solution of 11-mercaptoundecanoic acid (1.06 g, 9.99 mmol) at room temperature under
N2 atmosphere. After stirring for 12 h, D-glucosamine hydrochloride (2.16 g, 10.02 mmol) and
DIPEA (5.0 mL, 30.25 mmol) were added. The reaction mixture was continually stirred for an
additional 8 h, and then poured into water (200 mL). The precipitation was collected by filtration
and re-dissolved in 1.0 mol/L NaOH solution (100 mL). After that, the resulting solution was
filtered to remove the residue and then acidified to pH 5.0 with 1 mol/L HCl solution. The
resulting precipitation was collected by filtration again to obtain Glu-SH as a white powder (3.03 g,
79.7 %). FT-IR (powder): 3416, 2920, 2847, 1637, 1539, 1295, 1088 (cm-1) (Supplementary Fig. 2a).
1H NMR (400 MHz, DMSO-d6) δ(ppm):7.78 (d, 1H), 7.59 (d, 1H), 6.38 (s, 1H), 4.93 (s. 1H), 4.41 (d,
1H), 3.67-3.30 (m, 6H), 3.10 (t, 1H), 3.06 (d, 1H), 2.45 (q, 2H), 2.25 (t, 1H), 2.08 (q, 2H), 1.56-1.46
(m, 4H), 1.32 (t, 2H), 1.24 (s, 9 H) (Supplementary Fig. 2b). HRMS (ESI Positive): calc. for
C17H33NO6, [M+H]+ 380.2106, found 380.2109 (Supplementary Fig. 2c).
Preparation of Pep-Acy@AuNRs
10 mL of CTAB@AuNRs solution was first centrifuged twice at 8000 rpm for 5 min to remove the
excess CTAB and then re-suspended in the same volume of high-purity water. To the purified
CTAB@AuNRs solution, 2 mL anhydrous DMSO solution of Pep-Acy (2 mg, 1.56 μmol) was added
dropwise under vigorous stirring. After stirring for 24 at room temperature in the dark, the
solution was centrifuged at 8000 rpm for 5 min at room temperature to remove the excess
Pep-Acy. The resulting residue was washed three times with DMSO-water (1:9, v/v) to further
remove the unbound Pep-Acy, and then re-dispersed in high-purity water to obtain
Pep-Acy@AuNRs. The prepared Pep-Acy@AuNRs was kept in dark for further use.
S28
Pep2-Acy@AuNRs was obtained by the similar method and characterized with FT-IR
(Supplementary Fig. 20a) UV-vis-NIR absorption (Supplementary Fig. 20b) and fluorescence
spectroscopy (Supplementary Fig. 21).
Preparation of Pep-Acy/Glu@AuNRs
1.56 μmol of Pep-Acy in anhydrous DMSO (2 mL) was dropwise added to the purified
CTAB@AuNRs solution under vigorous stirring. After vigorous stirring for 3 h in the dark, a DMSO
solution of Glu-SH (1 mg, 2.63 μmol) was added and stirred at room temperature for an
additional 12 h, then centrifuged three times at 8000 rpm for 5 min to remove the excess Pep-Acy
and Glu-SH. The final product (Pep-Acy/Glu@AuNRs) was re-dispersed in high-purity water and
stored at 4 oC in dark before use.
Quantitative analysis of Pep-Acy on the surface of AuNRs and calculation of the fluorescence
quenching efficiency
To determine the concentration of Pep-Acy bound to the surface of AuNRs, UV-vis titration of
asymmetric cyanine (Acy) was carried out at pH 7.4 (Supplementary Fig. 7). Then, the solution of
Pep-Acy/Glu@AuNRs at 60 μg/mL (as Au, determined by AAS) was treated with DTT (20 mM) and
NaCl (4 M) for 30 min (the strong binding ability of DTT to AuNRs makes Pep-Acy depart from
AuNRs3-5), and then the resulting mixture was centrifuged. The supernatant was collected and its
absorbance at ca. 525 nm was measured by UV-vis-NIR spectroscopy. The concentration of the
Acy in the supernatant was determined with a standard calibration method and then the amount
of Pep-Acy in the above Pep-Acy/Glu@AuNRs was further calculated.
Besides, each AuNR can be assumed to a cylindrical middle and two spherical segments6.
The radius (r) and height (h) of cylindrical middle were 5.56 nm and 40.03 nm, respectively, while

S29
the base radius (r) and height (a) of spherical segment were 5.56 nm and 5.04 nm, respectively
(determined by TEM images, Supplementary Fig. 3a). Hence, the volume of the AuNR was
calculated as follow: V = πa (3r2+a2)/3 +πr2h = 4508.89 nm3. The amount of Au of each AuNR was
determined by the formula: amount of Au/AuNR = ρAuVMAu/NA = 5.24 × 10⁷ / NA, Where ρAu = 59
atoms/nm3, is the density of gold atoms in the bulk; MAu = 197 g/mol, is the molar mass of Au. As
the amount of Au in the AuNRs solution is 60 μg/mL, the number of the gold rods in this solution
was calculated to be 1.45 × 10⁻⁹ NA/L. Finally, the grafting density of peptide-probe on each AuNR
surface was calculated to be 6234.
To calculation of the fluorescence quenching efficiency, the solution of Pep-Acy/Glu@AuNRs
(60 μg/mL, as Au) was treated with DTT (20 mM) and NaCl (4 M) for 30 min and adjusted to pH
6.0 to recover the de-quenched state. Then, the fluorescence spectra of Pep-Acy/Glu@AuNRs in
its de-quenched state and quenched state (untreated with DTT, pH 7.4) were recorded
(Supplementary Fig. 8a and 8b). The fluorescence quenching efficiency (QE) was calculated via
the formula: QE = (1-β) × 100%, where β is the ratio of fluorescence intensity of the quenched to
completely de-quenched state5.
Evaluation of cytotoxicity and in vitro photothermal therapy
Standard MTT assay was carried out to evaluate the cytotoxicity and in vitro photothermal
therapy. Briefly, both SCC-7 and 293T cells were separately seeded into a 96-well plate at a
density of 1 × 10⁴ cells per well and incubated overnight, then the medium was replaced with
fresh medium containing a series of concentration of CTAB@AuNRs, Pep-Acy@AuNRs or
Pep-Acy/Glu@AuNRs (7.5, 15, 30, 60 and 120 μg mL-1). Each concentration was done in
quintuplicate. The cells incubated with no AuNRs were used as the blank control. After incubation
S30
for 24 h, the medium was removed and fresh medium containing MTT (0.5 mg mL-1) was added to
each well followed by incubation for an additional 4 h. Afterwards, the medium was removed and
rinsed with cold PBS, then 100 μL DMSO was added to each well to dissolve the formazan crystals
generated by living cells. Finally, the absorbance at 570 nm of each well was recorded on a
microplate reader before the plate was vibrated for 20 min in the dark. The relative cell viability
(%) was then calculated by the following formula: viability (%) = (the average absorbance of test
group / the average absorbance of the blank control) × 100.
For photothermal therapy, SCC-7 cells were seeded in 96-well plate at 1 × 10⁴ cells per well
and incubated for 24 h until adherence, then incubated with Pep-Acy/Glu@AuNRs (60 μg mL-1)
for an additional 12 h. After that, the cells in each well were subjected to irradiation with an 808
nm laser at various power densities (0.2, 0.4 and 0.6 w cm-2) for different times (3, 6 and 10 min).
The cells irradiated under the same conditions but without AuNRs were employed as blank
controls. Each experiment group was done in quintuplicate as well. After irradiation, the cells
were further incubated for 12 h and then the cell viability was evaluated following the similar
procedure mentioned above.
Supplementary References
1. Wang, J. H. et al. Bimodal optical diagnostics of oral cancer based on rose Bengal conjugated
gold nanorod platform. Biomaterials 34, 4274-4283 (2013).
2. Zhao, X. et al.. A near-infrared multifunctional fluorescent probe with an inherent
tumor-targeting property for bioimaging. Chem. Commun. 51, 11721-11724 (2015).
3. Yi, D. K. et al. Matrix metalloproteinase sensitive gold nanorod for simultaneous bioimaging
and photothermal therapy of cancer. Bioconjugate Chem. 21, 2173-2177 (2010).
S31
4. Sun, I. C. et al. Tumor-targeting gold particles for dual computed tomography/optical cancer
imaging. Angew. Chem. Int. Ed. 50, 9348-9351 (2011).
5. Lee, S. et al. A near-infrared-fluorescence-quenched gold-nanoparticle imaging probe for in
vivo drug screening and protease activity determination. Angew. Chem. Int. Ed. 47, 2804-2807
(2008).
6. Vigderman, L., Manna, P. & Zubarev, E. R. Quantitative replacement of cetyl
trimethylammonium bromide by cationic thiol ligands on the surface of gold nanorods and
their extremely large uptake by cancer cells. Angew. Chem. Int. Ed. 51, 636-641 (2012).


