
Page 1 of 13
Atlantic Coast Pipeline:
Economics and Manufacturing
Jobs Prepared for the Natural Resources Defense Council
Authors:
Rachel Wilson
Sagal Alisalad
Emrat Nur Marzan
Bryndis Woods
December 5, 2017

Page 2 of 13
Table of Contents
Executive Summary ......................................................................................................................... 3
I. Natural gas price differentials ................................................................................................... 4
II. Electricity demand .................................................................................................................... 7
III. Natural gas pipelines, electric rates, and manufacturing jobs ................................................. 10
IV. Conclusions ............................................................................................................................ 13

Page 3 of 13
Executive Summary
The Atlantic Coast Pipeline (ACP) is a proposed new natural gas pipeline that is currently planned
to travel through West Virginia, Virginia, and North Carolina and is intended to bring natural gas to
markets in those states. Dominion Transmission, Inc. (“Dominion”), the leading percentage owner
of the pipeline, has made several arguments in favor of the project based on reports it
commissioned from ICF International (ICF) and Chmura Economics & Analytics (Chmura). In this
report, we examine the merit of each of these claims and find them to be unsupported based on
available data.
Questionable cost savings
Dominion claims that the ACP will save consumers money by supplying the region’s power
producers with shale gas, even accounting for the additional cost to transport the gas from farther
away. This claim assumes a large difference in price between the regional natural gas hub that
currently services the West Virginia, Virginia, and North Carolina territory (Transco Zone 5) and
the natural gas hub that will service the territory once the ACP is operational (Dominion South). A
critique of ICF’s analysis notes that, historically, the price differential has not been as large as
Dominion projects, and therefore, this assumption may not be justified. The price differential
between the two hubs has already declined substantially in the last few years as new pipeline
capacity has been added in the region, and Dominion itself is projecting a significantly smaller
differential than ICF did in its most recent long-term projections. In fact, testimony using
Dominion’s own, more recent cost projections concludes that Dominion’s customers may actually
pay $1.61 to $2.36 billion more with the ACP than without the ACP over the next 20 years.
Modest increases in customer demand
The ICF report also predicts demand for natural gas will increase substantially over the next 20
years due to power capacity retirements and additions. However, in their most recent Integrated
Resource Plans, Dominion and its pipeline partner Duke Energy (Duke Energy Carolinas and
Duke Energy Progress) have lowered forecasted demand by 15,468 GWh in 2025 since the ICF
report was released. This reduction in future energy load reflects a reduced need for new natural
gas combined cycle generating capacity, and a corresponding reduction in demand for natural
gas.
Job growth is a coin toss
The Chmura report claims that these assumed lower electricity prices will spur growth in
manufacturing spending and employment. However, based on an examination of the relationship
between new and expanded natural gas capacity, electricity prices, and manufacturing jobs using
publicly available data, we find no reliable trend in these relationships. There is no clear support
for the claim that the ACP would lead to additional opportunities for new manufacturing in the
region, and this is likely the case for other new natural gas pipelines such as the Mountain Valley
Pipeline.

Page 4 of 13
I. Natural gas price differentials
New long-haul interstate natural gas pipelines have the potential to bring natural gas from regions
where it is produced to regions without their own natural gas production. An influx of natural gas
could lower utility bills for customers of natural gas and electric service in the receiving region.
This report questions whether, and under what circumstances, utilities should pay to reserve the
right to transport natural gas via a new pipeline, and examines common claims by pipeline
developers regarding regional differences in the price of natural gas, forecasted growth in the
demand for natural gas, and economic benefits to states from construction jobs and tax revenues.
Developers for the Atlantic Coast and Mountain Valley Pipelines,1 two proposed pipelines in the
Mid-Atlantic region, have made these types of claims. While this report specifically analyzes those
claims made by the developers of the Atlantic Coast Pipeline, the regional trends in natural gas
pricing and demand as well as economic benefits from new pipeline capacity apply to both.
The Atlantic Coast Pipeline (ACP) is a proposed new natural gas pipeline that will begin in
Harrison County, West Virginia and travel 600 miles to its currently proposed terminus in Robeson
County, North Carolina.2 Three laterals would extend from the pipeline, with the first reaching
Chesapeake, Virginia, and the second and third connecting to two Dominion Energy electric
generating stations in Brunswick and Greensville counties, respectively.3 The proposed pipeline
route is shown in Figure 1, below.
1 The Mountain Valley Pipeline (MVP) is a proposed new natural gas pipeline that would stretch 303 miles
from the Equitrans transmission system in Wetzel County, West Virginia to connect to the Transco natural
gas pipeline at the Transco Zone 5 compressor station in Pittsylvania County, Virginia.
2 At least one comment from a Dominion executive has suggested that the ACP may extend into South
Carolina. See: http://southeastenergynews.com/2017/11/29/north-carolina-seeks-more-information-on-
atlantic-coast-pipeline-development-claims/
3 Atlantic Coast Pipeline. 2017. About ACP. Available at: https://atlanticcoastpipeline.com/about/default.aspx

Page 5 of 13
Figure 1. Atlantic Coast pipeline route and key pricing hubs
Source: ICF, Ventyx.4
In 2015, Dominion Transmission, Inc. (Dominion), the largest owner of the ACP project,
commissioned ICF International (ICF) to assess the impact of the pipeline on market area natural
gas and electric prices. The ACP will provide access to natural gas at the Dominion South market
hub, the pricing point in the Marcellus shale from which the ACP would transport natural gas
supply to Virginia and North Carolina. The ICF report claims that this natural gas will be lower cost
than natural gas from both Henry Hub and Transco Zone 5, the segment of the Transcontinental
Gas Pipeline that runs from North-Central South Carolina to the Virginia-Maryland border, and
which currently delivers natural gas to the region. These pricing hubs are also shown in Figure 1.
The difference in natural gas prices at different regional hubs is known as the “basis differential”
and results from market inefficiencies or constraints on pipeline capacity that limit the movement of
natural gas between regions. ICF forecasts future basis differentials and estimates that entities
purchasing natural gas from the Dominion South hub could save $1.61/MMBtu on average
compared to purchasing natural gas supplies delivered into the market.5 ICF calculates that this
cost savings greatly exceeds the additional cost of transporting Dominion South natural gas via
the ACP and will result in net savings to customers.6
4 ICF International. 2015. The Economic Impacts of the Atlantic Coast Pipeline. Page 4. Available at:
https://www.dominionenergy.com/library/domcom/pdfs/gas-transmission/atlantic-coast-pipeline/acp-icf-
study.pdf
5 Id. Page 9.
6 Ibid.
Page 6 of 13
A 2015 critique of ICF’s analysis notes that its “assumption of a large difference between Henry
Hub and Dominion South natural gas prices may not be justified based on available price data.”7
The authors go on to point out that ICF’s results “depend on the continuing divergence of
Dominion South and Henry Hub prices. If these price points are converging, the implied savings—
and resulting economic impacts—would decrease or perhaps disappear.”8
Many new and expanded natural gas pipelines have been completed since February 2015, greatly
reducing supply constraints and narrowing the basis differentials between Henry Hub and the
various hubs in Appalachia. The U.S. Energy Administration (EIA) notes that just over 4.0 billion
cubic feet per day (Bcf/d) of inter-regional pipeline capacity was added during 2016 alone. This
lowered the basis differential between Henry Hub and Dominion South from $1.79/MMBtu9 at the
beginning of 2015 to $0.49/MMBtu by the end of 2016, a reduction of almost 73 percent.10 An
additional 7.2 Bcf/d of additional capacity is currently under construction and is expected to be fully
operational by the end of 2017.11
Testimony from Gregory Lander before the Commonwealth of Virginia State Corporation
Commission uses Dominion’s own 2017 Integrated Resource Plan (IRP) data to demonstrate that
even Dominion is forecasting reduced price differentials compared to ICF’s more outdated 2015
analysis. Under Dominion’s most recent natural gas price forecast, the price spread between
Dominion South and Transco Zone 5 was only 0.46 dollars per dekatherm day ($/Dthd). The basis
differentials assumed by Dominion in its 2017 IRP are lower than those used by ICF in its analysis,
and use of these values would reduce ICF’s calculated customer benefits. Mr. Lander’s testimony
concludes that “the ACP will actually increase (emphasis in original) customer costs between
$1.61 and $2.36 billion”12 over the initial 20-year contract period.
7 Stanton, Elizabeth A., et al. 2015. Atlantic Coast Pipeline Benefits Review. Synapse Energy Economics.
Page 1. Available at: http://www.synapse-energy.com/sites/default/files/Atlantic-Coast-Pipeline-Benefits-
Review-14-150.pdf
8 Id. Page 3.
9 Calculated using data from Natural Gas Intelligence.
10 US Energy Administration. 2017. Natural gas pipeline projects lead to smaller price discounts in
Appalachian region. Available at: https://www.eia.gov/todayinenergy/detail.php?id=32512
11 Ibid.
12 Testimony of Gregory M. Lander before the Commonwealth of Virginia State Corporation Commission.
2017. Case No. PUR-2017-00051.
Page 7 of 13
II. Electricity demand
The 2015 ICF study also argues that the ACP is needed because of increasing demand for natural
gas as the primary fuel source for electric power generation in Virginia and North Carolina.13
Through the use of its Gas Market Model (GMM) and Integrated Planning Model (IPM), ICF
forecasts that 9,900 MW of coal and nuclear capacity in the region will retire between 2014 and
2035, and that 20,200 MW of new natural gas-fired combined cycle (NGCC) capacity is needed to
both replace this retired capacity and meet growing demand over this 20-year period.14 ICF
predicts that this new NGCC capacity will cause power sector demand for natural gas to grow at a
rate of 6.3 percent annually over the analysis period, rising from 1.0 Bcf/d in 2014 to 3.7 Bcf/d in
2035.15
ICF does not provide its assumptions about electric demand growth that underlie these predictions
of increased natural gas use from the power sector in Virginia and North Carolina, and in fact, its
report has been criticized for being “largely inauditable, meaning (it) lack(s) the transparency and
verifiable data necessary for independent review.”16 However, electric utilities in the territories that
would be served by the ACP have revised forecasts of electric demand downward in the two years
since ICF released its analysis.
In their 2014 Integrated Resource Plans (IRPs), Duke Energy Carolinas and Duke Energy
Progress forecasted average growth in electric sales in their respective service territories of just
over 1 percent per year.17,18 In their 2017 IRPs, released in September, the utilities lowered their
demand forecasts to reflect 0.4 percent and 0.6 percent annual growth, respectively, and reduced
the amount of new natural gas capacity that they have planned for construction between 2020 and
2022.19,20
13 ICF International. 2015. The Economic Impacts of the Atlantic Coast Pipeline. Page 6.
14 Ibid.
15 Ibid.
16 Stanton, Elizabeth A., et al. 2015. Atlantic Coast Pipeline Benefits Review. Synapse Energy Economics.
Page 1.
17 Duke Energy Carolinas. 2014. Integrated Resource Plan. Page 80. Available at:
http://www.energy.sc.gov/files/view/2014DukeEnCarIRP.pdf
18 Duke Energy Progress. 2014. Integrated Resource Plan. Page 14. Available at:
http://www.energy.sc.gov/files/view/PROGRESS2014IRP.pdf
19 Duke Energy Carolinas. 2017. Integrated Resource Plan. Pages 44 and 78. Available at:
http://www.energy.sc.gov/files/view/2017%20Duke%20Energy%20Carolinas%20Integrated%20Resource%
20Plan.pdf
20 Duke Energy Progress. 2017. Integrated Resource Plan. Pages 48 and 59. Available at:
https://www.scribd.com/document/358089739/Duke-Energy-Progress-LLC-2017-Integrated-Resource-Plan-
Update-and-2017-REPS-Compliance-Plan#download
Page 8 of 13
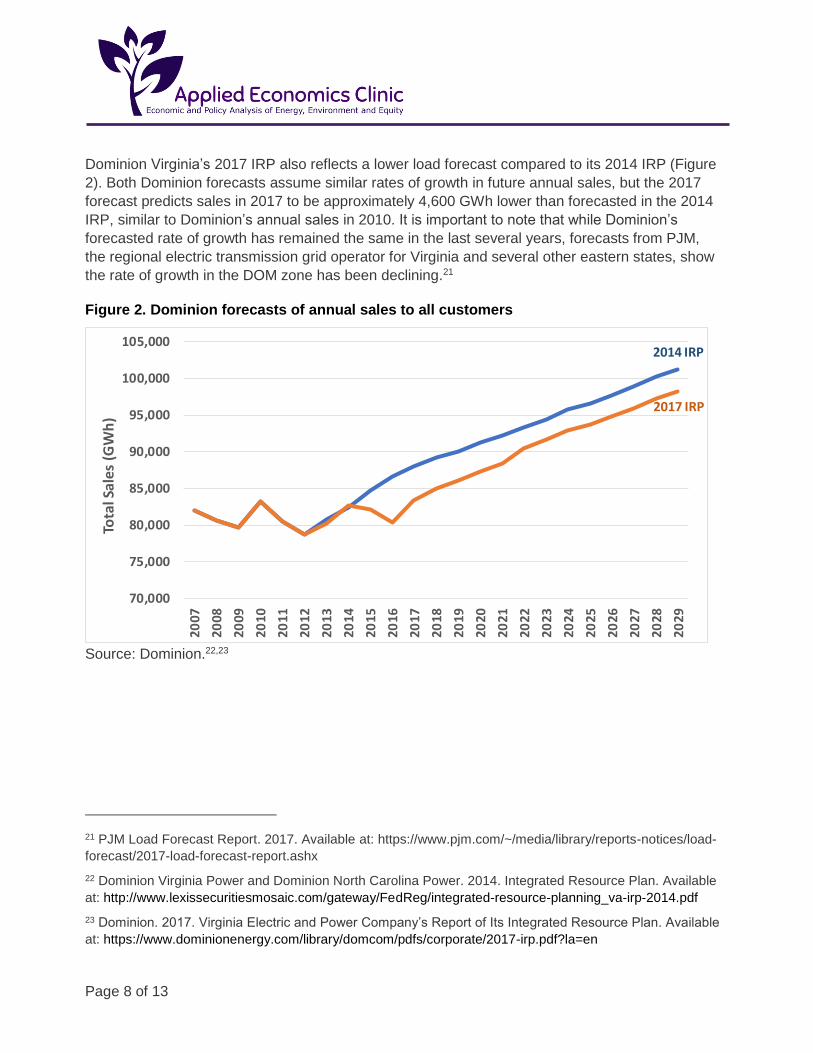
Dominion Virginia’s 2017 IRP also reflects a lower load forecast compared to its 2014 IRP (Figure
2). Both Dominion forecasts assume similar rates of growth in future annual sales, but the 2017
forecast predicts sales in 2017 to be approximately 4,600 GWh lower than forecasted in the 2014
IRP, similar to Dominion’s annual sales in 2010. It is important to note that while Dominion’s
forecasted rate of growth has remained the same in the last several years, forecasts from PJM,
the regional electric transmission grid operator for Virginia and several other eastern states, show
the rate of growth in the DOM zone has been declining.21
Figure 2. Dominion forecasts of annual sales to all customers
Source: Dominion.22,23
21 PJM Load Forecast Report. 2017. Available at: https://www.pjm.com/~/media/library/reports-notices/load-
forecast/2017-load-forecast-report.ashx
22 Dominion Virginia Power and Dominion North Carolina Power. 2014. Integrated Resource Plan. Available
at: http://www.lexissecuritiesmosaic.com/gateway/FedReg/integrated-resource-planning_va-irp-2014.pdf
23 Dominion. 2017. Virginia Electric and Power Company’s Report of Its Integrated Resource Plan. Available
at: https://www.dominionenergy.com/library/domcom/pdfs/corporate/2017-irp.pdf?la=en
2014 IRP
2017 IRP
70,000
75,000
80,000
85,000
90,000
95,000
100,000
105,000
20
07
20
08
20
09
20
10
20
11
20
12
20
13
20
14
20
15
20
16
20
17
20
18
20
19
20
20
20
21
20
22
20
23
20
24
20
25
20
26
20
27
20
28
20
29
Tota
l Sal
es (
GW
h)

Page 9 of 13
Overall, in the three years since the ACP was first proposed, Duke and Dominion’s revised
electricity demand forecasts reflect the need for much less new electric generating capacity.
Compared to the utilities’ initial predictions, Duke’s forecast is 12,549 GWh lower and Dominion’s
is 2,919 GWh lower, for a total reduction in expected annual demand of 15,468 GWh by the end of
2025.24 This is equivalent to the power produced by two large natural gas combined cycle facilities
operating at capacity factors of 70 to 80 percent.25 A reduction in electricity demand of this
magnitude would lower the demand for natural gas from the ACP by approximately 375 million
cubic feet of natural gas per day, or 25 percent of the pipeline’s maximum capacity.26
24 Duke Energy Carolinas. 2014. Integrated Resource Plan. Page
25 This is equal to 2,207 MW of natural gas combined cycle capacity operating at an assumed capacity
factor of 80 percent, or 2,523 MW if a 70 percent capacity factor is assumed. Lower assumed capacity
factors would increase the number of MW of avoided capacity.
26 Dominion’s Greensville Power Station is a 1,585 MW natural gas combined cycle facility currently under
construction in Virginia. Assuming the unit operates at the average capacity factor of 80.12 percent as
projected in Dominion’s 2017 IRP, the unit would produce 11,125 GWh of electricity. The Transco Virginia
Southside Expansion II pipeline project would deliver 250 million cubic feet per day of natural gas to serve
the power plant. Using this ratio, avoided generation of 15,468 GWh would avoid 375 million cubic feet of
natural gas use per day.
Page 10 of 13
III. Natural gas pipelines, electric rates, and manufacturing jobs
Dominion also commissioned a report from Chmura Economics & Analytics—released in
September 2014—that examined the economic impacts of the ACP.27 The Chmura report claims
that the construction and operation of the ACP would have positive impacts on both spending and
employment in West Virginia, Virginia, and North Carolina. The report also asserts that the
existence of the ACP would lead to additional opportunities for new manufacturing, but makes no
attempt to quantify those benefits.
In this section, we examine on a state by state basis the claim that lower electricity prices lead to
more manufacturing jobs. Industrial electricity price data were taken from the U.S. EIA from 2015
to 2017.28 Manufacturing jobs data were taken from the U.S. Bureau of Labor Statistics.29 We
compared the percentage change in electricity prices to the percentage change in the number of
manufacturing jobs in each state from January 2015 to January 2017, as shown in Figure 3.
27 Chmura Economics & Analytics. 2014. The Economic Impact of the Atlantic Coast Pipeline in West
Virginia, Virginia, and North Carolina. Page 1. Available at: https://www.coastalreview.org/wp-
content/uploads/2017/03/acp-chmura-report-091014-1-1.pdf
28 U.S. Energy Information Administration. 2017. Electric Power Monthly. Available at:
https://www.eia.gov/electricity/monthly/epm_table_grapher.php?t=epmt_5_6_a
Because seasonality affects the price of electricity, and because 2017 is only a partial year, we used data
from January 2015 to January 2017 only.
29 U.S. Bureau of Labor Statistics. 2017. State Employment and Unemployment Archived News Releases:
U.S. Bureau of Labor Statistics. Available at: https://www.bls.gov/bls/news-release/laus.htm#current
Page 11 of 13
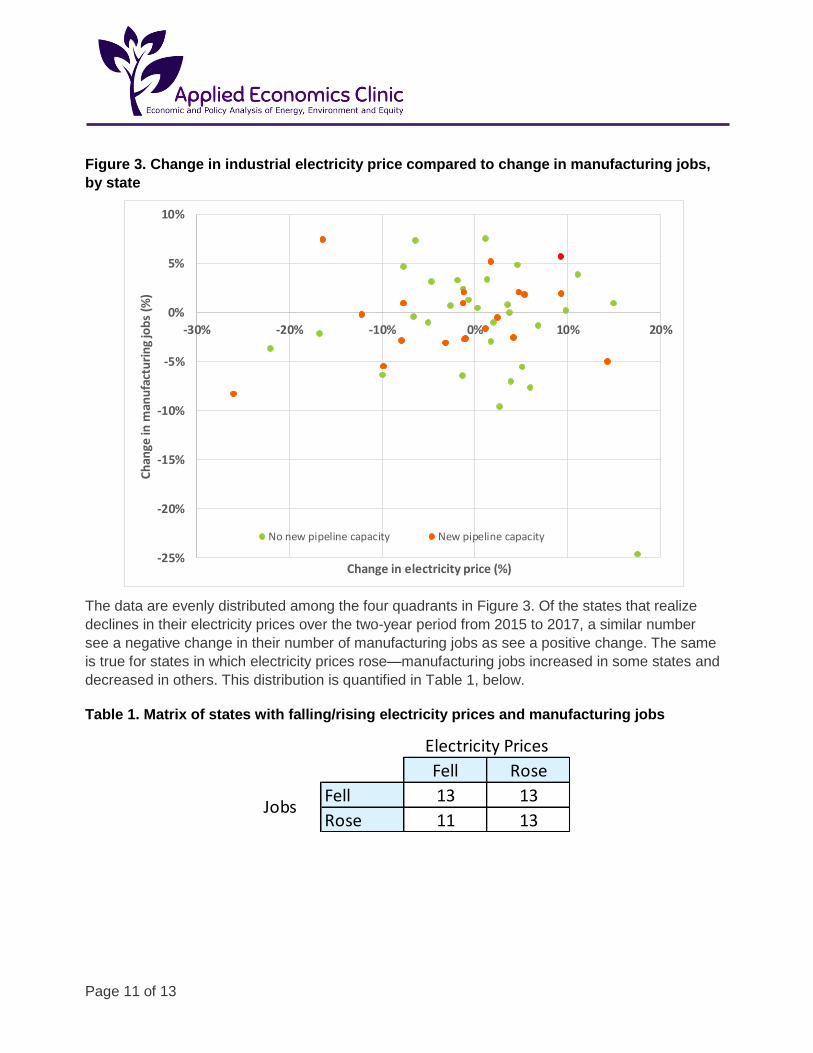
Figure 3. Change in industrial electricity price compared to change in manufacturing jobs,
by state
The data are evenly distributed among the four quadrants in Figure 3. Of the states that realize
declines in their electricity prices over the two-year period from 2015 to 2017, a similar number
see a negative change in their number of manufacturing jobs as see a positive change. The same
is true for states in which electricity prices rose—manufacturing jobs increased in some states and
decreased in others. This distribution is quantified in Table 1, below.
Table 1. Matrix of states with falling/rising electricity prices and manufacturing jobs
-25%
-20%
-15%
-10%
-5%
0%
5%
10%
-30% -20% -10% 0% 10% 20%
Ch
ange
in m
anu
fact
uri
ng
job
s (%
)
Change in electricity price (%)
No new pipeline capacity New pipeline capacity
Fell Rose
Fell 13 13
Rose 11 13Jobs
Electricity Prices

Page 12 of 13
The smallest number in Table 1 are the eleven states that saw a decline in electricity prices and a
corresponding increase in the number of manufacturing jobs between 2015 and 2017: California,
Florida, Georgia, Mississippi, Montana, Nevada, New Hampshire, New Jersey, North Carolina,
Ohio, and South Carolina. Recent historical data thus show little evidence of decline in electricity
prices being associated with additional opportunities for manufacturing on a state by state basis.
Among just the states that built pipelines, the results are similarly distributed. We quantified the
number of states with natural gas pipelines (new builds and expansions) that were completed
between 2015 and 2017, and assigned them to the four quadrants shown in Table 1. New and
expanded natural gas pipelines passed through twenty different states,30 and Table 2 shows
states with new pipeline capacity in each of the four quadrants relating to electricity prices and
manufacturing jobs.
Table 2. Matrix of states with new natural gas pipeline capacity under combinations of
changes in electricity prices and manufacturing jobs
Table 2 shows that states with new and expanded natural gas pipeline capacity are distributed
between all four quadrants relating to changes in electricity price and number of manufacturing
jobs. Seven states with additional pipeline capacity saw both falling electricity prices and losses to
manufacturing jobs, including Virginia,31 one of the states in which the ACP and MVP would
deliver natural gas. West Virginia—a major natural gas producer and the origin for a number of
new natural gas pipelines including the ACP and MVP—has experienced increased electricity
prices coupled with losses in manufacturing jobs in the state.
Recent evidence from states with new natural gas pipeline capacity shows no support for the
conclusion that the addition of new pipelines leads to additional opportunities for new
manufacturing jobs in those states. There is also no support for claims that the ACP or the MVP
would lead to an increased number of manufacturing jobs in West Virginia, Virginia, and North
Carolina.
30 AL, CT, IL, IN, KY, LA, MA, MS, NE, NV, NJ, NY, OH, OR, PA, RI, TN, TX, VA, and WV.
31 Transco’s Southside Expansion I project was completed in the third quarter of 2015.
Fell Rose
Fell 7 4
Rose 4 5
Electricity Prices
Jobs

Page 13 of 13
IV. Conclusions
When seeking approval for new long-haul interstate natural gas pipelines, project developers often
make the following claims:
1) Pipelines are needed to take advantage of the basis differentials between regions and
transport lower cost gas from regions in which it is produced to regions with no natural gas
production and, therefore, higher priced gas;
2) The need for new pipelines is driven by forecasted growth in demand for natural gas from
the electricity sector for power generation; and
3) States with new pipeline capacity will derive economic and employment benefits from the
direct construction and operation of the pipeline, and well as from any benefits that are
induced by the presence of the pipeline.
Unsurprisingly, Dominion, the largest owner of the Atlantic Coast Pipeline, has made exactly these
claims. As we have shown in Section I, however, assumptions by the independent consultant hired
by Dominion about the future divergence between natural gas prices at regional hubs are no
longer supported by either recent basis differentials or even Dominion’s own, more recent
projections from its 2017 Integrated Resource Plan.
Claims attributing a need for the ACP to load growth from electricity demand are also
unsupported. Dominion, Duke Energy Carolinas, and Duke Energy Progress have revised their
assumptions about electric load growth to reflect a lower rate of growth (Duke) or a lower starting
point for growth (Dominion). Moreover, the regional electric transmission grid operator for the
region that includes Virginia has lowered the forecasted growth rate in the region. These lower
utility demand forecasts would eliminate the need for a large amount of new natural gas
generating capacity and avoid 375 million cubic feet per day of natural gas delivery.
Finally, recent data on states with new natural gas pipeline capacity does not support the claim
that the addition of a new natural gas pipeline in a state is correlated with lower industrial
electricity prices or an increase in the number of manufacturing jobs in that state.


